 TigerSoft and Peerless Daily Hotline
(C) 2010 William Schmidt, Ph.D. www.tigersoft.com All rights strictly reserved.
===> Order form to Renew On-Line, "Nightly Peerless/TigerSoft Hotline " ($298)
TigerBlogs for Hotline Subscribers
IMPORTANT NOTICE
This Thursday's Early AM, Our Hotline's Address Will Change.
You should get a notice from us by tomorrow night about the new address.
If we omit you, contact us about our mistake, as your email address may
have changed, or fill out the form below to renew for $298/year. ===> Order Here
Overnight Market
Action:
Bloomberg Futures around
the world before the US Markets open.
CNN Futures before the Opening in NY
24-hour Spot Chart - Gold
24-hour Spot
Chart - Silver Dollar and Currencies
Daily NYSE and NASDAQ New Highs.
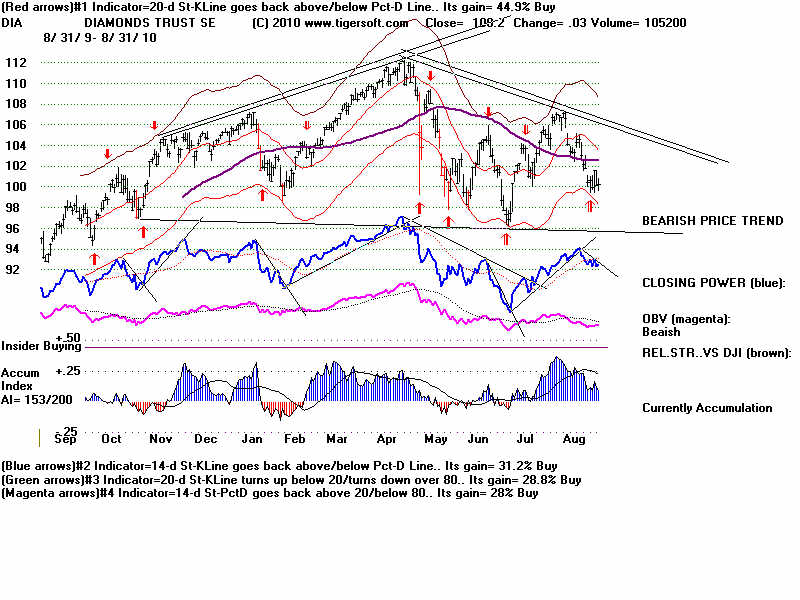
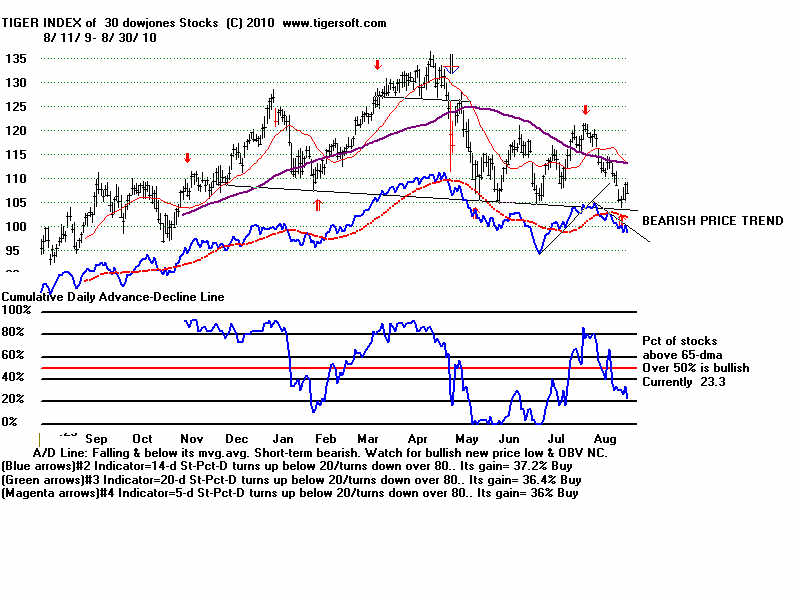
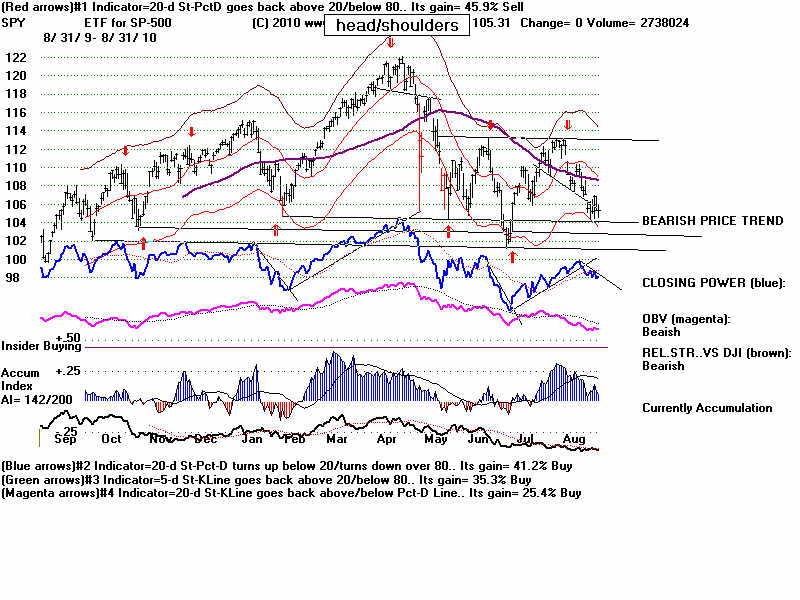
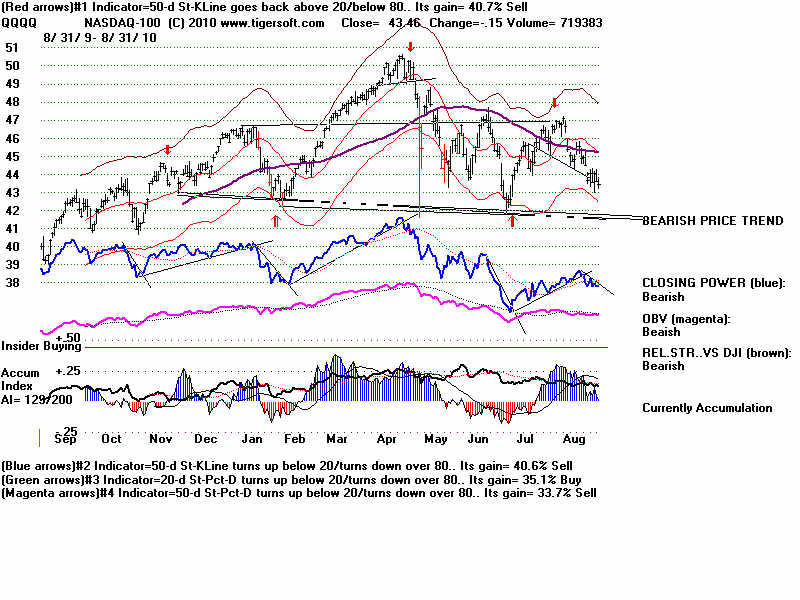
| CURRENT STATUS: KEY ETFs, Signals. Closing Power and A/D Line Trend 8/31/2010 Closing Power:Opening Power UU = Both up. (initially reliably bullish) DD = Both down (initially reliably bearish) UD = Opening Power up, Closing Power Down (bearish) DU = Opening Power Down, Closing Power Up (bullish) Blue = Bullish Red = Bearish Click Index Symbol Automatic Closing Power Pct of Stks over Opening Power To See Graph Signal Trend over 65-dma Closing Power --------------------------------------------------------------------------------------------------------------------------------------- DIA Red Buy Closing Power Downtrending D? Bearish DJIA-TGR-Index Red Buy A/D Line Downtrending 30% (+10%) SPY Red Sell Closing Power Downtrending D? Bearish SPY-TGR-Index Red Buy A/D Line Declining 31% (no change) QQQQ Red Sell Closing Power Downtrending DD Bearish CP head and shoulders is forming QQQQ-TGR-Index Red Buy A/D Line Trend Downtrending 31% (+2%) QQQQ-10-TGR-Index Red Buy A/D Line Trend Downtrending 10% (no change %) Foreign ETFs Red Buy A/D Line Trend Downtrending 62% (+6%) Home Building Red Sell A/D Line downtrending 19% (+8%) Finance Red Sell A/D Line downtrending 17% (-4%) 6 buys / 4 sells 0 buys 10sells 1 buys 9 sells |
|||||||||||
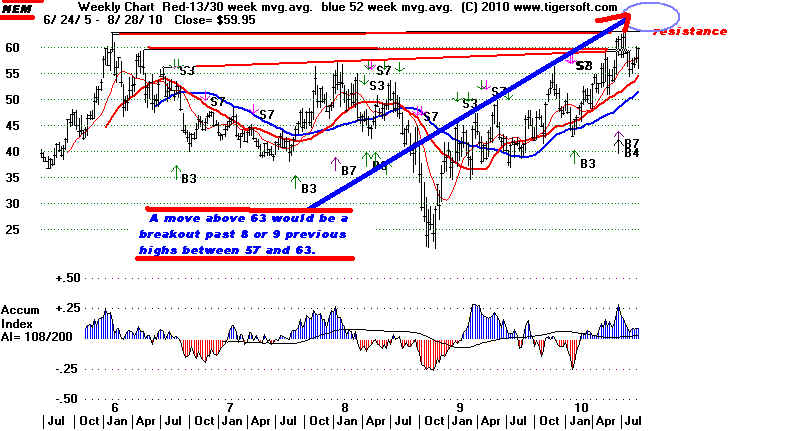
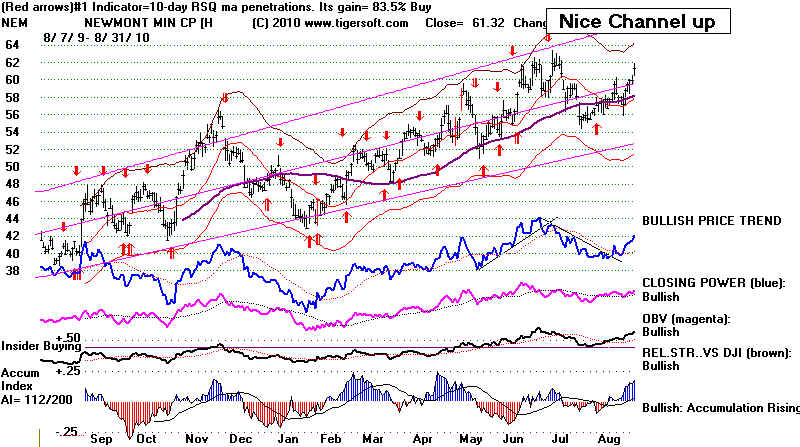
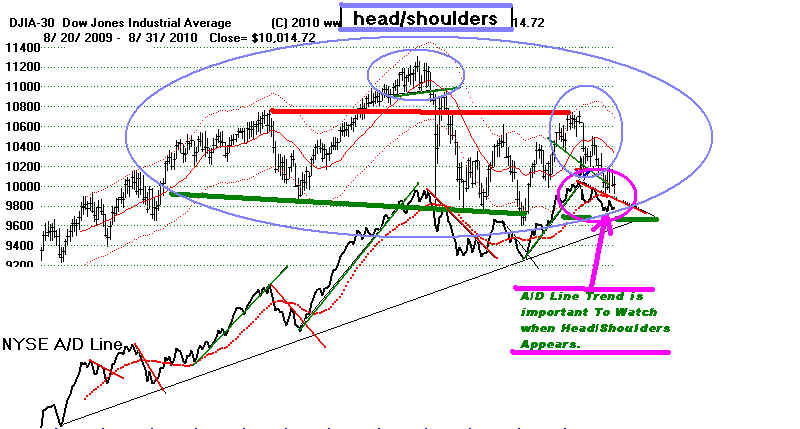
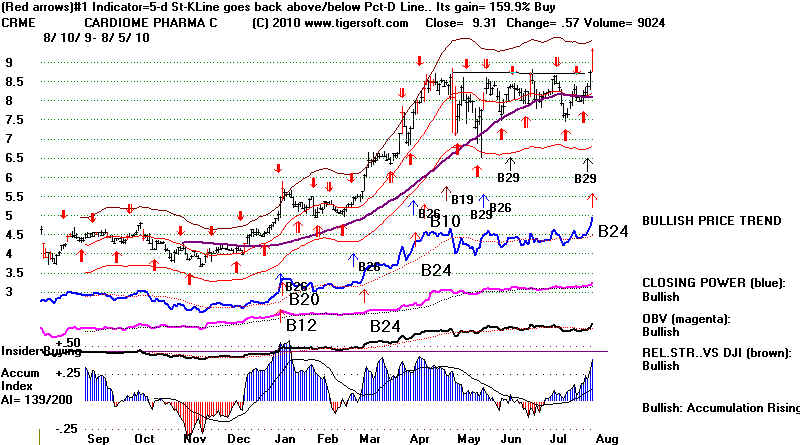
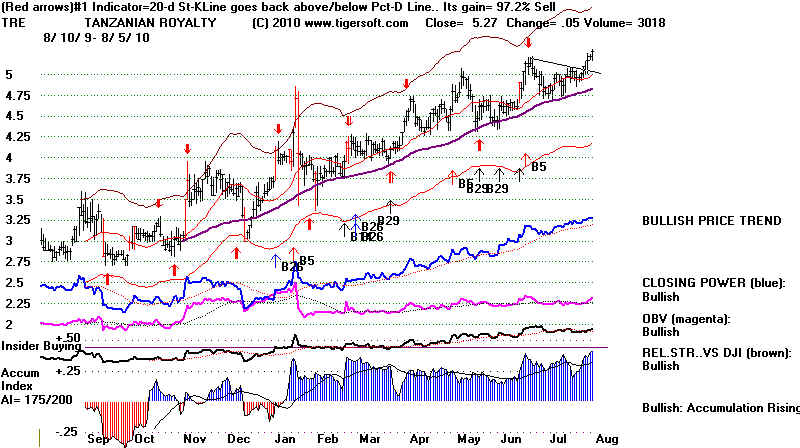
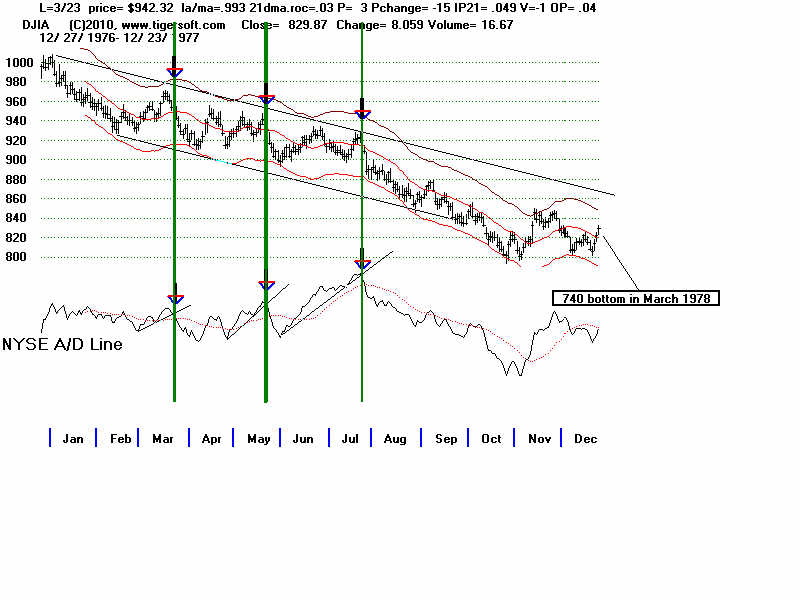
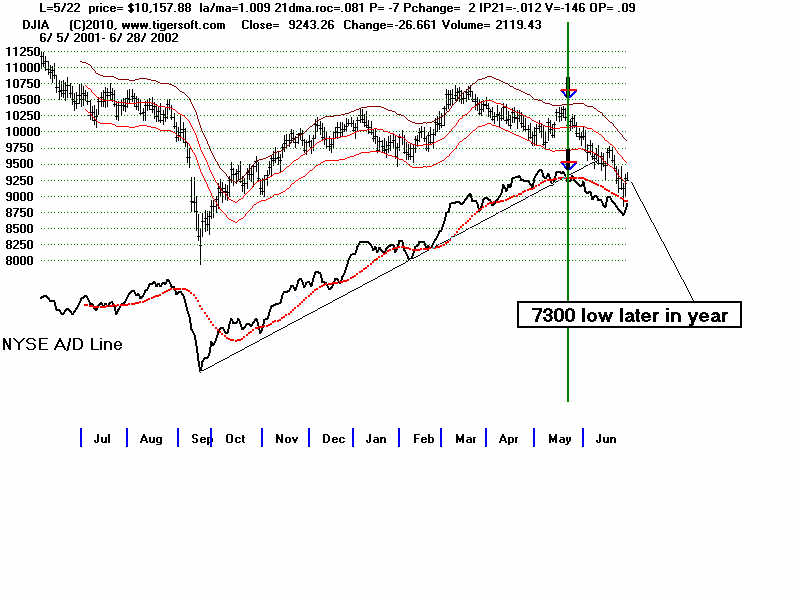
| 8/31/2010 CURRENT DJIA CHART and PEERLESS SIGNALS We Remained Hedged: Long DIA and short QQQQ or as I prefer, long some "Bullish" MAXCP stocks and short some "Bearish" MINCP stocks. NEM and TRE should be bought among the strongest Gold Stocks. The bearish head and shoulders patterns have not appeared for nothing. They are bearish omens. If their necklines give way, a very big decline seems likely, based on lots of historical parallels. The levels of Accumulation are dimminishing. This is a warning that the big buyers are dwindling and may not be able to hold the marke up if the necklines are tested. The favorable NYSE advances and declines data are normally bullish. But they do not always save the day. I have pointed out early 1977 and early 2001 as such cases. New high/low data shows how much weaker the NASDAQ is now than the NYSE. On the NASDAQ, the ratio of 12-month highs to lows was a bearish 14 to 85, but on the NYSE, it was a positive 77 to 45. I have suggested shorting some of the stocks whose Closing Power is making new lows that also show heavy Red distribution. Click here to see some of the stocks making actual new lows now that show great internal weakness, too. Hedging at its best means making money on both ends, as the stocks below show. Recent BULLISH MAXCP Stock 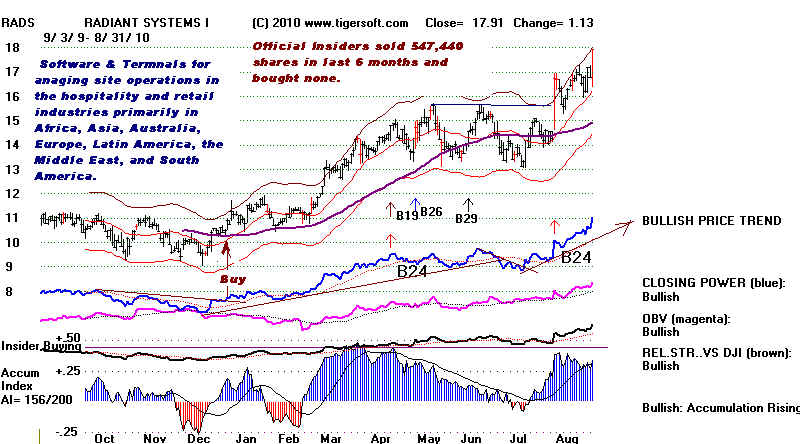 Recent BEARISH MINCP Stock 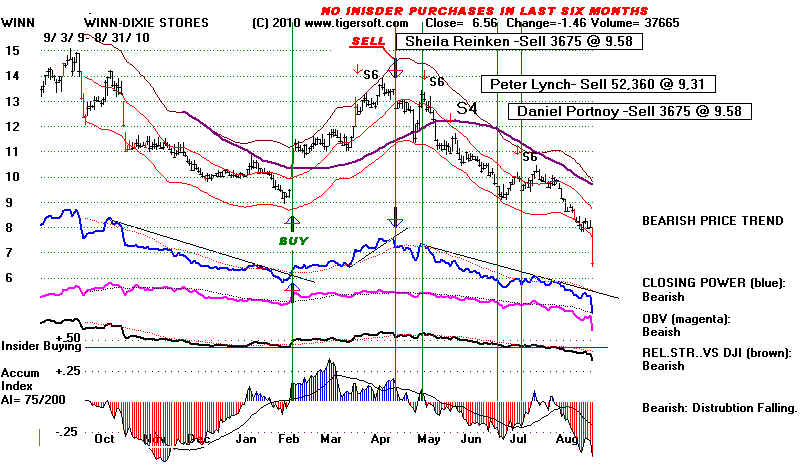 With September, the most bearish month of the year coming up, it is not, at all clear that the Fed can hold the market up with low interest rates in the next few months. Perhaps, internal dissension inside the FED will force a change in the policy of very low rates. Perhaps, the Dollar will turn so weak, the Fed will have to try to protect it by raising rates back up. These factors are not evident yet, but Gold is challenging its June highs. A breakout by it would not be good for the Dollar or the policy of low interest rates. GOLD STOCKS TO BUY NOW I have already recommended TRE here as it went over $5, a month or so ago, Clearly it is a very specualtive gold play. But look how much such stocks can rise.  Speculative ANV has almost tripled in the 18 months since I recommended it here. (Unfortunately we sold it way too soon at 16.)  BUY NEM.. Since both Opening and CLosing Power are rising now for NEM, I would buy it now for this breakout play and sell it if the Closing Power uptrend is violated. Watch NEM to see if it can make a historicclosing breakout over 63.2 It would defintely be a buy if this happens. See the weekly and daily charts below. Unfortunately, I have to add that big advances by NEM have historically been bad signs for the stock market. See Tiger Blog of 2/1/2008 - http://www.tigersoftware.com/TigerBlogs/02-21-2008/index.html "Spot General Market Tops by Noting Newmont Mine's Run-ups."
================================================================
UltraShort 20+ Year Treasury ProShares (TBT)
|


=================================================================================
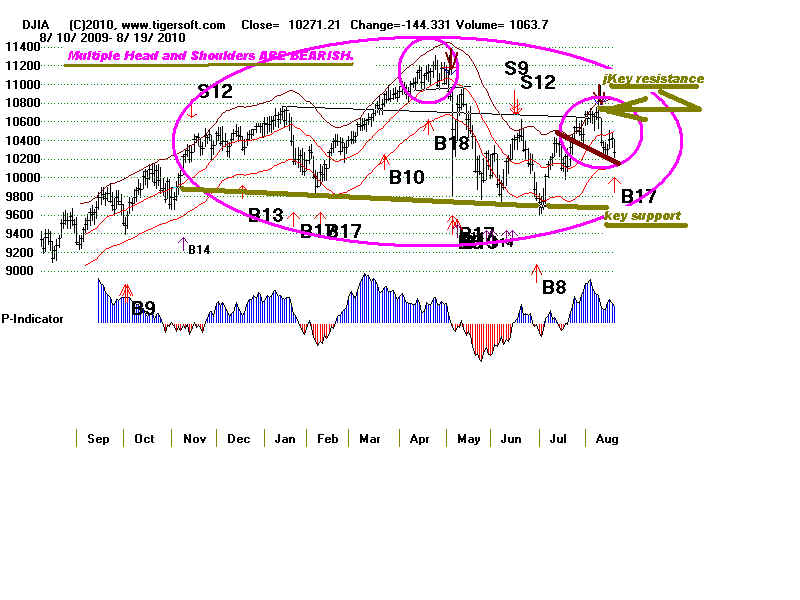
8/20/2010
Thursday's Buy B17 (on-going bull
market variety)
is risky because if 10135, the
location of recent small head and
shoulders' neckline is broken, the
next support is at 9800
The history of Buy B17s and Head
and Shoulders patterns
strongly suggests we should respect
the pattern's bearishness
and work with the A/D Line
trendlines. Right now, those trendlines
are DOWN and BEARISH. Wait
for a resolution or hedge by
buying only the "bullish"
MAXCP stocks and shorting the
"bearish" MINCP stocks.
"Bullish" MAXCP Stocks: MFL, NZ, FFIV, MYO, PGP, VMW
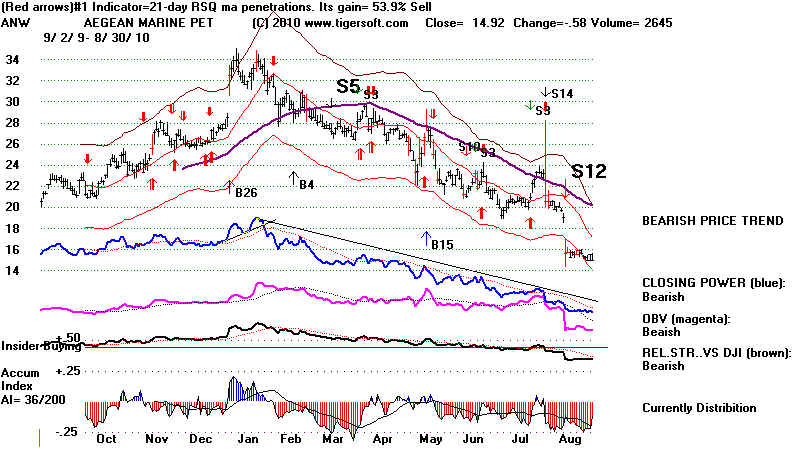
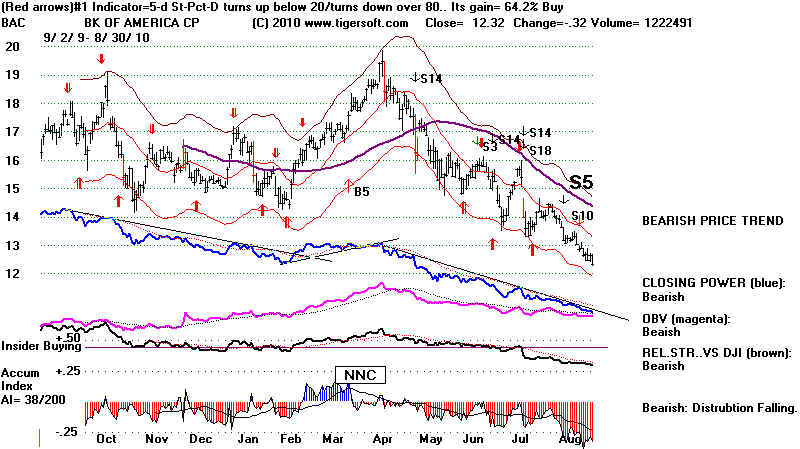
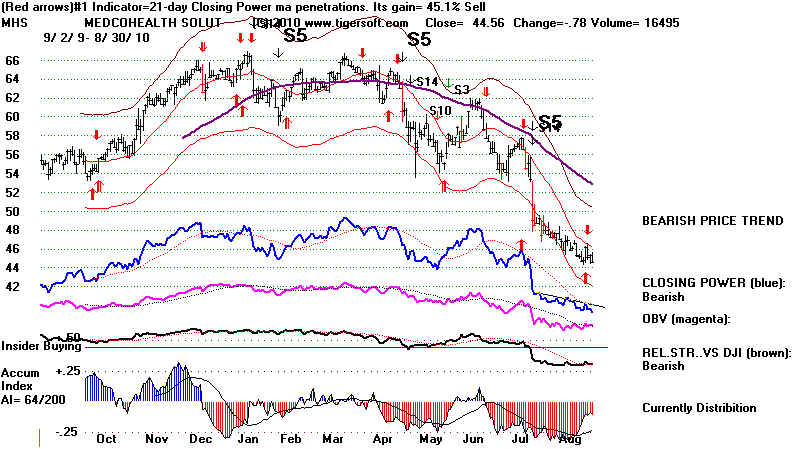
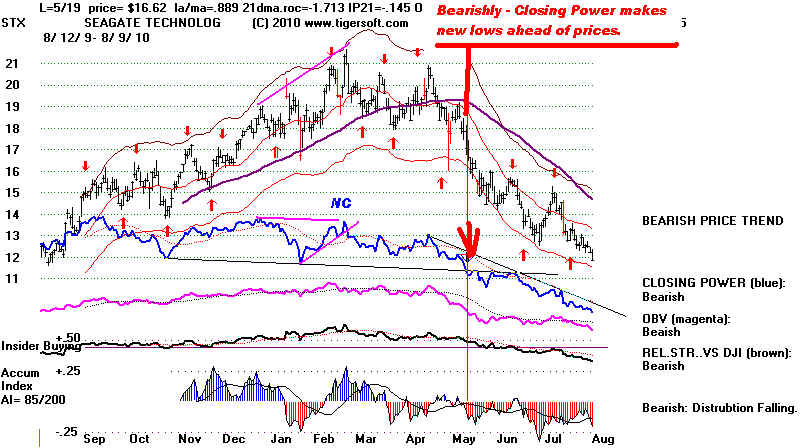
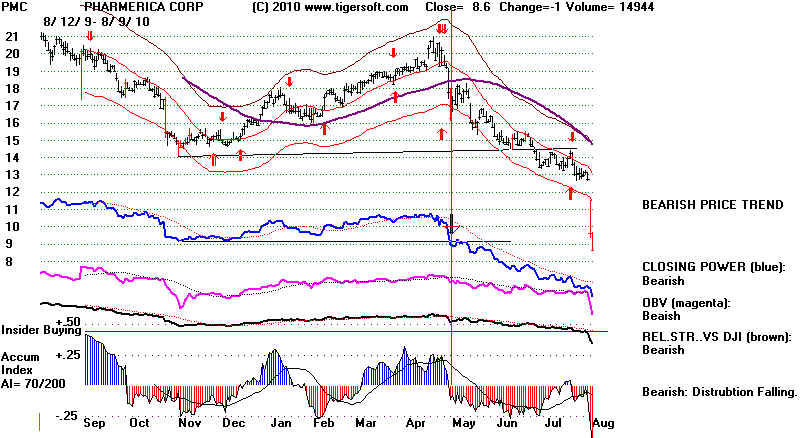
"Bearish" MINCP Stocks: TBT, HAWK, SPWRA, BAC, EHTH. ESI, PMC and MHS
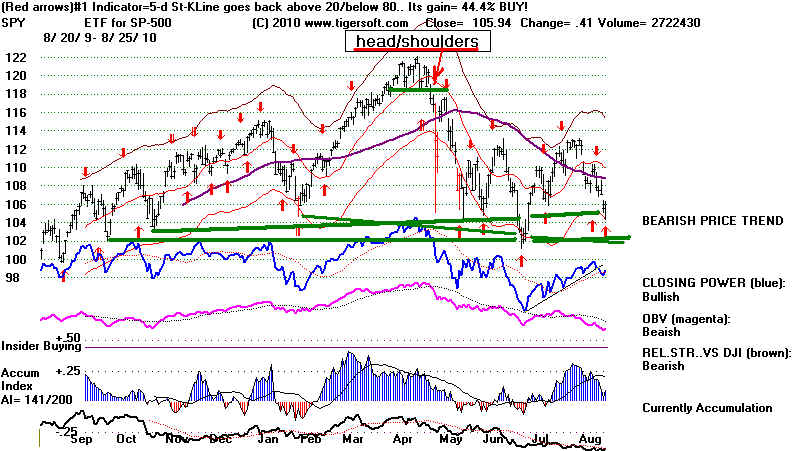
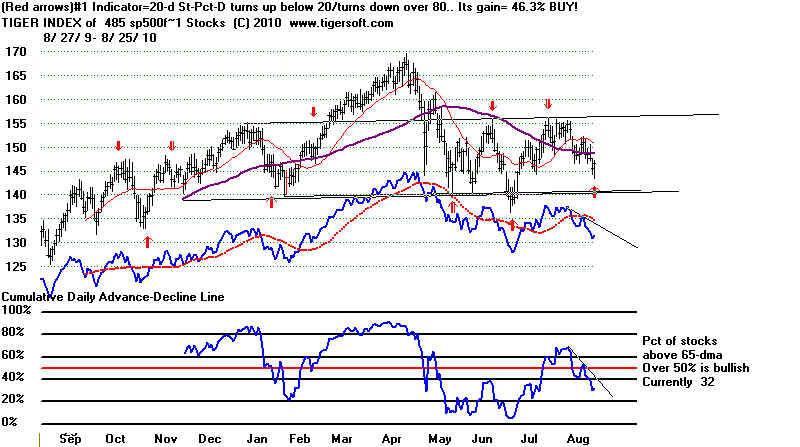
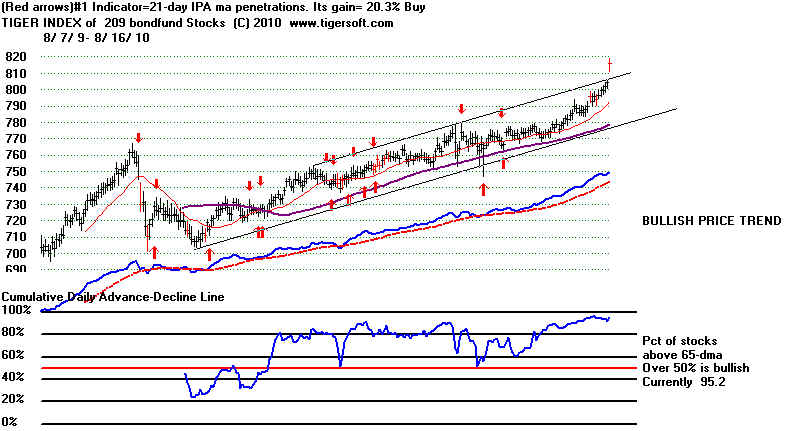
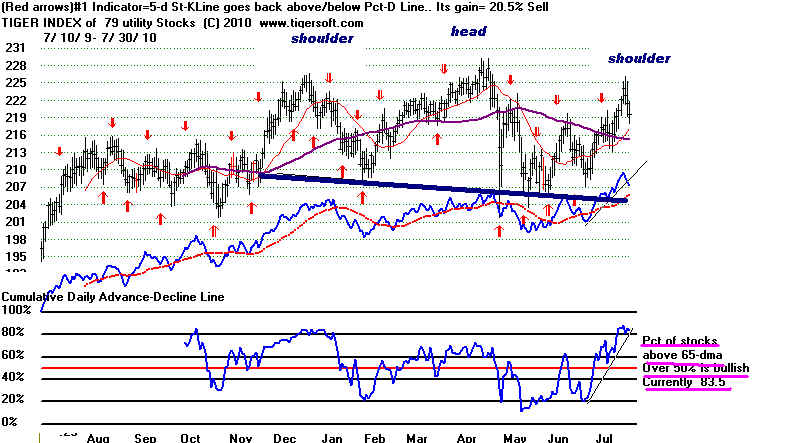
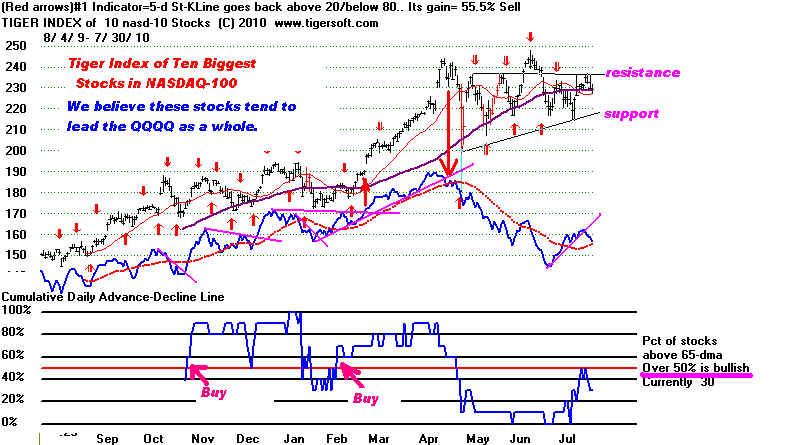
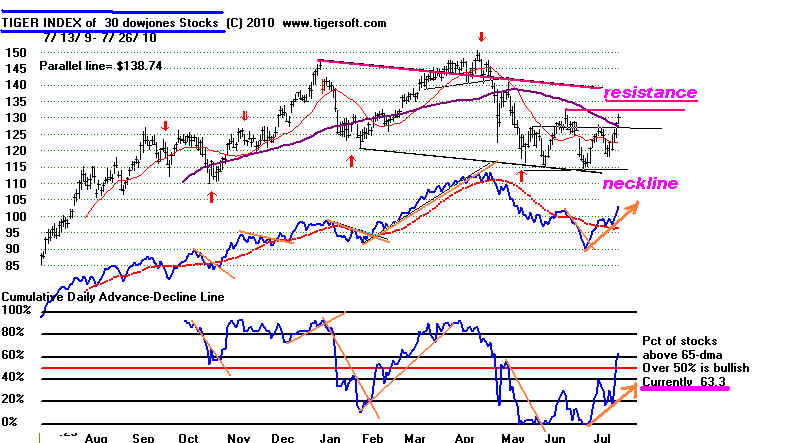
The
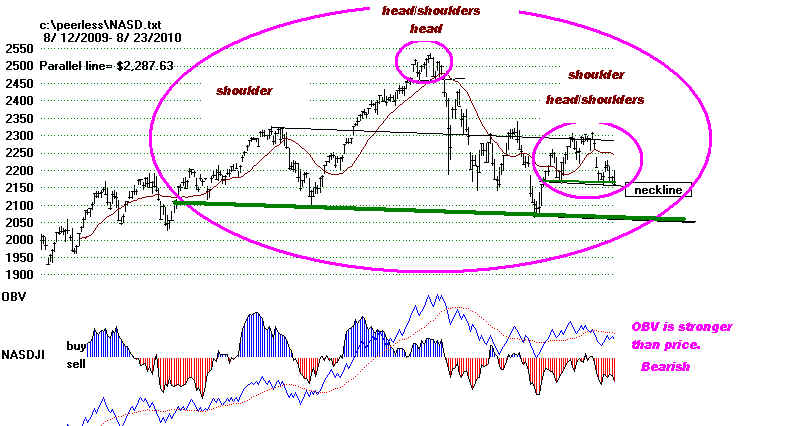
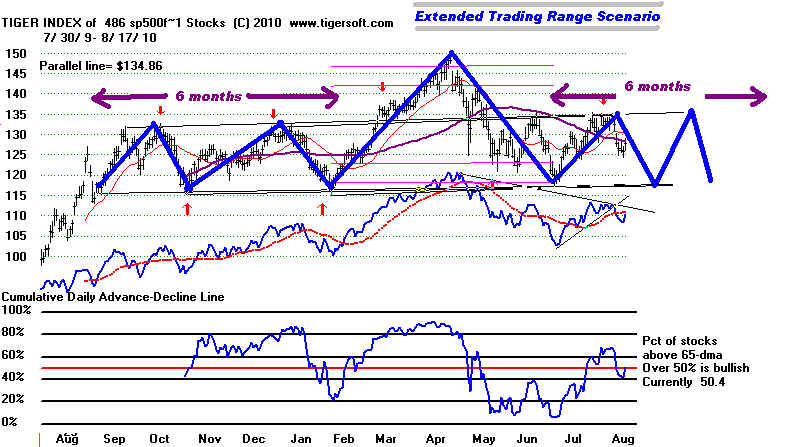
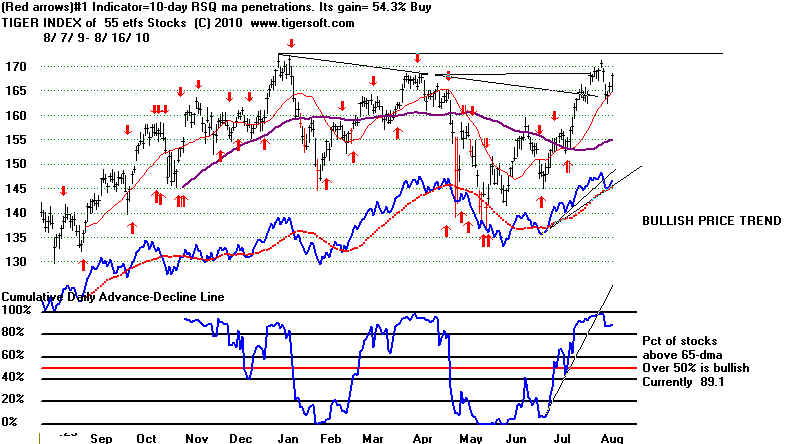
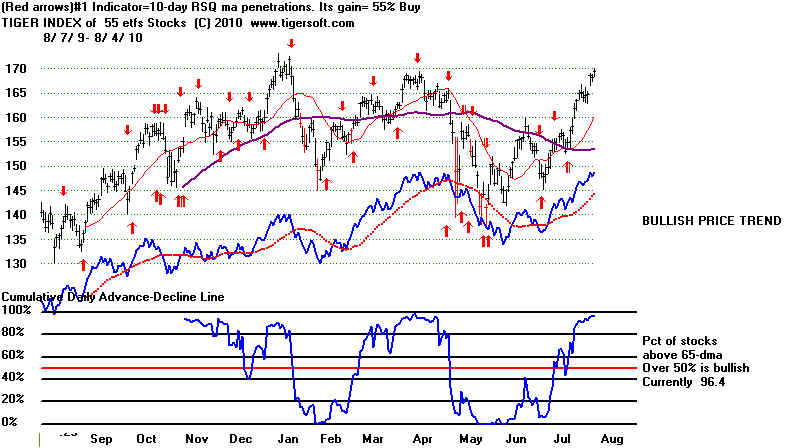
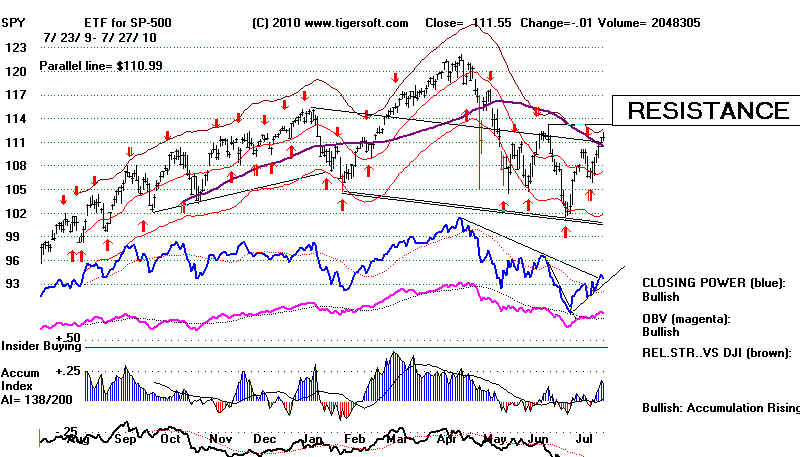
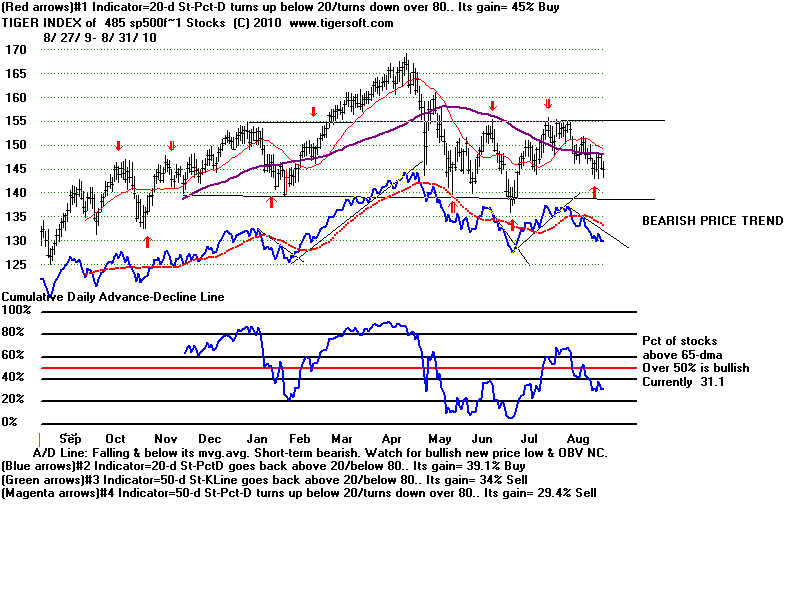
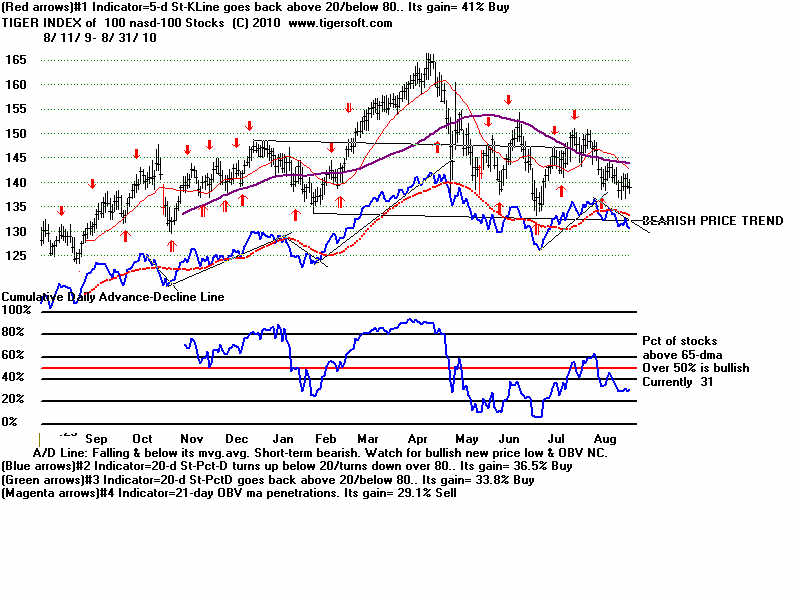
Tiger Index of the SP-500 stocks shows the DJI has fallen to the H/S neckline support.
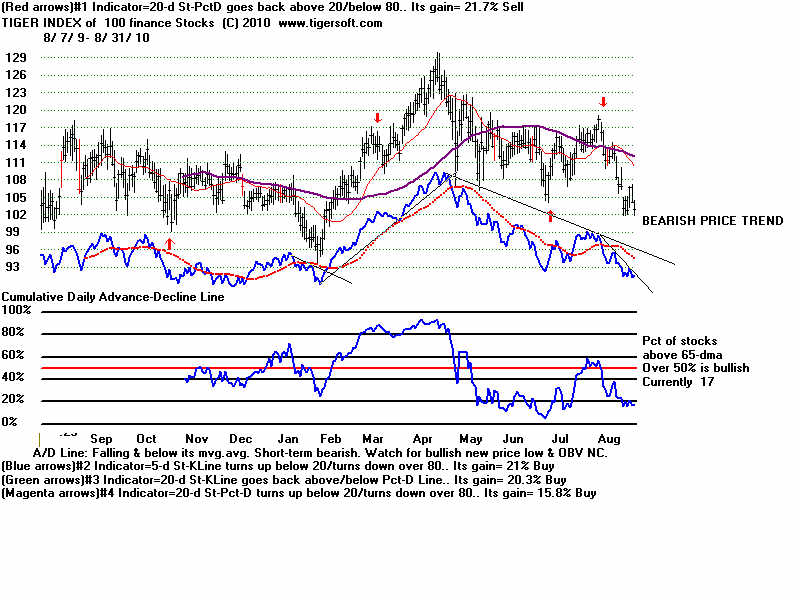
The
A/D Line for these stocks is falling and leading prices down. Only 41.4% of these
stocks are above their 65-dma. The Trend of the A/D Line for these stocks is
falling.
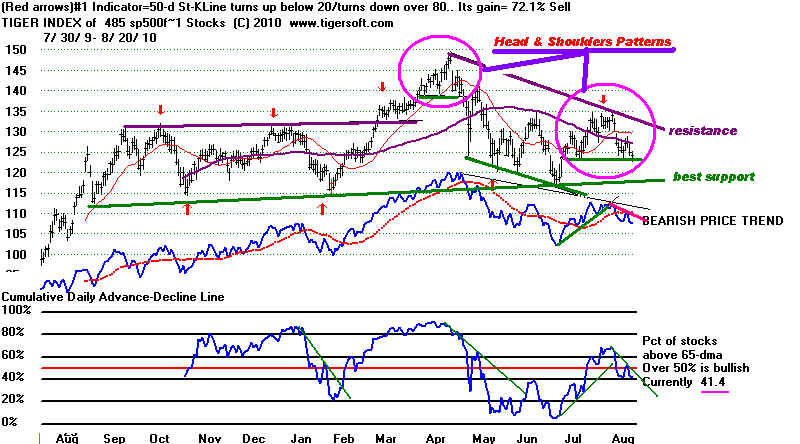
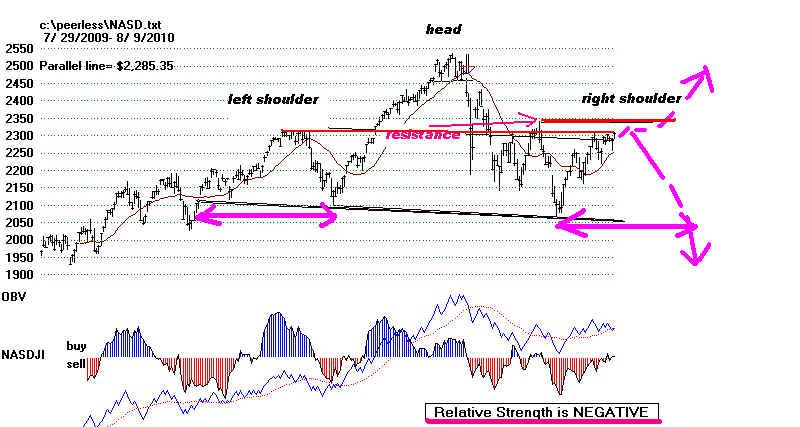
Breadth is a problem now. Thursday's jobs report has shifted attention to the unrelenting
high
unemployment and away from low interest rates and year-to-year earnikngs gains. Even
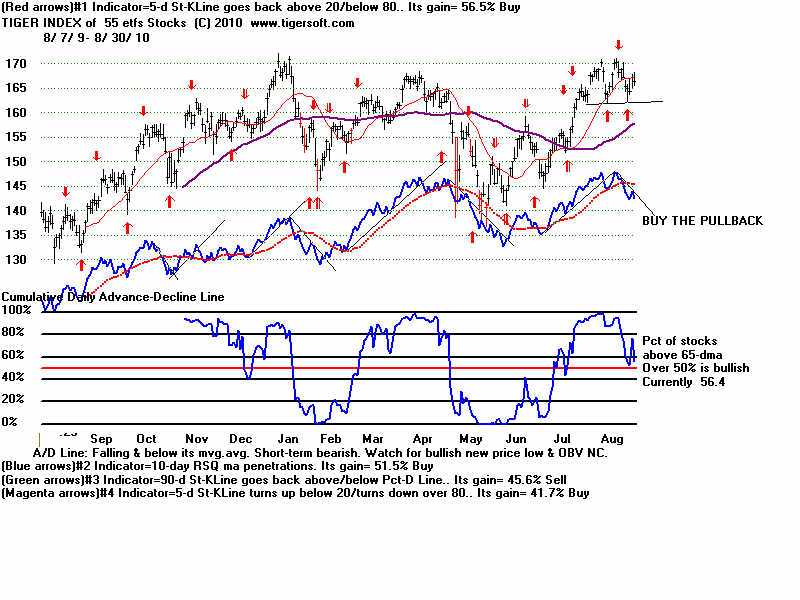
foreign ETFs are being dragged down by the weakness in the US
economy. The Peerless
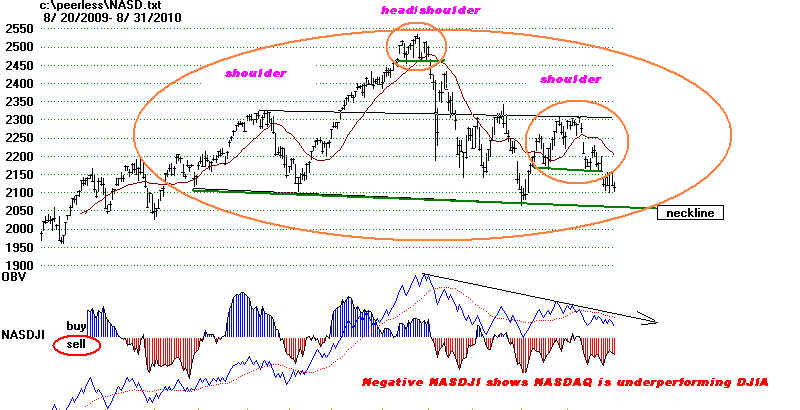
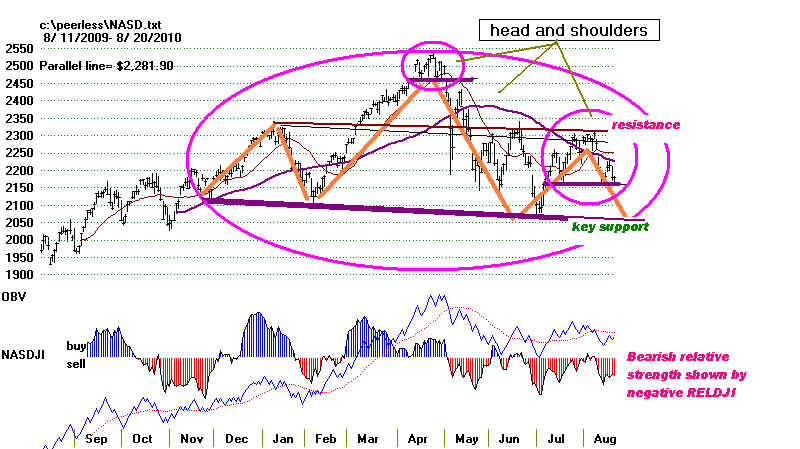
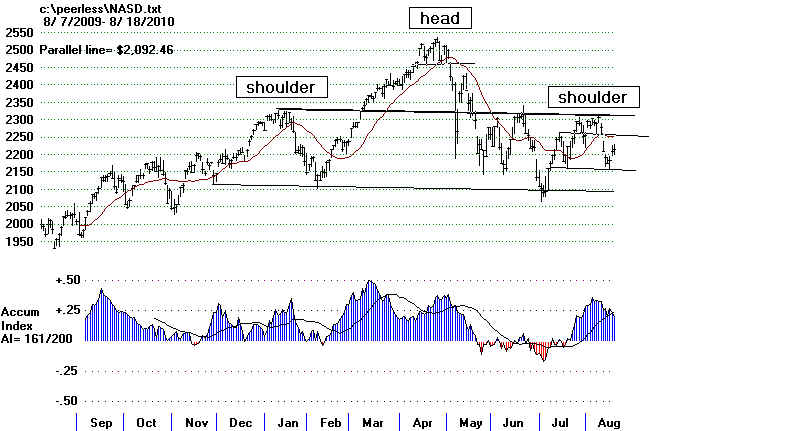
"NASDJI" relative strength indicator is clearly negative. The same three head
and shoulders
patterns the DJI shows are now pressent in the NASDAQ chart. This has to be
worrisome.
This
bearishness will have to be worked out of the market.
On
the NASDAQ there were 61 new lows and only 12 new highs. On the NYSE, where low
interest
rates
help yield stocks and funds, there were 4 more new lows than new highs. But there is
hope
the neckline of the DJIA and of our SP-500 chart will hold. After all, a rally
around
Labor
day has a good tradition. There are more MAXCP stocks (112) than MINCP (79)
stocks. Closing Power usually leads prices and right now more stocks are showing
Closing
Power
is at its yearly highs than lows. The SHU
My
research shows we should wait for the downtrends of the A/D Lines to stop falling
in
the present situation were dangerous and unresolved head and shoulders are present.
These
are made much riskier because of the bearish seasonality of September and early
October..
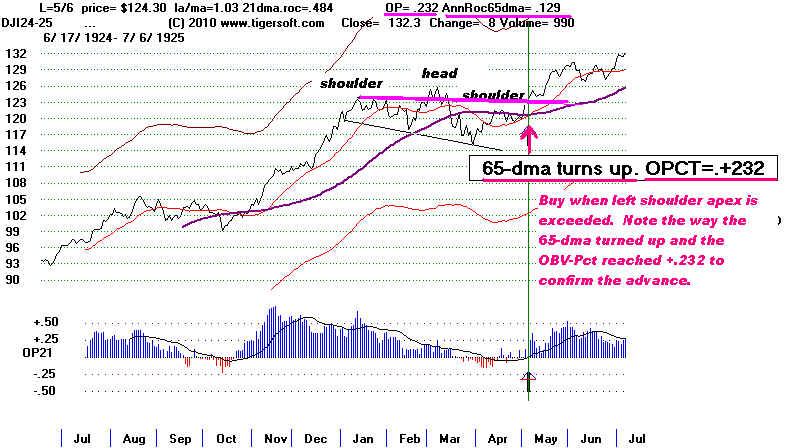
Head and shoulders patterns have to be
judged. That does
not diminish their importance. See
the details in my new study
of B17s as they occur with head and
shoudlers patterns. This
summation and conclusion read:
"Where a head and shoulders (H/S) pattern
appears, it seems best to wait
for the
neckline to be tested and hold, or if is broken to wait for the DJI to have
some
headroom before buying. If you see a potential head and shoulders pattern
developing,
the judged Peerless Right Shoulder Apex rule should be applied. This
involves
selling when the A/D Line turns down or its recent steep uptrendline is violated.
When the
H/S neckline is violated, the minimum downside objective was usually reached.
This is
calculated by taking the height of the pattern at its maximum and subtracting that
number from
the point where the neckline is violated. In such cases, the simplest
and safest
approach is to wait for the A/D Line downtrend to be broken after the
minimum
downside objective has been reached. This usually occurs in a market
that is
ready to rise quickly. So, hesitation can be somewhat costly. "
http://www.tigersoft.com/PeerInst/B17s-RisingTrend/B17-rising-trend.htm
===============================================================
===============================================================
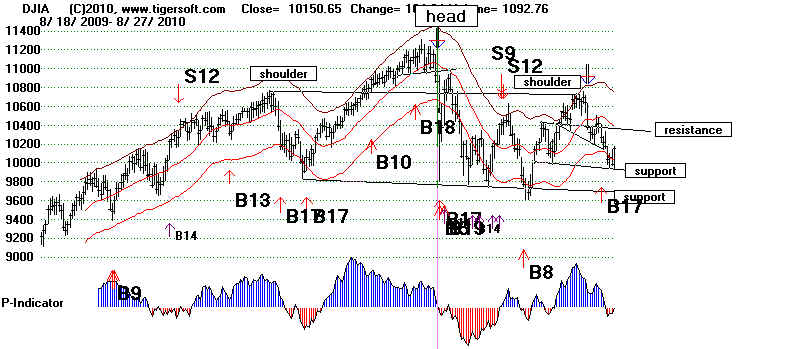
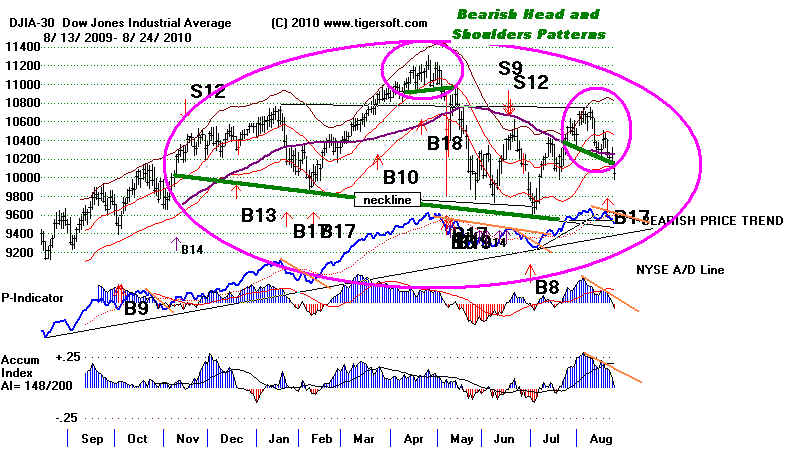
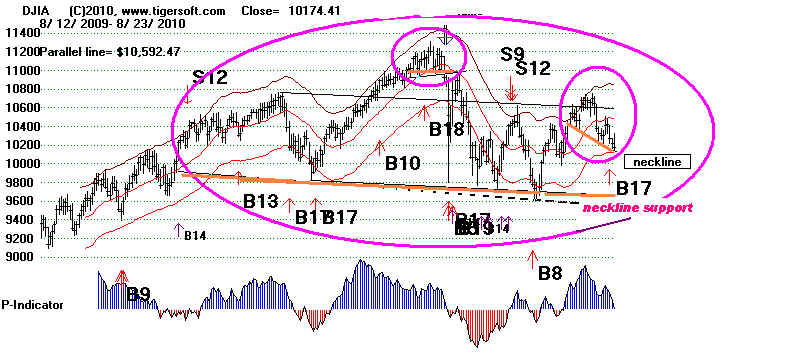
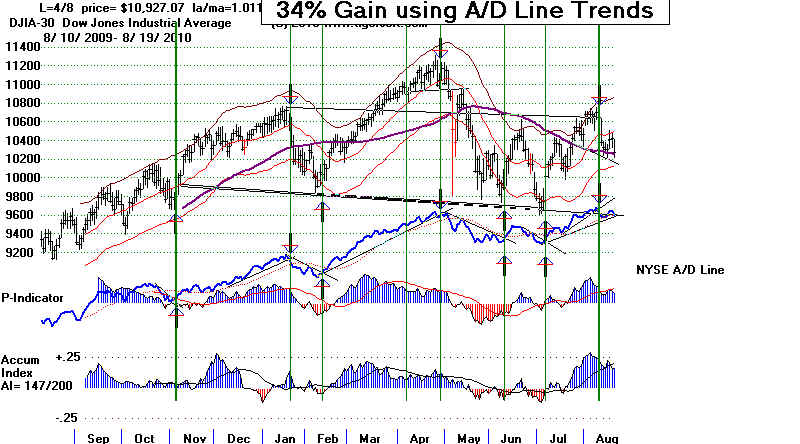
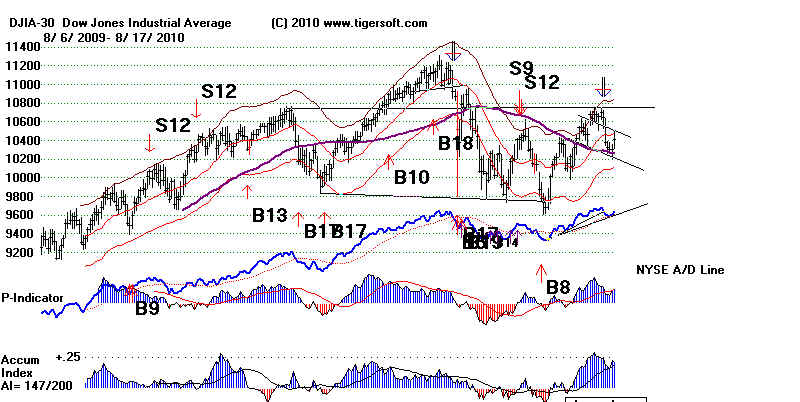
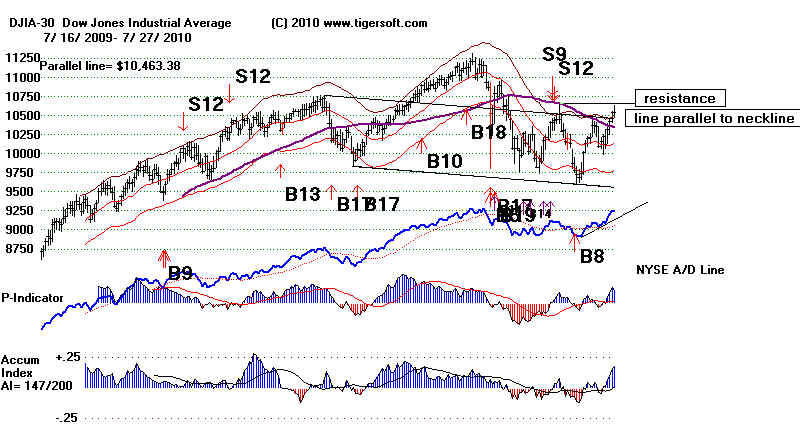
CURRENT DJIA CHART and PEERLESS SIGNALS
shoulders pattern. That adds to the bearishness we see
in the larger pattern. I fear a decline below the smaller,
recent pattern's neckline and the lower band will mean
another test of 9800. But perhaps, today's Buy B17
will save the day. The A/D Line breaks and new ETFs'
sells would get me to be hedged or sit on the sidelines
until we see a satisfactory test of the 10200 support or
the Closing Powers turn right back upwards. The coming
of the very often bearish months of September and October
are worrisome.
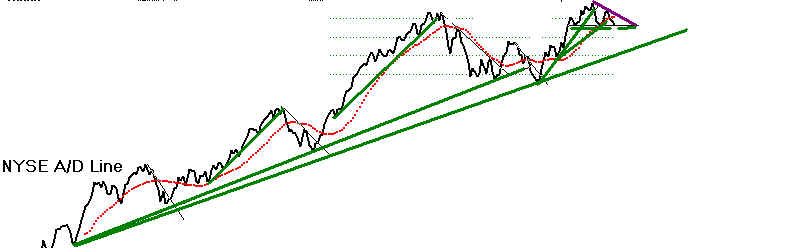
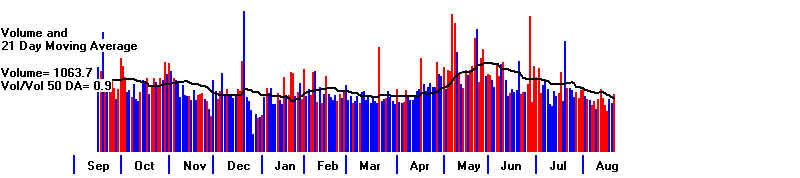
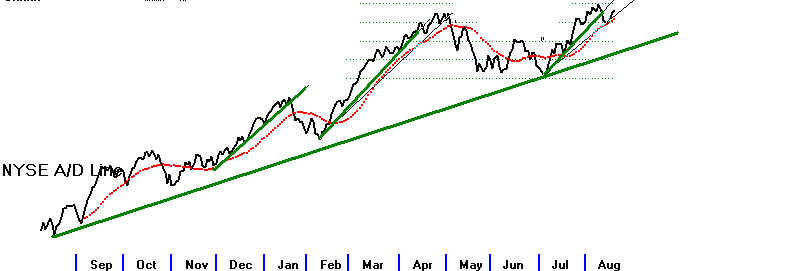
Steep A/D Line
uptrend broken.

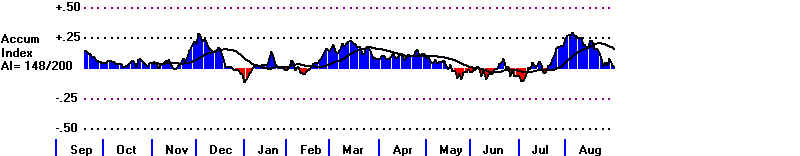
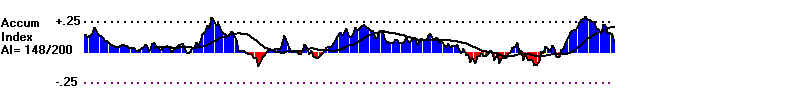
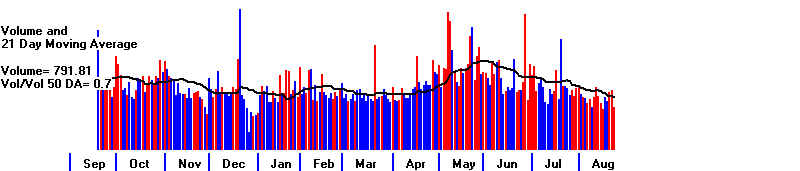
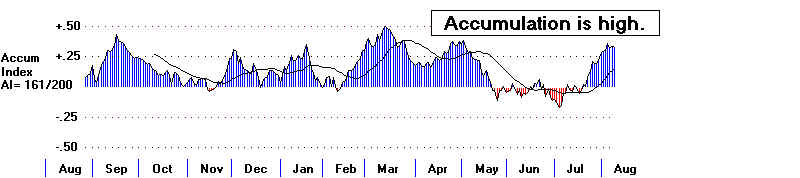
High Accum.
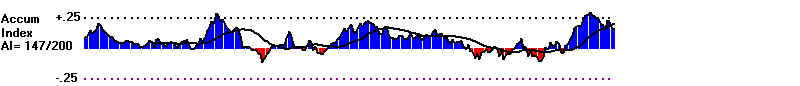
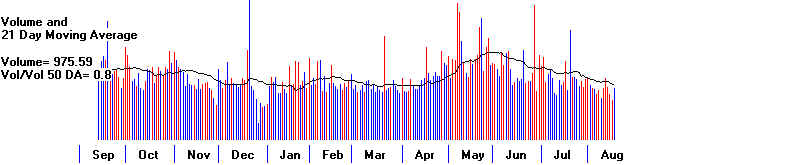
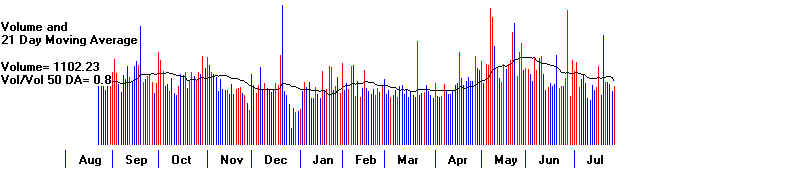
Bearishly low
Blue Volume
WORKING SIMPLY WITH A/D LINE
TREND-BREAKS
Serious weakness would break the more gradual A/D
Line
uptrend. The longer term up-trend is still
intact.
8/19/2010
New Buy B17 (on-going bull market
variety)
In 50 of 51
earlier cases this signal was reversed with a profit.
In 8 cases (16%) there was first a paper loss of berween 4% and
10%
In 4 more cases there was a paper loss of between 1% and 3%/
That means a paper loss of under 1% occurred in 75% of the B17s
that took place in an on-going bull market, with the DJI within
13%
of its yearly highs. For more information on Buy B17s,
please go to
http://www.tigersoft.com/peerinst/--Buy-B17.htm
When a head
and shoulder pattern was visible, as now, paper losses did occur.
See the cases of the Fall of 1941 (a bear market B17) and
February 2000.
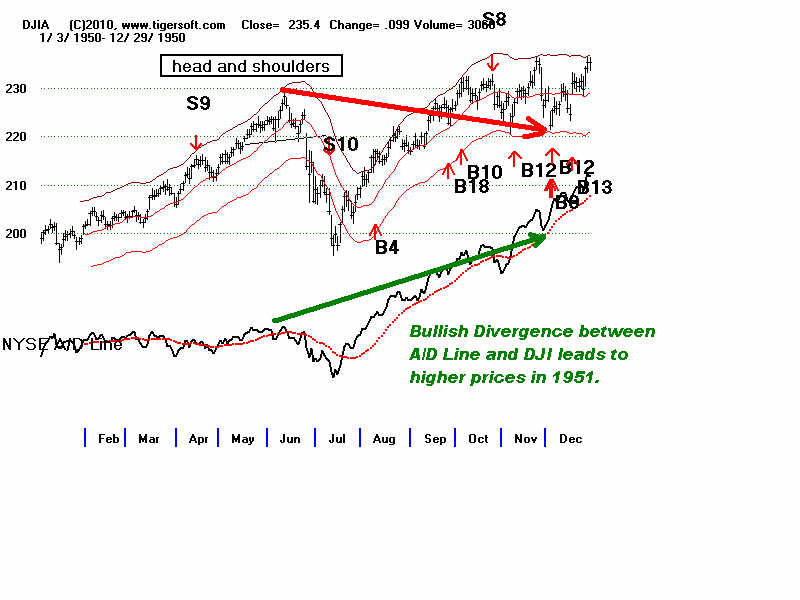
This is more like the June 29, 1951 Buy B17 when the current
Accumulation Index was +.102 and the DJI quickly reversed from
the lower band and ran to new highs. The trick here will be
for the DJI not to breakdown much more than 2.6% below the
21-day ma, as it did then. Right now it is 2.1% below the
21-day ma
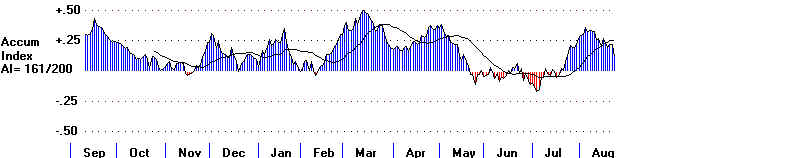
and shows a current Accum. Index value of +.163. Such
levels
show usually mean there is too much Accumulation to break below
the lower band now at 10124.
Somewhat lower
prices should NOT be too disturbing tomorrow. Watch
to see if the CLosing Powers move up or down from their current
positions.
They broke their uptrends today. These low interest rates
are
a big prop behind much of the NYSE. Technically, the
problem is
that many more stocks are now below the important 65-dma.
That will make a good rally difficult with volume low and
the bearish month of September coming up. Let's wait until
this weekend to get a better idea of what new steps to take.
That there was a bearish shift today can be seen in the
breakdowns
of some key DJIA stocks below their 65-dma (AXP, BA, DIS, GE,
JNJ,
KFT, TRV , WMT and XOM) and the fact that the number of
MAXCP
stocks is now only slightly higher than the MINCP stocks.
These show
unusual CLosing Power strength and weakness. New lows on
the
NASDAQ jumped to 83 with new highs only 10. This is not
good.
Our Tiger Index of 209 bond funds fell today despite 10-year
notes
rising. Is that a warning that interest rates are hitting
lows right
now and they can only bearishly rise from here. Our Hotline
will
remain short a number of the "bearish" MINCP stocks and
long
some of the "bullish" MAXCP stocks.
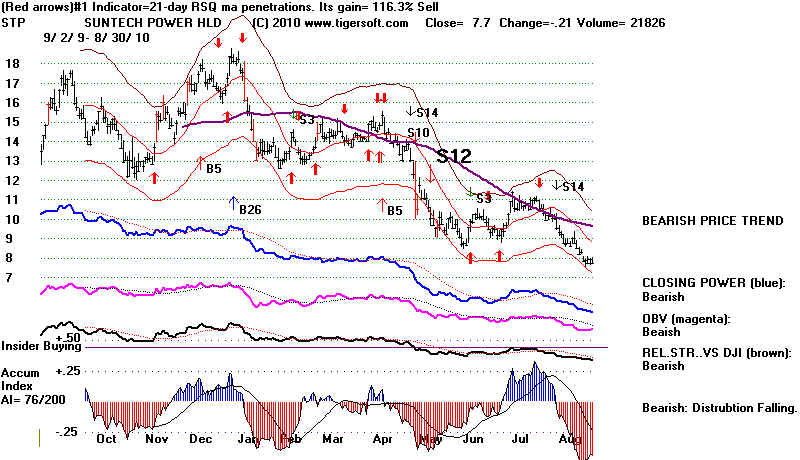
Some very
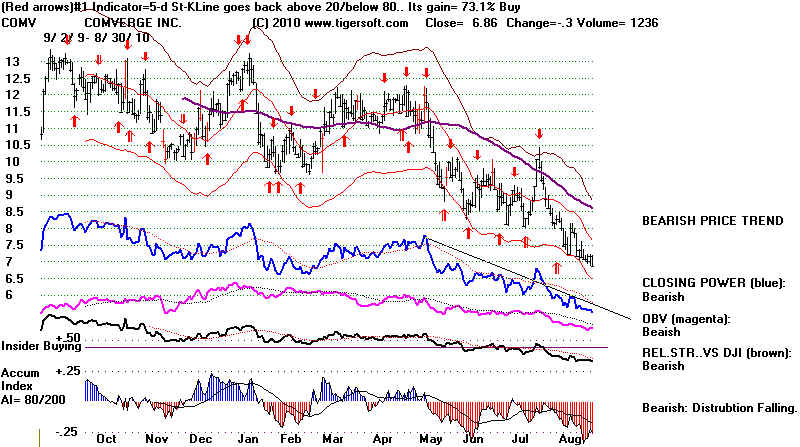
weak looking bearish MINCP stocks are TBT, HAWK.
SPWRA, BAC, OPTR, PMC, GAJ, ALNY, MHS, WINN, LEN,
CHNG. ADY and COMV.
It has to
be of concern that the bearish list is so long.
--------------------------------------------------------------------------------------------------------------------------------------------------------


The SEC
is apparently activating its whistle-blower, bounty hunter program
for individuals who have knowledge of
"original" information about illegal insider selling.
Use our bearish MINCP stocks to see those the SEC
should be investigating. Want to be
an SEC bounty hunter.
See - http://www.tigersoftware.com/Insider-Trading-Bounty-Hunter/index.html
-----------------------------------------------------------------------------------------------------------------------------------------------------
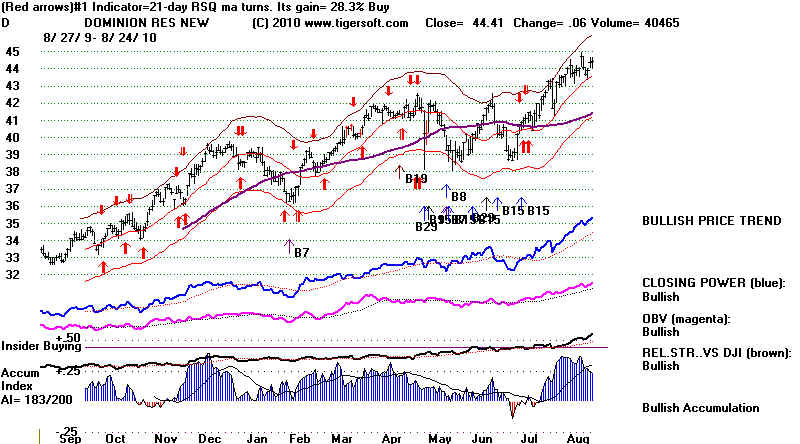
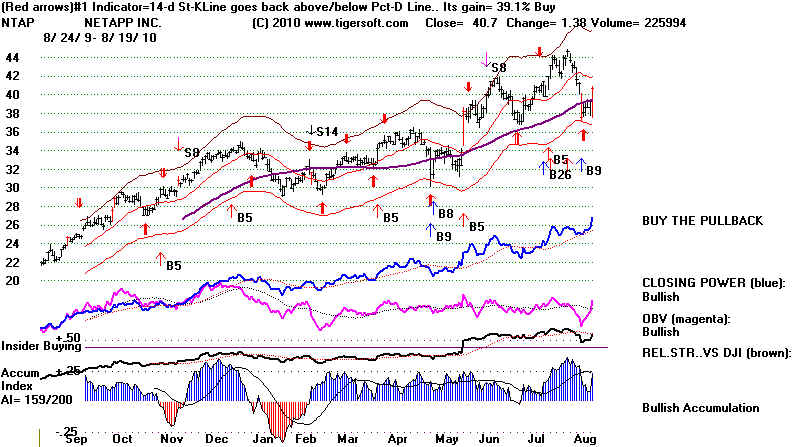
Some
of the most bullish MAXCP stocks are MFL +.25 today, FFIV, MYD, MYN, AEF, EDD,
AAP and NTAP(below), which is recommended for
purchase.
NetApp, Inc. provides enterprise storage and
data management software and hardware
products and services in the United States and
internationally.
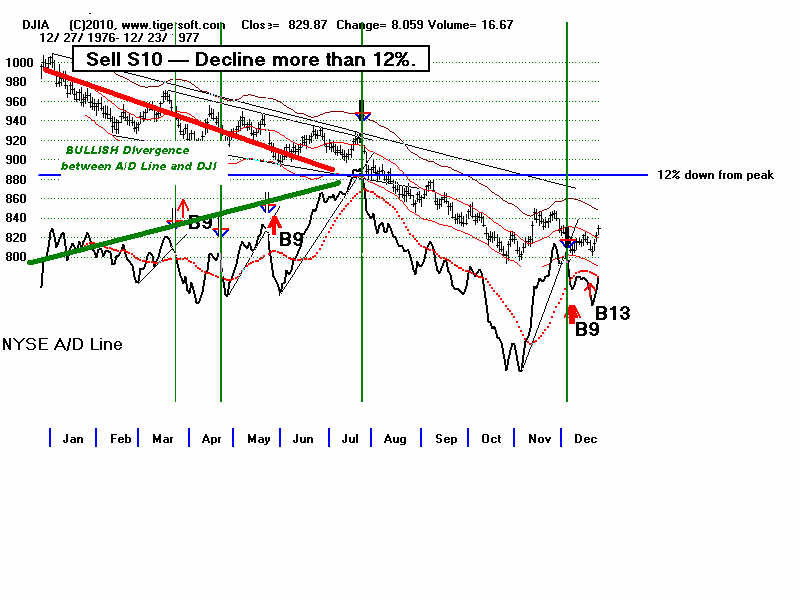
| New Buy B17 (on-going bull market variety) The B17s occur near the lower band when the Accumulation Index is much improved from a previous low or is positive. The exact parameters are not yet posted and are considered proprietary. Date DJIA Gain at next Sell Paper Loss 1. 12/ 10/ 1928 263.9 +18.5% none 2. 3/ 5/ 1935 100.1 +18.6% 3% loss 3. 1/ 12/ 1939 147.3 +1.0% 7% loss 4. 8/10/43 136.20 -0.5% 5% loss 5. 2/13/46 198.7 +1.6% 7% loss 6. 6/29/51 242.60 +11.3% none 7, 10/29/51 260.4 +5.3% none 8. 11/5/51 259.8 +5.5% none H/S 9 4/7/53 275.2 +8.8% 8% loss 10. 9/26/55 455.6 +7.9% 4% loss 11, 10/11/55 438.6 +12.0% none 12. 10/18/55 448.6 +9.5% none 13. 2/5/57 470 +10.3% 3% loss 14. 2/13/57 462.1 +12.2% none 15. 9/9/59 637.6 +5.9% 4% loss Simultaneous H/S 16. 9/15/59 630.8 +8.7% 2% loss 17. 9/23/59 624 +9.9% none 18. 2/11/60 618.60 +0.7% 3% loss 19. 11/13/67 859.74 +5.6% none 20 2/14/68 837.38 +10.2% none 13% down from high 21 2/20/69 916.65 +3.7% none 22 2/25/69 899.80 +5.6% none 23 2/28/69 905.21 . +5.0% none 24 2/26/73 959.79 +1.4% 4% loss 25 9/16/75 795.13 +6.5% none 26 10/8/76 952.38 +4.6% none 27 5/15/79 825.88 +6.6% none 28 11/7/79 796.67 +8.6% none 29 12/9/80 934.04 +3.5% none 30 2/2/81 932.25 +8.8% none 31 8/9/83 1168.27 . +9.2% none 32 5/22/84 1116.82 +9.8% 3% loss 33 7/14/86 1973.45 +2.3% none 34 9/11/86 1792.89 +30.6% none 35 11/19/86 1826.63 +28.2% none 36 5/19/87 2221.28 +5.9% none 37 9/4/87 2561.38 +3.0% none 38 11/11/88 2067.03 +34.1% none 39 10/17/89 2638.73 +6.5% none 40 1/23/90 2615.32 . +13.2% none 41 2/1/1990 2586.26 +14.8% none 42 11/22/91 2902.73 +13.9% none 43 12/5/91 2889.09 +14.4% none 44 9/22/93 3547.02 +11.9% none 45 7/17/96 5376.88 +5.7% none 46 12/12/96 6303.71 +8.4% none 47 4/1/97 6611.05 +3.4% none 48 5/27/99 10466.32 +3.7% none 49 10/18/99 10116.28 +13.4% none 50 2/4/2000 10963.8 +1.4% 11% loss H/S 51 3/2/07 12114.1 +15.3% none 52 8/20/10 10721.21 ? H/S IP21-.163 |
-------------------------------------------------------------------------------------------------------------------------------
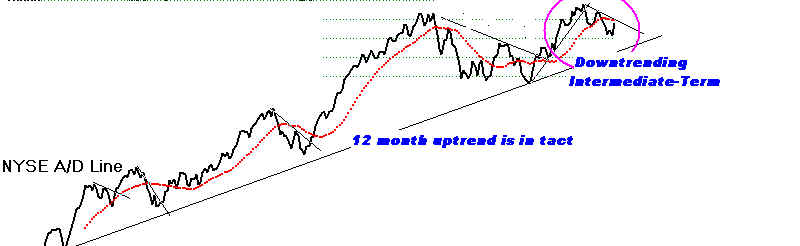
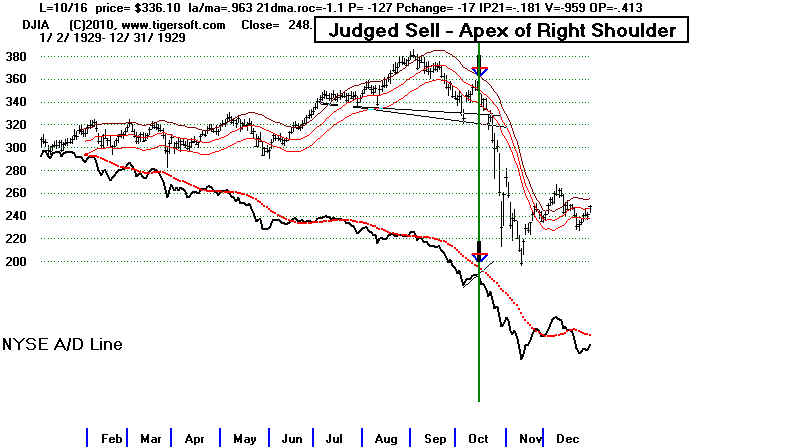
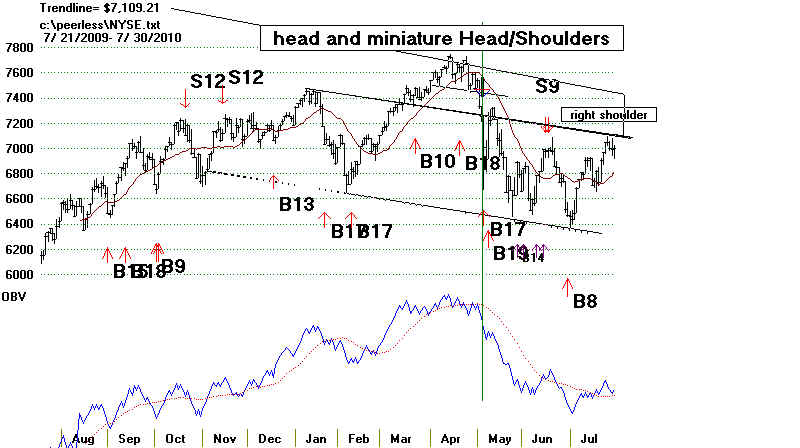
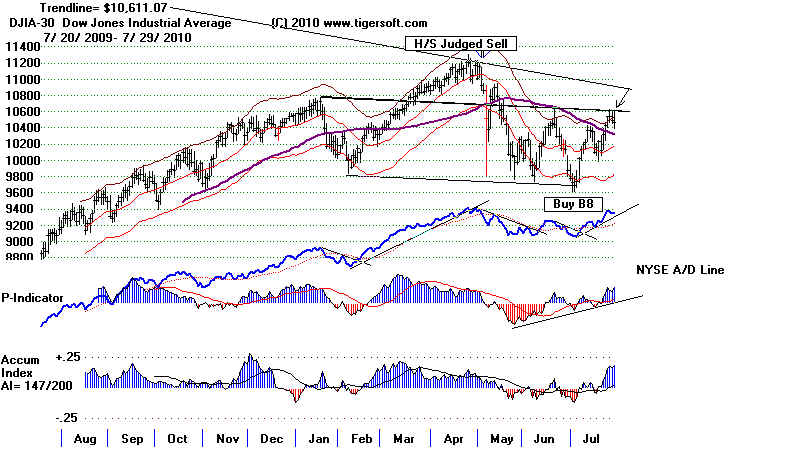
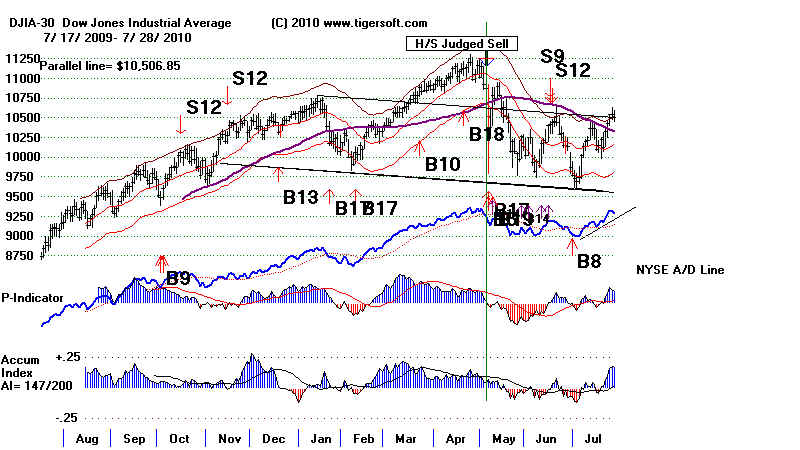
8/18/2010 Judged Sell based on NYSE A/D Line trend-break and
DJI's head and shoulders' pattern. But as long
as the Closing
Powers keep rising and Interest Rates stay in a downtrend,
the market will probably rally. Watch for reversals of
these.
The normally bearish month of September is not far away.
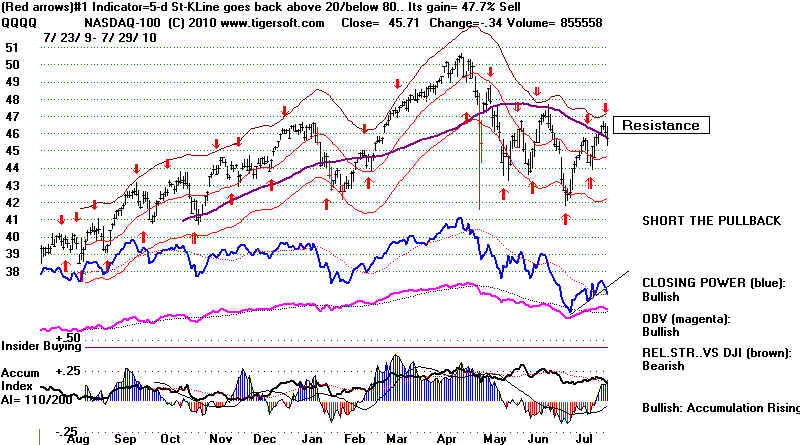
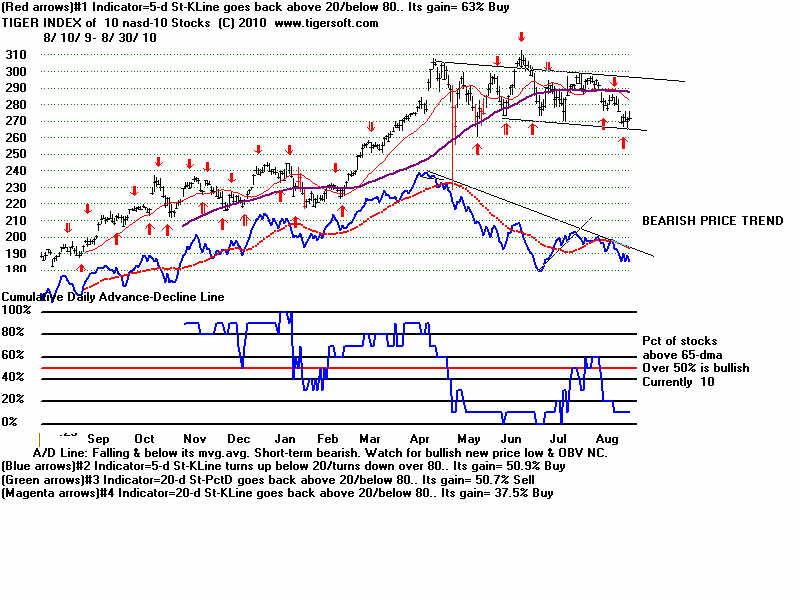
Speculative stocks do not agree that this
is still a bull market. More stocks made new
lows than new highs on the NASDAQ. Only 3
of the 10 biggest NASDAQ-100 stocks
are above their 65-dma. The QQQQ
has been underperforming the DJIA on a 50-day basis
since June 28th.
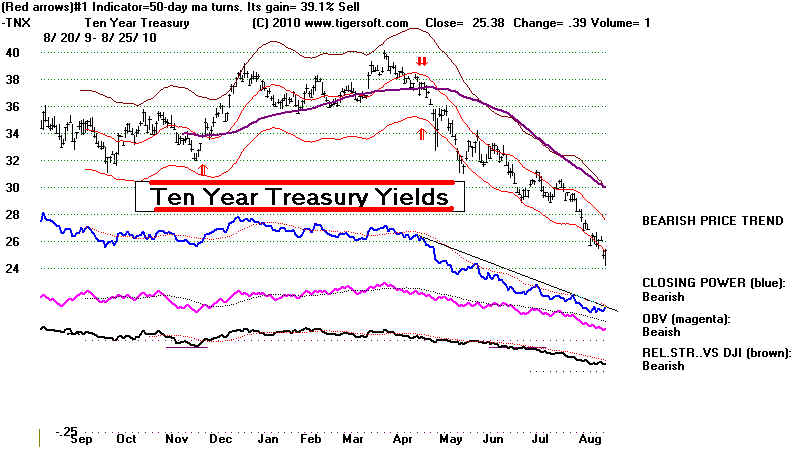
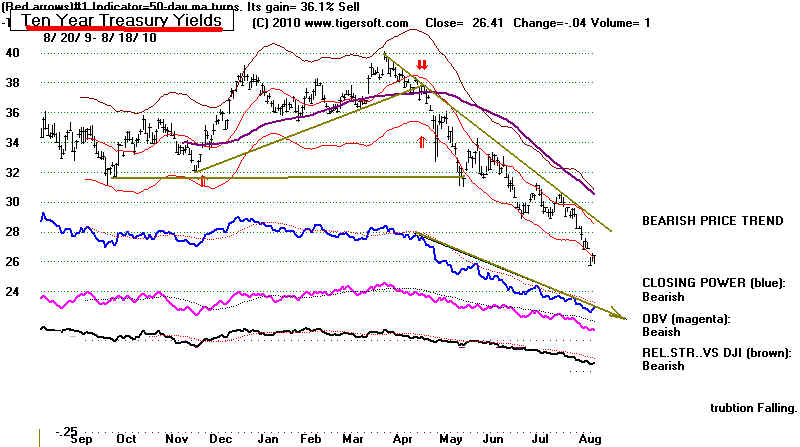
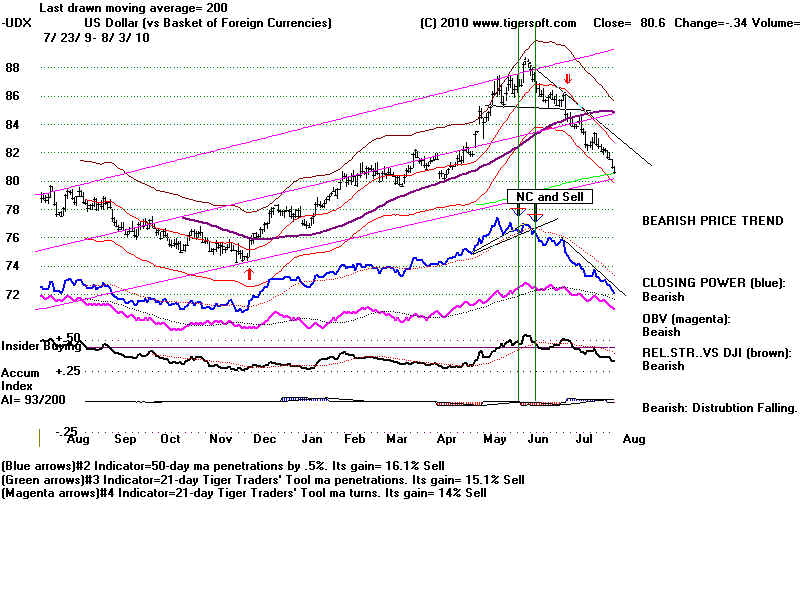
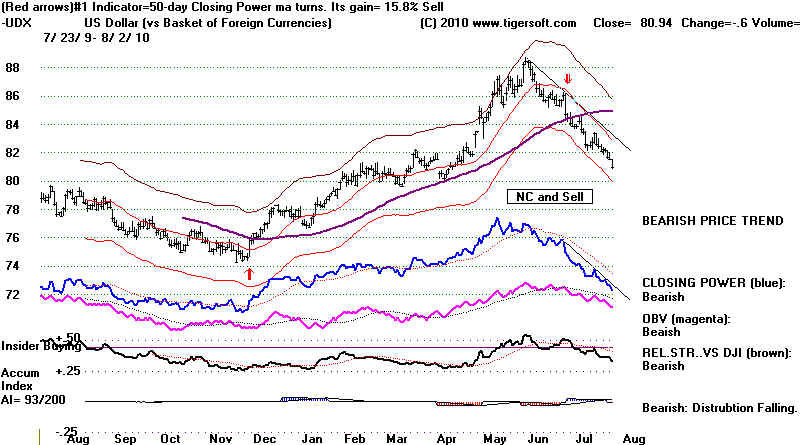
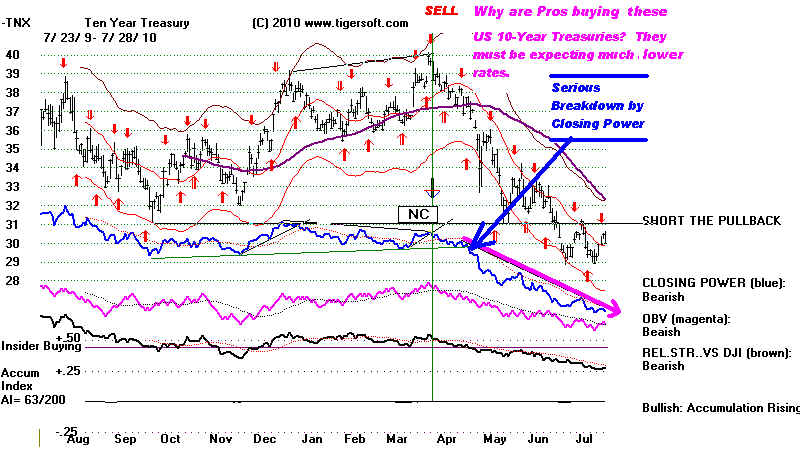
We have said everything depends now upon
the Feds ability to keep interest rates low until
a broader economic recovery is very
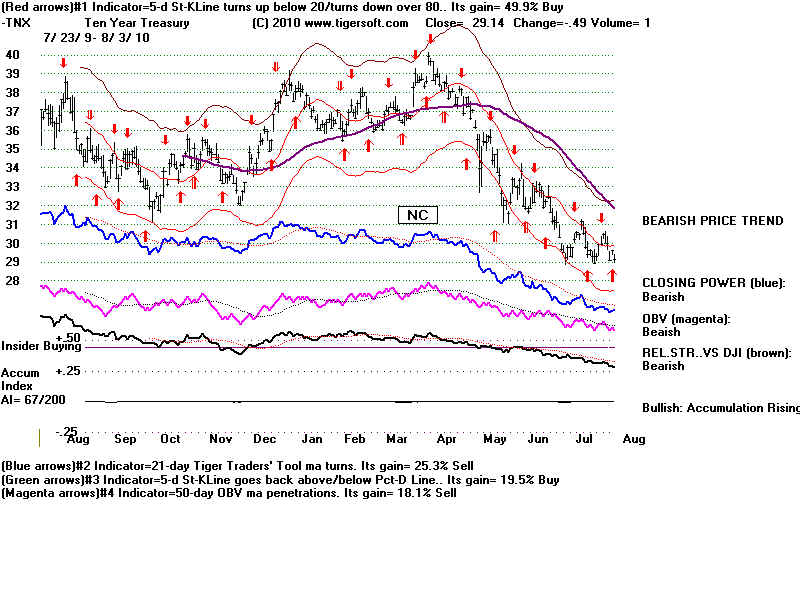
evident. So, far, the Tiger Chart of Ten Year Yields
remains in falling mode. But the
Closing Power downtrend could be broken if rates rally.
See the chart below.
228 stocks has their Closing Power make a
new high today or yesterday.
These are the MAXCP stocks.
The vast majority of these are stocks
that offer yields which were appealing.
The most bullish 10 MAXCP are
FFIV,
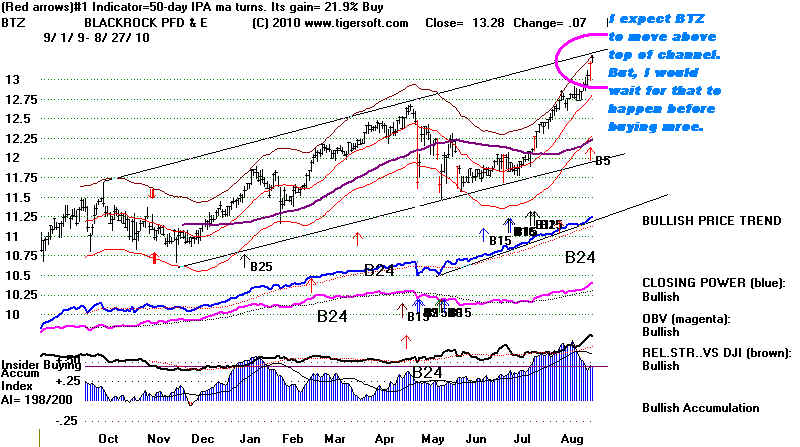
BTZ (current yield = 7.4%),
LNT (current yield = 4.4%),
MYD (current yield = 6.4% )
NST (current yield = 4.1%),
OGE (current yield = 3.6% ),
CRM,
VGR (current yield = 8.4%)
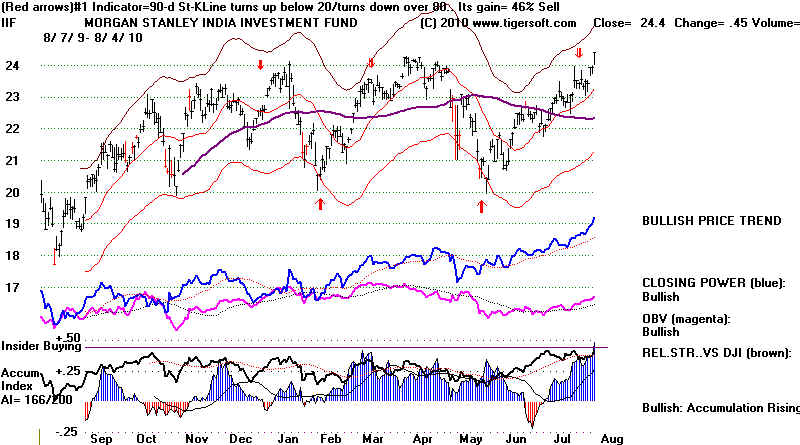
EDD (Morgan Stanley Emerging Markets),
TEG (current yield = 5.5% )
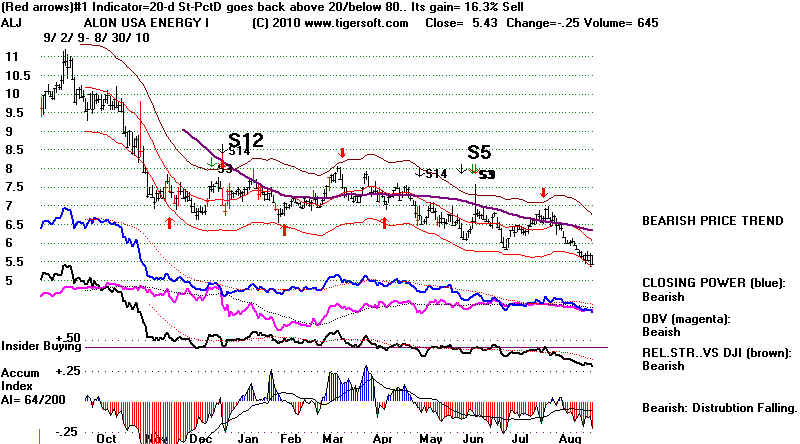
Only 34 stocks appear tonight in the list
of stocks with their Closing Powers making new lows
today or yesterday. All but
11 are already down more than 10% in the last month. 4 are ultra-short
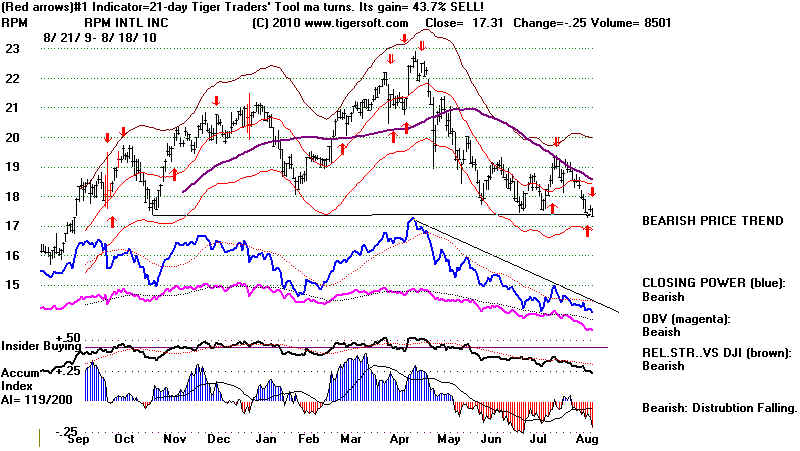
ETFS (DXD, ERY, TZA and SRS). RPM
is the weakest of these "MINCP" stocks. You can see
below that it isat key support but is
sfows heavy red Distribution. Short a little of it, is my advise,
in expectation of a breakdown and short
more when it does close below 17.
RPM - Example of Stock To Short
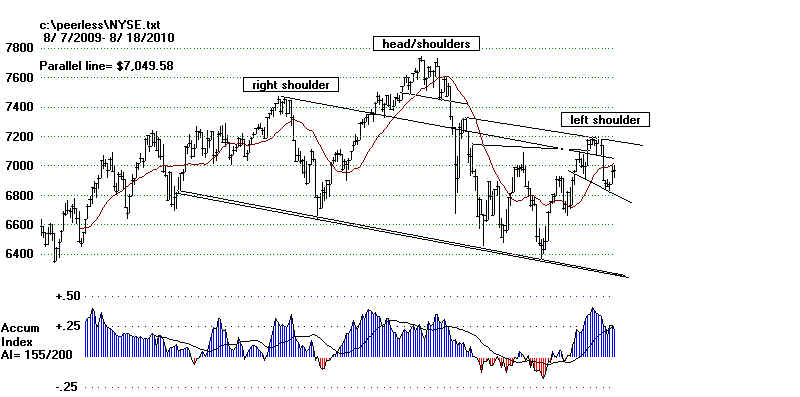
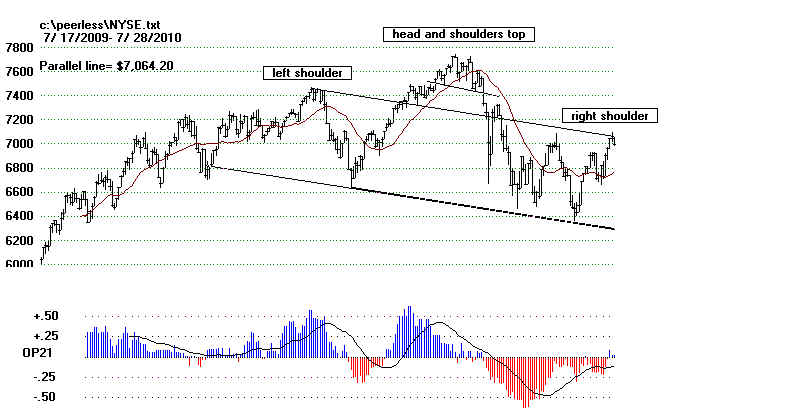
NYSE 106 New Highs 5
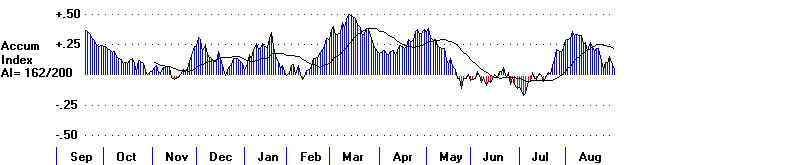
New Lows. Positive Accumulation.
7200 is resistance. Steep A/D line
uptrend has been broken.
NASDAQ 17 New Highs 22 New Lows. Positive
Accumulation.
2340 is resistance.
IWM - Russell 2000 ETF

---------------------------------------------------------------------------------------------------------------------------
8/17/2010
It Seems Best Still to Consider Us Operating
Under A Judged Sell. The Sell was based on the break in the
NYSE A/D Line's uptrend right after the right shoulder appeared
in the DJI's 8-month-long head and shoulders pattern. For more
of the rationalle see other recent Hotlines.
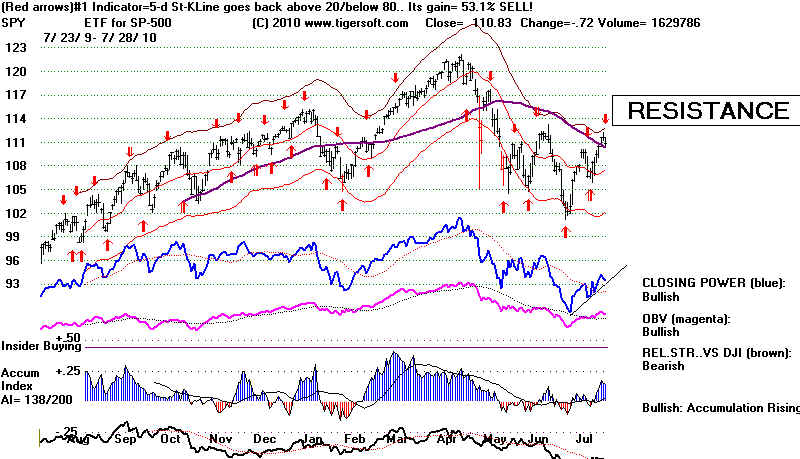
A case can be made
for an extended stalemate in the market.
The Tiger Index of SP-500 stocks shows the 10 month
head
and shoulders pattern we are stuck in. If
symmetry were to
play out, we might not see a decisive move up or down
until
early next year. With the DJI's internals still
positive, it would
seem any decline back to 9800-10000 would bring in
buyers from
the sidelines. On the other hand, a rally to
10500-10600 would probably
be met with lots of sellers, because the real economy
is so slow
to improve and interest rates cannot realistically be
expected
to fall much more.
Another small head
and shoulders has appearedi in the last two week's trading.
. The DJI backed off today from the apex of its right shoulder.
This fits in with
the judged Sell, despite today's rally.
Clearly interest rates this low (under 2.7%) make many
dividend paying stocks on the NYSE
attractive. The DJI-30 stocks' DIA pays dividends
that right now yield +2.65%. From this
we can see how closely the DJI is pegged to the 10-Year
Treasury rate. So, the Fed's
buying Treasuries and providing very cheap money to banks
goes a long way in explaining
the resiliency of the market while unemployment is very
high and Main Street is still in
a very bad way. The low interest rates also
lure buyers into foreign ETFs that pay dividends
higher than US Treasury Bills. You can see some of
these below. The Fed is, in effect,
try to reflate the World Economy. That is a big job.
The real question
remains: can the Fed continue to keep rates this low? What can it do
for an encore? Lower 10-year Treasury rates would
seem unlikely. Mostly, the FED must
now keep rates low and ensure that utilities and
corporations remain able to pay the dividends
they do now, if it wants to hold up the market.
That should work for dividend stocks,
so long as the FED does not raise rates and undercut the
attractiveness of all these NYSE
yield stocks. There is no effective political
opposition to Bernanke's easy money policies.
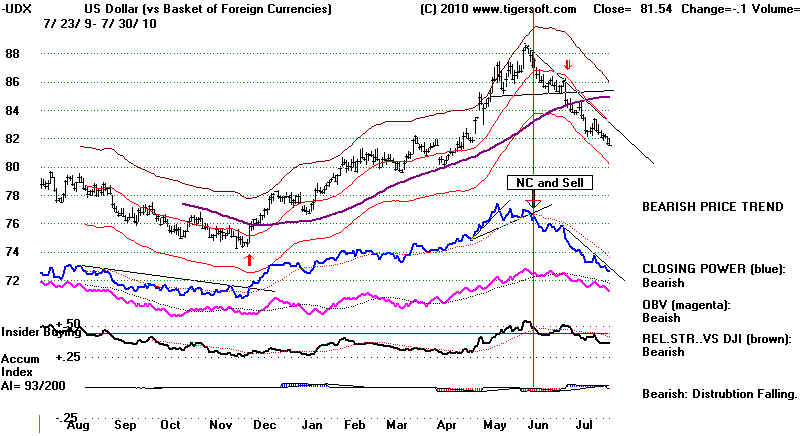
It probably will take unusual Dollar weakness from this
point forward, for the FED to be
forced to raise rates to attract buyers back to US
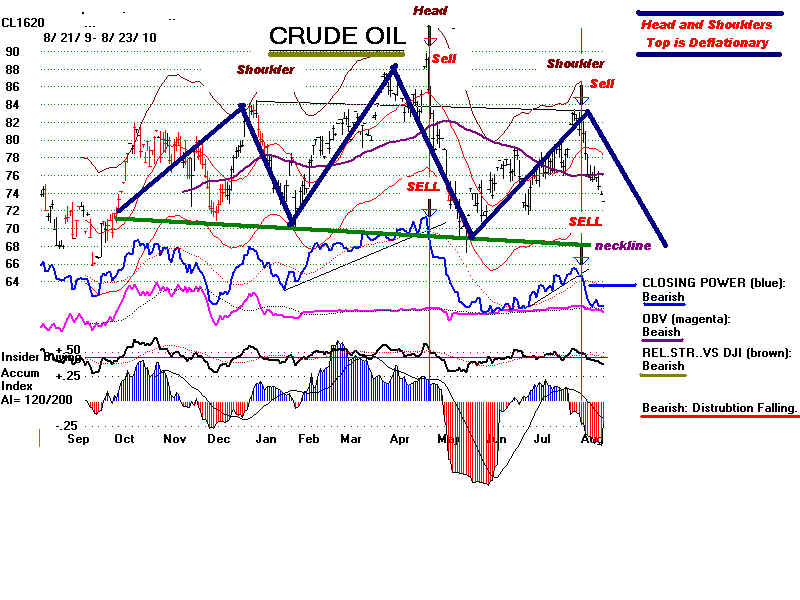
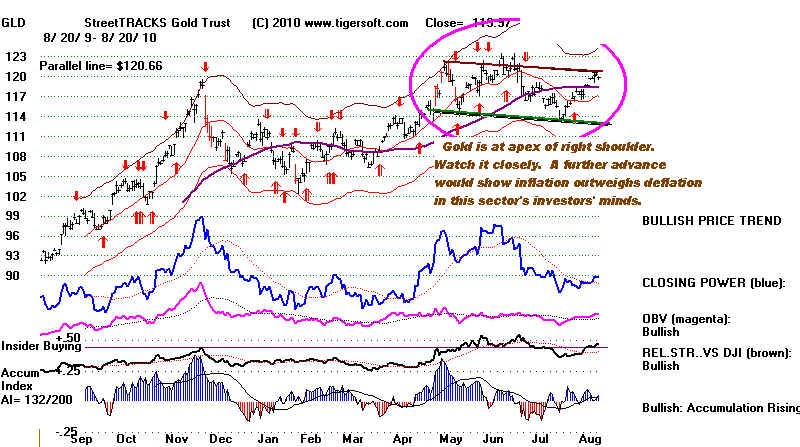
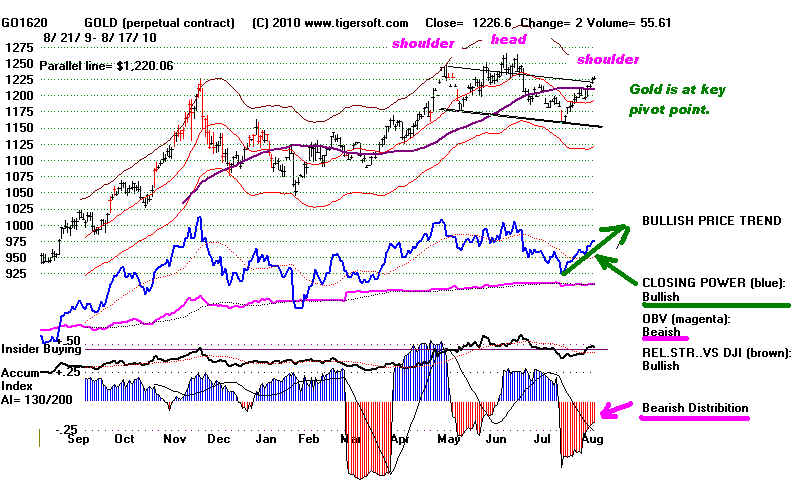
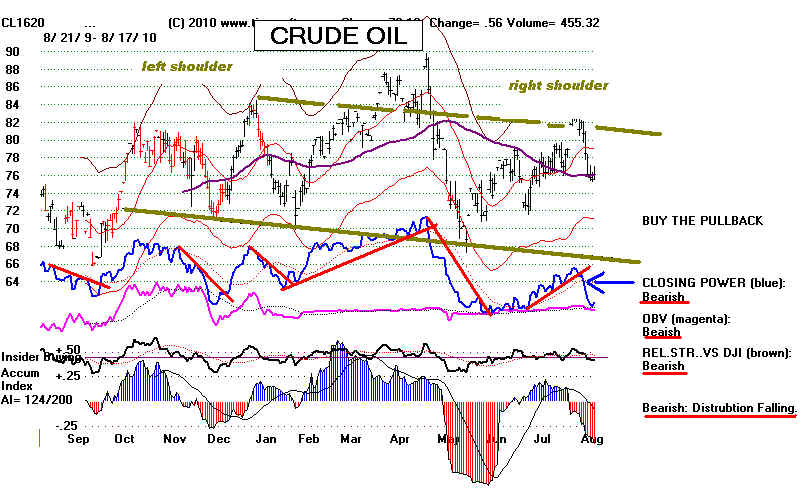
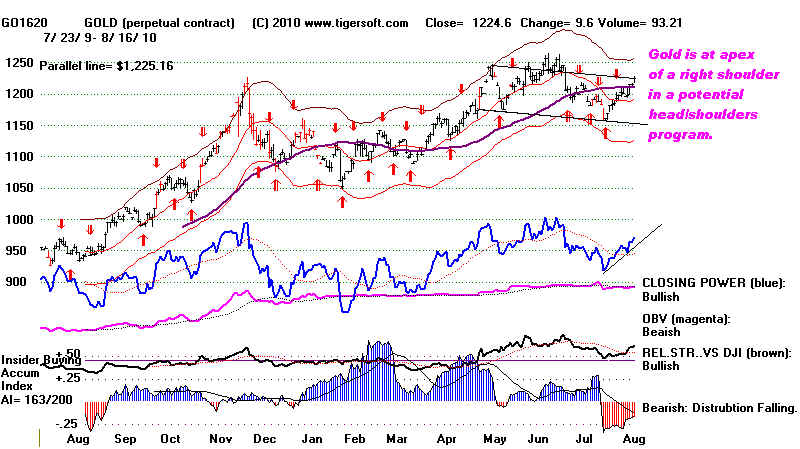
debt. Both Gold and Crude Oil
show bearish head and shoulders patterns. If the
patterns do work out bearishly, it would
mean the FED can continue their low rate policies through
the end of the year. But if the
right shoulder apexes of Gold and Crude Oil are exceeded,
the Dollar will get weaker,
perhaps much weaker, and that would probably force
the FED to lift interest rates.
(The
Importance of FED rate changes for the market was studied in some historical
detail in a Blog I wrote on August 18, 2007
Federal
Reserve Discount Rate Changes and Their Effect of Stock Prices: 1965-2007 )
Gold and Crude Oil
| FED RATE CHANGES ARE BEING MATCHED FAIRLY CLOSELY BY THE YIELDS IN DIA and Foreign ETFS, as well as Utilities, Bonds, REITS and yield funds generally... DIA DJIA +2.65% SPY +2.03% QQQQ +0.49% Yields on Foreign ETFSs BKF Barclays Global +2.9% CH Aberdeen Chile Fund +2.6% DGS WisdomTree Emerging Mkts Small Cap Div +2.96% EPP iShares MSCI Pacific ex-Japan +3.67% EWA iShares Trust (Barclays Glob +3.09% EWG iShares MSCI Canada Index +2.71% EWO iShares MSCI Austria Investable Mkt Idx +4.67% below 149-dma EWP iShares MSCI Spain Index +4.68% below 200-dma EWS iShares Trust (Barclays Global ) +2.95% EWU iShares MSCI United Kingdom Index +2.7% EZA iShares MSCI South Africa Index +3.72% EZU iShares MSCI EMU Index +2.99% FEZ SPDR DJ EURO STOXX 50 +3.39% IEV iShares S&P Europe 350 Index +2.7% IXP iShares S&P Global Telecommunications +4.31% TAO Claymore/AlphaShares China Real Estate +3.55% VGK Vanguard European ETF +4.19% VPL Vanguard Pacific Stock +2.82% |
PEERLESS DJI and SIGNALS
H/S Sell RSH/S Sell
Low Volume
| CURRENT STATUS: KEY ETFs,
Signals. Closing Power and A/D Line Trend 8/17/2010 Closing Power:Opening Power UU = Both up. (initially reliably bullish) DD = Both down (initially reliably bearish) UD = Opening Power up, Closing Power Down (bearish) DU = Opening Power Down, CLosing Power Up (bullish) Blue = Bullish Red = Bearish Click Index Symbol Automatic Closing Power Pct of Stks over Opening Power To See Graph Signal Trend over 65-dma Closing Power --------------------------------------------------------------------------------------------------------------------------------------- DIA Red Sell Closing Power is Rising DU Bullish DJIA-TGR-Index Red Buy A/D Line Trend Break 57% (+17%) SPY- Red Buy Closing Power is Rising DU Bullish SPY-TGR-Index Red Sell A/D Line Trend Break 50.4% (+6%) QQQQ Red Buy Closing Power is Rising . DU Bullish QQQQ-TGR-Index Red Buy A/D Line Trend Break 42% (+7%) QQQQ-10-TGR-Index Red Buy A/D Line Trend Break 20% no change Still above 65-dma but caught in flat trading range. Foreign ETFs Red Buy! A/D Line is Rising 95% (+6%) 6 buys / 2 sells 4 buys / 4 sells |
-
HOTLINE
8/16/2010 Judged Right Shoulder Apex Sell
with Break in A/D Line Uptrend.
The markets have refused to sell off following last week's break.
The DJI seems
to have support at its 65-dma
support. Its chart is above. if the market cannot
fall, it should try to rally.
The rising CLosing Powers suggest this briefly.
The Fed
is apparently now heavily buying Treasury instruments with money they are
empowered to create.
Deflationary pressures and employment stagnation are also
reducing borrowing demand;
this and the bankers' preferred way of making money
now, borrowing from the Fed
for nearly nothing and buying Treasury instruments.
So, the result is interest
rates have fallen to new lows, below 2.6%. The FED now has
its own a stake in keeping
interest rates low. (Aug
17th Report of heavy Fed buying
Treasuries) If the
Chinese or Japanese started selling their Treasuries, not only would
interest rates rise
sharply,but the Fed's balance sheet would be savaged. This is
risky behavior by Bernanke.
Is it a sign of desperation?)

Such low
interest rates have sent the bond market soaring and also made foreign
investments with higher
yields seem more attractive. We see this in the exceptional
strength in bonds and foreign
ETFs. Cyclical industrial metals crossed back above
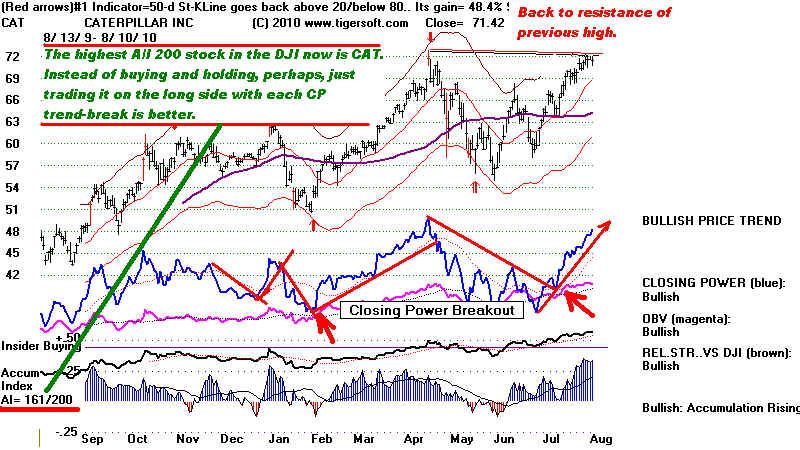
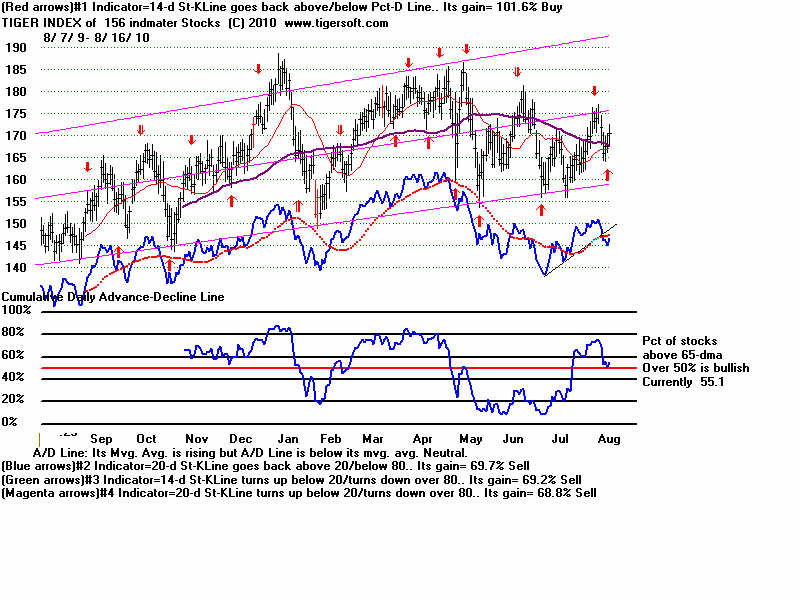
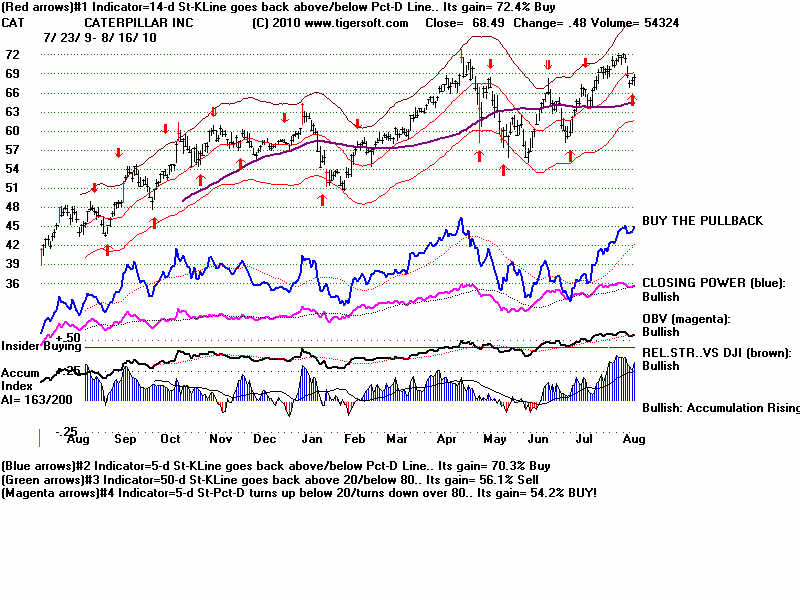
their 65-dma today and are on a short-term Buy. CAT is the highest AI/200 stock in the
DJI. It just gave a new
short-term Buy. I would buy CAT now. Perhaps, cyclicals
will lead the recovery, as
their reputation would give us hope..
Tiger Index of Bond Stocks
TIGER INDEX OF FOREIGN ETFs
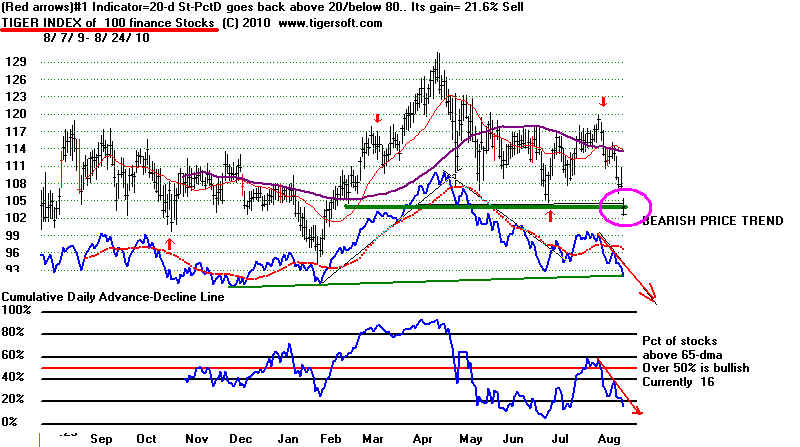
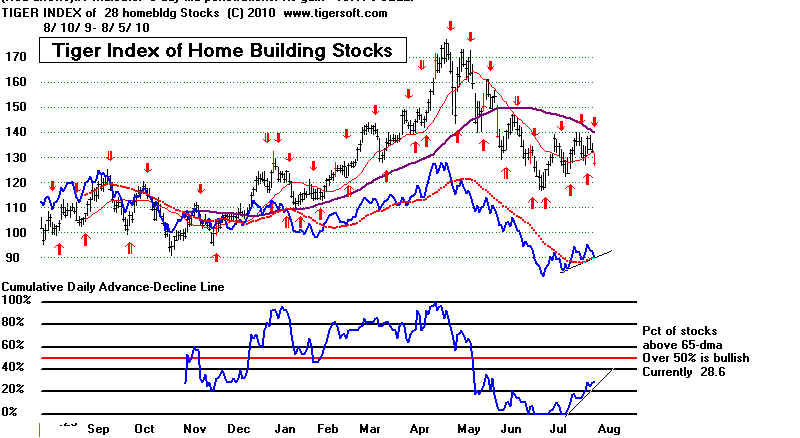
The
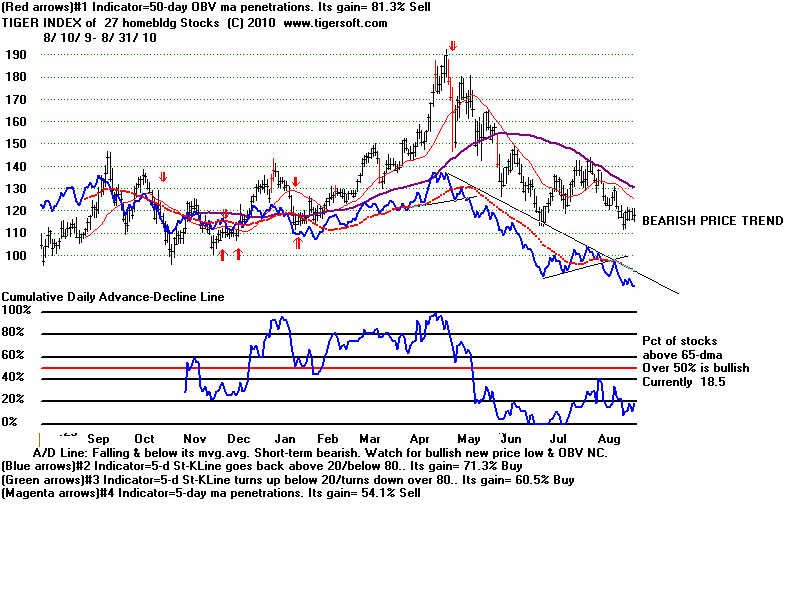
FED claims it is trying to help home buyers. The Tiger Index of Home Builders
does not look good.
That could mean rates will go even lower, if it gives the
Fed more excuse to keep rates
low. More likely, they believe that only if interest
rates are low will a general
economic recovery take place. Such is their faith in
monetary stimulus. A
more real benefit is that the interest on the national Debt
is kept from exploding out of
sight.
TIGER INDEX OF HOME-BUILDING STOCKS

The
risk in the Fed's low interest rate policy is the the Dollar will fall faster and
faster. That has not
happened yet. But a symptom of the potential danger to
the Dollar is renewed
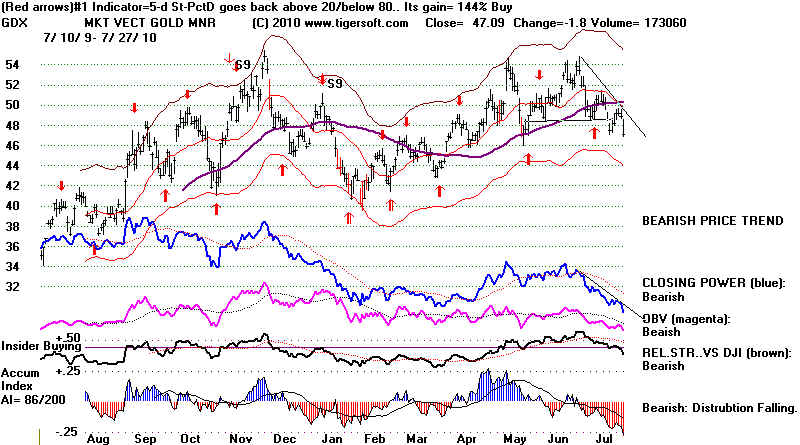
interest in Gold and Gold Stocks. Gold is back above
its 65-dma. Some speculative
Gold stocks are starting to perk up. With interest rates
very low, the comparative
cost of owning gold, which pays no dividend, is insignificant.
GOLD and ANV (Allied Nevada)
Watch to see if these get past their right shoulder apexes.
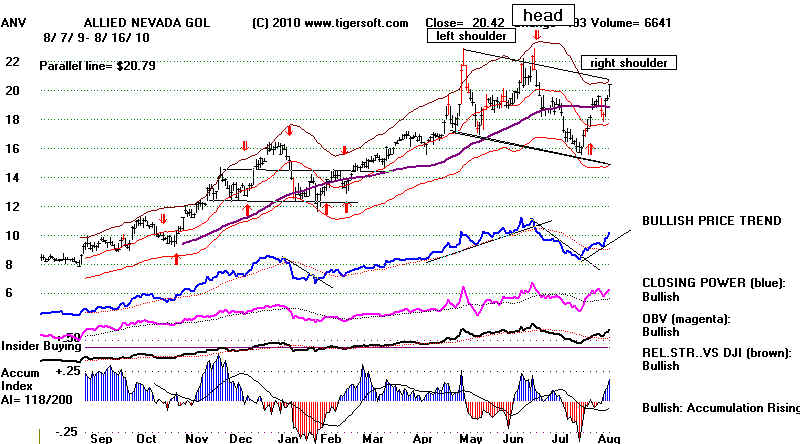
As
long as the A/D Lines of the SPY, NASDAQ-100 and DJIA-30 are in downtrends
and as long as most of these
stocks are below their 65-day ma, I think caution or
hedging is most helpful,
especially when we can short stocks which show insider
selling (negative red
Accumulation) AND falling Professional-Closing Power making
new lows.
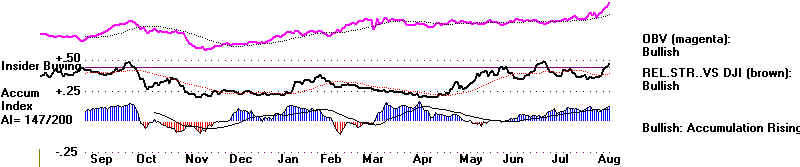
What is impressively
bullish right now is how well the Closing Powers have
been doing for the SPY,
QQQQ and DIA. They have been rising while the
public Opening Power
has been falling. Such divergences are
usually resolved
in favor of what the
CLosing Power does. When the CLosing Power next turns sharply
down, I would expect a
3% decline by the DJIA back to its lower band.
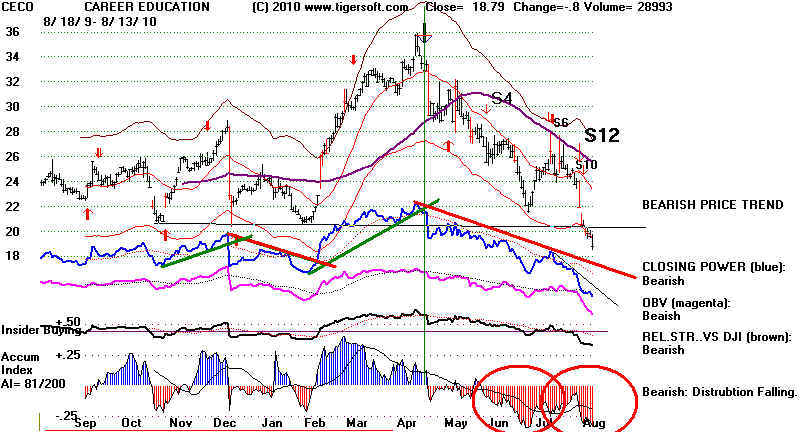
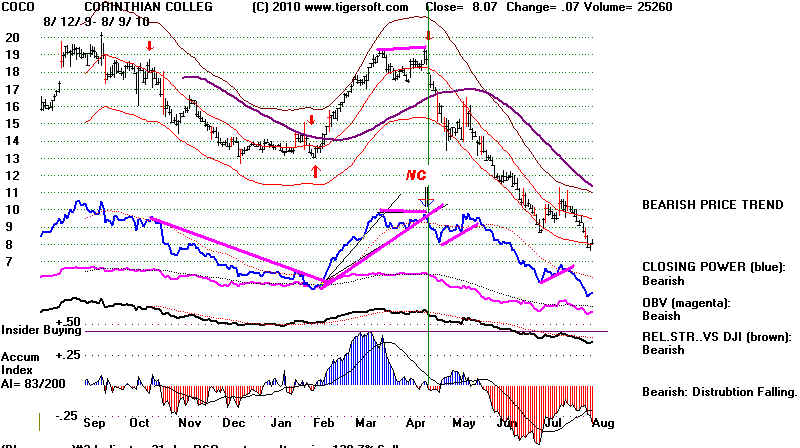
I
believe a real scandal is developing in the for-profit education industry. Insider
selling, such as the selling
of 700,000 shares of APOL by Peter Sterling, one of
America's richest,
before the bad news about the GAO charges of criminal fraud were
made public, will surely
create a public outcry. This
seems such a flagrant case,
it will be interesting to see
if the national media pick up on it, and then if the SEC is
forced to bring insider
trading charges. It does not matter if Sterling exercised
options or sold long held
stock. The rules against insider trading are clear that
insiders cannot sell based on
material information they they have which the public
does not. The charges
of criminal fraud by the GAO are very serious. They seriously
damage the compnay's
credibility on Wall Street, with government subsidizers and
prospective students.

--------------------------------------------------------------------------------------------------------------------------------------------------------
8/13/2010
Judged Right Shoulder Apex Sell
with Break in A/D Line
Uptrend. Seasonality
Is Not Good and Wall Street
Has A New Pariah
Industry.
Two
thirds of the Julys-Augusts in the second year of a Presidential Election Year,
like we are now in, bring very tradable declines.
See table further below for the details.
The
fact that the DJI has formed a head and shoulders pattern should also be great
concern. Our studies show if there is a NYSE
A/D Up-Line trend-break, also like now,
after the DJI hits a symmetrical right shoulder in
what appears to be a developing head
and shoulders pattern, we should look for a drop to
the lower band, at a minimum. That is
about 3% lower for the DJIA. The DJIA chart is
shown further below.
While the CLosing Power Lines are still uptrending, many more of the leading indexes'
stocks are now below their their 65-dma than above.
Their A/D Line uptrends have
been broken, too. Look back and see how well
these A/D Line trendlines work on
the DJIA-30, the NASDAQ-100 and SP-500.
So, we have to be bearish now.
.
This coming week see if the DJI is allowed to move
down below the support of its
65-dma at 19290, just 10 points below Friday's close
and watch the Closing Powers.
Closing weakness below the openings this coming week
would be bearish. Seasonality
for August 15th shows the DJI rose only 48.7% of the
time over the next two weeks
and four weeks.
For Profit Schools Get "F" for Fraud from GAO.
Want some short selling ideas? Look at the
trouble that for-profit schools
are in. The GAO has found evidence of
widespread fraud in that the schools have
have told prospective students how to lie to get a
government subsidy. These colleges
depend on these subsidies. Besides
"F" for Criminal Fraud", more and more reports
are showing that they also are getting an
"F" for failure to educate usefully for a career
while putting forth ads that claim the opposite.
Lawyers already getting in the act.
http://finance.yahoo.com/news/Kahn-Swick-Foti-LLC-and-pz-314049688.html?x=0
.
You can see from the charts 2 months ago of these
stocks that insiders and
then Wall Street professionals knew the GAO was
writing a scathing report on the
abuses of the for-profit vareer colleges....
See the TigerSoft
Blog of August 14,
2010
and the Daily Tiger News
Report of Apollo of 8/7/2010. Read these pieces and see how
the Insider Trading Tiger Charts reflect the news..
Trading the trend of the Tiger
CLosing Power will give you, I expect, a great
insight into how Wall Street handles these,
the latest pariahs.
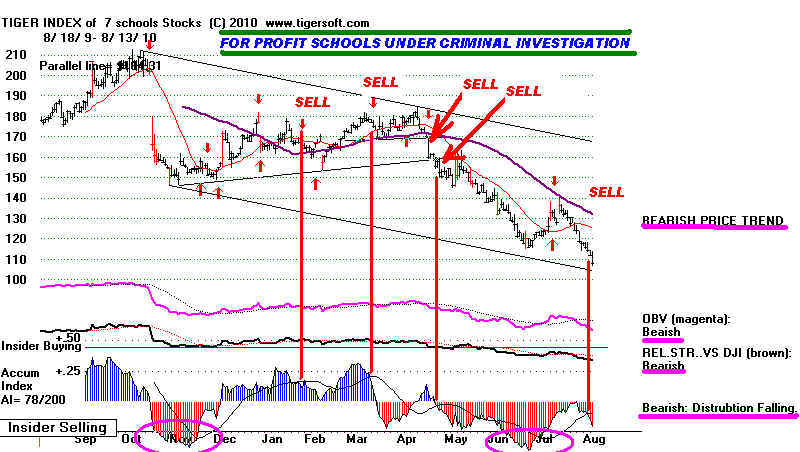
Trade the trend of the Closing Power here.
CURRENT DJIA CHART and PEERLESS SIGNALS  
|


