TigerSoft and Peerless Daily Hotline.
                                                      Tuesday    6 /30/2009


   NOTE THIS HOTLINE's IP ADDRESS WILL CHANGE HERE WEDNESDAY NIGHT.
                   You should have been notified about the new address if your subscription is current.

                                 Order form to Renew On-Line, "Nightly Peerless/TigerSoft Hotline " ($298)
                                                     . 
Previous Hotlines: 5/1/2009 - 6/11/2009
                                                                      3/30/2009-4/30/2009
                                                                (C) 2009, William Schmidt, Ph.D.
wpe15E.jpg (10887 bytes)

  Important Notice:   Redistribution of any text or concepts here is a violation of copyright laws.  This is valuable intellectual property.
   All violators will be subject to legal action.   Please visit
www.tigersoft.com   Goggle TigerSoft and a technical subject, to get
   additional examples and a further discussion of concepts and terms used here.   See also our Books for sale. . 

                      
Overnight Market Action:  Bloomberg Futures around the world before the US Markets open.

 
Color Codes  blue or green  = new to this night's report or considered more important
                       black = from a previous night's report  

  Introduction.
When reading this HOTLINE,  please note the dates that show when the comments in a paragraph or  set
  materials  were written. 
Always read the first comments at the top with the most recent date.  They show the Buy or Sell
  which now applies.
  Older comments are there entirely for background and to teach TigerSoft and Peerless technical analysis. 
  On a Peerless graph,  only the new and latest signal applies.   Again, always note the date at the top of a set of paragraphs.


                                                                  INTRODUCTION.
                   Readers, our assessment of the stock market's future trends is based on the following. 
                   Google TigerSoft and these subjects to get additional links, besides those shown below.

                 
                   1) Peerless automatic Buys and Sells for intermediate-term trend. 
                                Details of Peerless Signals are given here as they occur.
                  2) Price charts and moving averages.
                  3) Closing Power and Closing Power Percent for 2-4 week trends.
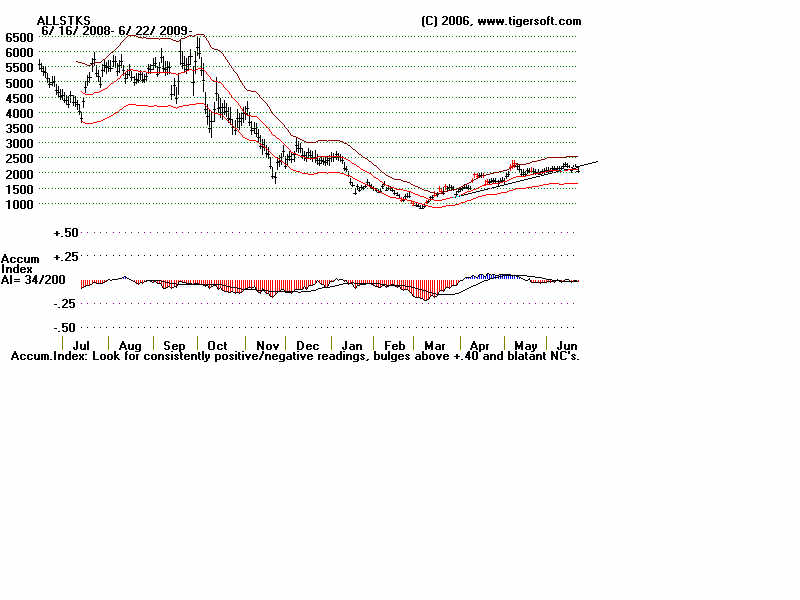
                  4) Accumulation Index to measure support on weakness or distribution on strength.
                  5) Volume (and OBV to a small extent).
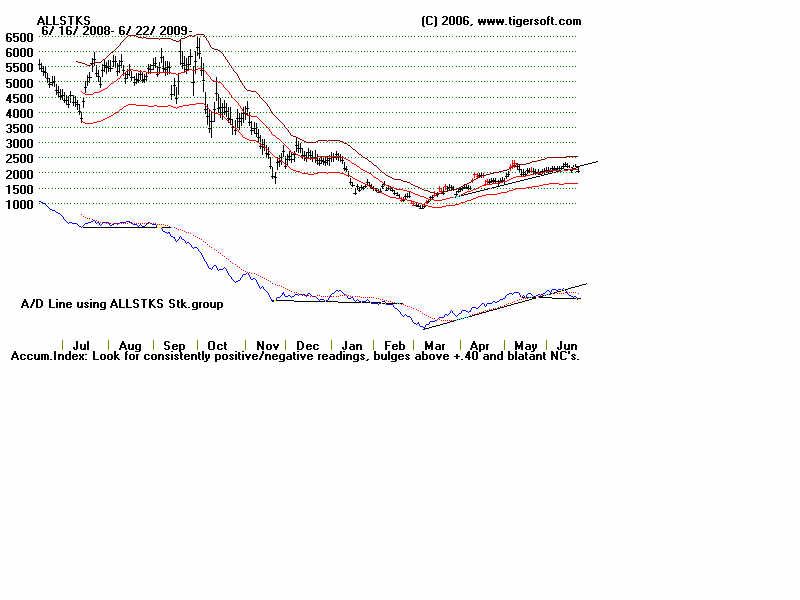
                  6) Breadth: Advances minus Declines.  P-Indicator,  A/D Line
                  7) Stochastics when they are the best trading system.  See QQQQ in 2003.
                  8) Relative Strength -  QQQQ/DJI rising is bullish.  Compare QQQQ Chart now, on this page, with 2003..
                  9) CURRENT Seasonality Updated 6/30
                  10.) CURRENT Sector Strength/Weakness Analysis.  Updated 6/30
                  11) CURRENT NYSE/NASDAQ New Highs and New Lows.   Interesting NH/NL Stocks. Updated 6/30
                  12) News and Political Economy. See Tiger Blog

                 See also 
Predicting The QQQQ Using TigerSoft's Opening Power,
                 Closing Power and Tiger's Day Traders' Tool: 1999-2008

       6/30/2009   
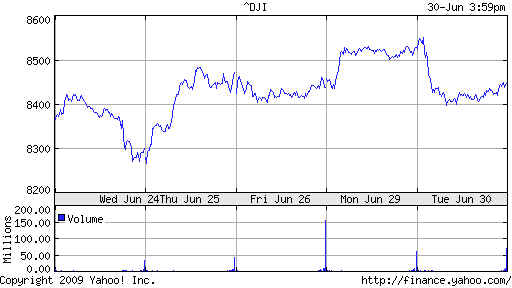
                        DJI    8447  -0.97%               SP-500  927 +0.91%            NASDAQ 1835   -9.02  -0.49%
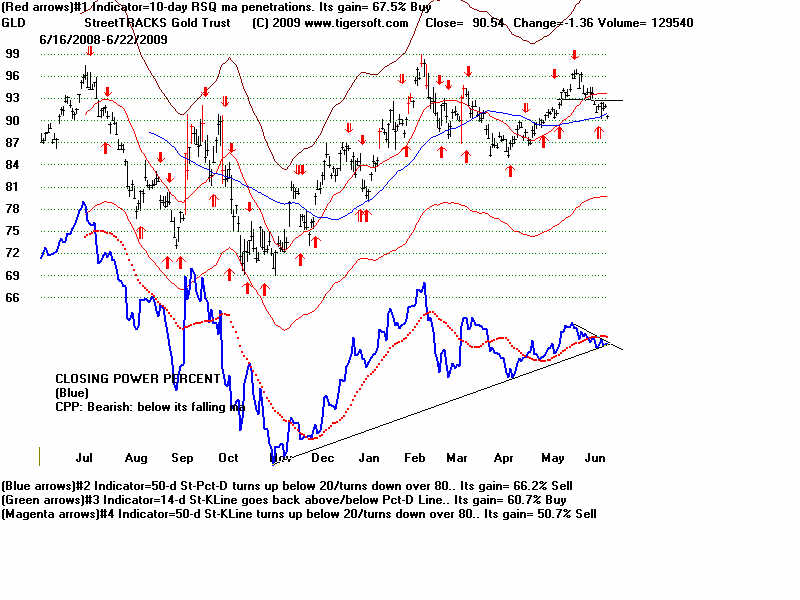
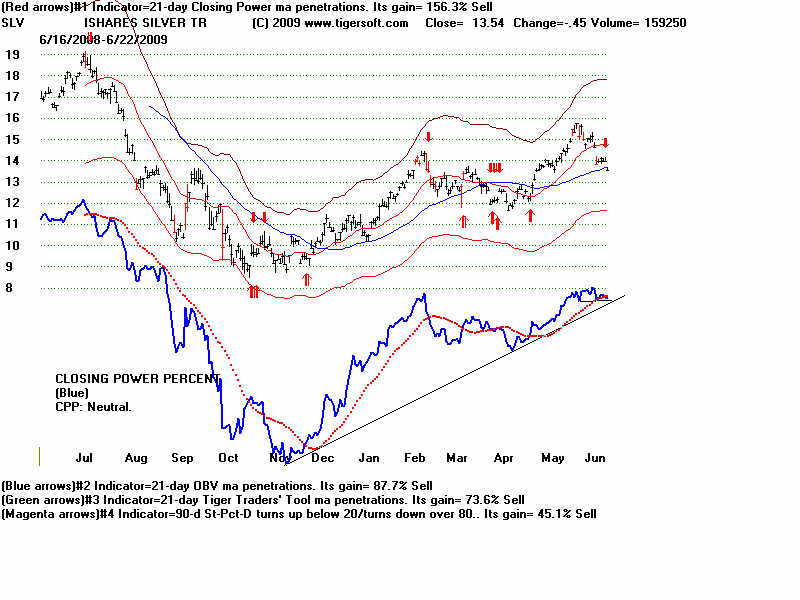
                        USO  37.93 -1.91%           GLD  91.18 -0.93%              SLV 13.38 -2.05%   -2.05%

      wpe15F.jpg (21719 bytes)

                         DJIA AND SUPER-IMPOSED PEERLESS SIGNALS STOCKS 
 
 
                        6/30/2009  8447.00    cl/ma=.984  P=-.11   IP21= -.064  V= -158  Opct = -.221
wpe160.jpg (69915 bytes)
wpe161.jpg (7576 bytes)    
wpe162.jpg (29543 bytes) 
                         
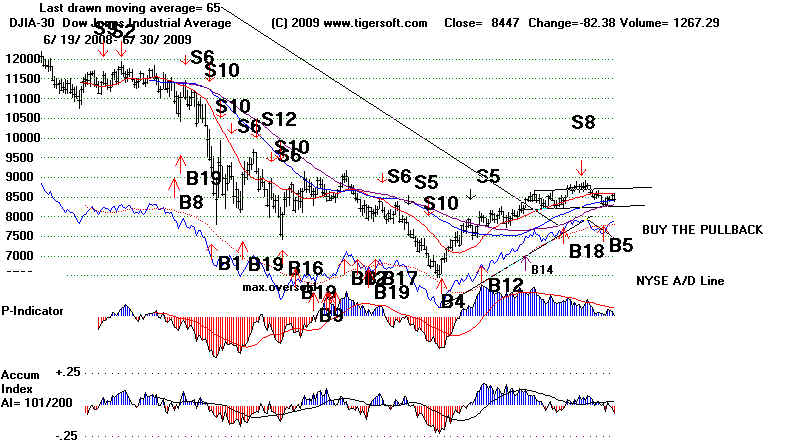
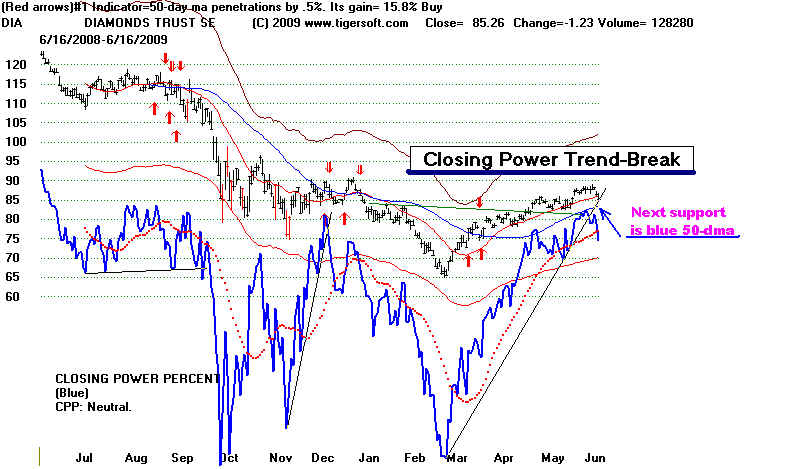
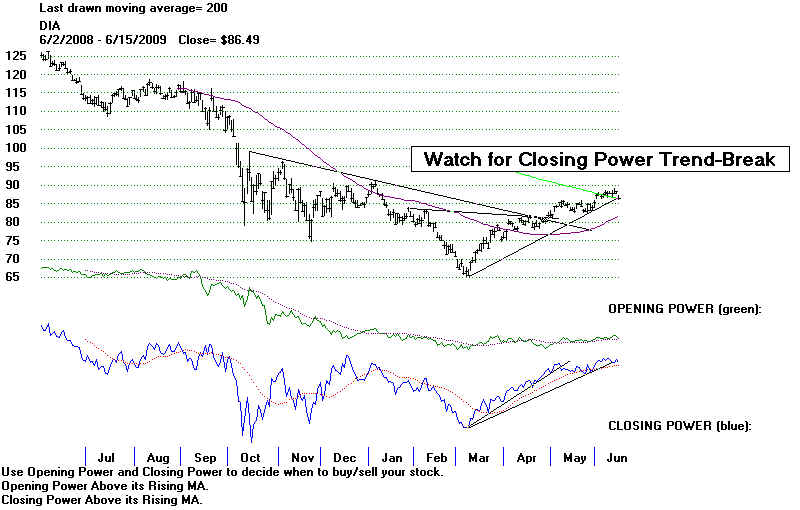
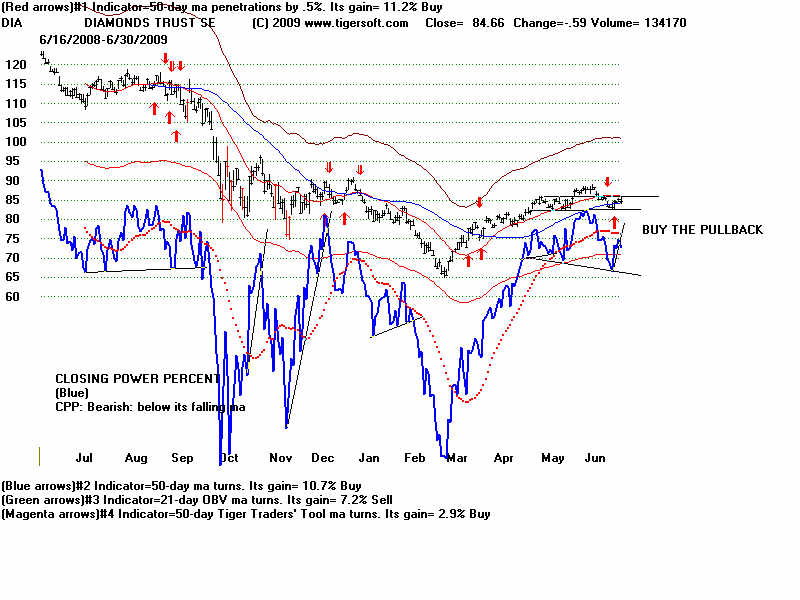
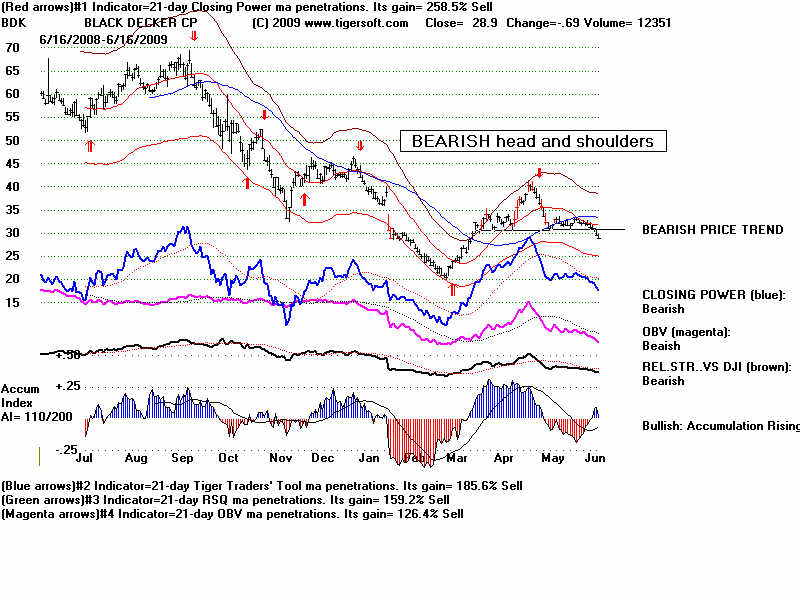
                           DIA - ETF for DJIA Chart   Note the bearish head and shoulders pattern
                           that is developing with DIA's Closing Power.  The DIA's price pattern shows such
                           a pattern is emerging.
The DIA's red Buy is based on its upside penetration of 50-dma. 
                           The DIA's Closing Power's downtrend has been penetrated for a trading Buy.
                           The Closing Power is bearishly below its falling mvg avg.   Expect resistance at 86-87
                           as the DJI tests the right shoulder in a potential head and shoulders pattern. 
Support
                           is at 82.  Wednesday'-Fridays are each up 50.9% to 52.9% for the last year.  It's
                           Mondays (22.4%) and Tuesdays (48.1%) that longs have to be worry about.
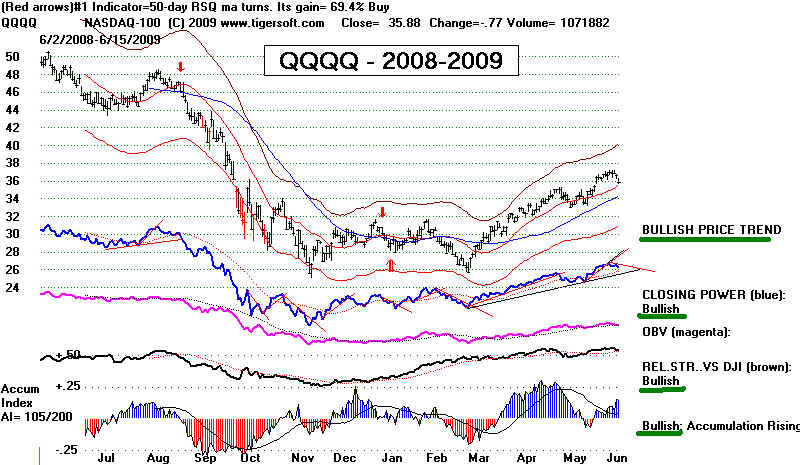
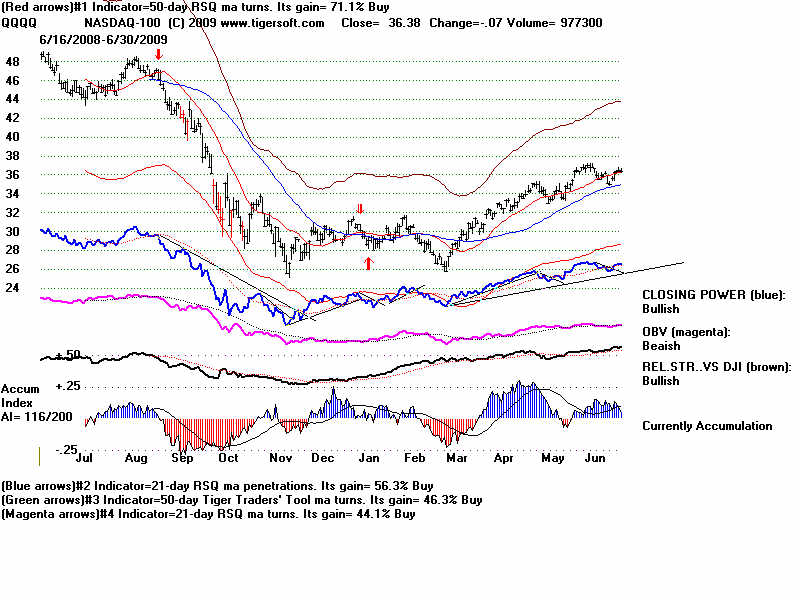

                           QQQQ Chart
                          The QQQQ is rebounding from its rising 50-day ma.  Its internal strength readings are
                            rated "bullish".  38 is a reasonable target based on the height of its earlier trading
                           range, 26-32 and its breakout at 32 plus the height of the base pattern.  The exceeded
                          April high at 35 did act as support.  That is bullish.  The QQQQ has been outperforming
                          the DJI for 5 months when one looks back 50 days and 7% over the last 50 trading days.
                          Mondays for the last year have brought a QQQQ gain only 33% of the time. 
                          Wednesday, Thursday and Friday show a probability between 49% and 51%. It's
                          Accum. Index is still considered "bullish". 

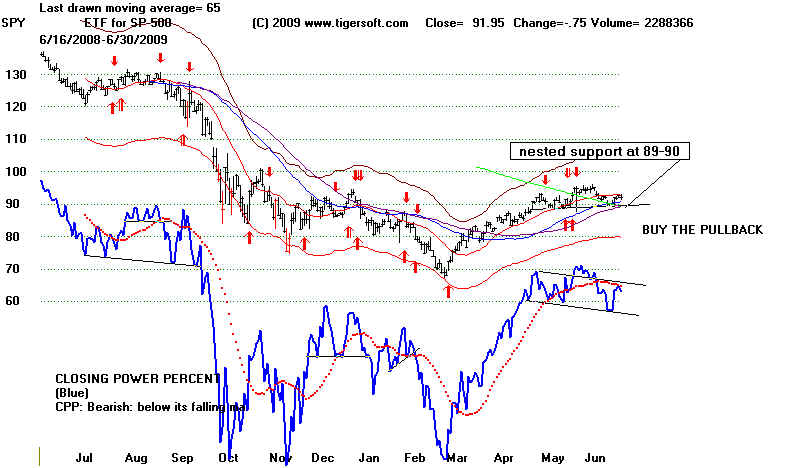
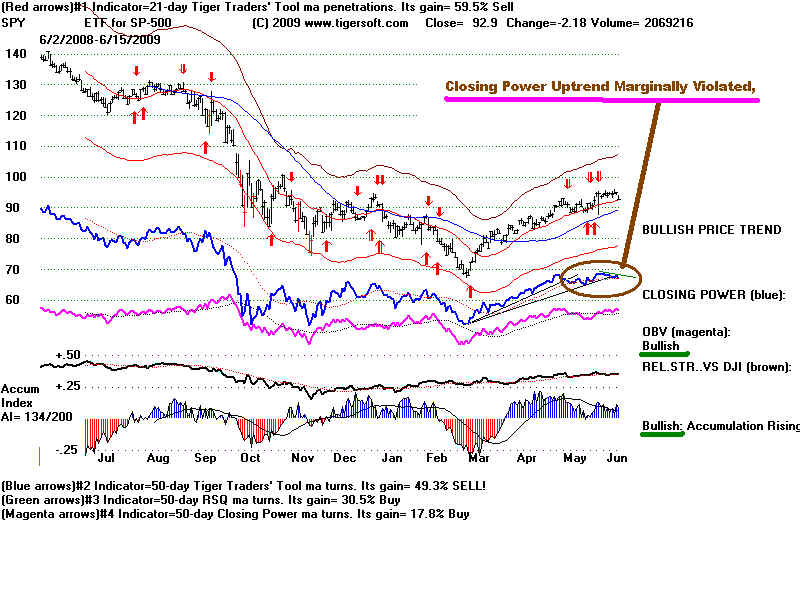
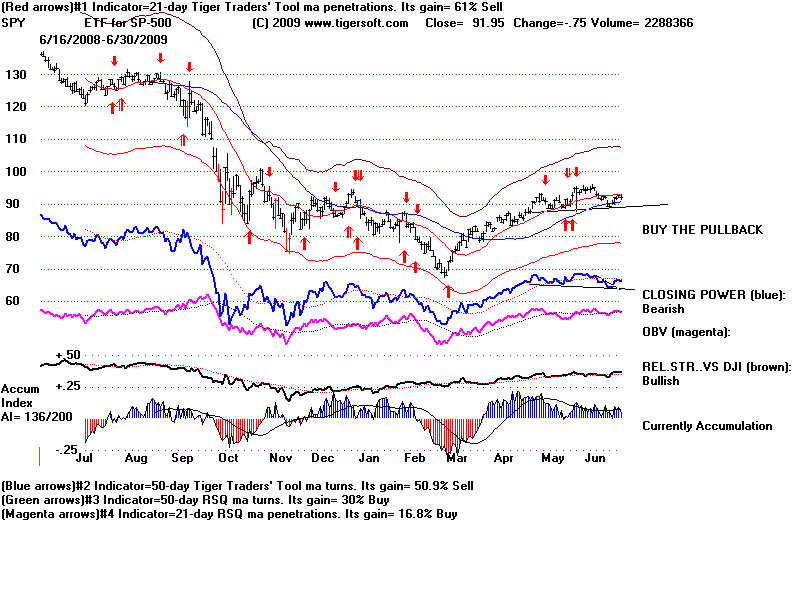
                               SPY Chart   Note the emerging head and shoulders pattern.  the neckline crosses
                          at 89.5.  The Closing Power could not get past past its falling 21-day ma.  The is also
                          forming what may become a head and shoulders top pattern

                          The SPY is now above its now rising 50-day ma and falling 200 day ma.  Mondays
                          for the last year have brought an SPY gain only 33% of the  time.
  Tuesdays and
                          Wednesdays rise 51.8% of the time.  Thursday's are up 60% and Fridays 57%.
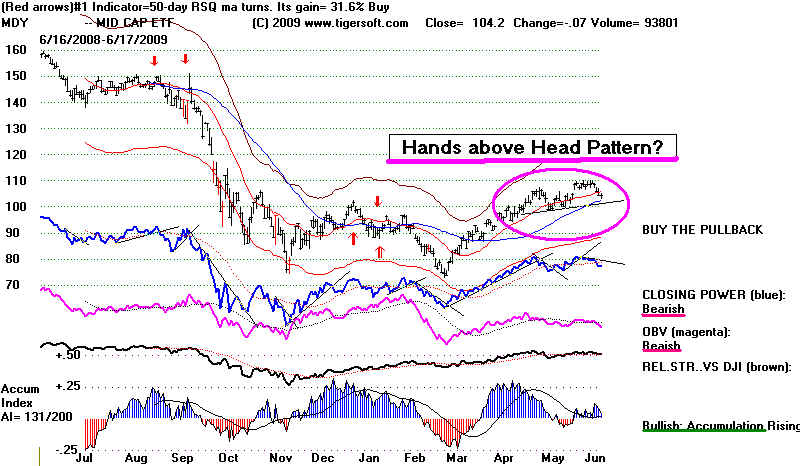
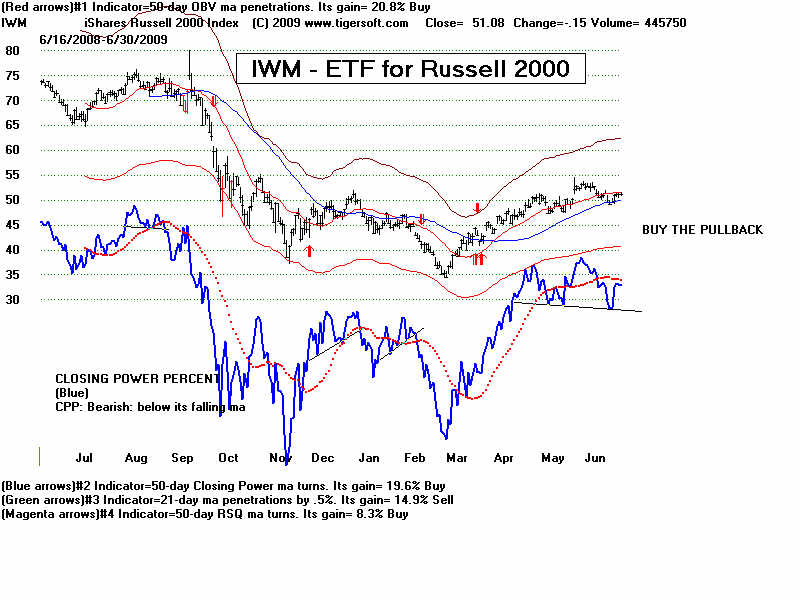
wpe15F.jpg (59621 bytes)
                               IWM - Chart
                          IWM has turned up from its rising 50-day ma.  Its Closing Power downtrend has been
                          violated giving traders a Buy. 
Wednesday's are up 57% of the time, Thursday's
                          50% and Fridays 67%.  Mondays - 32.6% and Tuesday's 51.8%. 


                         6/30/2009  Buy B5 and pre-July 4th Bullish Seasonality
                                                                        versus
                          Bearish DJIA's and SP-500's Head and Shoulders Pattern and
                          Concerns about the low volume and high amount of manipulative program
                          trading by Goldman Sachs, in particular. 


                          The next ten trading days have been up 63% of the time since 1965.   That is statistically
                           significant.   Anything above 56% is worth noting.  Bullish also is the still rising
                           NYSE A/D Line.  Most completed head and shoulder patterns show weaker breadth,
                           where the head in the pattern is not accompanied by a confirming NYSE A/D Line.  In our
                           case the A/D Line is stronger, not weaker, than the DJI.  Until the A/D Line uptrend
                           is violated, we are safe. 

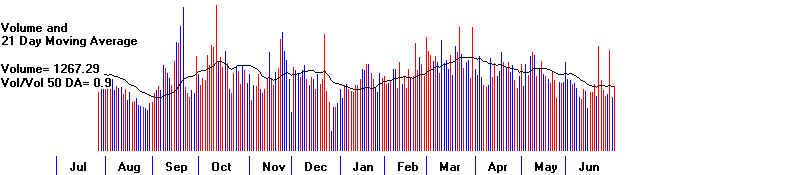
                           The big concern is low volume on rallies in the last 16 trading days and on the right
                           shoulder of the head and shoulders pattern.  This is a classic characteristic of a valid
                           pattern.   This pattern is not recognizable by any computer algorithm I can write.
                           So, we just have to be on the alert.  The negative readings from the Accumulation Index
                           are important confirmations that the pattern is, in fact, developing.  The good news is that
                           a head and shoulders pattern appears in relatively few stocks now.  Normally, we would
                           see more such patterns at a top. Here are more stocks with such patterns.  It will be bearish
                           if they complete their pattern.

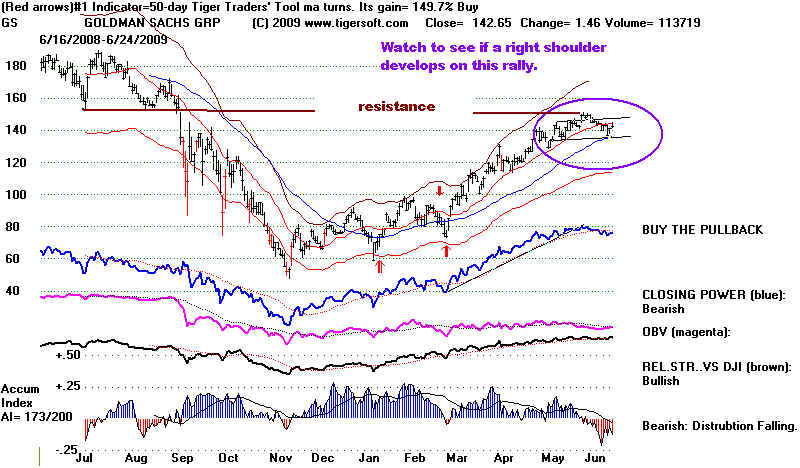
                           How much of the rally is a result of artificial program trading with taxpayer provided
                           TARP bailout money by companies like Goldman Sachs?  Computer program trading
                           has certainly gotten more sophisticated and takes in many more stocks than before.
                           How extensively Goldman's trading now is can be gleaned from earlier statistics showing
                           that Goldman was by far the biggest program trader, nearly always trading for its
                           own account and constituted as much as  74% of the entire trading volume on the NASDAQ
                           for one week two months ago.  Significantly, Goldman has leaned on the NYSE to stop
                           revealing this information.  It is too incriminating!  
The Zero Hedge Blog writes:
                                       "The NYSE has taken action to make sure that nobody will henceforth be able
                          to keep track of the complete dominance that Goldman Sachs exerts over the New York Stock
                          Exchange. This basically ends our weekly Program Trading updates disclosed every Thursday
                          indicating that Goldman has single-handedly captured all of NYSE's program trading. ..This is a
                          travesty, as well as a complete obliteration and a mockery of the move for transparency
                          that the Administration, Regulators and Exchanges have been posturing they support.

                          We advise all readers to contact the provided staff on the memorandum and voice your incredulity
                          with this brazen move to completely obfuscate Goldman's behind-the-scenes take over the world's
                          biggest stock exchange.    Robert Airo, Senior Vice President, NYSE Euronext at (212) 656-5663 or
                          Aleksandra Radakovic, Vice President, NYSE Regulation at (212) 656-4144


                                         Goldman Sachs has a long history of flagrantly manipulating markets, according
                           the lengthy, well-written and carefully researched article in the current Rolling Stone. He
                           counts four major bubbles that they created to fleece retail traders and investors:
                                         1929 Bubble,   Internet Bubble,   Housing Bubble and Oil Bubble
                           Without any prompting, I reached the same conclusion last year as Paulson allowed his old
                           firm to transform itself in a blink into a commercial bank, so that it could get their hands on a
                           TARP handout.  Paulson, of course, was the ex-CEO of GS.  Shamelssly, as Secty of Treasury,
                           he refused to save Lehman Brothers, the primary competitor of Goldman but then
                           rescued AIG so that they could pay $13 billion to Goldman, all at taxpayers' expense. 
                           I will write a summary of Matt Taibbi's many charges in a day or two, but it would be
                           good to read the original source. 1 year is only $14.97.  By the way, Goldman has hardly replied.


==================================================================================
                             6/29/2009   Buy B5 but Note The Bearish Head and Shoulders Pattern

                                  When a head and shoulders pattern appears, it gives us useful trading
                             points to watch: the apex of the right shoulder and the neckline.  In addition, we
                             should watch the volume and the internal strength indicators.  If the pattern is
                             to be acompleted and a new bearish reversal of trend is to occur, certain technical
                             signs usually are present.  Use a checklist like this:


                                1) Is Volume MA waning on the right shoulder?   DJI now - Yes
                                2) Is the Accumulation Index near or below 0 on the right shoulder?  DJI now -.024
                                3) Is the A/D Line falling behind price?  DJI - No. It is above its level on left shoulder
                                4) If the P-Indicator trending down and below zero? DJI - Yes but +101

                                   The current DJI rally could be reversed by a head and shoulders pattern.   That
                               happened in 1930, 1931, 1932, 1938, 1940,  1941, 1974 when the DJI fell more than
                               40%.   See the charts for these years in the study I did this past weekend.
                                                        Head and shoulders patterns since 1915. 

                               A bearish reversal could happen without a Peerless Sell, though that only took place once
                               before, going back to 1928, following a Buy B5.  See the discusson of Buy B5s
                               since 1928.

                               The distribution process takes time. The way a head and shoulders pattern
                               usually works is to allow significant distribution to take place over a few weeks
                               on the right shoulder.  Time and Price symmetry are more common than not.
                               The right shoulder usually is similar to the left shoulder.  The left shoulder in
                               the DJI's current pattern lasted about a month.  The right shoulder here has only
                               been extant 3 days, so far.  On this basis, even if this is a bearish top, the neckline
                               at 8100 may not be violated until early August.  Knowing this, we can play the
                               strongest stocks a little while longer, I would think, even if a big decline lies ahead.  

                               Usually if the market is about to reverse significantly, we see bearish head and
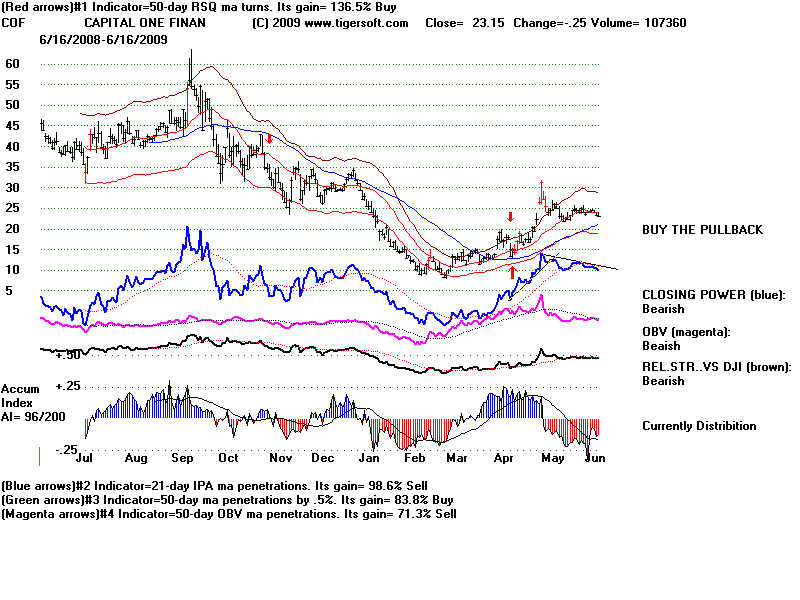
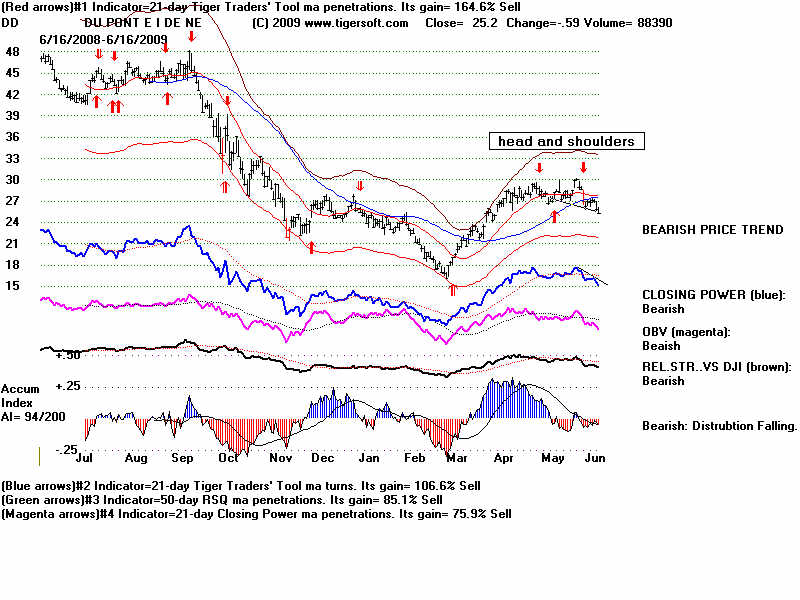
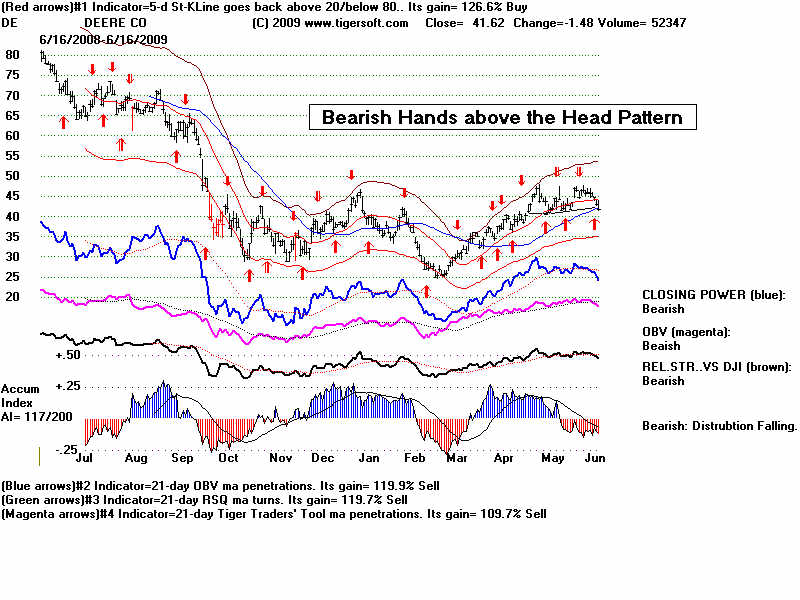
                               shoulders patterns
in important stocks, too Not many are now evident.  There are four
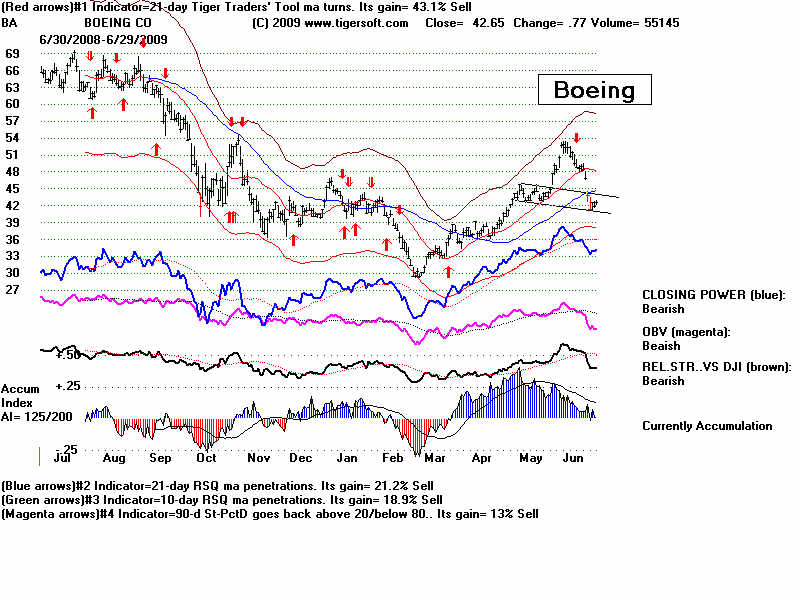
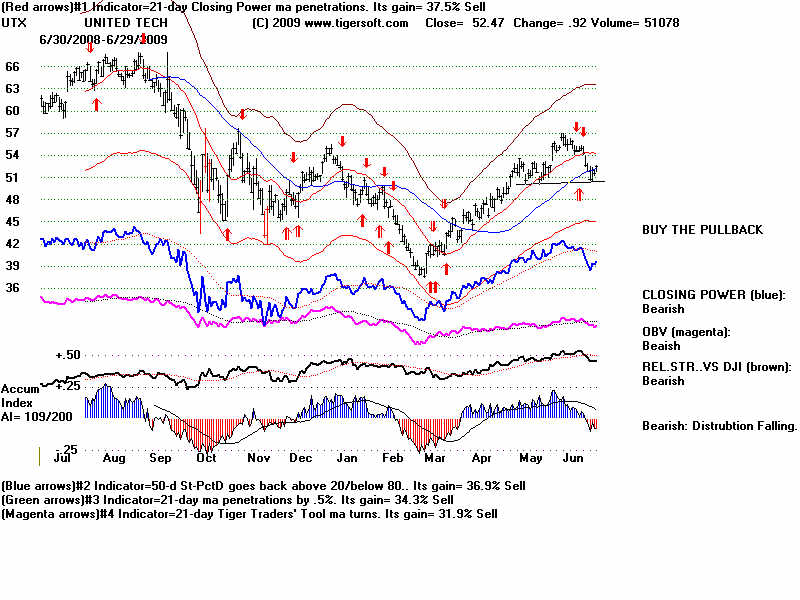
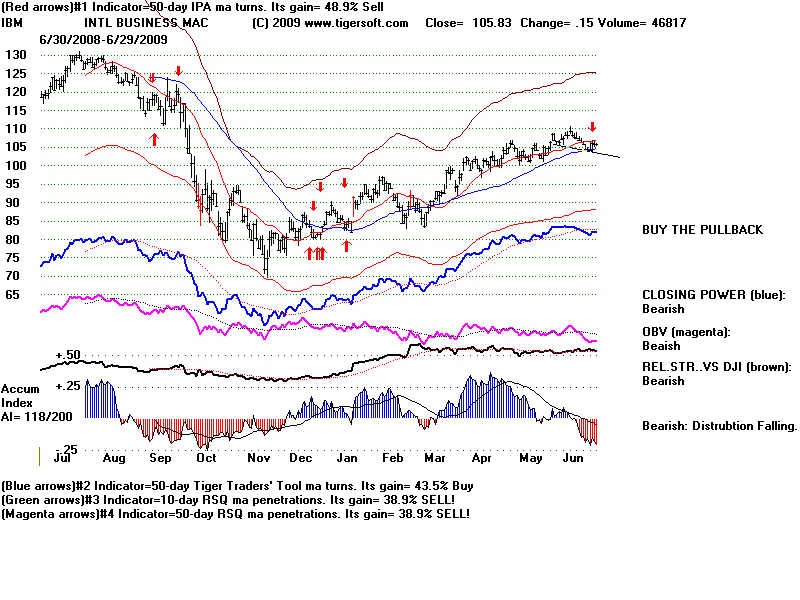
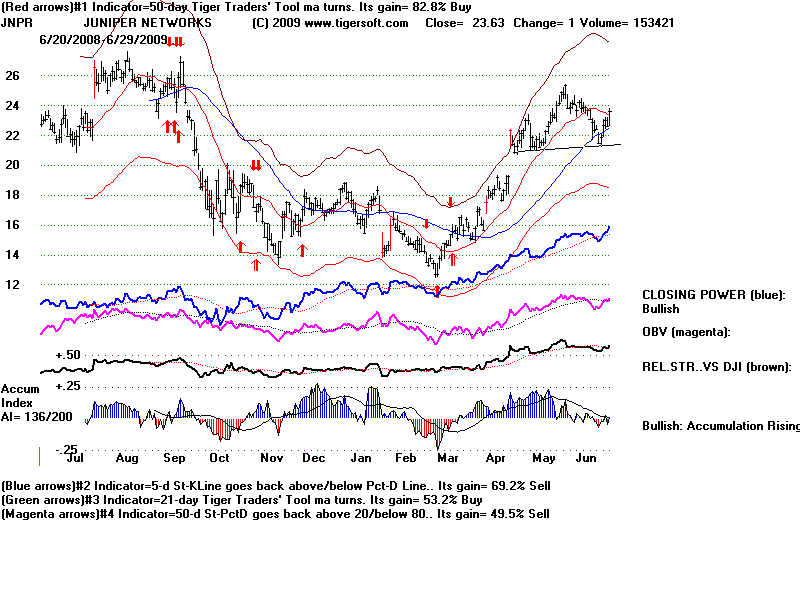
                               developing head and shoulders patterns in key DJI and QQQQ stocks we should
                               probably watch watch:  BA, UTX, IBM and JNPR.

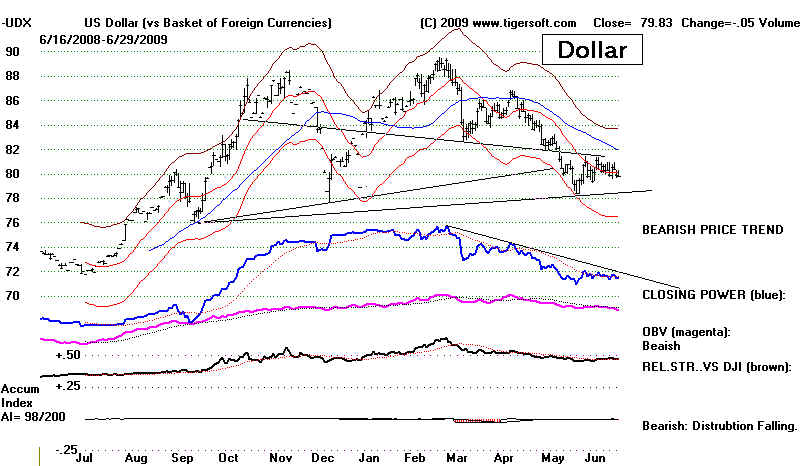
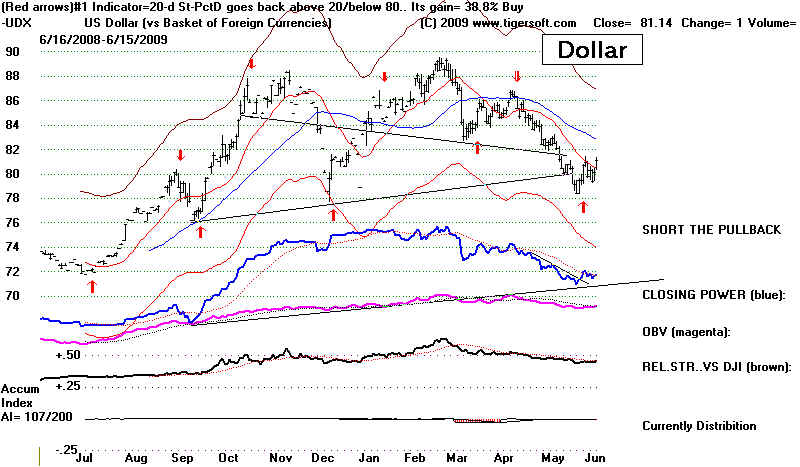
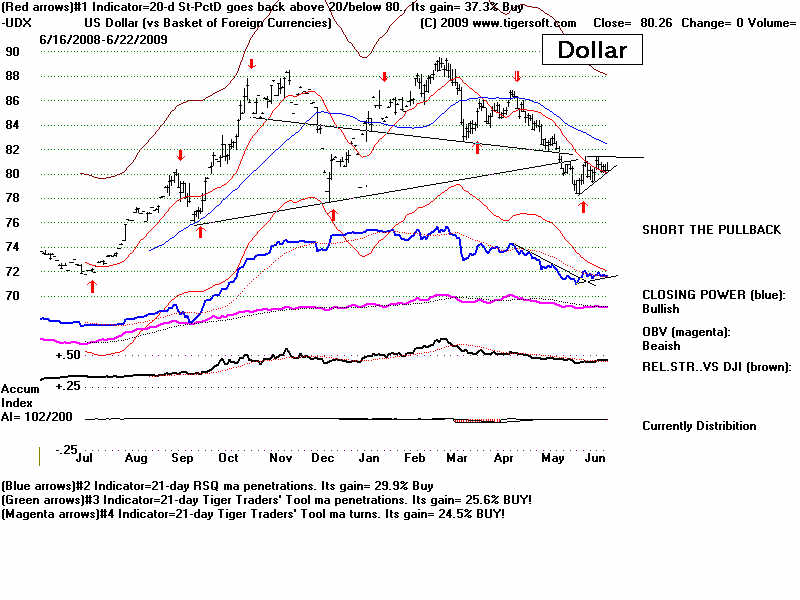
                               Also of interest is the US Dollar.  The Chinese have become more vocal calling for
                               a new international currency other than the Dollar.  The Dollar is holding up just
                               above the key 80 level. 

wpe15F.jpg (64938 bytes)

                                          
Meanwhile, hot money is busy chasing a relatively small number of
                               explosive super stocks, up, up and still higher.  Some of these are very over-extended. 
                               In these cases, their rallies may continue only for one more day because of
                               window-dressing related buying.   We have to be concerned that there is usually a
                               point, where super strength becomes sloppy, careless buying.  Most of the stocks
                               zooming upwards now do show heavy insider buying and professional sponorship. 
                               But how much of this is a new type of program trading?  The broad public is not
                               in the market now.  If they cannot be induced to enter this market, will the program
                               traders be forced to dump their holdings as they did leveraged oil futures last year? 
                               Historically, bull market in secondary and low-priced "cats and dogs" are very
                               rare and last 6-7 months and then they may dry up.  Here I'm thinking of
                               April 1968 - December 1968, the Prudhoe Bay Stocks' Boom and October 1999
                               - April 2000.   Our Stocks' Hotline is still long many of these.  The CLosing Power
                               up- trend is important to watch.  A break after a long run is bearish.  For now, we will
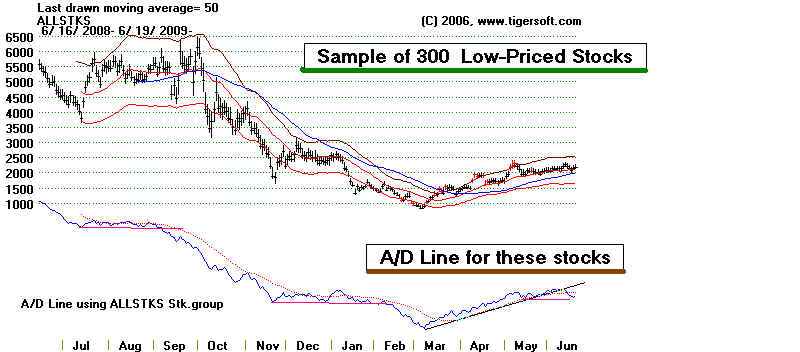
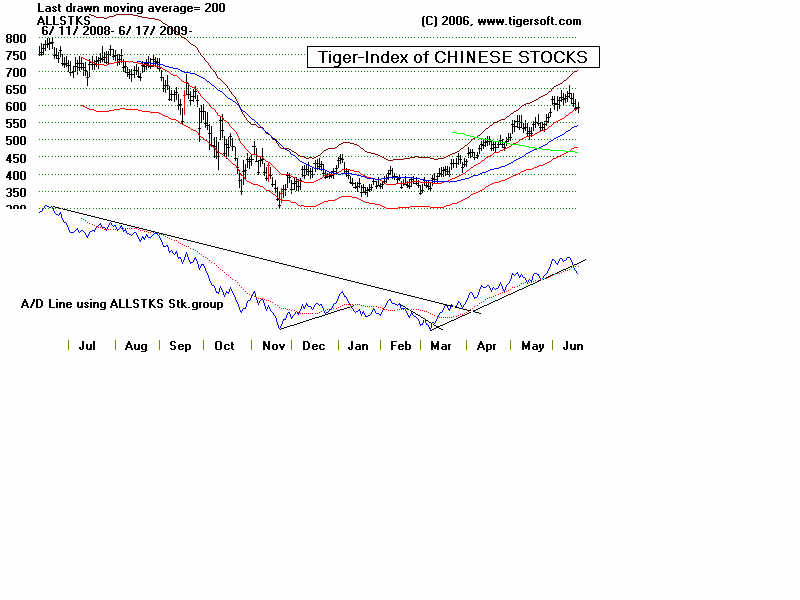
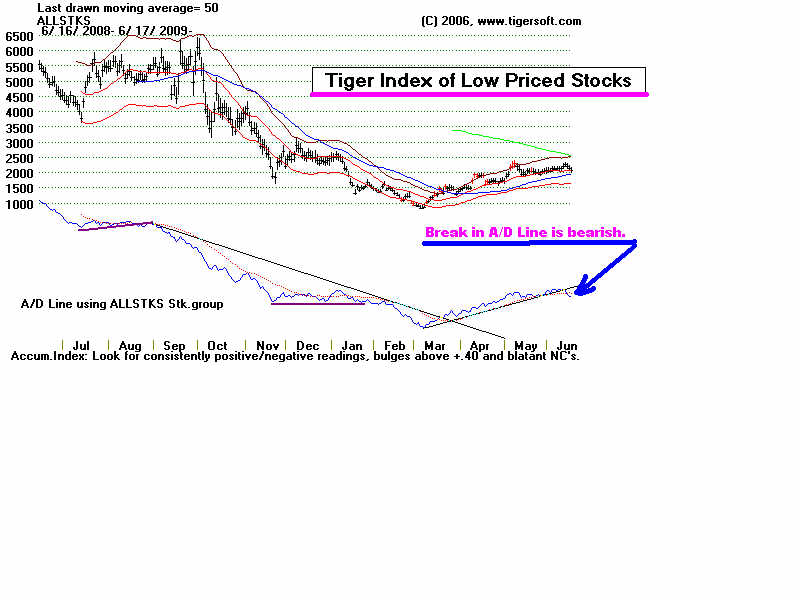
                               also watch the Low-Priced Stocks' A/D Line that TigerSoft's Index program builds. 
                               It is testing its 21-day ma on a rebound.

             wpe165.jpg (46231 bytes)                


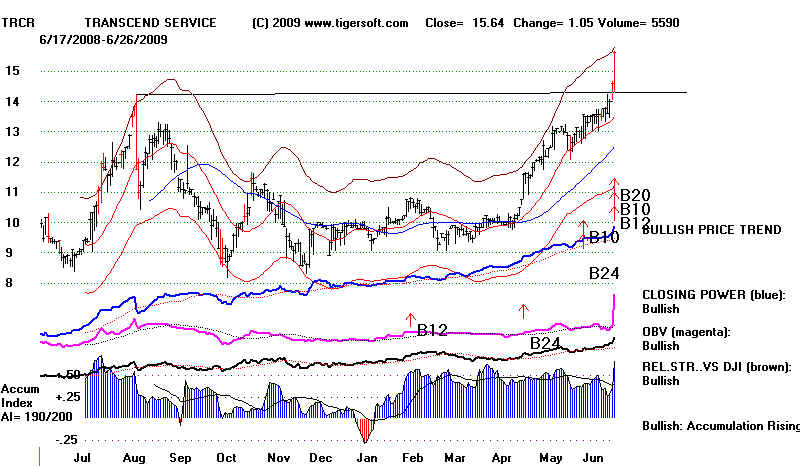
                            6/26/2009     A Peerless Buy B5 is operative Peerless signal.  This signal has
                            always eventually been profitable at the time of the next Peerless sell
                            signal.   This weekend's TigerSoft Elite Stock Professional Report has found
                            a very high number of extraordinary volume Buy B12s.  There is a lot of
                            evidence that Goldman Sachs program trading is making up a very large
                            proportion of all trading volume.  Without fanfare, someone is buying all
                            the most heavily accumulated lower priced stocks with no fanfare.  I am reminded
                            of 1968, except that then it was the small investor who was buying.  Here
                            is an example.  Transcend Medical Transcription Services.

wpe15F.jpg (70157 bytes)

                                    
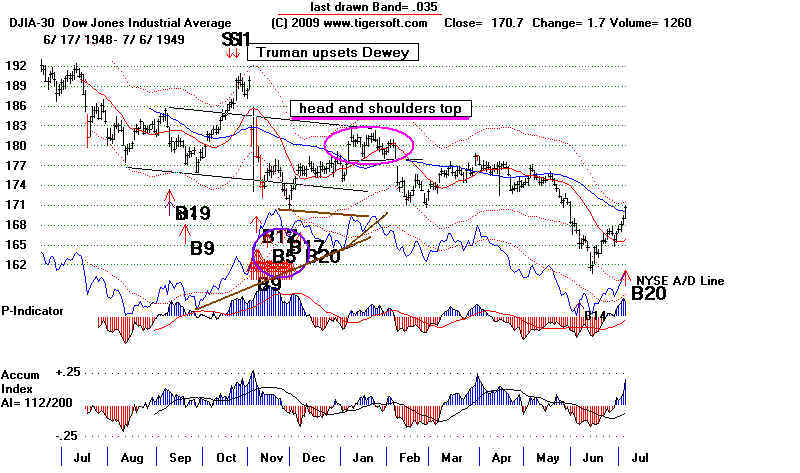
But there is one case when a head and shoulders pattern developed
                            before a Peerless reversing Sell signal.  Since we have a potential head
                            and shoulders pattern emerging with the DJI now, we will want to watch
                            to see how it unfolds.  Selling if the neckline of the head and shoulders
                            pattern was violated would have worked out better than buying and holding
                            until the next Peerless Sell.  Watch also the NYSE A/D Line.  The extensive
                            study of head and shoulders shows the usefulness of simply getting out
                            when the A/D Line uptrend is broken if the head and shoulders pattern
                            plays out.  See 1948-1949 chart below.  For now look at  the extensive
                            research I have just done on all head and shoulders patterns since 1915. 


wpe15F.jpg (72097 bytes)

=================================================================================


6/25/2009
                               Volume was low.  B5s are bullish.   Look for a rally to the upper
                              band near 9000.  There may be resistance at the apex of the right
                              shoulder in a potential head and shoulders pattern.  That apex
                              high is 8663.  Even if a head and shoulders pattern does develop
                              there is usually temporal symmetry, so that a right shoulder
                              may last as long as 3 weeks, before we get a resolution
                             and either a price breakout above 8680 or a price breakdown
                             below the neckline, the lows just seen.  DJI stocks are not
                             where the upside action is.  Look at the lengthening list of new highs
                             to get ideas.  Most nights you will see some of them above at the
                             Introductory link that that says:

                           
11) CURRENT NYSE/NASDAQ New Highs and New Lows.   Interesting Stocks.

                             Some of these are getting quite extended.  Find tech stocks showing lots of
                             accumulation with a CLosing Power making new highs ahead of price. 
                             Some examples are EMC,  MXIM and QCOM.


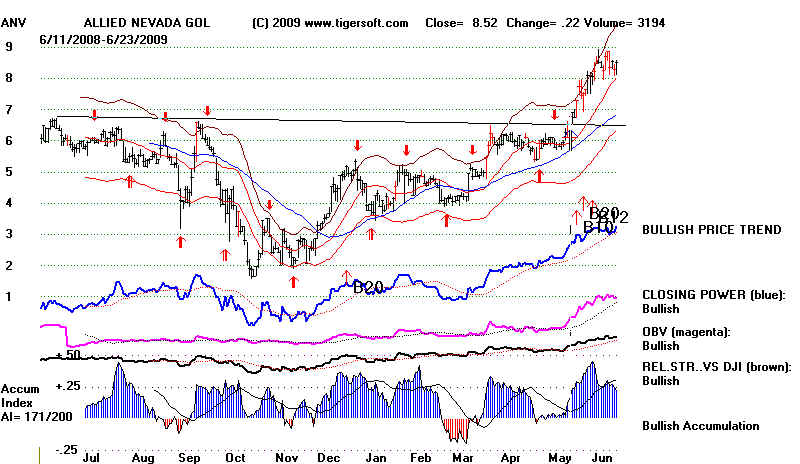
                 6/24/2009   Buy B5 Is Operative Peerless Signal

                           The hot money is still going into low-priced stocks showing bulging Accumulation and making
                new highs.  The sense that the Fed will guarantee the market against a worse decline gives lots
                of help to speculative stocks.  In many ways, this boom in low priced stocks is the equivalent of
                the Fed induced boost to technology stocks in 1999-2000 and housing stocks from 2002-2004.
               See some more examples of Explosive Super Stocks Today and read the Blog I wrote on June 6th.
               The Great 2009 Bull Market. Why Is Wall Street Concealing The Huge Surges in
               Low Priced Stocks?


    I think it is very bullish for a few more months that hot money chooses to buy low-priced
                stocks rather than drive prices down by buying  leveraged short ETFs. Say what you will about
                Goldman Sachs manipulating stock prices, even creating the booms and then the busts in a very
                big way. I would much rather have them buying than selling short. Read The Rolling Stone's
                Goldman Sachs: "Engineering Every Major Market Manipulation Since The Great Depression
"  
                Compare it with the points I have been trying to make about Goldman's sinister dominance of |
                US government economic policy making since the early 1994. 


Since 1965, the DJI has risen 61.4% of the time in the 10 trading days following
                June 25th. New investment money is most apt to come into the market the last few trading
                days of the month and for a week after the first.  With June's end comes 2nd quarter
                window-dressing.   That boost the strongest stocks.  Low priced stocks and technology are
                not the only ones favored.  Since the market turned up the six biggest gain Fidelity Sector funds
                are:    
                                        Automotive +136%
                                        Paper-Forest +67%
                                        Brokerage   +63%
                                        Financial +57%
                                        Networking Infrastructure +50%
                                        Technology   +48%

                           Half the time in the past the DJI retreats 2% to 8% before making a significant recovery
                following a Buy B5.  Waiting for the Closing Power to break its downtrendline in what you Buy may
                prove a reasonable course of action.  But it also will force traders to buy on strength.   Buying
                the strongest of the general market ETFs would not have put you in the weak DIA.    Unlike the
                DIA, the QQQQ closed above it opening.  That there were almost 3 times more stocks rising today
                than falling stock is certainly a positive sign.


The DJI was  much weaker.  Its first hour 100 point jump and later 150 point fade
                is clearly bearish action.  Will its action continue?  Who were the sellers for the last 4 hours? 
                It may well be that the DJI's weakness today owed to news which will not affect the whole
                financial world.  Much of the weakness in the DJI-30 today owed to the 6% drop in Boeing,
                which announced serious delays in its new 787 aircraft.  The second biggest loser in the DJI
                was UTX.  The Motley Fool explains: "A whole string of suppliers -- from Honeywell
                (NYSE: HON) to United Tech (NYSE: UTX) to Spirit Aerosystems (NYSE: SPR)  -- depend
                on Boeing getting its act together so that they can bring parts operations up to speed.   Meanwhile,
                customers such as Continental (NYSE: CAL) and AMR (NYSE: AMR), parent company of
                American Airlines, who have ordered large batches of 787s, need the plane desperately in order
                to cut their fuel costs.

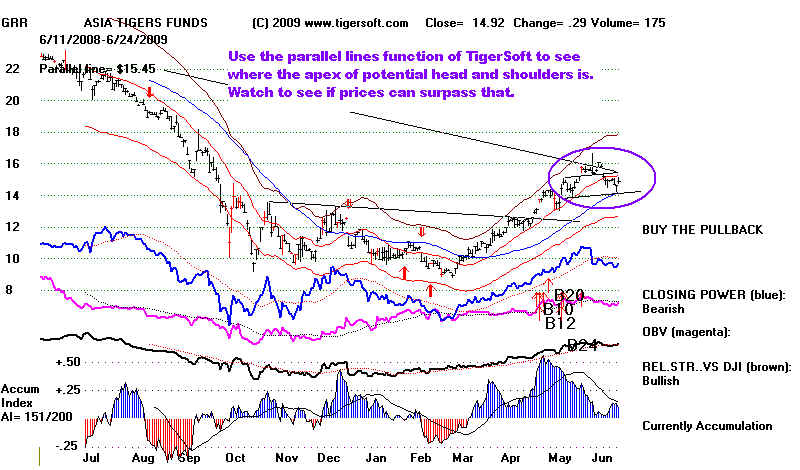
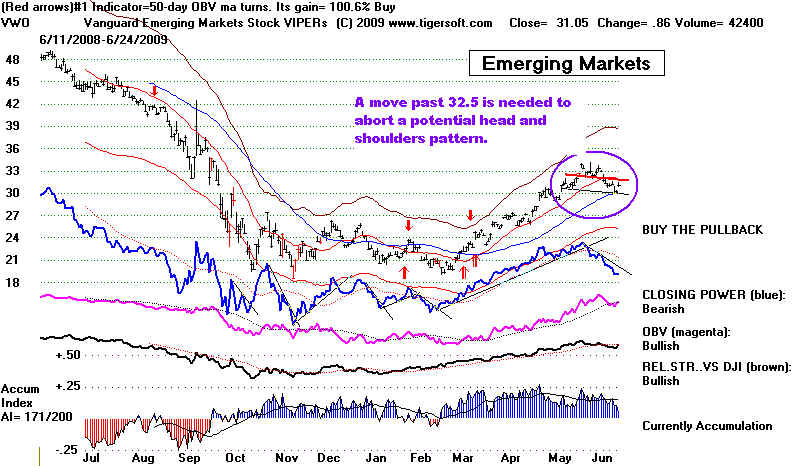
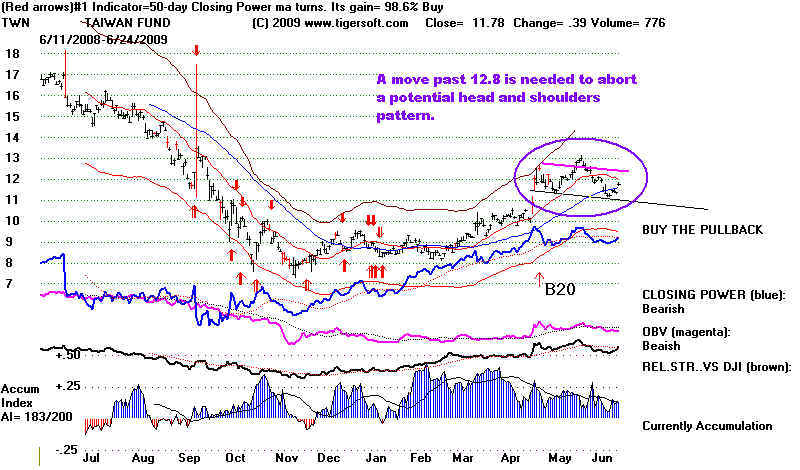
                         A market recovery is expected.  But watch to see if the leaders can get past the apex of
              . potential right shoulders in what would become bearish head and shoulders tops if their rally
               fizzles. Here are some examples of ETFs and stocks that could become bearish head and shoulders
               if prices cannot get past the lines shown.

wpe15F.jpg (76753 bytes)

VWO.BMP (1118454 bytes)
               

wpe15F.jpg (76599 bytes)
                        
GS.BMP (1123254 bytes)
=====================================================================================

            6/23/09     New Buy B5 today.

          
  Today brought a Buy B5 on the DJIA using Peerless.  With all three key
        internal strength indicators (P-, IP21, Opct) above zero and the DJI 3.2% below
        the 21-day ma, A Buy B5 is seen in these conditions as long the market has not
        shown exceptional weakness in the last 4 months.  In the 9 cases of Buy B5s since
        1942, there have no losses. The average gain was 7% at the time of the next major
        Peerless Sell when we look at the period 1942-2008. It is important not to
        use a Buy B5 within 8 weeks of a Sell S9/Sell S12 See Buy B5

              There are two more cases in the period 1928-1942.  These can be considered a test
         of the Buy B5 principle, as they were in the period used to develop the Peerless
         system.   *=Not an automatic signal using previous S9/S12 rule.
                   12/11/28 Gain= 6.9% Cl/ma=.958
                    2/15/29   Gain = 5.7%  Cl/ma=.967
                   *4/29/30  Gain = -1.2% Cl/ma=.966 Paper Loss = 278-255)/278
                                    This was after S9/S12 and completed head and shoulders pattern.

                    In 6 of the 11 earlier Buy B15s the DJI rallied without falling more than 1%.
          In one case the DJI rallied only to start falling back, so that the paper loss
          was 8% before a very good rally 6 months later.  And in 4 cases the DJI fell
          between 2% and 5% before rallying strongly.  A decline below 7900 would
          seem to be very unlikely before the next Peerless Sell.


Traders may want to see more evidence that a bottom has been put in place.
       After all, the downside volatility was terrible 12 months ago.  Summer may remind
       traders of last year!  Watching for the CLosing Power downtrends to end will help
       if you choose to take this independent approach.   But you should know that
       the Peerless signals are worth taking, year in and year out.  Here are the results
       after 9/15/2008
       
         ETF     Winning             Gains on Initial $10,000 Reinvested              Biggest
                         and                  with each reversing Peerless Buy                  Paper Loss
                      Losing                and positions closed out on next Sell.
                      Trades               $40. commission and slippage allowed
                                                for with each trade.  Trades taken
                                                at opening day following signal                
         =====    =====              ==============================      =========
         DIA         4 vs 2                +22.6%                                                           -16%
         SPY         5 vs 1                +32.0%                                                          -16.2%
         QQQQ   4 vs 2                +37.2%                                                          -11.4%
         IWM      5 vs 1                +61.9%                                                          -16.5%   


                                              GOLD STOCKS' MADE BIG MOVES UP TODAY

                          Our report on health insurance stocks must be delayed until this weekend.   Several
                           Gold stocks look attractive for purchase.  Normally, we don't put stock picks here.
                           They belong on the Tiger Elite Stock Professional Service.  But this shows what
                           we look for when Peerless gives a reversing Buy signal.  Of interest here is that
                           the Fidelity Gold Fund (FSAGX) was the biggest gainer today among 42 its 42 Select
                           Industry fund.  Readers will be intrigued by the fact that Gold Stocks were among the
                           best performers using Peerless Buys and Sells.  All markets seem integrated
                           as never before to the DJIA.  (The Biggest gainer today among foreign ETFs
                           was CEE - Central Europe.)


wpe15F.jpg (75600 bytes)


wpe160.jpg (71038 bytes)


wpe161.jpg (71498 bytes)
==================================================================================
             6/22/2009   Sell S8 Is Still Operative.
                       The DJIA has reached its lower 3.0% band.  The internal strength indicators are close to giving
             a Buy B9 for this time of the year, from April to June  But they did not. The key thresholds for cases
             where the la/ma=.97 are:
                              1) a P-Indicator at 107 or higher;
                              (2) the current Accum. Index (IP21) above .005 and
                              (3) the V-Indicator above -70.  None of these condition are true.  All need to be.  

              The DJI has also retreated to the support of its rising 50-day ma.  Starting bull markets usually
           do not drop below this ma, but do sometimes.  Should a penetration of the 50-day ma be taken
           as a reinforcing sell?   Looking back to 1915, I count 16 cases where a simple penetration of a 50-day
           ma after the first rally from a bear market led to a significant decline of at least 5% more on the
           DJI.  But in 25 cases, using a 50-day ma to buy and sell would have led to a whip-saw.  Better would
           have been to use a two day penetration of a 65-day ma.  That would have reduced the number of
           whipsaws to 17.     Where there has been shown to be extreme downside volatility. it is better to be
           occasionally whip-sawed than stuck in a serious or growing loss for 6 months.  Use a two day violation
           of the 65-day ma to avoid 1/3 of the whip-saws. 


  In our present case, we note that the 65-day ma crosses at 8250, about where the support of the lows
             of May 15 and May 22nd  are also.  In addition, we would require that the Accumulation Index to be
             negative and the Closing Power be below its falling 21-day ma..  
                                     

                   Penetrations of  the 50-day ma after a recovery rally from
                    what seems a bear market: 1915-2003


                                     Whipsaw Cases using 50-day ma =  25  
                                     Whipsaw Cases using 2-day penetration of 65-day ma =  17   
                                      Declines continued after violation of 50-day ma = 16
                                   50-day ma
                    May 1918  .   78             Whipsaw...fell to a 75.60 low two weeks after violating the ma and then rallied. t
                    Feb   1921      75              Whipsaw..fell to 73 after breaking 50-dma and rallied to 80 and then fell to 64.
                    May 1921      77              fell to 65 in August 1921 and rallied
                    Oct 1924      103             Whipsaw.. fell to 99 and then began bull market
                    Sept 1930     234            fell to 157 and began bear market rally.
                   March 1931   173           fell from 172 to 121 and began bear market rally.
                   July-August 1931  140    whip-sawed between 133 and 143.
                   August 1931   140          fell to 87 and began brief bear market rally.
                   Nov 1931       108          fell to  70 and began brief bear market rally.
                   March 1932    78           fell to 41 and then rallied strongly to 80.
                   October 1932  67          fell to 57 and then began brief bear market rally.
                   February 1933  58         fell to 50 and then began bull market
                   March 1933     58          Whipsaw.. decline to 56 and two weeks later started bull market by surpassing 50-dma.
                   January 1938   122        Whipsaw....fell to 119 and then briefly rallied above 50-dma.
                   March 1938    125         fell to 100 and then began new bull market. 
                   August 1940    122        1-day whipsawUsing 65-dma would have avoided this. 
                   August 1941    125        1-day whipsawUsing 65-dma would have avoided this.
                   Sept 1941        126       1-day whipsawUsing 65-dma would have avoided this.
                   Sept 1941        126       fell to 93 in April 1942
                   March 1947      177      fell to 164 two months later.
                   Sept. 1949        178      1-day whipsaw.  Using 65-dma would have avoided this
                   Nov   1950        235        Whipsaws for next next two month.
                   Nov   1958        541      1-day whipsawUsing 65-dma would have avoided this
                   June 1961         686        whipsawed - declined only to 680 and rallied to new high and 725
                   Sept 1961         703        whipsawed - declined only to 691 and rallied to new high and 735
                   April 1967         842      1-day whipsaw.  Rallied to 910
                   Oct   1970         754        1-day whipsaw.   Rallied to 840.  Using 65-dma would have avoided this
                    Aug 1973         892      fell to 850 and rallied
                    Sept 1973        891       whipsawed
                    Nov, 1973        919    fell to 790 in a month.
                   1973-1974 bear market  No violations of 50-day ma for 7 months.  Almost.  65-dma = better.
                   June 1978          825     whipsawed.  fell only to 807 and rallied to 900.
                   1980 mini-bear. No violations for 5 months.  whipsawed and rallied from 925 to 975.
                   1981-1982 bear market. 1000 whipsawed 1-day violation. rallied to 1075.
                   Jan 1991          2509   whipsawed fell only to 2480. and rallied strongly,
                   Aug 2001         8342   whipsawed  fell to 7290 in six weeks.
                   Jan 2002          9712   whipsawed fell only to 9630 and then rallied to 10600
                   April 2002      10136 whipsawed to 9820 and then 10300.
                   May 2002       10106  fell to 7702 in 3 months.
                   Sept 2002         8671  fell to 7286 in 2 months
                   Dec. 2002         8365  whipsawed to 9820 and then 8304 and then rallied to 8800
                   Jan    2003         9129  fell to 7552 in two months.
                   Aug 2003          9061  1-day whipsaw.  Rallied.  Using 65-dma would have avoided this (Also Sept and Nov)
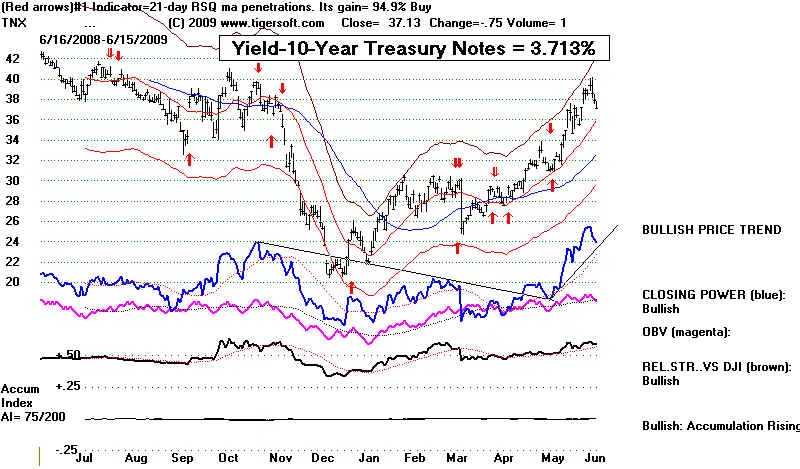
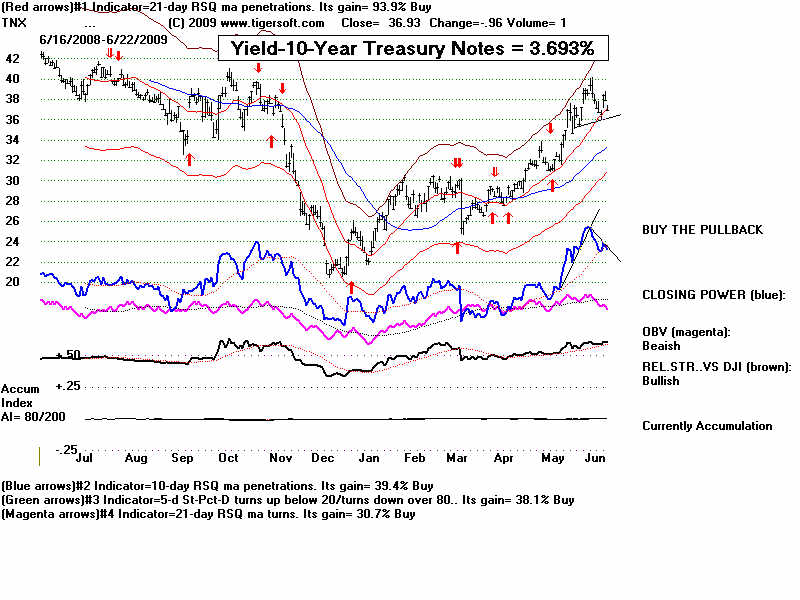
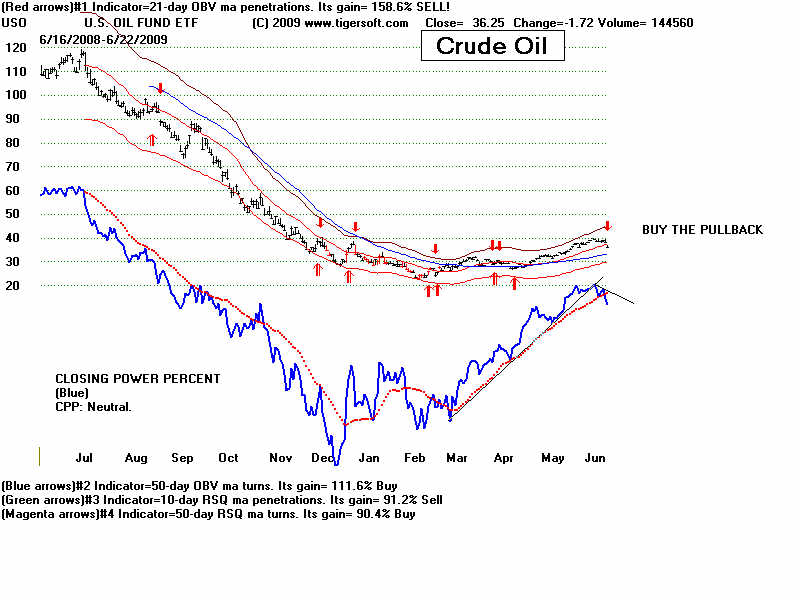
          
                                 The Dollar is hovering just above the key 70-level.  Gold and Silver's Closing Power
                            are stuck in narrowing triangles.  Interest rates look weak and Crude Oil has violated its
                            rising Closing Power.  Low-Priced Stocks broke their uptrend and their uptrending A/D Line.
                           Distribution is very apparent.  Watch to see if they can rally and avoid dropping to a 2 month low,  
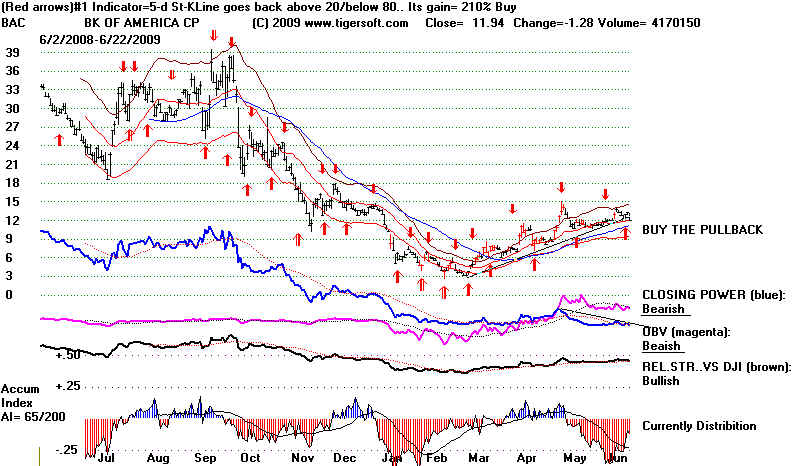
                           Bank stocks were  weak.  The Treasury Secretary says he will not let a monster zombie bank fail.
                           That could, according to Roubini, cost the US taxpayer a trillion dollars.  And exactly what,
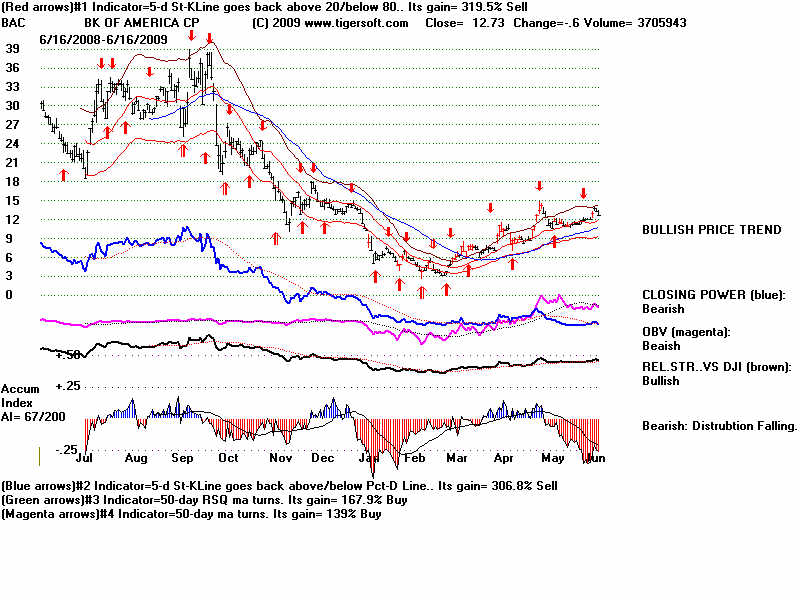
                           do we get for it?    BAC is sitting on its rising 14 week uptrend.   Distribution and insider selling
                           continue.   22 of the 125 bank stocks we follow fell more than 9%, 

                                Obama's decline in popularity is a direct threat to the big banks that are dependent
                           on their US Fed and Treasury benefactors. Rumor has it that Obama will not be able to get
                           a 75% popular public health insurance option through the plutocratic US Senate.  He has
                           raised expectations very high here.  If he dashes these hopes, his popularity will drop much
                           further. We will look at health insurance stocks tomorrow night. 

   wpe15F.jpg (76877 bytes)                                      

===================================================================================

   6/19/2009            PEERLESS Sell S8 on DJI.  But Low-Priced "Cats and Dogs"
                               are running.   Watch the NYSE A/D Line.  It is Neutral, in that
                              it is sitting on its 21-day ma.  Monday's Have Been Reliably
                               Bearish for The Last Year.                  

                         A Tale of Two Very Different Markets.

                            Many low priced stocks are still quite strong.  As a whole, they have not had much play
                            since the start of the 2003-2007 bull market.  As a result, now they are considered by
                            Wall Street pros to be oversold and cheap, as these stocks'  2009 bull market still has
                            not been announced to the public by the talking heads of CNBC AND their Closing Powers
                            are in pronounced uptrends, for the most part, showing professional buying. All this
                            suggests more upside potential, even as the DJI retreats back to its support at
                            8300 and, below that, 8000.  Low interest rates and traditional favoritism by Democrats
                            of smaller tech stocks rather than mthe mega- Blue Chips also lies behind their up-trend. 
                              See again:    June 6, 2009            The Great 2009 Bull Market.
                              Why Is Wall Street Concealing The Huge Surges in Low Priced Stocks?

                            The initial 2009 Low Priced stocks' A/D Line has been violated.  But greed,
                            being what it is, I would expect another up-wave.  How often do folks get a chance
                            to make 200%-400% in 6 weeks?  This group has started to rebound from its
                            rising 50-day ma. two days ago. I will be looking to buy more low priced stocks this week
                            on the Stocks' Hotline
.

                            
WHEN NASDAQ OUT-PERFORMS DJI FOR MORE THAN 6 Mo.
                           The NASDAQ is clearly out-performing the DJI by a wide margin,  Since January 15th,
                           the QQQQ's percent change minus the DJI's percent change over 50 days has been
                           has been positive.  The difference is now 6% over the last 50 trading days.  The PEERLESS
                           NASDAQ chart features a unique relative strength indicator, the NASDJI.  Study of all
                           4 earlier and comparable cases shows 8 months is the longest a secondary stocks rally
                           lasted; that the NASDJI always stops being positive after 7 months; Peerless called 3 of the
                           4 tops very well; and we should be watching for a double top or a break in the second
                           NYSE A/D Line uptrend.   See this study and earlier NASDAQ charts.
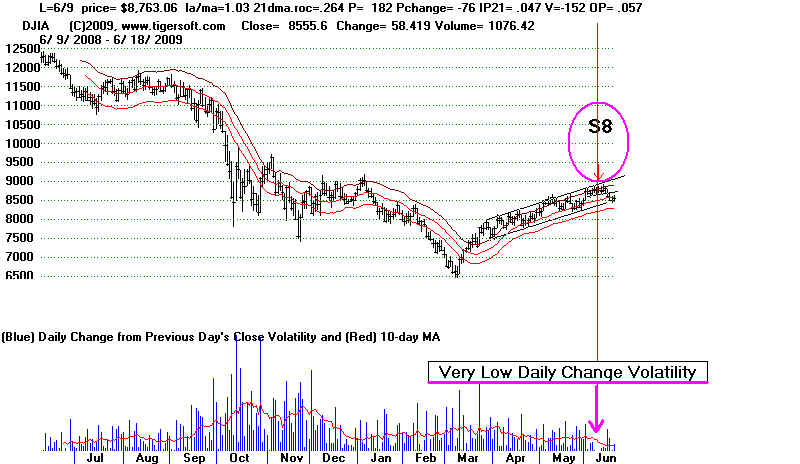
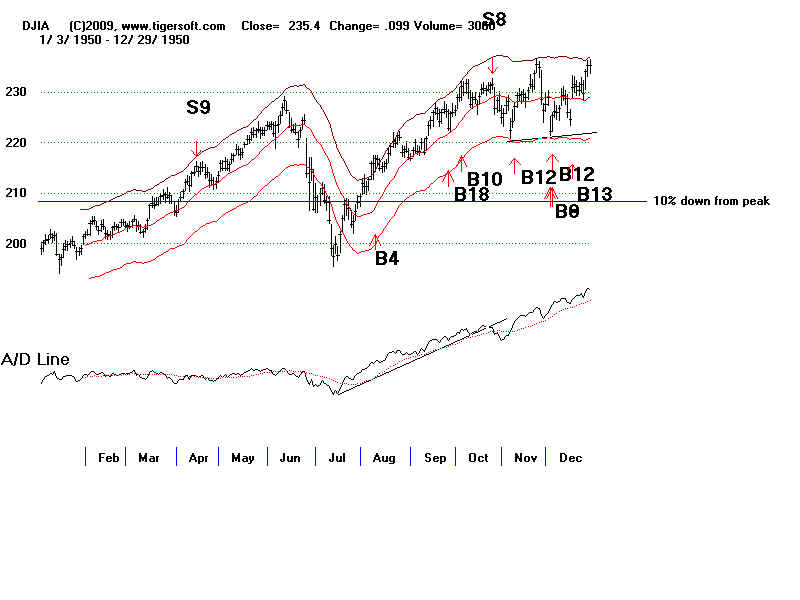
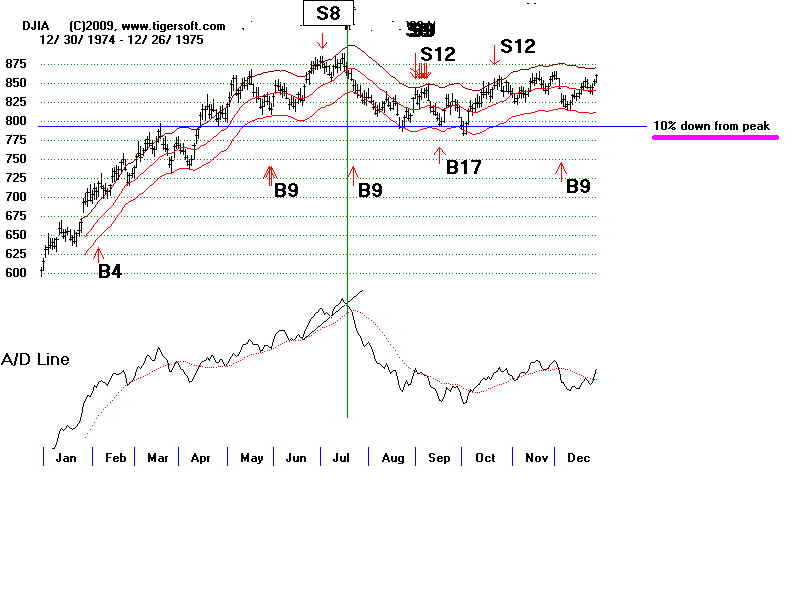
wpe15F.jpg (47961 bytes)

                           
        6/18/09    Sell S8. 

               
The Sell S8 is new.  It was introduced last week.  It is based on very low day-to-day volatility
                 for 6 consecutive days.   See details below.   The documentation appeared here in the last
                 week.   I believe it should be used as a major and reversing sell signal. especially as the NYSE
                 A/D Line uptrend has confirmed the S8.  In 7 of 10 cases, the Sell S8 led to a decline of at least
                 8% going back to 1928 when the DJI was not near an all-time high.  The parallels to August 1932
                and July 1975 seem close.  Practically, this has meant on our Stocks' Hotline, we have reduce
                by 1/2 the long positions and hedged with some short sales.  The rising 21-day ma very often
                does act as support.  And the QQQQ's internals are all considered "Bullish" as it tests that
                suppport.   The bounce we are seeing over-night will help our high accumulation longs more
                than the short positions will hurt us if there is a 1% rally in the DJI on Friday.   Monday,
                has the habit of declining.  Since Juine 2nd, 2008, the DIA (ETF for the DJIA) rose 55.7%
                of the time on Thursday and 53.8% on Friday but only 23.9% on  Monday and 47.2% on Tuesday.
                Mondays are up 34% of the time for the QQQQ.

                         Yesterday the DJI broke its 21-day ma and its previously four-times tested uptrend.  Only
                 the P-Indicator, among our key internal strength readings for it,  is still positive.  Volume
                 bearishly picked up on the small decline yesterday and fell on today's stunted rally.  The late
                sell-off today makes the bounce seem unconvincing, though breadth was positive. 
               
                        Today's rally in financials and the DJI owed to Wall Street's happiness that under
                 the Obama-Geithner Plan there will be no independent investigation of the regulatory
                 failures and banking excesses that led to the world-wide financial collapse of 2007-2009.   That
                 will all be quickly swept under the rug.  Wall Street is very pleased that it will be the Federal
                 Reserve which will police banks that are "too big to fail."  There will be no enforcement
                 of anti-trust laws against monster banks.   There will no new requirements that bankers'
                 executive compensation be limited or risk-adjusted.  De facto hedge funds like Goldman Sachs
                 will continued to get all the privileges and benefits of a real bank.  So, Goldman (+3.3),
                 Bank of America (+4.9%) and JPMorgan (+4.4%) and other non-DJIA banks are celebrating.
                 In the end, the big bankers know that the Fed is not an independent bureaucracy.   Rather,
                 apart from the Chairman who is appointed by the President, the Fed is essentially run and
                 staffed by and for bankers.  The FED did not have the courage to step on toes and regulate
                 the bankers when Geithner was the head of the NY Fed, exactly when conditions most cried out
                 for such independence and courage.  Not surprisingly, Wall Street reasons that the banks
                 will find lots of ways to keep a more powerful Fed from rocking their boat.  Political scientists
                 have often pointed out that a regulatory agency is soon captured by those it is supposed
                 to regulate.  Capturing will not be necessary under the Obama-Geithner plan.   Private
                 banks will run the show immediately.
   
                        But the big banks are not out of the woods, yet.  They may still run short of funds if
                 the economy and housing prices continue to fall.  It will be much harder politically for them to get
                 more TARP money,  though Geithner says he is the giver that has the power to keep on giving. 
                 Showing his loyalty to banks is undiminished, he insists he needs to no new Congressional
                 authority.   So, Obama is now perceived by them as the banks' protector.  And 57% of Americans
                 still approve of his actions as President.  As he strives straddles to straddle an increasingly
                 polarized electorate, his approval ratings will weaken and Congress will become more resistant
                 to his pro-bank policies.

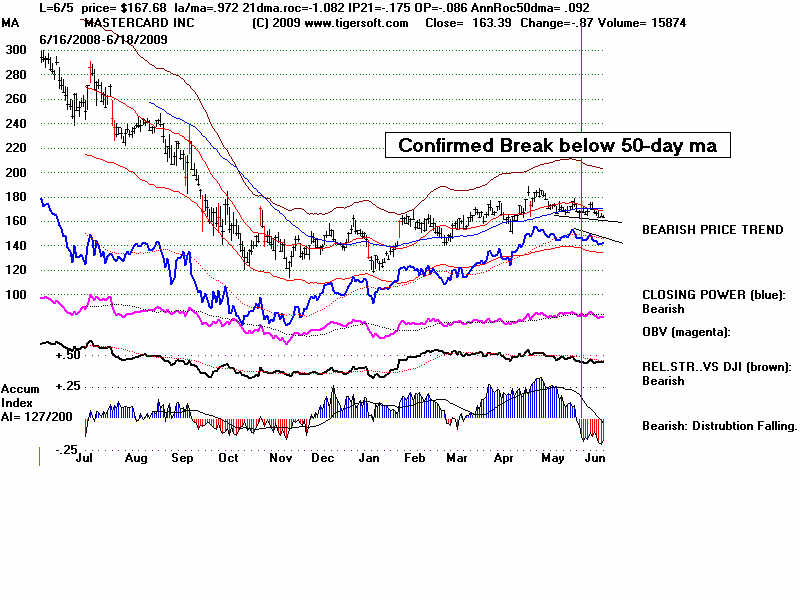
                      The central problem, of course, is that many, probably most, American consumers are 
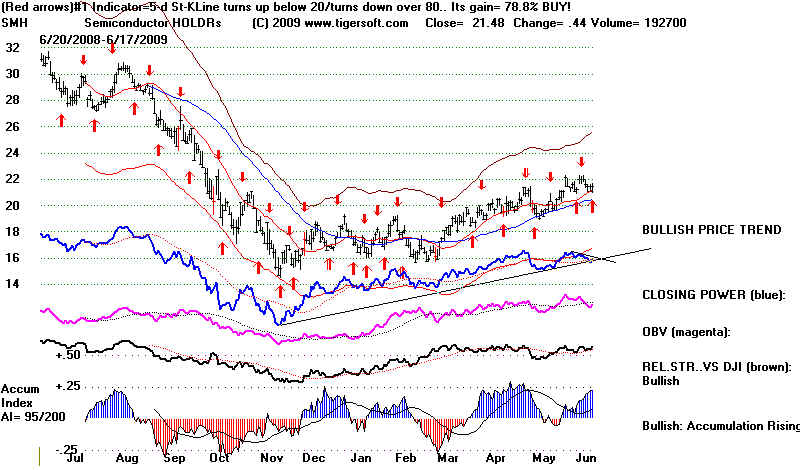
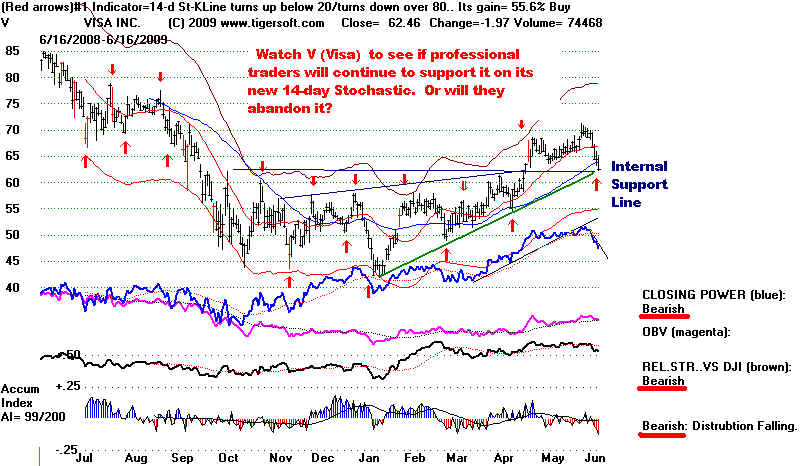
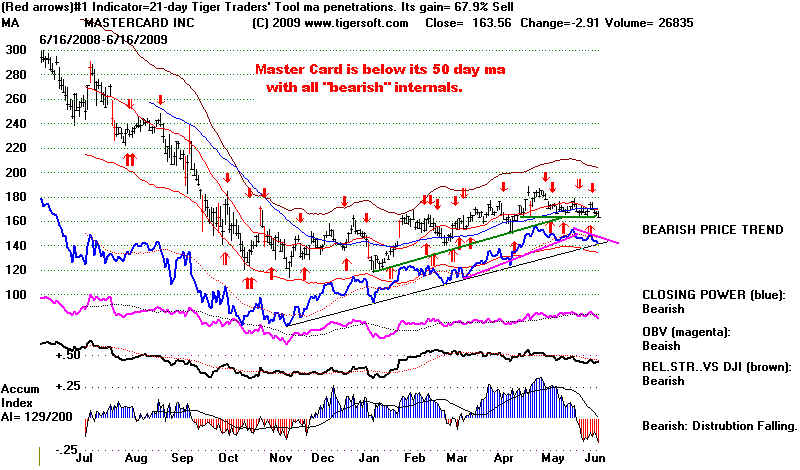
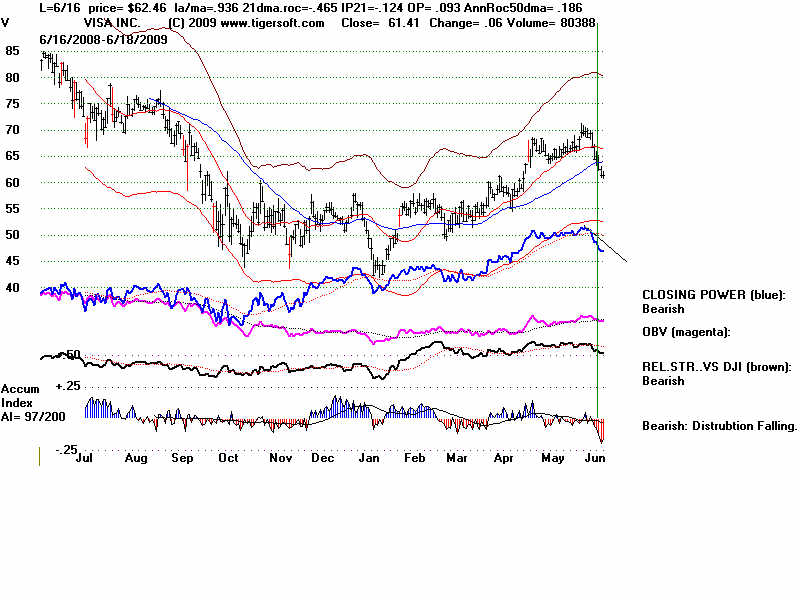
                 nearly tapped out.  The charts of Master Card and Visa may reflect this by their confirmed breaks
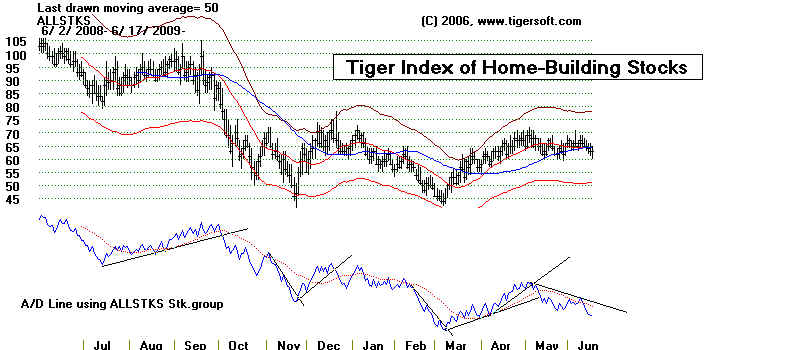
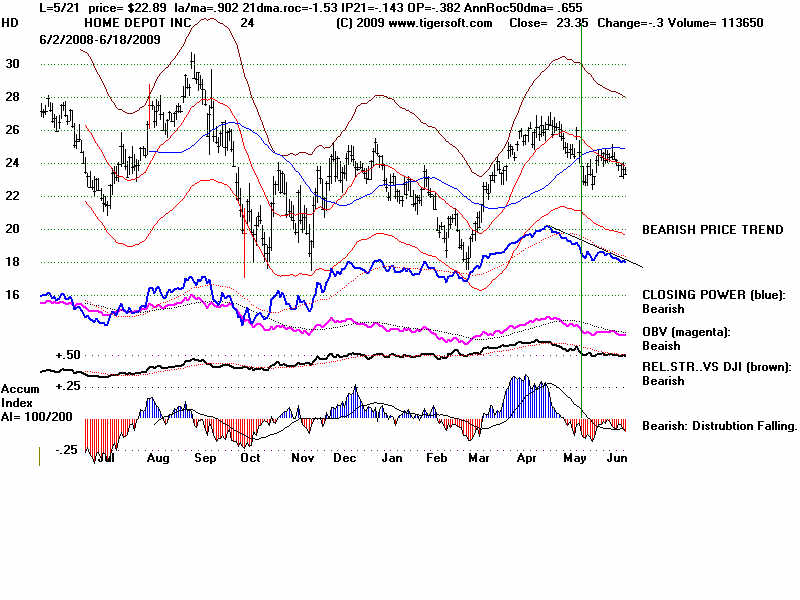
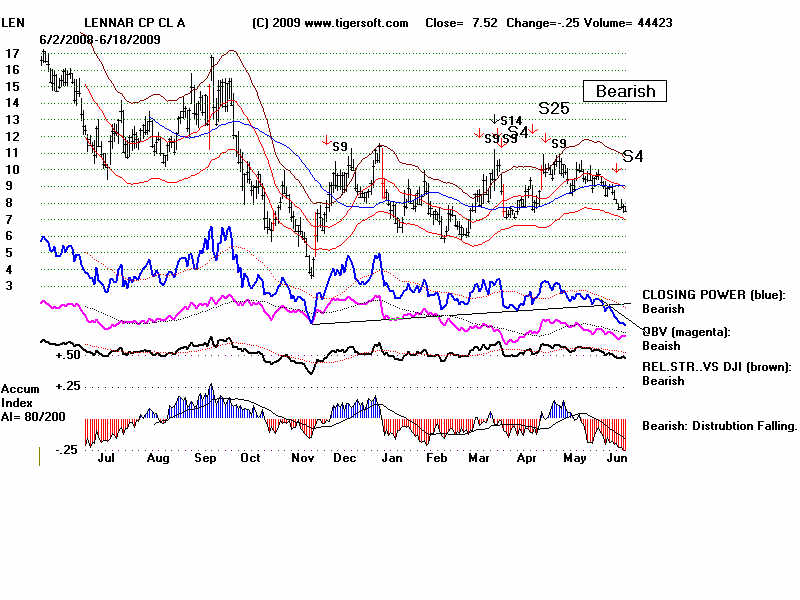
                 below their 50-day ma.  Housing stocks are turning weak again in the same way.
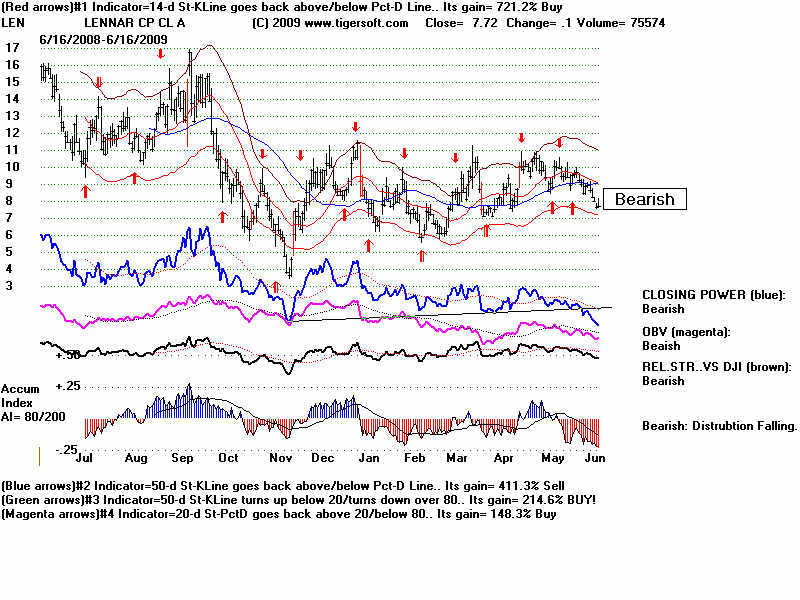
   See HD LEN.


                                                                     DJIA's SELL S8

wpe160.jpg (63429 bytes)

        
            6/17/2009   The DJIA remains on a Sell S8.  The lower band would seem to be the
                  next target, although a recovery back above the 21-day ma is possible.  The most likely
                  scenario would be for the DJI to test 7900-8000.  There may emerge two markets from
                  here.   Bank stocks and home-building stocks lead the market down while tech stocks and
                  the NASDAQ-100 (QQQQ) are much stronger than the DJIA/  They are trying to bring
                  about a rally from the rising 21-day ma.  The QQQQ chart above shows this.   Unfortunately,
                  three groups that had been leading the rally seem to be stalling out.  The uptrends in the
                  A/D Lines for (1) All Foreign ETFS, (2) Chinese Stocks and (3) Low-Priced Stocks have
                  each been bearishly broken.  The global market is now so integrated that weakness in
                  the US is instantly communicated elsewhere. This was the conclusion I reached when studying
                  how well Peerless Buys and Sells worked not just in the US, but everywhere on the planet.

                  There are many High Tech ETFs.   Like the QQQQ, they all seem to have a CLosing Power
                  which has fallen to a point where further weakness would break CP uptrends of four or more
                  months.   Further below are the charts of three.


Watch IWM - just below.  It  shows a potentially very bearish "Hands above the
                  Head" pattern.  A decline by it below 100 would break the patterns neckline.  This is a pattern
                  I have only seen in very bearish markets.  Another warning, our index of 300+ low priced
                  stocks shows a bearish break in its A/D Line uptrend.  Given the volatility of these stocks,
                  this should cause to become guarded in this area.  I warned that the break in the NYSE A/D Line
                  would have this effect on secondary stocks.

                                     MID-CAPS' Hands Above The Head Pattern.

wpe168.jpg (75119 bytes)

                                                        
Merrill Lynch Internet HOLDR
s (HHH)                   wpe163.jpg (73431 bytes)

                              
      iShares Goldman Sachs Technology Index Fund
(IGM)
wpe164.jpg (72011 bytes)

                                   
   Merrill Lynch Semiconductor HOLDRs (
SMH)
wpe165.jpg (73672 bytes)


  Bank and housing stocks are weakening significantly.  The A/D (Advances-Declines) Line
                         of these groups are in downtrends.  Watch to see if financial stocks show an ability to
                         rebound from its rising 50-day ma. 


Tiger Index of Financial Stocks
  wpe166.jpg (47746 bytes)

                                                 
Tiger Index of Home-Building Stocks
wpe167.jpg (48708 bytes)

===================================================================================


                6/16/2009

                The Sell S8 still operates.  The odds favor a test by the DJI of its lower 3.5% band near 8300.
                A further decline to 7900 of 10% from its highs is more likely looking back at the closest
                historical parallels.  Details of new financial regulations will have to be sifted through by
                Wall Street, even though Obama's Wall Street friendly minions have set out the details.
                Congressional reaction will probably produce some populist posturing that may unsettle
                financial stocks.  New weakness is apparent there now.  See AXP, BAC, JPM, TRV.
                Most unsettling, because of what it says about consumer spending, are the confirmed breaks by
                VISA and MASTER CARD of their 50-day ma.  The banks have received most of the
                government's bailouts.  They are making less loans than in the last reported month

                                             VISA HAS BEEN CONTROLLED BY PROFESSIONALS
                                            USING A 14-Day STOCHASTIC.  WITH A NEW BUY
                                                  WILL IT CONTINUE TO BE SUPPORTED?
wpe15F.jpg (77714 bytes)


MASTER CARD - AT KEY SUPPORT
wpe160.jpg (78106 bytes)


  A Re-Test of the Lows?

                The liberal economist JM Keynes would be very disappointed in the meager size of Obama's
                $85 billion public works program in the US and his decision to waste a trillion on banks and throw
                more than $150 billion more down civil warring rat-holes half way around the world.  A test
                of the DJI-6500 may yet develop if I'm right that Obama's stimulus package does not begin to
                correct the vast need for decent-paying American jobs and, worse, that the rally is artificial,
                having been fueled by TARP payments turned into program trading by banks like Goldman Sachs,
                which is really a government subsidized hedge fund, and not a bank, anyway.  When the banks
                discover that there is now no one to sell their stock to, prices may start to fall sharply.   The
                memory of the bear market is apt to prompt traders not to hold their shares very tightly if
                technical supports like the 50-day ma give way.   

                The FED is afraid of Gold surpassing $1000/oz.  That would signify a very weak dollar
                that is probably about to get a lot weaker very quickly.  Expect the central bank to try
                to make it fall back by talking about how inflation is not a problem.  But pay more attention
                to Gold and the Dollar than their words.  Every central banker and politician knows that
                they must say they favor a "strong dollar".     From the Fed's viewpoint, and Bernanke
                in particular, the moment of truth is getting closer where they must choose much higher
                unemployment and a deepening recession or a much weaker Dollar and significantly higher
                fuel prices because of the weak Dollar. 

                                                                    5-Year Chart of Gold  
wpe15F.jpg (55247 bytes)          

              
  The DJIA has slightly penetrated its 21-day ma.  A rebound from here cannot be ruled out.
                But the Sell S8 is much more likely to bring a further decline when the DJI is not near an
                all-time high and is instead rebounding off a bear market low.   Note the break in the NYSE
                A/D line and the poor breadth today.  In addition, the DIA's Closing Power is falling, as is SPY's.  
                (See these two charts just below).  The QQQQ has broken its steep Closing Power uptrend.  
                It is testing its less steep uptrend.  It seems bound to test its rising 50-day ma.  

                There are a growing number of stocks that look bearish.   Their breaking the 50-day ma with
                a negative Accumulation Index and falling Closing Power are reliable signs of a decline.
                Only about 15% of stocks,  I reckon now, show this.  Here are some cases to study, if you
                want to see what TigerSoft considers bearish.

                                             Vulnerable Looking Stocks


                BAC - heavy distribution and falling Closing Power.
               BDK - Completed continuation head and shoulders pattern.
                C - Bleak internals.  Only Obama bailouts will save it.   Political opposition is growing to this.
                Watch COF- Capital One - to see if it can stay above its blue 50-da ma with such weak internals.
                Home Builder CTX has a bearish confirmed 50-day ma penetration.

                DD in DJIA shows a bearish head and shoulders pattern with distribution on right shoulder.
                John Deere shows a reliably bearish hands above the head pattern.
                Watch FCX to see if metals prices are going to drop as world demand slows up.
                Federal Express - confirmed breakdown below 50-day ma.
                Why is Public buying GE at opening so aggressively and professionals selling even more so?

                JP Morgan -confirmed breakdown.
                Home-builder KBH shows a bearish head and shoulders pattern and confirmed breakdown.
                Home-builder LEN shows a bearish confirmed breakdown.
                Conglomerate TXT shows a bearish confirmed breakdown.
                United Parcel Service is being hit by a double whammy: falling consumer demand and rising oil prices.
               

                In this environment, we should wait for a new Peerless Buy signal.   Seasonality remains
                bearish.   Since 1965, the DJI has risen only 34.1% of the time over the week following June 16th
                and 40.9% of the time over the next two weeks.


wpe164.jpg (67386 bytes)


6/15/2009   

           
          The V-Indicator has dropped below its declining 21-day ma in the vicinity of a falling
                200-day ma.  The V-Indicator's 21-day ma is also negative.  That does not look good.     A decline
                by the DJI to 8300 and lower band are likely to give new Buys as long as the Accumulation Index
                and P-Indicator remain positive. The P-Indicator stands at +229, which gives it some cushion to
                stay positive if the DJI should fall another 3.5% to the lower band now at 8275 and rising 20 points
                a day.  The Accumulation Index is at .056.  This also provides a cushion for the market on a
                further decline.  The DJI now stands .5% above its rising 21-day ma 40 points below today's close.

                            Will the rising 21-day ma be violated?  Initially I thought that we might get some idea of
                what to expect here by looking all the cases where there is a test of that ma within 2 months
                of a B18, which is what we had here 3 weeks ago.  That reflects the very good breadth.  I estimate
                that declines more than a two percent below the 21-day ma take place in the two months after
                a Buy B18 only in about 25% of all cases.  In about 14% of the cases, the DJI falls below the
                lower 3.5% band within 3 months of a Buy B18.  Of course, we have a unique market. 
                Breadth has been unusually bullish.  But the depth of the bear market has badly shaken confidence. 
                To start a real bull market, we will probably need a re-test some level nearer 7500 or even 6500.
                Today, there was a clear break in the NYSE A/D Line and that has in the past reliably confirmed
                 an Sell S8.


Further analysis shows that the Sell S8 may cancel the bullishness of the previous B18.
                When there was also a Sell S8, a decline to at least the the lower.band always occurred, despite
                the B18.   Look at the only cases, 3 instances,  where there was a  B18 AND a Sell S8.  Interestingly,
                in two cases the DJI declined 10% and in one cases the DJI fell to the lower band twice before
               starting much of a rally.  A 10% decline here would take the DJI to 7900.


                                            =============== 1946 =====================

DATA4546.BMP (1120854 bytes)

                                            ================ 1950 ========================
DATA50.BMP (960054 bytes)

                                      ================ 1975 ========================
DATA75.BMP (1440054 bytes)


  6/14/2009 
         
    Watch Breadth This Week Closely.  Very Weak Breadth  Would Confirm The New Sell S8.

           Peerless Still Operates on a Buy, unless you wish to use the tentative Sell S8 discussed last week.
        In 7 of 10 cases the DJI fell at least 9% after this signal.  So, it is important.  It is confirmed by weak
        breadth (NYSE advances - declines).  The new signal needs a real-time test to be adopted.  Since the
        NYSE A/D Line still is in a steep rising trend, it's probably best to adopt a wait and see attitude. 
        But broad weakness all day Monday will break the A/D Line uptrend.  That would make the S8
        look like it did in 1932, 1933, 1935, 1939 and 1975.   

                So, Watch the NYSE A/D values this week.   The NYSE A/D line is now sitting on its well-tested
        uptrendline.   Poor breadth early next week would break that uptrend-line.  The effect of such an A/D Line
        uptrend-break is usually significantly bearish for a few weeks for most stocks.   In 1932, 1933, 1939
        and 1975, trend-breaks in it followed very soon after this new Sell S8.  As I write, this the futures are
        down nearly 100.  This is not a good start for the new week.  But more important, is what happens after
        the opening in New York.  A good market recovery will be constructive.  But additional weakness all
        day long after such a weak opening will probably mark the beginning of a decline back the lower 3.5%
        band on the DJI, near 8300.  If the P-Indicator stays positive, a very strong recovery will be expected. 
        Last week we reduced our long holding almost by 1/2 on the Stocks' Hotline and will delay doing new
        buying tomorrow.  Gold's head and shoulders top forces us to sell some gold and silver plays.

               
The market will not stay this dull much longer.  The steep Closing Power uptrend lines for the DJI
        and SP-500 have been broken.  Now the more important, somewhat more gradual and well-tested
        uptrend lines are being challenged.    If the test of this support line is successful, 9000 is likely.  If it
        is broken, 8300 will be good support.  DJI-9000 was the key barrier that had to be breached at the start of
        the 2003-2007 bull market.  That was the basis for my thinking this move would challenge that level.          

                While more and more of the rally's leaders,  like GS and AMZN, have reached points of expected
        resistance, this has been a very broad advance.   That means the market is not so reliant upon any one
        sector to hold it up.  The Fidelity Sector fund strength/weakness study shows all but one of the 42
        Fidelity Sector funds is rising for the last 21 trading days (a month).
CURRENT Sector Strength/Weakness
        Analysis. 
That the QQQQ's Relative Strength Quotient (RSQ) is still rated as "Bullish" - because
        the QQQQ/DJI Line is still above its rising 21-day ma - shows the market is very strong.  The
        QQQQ's RSQ now compares favorably to the start of the 2003 bull market.

             Volume and volatility are now very low.  Low volume rallies suggest short covering and/or
       market manipulation.  It generally takes higher volume and new buying power to keep stock prices
       from falling as some investors simply must sell shares to raise money.  The exception to this is
       when dull markets won't give short sellers a chance to cover their bets on the downside, and prices
       edge higher and higher and finally take-off.    This explains why lulls in volume and volatility usually
       are bullish when the market is at an all-time high, and each new high breakout forces some shorts to cover. 
       That is not true now, of course.  The historical statistics are distinctly bearish for such volume
       and volatility lulls when the DJI was not at an all-time high.  Taking some profits where there are
       bearish divergences seems reasonable and waiting to see which way the market springs seems
       best for those trading the market ETFs.


Why the lull? What is the market waiting for?  Earnings reports?  Better economic news?   The
        SEC's new rules on short selling?  Obama's new plans to regulate banks and credit.  The Fed's real
        intentions regarding the weak Dollar?   Something that will bring the public into the market, so that
        professional  trading desks have someone to sell to? 

           The seasonality is bearish in years after a Presidential Election until the end of June.  And for
       all years since 1965, the odds of the DJI rallying were only 38.6%.  The DJI fell on average
       -.8% two weeks after June 14th.  See the new
CURRENT Seasonality page for Hotline subscribers.


                       NEW SELL SIGNAL - Sell "S8" (That is its tentative name for now.)

                    It is based on unusually low volatility after a 3-month rally of more than 10%
              by the DJIA, provided that index is not in all-time high territory where the path of least
              resistance is up.  The rate of daily change in closing prices must have stayed under
              its 10-day ma for 6 straight days.  This signal seems to work particularly well after
              there has been a substantial jump up from a bear market low.

                 There have been 11 such earlier cases when the DJI was not in all-time high territory.
              In 8 cases the DJI fell more than 8%. 
There were only 2 cases where the paper loss
              was this big.

                  Here are the cases since 1928 when the DJI was not in all-time high territory.

     DATE     What DJI did subsequently
                     Key values: last/21-dma,  OBVPct.,  IP21 (Current AI), annualized rate of change of 21-dma

    (1)    8/30/1932 DJI moved up for a week from 74.30 to 80 and then fell to 58 in 2 months
                   
Key values: la/ma = 1.098  OBVPct= .246    ip21=.01            roc=3.46
                     This was on a  recovery from a bear market low.
                    8% paper loss before a profit. 
                     More than 20% decline.

    (2)     9/29/1932 DJI fell from 71.50 to 59 in 2 weeks.
                   
Key values: la/ma =.988     OBVPct=-.107    ip21=-.069        roc=.46
                  This was just after a recovery from a bear market low.
                   More than 15% decline.

    (3)      10/31/1932  DJI fell from 61.90 to 58 in a week, rallied to 67 and then fell steadily to 50
                                      4 months later..

                     
Key values: la/ma =. .97  OBVPct=  -.087    ip21=-.139    roc=1.779
                  This was just after a recovery from a bear market low.
                  8
% paper loss before a big profit.
                  More than an 18% decline.

    (4)     7/14/1933 DJI rose from 105 to 109 in 3 days and then fell to 89 a week later.
                    
Key values: la/ma = 1.059  OBVPct= .17    ip21=-.103        roc=1.316
                  This was on a  recovery from a bear market low.
                  4% paper loss before a profit.
                  More than 15% decline.

   (5)     9/17/1935  DJI fell from 133.10 to 128 in a week and two mo later hit 148.
                   
Key values: la/ma =  1.027 OBVPct= .316    ip21=.04                roc=506
                    Only 3% profit before rally.

   (6)      3/25/1936 DJI rose from 157.90 to 162 in a week and fell, a month later hit to 143
                  
Key values: la/ma =  1.017 OBVPct= .221     ip21=.016           roc=.546|
                    3% paper loss before a profit.
                    More than 8% decline.

   (7)       7/31/1939 DJI fell from 143.30 to 131 in  3 weeks and then rallied to 156 2 weeks later.
                 
Key values: la/ma = 1.03   OBVPct=  .328    ip21 =.099             roc=1.03
                            This was on a recovery from a bear market low.
                   More than 8% decline.

   (8)      9/27/1939  DJI from 150 went sidewise for 7 months and then fell to 114.    
                   
Key values:     la/ma = 1.028  OBVPct= .27   ip21=.068         roc=1.479
                   More than 22% decline.

    (9)     2/25/1946  DJI fell from 206.60 to 186 in 2 weeks and 5 weeks after that. rose to 208
                  
Key values:     la/ma = 1.024 OBVPct= .43    ip21=.268         roc=.877
                   More than 9% decline.

   (10)    10/25/1950
DJI fell from 231.50 to LB at 221 in 8 trading days and two weeks later hit 236.
                 
Key values:    la/ma =  1.011 OBVPct=  .286  ip21=.049         roc=.281
                   More than 5% decline.

    (11)    7/1/1975 DJI fell from 877.42 to 784, 10 weeks later.
                 
Key values:     la/ma = 1.036  OBVPct=  .01   ip21=.04           roc=.434
                  This marked the recovery high after the 73-74 bear market for 6 months.
                  More than  9% decline.

   (12)    6/9/2009
                
Key values:    la/ma=1.03      OBVpct= .059     ip21=.047       roc=.264

       Key Charts:

                      DIA - Both Opening and Closing Power Rising.

wpe160.jpg (58581 bytes)

                    QQQQ -  Steep Closing Power uptrend violation.
                    Bullish Internals.

QQQQ.BMP (1116054 bytes)


             SPY - Closing Power Uptrend Marginal Violation.
                          OBV and Acccumulation are uptrending.
SPY.BMP (1440054 bytes)
                      
                                     CRUDE OIL - ALL BULLISH INTERNALS
wpe161.jpg (73717 bytes)


                                              GLD - Inflation is on Its Heels
                See - http://finance.yahoo.com/news/Stocks-tumble-as-stronger-apf-15531082.html?sec=topStories&pos=1&asset=&ccode=

GLD.BMP (1120854 bytes)

                                               Dollar Is Being Support at 78.5
wpe1D26.jpg (65815 bytes)

                                          Interest rates are retreating.
wpe162.jpg (70167 bytes)

                                     Charts with Technical Lessons
  
         
      Head and shoulders patterns are difficult to automatically scan for.
  But when bearish gold and silver show head and shoulders develop,
  look for gold and silver stocks showing the same. They have more
  volatility and can make good short sales.

SSRI.BMP (1440054 bytes)

  SPIL - Bearish Hands above the Head Pattern
  Stock closes below 50-day ma with negative AI and falling Closing Power.

   Note - Very bullish when prices surpass a rising 50-day ma
  with current AI >.25

wpe163.jpg (74173 bytes)
                SPIL -  Bearish = Prices fail to surpass 200-day ma.
          Bearish = Stock closes below 50-day ma with negative AI
          and falling Closing Power.

wpe164.jpg (63178 bytes)