www.tigersoftware.com/1-HOT-07009/index.htm
Friday 7/31/2009
IMPORTANT:
The Address for this Hotline will change on Monday - August 3rd
Order form to Renew On-Line, "Nightly Peerless/TigerSoft Hotline " ($298)
. Previous Hotlines: 6/14/2009-6/30/2009
5/1/2009 - 6/11/2009
3/30/2009-4/30/2009
(C) 2009, William Schmidt, Ph.D.

Important Notice: Redistribution of any text or concepts here is a violation of copyright laws. This is valuable intellectual property.
All violators will be subject to legal action. Please visit www.tigersoft.com Goggle TigerSoft and a technical subject, to get
additional examples and a further discussion of concepts and terms used here. See also our Books for sale. .
Overnight Market Action: Bloomberg Futures around the world before the US Markets open.
Color Codes blue or green = new to this night's report or considered more important
black = from a previous night's report
Introduction. When reading this HOTLINE, please note the dates that show when the comments in a paragraph or set
materials were written. Always read the first comments at the top with the most recent date. They show the Buy or Sell
which now applies. Older comments are there entirely for background and to teach TigerSoft and Peerless technical analysis.
On a Peerless graph, only the new and latest signal applies. Again, always note the date at the top of a set of paragraphs.
INTRODUCTION.
Readers, our assessment of the stock market's future trends is based on the following.
Google TigerSoft and these subjects to get additional links, besides those shown below.
1) Peerless automatic Buys and Sells for intermediate-term trend.
Details of Peerless Signals are given here as they occur.
2) Price charts and moving averages.
3) Closing Power and Closing Power Percent for 2-4 week trends.
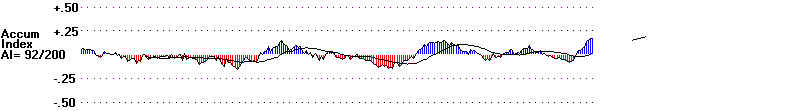
4) Accumulation Index to measure support on weakness or distribution on strength.
5) Volume (and OBV to a small extent).
6) Breadth: Advances minus Declines. P-Indicator, A/D Line
7) Stochastics when they are the best trading system. See QQQQ in 2003.
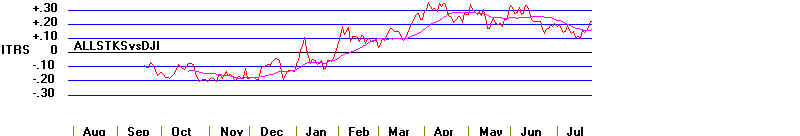
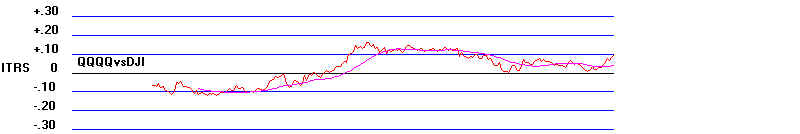
8) Relative Strength - QQQQ/DJI rising is bullish. Compare QQQQ Chart now, on this page, with 2003..
9) CURRENT Seasonality Updated 7/29
10.) CURRENT Sector Strength/Weakness Analysis. Updated 7/29
11) CURRENT NYSE/NASDAQ New Highs and New Lows. Interesting NH/NL Stocks. Updated 7/29
12) News and Political Economy. See Tiger Blog
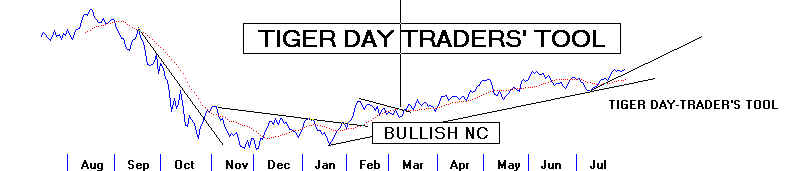
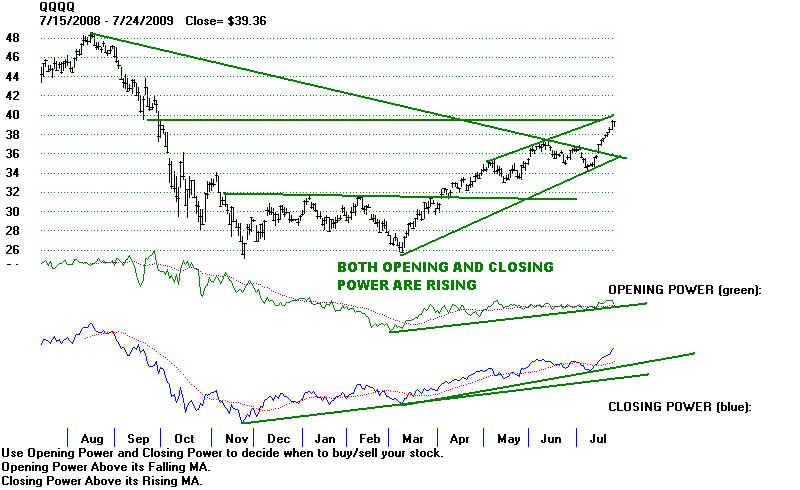
See also Predicting The QQQQ Using TigerSoft's Opening Power,
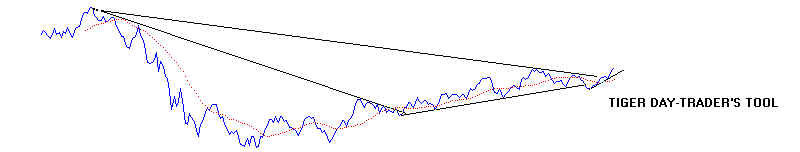
Closing Power and Tiger's Day Traders' Tool: 1999-2008
7/31/2009
5-day chart
Click on links to see charts
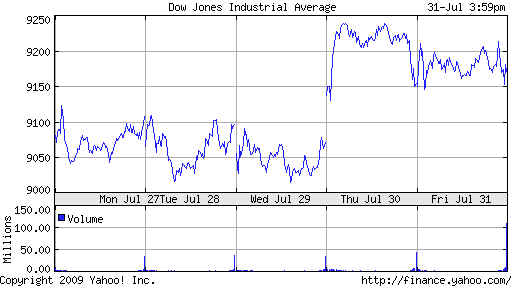
DJI 9172 +.19% DIA 91.67 +.27% SPY 98.81 +0.14%
NASDAQ 1978.5 -0.29% QQQQ 39.45 +.30% IWM 55.57 -0.41%
USO 36.81 +3.72% Dollar GLD 93.35 +1.89% SLV 13.70 +3.40%
Highest Priced DJI-30 Stocks IBM 117.93 +.07 XOM 70.39 -.33 CVX 69.47 +1.77
Investment Bank Stocks GS 163.30 +0.88 JPM 38.65 +.18 MS 28.50 +0.14
Other leading stocks: GOOG 443.05 -2.59 AAPL 163.39 +0.60 AMZN 85.76 -.33
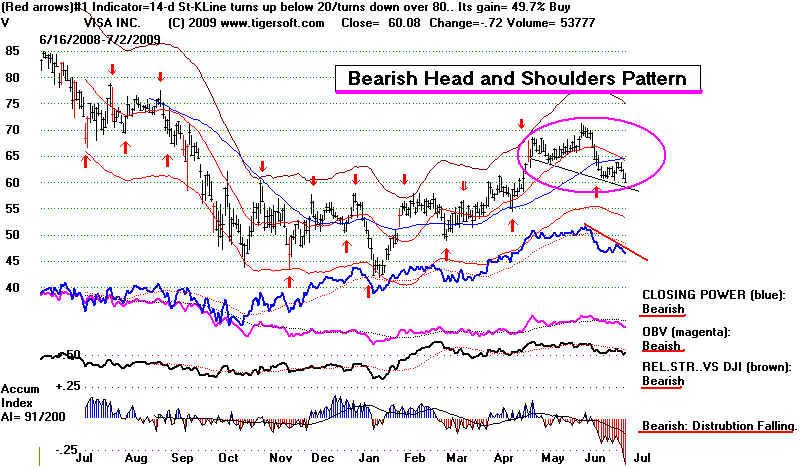
Also F 8.00 +0.61 VISA 65.46 -1.75 QCOM 46.21 -0.31 SNE (Sony) 27.96 +0.68
7/31/2009 Peerless Is Still Operating under a Buy B12.
Without a sell signal from Peerless and clear breaks in the Closing Power uptrend-lines
of the key ETFs, I think prices have to be given more chance to rise. Quite a few
low-priced NASDAQ stocks are very over-bought, having made several lurches upwards
more than 20% over their 50-day ma. So, a rotation back into "safer" blue chips and
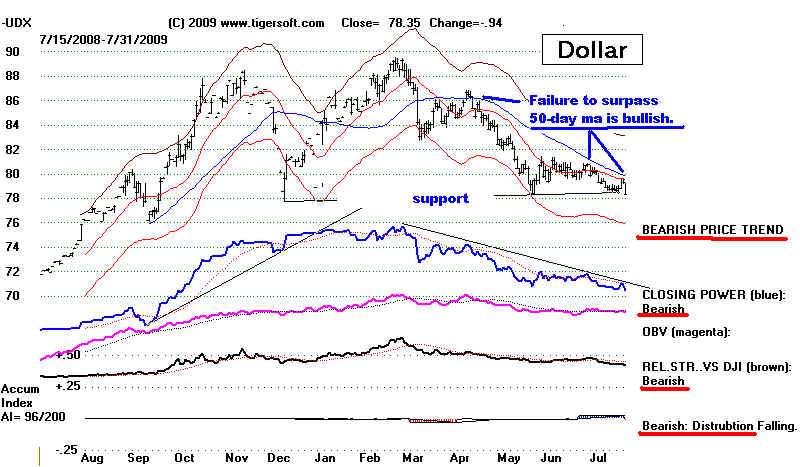
gold stocks seems likely. Watch the US Dollar's action tomorrow. It is again below 79.
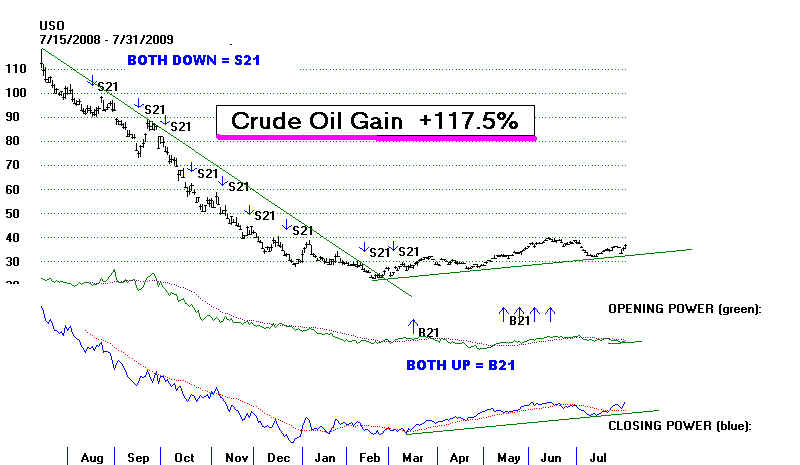
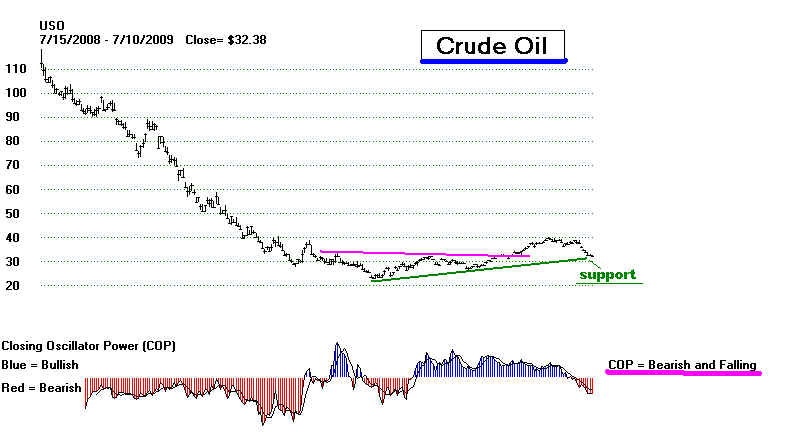
Crude Oil is moving up again, both on an Opening basis and after the Opening and to the CLose.
This condition we describe as "BOTHUP". New software showing Buy signals when this
condition occurs works well in very volatile markets. With Crude Oil, the gain has been
very high.
If the Dollar breaks down, it will eventually put pressure on the Fed and Geithner to move
to raise interest rates, to discourage more stimulus packages and raise taxes.
 .
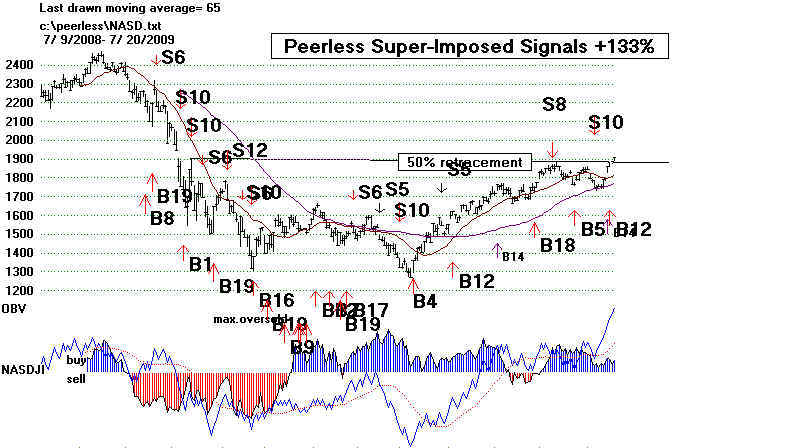
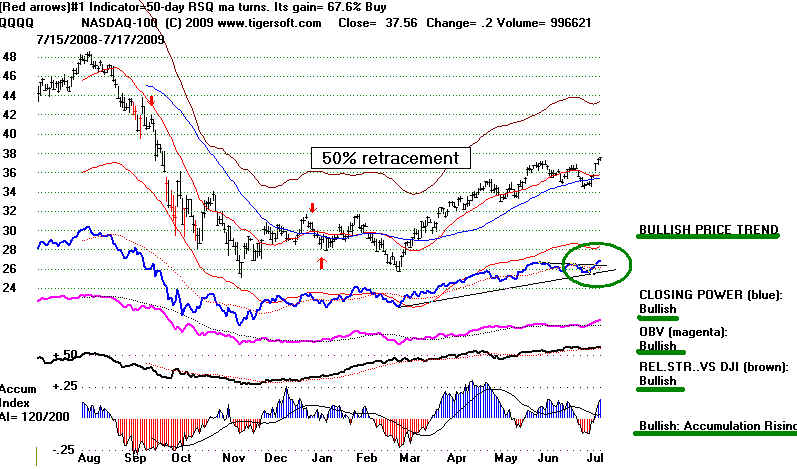
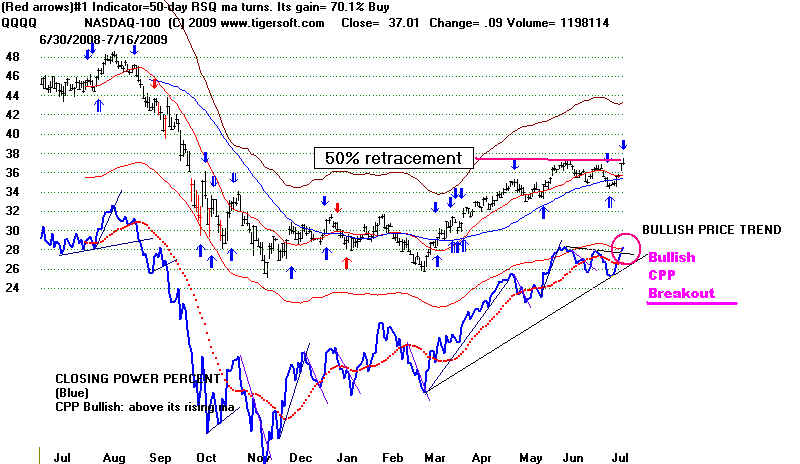
. QQQQ Has Achieved A True 50% Recovery.
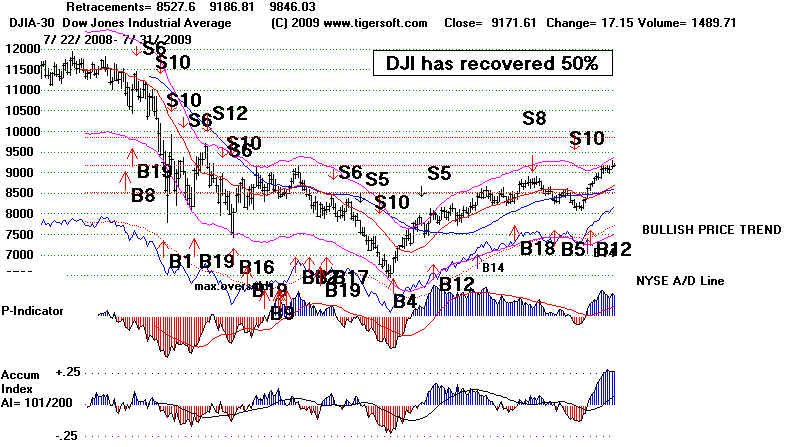
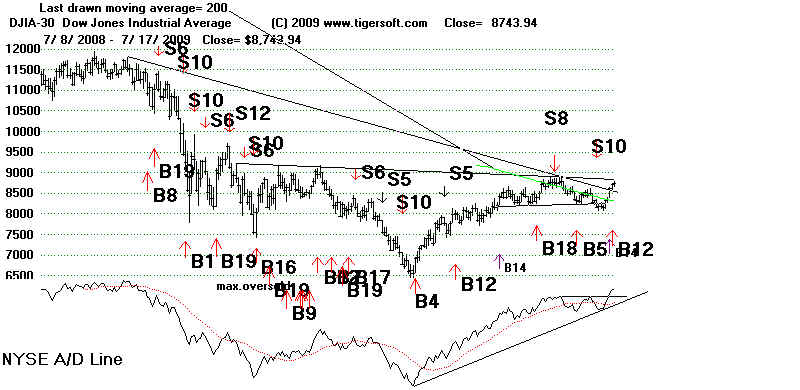
DJI has now recovered 50% of what it lost from July to March. But this is misleading.
In 2007 the DJI topped out at 14164. It closed at a low of 6547 in March 2009. It thus
fell 7817 points. A 50% recovery of the entire loss would mean a rally of 3909 points
off the low. 10456 is the real 50% retracement target.
2007 High 2009 Low 50% Retracement High This Year Now
DJIA 14164 6547 19456 9270 9171.61
NASDAQ 2859 1269 2044 2000 1978.50
SP-500 1562 677 1130 1000 987.50
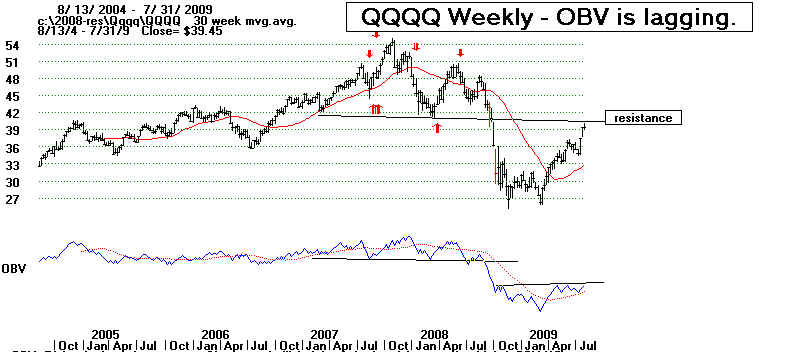
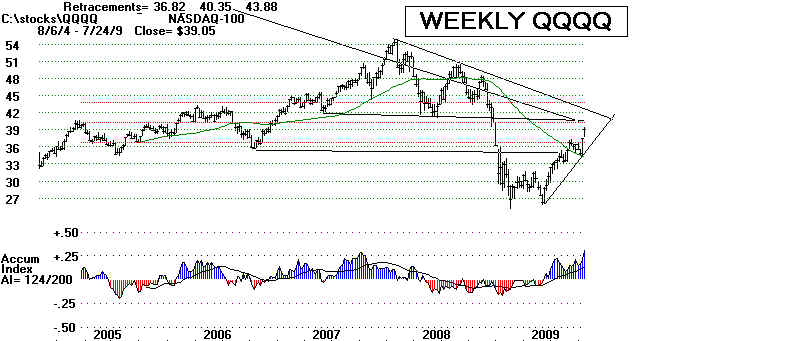
QQQQ 54 25.74 39.87 40 39.45
With the QQQQ now having achieved the 40 resistance and the NASDAQ's relative strength
indicator (NASDJI) negative, it is probably a good idea to take profits in some of the NASDAQ
stocks. When their Closing Power uptrend are violated, they become vulnerable. Many are up
more than 20% over their 50-day ma, have already tripled or more and have had warning
Sell S24, S25, or S26 signals. A subsequent clear breaking of their 10-day ma in these conditions
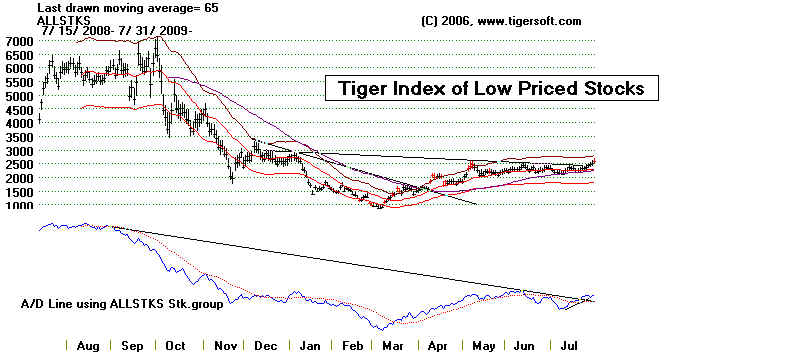
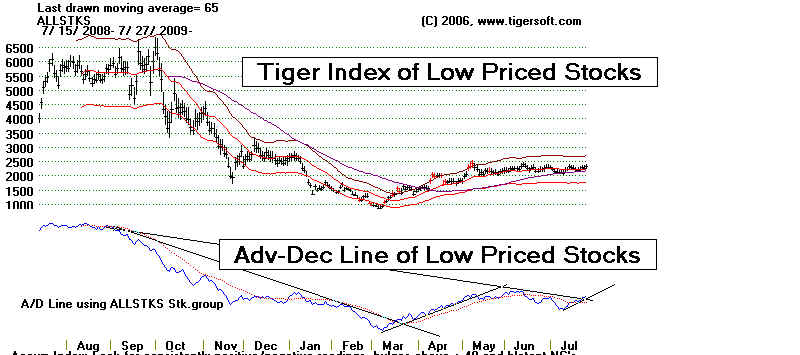
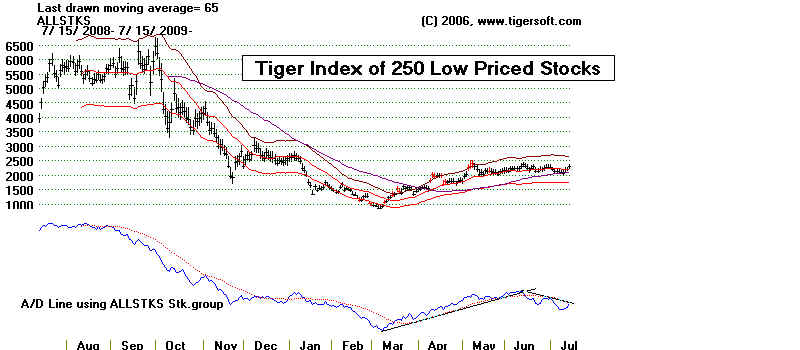
on a closing basis should be used by traders to take profits now, I'd say. The Low Priced Stock's
Index is still in an uptrend; as its A/D Line.
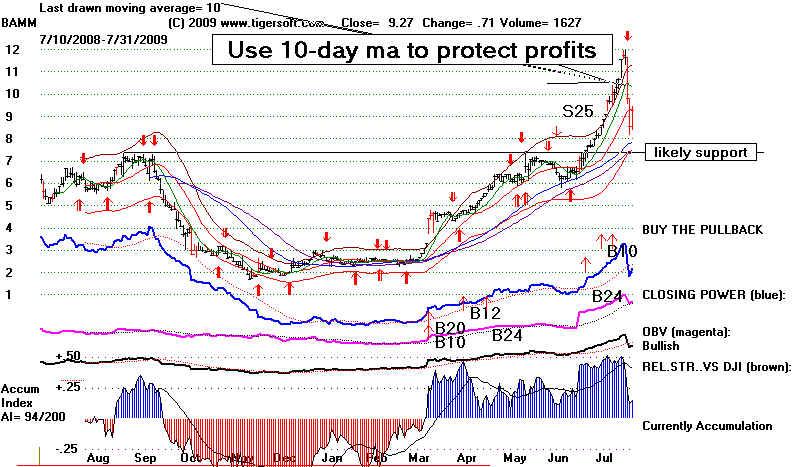
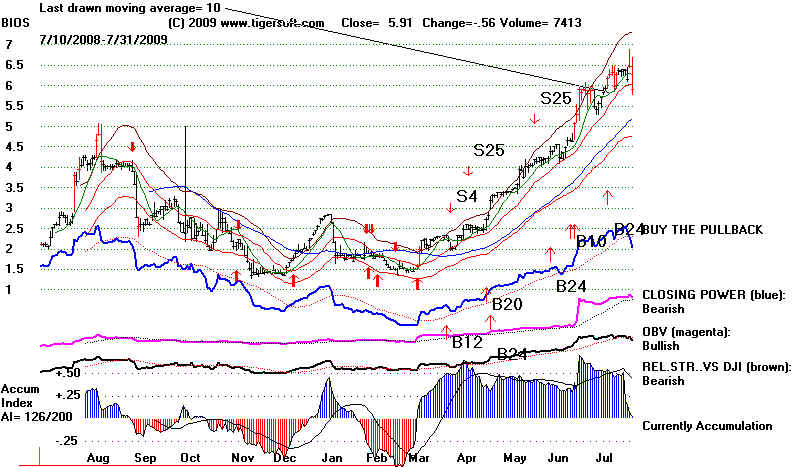
Use of 10-day ma to lock in profits seems prudent. Two examples: BOOM and BIOS
-------- SUPERIMPOSED PEERLESS SIGNALS ON DJIA ---------
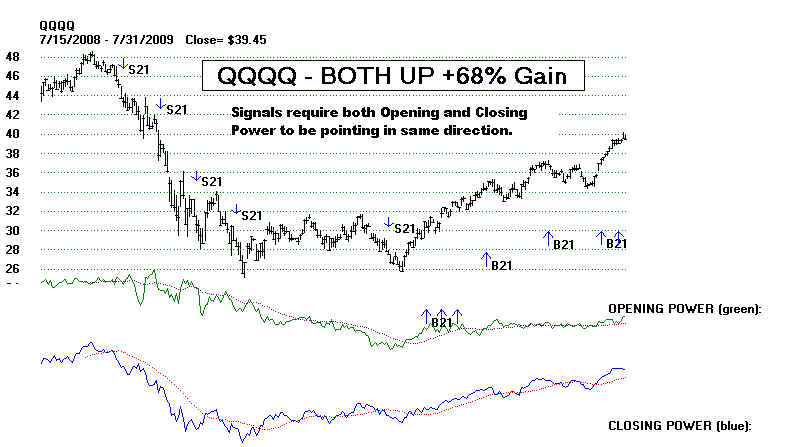
QQQQ - Some New Emphases:
1) When Both Opening and Closing Power Agree
2) Trend of Tiger Day Traders' Tool.
For more informatio and historical studies about the Tiger Day Traders' Tool:
QQQQ - 1999-2008
IBM - 1999-2009 www.tigersoftware.com/TigerBlogs/Aug-31-2009/index.html
==================================================================================
7/30/2009 Peerless remains on a Buy. Closing Powers Are Still Rising. Enjoy The Rally.
New Recovery High Today - that's bullish, though prices did not close near their highs. It is not
uncommon for prices to close off their highs when prices are moving up through overhead resistance.
The day after Obama's Election, November 5th 2008, saw a sharp sell-off from above 9600 to
9138. That sudden reversal created lots of overhead supply of stock, whose owners want now to
get out even on.
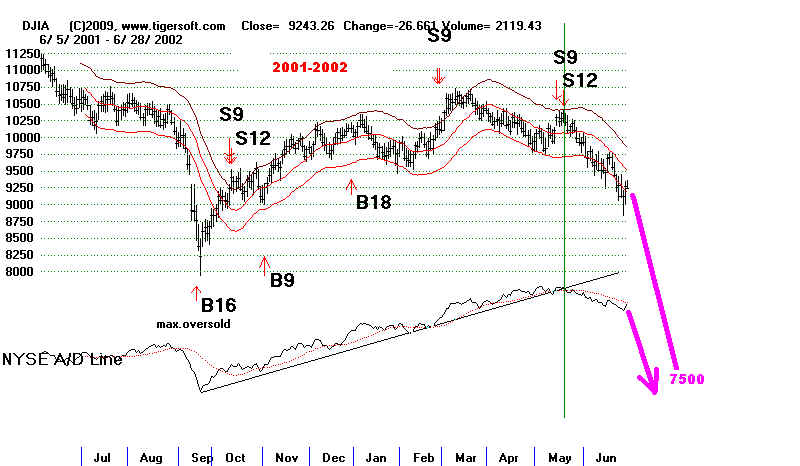
Today the NYSE A/D Line made another 12 month high. It is much, much stronger than the DJI.
This does not preclude a bear market, as the excellent breadth for eight months after 9/11/2001
showed. But even in 2002, as long as the NYSE A/D Line stayed above its 21-day ma or until
a new Peerless Sell signal was seen, it paid to wait for still higher prices for most stocks. However,
when the NYSE A/D Line long uptrend was broken, prices deteriorated quickly. The chart for
2001-2002 is shown further below.
Breadth has been very good. The frequency of days of super breadth has no precedent, that
I am aware of, for the start of a bull market. Today the number of NYSE Advances (2432)
exceeded Declines (625) by almost 4 to 1. Here is a simple monthly count of the number of days
when there was a 3:1 positive breadth since the bottom in March this year. This count compares
very favorably to the start of other big bull markets: 2003, 1982, 1975 and 1962
Monthly Count of The Number of Days
of A 3:1 Positive Ratio of Daily NYSE Advancers to Decliners
Following A Market Bottom at The Start of A New Bull Market.
---------------------- 2009 ------- 2003 ---------- 1974-5 --------- 1962
First Month - Month of Bottom 10 3/03 0 12/74 1 10/62 1
Second Month (April 2009) 7 4/03 1 1/75 4 11/62 6
Third Month (May 2009) 4 5/03 2 2/75 1 12/62 0
Fourth Month (June 2009) 3 6/03 1 3/75 3 1/63 2
Fifth Month (July 2009) 5 7/03 1 4/75 0 1/64 0
-----------------------------------------------------------------------
Total 29 5 9 9
------- 1942 ---------- 1938 --------- 1933
6/42 3 4/38 4 3/33 4
7/42 4 5/38. 3 4/33 6
8/42 1 6/38 7 5/33 7
9/42 1 7/38 4 6/33 5
10/42 2 8/38 4 7/33 3
---------------------------------------------------------
Total 11 22 25
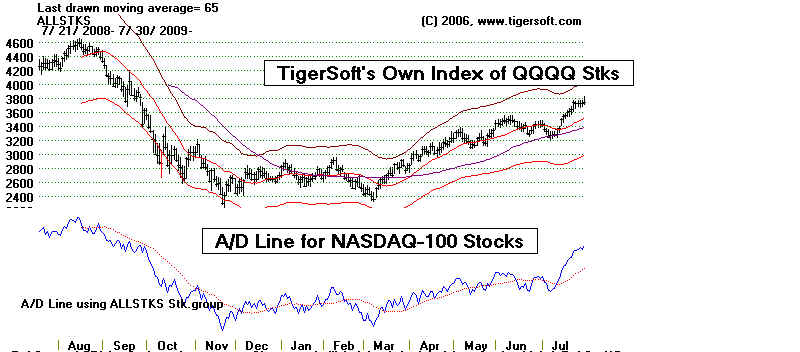
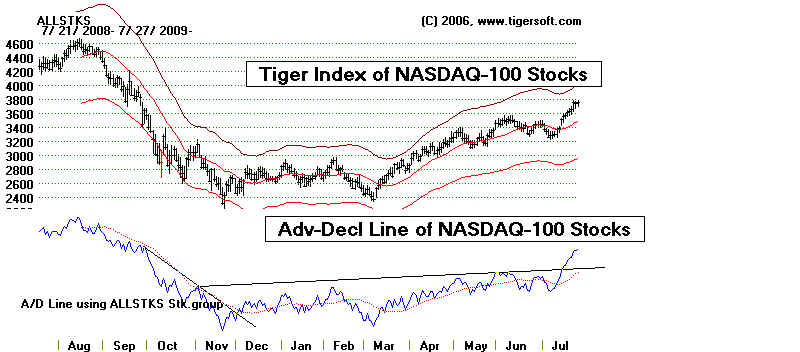
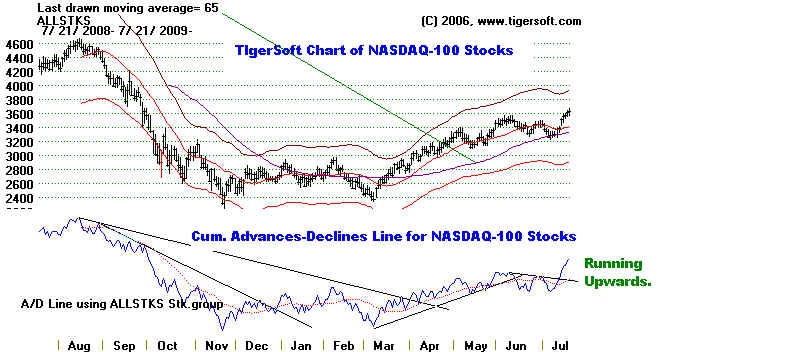
It has been argued that the breadth figures in today's market are not representative of
common shares generally. That may be true. So, here is the TigerSoft A/D Line for
the NASDAQ-100 stocks. (A chart for the SP-500 is not now available, but will be
constructed over the enxt week. It should help a lot.)
===================================================================================
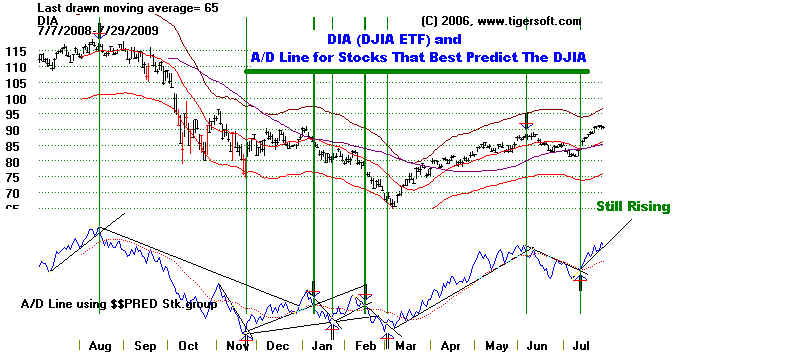
7/29/2009 New Indicator Suggests The Trend Is Still Up.
The comments from July 28th seem still to apply.
But sometimes, it's a good idea to think creatively. In that vein, I found the stocks that on
a day by day basis best predict the direction of the DJI the next day. (The TigerSoft
programs have that capability. Use TigerSoft + Run/Setups + Daily DJI Predictor of the DJI. )
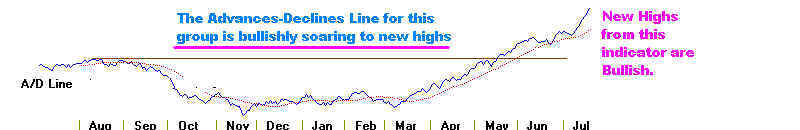
Then I built a chart with the DIA at the top and the A/D Line for this group of 15 stocks in
5000 stocks, each of which predicts the DJI direction the next day at a 53.6% rate or higher.
The A/D Line trends as you can see below have a very good record for the last year.
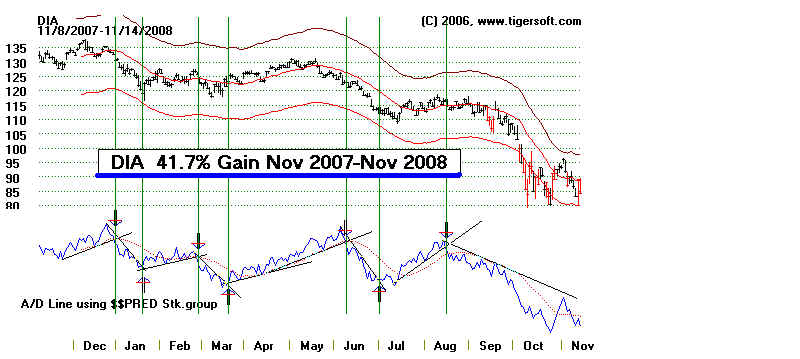
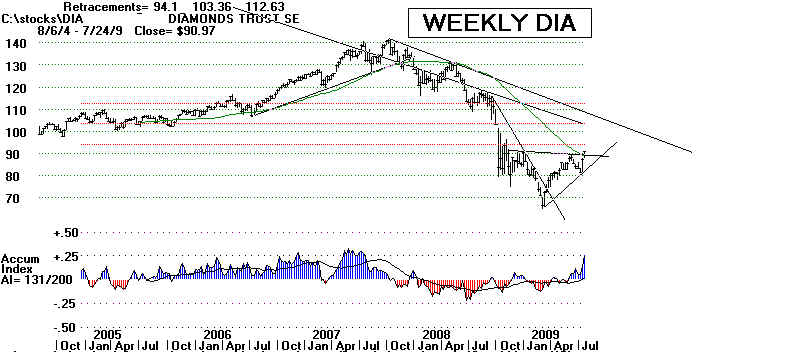
DIA 2008-2009 and A/D Line for Stocks That Best Predict DIA
DIA 2008 and A/D Line for Stocks That Best Predict DIA
WHAT STOCKS BEST PREDICT THE DJI'S DIRECTION THE NEXT DAY?
1 Year of Data Only
Success Rate
-----------------
SKF 55.3% +.04 Ultra Short Financials
NVDA 55.1% -.26
SMTC 55.1% +.27 Semtech
GSBC 54.8% +.07
Dollar 54.5% +.78
CTV 54.3% -.51
STRT 54.3% -.26
SWKS 54.3% +.11
AXYS 53.6% -.11
CHIC 53.6% -.02
DDE 53.6% -.18
GRR 53.6% -.62
NUVA 53.6% +.90
SGF 53..6% -.17
TNB 53.6% -.01
The ETFs themselves do not show a pattern of having an up day predict another up day,
or a down day predict another down day.
QQQQ 48.2%
SPY 44.3%
DIA 43.9%
===================================================================================
7/28/2009 TIME IS RUNNING OUT FOR A BREAKOUT.
Peerless remains on a Buy. The NYSE A/D Line, the Closing Power Lines and
Cumulative Inverted MKDS are all still rising. But there are risks now if the DJI does not
achieve a much higher volume breakout past 9180 very soon. It's probably a good idea to
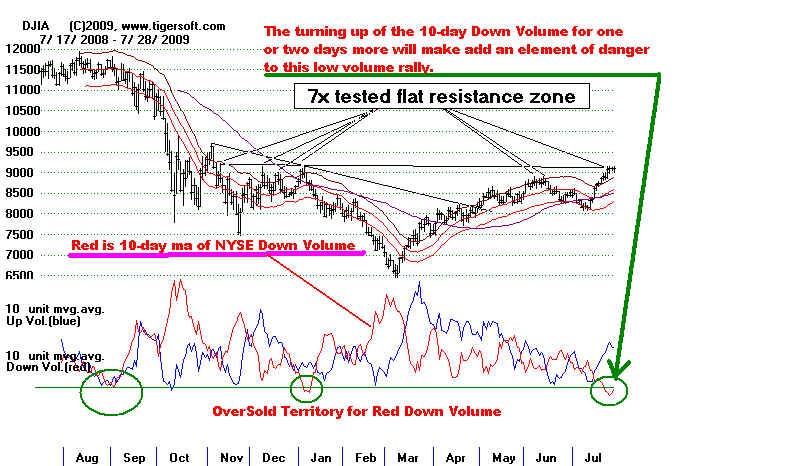
take some profits and look for a pull-back. The danger is that Down Volume will start picking up,
after a long lull in it. Today, the DJIA did slightly fall on rising volume.
The most disturbing aspect to the market has been the low volume. It is not clear how prices
will achieve a further advance without much more volume to eat up the over-head supply.
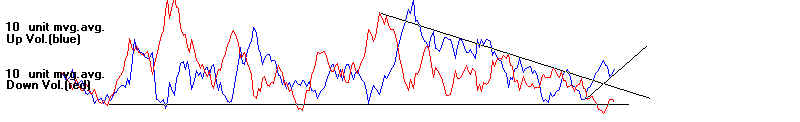
Leading stocks - like those shown above - turned down today. That's a warning sign. Of concern
too, the 10-day Blue Up-Volume has turned down and the 10-day Red Down-Volume has turned
up from a deeply over-extended low position. See in the chart just below how this happened in August
2008 and January 2009 right before significant market declines. The DJI is clearly having trouble getting
past the last resistance. If prices cannot get past resistance very soon, they must fall back to
find support. The daily change volatility has declined sharply. Another Sell S8 will occur in
a few days if the daily change volatilty does not rise above its mvg. avg. And if NYSE Down Volume
starts rising, it will make the market look somewhat like it did in August 2008 and January 2009
right before big declines.
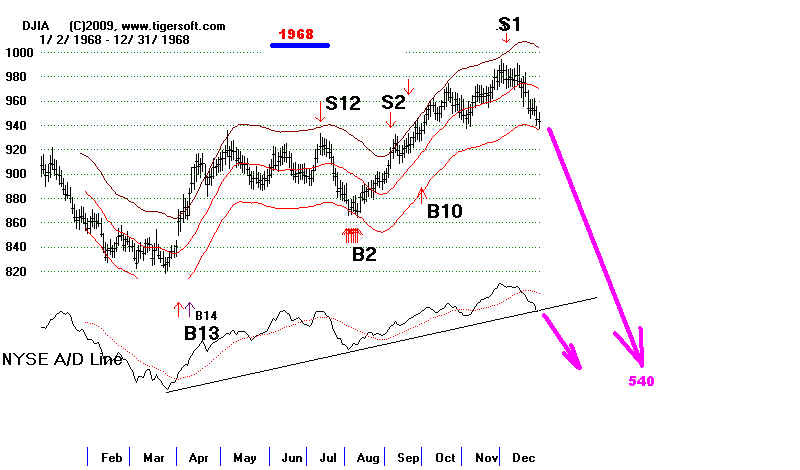
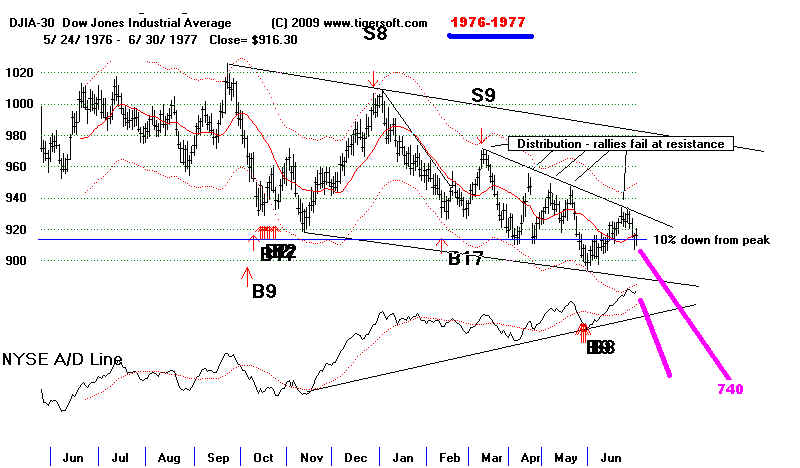
One more item of concern, very good breadth does not guarantee a rising market. See the examples
of 1968, 1976-1977 and 2001-2002.
1968
1976-1977
2001-2002
===============================================================
7/27/2009 PEERLESS REMAINS ON A BUY
The DJIA still has not clearly taken out the last resistance line near 9000, but it is close
to doing so. And the other averages are much stronger. The NYSE A/D Line is making 12 month highs.
Stick with the trend as shown by the last major Peerless signal and the trend of the major market ETFs'
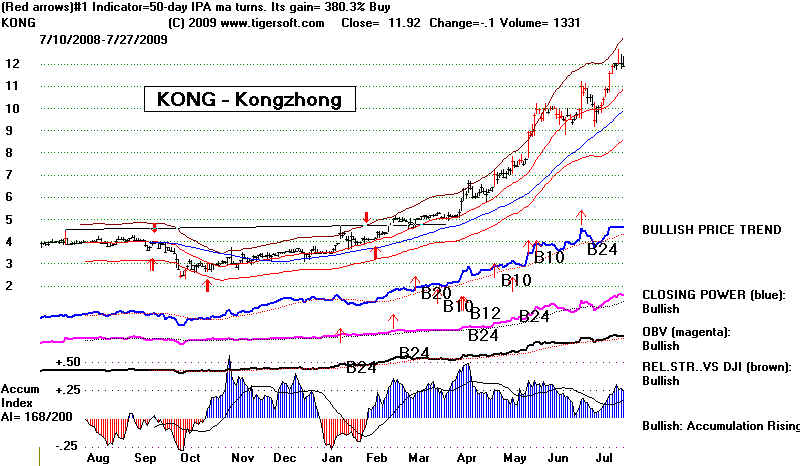
rising Closing Power trends. Buying the new highs after an intense bulge of Accumulation and holding
until there are clear signs of weakness or a confirmed break of the stock's 50-day ma is working fine.
See KONG's AI bulges above .50 in October and April.
It's a good idea to find the most bullish stock in the strongest (highest ITRS) group of stock.
KONG has been that stock for almost 3 months. KongZhong Corporation, through its subsidiaries,
provides wireless interactive entertainment, media, and community services to mobile phone users in
the People's Republic of China. The TigerSoft ITRS subtracts the rate of change for the DJI over 50
days from the stock's.
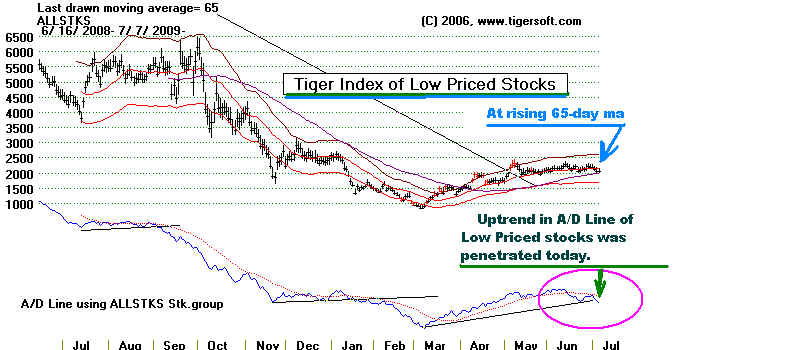
Tiger Index of LOW PRICED Stocks with A/D Line
Tiger Index of NASDAQ-100 with A/D Line
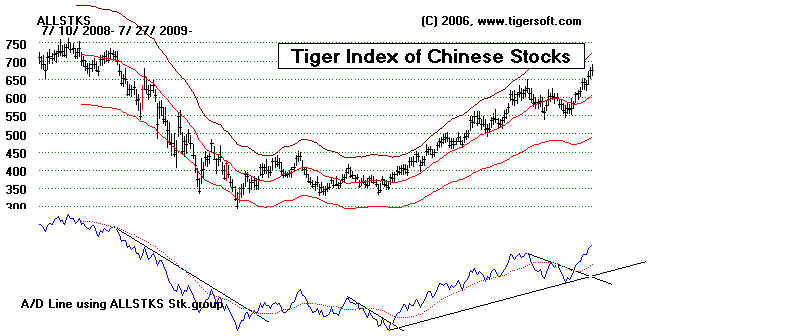
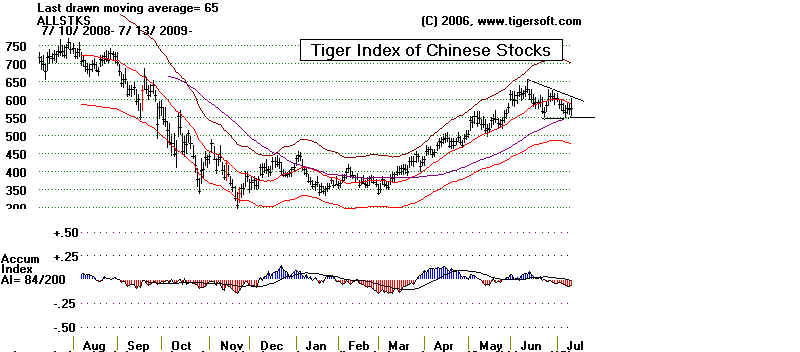
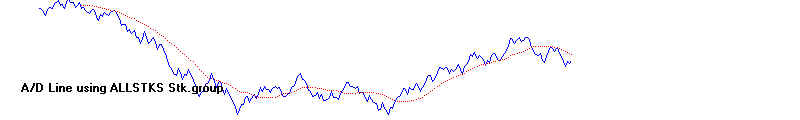
Tiger Index of Chinese Stocks with A/D Line
and Bullish Relative Strength Indicators

==================================================================================
The
DJI's breakout above 8940 has not yet led to a move past additional resistance at 9200.
There is also still additonal resistance at
9200. But flat tops usually bring breakouts. 1976
is the major exception for the DJIA in 84
years. Volume remains very low, but that has been true for
most of the rally and prices keep rising.
Valid breakouts historically mearly always show more
volume as prices surge past resistance.
The A/D Line and P-Indicator are in firm, even historically
strong uptrends. The QQQQ has now risen
13 straight days. This is a record by a wide margin.
Ostensibly, this would seem to suggest caution.
But long streaks of up-days in the range of 6, 7,
or 8 have been bullish for the QQQQ.
Peerless remains on a
Buy B14/B12. A Peerless reversing Sell does not seem imminent.
The Closing Powers for all the ETFs are rising.
The key index ETFs have all surpassed their
52-week mvg.avgs. on the weekly chart.
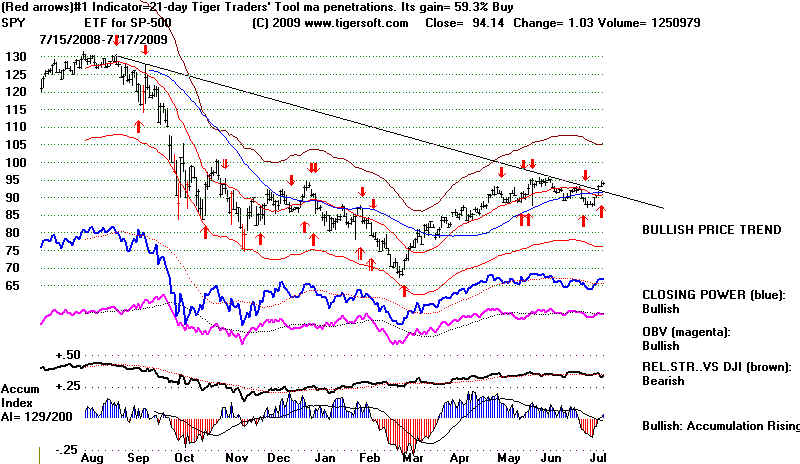
DIA and SPY are still working on achieving 33% recoveries
from its October 2007 peak. Even in a
bear market, this is normal. The QQQQ seems headed for
40, only a point higher. The QQQQ charts
viewed below show its:
`1) its own A/D Line, (Will Be posted later...)
2) TigerSoft's Opening Indicator and Closing Power - BOTH Bullishly rising
3) TigerSoft's "ITRS" (50 day percent change of QQQQ verus the DJIA's percent
change),
4) TigerSoft's Day-Traders' Tool (the difference between the upside change after the
opening
and the downside change after the close.)
QQQQ is the strongest of
the ETFs. Its Internals are all rising using Closing Power, OBV,
Relative Strength and the Accumulation
Index.
.
===================================================================================
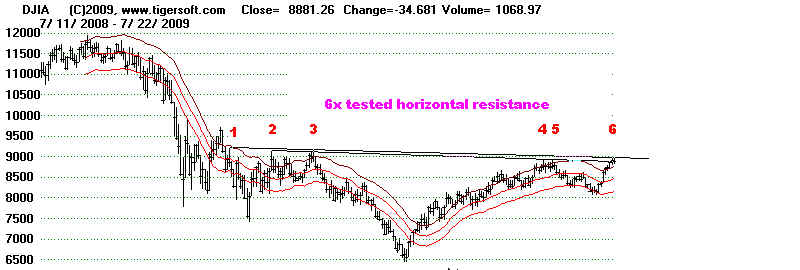
7/23/2009 B14, B12 and Breakout above well-tested
horizontal resistance.
The rally continued today, quite impressively. Breadth and
internal strength indicators are all bullish.
See how the NYSE A/D Line has
reached levels not seen since last September. Volume rose,
but the 21-day ma of volume is
declining. Volume is needed to eat up over-head supply of stock.
It is only when the DJI is near
all-time high territory that big rallies can take place without
rising volume. So, the target
now becomes 9600, the level of the DJI on Election Night last November.
High accumulation new highs
continue to behave very well.
My study of well-tested resistance
level breakouts since 1915 shows that there are as many valid
such breakouts without Buy B10s as
those with Buy B10s. So, not getting a Buy B10 today
is not a problem. Moreover,
rallies without sufficient volume typically do not immediately fail
the breakout unless there is also a
Peerless Sell signal or a head and shoulders top develops.
Again, I say this based on studying
30 such cases where the DJI challenged a well-tested,
horizontal resistance level going
back 40 trading days from 1915 to the present.
See http://www.tigersoft.com/PeerInst/Flat-Resistance/index.html
Accordingly, I would think prices
will go higher and this breakout over 9000 will reach 9600 next.
However, a failure of the DJI to
stay above 8950 over the next 4 trading days would suggest a false
breakout. In that case, a
decline by the DJI back to the lower lower band, as occurred in January 1947,
================================================================================
7/22/2009
PEERLESS REMAINS ON BUYS (B14
and B12)
The DJI is facing nearly flat resistance in the zone 8900-9050 that been tested
six times,
if we count each tagging of the resistance separated by 3 days. Below
is a link
to my study showing all such cases of well-tested flat resistance
for the
DJIA since 1915. The conclusions I reach from this effort are that:
1) Volume must
rise noticeably and even dramatically for a breakout to lead to a
big advance;
2) Even when
there is a breakout on an increase in volume, the volume must continue
to stay at a high
level, or else there is a risk of a bearish head and shoulders pattern
quickly forming
and the breakout soon failing;
3). Breakouts
above flat resistance without an increase in volume may still produce
a rise for in
price for a few weeks, but not much more.
4) Usually,
there is an upside breakout from a flat, well-tested resistance level.
The odds of an
upside breakout I reckon to be 4:1, looking back to 1915.
5.) Hesitation
between 8900-9100 for more than a week will increase the risk of
a failure to
breakout.
6) An absence of
an increase in volume soon will also increase the risk of a a failure
to breakout.
7) The Peerless
automatic signals usually do what they are supposed to and tell us
when to sell.
See all the charts at http://www.tigersoft.com/PeerInst/Flat-Resistance/index.html
A full
tabulation of results will be posted by tomorrow night.
In the 5-day chart above you can see that a DJIA move back above 8900 would
move prices
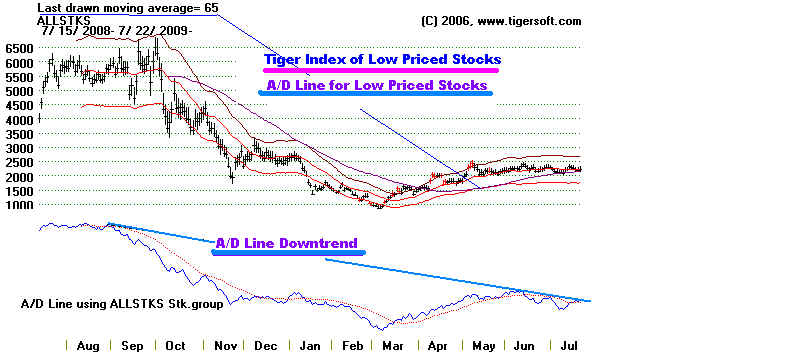
past the short-term downtrendline. We also have to keep watching the
Tiger Index
of Low Priced stocks. The second chart below shows its A/D Line is right
at its
resistance line.
Well-Tested Horizontal Resistance
-------
TIGERSOFT Index of 308 Low Priced Stocks --------
7/21/2009 PEERLESS REMAINS ON BUYS (B14 and B12)
The DJI's rally has reached an
area of well-tested resistance between 8900 and 9100.
The CLosing Powers of QQQQ and DIA are still rising.
SPY's and MDY's (mid-caps) are flat.
IWM's Closing Power has turned slightly down from the
previous day. All the QQQQ's
and DIA's automatic technical evaluations are
bullish. The NASDAQ's OBV Line is scoring
12 month highs by a wide margin. This is a
bullish sign. Non-confirmations by the OBV Line
of a NASDAQ new high can occur and they can also call
important tops: 11/1/2007 and 6/5/2008.
The fake-out below 8200 was a bear trap.
I doubt if this trap was sprung simply to get a
trading range rally. Even though volume
is low, I believe the stealthy bull market in low
priced stocks experiencing insider buying
will continue. I created an index of stocks I
would put in this category. It is shown
further below. Look at the high levels of Accumulation
and how strong the A/D Line is for these
stocks. See the stock chosen for this index
here.
Wall Street's Stealthy
Bull Market in Low Priced Stocks Continues.
The NASDAQ-100 and high
Accumulation Index breakouts are leading the rally upwards.
Below are the TigerSoft charts of both, showing
Accumulation and their Advances-Declines
Line.
NASDAQ-100 and A/D Line for
NASDAQ-100
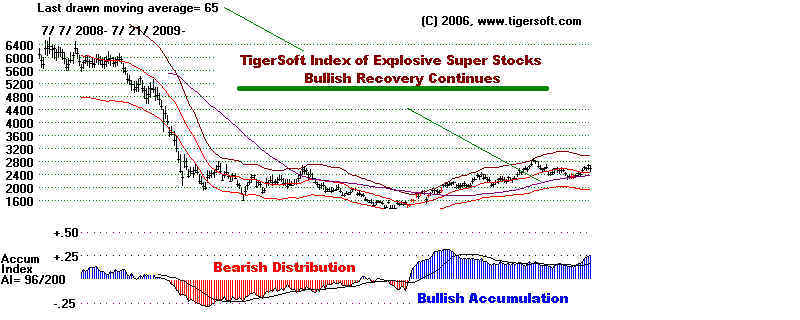
------------
Explosive Super Stocks' INDEX ------------------
====================================================================================
7/20/2009 DJIA= 9000 Should Be Tested.
Volume Needs To Pick up for
A Breakout.
Volume and OPct
Best Distinguish Take-Off Buy B12s from
Being Just Notices That A
Bull Market Lies Ahead.
The
NASDAQ is clearly outperforming the DJIA. See chart below. Its OBV is much
stronger than its price
action. Volume on up-days dominates now. The DJI and NASDAQ
have now risen 6 straight
days. A retreat is possible, but my guess is that the DJI will
get past 9000 to the surprise
of the shorts. A stealthy rally in high accumulation low-priced
stocks continues with very
little public notice. There were a number of new highs
among such stocks today.
See www.tigersoftware.com/TigerBlogs/7-20-2009/index.html
This has to be a constructive
sign. Watch the next few days to see if the A/D Line for
our sample of low priced
stocks can break its year-long downtrend. Today there were 34
new NASDAQ 52-week highs.
Watch that number to see if it can expand.
NASDAQ MAKES RECOVERY NEW HIGH
ITS OBV IS STRONG THAT IT MADE A 12-MONTH HIGH.
ACCUMULATION IS POSITIVE - RELATIVE STRENGTH
VERY POSITIVE
VOLUME IS TOO LOW.
================================================================================
7/19/2009 9000 Should Be Tested.
Volume Needs To Pick up for A Breakout. Volume
and
OPct Best Distinguish Take-Off Buy B12s from
Being Just
Notices That A Bull Market Lies Ahead.
Before
reading about the general market, consider running the Power Ranking programs
in search
of Explosive Super stocks. I
have written two new sections for the Explosive
Super
Stocks book. One is entitled AUGMENTED BUY B24s (the link to which will be on the
Elite Stock
Professional Page later tonight). The other is WHEN
TO SELL AN EXPLOSIVE
SUPER STOCK. I think the second will prove
timely, given how much some of the high
accumulation low priced stocks have risen since the March 9th bottom.
A second
Peerless Buy B12 reinforces the B14. Two Buy B12s in close succession are
more
bullish than once. We had one 2 months ago. The severe bear market of
1973-1974
ended and
the 1975-1976 bull market was launched with a second Buy B12.
Read more about Peerless Buy B12s here.
The DJI is now testing its resistance between 8750 and 8800
from its
early June advance. Its last peak was a closing at 877.26 on 6/12/2009. A well
tested
resistance
line crosses at abut 8850. Above that is the January 2nd, 2009 high closing of
9034.69.
All these
points could turn the DJI back down. Almost half the Buy B12s do bring a decline
back to
the lower
band. Such a decline is much more likely when the internals are not extremely positive
om the day
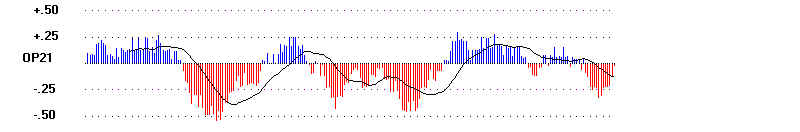
the B12 occurred. Here the OPct was only -.017. OPct is a way of measuring
aggressive
buying and
selling. It takes aggressive buying to launch a bull market and get prices past
earlier
resistance
levels. Below are the past cases of B12s ith a negative OPct. In only
one case did |
the market
roar upwards, as it can with a Buy. And that was a day when daily volume was more
than twice
is 21-day average.
Buy B12s Year
OPct
Result
--------------------------------------------------------
11/5/1943 -.135 4% decline back to lower band
and then recovery.
10/14/1946 -.054 3% decline back to lower
band and then modest recovery.
6/1/1970 -.125 7%
decline back to lower band and then strong recovery.
10/10/1974 -.193 11% decline
hotmail.comback totest lows and then strong recovery.
8/17/1982 -.306
Immediate Rally and start of powerful bull market.
.
Here the daily volume was 100% above its norm for th last 21-days.
Buy B12s are remarkable because they often do launch very bullish
advances. They did this
usually with a big increase in volume and much higher OPct readings on the day of the Buy
B12.
These
are the two characteristics that distinguish take-off Buy B12s and Buy B12s that
show
a bull market lies ahead, after a decline to the lower band.
Buy B12s Year
OPct
Vol/21dma Vol Result
--------------------------------------------------------------------------------------------------
7/25/1932 .132
80%
DJI rose 60% in next 6 weeks.
4/10/1933 .367 30%
DJI rose 70% in next 13 weeks.
6/22/1938 .216 100%
DJI rose 16% in next 4 weeks.
1/28/1975 .574
80%
DJI rose 20% in next 5 months.
1/5/1976 .432
80%
DJI rose 14% in next 12 weeks.
8/17/1982 -.306 100%
DJI rose 28% in next 16 weeks.
1/17/1991 .14
100%
DJI rose 12% on 2 months.
OPCT = OP21

====================================================================================
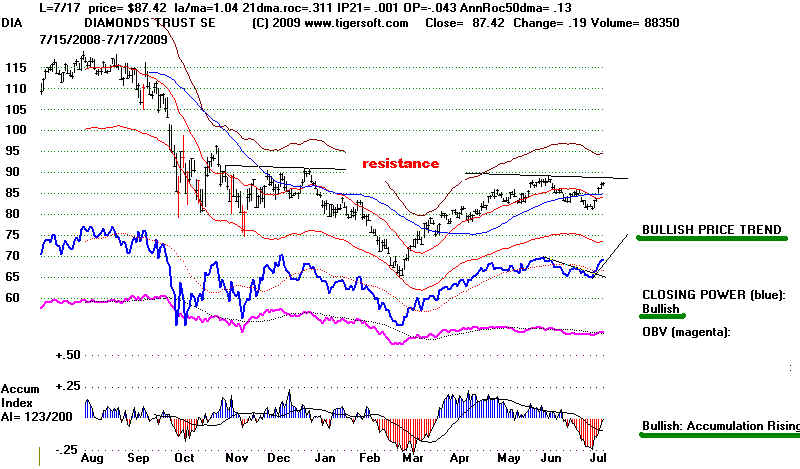
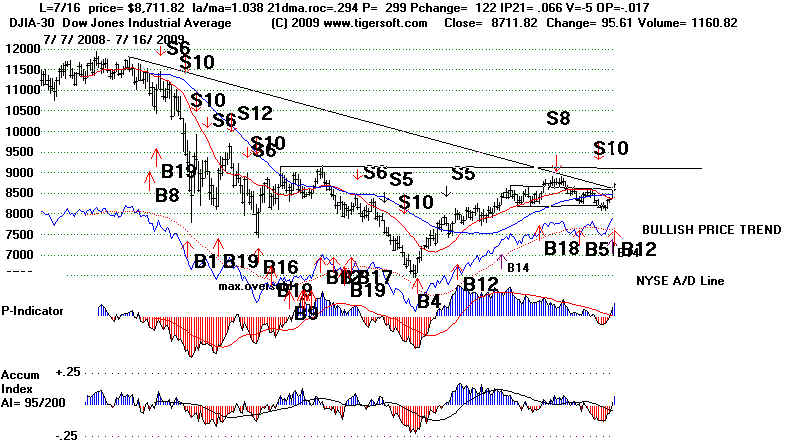
7/16/2008
A Peerless Buy B12 joins yesterday's B14. The apex of the DJI's right
shoulder has
been broken
above decisively. This is reliably bullish. In 5 of the 7 cases where a head
and shoulders
pattern was
aborted in the DJI by the apex of the right shoulder being exceeded, very significant
gains
followed. The charts may be seen at www.tigersoftware.com/TigerBlogs/7-16-2009/index.html
Below are
the cases.
1. July 1922 DJI rallied from 92 to 102 in 10 weeks.
2. April 1945 DJI rallied from 159 to 169 in 6 weeks.
3. August 1945 DJI rallied from 165 to 195 in 4 months.
4. July 1951 DJI rallied from 255 to 276 in 2 months.
5. April 1956 DJI rallied from 510 to 518 and
then fell to 470/
The decline back below the apex point could have been used ot go short again.
6. January 1995 DJI rallied from 3900 to 4600 in 4 months.
7. May 1996 DJI rallied from 5650 to 5800 in a
week and then re-tested the neckline
in July at 5350.
The excellent breadth has brought today's Buy B12. Read
more about Buy B12s here.
http://www.tigersoft.com/PeerInst/-B12.htm
"B12s are the most bullish of all Peerless signals. They have
launched many a
bull markets, as in 1947, 1950, 1953, 1958, 1970, 1971, 1975, 1976, 1982, 1991.
There
have been 25 closed out Buy B12 trades. The average gain on the at the time of the
next Peerless Sell was +17.9% in 25 cases. Only one saw a loss.
"B12's can start a bullish stampede into stocks. In 12 cases, or 48% of the
time,
very powerful rallies immediately followed. They are not perfect, of course.
In 4 of
the 25 cases the DJI declined more than 4.4% from the Buy B12, always to eventually
recover and move much higher. Declines back to the lower band occurred in a
handful more cases."
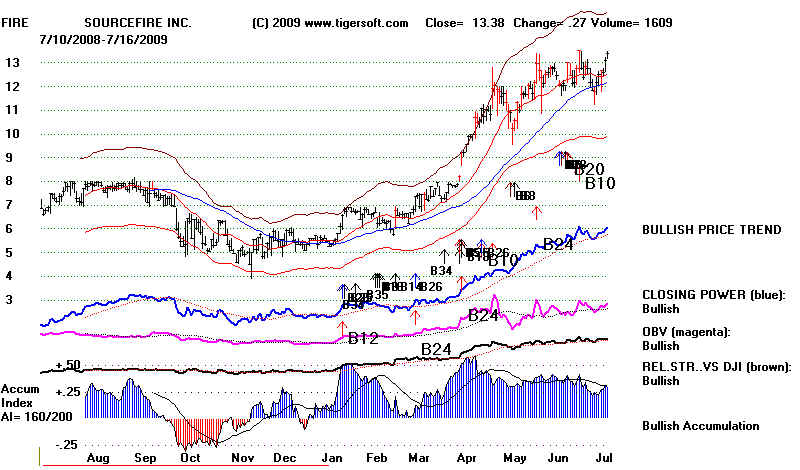
Lots of "Augmented TigerSoft
B24s": That's Usually Bullish,
Especially When These Are Occurring In Many Indistry Groups, as Now.
TigerSoft developed a powerful Buy signal called an augmented B24 for stocks and tested
it
extensively. There are a number of stocks that have had such sugnals in the last 3
months.
I
take that to be a sign that a lot of insider capital is flowing into certain stocks.
As they
have
become tightly held and are doing well, they are now attracting "HOT MONEY",
that
seeks performance. Just running through the alphabet to "I", the following
were found:
ATNI AVNR BAMM BIOS BKYF BPSG CCNE CKEC CLRT COMS CRGN
DDRX DRCO DTG EEI EJ
ELOY EVOL FIRE GMTN
These
can be bought on TigerSoft fix-rule Buys as long as they do not fall below their
50-day ma. Our Stocks'
Hotline has bought more of these this week and covered
its
short sales as the CLosing Power downtrends are ended.
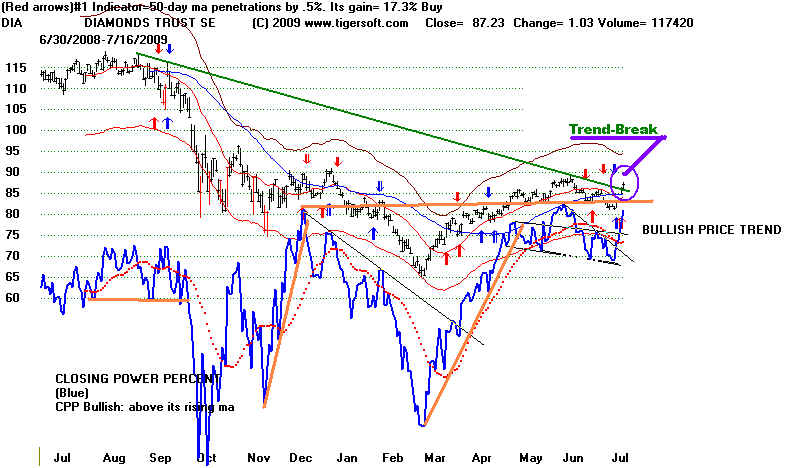
DJIA with Super-Imposed Peerless
Signals
DIA - ETF for DJIA Chart
below Note the bearish head
and shoulders pattern
that was aborted yesterday in the DIA's Closing Power. More closing
strength should
be expected. The bullish UP-UP condition exists now. Both Opening and Closing
Power
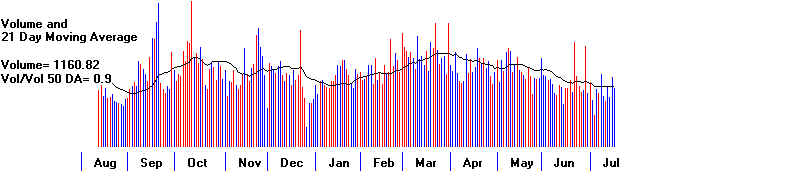
are rising. Volume remains suspiciously low on this rally.
Wednesday'-are
up 57%. Tuesday's are up 50% and Fridays 54% of the time for the last year.
It's Mondays (29.1%) and Tuesdays (48%) that longs typically have to be worry
especially about.
QQQQ Chart below Its CCP
broke out. The Trend, Closing Power, Accum. Index
and
OBV are all rated bullish. The bullish UP-UP condition exists now. Both Opening
and Closing Power are rising. Volume is still suspiciously
low
Mondays are up 35.4% of the time for the last year, Tuesdays 46.1% of the time.
Wednesday's 56.6% of the time and Thursday's 52% and Fridays 54% of the time.
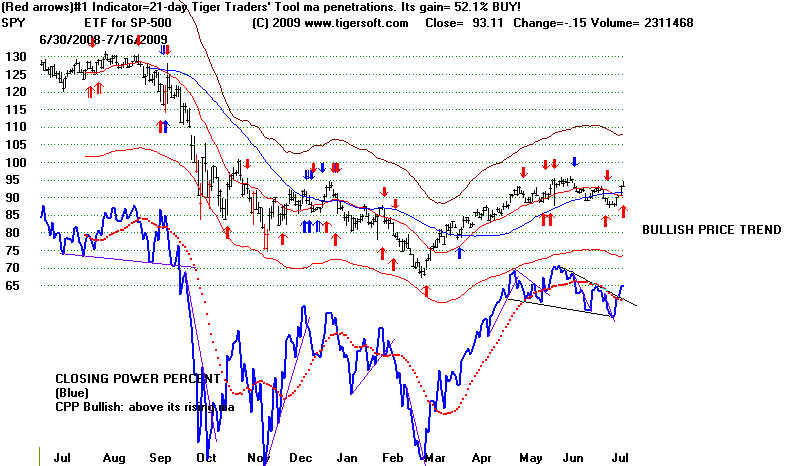
SPY Chart below. Note the CPP head and shoulders has
been aborted but the SPY's
CP went flat today. Prices have broken above their 12-month downtrend but
today they declined.
. The Accum. Index is slightly positive. This is not impressive. Volume
picked up today
on the decline. Mondays for the last year have brought an SPY gain only 35% of
the time.
Tuesdays - 52%, Wednesdays - 55% Thursday's are up 58% and
Fridays 58%.
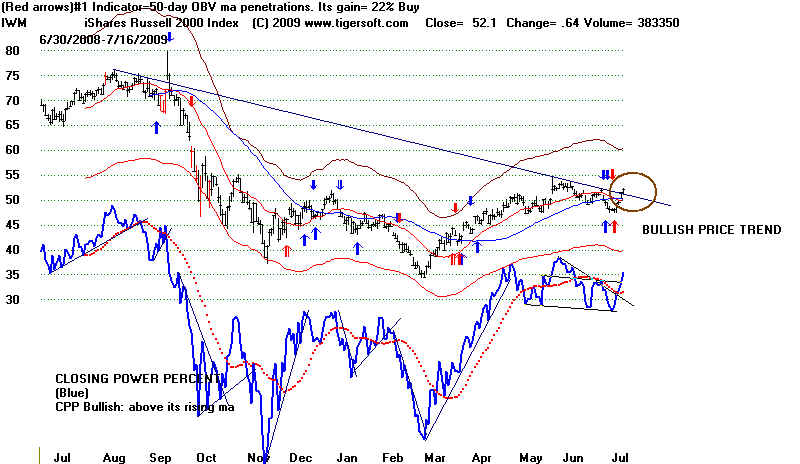
IWM - ETF for Russell-2000 Chart
below Note the bearish head
and shoulders pattern that was aborted today in the DIA's Closing Power.
More closing strength should be expected. Volume remains suspiciously low on this
rally.
There is a lot of daily variation in the probability of a gain for th last year:
Monday 35.4%, Tuesday 52%, Wednesday 60%, Thursday 50% and Friday 68%.
==================================================================================
7/15/2009
- New Buy B14.
- False Horizontal DJI Breakdowns Are Bullish.
- A move more clearly above the apex of the right shoulder
would make the advance more convincing, given its low volume.
. The excellent breadth favors smaller stocks.
- High Accumulation, secondary stocks making new highs
seem a lot more bullish than the DJIA.
The size of the rally today was a a surprise. I'm sorry I did not see it
coming.
Time has been shrunk; moves that used to take a few days are now taking only a few hours.
The move has been explained as being the result of Intel's and Goldman's earnings. I
think
the continued low volume suggests two other more important factors: program trading
manipulation and short covering as shorts realized that a trap had been set for them on
the false breakdown below 8200. This does not mean prices will reverse and go
back to
8200. A DJI drop to the 21-day ma at 8380 would be reasonable to expect. But the
superb breadth and B14 require us going long if prices move decisively above the apex
of the right shoulder.
Is this the start of a much bigger move? Is
it too late to buy? It is reliably bullish when
the DJI surpasses its right shoulder's apex in a head and shoulders pattern that is being
aborted by the advance. We must use the hypothetical high of the DJI to judge
this. Measured
this way, the right shoulder's apex on 7/1/09 was 8610.32. So, the DJI has closed
only
6 points over that level. This is not much of a margin for an average that stands at
8600,
less than .1% There are a number of earlier cases where the apex of the right
shoulder is
reached and then there is a pullback or even a breakdown. Octover 1929's case is the
most ignominous. Here is a study of a number of earlier false breakdowns below
well-tested
horizontal support. Usually, prices rally to recoveryhighs, at the least, if the
apex is
clearly exceeded.
www.tigersoftware.com/TigerBlogs/7-16-2009/index.html
The danger now would be if the rally were to fizzle. Many of the shorts that might
have cushioned a decline have now covered.
What is moat impressive now is the exceptionally positive
breadth we have seen in two of the
last three days. Monday's NYSE advances outpaced declines by 2067 and today the difference
was nearly 2600. The ratio of NYSE up volume to down volume was more than 26 to 1.
That more than satisfies the conditions for a Peerless Buy B14. For datails about
the B14
go to http://www.tigersoft.com/PeerInst/-Buy-B14.htm
I think it is bullish that this signal
did not occur once in the bearish period 1928-1941. There have been 27
Buy B14s. The
average gain at the time of the next Peerless sell signal is about 12%, but the gain was
less than
5% in 14 cases. There were 3 losses. The last occurrence in March
gained 4.0%.
The DJI is now 2.8% over the 21- day ma. There have been 6 such cases among
the
B14s. None of these ended up losing money, though in two cases the gain was less
than .7%.
The 1982 take-off began with a B14 that was 2.9% over the 21-day ma. So, being this
far over the 21-day ma is not by itself a problem.
FLAT R0C (Annualized Rate of CHnage of The 21-Day MA)
A key problem now is that the 21-day ma is essentially flat. This strongly suggests
that
it is much more likely that we are seeing a trading range rally, rather than a break-away
advance.
The lack of volume now also dramatically decreases the odds of a breakaway rally, as in
1982.
The annualized rate of daily change of the 21-day ma is now only .6%. Here are the
cases
when the DJI's 21-day ma ROC was between -.10 and +.10. There were 9 earlier cases of
such B12s. In one case the DJI rose 27.2%, in another it rose 6.4% and in a
third, it rose 6.4%.
Note that in 6 of the 9 such cases, it rose less than 3.5%.
B14 Data DJI CL/MA ROC P-I
IP21 V-I OPct
Gain
1 3/9/1945
156.3 .985 .06 179 28
.133 242 .314
+ .076
DJI fell to 152.30 and then rose
2 10/15/1946 175.9 1.035
.098 30 27 .072
4 -.029 + .007
This was bottom. Rallied to 183.But low needed to be tested 7 months later.
3 9/9/1948 180.3 .989
.02 70 63 .11
17 .035 +
.033
DJI fell to 176.. on 9/27/1949 and then rallied.
4 1/28/1982 864.25 1.011 -.056 -114 71
-.018 -5 .017 -.036
DJI fell to 795.47 before
rallying to 865.87 and then falling back again.
5 8/17/1982 831.24 1.029
.076 -66 65 -.064 -5 -.306
+.272
DJI roared ahead in new bull market.
6 5/31/1988 2031.12 1.021 -.007 -87 41
.024 -4 .018 +.011
DJI rose to top of trading channel.
7 1/19/2006 10880.71 1.00 .006
360 112 .02 -24
-.017 +.064
DJI fell to 10667 on 1/20 and then rose.
8 8/29/2007 13289.29 1.004 .07
-69 139 .103 370 .209
+ .035
DJI rose to 14156 and then started a bear market.
9 3/18/2008 12392.66 1.011 .042 -327
138 .088 -263 -.029 +.013
DJI rallied to upper band
7/15/2009 8616.21 1.028
.006 177 221 .001 -50
-.11
Again, the false breakdown is significant. It has trapped a lot of
bears. I think it
requires a review of all the similar false horizontal breakdowns in the DJIA that
I can find historically. The main concept here is that if closing prices
within 4 days get
back above the horizontal breakdown point, it means a test of the apex of the right
shoulder
when there is a head and shoulders pattern. When there is no such head and
shoulders
pattern, we can can simply become bullish when prices clearly surpass the point
of breakdown. Look at the chart of the DJI back in 1983. Another
thing - false breakdowns
below a 3x or 4x tested horizontal support are rare. They are significant
traps. Often they
are not set unless there is much more upside potential in the market. But for now,
we need
a clearer move by the DJIA over the right shoulder apex.
Example of False Horizontal Breakdown in 1983.
7/15/2009 Note New
B14. DJI closed at apex of previous right shoulder.
The NYSE A/D Line has bullishly made a marginal new high. Volume on today's
rally is lower than it was on similar rallies a month and two months ago. The DJI
has reached the resistance of its price downtrendline going back 11 months. (This
is not shown here. But you can print this out and draw the line.)
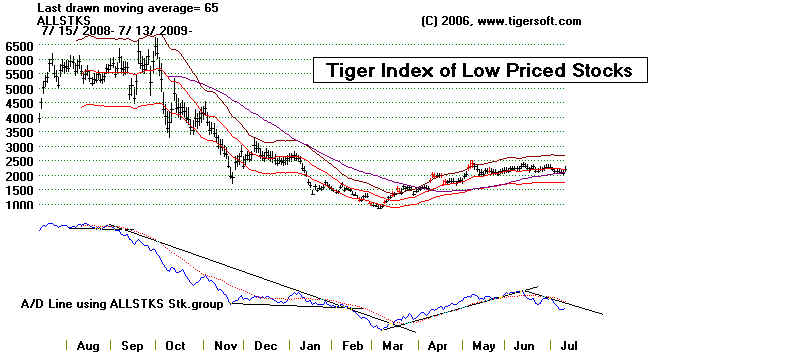
LOW
PRICED STOCKS TURNED UP AT THEIR 65-DAY MA
THEIR A/D LINE IS
STILL DOWN-TRENDING.
GREATER SELECTIVITY IS NEEDED.
Peerless Still Shows a Sell S10, but the Head and Shoulders' neckline has
been exceeded. That commonly brings a rally to the 50-da ma or the apex
of the right shoulder, near 8500. The research into S10s shows that normally breadth
(the NYSE A/D Line) is much weaker than we now see. In addition, the Closing
Power for the DIA is above its falling 21-day ma now, while the Opening Power is
still below its falling 21-dma. That means the rally is being driven more by professionals
than the public. That both the Opening Power's and CLosing Power's 21-dma are
falling shows that the rally may still fail between 8450 and 8500. The low volume shows
the upward action is probably heavily influenced by artifical, short-term program trading.
That raises the question of who is going buy shares another 10% higher.
Still, there were enough high Accumulation breakouts to new highs today to give us
some more ways to play the rally.
CURRENT NYSE/NASDAQ New Highs and New Lows. Interesting NH/NL Stocks. Updated 7/14
In addiiton, our policy with short sales of individual stocks is generally to close
them out if the CLosing Power Pct (CPP) moves up past its downtrend. Such breaks
in CPP downtrends have occured in the last two days with a number of DJI-30
stocks: BA, UTX, CVX, IBM and JPM. Consumer spending stocks like Visa still
look very weak.
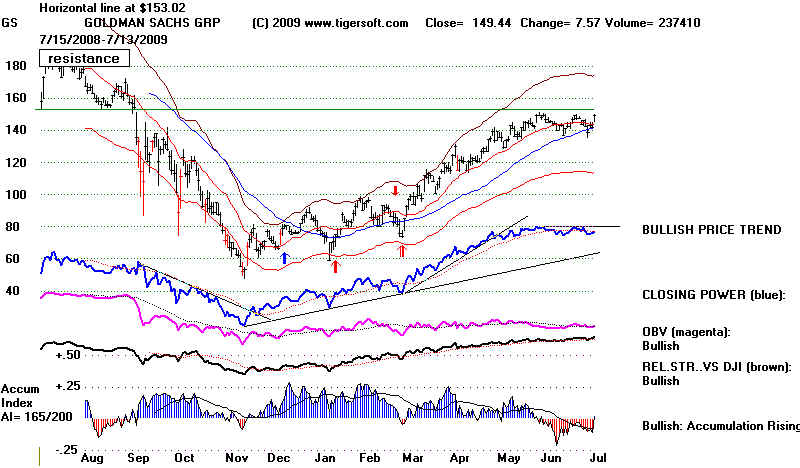
Goldman's $3.4 Billion in Quarterly Earnings
This Is after Allowing Billions for Bonuses.
"The average Goldman Sachs worker could end up taking home more than 10
times the typical American failily's income." So why did Goldman get its Paulson bailout
and was AIG kept alive just so Goldman would get the $12.9 billions it was owed by AIG?
What made Goldman worthy of saving and blessing with so much money when its
competitors, Bear Stearns and Lehman Brothers were allowed to fail?
If Paulson and Obama had let each of the 300 million Americans borrow $3000
from the US government at 0.25% interest instead of giving this and a lot more to the
greedy banks that caused the debacle, we would probably all be a lot better off, and the
banks would end up with the money anyway. But Paulson came directly from Goldman
and Obama was given a million dollars by Goldman Sachs executives. That idea was never
considered. Obama was given the money to keep the GS bonuses a'rollin' on in, to the tune
of $700,000 for each GS employee at last count. "What a country to be a Goldman employee in!
Greed is not just good. It's everything. Realizing that they are too big to be allowed to
fail, they can trade with even more contol of the markets they rig. They can can trade
with that much more leverage, aggressiveness and indifference to the consequences.
Who's going to stop 'em? Backboneless Obama? Just keep in mind what the
wise Greeks said 2000 years ago. Hubris and arrogance invite retribution by the Gods.
I should have said Happy Bastille Day yesterday. But today seems appropriate, too.
See the breakout past a series of tops between 8210 and 8225, That is the
price breakout past the neckline. This commonly brings a challenge of the
right shoulder apex.
7/14/2009
The very good breadth, low volume rally continued today. There were an impressive 2500 more
up than down on the NYSE yesterday and 2200 more up than down there today, while volume today
was significantly lower today than yesterday on both the NYSE and NASDAQ. The rally will likely
have trouble between the 21-day ma at 8382 and the 50-day ma at 8500. That is expected
resistance. Just above that is the resistance of the apex of the right shoulder. The apex of the
right shoulder is the key pivot point in patterns like this. The head and shoulders pattern will
be considered aborted if the DJI surpasses the apex of the right shoulder and the resistance line
at 8607. A failure by the DJI this week to either surpass 8607 or make a new low below 8100 would
weaken the pattern's significance. For now, the rally has to be considered a recovery bounce. Such
a rally can recover 1/3 to 1/2 of what was lost from the head of the pattern. On this basis, a 50%
recovery would take the DJI back to about 8484.
The most bullish aspect about the market now is the rising NYSE A/D Line. I take its pattern
to be an ascending triangle. It did not make a new low when the S10 signal took place. This is rare for
S10s and argues against a decline of more than 10%, if there is a reversal. The improving Inverted
MKDS will be researched on tonight and a link to the report will be here. Presently, it is still
bearishly below its 21-day ma. One question to answer is how bullish is it when the the Inv. MKDS does move
above its 21-day ma.
The Closing Power Lines for the DIA, SPY, QQQQ and IWM are still locked into
relatively narrow trading ranges. Until there is a clear breakout or breakdown, I think it
is best to just wait. Our Stocks' Hotline is quite hedged right now. The history of the Closing
Power Percent and the DIA since 1999 will be finished tonight and highlight such cases of
Closing Power breakouts/breakdowns from tight ranges. Please see the report here a little
later tonight.
BEARISH SEASONALITY
Seasonality is bearish for the next month. Since 1965 the DJI is more likley to decline
than rise for this period.
Probability of a Rally Avg DJIA Gain
--------------------------------- --------------------
33% after the next 5 trading days. - 0.5%
44% after the next 10 trading days. - 0.4%
42% after the next 21-trading. - 0.3%
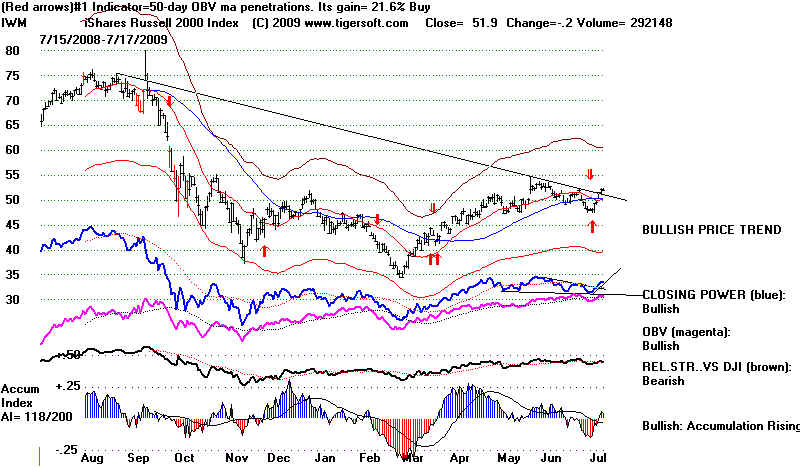
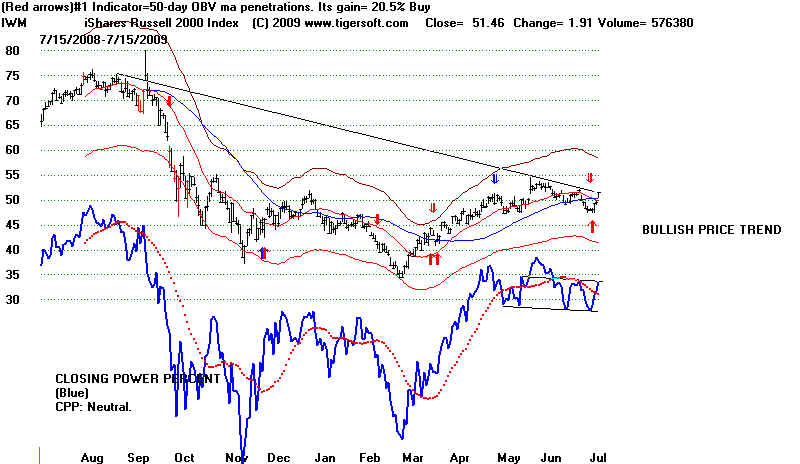
WATCH HOW IWM BEHAVES AT 50-51,
One helpful clue tomorrow - about whether this will be a bigger move or there will be a reversal
back downwards - may come from IWM, the ETF for the Russell-2000. It closed at 49.55.
Its resistance line crosses at 51.10. We will post some stocks to Buy on our Stocks' Hotline
if such a breakout does take place.
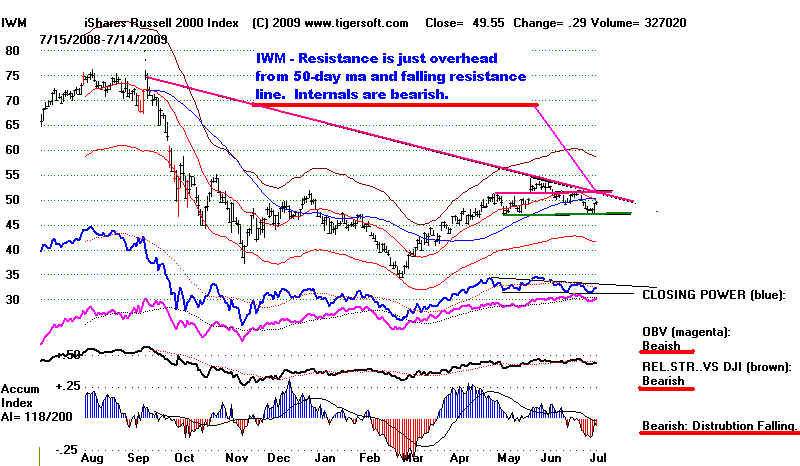
IWM's CLOSING POWER IS STILL STUCK IN TRADING RANGE.
=====================================================================================
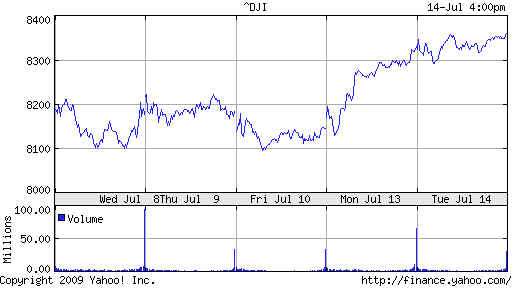
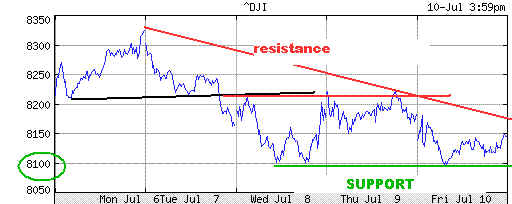
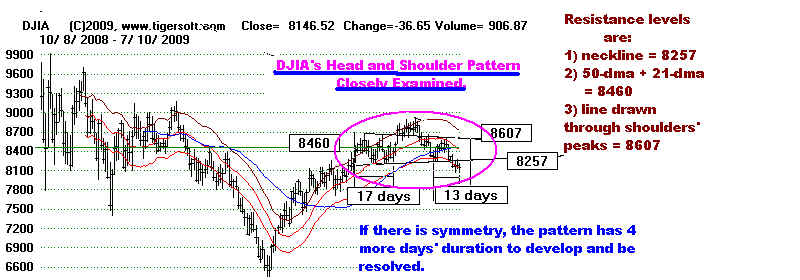
7/13/2009 Today, the DJI broke its short-term 5-day downtrend and has recovered back above its
neckline. I have dropped off earlier data to let the recent head and shoulders' pattern be seen
better. The rally will likely have trouble at the point where the 50-day ma and 21-day ma nest at 8460.
Just above that is the resistance of the apex of the right shoulder. The head and shoulders pattern
would be aborted if the DJI surpasses the resistance line at 8607. The left shoulder took 17 trading
days to form. Symmetry in a classic H&S pattern here would require 3 more trading days for the
right shoulder to form. Thus, a failure by the DJI this week to either surpass 8607 or make a new
low below 8100 would weaken the pattern's significance. For now, the rally has to be considered
a recovery bounce. Such a rally can recover 1/3 to 1/2 of what was lost from the head of the pattern.
On this basis, a 50% recovery would take the DJI back to about 8475. A 33% recovery would
cause this rally to reverse at about 8320. A failure of the pattern not to be resolved this week or
a move past 8600 should get us to consider the DJI to be in an expanded trading range. Then unless
Peerless gives a new signal, we should play the trend of the Closing Powers. Usually, unless
breadth is very good, when a right shoulder in these patterns is exceeded, prices do go to a new high,
but the bearish significance of the pattern is not removed from the market and a more substantial
decline then follows. On the other hand, if breadth is very good, a bull market follows, as shorts
are forced to cover on strength.
Could the rally today have been better predicted? The 5-day chart shows that a new low could not
be made below 8100 early Monday. Seeing that, traders bought. Secondly, the Cumulative Inverted
MKDS Index's rising status deserved more attention. That does often lead to a short-term rally.
More study is needed of this indicator and will have to be presented here. But note that the
Cum. Inverted MKDS is still below its falling 21-day ma, so the rally may be brief... See the chart
of the DJI below. Thirdly, the NYSE A/D Line did not make a confirming new low, even
for a month, on the day of the S10. In all but one case of the 16 head and shoulders' S10s, such
an A/D low was made. But in the other exceptional case, the DJI fall straight-away down, but only 7%.
See Head and Shoulders S10 .
Review of the DIA, SPY, QQQQ, IWM, NASDAQ and commodities forces me to believe that
we just do not have enough evidence to Buy. A reversal in the next two days would strongly suggest
the bounce today was a temporary recovery and the next big move will be down. Volume was very low
on the rally today. Both Opening and Closing Powers are falling for the DIA, QQQQ and SPY. The
intermediate-term notices on the right-side of the Tiger charts are predominately "Bearish". There is
considerable risk if the Closing Powers do break below the horizontal necklines in the DIA and SPY
charts further below. I am working on a review you can see of all the DIA and Closing Power charts
since 1999. More rules are set out there for use of the Closing Power. These are in addition to the ones
set out a few days ago. One thing I would like to mention: When the Closing Power is just below its
falling 21-day ma, it is probably better to wait for a move by it above that mvg. avg, rather than trust
a very marginal breakout above the Closing Power downtrendline.
Just below, the TigerSoft chart of a sample of 300 low priced stocks shows distribution and
a falling A/D Line. But prices did stop declining at their 65-day ma. TigerSoft's Chinese stocks (below)
also are holding above their 65-day ma. The NASDAQ also turned up above its 50-day ma. And
Goldman Sachs' earnings should give cause for celebration in the financial sector. These earnings
have been priced into the stock's rise and it is now at the 150 resistance.
Take a look at this piece of information forwarded me by DC, my first customer in San Diego,
back in August 1982. http://www.cnbc.com/id/31852906
TigerSoft Index of Low-Priced Stocks
See Chart of NASDAQ. It reached and is falling back from its 50% retracement level.
Volume on today's rally was very low. The NASDAQ did rise above its 50-day ma.
Inflation is not the problem now. Declining Commodities suggest DEFLATION and
UNDER-CONSUMPTION, despite or (maybe) BECAUSE of TRILLION DOLLAR
SUBSIDIES of the very BANKS WHO CREATED THIS MESS.
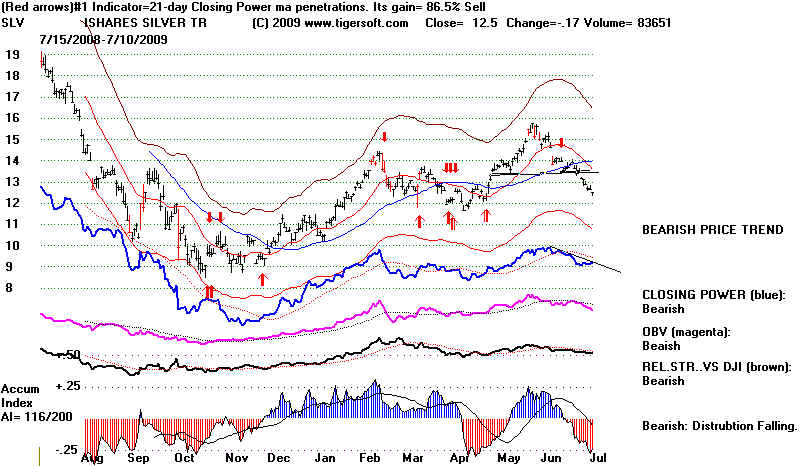
See falling charts of USO, GLD, SLV, CORN, SOYBEANS and WHEAT
====================================================================================
7/12/2009
The DJI is now below the neckline in the current head and shoulders pattern. A minimum downside
target of 7650 is set up. A 4% rally backup to the resistance of the falling 21-day and 50-day
mvg. avgs. cannot be precluded as a possibility, but the history of these Sell S10s (see below)
makes the odds of this 1 in 7. With volume so low, the odds probably should be doubled. But
the Closing Power for the ETFs is declining and the Accumulation Index is quite negative, at -12.
Watch breadth, the daily advances minus declines. A new low by the A/D Line would confirm
the breakdown. On our stocks' hotline, we still hold a hand ful of long positions, but the preponderance
are shorts.
UNDER-CONSUMPTION and DEFLATION
ARE NOW THE KEY CONCERNS AGAIN
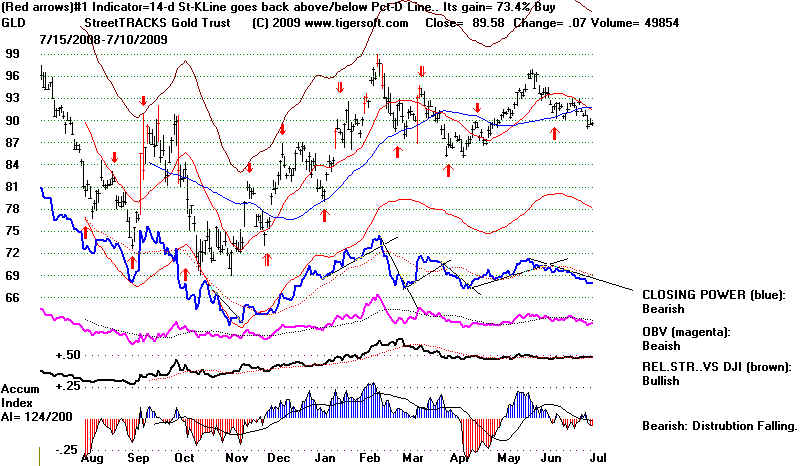
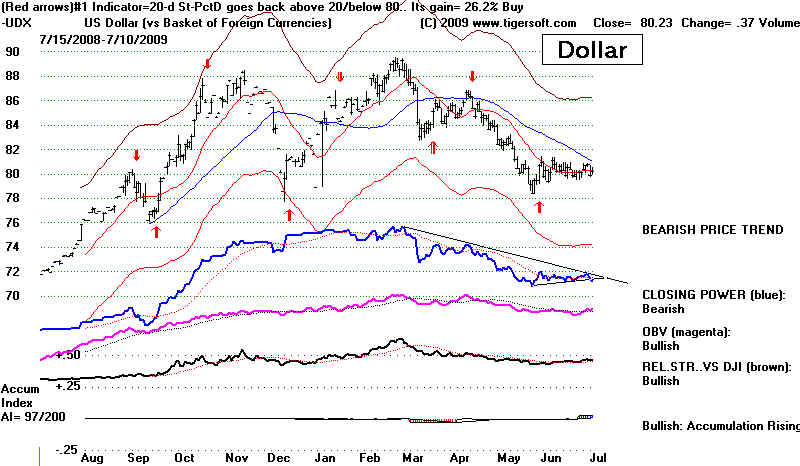
The US Dollar is below its blue 50-day ma and the Closing Power and Accum Index
are both bearishly downtrending and negative.
7/9/2009
The NYSE A/D Line is testing its earlier low. A breaking of its June low would confirm that
the NYSE A/D Line is downtrending. Today, though, it improved even as the DJI
ran into resistance at the neckline in the head and shoulders pattern. That neckline
crosses at about 8220.
===============================================================
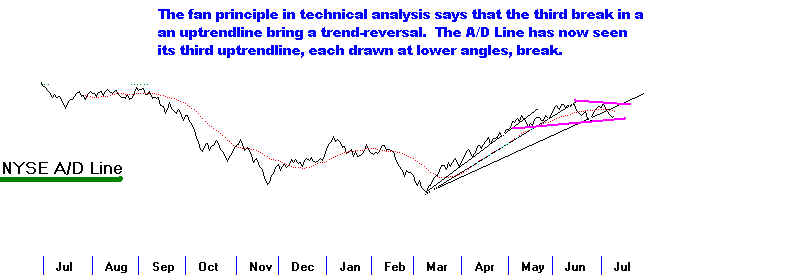
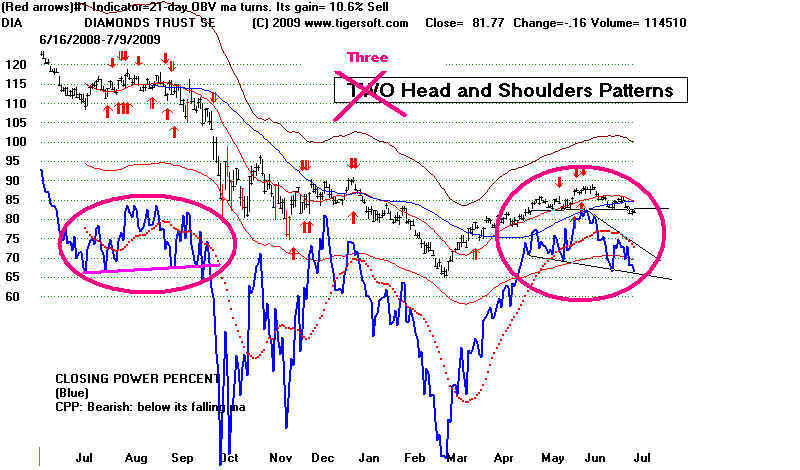
7/9/2009 The Closing Power head and shoulders should be of concern to longs. This is
a reliably bearish top pattern. Its occurrence in the key Closing Power is even more bearish.
Much strength after the opening is needed to break the Closing Power downtrend and abort its
bearish head and shoulders pattern.
|
7/9/2009 Closing Power Trendline Suggestions:
CP Trend-breaks can whipsaw, but overall they will keep you
profitably in tune with the trend. Flat CP support lines and
flat CP resistance lines that have been three times tested
are more important when penetrated than diagonal lines that
are two times tested lines.
Head and shoulders CP necklines when violated are believed
to be even more bearish. See DIA CP last fall.
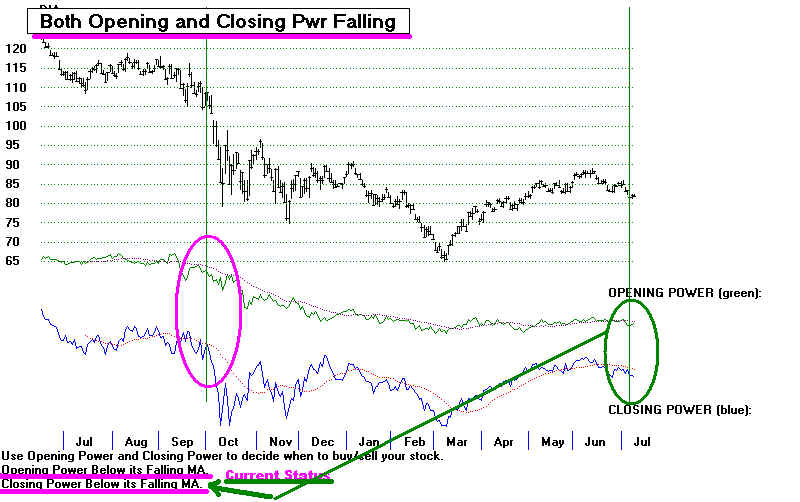
Watch Opening Power. When it and CP are rated "falling",
it is a more bearish situation than when CP is falling and
Opening Power is rising. See DIA last fall. That is its current
status.
Example - A Closing Power resistance line going through three
peaks offers important resistance. When this line is overcome.
a good Buy is usually presented.
____________/(!) - breakout
/\ /\ /\ /
/ \ / \ / \/
\/ \/ \
Example - A Closing Power support line going through four
bottoms offers even more important support. When this line
is overcome, significant weakness usually follows.
____________
/\ /\ /\
/ \ / \ / \ /\
\/ \/ \ \/ \
\(!) - breakdown
\
When the CP Line falls significantly away from a shallower
trendline and sets up a steeper angle, use the steeper CP
line to watch for trend-breaks. Do the same with rising trends.
Raise the trendline so it is steeper and goes through the
most recent bottoms.
\ _
\ / \
\/ \/\
\ /(!)- breakout above steeper downtrendline.
\ /
\/
----------------------------------------------------------------------------------------------------------------------------
7/8/2009
Sell S10 - Neckline in Well-Tested Head and Shoulders Pattern
Has Been Violated. 7750 Is Minimum Target. See also tables in 7/7/2009
There were 960 more down than up on the NYSE despite the DJI's slight rally. The many
head and shoulders patterns in foreign ETFs makes the DJI's pattern's bearishness more credible.
These patterns are reliably bearish.
How serious is the Sell S10? There were 15 earlier cases of Sell S10 when there was a
head and shoulders pattern and the DJI was not down more than 10%. In 14 of 15 the DJI fell
more than 5%. In 8 of the 16 cases the DJI fell more than 10% in the following 6 months.
Will there be much of a rebound?
In 10 of 15 cases there is a rebound before the big decline develops. But waiting for a rebound
is risky. In the five cases there was no rebound, prices swooned badly. When down-day volume
does not pick up on the break of the neckline by much, there is more likely to be a rebound.
Only in two cases, 1946 and 1971, was the a recovery rally of about 5% from where the Sell S10
occurred.
Many other countries' ETFs also head and shoulders patterns. This shows the DJIA is not an
exception. The NASDAQ and QQQQ look stronger. But a very weak market will effect them
adversely. Also note from our tables below that the absence of an S9 or S12 does not preclude
a serious decline. Look at the cases of 1956 and 1962 for example.
Here are the cases gain of the 15 earlier cases. Click on the links to see their charts.
This should help you see what the market is up against.
Charts Rebound Rally? Earlier Sell?
1. 9/26/1930 213.30 DJI fell to 157.5 on 12/16/30 No S9/S12
(There were two Head and Shoulder patterns in previous three months)
Decline is more than 10%
2 5/10/1940 144.80 DJI fell to 111.80 in a month... No None
(Head and Shoulders Pattern.)
Decline is more than 10%
3. 1/29/1941 126.00 DJI fell to 115.50 on 4/20/40 Yes - rally to 124.60 Earlier Sell S10
(Head and Shoulders Pattern.)
4. 10/7/1941 124.40 DJI fell to 93.90 on 4/27/42 No None
(Head and Shoulders Pattern.)
Decline is more than 10%
5 7/23/1946 195.20 DJI fell to 163.10 on 10/19/1946 Yes - rally to 204.00 None
(Head and Shoulders Pattern.)
Decline is more than 10%
6. 4/11/1947 173.40 DJI fell to 163.60 on 5/20/1947 Yes - rally to 174.20 None
(Head and Shoulders Pattern.)
7. 1/4/1948 177.40 DJI fell to 165.40 on 3/16/1948 Yes...rally to 173.90 Earlier S10
(Head and Shoulders Pattern.)
8. 9/10/1952 271.70 DJI fell to 263.10 on 10/22/1950 Yes .. rally to 272.40 Earlier S1
(Head and Shoulders Pattern.) Closed out with a 1.7% gain.
9. 1/5/1962 714.80 DJI fell to 535.70 on 6/26/62 Yes ... rally to 722.30 None
(Also S10 1/17/61 at 697.40)
(Head and Shoulders pattern.)
Decline is more than 10%
10. 4/9/1962 692.90 DJI fell to to 535.70 on 6/26/62 Yes ... rally to 694.60 None
(Head and Shoulders pattern.)
Decline is more than 10%
11. 6/21/71 876.53 DJI fell to 797.97 on 11/23/71 Yes...rally to 920.93 Earlier S9
(A clear head and shoulders pattern.)
12 1/7/78 793.49 DJI fell to743.33 on 3/1/1978 None None
(Continuation Head and shoulders Pattern.)
13 3/7/80 820.56 DJI fell to 759.13 on 4/21/79 None Earlier S9/S12/S15
(A Head and Shoulders Pattern).
14. 7/6/1981 949.30 DJI fell to 824.01 on 9/25/81 Yes...rally to 952.91 Earlier S12/S15
(Head and Shoulders Pattern).
Decline is more than 10%
15. 8/4/98 9195.47 DJI fell to 7539.07 on 8/31/98. Yes .. rally to 8714.65 Earlier S9/S12
(Head and Shoulders Pattern).
Decline is more than 10%
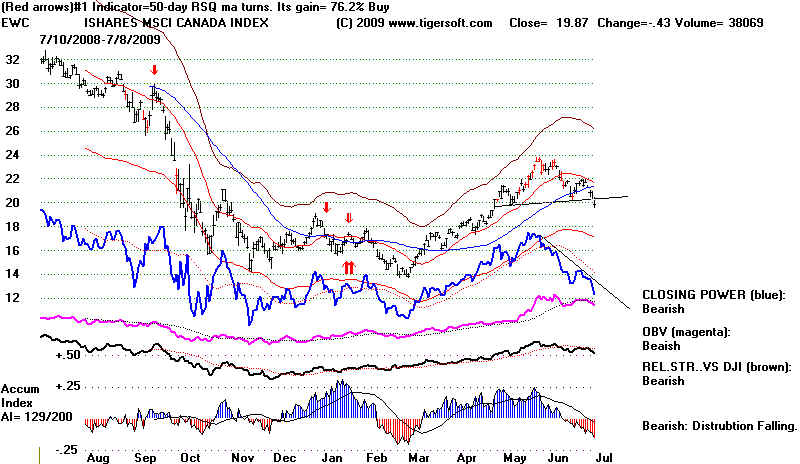
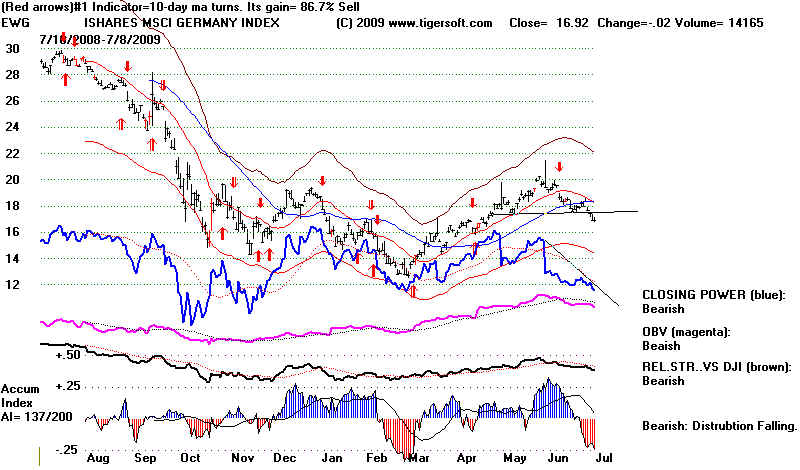
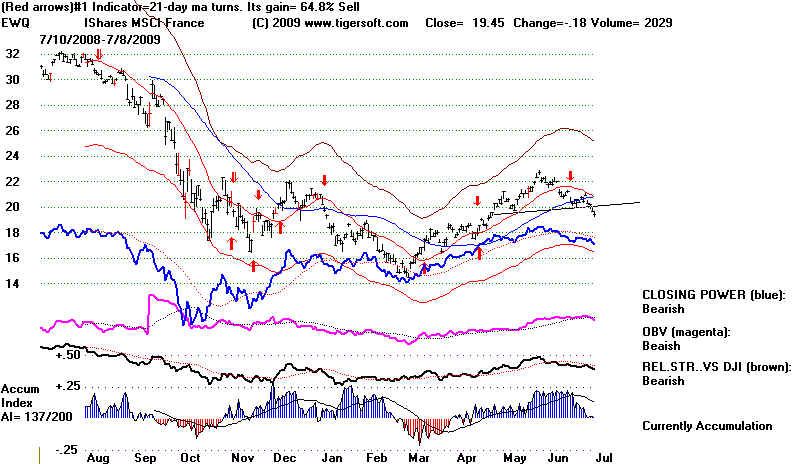
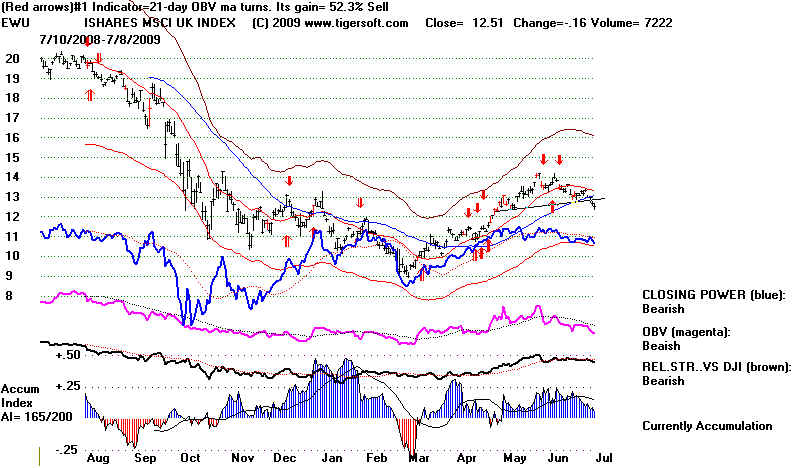
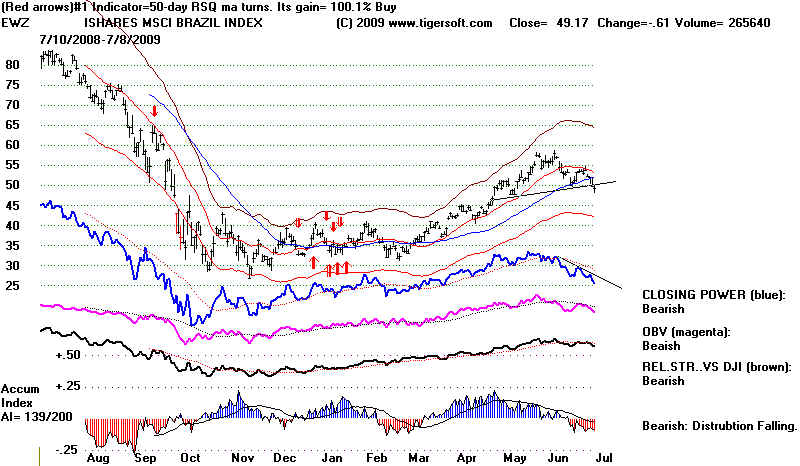
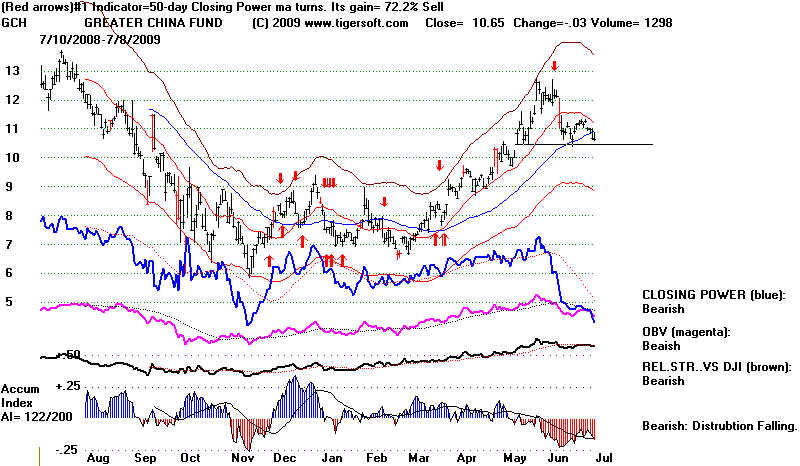
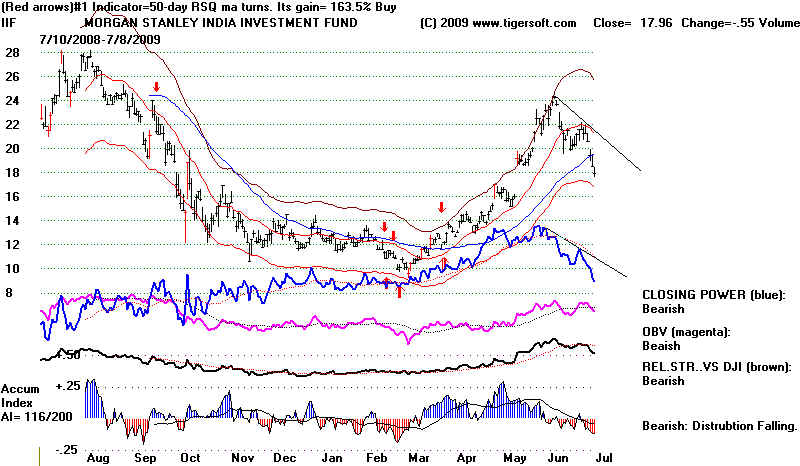
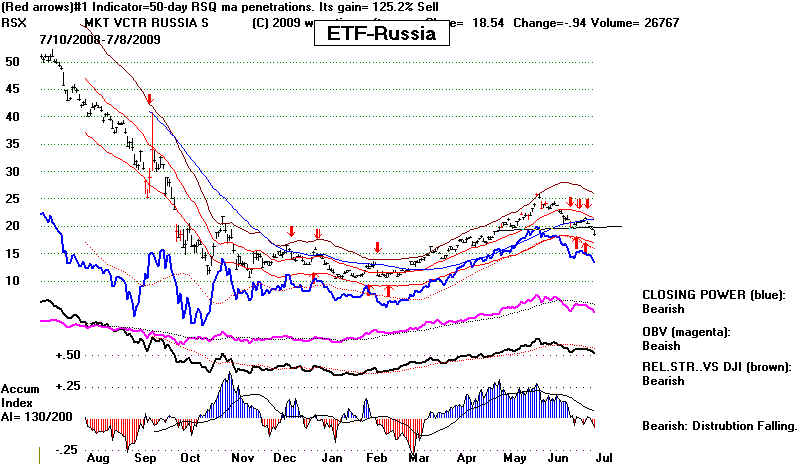
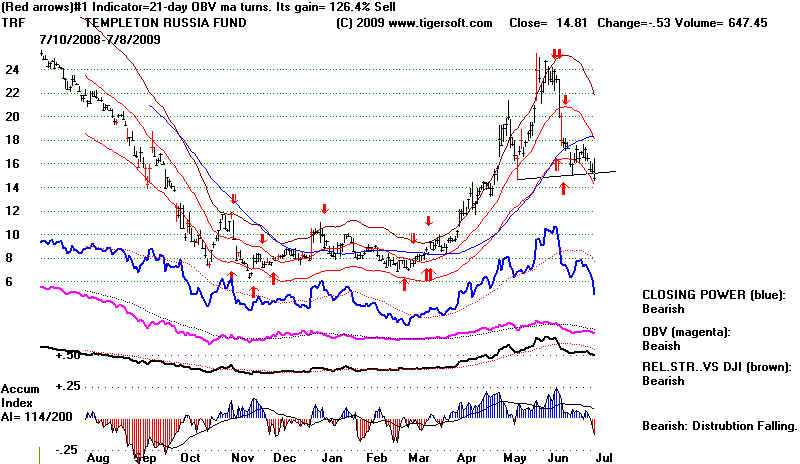
7/8/2009 TIGER INDEX OF FOREIGN ETFS
ALSO SHOWS A HEAD AND SHOULDER PATTERN.
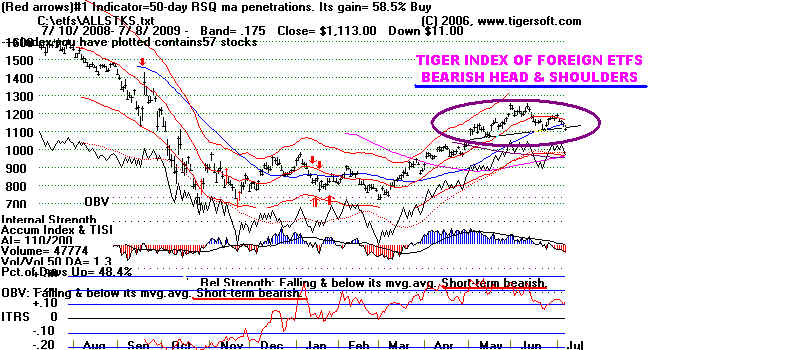
CANADA - Completed Head and Shoulders Pattern
GERMANY - Completed Head and Shoulders Pattern
FRANCE - Completed Head and Shoulders Pattern
GREAT BRITAIN - Completed Head and Shoulders Pattern
BRAZIL - Completed Head and Shoulders Pattern
CHINA - Shows An Emerging Head and Shoulders Pattern
Watch this pattern closely.
INDIA - Down-Sloping Completed Head and Shoulders Pattern
LATIN AMERICA - Completed Head and Shoulders Pattern
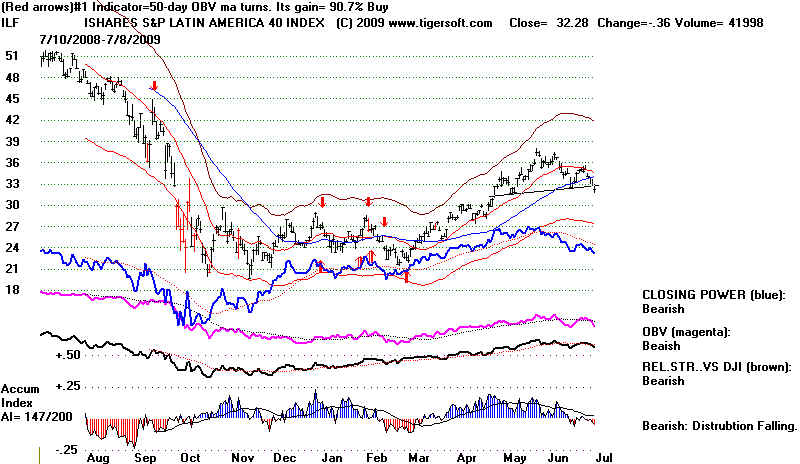
RUSSIA - Completed Head and Shoulders Pattern
USO GLD SLV - Downtrending Closing Powers.
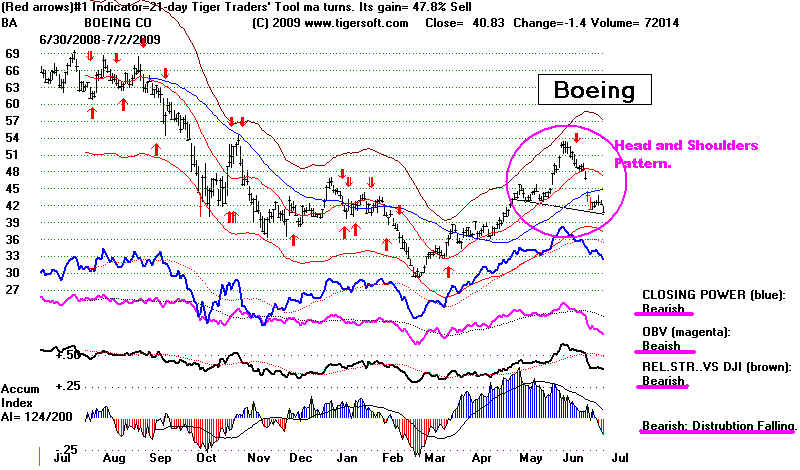
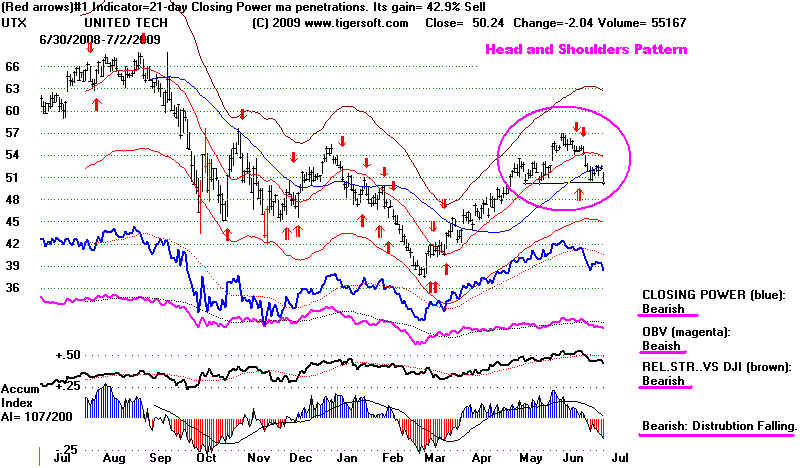
Bearish head and shoulders patterns: IBM, BA, BDK, UTX, NOC
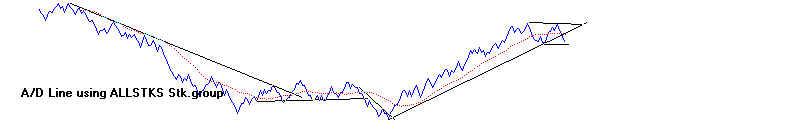
TigerSoft Low-Price Index.
===================================================================================
7/7/2009 The DJI fell and closed below 8200 for a judged S10, based on the break in the neckline.
New Peerless software will be posted on the Elite Stock Professional page tomorrow
for downloading. It produces the Sell S10 automatically.
This new Sell S10 occurs when there is a closing break in a horizontal support line going
back 40 days that has been tested more than 4 time by a decline to within 1% of it. The support
line is not necessarily the neckline in a head and shoulders pattern. These patterns are not
readily recognized by the computer. The Tiger user will have to spot them. Lots of examples
have been posted at the links I have previously posted.
The Sell S10 also requires that the Accumulation Index be lower than -.10; the P-Indicator
must be below -50 and the OPct must be below -.10. Sell S10s should not be allowed if the DJI
is already down more than 9% from the highest closing in the pattern. You can see the need for this
rule in the second table posted below. I emphasize that Sell S10s can occur when there is no head
and shoulders patterns. Traders should look at the pattern that preceeds the S10 to see if there
is such a pattern. The S10 is much more reliably bearish when there is a head and shoulders
pattern. Without a head and shoulders pattern, S10s are much more risky when the DJI is near
all-time high territory.
There were 15 earlier cases of Sell S10 when there was a head and shoulders pattern and the
DJI was not down more than 10%. In 14 of 15 the DJI fell more than 5%. In 8 of the 16
cases the DJI fell more than 10% in the following 6 months/ That should get our attention now.
In 10 of 15 cases there is a rebound before the big decline develops. But waiting for a rebound
is risky. In the five cases there was no rebound, prices swooned badly. When down-day volume
does not pick up on the break of the neckline by much, there is more likely to be a rebound.
Only in two cases, 1946 and 1971, was the a recovery rally of about 5% from where the Sell S10
occurred.
Below are the cases.
Sell S10s: 1928-2009: A Head and Shoulders Was Present.
These S10s Meet The Parameters That Set off The Current Case.
Blue shows what would have been a profitable short trade of more than 5%.
Black shows what would have been a profitable trade, but at less than 5%.
Red shows that the DJI did not decline more than 5% before rallying more than 10%
Decline is more than 10%
1. 9/26/1930 213.30 DJI fell to 157.5 on 12/16/30 No S9/S12
(There were two Head and Shoulder patterns in previous three months)
Decline is more than 10%
2 5/10/1940 144.80 DJI fell to 111.80 in a month... No None
(Head and Shoulders Pattern.)
Decline is more than 10%
3. 1/29/1941 126.00 DJI fell to 115.50 on 4/20/40 Yes - rally to 124.60 Earlier Sell S10
(Head and Shoulders Pattern.)
4. 10/7/1941 124.40 DJI fell to 93.90 on 4/27/42 No None
(Head and Shoulders Pattern.)
Decline is more than 10%
5 7/23/1946 195.20 DJI fell to 163.10 on 10/19/1946 Yes - rally to 204.00 None
(Head and Shoulders Pattern.)
Decline is more than 10%
6. 4/11/1947 173.40 DJI fell to 163.60 on 5/20/1947 Yes - rally to 174.20 None
(Head and Shoulders Pattern.)
7. 1/4/1948 177.40 DJI fell to 165.40 on 3/16/1948 Yes...rally to 173.90 Earlier S10
(Head and Shoulders Pattern.)
8. 9/10/1952 271.70 DJI fell to 263.10 on 10/22/1950 Yes .. rally to 272.40 Earlier S1
(Head and Shoulders Pattern.) Closed out with a 1.7% gain.
9. 1/5/1962 714.80 DJI fell to 535.70 on 6/26/62 Yes ... rally to 722.30 None
(Also S10 1/17/61 at 697.40)
(Head and Shoulders pattern.)
Decline is more than 10%
10. 4/9/1962 692.90 DJI fell to to 535.70 on 6/26/62 Yes ... rally to 694.60 None
(Head and Shoulders pattern.)
Decline is more than 10%
11. 6/21/71 876.53 DJI fell to 797.97 on 11/23/71 Yes...rally to 920.93 Earlier S9
(A clear head and shoulders pattern.)
12 1/7/78 793.49 DJI fell to743.33 on 3/1/1978 None None
(Continuation Head and shoulders Pattern.)
13 3/7/80 820.56 DJI fell to 759.13 on 4/21/79 None Earlier S9/S12/S15
(A Head and Shoulders Pattern).
14. 7/6/1981 949.30 DJI fell to 824.01 on 9/25/81 Yes...rally to 952.91 Earlier S12/S15
(Head and Shoulders Pattern).
Decline is more than 10%
15. 8/4/98 9195.47 DJI fell to 7539.07 on 8/31/98. Yes .. rally to 8714.65 Earlier S9/S12
(Head and Shoulders Pattern).
Decline is more than 10%
16. 7/7/2009 8163.60 DJI Trade is open. Earlier Sell S8
A reflex recovery often occurs when the minimum downside objective has been reached.
In many cases, the DJI goes much lower than the minimum downside objective.
|
Sell S10s: 1928-2009: These S10s Meet The Parameters That Set off The Current Case. Blue shows what would have been a profitable short trade of more than 5%. Black shows what would have been a profitable trade, but at less than 5%. Red shows that the DJI did not decline more than 5% before rallying more than 10% Date Outcome for DJI Recovery Rally? Previous Peerless Sells 1. 9/26/1930 213.30 DJI fell to 157.5 on 12/16/30 No S9/S12 (There were two Head and Shoulder patterns in previous three months) 2. 10/16/1933 90.50 DJI fell to 86.60. rallied to 101.90 Yes S9/S12 (There was no Head and Shoulders Pattern.) 3, 5/10/1940 144.80 DJI fell to 111.80 in a month... No None (Head and Shoulders Pattern.) 4. 12/19/1940 128.80 DJI fell to 115.50 on 4/20/40 Yes - rally to 133.60 None (There was no Head and Shoulders Pattern.) 5 1/29/1941 126.00 DJI fell to 115.50 on 4/20/40 Yes - rally to 124.60 Earlier Sell S10 (Head and Shoulders Pattern.) 6 10/7/1941 124.40 DJI fell to 93.90 on 4/27/42 No None (Head and Shoulders Pattern.) 7. 11/5/1943 135.50 DJI fell to 129.60 on 11/30/43 No None (Head and Shoulders Pattern.) This was closed out profitably. Gain =+2.1% 8. 7/23/1946 195.20 DJI fell to 163.10 on 10/19/1946 Yes - rally to 204.00 None (Head and Shoulders Pattern.) 9. 4/11/1947 173.40 DJI fell to 163.60 on 5/20/1947 Yes - rally to 174.20 None (Head and Shoulders Pattern.) 10. 12/5/1947 176.10 DJI fell to 165.40 on 3/16/1948 Yes - rally to 181.20 Earlier S4 (There was no Head and Shoulders Pattern.) 11. 1/4/1948 177.40 DJI fell to 165.40 on 3/16/1948 Yes...rally to 173.90 Earlier S10 (Head and Shoulders Pattern.) 12. 7/11/1950 204.80 fell to 197.50 on 7/13/1950 ... Yes...rally to 231.20... Earlier S10 (Head and Shoulders Pattern.) (This was already down 228.20-204.80, more than 10% from high)... 13. 9/10/1952 271.70 DJI fell to 263.10 on 10/22/1950 Yes .. rally to 272.40 Earlier S1 (Head and Shoulders Pattern.) Closed out with a 1.7% gain. 14. 4/23/53 270.70 DJI fell to 262.90 on 6/16/1953 Yes...rally to 278.80 None (This was not a Head and Shoulders pattern...) Closed out with a 2.7% gain. 15 8/14/67 485.90 DJI fell to 419.90 on 10/22/1957 Yes.. rally to 486.10 Earlier S9 (This was not a Head and Shoulders pattern.) 16. 1/20/60 643.50 DJI fell to 599.60 on 5/2/60 None Earlier S9/S15 (Also an S10 on 1/25/1960 at 639.00) (This was not a Head and Shoulders pattern.) 17. 7/21/60 616.60 DJI fell to 566 on 10/25/60 Yes... rally to 637.10 Earlier S9/S12 (This was not a Head and Shoulders pattern.) 18. 9/19/60 586.70 DJI fell to 566.00 on 10/25/60 Yes...rally to 596.50 Earlier S1/S2 (Earlier there had been a single Head and SHoulders pattern, but this was not one.) Short sale on DJI closed out with 1.5% gain, 19. 1/5/1962 714.80 DJI fell to 535.70 on 6/26/62 Yes ... rally to 722.30 None (Also S10 1/17/61 at 697.40) (Head and Shoulders pattern.) 20. 4/9/1962 692.90 DJI fell to to 535.70 on 6/26/62 Yes ... rally to 694.60 None | (Head and Shoulders pattern.) 21. 7/6/1964 802.50 This was low. Immediate rally to new highs. (This was not a head and shoulders pattern.) 22. 6/24/1965 857.70 DJI fell to 840.60 on 6/28.65 This was the decine's bottom Earlier S8 DJI was already down 939.60-857.70 from high. More than 8% and near an all-time high. (This was not a head and shoulders pattern.) 23. 3/1/1966 938.19 DJI fell to 864.14 on 5/17/66 Yes ... rally to 954.73 Earlier S4/S12 (Not a head and shoulders pattern.) 24. 6/11/1969 904.60 DJI fell to 801.96 on 7/29/60 None Earlier S8/S9 (Not a head and shoulders pattern.) 25. 12/3/69 793.36 DJI fell to 631.16 on 5/26/70 Yes...rally to 811.31 Earlier S12 (Not a head and shoulders pattern.) 26 4/27/69 735.10 DJI fell to 631.16 on 5/26/70 None Earlier S9/S15 (Not a head and shoulders pattern.) 27. 6/21/71 876.53 DJI fell to 797.97 on 11/23/71 Yes...rally to 920.93 Earlier S9 (A clear head and shoulders pattern.) 28. 8/4/1971 904.13 DJI fell to 797.97 on 11/23/71 Yes ...rally to 920.93 Earlier S9 (Not a head and shoulders) 29. 2/26/73 953 Simultaneous B17 DJI fell to 851.90 on 8/22/73 Yes...rally to 979.98 Earlier S9/S12 (Not a head and shoulders) 30. 4/25/74 827.68 DJi fell to 584.56 on 10/4/1974 Yes... rally to 852.08 Earlier S9/S12 (Not a head and shoulders) 31. 8/20/1975 793.26 DJI fell to 784.16 on 10.1.1975 Yes...rally to 827.75 Earlier S8 Already down 878.99-793.26, 10% from high) (Not a head and shoulders pattern.) 32 1/7/78 793.49 DJI fell to743.33 on 3/1/1978 None None (Continuation Head and shoulders Pattern.) 33. 10/27/78 806.5 DJI fell only to 785.26 on 11/14/79 None Earlier S9/S12 (Not a head and shoulders pattern.) (DJI was already down more than 10% from recent high. 34. 10/19/79 814.68 DJI fell only to 796.67 on 11/7/79 None Earlier S9 (Not a head and shoulders pattern.) (DJI was already down more than 10% from recent high. 35. 3/7/80 820.56 DJI fell to 759.13 on 4/21/79 None Earlier S9/S12/S15 (A Head and Shoulders Pattern). 36. 7/6/1981 949.30 DJI fell to 824.01 on 9/25/81 Yes...rally to 952.91 Earlier S12/S15 (A Head and Shoulders Pattern). 37. 5/28/82 819.54 DJI fell to 777,21 on 8/11/82 Yes .. rally to 832 Earlier S9 (No Head and Shoulders Pattern.) 38. 11/22/94 3834.44 DJI fell only to 3674.63 on 11/23/94 and rebounded. No Earlier S9 (No Head and Shoulders Pattern) 39. 6/15/98 8627.93 DJI fell only to 8665.29 on 6/16/98 and rebounded to 9337.97 Earlier S15 (No Head and Shoulders Pattern) 40. 8/4/98 9195.47 DJI fell to 7539.07 on 8/31/98. Yes .. rally to 8714.65 Earlier S9/S12 (Head and Shoulders Pattern). 41. 9/23/99 10318.58 DJI fell to 10116.28 on 10/18/99 Yes...rally to 10648.17 Earlier S9/S12 (No Head and Shoulders Pattern) 42 1/24/05 10368.61 DJI fell to 10012.36 on 4/20/05 Yes...rally to 10936.88 None (No Head and Shoulders Pattern) 43. 4/14/2005 10278.75 DJI fell DJI fell to 10012.36 on 4/20/05 Yes...rally to 10640.91 Eariier S15 (No Head and Shoulders Pattern) 44. 6/13/2006 10706.14 This was bottom Earlier Sell S9 (Head and Shoulders Pattern) (Close to all-time high.) 45. 7/7/2009 8163.60 DJI Trade is open. Earlier Sell S8 |
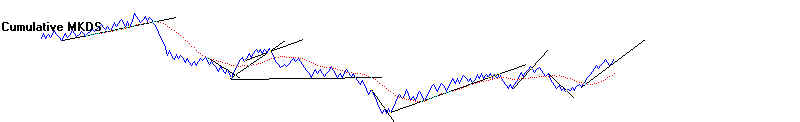
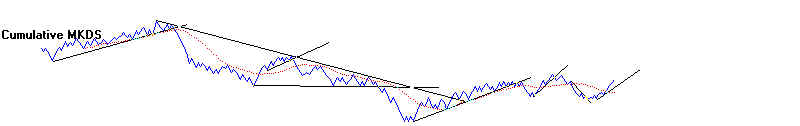
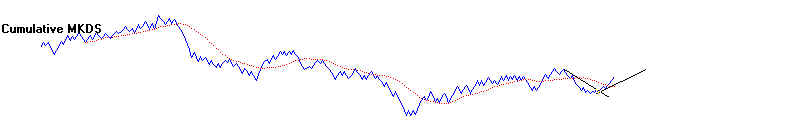
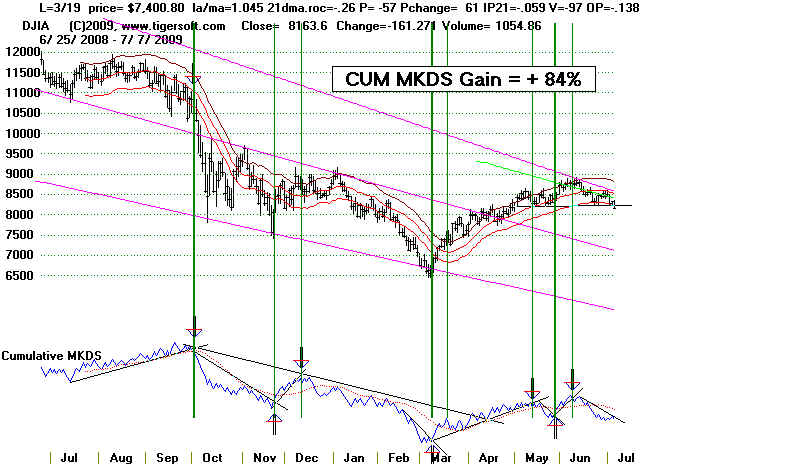
Cumulative MKDS and Its Trend
Changes
Cum. MKDS Is Still Declining
The Inverted MKDS represents the relationship between advancing and declining stocks and the volume in these
advancing and declining issues
on the NYSE. If there's more volume in advancing stocks,
the inverted MKDS
is greater than 1.0; but if there's more volume in declining stocks, it's below 1.0. TigerSoft's Peerless
program
includes the cumulative Inverted MKDS. Richard Arms of Albuquerque is credited with
popularizing the reciprocal.
soon after the data started being posted in Barrons in 1965, but many traders, including
myself, were doing it
long before they heard of Arms. It's not unlike bands a fixed percent below the
21-day ma. I was the first
person to publish analyses based on what was a pretty simple concept, but I have never
tried to insist that
all bands should be declared to be "Tiger-Bands". So, I do not mention
Arms in my work.
Tiger Index of Low Priced Stocks
==================================================================================
7/6/2009
Buy B5 but note the Bearish
Head and Shoulders. As emphasized here
frequently, this is potentially a reliable reversal formation, especially when volume and
internal
strength indicators weaken noticeably on its right shoulder. A close below the
neckline
at 8200 would complete the pattern and bring either a Sell S10. That's what we have
to
be on guard for. Until then, the operative Peerless signal is a Buy. There are
perhaps ten
cases since 1915 when the DJI started to form such a pattern, but it was never completed
and prices resumed their uptrend. See how the pattern usually aborts and what
predicts
its failure. http://www.tigersoft.com/Tiger-Blogs/July-6-2009/index.html
The best way to
judge that this is happening is to watch the P-Indicator and Accumulation Index, which we
would expect to be or turn positive again, and/or prices, which will move past the apex
of the right shoulder, here about 8600.
Note that all the internal strength indicators are now negative. Today's low volume
rally
from the opening low keeps the Closing Powers uptrends alive in all the general market
ETFs.
My opinion is that the rally would be more convincing if the price pattern did not look
like
such a classic head and shoulders case. I am also concerned about the excessive
rises in
many low priced stocks in the last 12 weeks. DDRX is the most extreme case that I'm
aware
of this Spring; it rocketed up from less than .40 to 24.0 in 3 months. This is a
60-fold increase.
If this is not dangerously "sloppy" buying, than nothing is.
Unfortunately, this reminds me
of the way unknown oil stocks with 2 or 3 employees, roared upwards a year ago in
frenzied
over-speculation, right before the general market crashed.
Another two weeks of
sidewise action in the DJI between 8200 and 8600 would
be in keeping with the symmetry of such classic head and shoulders patterns. Watch
the
NYSE A/D Line for good clues. The NYSE A/D Line is still uptrending, but today,
though
the DJIA and SP-500 rose, there were 600 more down than up.
7/2/2009 Will The Head And
Shoulders Pattern Be Completed in The DJI? Watch Closely.
The Buy B5 Will Be Reversed by A Sell S10 if The DJI Closes Below 8200.
The Honeymoon Bounce May Be Over.
VP Biden's statement that the Administration under-estimated how fast unemploy-
ment would rise is not going to build much investors' confidence. And if the White
House can't
get a better grasp of what's going on with the economy, why should anyone trust his next
simulative efforts? Keynes was probably right. But the Administration
keeps twisting
its polices to serve its friends. It is going to have a very difficult task going
forward
pushing for truly needed public works programs - like bullet trains, new energy
projects, re-forestation, clean waters, de-salinization, public encouragement for more
people to enter nursing and a developing a domestic educational Peace Corps for the
poorest areas
of the country.
Talk will not do it. The honeymoon is ending. Even the media may conceivably
become more critical of him The belief that Obama's people only end up
rewarding and
repaying their closest political friends, like they have Wall Street bankers, is taking
hold.
And we who live California now see that the State of California will be issuing IOUs,
rather
than checks, and that Bank of America will be glad to cash these IOUs and charge the
State 3.5%. Obama seems incapable of direct solution. There is no Emergency
Fund
for States with an interest rate of .5%. Instead the banks get this. He has
taken taxpayer money
and bailed out Bank of America, so that the Bank will be able to loan us back our money
at 3.5%. In the same convoluted way, Obama plans to allow polluters with deep
pockets
to keep polluting the air we breathe for a fee. (This sure seems like a new national
patronage system, such as we might have found in a city with a long tradition of
political corruption. ) Under Obama's deviously corrupt plan, big polluters
can defile our
air and water if they buy "Pollution Rights" through agents of the Government
like Goldman Sachs. It would be so much easier to simply say "NO"to dirty
air and
water, and then put people to work inventing, building and installing Air-Scrubbers or
whatever is needed. Why should Goldman Sachs get any profit from it? So, Obama
is losing confidence. And that is what is needed. The honeymoon has
ended. Why
should the stock market rally any further. The biggest gainers are ripe for
profit-taking.
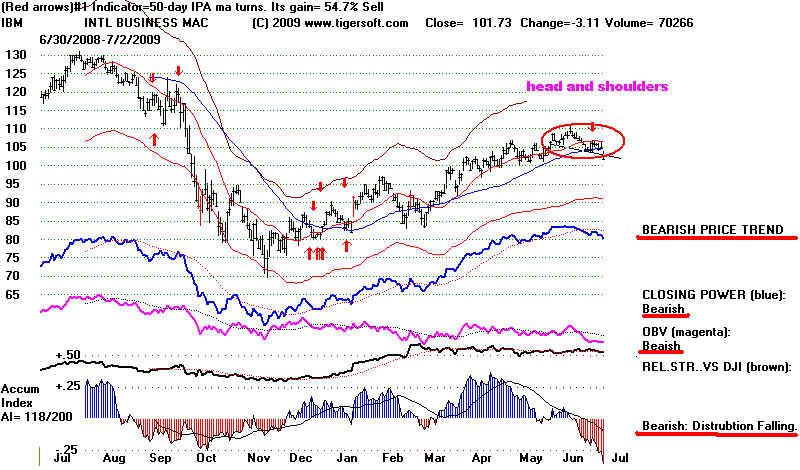
And a number of DJI stocks like IBM have ended their uptrends.
The real problem, of course, is that American consumers are tapped out. The bearish
chart of VISA, complete with a head and shoulders patter, demonstrates this. The breaking
of the neckline would complete the pattern.
In the same way that corporate executive have taken for themselves, rather than let
workers or even shareholders properly benefit, the lion's share of the productivity gains
for last twnty years, Wall Street companies like Goldman Sachs have defrauded and
stolen the savings of the American middle Class by pumping and dumping, in turn, internet
stocks, mortgages and commodities. Exageration? Rread the article in the
current issue
of The Rolling Stone by Matt Taibbi. See
http://www.rollingstone.com/politics/story/28816321/the_great_american_bubble_machine
The result is that wealth is, at least, as unevenly distributed as it was in 1928 and
1929. And even
after a 40% decline, the DJI is still up more than twice what it was in 1929 compared to
what its was 25 years earlier.
Weak Internals Are Very Evident in Many DJI Stocks.
Too many of the DJI-30 stocks are showing weak internals. IBM, BA and UTX
each look like good short sales, in that they have broken their 50-day ma with confirming
internal weakness. These are high priced DJI-30 stocks and will so exercise
that much
more influence on the DJI-30. Also showing very weak internals in the DJIA are
AXP,
CAT, CSCO, CVX,
DD, DIS, GE,
HD, JPM, PG
and TRV.
The Buy B5 Will Be Reversed by A Sell S10
if The DJI Closes Below 8200.
The last Peerless signal is a Buy B5 but a closing by the DJI below its neckline
at 8200 will bring either a judged or an automatic Sell S10, depending on the
numbers. I spent
a considerable time this weekend going back over past head and shoulders patterns since
1915. The data will be posted tomorrow. The charts have already been put up
for your
examination. See Head and shoulders
patterns since 1915.
For now, note that the conclusion I reached is that completed head and shoulders
patterns, where there is a close clearly below the neckline, produce far too many big
declines
to ignore, especially when the DJIA's volume steadily subsides during the formation of the
pattern,
as has happened since May, and when the Accumulation Index and OBV-PCT are
negative,
as they are now in the formation of the pattern's right shoulder. Very good
breadth
will help save some stocks, the NASDAQ and the QQQQ for a while longer, but
the lesson
of 1977, in particular, was that the DJI can lead the rest of the market into
a bear market.
So, a completed head and shoulder pattern in the DJI with the P-Indicator negative
must
be heeded. It is slightly positive now.
It's also true that the Closing Power and NYSE A/D Lines now are still uptrending.
So, there is hope that the decline this Thursday before a 3 day weekend was an aberration
and occurred without the full participation of all the market's participants. That
could
bring a rebound early in the day. But will the Closing be weak? A lot of
traders who
depend upon seasonality may have bought Wednesday in hopes of a typically good
pre-July 4th advance. If there is no recovery, they will be trapped unless they
sell.
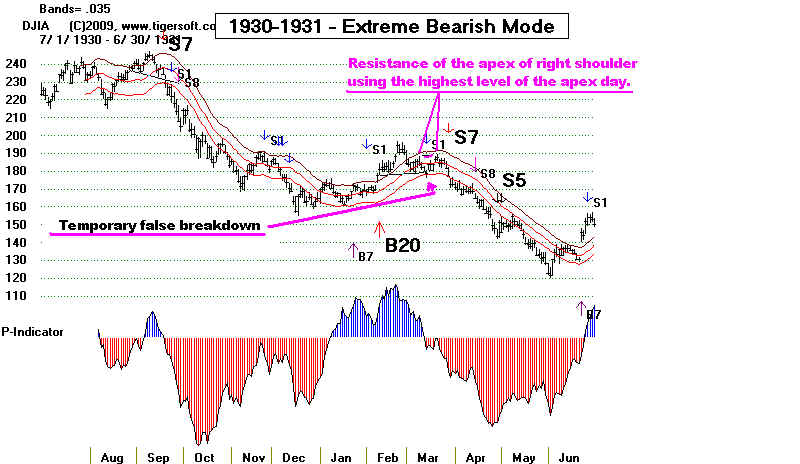
Typically, there first is a break in the NYSE A/D Line uptrend before a DJI
head and shoulders pattern is completed. That was true in each of the five head and
shoulders patterns, for example, in the scary period 1930. Then as now, many market
players
thought the DJI has reached a bottom in that year. The appearance of head and
shoulders
patterns was a dire warning in 1930, as the DJI lost 60% of its value after 1930 by the
time it
bottomed at 42 in July 1932. So, we can surmise that the downside risks will
loom up
again in investors' minds and the selling will pick up again if there is a clear break in
the
neckline of the head and shoulders pattern we see now in the DJI, with a closing below
8200.
Such a break would set up a minimum downside target that is 500 points (the height
of the DJI's pattern) below the neckline, or 7750.
Five Head and Shoulder Patterns in the DJI in 1930
The A/D Line Uptrend in Each Was First Violated.
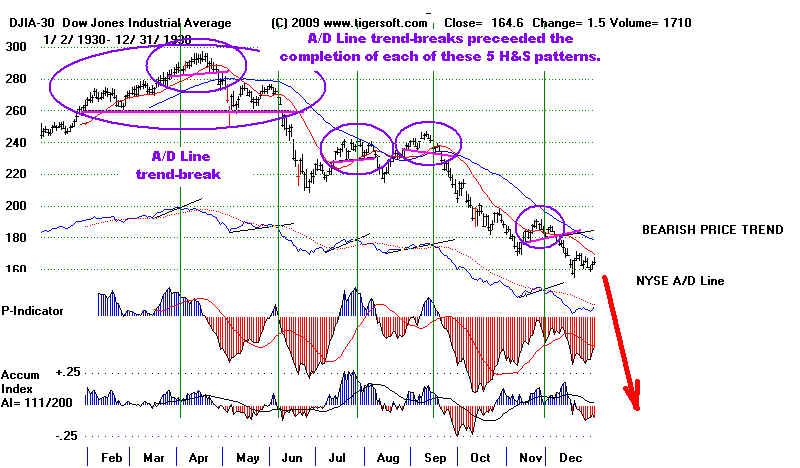
7/1/2009 Buy B5 ... Resistance Levels Are
Being Challenged
It's true that what was Accumulation has now turned to Distribution, judging
from our Accumulation Index now being clearly negative. This is typical of a head
shoulders pattern. But the day just before the July 4th weekend rallies more
than 70% of the time. A move above the H&S apexes of the SPY and DIA coupled
with breaks in the 12 month down-trendlines of the QQQQ and IWM under the
normally bullish influence of trading just before July 4th may cause a short-term
jump in prices. Look also at how often markets take off after prices exceed the
resistance of the apex of right shoulders in these patterns.
The resistance of the downtrending A/D Line for speculative low priced stocks
has also been reached. The operative Buy B5 and rising Closing Powers suggest
an upside breakout. Even if it does not occur, the head and shoulders pattern will
still
not be bearishly completed until the necklines' supports are taken out.
Many high accumulation low priced stocks seem indifferent to the resistance
levels the averages are approaching. Look at how strong are BORL,
GPX, ATSI,
DRCO, TRCR, HWKN,
AIXG, BKYF, CRAY,
LAD and STEC.
Surely, it is bullish that the market can rally when the biggest state in the Union
cannot pay its bills and when so many low priced stocks can double and double again
in 4 months without Wall Steet heralding or hawking them to private investors.
The NYSE A/D
Line now is still uptrending. Typically, there first is a break in the
NYSE A/D Line uptrend before a DJI head and shoulders pattern is completed.
That was true in each of the five head and shoulders patterns, for example, in the period
1930.
================================================================================
6/30/2009 Buy B5 and pre-July 4th Bullish Seasonality
versus
Bearish DJIA's and SP-500's Head and Shoulders Pattern
and
Low volume and Manipulative program
The next ten trading days have been up 63% of the time since 1965. That is
statistically
significant. Anything above 56% is worth noting. Bullish also is the still
rising
NYSE A/D Line. Most completed head and shoulder patterns show weaker breadth,
where the head in the pattern is not accompanied by a confirming NYSE A/D Line. In
our
case the A/D Line is stronger, not weaker, than the DJI. Until the A/D Line uptrend
is violated, we are safe.
The big concern is low volume on rallies in the last 16 trading days and on the right
shoulder of the head and shoulders pattern. This is a classic characteristic of a
valid
pattern. This pattern is not recognizable by any computer algorithm I can write.
So, we just have to be on the alert. The negative readings from the Accumulation
Index
are important confirmations that the pattern is, in fact, developing. The good news
is that
a head and shoulders pattern appears in relatively few stocks now. Normally, we
would
see more such patterns at a top. Here are more stocks with such patterns. It will be
bearish
if they complete their pattern.
How much of the rally is a result of artificial program trading
with taxpayer provided
TARP bailout money by companies like Goldman Sachs? Computer program trading
has certainly gotten more sophisticated and takes in many more stocks than before.
How extensively Goldman's trading now is can be gleaned from earlier statistics showing
that Goldman was by far the biggest program trader, nearly always trading for its
own account and constituted as much as 74% of the entire trading volume on the
NASDAQ
for one week two months ago. Significantly, Goldman has leaned on the NYSE to stop
revealing this information. It is too incriminating! The
Zero Hedge Blog writes:
"The NYSE has taken action to make sure that nobody will henceforth be
able
to keep track of the complete dominance that Goldman Sachs exerts over the New York Stock
Exchange. This basically ends our weekly Program Trading updates disclosed every Thursday
indicating that Goldman has single-handedly captured all of NYSE's program trading. ..This is a
travesty, as well as a complete obliteration and a mockery of the move for transparency
that the Administration, Regulators and Exchanges have been posturing they support.
We advise all readers to contact the provided staff on the memorandum and voice your
incredulity
with this brazen move to completely obfuscate Goldman's behind-the-scenes take over the
world's
biggest stock exchange. Robert Airo, Senior Vice President, NYSE
Euronext at (212) 656-5663 or
Aleksandra Radakovic, Vice President, NYSE Regulation at (212) 656-4144
Goldman
Sachs has a long history of flagrantly manipulating markets, according
the lengthy, well-written and carefully researched article in the current Rolling Stone.
He
counts four major bubbles that they created to fleece retail traders and investors:
1929 Bubble, Internet Bubble, Housing
Bubble and Oil Bubble
Without any prompting, I reached the same conclusion last year as Paulson allowed his old
firm to transform itself in a blink into a commercial bank, so that it could get their
hands on a
TARP handout. Paulson, of course, was the ex-CEO of GS. Shamelssly, as Secty
of Treasury,
he refused to save Lehman Brothers, the primary competitor of Goldman but then
rescued AIG so that they could pay $13 billion to Goldman, all at taxpayers'
expense.
I will write a summary of Matt Taibbi's many charges in a day or two, but it would be
good to read
the original source. 1 year is only $14.97. By the way, Goldman
has hardly replied.
==================================================================================
6/29/2009 Buy B5
but Note The Bearish Head and Shoulders Pattern
When a head and shoulders pattern appears, it gives us
useful trading
points to watch: the apex of the right shoulder and the neckline. In addition, we
should watch the volume and the internal strength indicators. If the pattern is
to be acompleted and a new bearish reversal of trend is to occur, certain technical
signs usually are present. Use a checklist like this:
1) Is Volume MA waning on the right shoulder? DJI now -
Yes
2) Is the Accumulation Index near or below 0 on the right shoulder? DJI now -.024
3) Is the A/D Line falling behind price? DJI - No. It is above
its level on left shoulder
4) If the P-Indicator trending down and below zero? DJI - Yes
but +101
The current DJI rally could be reversed by a head and shoulders
pattern. That
happened in 1930, 1931, 1932, 1938, 1940, 1941, 1974 when the DJI fell more than
40%. See the charts for these years in the study I did this past weekend.
Head and shoulders patterns since 1915.
A bearish reversal could happen without a Peerless Sell, though that only took place once
before, going back to 1928, following a Buy B5. See the discusson of Buy B5s
since 1928.
The distribution process takes time. The way a head and shoulders pattern
usually works is to allow significant distribution to take place over a few weeks
on the right shoulder. Time and Price symmetry are more common than not.
The right shoulder usually is similar to the left shoulder. The left shoulder in
the DJI's current pattern lasted about a month. The right shoulder here has only
been extant 3 days, so far. On this basis, even if this is a bearish top, the
neckline
at 8100 may not be violated until early August. Knowing this, we can play the
strongest stocks a little while longer, I would think, even if a big decline lies ahead.
Usually if the market is about to reverse significantly, we see bearish head and
shoulders patterns in important
stocks, too. Not many are
now evident. There are four
developing head and shoulders patterns in key DJI and QQQQ stocks we should
probably watch watch: BA, UTX, IBM and JNPR.
Also of interest is the US Dollar. The Chinese have become more vocal calling for
a new international currency other than the Dollar. The Dollar is holding up just
above the key 80 level.
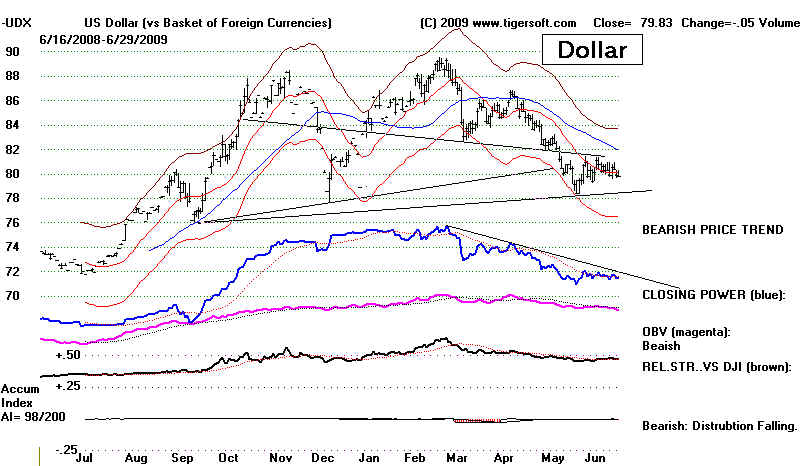
Meanwhile, hot money is busy chasing a relatively small number of
explosive super stocks, up, up and still higher. Some of these are very
over-extended.
In these cases, their rallies may continue only for one more day because of
window-dressing related buying. We have to be concerned that there is usually
a
point, where super strength becomes sloppy, careless buying. Most of the stocks
zooming upwards now do show heavy insider buying and professional sponorship.
But how much of this is a new type of program trading? The broad public is not
in the market now. If they cannot be induced to enter this market, will the program
traders be forced to dump their holdings as they did leveraged oil futures last
year?
Historically, bull market in secondary and low-priced "cats and dogs" are very
rare and last 6-7 months and then they may dry up. Here I'm thinking of
April 1968 - December 1968, the Prudhoe Bay Stocks' Boom and October 1999
- April 2000. Our Stocks' Hotline is still long many of these. The
CLosing Power
up- trend is important to watch. A break after a long run is bearish. For now,
we will
also watch the Low-Priced Stocks' A/D Line that TigerSoft's Index program builds.
It is testing its 21-day ma on a rebound.
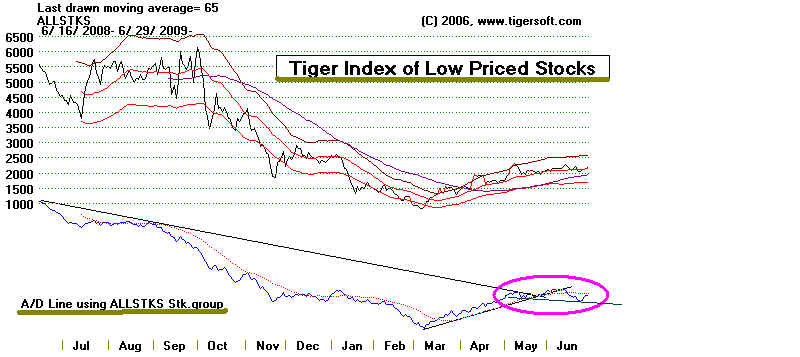
6/26/2009 A Peerless
Buy B5 is operative Peerless signal. This signal has
always eventually been profitable at the time of the next Peerless sell
signal. This weekend's TigerSoft Elite Stock Professional Report has found
a very high number of extraordinary volume Buy B12s. There is a lot of
evidence that Goldman Sachs program trading is making up a very large
proportion of all trading volume. Without fanfare, someone is buying all
the most heavily accumulated lower priced stocks with no fanfare. I am reminded
of 1968, except that then it was the small investor who was buying. Here
is an example. Transcend Medical
Transcription Services.
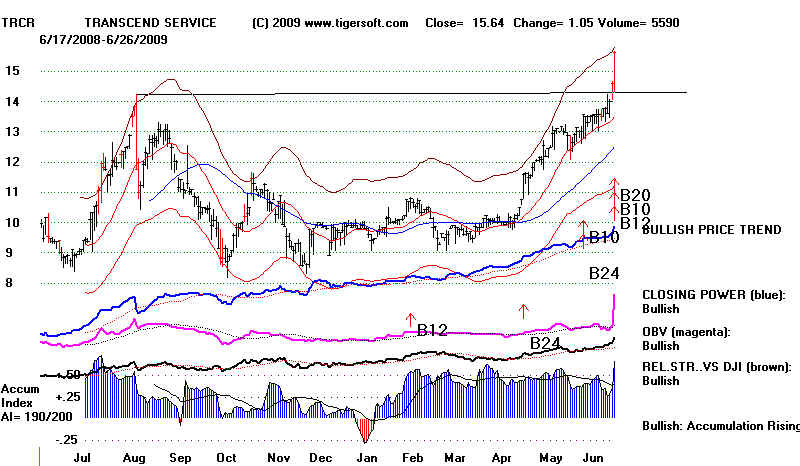
But there is one case when a
head and shoulders pattern developed
before a Peerless reversing Sell signal. Since we have a potential head
and shoulders pattern emerging with the DJI now, we will want to watch
to see how it unfolds. Selling if the neckline of the head and shoulders
pattern was violated would have worked out better than buying and holding
until the next Peerless Sell. Watch also the NYSE A/D Line. The extensive
study of head and shoulders shows the usefulness of simply getting out
when the A/D Line uptrend is broken if the head and shoulders pattern
plays out. See 1948-1949 chart below. For now look at the extensive
research I have just done on all head and
shoulders patterns since 1915.
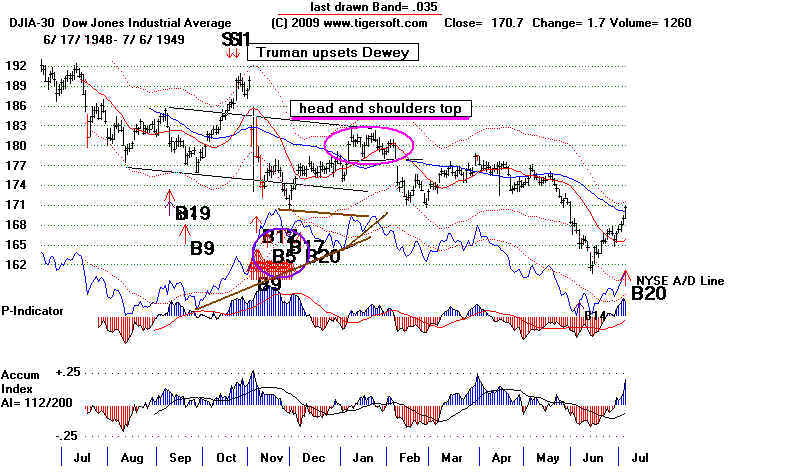
=================================================================================
6/25/2009
Volume was low.
B5s are bullish. Look for a rally to the upper
band near 9000. There may be resistance at the apex of the right
shoulder in a potential head and shoulders pattern. That apex
high is 8663. Even if a head and shoulders pattern does develop
there is usually temporal symmetry, so that a right shoulder
may last as long as 3 weeks, before we get a resolution
and either a price breakout above 8680 or a price breakdown
below the neckline, the lows just seen. DJI stocks are not
where the upside action is. Look at the lengthening list of new highs
to get ideas. Most nights you will see some of them above at the
Introductory link that that says:
11) CURRENT NYSE/NASDAQ New Highs and New
Lows. Interesting Stocks.
Some of these are getting quite extended. Find tech stocks showing lots of
accumulation with a CLosing Power making new highs ahead of price.
Some examples are EMC, MXIM and QCOM.
6/24/2009 Buy B5 Is
Operative Peerless Signal
The hot money is still going into low-priced stocks showing bulging Accumulation and
making
new highs. The sense that the Fed will guarantee the market against a worse decline
gives lots
of help to speculative stocks. In many ways, this boom in low priced stocks is the
equivalent of
the Fed induced boost to technology stocks in 1999-2000 and housing stocks from 2002-2004.
See some more examples of Explosive Super Stocks Today and read
the Blog I wrote on June 6th.
The Great 2009 Bull
Market. Why Is Wall Street Concealing The Huge Surges in
Low Priced Stocks?
I think it is very bullish for a few more months that hot money
chooses to buy low-priced
stocks rather than drive prices down by buying leveraged short ETFs. Say what you
will about
Goldman Sachs manipulating stock prices, even creating the booms and then the busts in a
very
big way. I would much rather have them buying than selling short. Read The Rolling Stone's
Goldman
Sachs: "Engineering Every Major Market Manipulation Since The Great Depression"
Compare it with the points I have been trying to make about Goldman's sinister
dominance of |
US government
economic policy making since the early 1994.
Since 1965, the DJI has risen 61.4% of the time in the 10
trading days following
June 25th. New investment money is most apt to come into the market the last few trading
days of the month and for a week after the first. With June's end comes 2nd quarter
window-dressing. That boost the strongest stocks. Low priced stocks and
technology are
not the only ones favored. Since the market turned up the six biggest gain Fidelity
Sector funds
are:
Automotive +136%
Paper-Forest +67%
Brokerage +63%
Financial +57%
Networking Infrastructure +50%
Technology +48%
Half the time in the past the DJI retreats 2% to 8% before making a significant
recovery
following a Buy B5. Waiting for the Closing Power to break its downtrendline in what
you Buy may
prove a reasonable course of action. But it also will force traders to buy on
strength. Buying
the strongest of the general market ETFs would not have put you in the weak DIA.
Unlike the
DIA, the QQQQ closed above it opening. That there were almost 3 times more stocks
rising today
than falling stock is certainly a positive sign.
The DJI was much weaker. Its first hour 100 point jump and
later 150 point fade
is clearly bearish action. Will its action continue? Who were the sellers for
the last 4 hours?
It may well be that the DJI's weakness today owed to news which will not affect the whole
financial world. Much of the weakness in the DJI-30 today owed to the 6% drop in
Boeing,
which announced serious delays in its new 787 aircraft. The second biggest loser in
the DJI
was UTX. The
Motley Fool
explains: "A whole string
of suppliers -- from Honeywell
(NYSE: HON) to United Tech (NYSE: UTX) to Spirit Aerosystems (NYSE: SPR) -- depend
on Boeing getting its act together so that they can bring parts operations up to speed.
Meanwhile,
customers such as Continental (NYSE: CAL) and AMR (NYSE:
AMR), parent company of
American Airlines, who have ordered large batches of 787s, need the plane desperately in
order
to cut their fuel costs.
A market recovery is expected. But watch to see if the leaders can get past the apex
of
. potential
right shoulders in what would become bearish head and shoulders tops if their rally
fizzles. Here are some examples of ETFs and stocks that could become bearish head and
shoulders
if
prices cannot get past the lines shown.
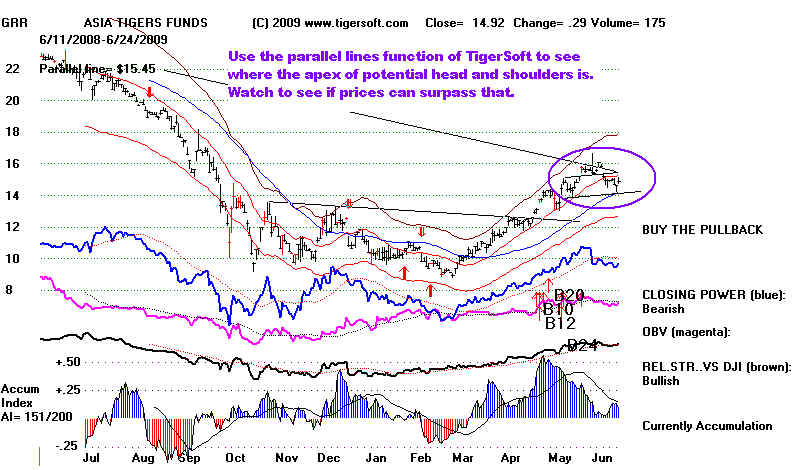
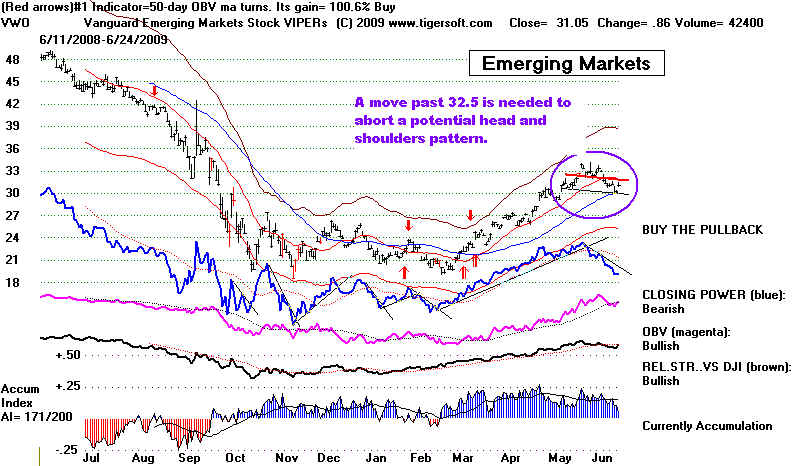
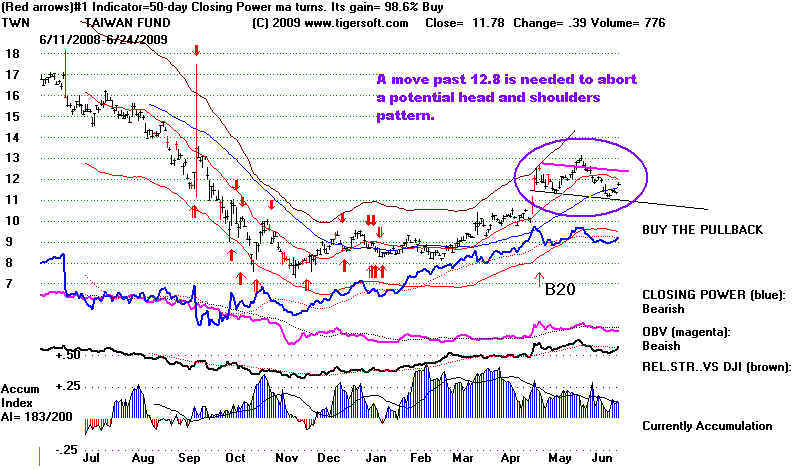
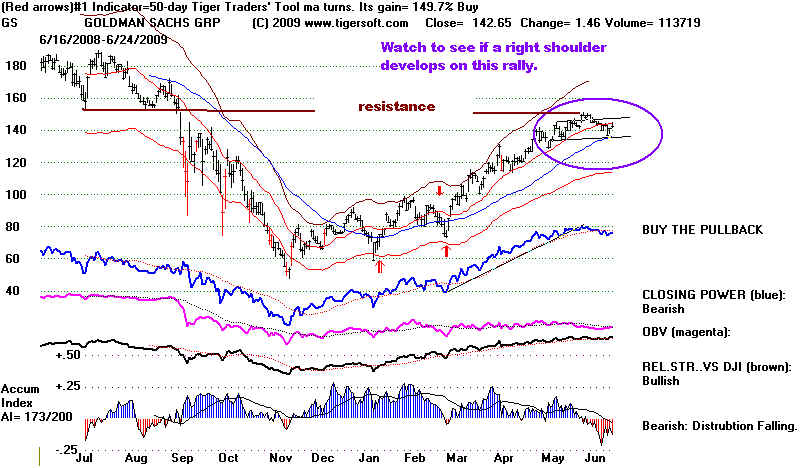
=====================================================================================
6/23/09
New Buy B5 today.
Today brought a Buy B5 on the DJIA using
Peerless. With all three key
internal strength indicators (P-, IP21, Opct)
above zero and the DJI 3.2% below
the 21-day ma, A Buy B5 is seen in these
conditions as long the market has not
shown exceptional weakness in the last 4
months. In the 9 cases of Buy B5s since
1942, there have no losses. The average gain
was 7% at the time of the next major
Peerless Sell when we look at the period
1942-2008. It is important not to
use a Buy B5 within 8 weeks of a Sell S9/Sell
S12 See Buy B5
There are two
more cases in the period 1928-1942. These can be considered a test
of the Buy B5 principle, as they were in the
period used to develop the Peerless
system. *=Not an automatic signal
using previous S9/S12 rule.
12/11/28 Gain= 6.9% Cl/ma=.958
2/15/29 Gain = 5.7% Cl/ma=.967
*4/29/30 Gain = -1.2% Cl/ma=.966 Paper Loss = 278-255)/278
This was after S9/S12 and completed head and shoulders pattern.
In 6 of the 11 earlier Buy B15s the
DJI rallied without falling more than 1%.
In one case the DJI rallied only to
start falling back, so that the paper loss
was 8% before a very good rally 6
months later. And in 4 cases the DJI fell
between 2% and 5% before rallying
strongly. A decline below 7900 would
seem to be very unlikely before the
next Peerless Sell.
Traders may want to see more evidence that a bottom has been put
in place.
After all, the downside volatility was terrible 12
months ago. Summer may remind
traders of last year! Watching for the CLosing
Power downtrends to end will help
if you choose to take this independent approach.
But you should know that
the Peerless signals are worth taking, year in and
year out. Here are the results
after 9/15/2008
ETF Winning
Gains on Initial
$10,000 Reinvested
Biggest
and
with each reversing Peerless Buy
Paper Loss
Losing
and
positions closed out on next Sell.
Trades $40.
commission and slippage allowed
for with each trade. Trades taken
at opening day following signal
===== =====
============================== =========
DIA
4 vs 2
+22.6%
-16%
SPY
5 vs 1
+32.0%
-16.2%
QQQQ 4 vs 2
+37.2%
-11.4%
IWM 5 vs 1
+61.9%
-16.5%
GOLD STOCKS' MADE BIG MOVES UP TODAY
Our report on health insurance stocks must be delayed until this weekend. Several
Gold stocks look attractive for purchase. Normally, we don't put stock picks here.
They belong on the Tiger Elite Stock Professional Service. But this shows what
we look for when Peerless gives a reversing Buy signal. Of interest here is that
the Fidelity Gold Fund (FSAGX) was the biggest gainer today among 42 its 42 Select
Industry fund. Readers will be intrigued by the fact that Gold Stocks were
among the
best performers
using Peerless Buys and Sells. All markets seem integrated
as never before to the DJIA. (The Biggest gainer today among foreign ETFs
was CEE - Central Europe.)
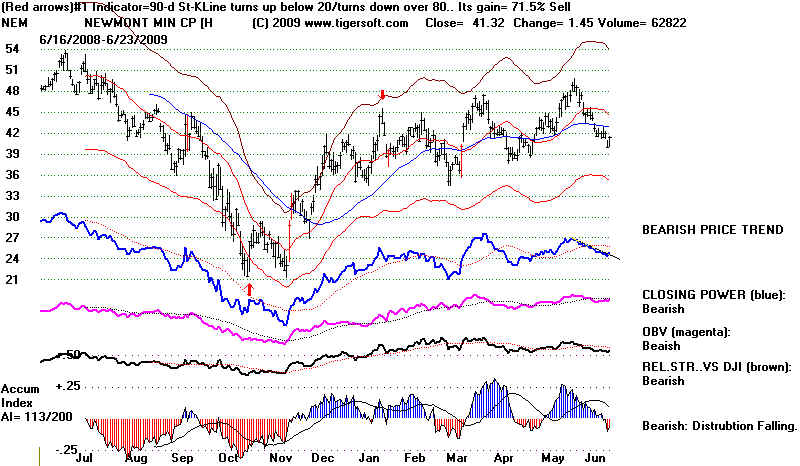
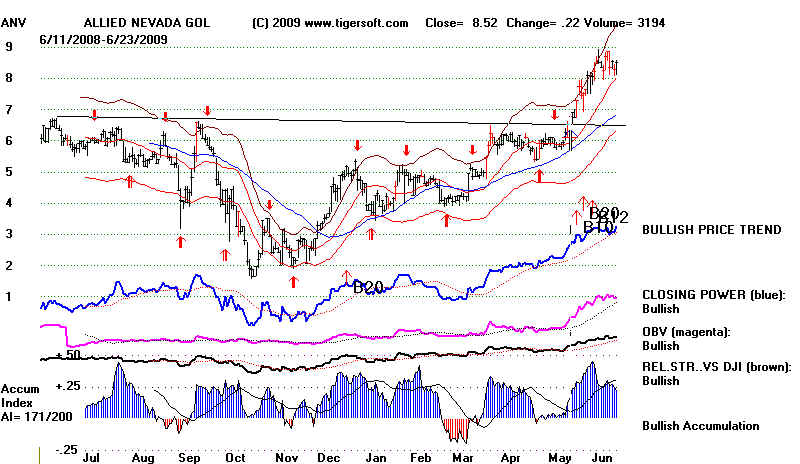
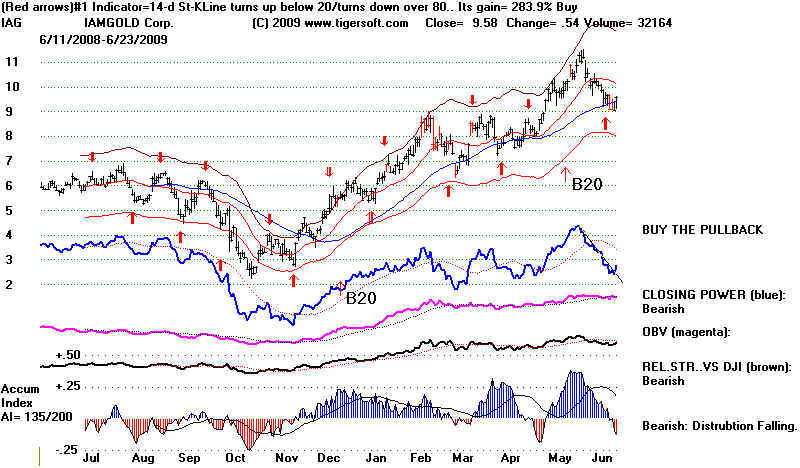
==================================================================================
6/22/2009 Sell S8 Is Still Operative.
The DJIA
has reached its lower 3.0% band. The internal strength indicators are close to
giving
a Buy B9 for this
time of the year, from April to June But they did not. The key thresholds for cases
where the
la/ma=.97 are:
1) a P-Indicator at 107 or higher;
(2) the current Accum. Index (IP21) above .005 and
(3) the V-Indicator above -70. None of these condition are true. All need to
be.
The DJI has
also retreated to the support of its rising 50-day ma. Starting bull markets usually
do not drop below this ma,
but do sometimes. Should a penetration of the 50-day ma be taken
as a reinforcing sell?
Looking back to 1915, I count 16 cases where a simple penetration of a 50-day
ma after the first rally from
a bear market led to a significant decline of at least 5% more on the
DJI. But in 25 cases,
using a 50-day ma to buy and sell would have led to a whip-saw. Better would
have been to use a two day
penetration of a 65-day ma. That would have reduced the number of
whipsaws to 17.
Where there has been shown to be extreme downside volatility. it is
better to be
occasionally whip-sawed than
stuck in a serious or growing loss for 6 months. Use a two day violation
of the 65-day ma to avoid 1/3
of the whip-saws.
In our present case, we note that the 65-day ma crosses at 8250,
about where the support of the lows
of May 15 and May
22nd are also. In addition, we would require that the Accumulation Index to be
negative and the
Closing Power be below its falling 21-day ma..
Penetrations of the 50-day ma after a recovery
rally from
what seems a bear market: 1915-2003
Whipsaw Cases using 50-day ma = 25
Whipsaw Cases using 2-day penetration of 65-day ma = 17
Declines continued after violation of 50-day ma = 16
50-day ma
May 1918 . 78
Whipsaw...fell
to a 75.60 low two weeks after violating the ma and then rallied. t
Feb 1921 75
Whipsaw..fell to 73 after breaking 50-dma and rallied to 80 and then fell
to 64.
May 1921 77
fell to 65 in August 1921 and rallied
Oct 1924 103
Whipsaw.. fell to 99 and then began bull market
Sept 1930 234
fell to 157 and began bear market rally.
March 1931 173 fell from 172 to 121 and began bear market rally.
July-August 1931 140 whip-sawed
between 133 and 143.
August 1931 140 fell to 87 and began brief bear market rally.
Nov 1931 108
fell
to 70 and began brief bear market rally.
March 1932
78 fell to 41 and then rallied strongly to 80.
October 1932 67 fell to 57 and then began brief bear market rally.
February 1933 58 fell to 50 and then began bull market
March 1933
58 Whipsaw..
decline to 56 and two weeks later started bull market by surpassing 50-dma.
January 1938 122 Whipsaw....fell to 119 and then briefly rallied above 50-dma.
March 1938 125 fell to 100 and then began new bull
market.
August 1940 122 1-day whipsaw. Using 65-dma would have
avoided this.
August 1941 125 1-day whipsaw. Using 65-dma
would have avoided this.
Sept 1941
126 1-day whipsaw.
Using 65-dma would have avoided this.
Sept 1941
126 fell to 93
in April 1942
March 1947 177 fell to 164 two months later.
Sept. 1949 178 1-day whipsaw. Using
65-dma would have avoided this
Nov 1950 235
Whipsaws for
next next two month.
Nov 1958
541 1-day whipsaw.
Using 65-dma would have avoided this
June 1961 686
whipsawed -
declined only to 680 and rallied to new high and 725
Sept 1961 703
whipsawed - declined
only to 691 and rallied to new high and 735
April 1967
842 1-day whipsaw.
Rallied to 910
Oct 1970 754
1-day whipsaw.
Rallied to 840. Using 65-dma would have avoided this
Aug 1973 892
fell to 850 and rallied
Sept 1973
891 whipsawed
Nov, 1973 919 fell to 790 in a month.
1973-1974 bear market No violations of 50-day ma for 7 months. Almost.
65-dma = better.
June 1978
825 whipsawed. fell
only to 807 and rallied to 900.
1980 mini-bear. No violations for 5 months. whipsawed
and rallied from 925 to 975.
1981-1982 bear market. 1000 whipsawed 1-day violation. rallied to 1075.
Jan 1991 2509 whipsawed fell only to 2480. and rallied strongly,
Aug 2001 8342 whipsawed fell to 7290 in six weeks.
Jan 2002 9712 whipsawed fell only to 9630 and then rallied to 10600
April 2002 10136 whipsawed to
9820 and then 10300.
May 2002 10106 fell
to 7702 in 3 months.
Sept 2002 8671 fell to 7286 in 2 months
Dec. 2002 8365 whipsawed to 9820 and then 8304 and then rallied to 8800
Jan 2003 9129 fell to 7552 in two months.
Aug 2003 9061 1-day whipsaw. Rallied. Using
65-dma would have avoided this (Also Sept and Nov)
The Dollar is
hovering just above the key 70-level. Gold and Silver's Closing Power
are stuck in narrowing triangles. Interest rates look
weak and Crude Oil has violated its
rising Closing Power. Low-Priced Stocks broke their
uptrend and their uptrending A/D Line.
Distribution is very apparent. Watch to see if they
can rally and avoid dropping to a 2 month low,
Bank stocks were weak. The Treasury Secretary says he will not let a monster
zombie bank fail.
That could, according to Roubini, cost the US taxpayer a trillion dollars. And
exactly what,
do we get for it? BAC is sitting on its rising 14 week uptrend.
Distribution and insider selling
continue. 22 of the 125 bank stocks we follow fell more than 9%,
Obama's decline in popularity is a direct threat to the big banks that are dependent
on their US Fed and Treasury benefactors. Rumor has it that Obama will not be able to get
a 75% popular public health insurance option through the plutocratic US Senate. He
has
raised expectations very high here. If he dashes these hopes, his popularity will
drop much
further. We will look at health insurance stocks tomorrow night.
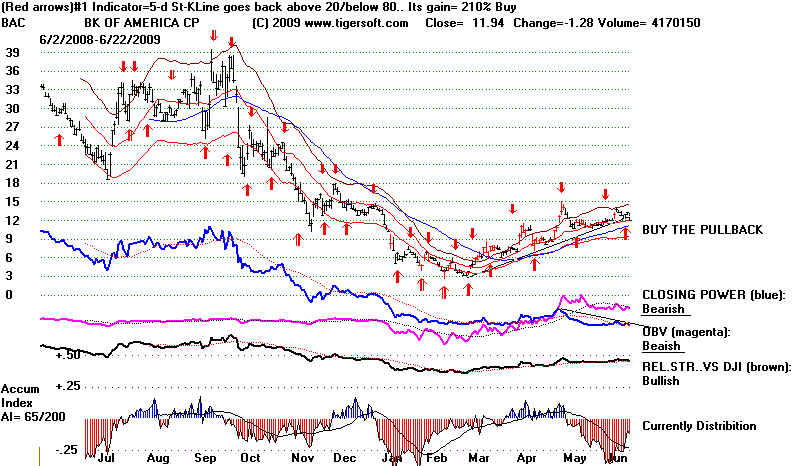
===================================================================================
6/19/2009
PEERLESS Sell S8 on DJI. But Low-Priced "Cats and Dogs"
are running. Watch the NYSE A/D Line. It is Neutral, in that
it is sitting on its 21-day ma. Monday's Have Been Reliably
Bearish for The Last Year.
A Tale of Two Very Different Markets.
Many low priced stocks are still quite strong. As a whole,
they have not had much play
since the start of the 2003-2007 bull market. As a result, now they are considered
by
Wall Street pros to be oversold and cheap, as these stocks' 2009 bull market still
has
not been announced to the public by the talking heads of CNBC AND their Closing Powers
are in pronounced uptrends, for the most part, showing professional buying. All this
suggests more upside potential, even as the DJI retreats back to its support at
8300 and, below that, 8000. Low interest rates and traditional favoritism by
Democrats
of smaller tech stocks rather than mthe mega- Blue Chips also lies behind their
up-trend.
See again: June 6, 2009
The Great 2009 Bull
Market.
Why Is Wall
Street Concealing The Huge Surges in Low Priced Stocks?
The initial 2009 Low Priced stocks' A/D Line has been violated. But greed,
being what it is, I would expect another up-wave. How often do folks get a chance
to make 200%-400% in 6 weeks? This group has started to rebound from its
rising 50-day ma. two days ago. I will be looking to buy more low priced stocks this
week
on the Stocks' Hotline.
WHEN NASDAQ OUT-PERFORMS DJI FOR MORE THAN 6 Mo.
The NASDAQ is clearly out-performing the
DJI by a wide margin, Since January 15th,
the QQQQ's percent change minus the DJI's percent change over 50 days has been
has been positive. The difference is now 6% over the last 50 trading days. The
PEERLESS
NASDAQ chart features a unique relative strength indicator, the NASDJI. Study of all
4 earlier and comparable cases shows 8 months is the longest a secondary stocks rally
lasted; that the NASDJI always stops being positive after 7 months; Peerless called 3 of
the
4 tops very well; and we should be watching for a double top or a break in the second
NYSE A/D Line uptrend. See this
study and earlier NASDAQ charts.
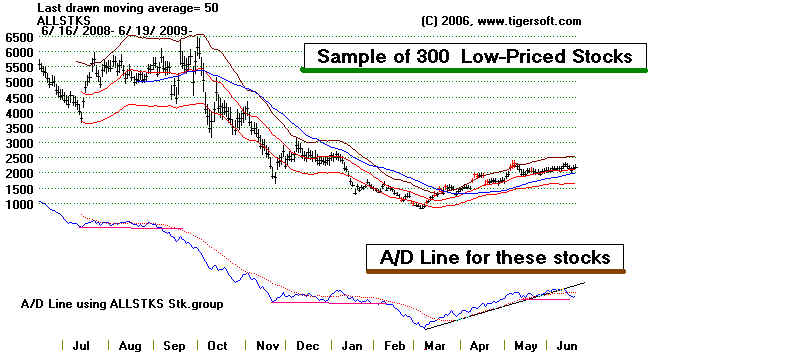
6/18/09 Sell S8.
The Sell S8 is new. It
was introduced last week. It is based on very low day-to-day volatility
for 6 consecutive days. See details below. The documentation
appeared here in the last
week. I believe it should be used as a major and reversing sell signal. especially
as the NYSE
A/D Line uptrend has confirmed the S8. In 7 of 10 cases, the Sell S8 led to a
decline of at least
8% going back to 1928 when the DJI was not near an all-time high. The parallels to
August 1932
and July 1975 seem close. Practically, this has meant on our Stocks' Hotline, we
have reduce
by 1/2 the long positions and hedged with some short sales. The rising 21-day ma
very often
does act as support. And the QQQQ's internals are all considered "Bullish"
as it tests that
suppport. The bounce we are seeing over-night will help our high accumulation longs
more
than the short positions will hurt us if there is a 1% rally in the DJI on Friday.
Monday,
has the habit of declining. Since Juine 2nd, 2008, the DIA (ETF for the DJIA) rose
55.7%
of the time on Thursday and 53.8% on Friday but only 23.9% on Monday and 47.2% on
Tuesday.
Mondays are up 34% of the time for the QQQQ.
Yesterday the DJI broke its 21-day ma and its previously four-times tested uptrend.
Only
the P-Indicator, among our key internal strength readings for it, is still
positive. Volume
bearishly picked up on the small decline yesterday and fell on today's stunted
rally. The late
sell-off today makes the bounce seem unconvincing, though breadth was positive.
Today's rally in financials and the DJI owed to Wall Street's happiness that under
the Obama-Geithner Plan there will be no independent investigation of the regulatory
failures and banking excesses that led to the world-wide financial collapse of 2007-2009.
That
will all be quickly swept under the rug. Wall Street is very pleased that it will be
the Federal
Reserve which will police banks that are "too big to fail." There will be
no enforcement
of anti-trust laws against monster banks. There will no new requirements that
bankers'
executive compensation be limited or risk-adjusted. De facto hedge funds like
Goldman Sachs
will continued to get all the privileges and benefits of a real bank. So, Goldman
(+3.3),
Bank of America (+4.9%) and JPMorgan (+4.4%) and other non-DJIA banks are celebrating.
In the end, the big bankers know that the Fed is not an independent bureaucracy.
Rather,
apart from the Chairman who is appointed by the President, the Fed is essentially run and
staffed by and for bankers. The FED did not have the courage to step on toes and
regulate
the bankers when Geithner was the head of the NY Fed, exactly when conditions most cried
out
for such independence and courage. Not surprisingly, Wall Street reasons that the
banks
will find lots of ways to keep a more powerful Fed from rocking their boat.
Political scientists
have often pointed out that a regulatory agency is soon captured by those it is supposed
to regulate. Capturing will not be necessary under the Obama-Geithner plan.
Private
banks will run the show immediately.
But the big banks are not out of the woods, yet. They may still run short of funds
if
the economy and housing prices continue to fall. It will be much harder politically
for them to get
more TARP money, though Geithner says he is the giver that has the power to keep on
giving.
Showing his loyalty to banks is undiminished, he insists he needs to no new Congressional
authority. So, Obama is now perceived by them as the banks' protector. And
57% of Americans
still approve of his actions as President. As he strives straddles to straddle an
increasingly
polarized electorate, his approval ratings will weaken and Congress will become more
resistant
to his pro-bank policies.
The central problem, of course, is that many, probably most, American consumers are
nearly tapped out. The charts of Master Card and Visa may reflect this by their confirmed breaks
below their 50-day ma. Housing stocks are turning weak again in the same way.
See HD LEN.
DJIA's SELL S8
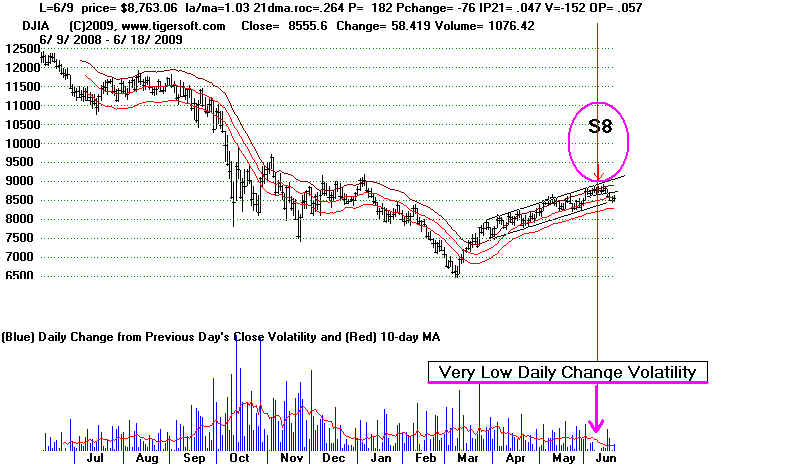
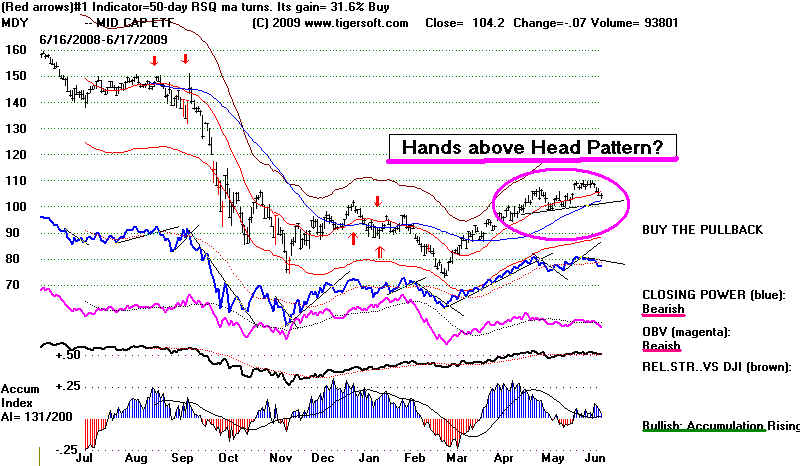
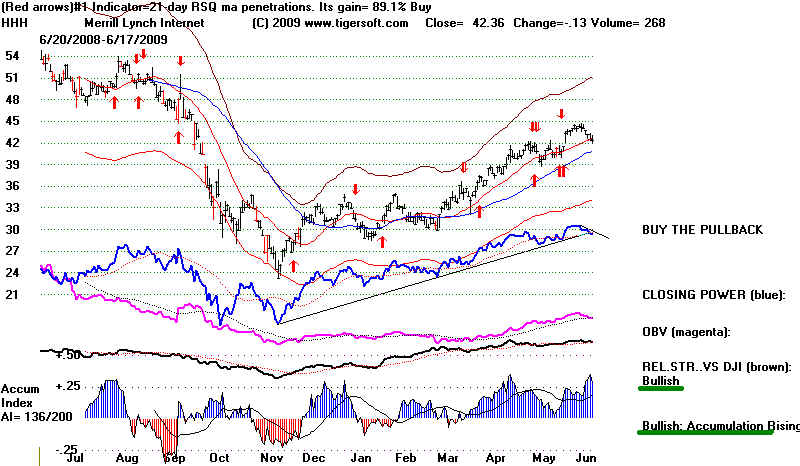
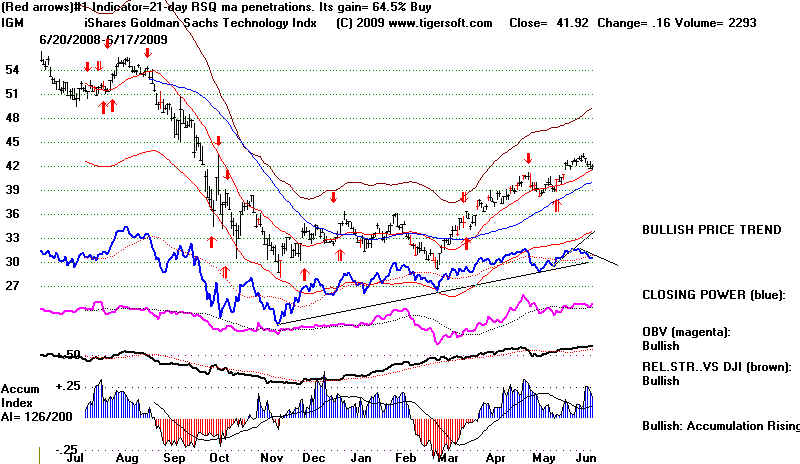
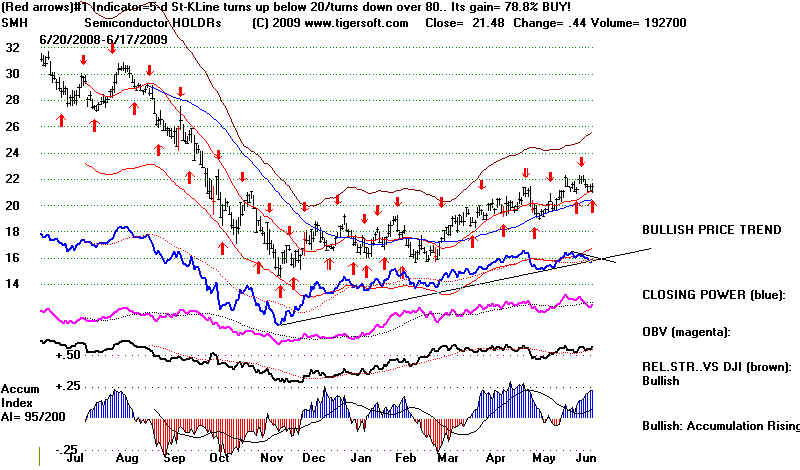
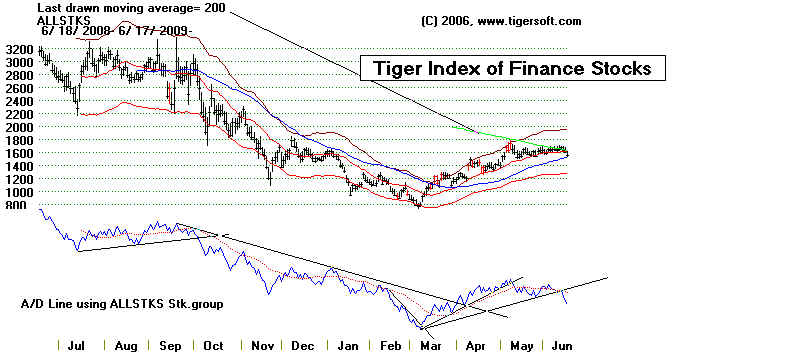
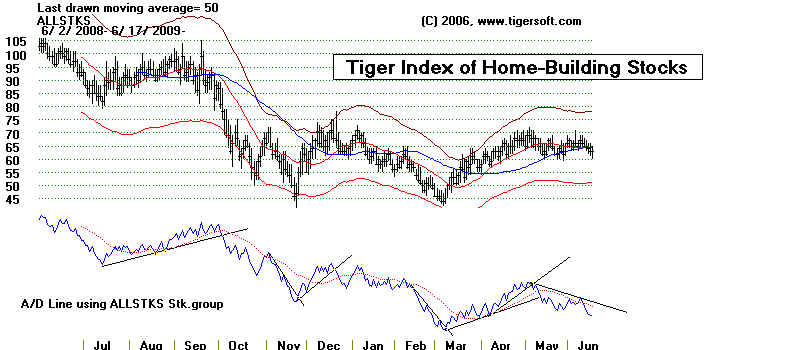
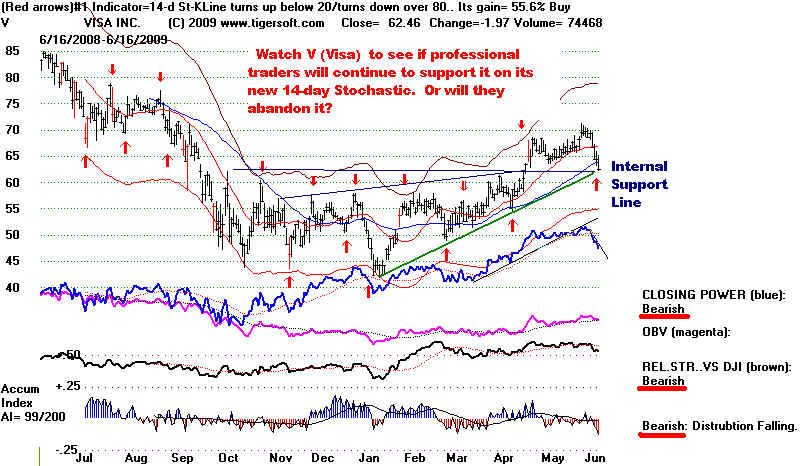
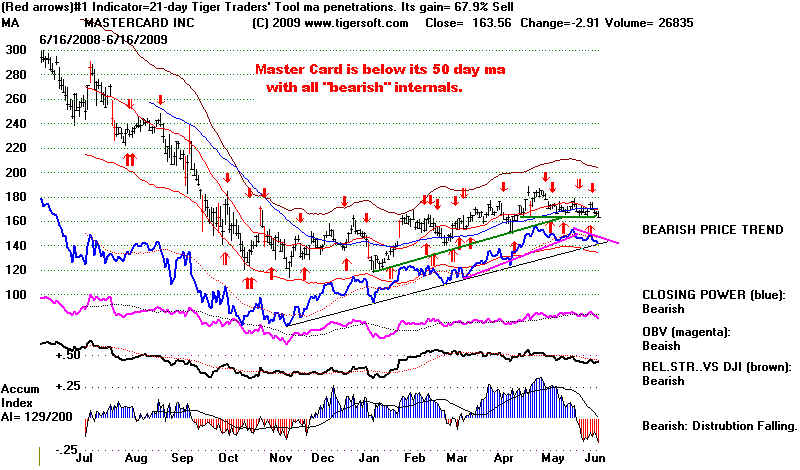
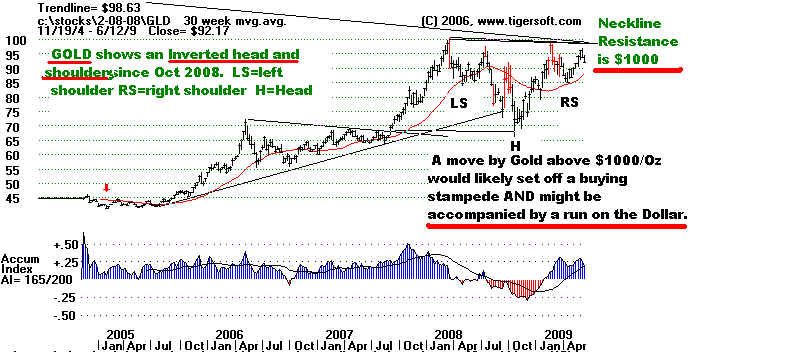
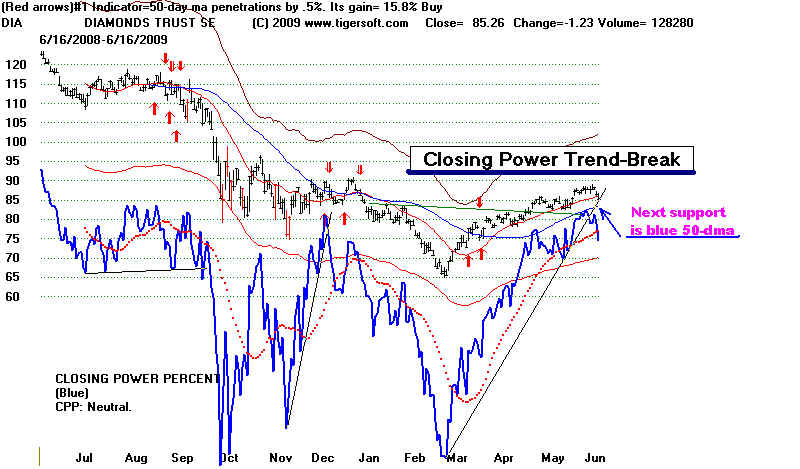
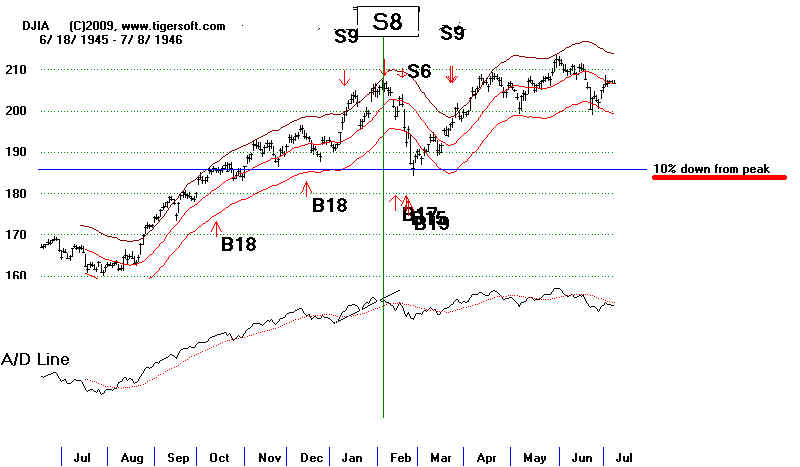
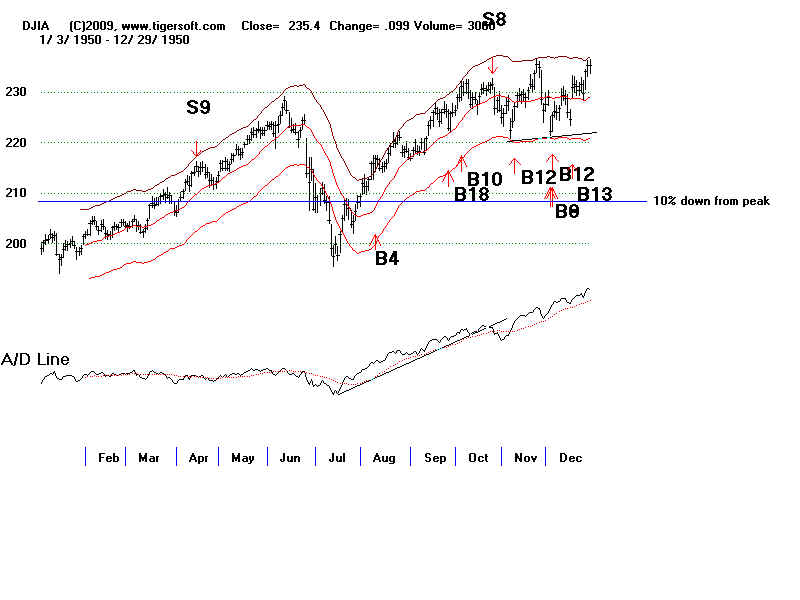
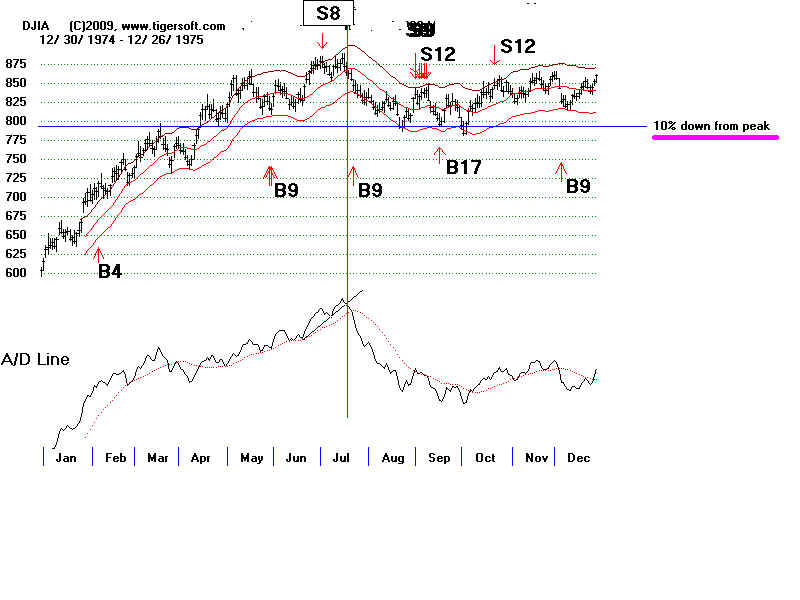
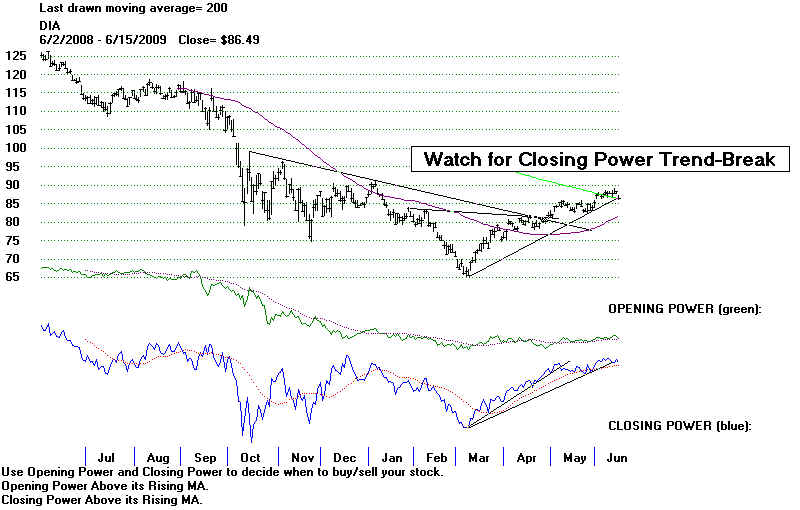
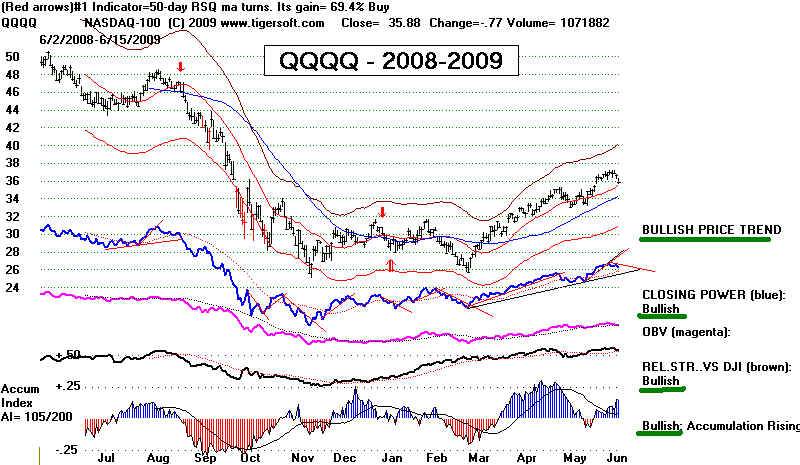
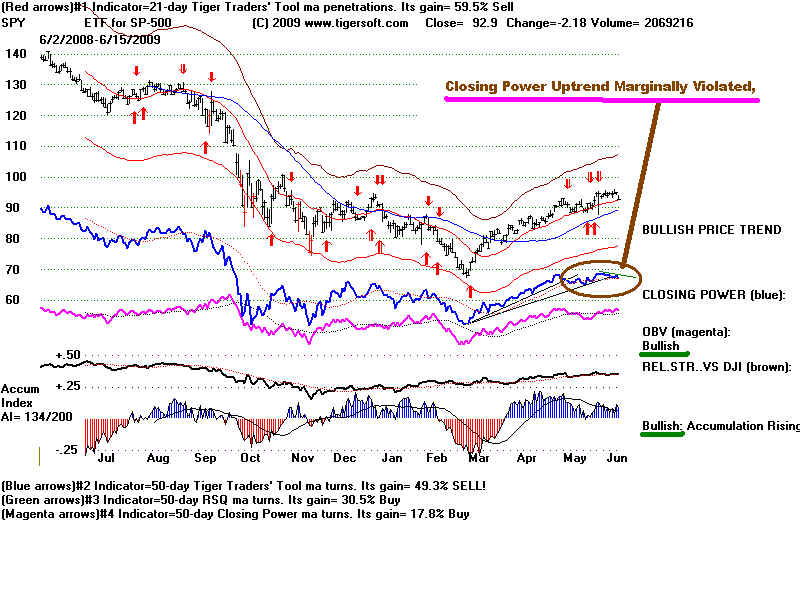
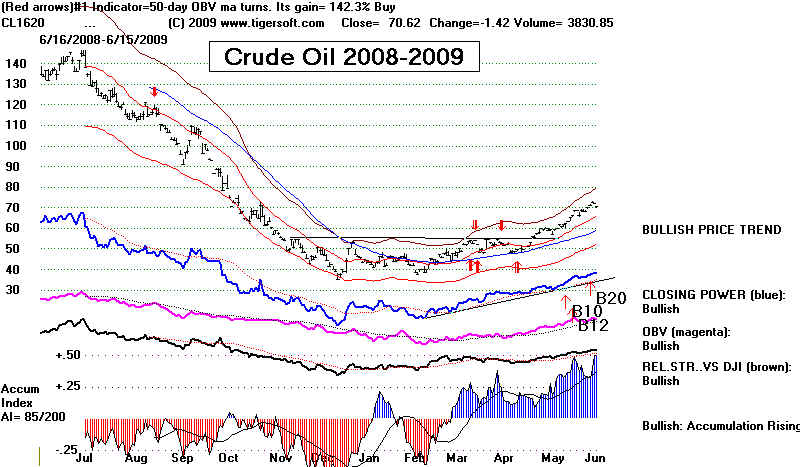
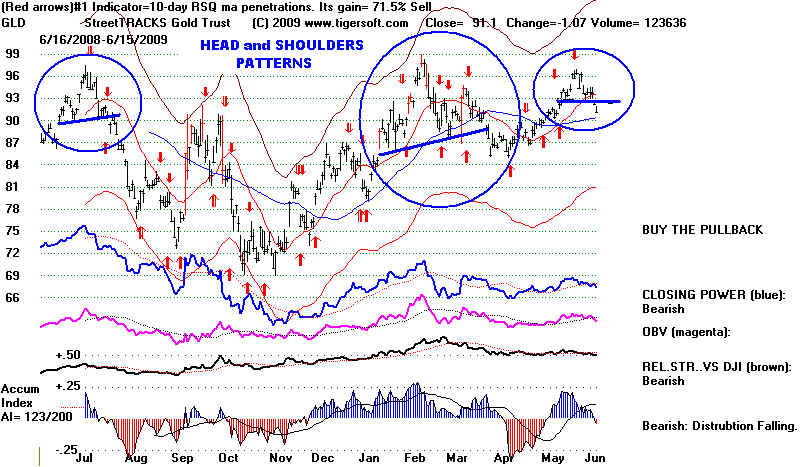
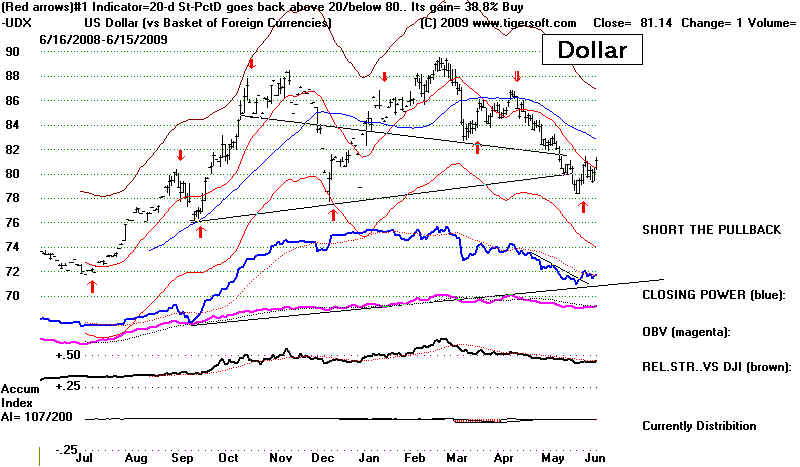
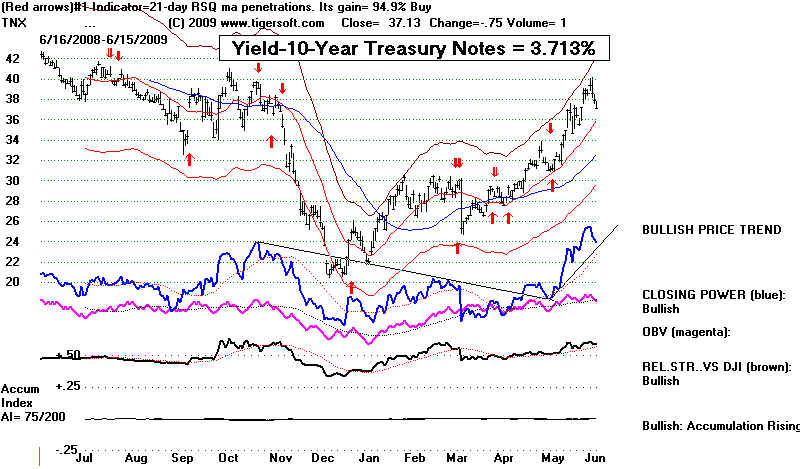
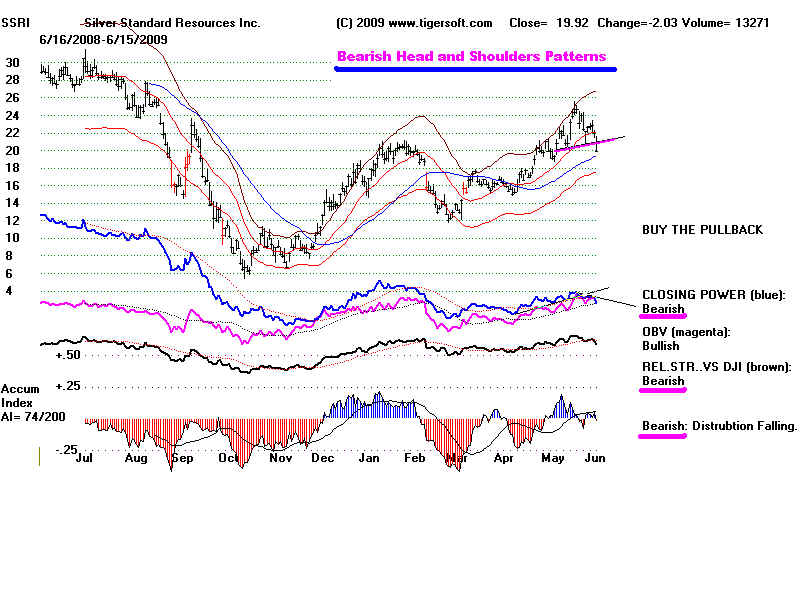
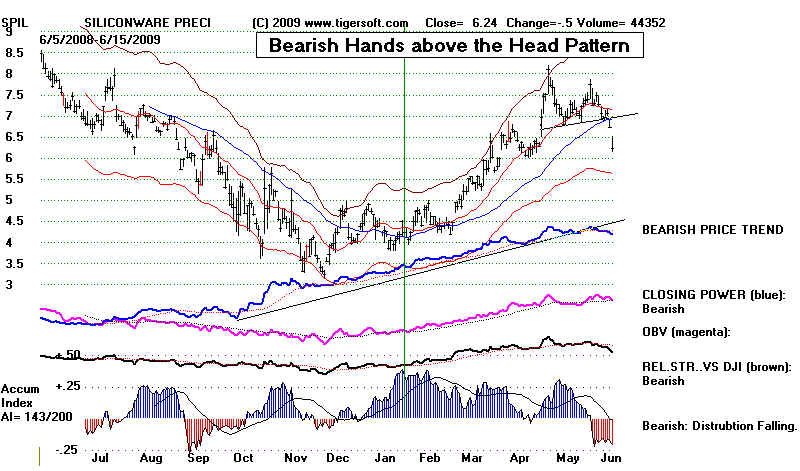
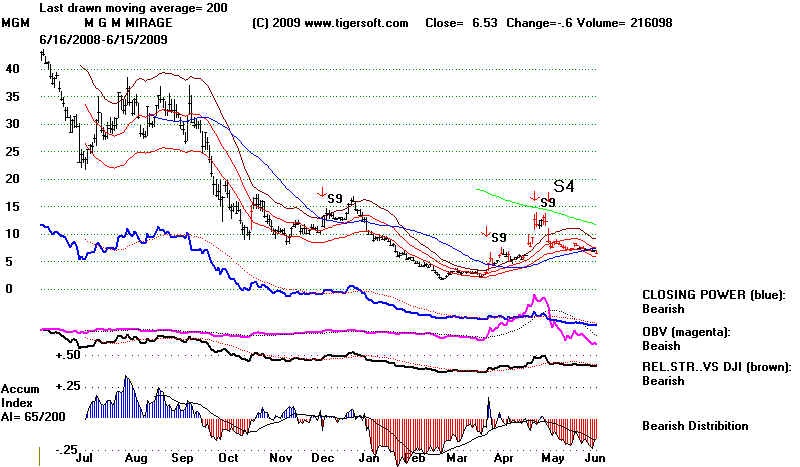
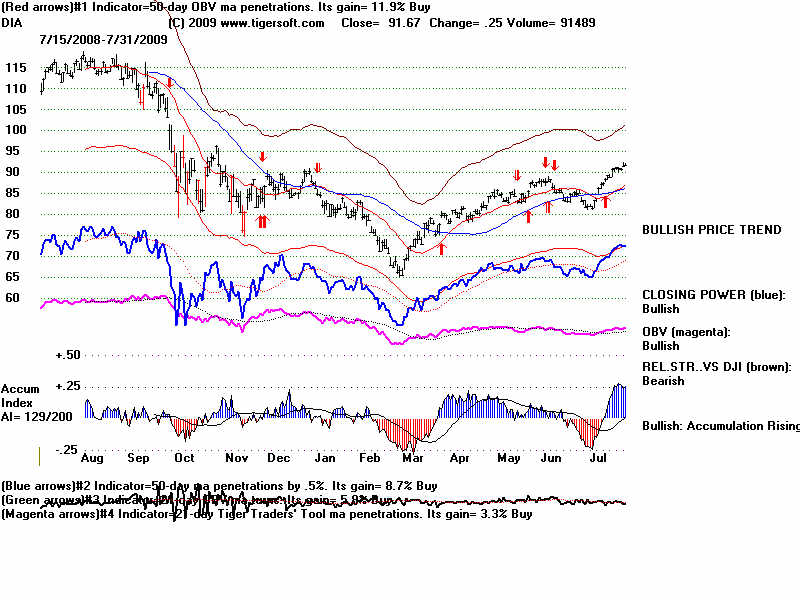
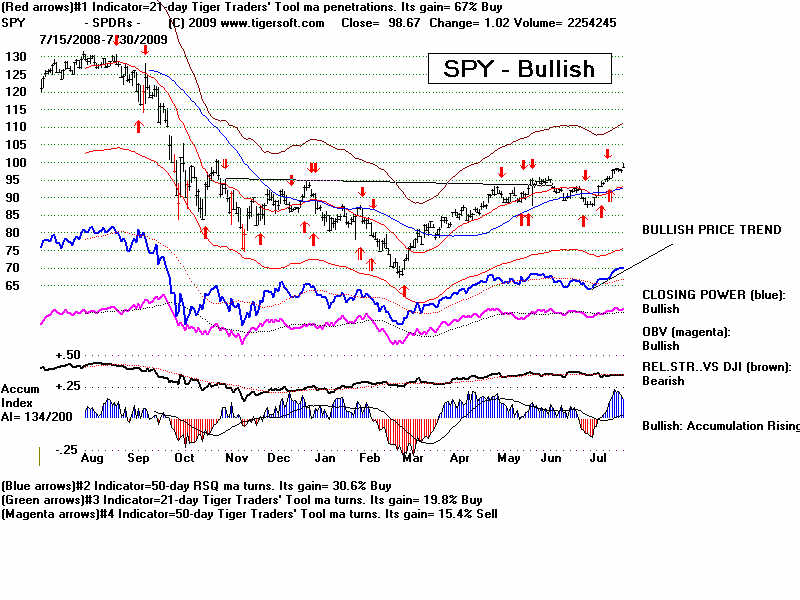
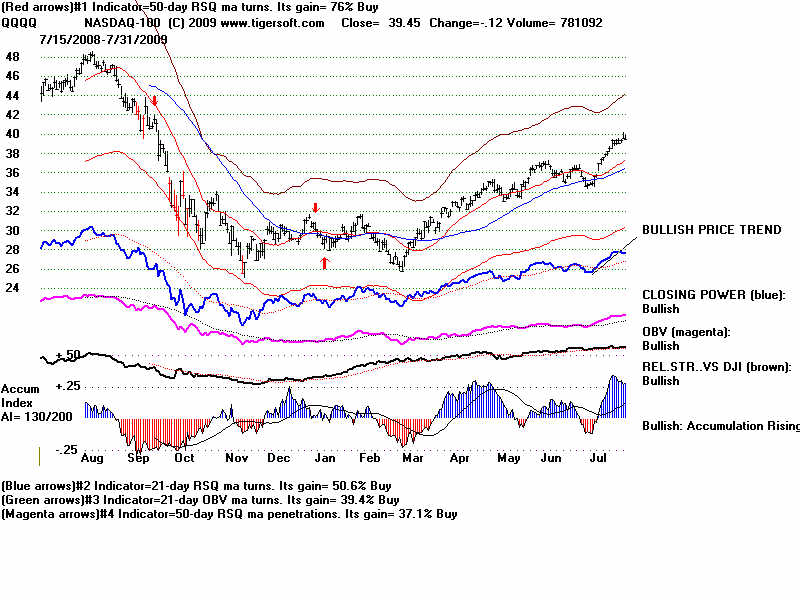
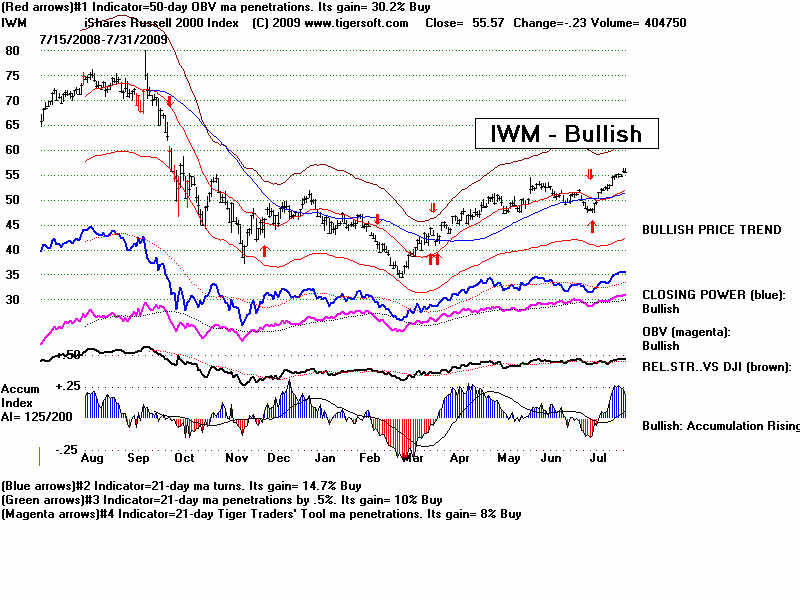
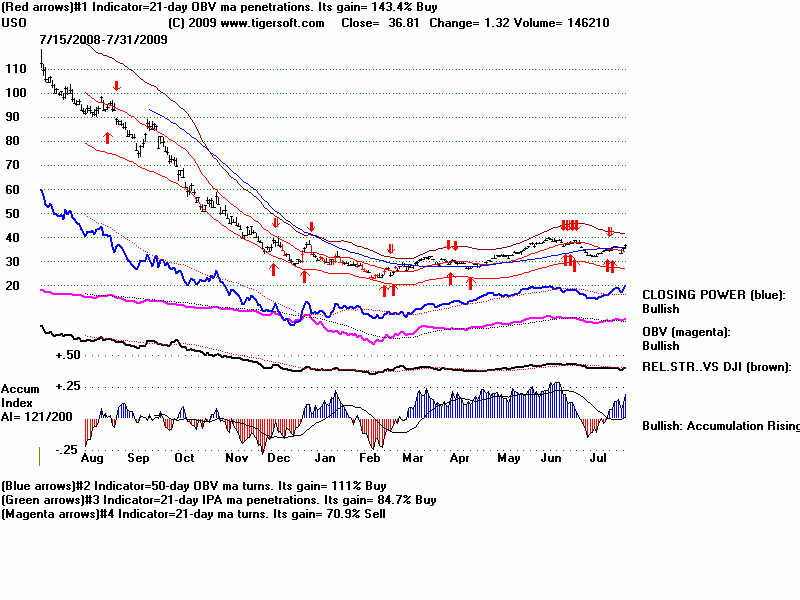
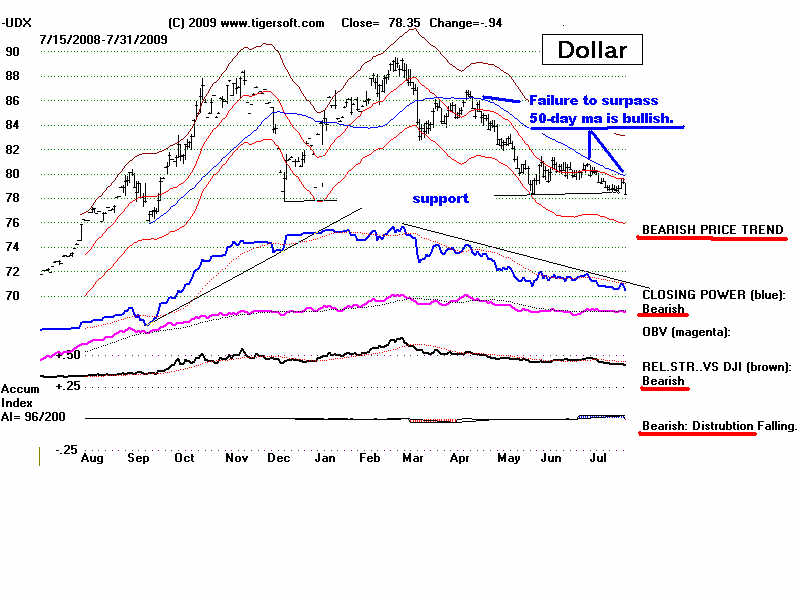
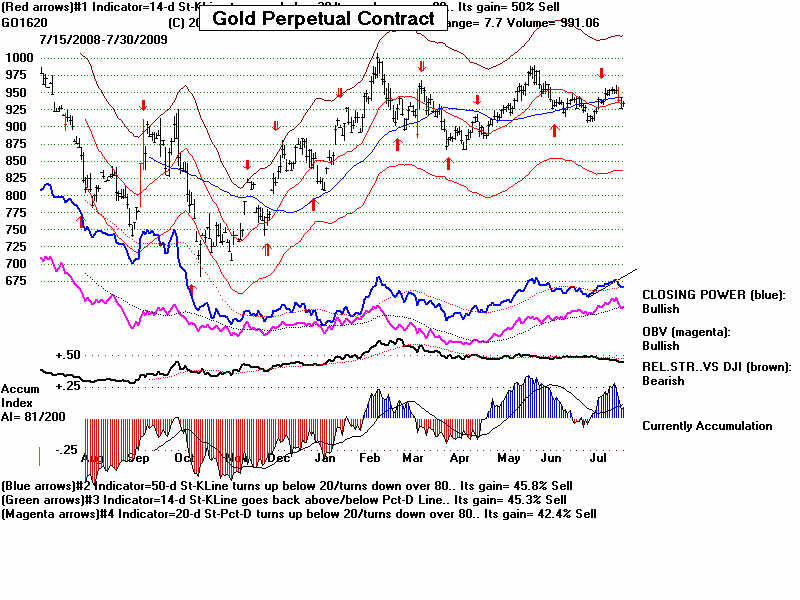
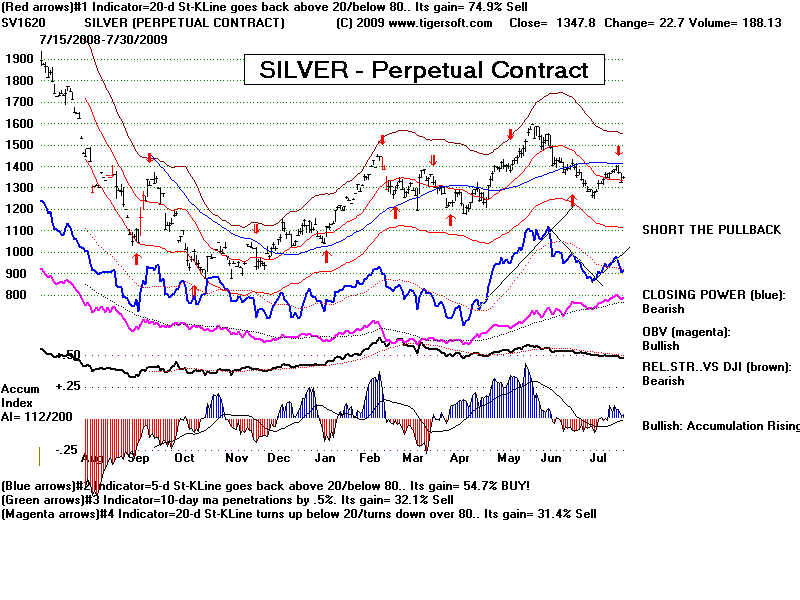
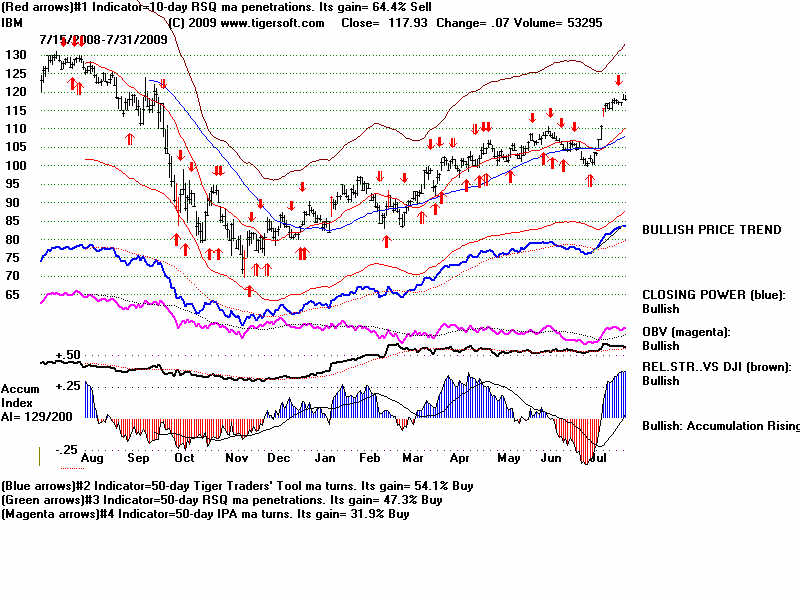
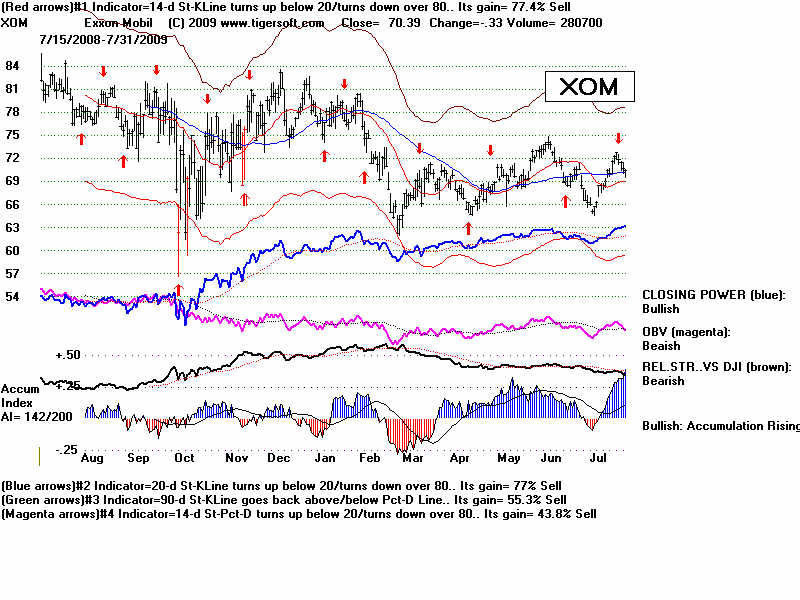
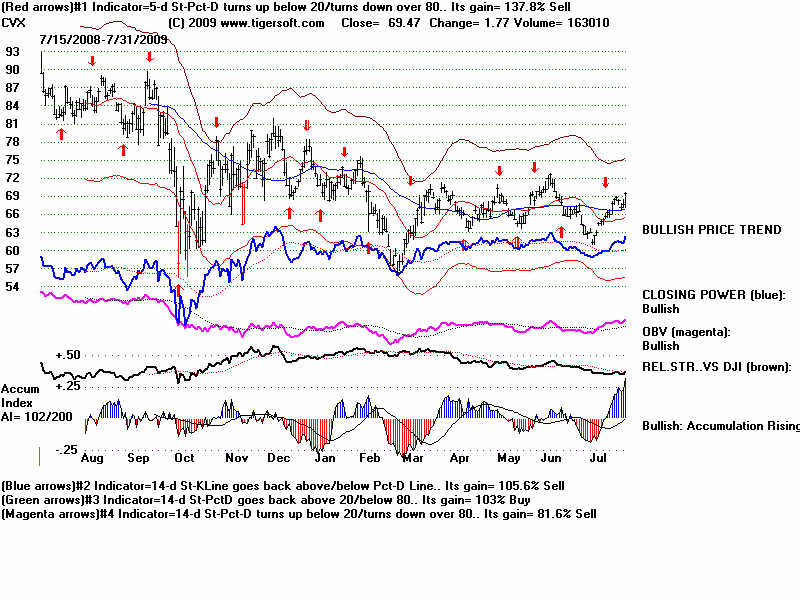
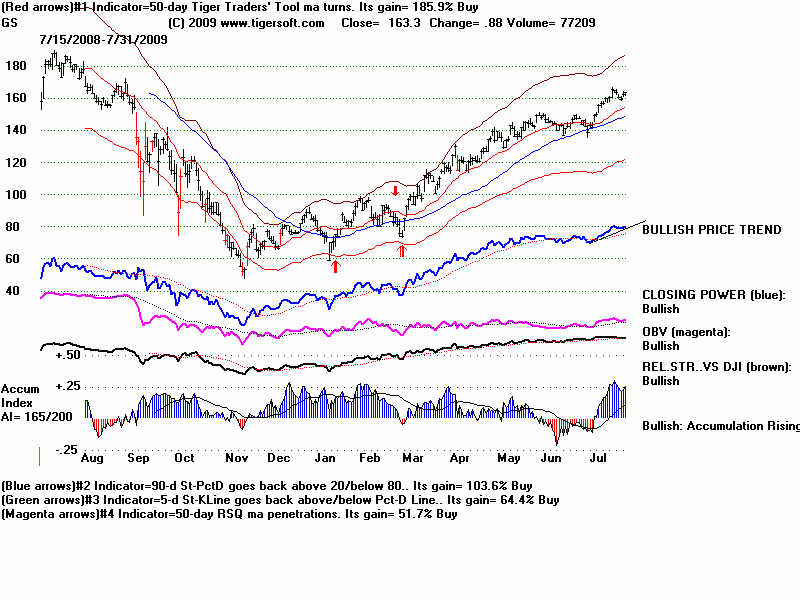
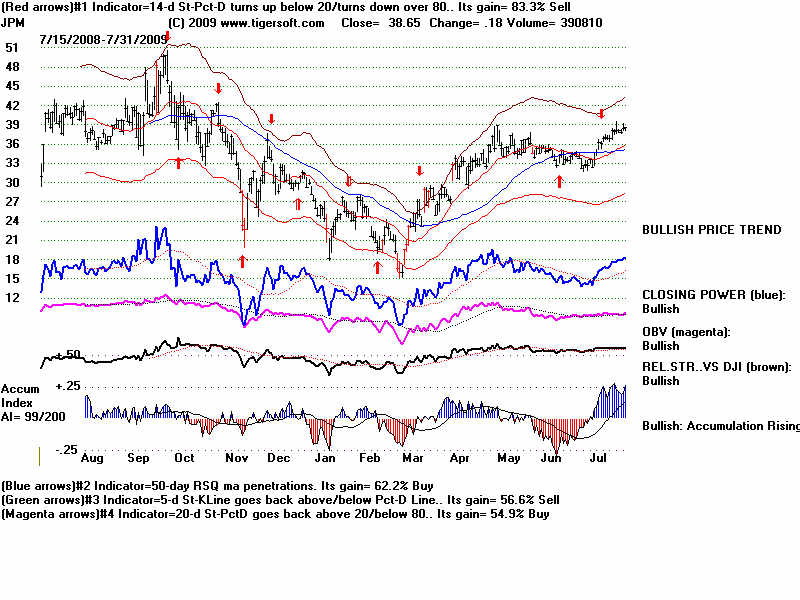
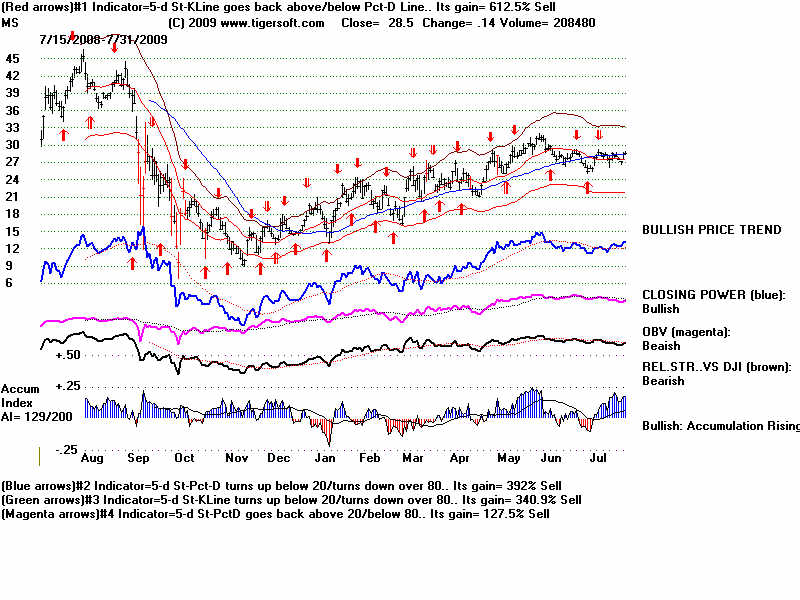
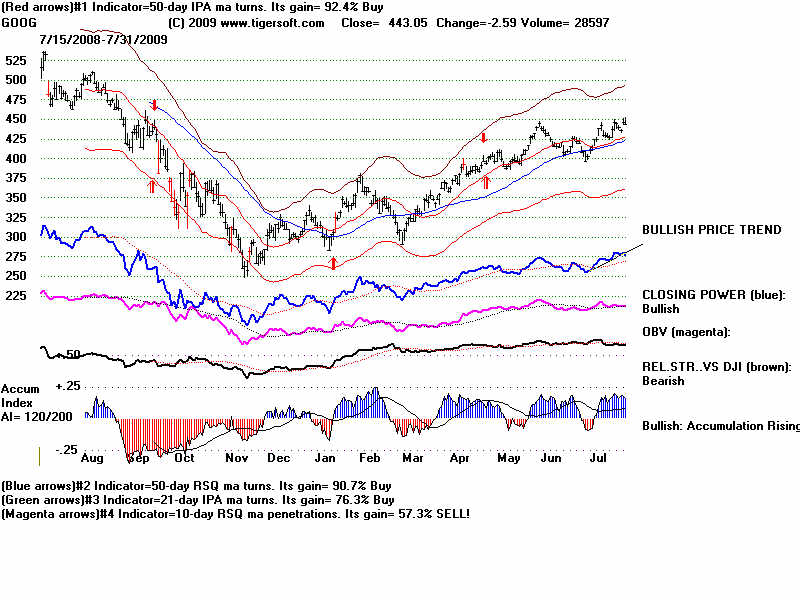
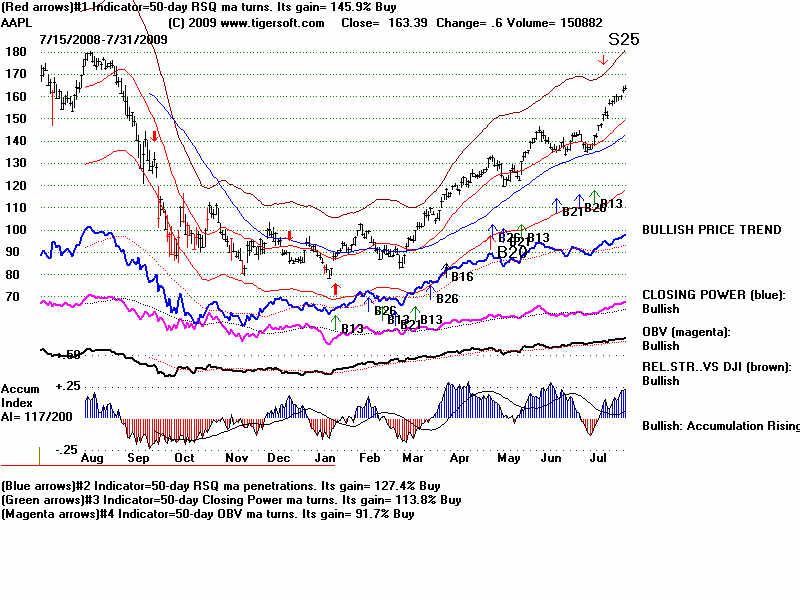
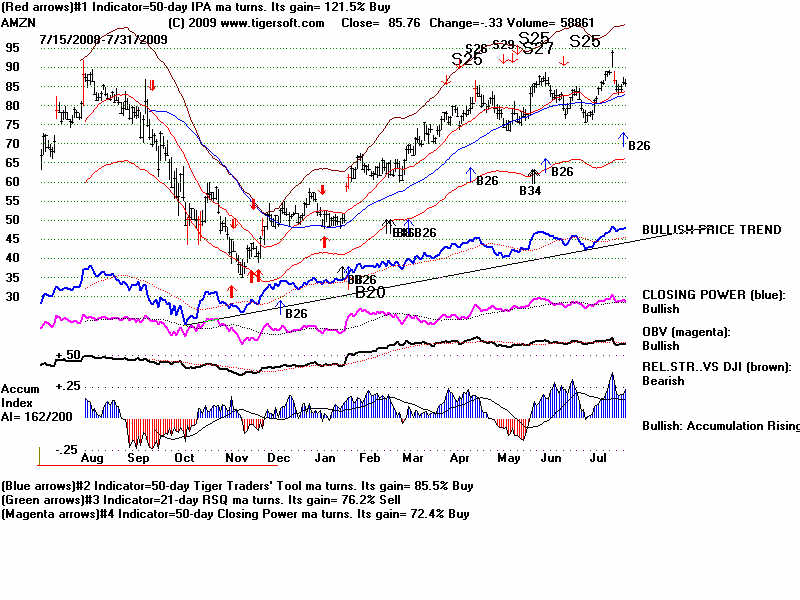
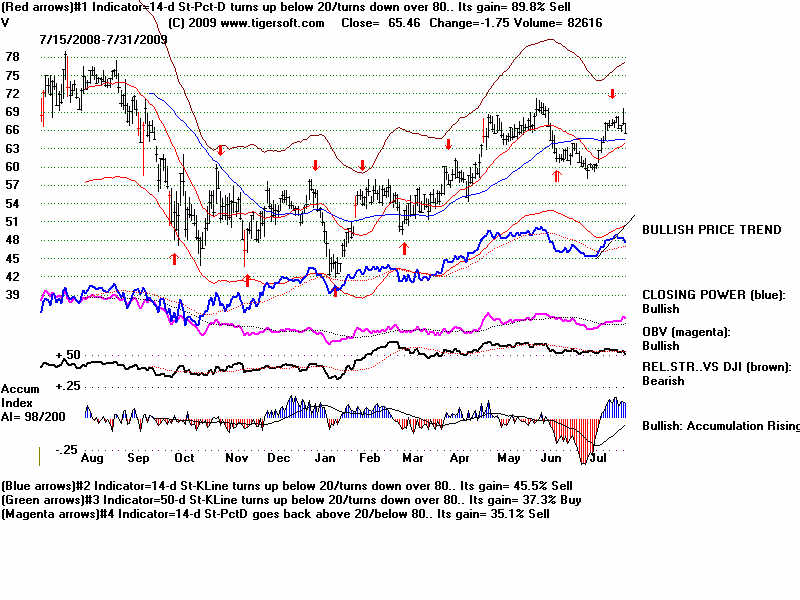
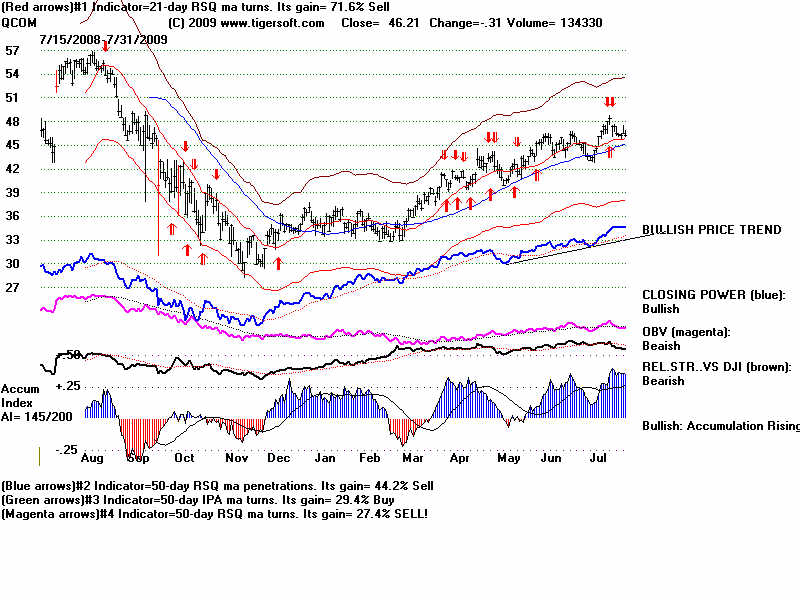
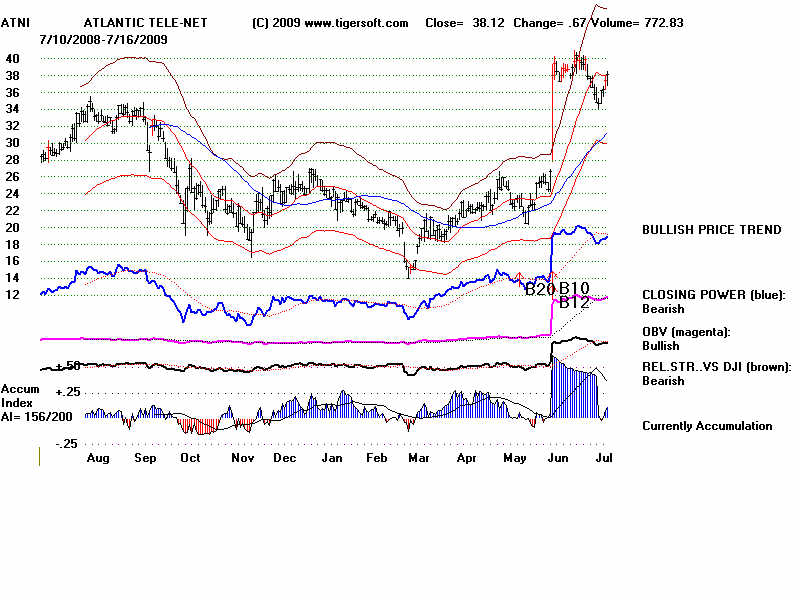
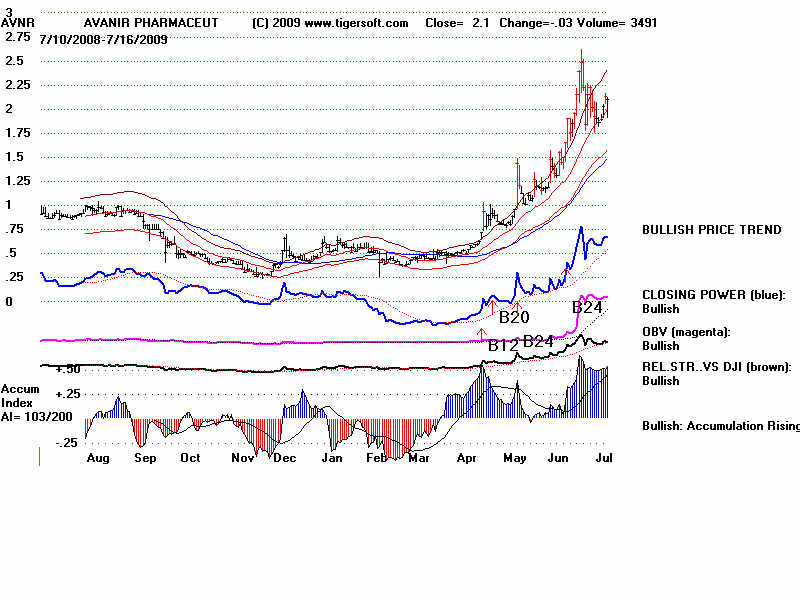
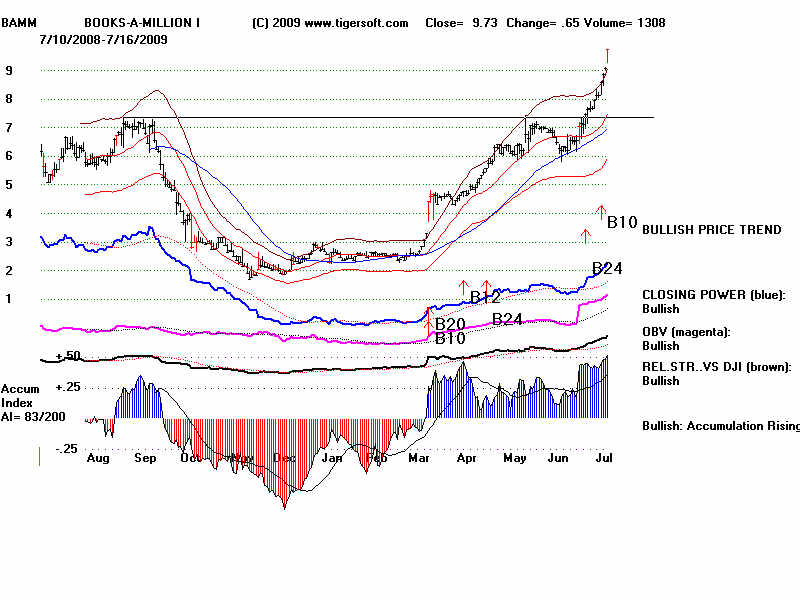
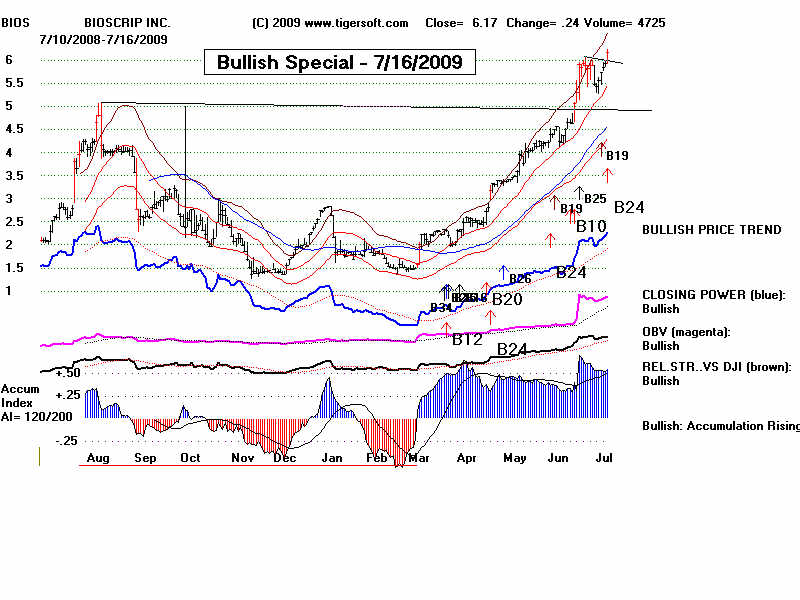
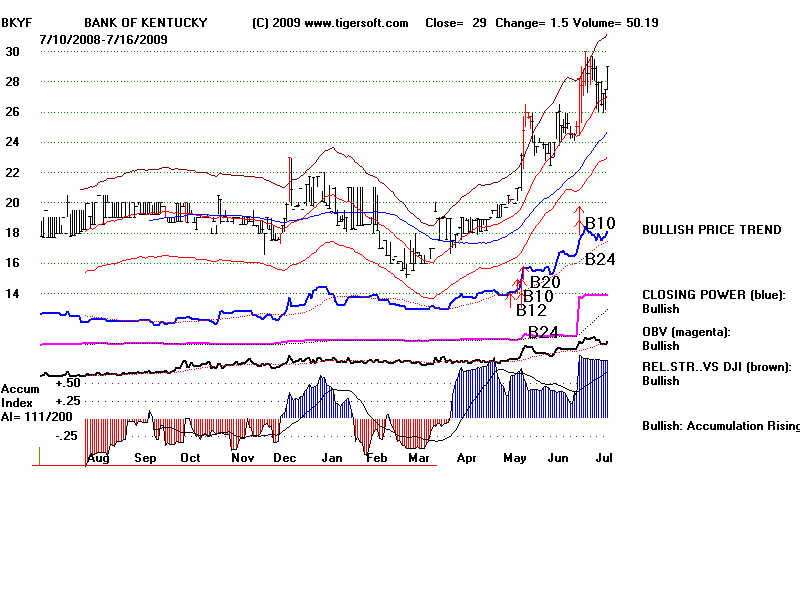
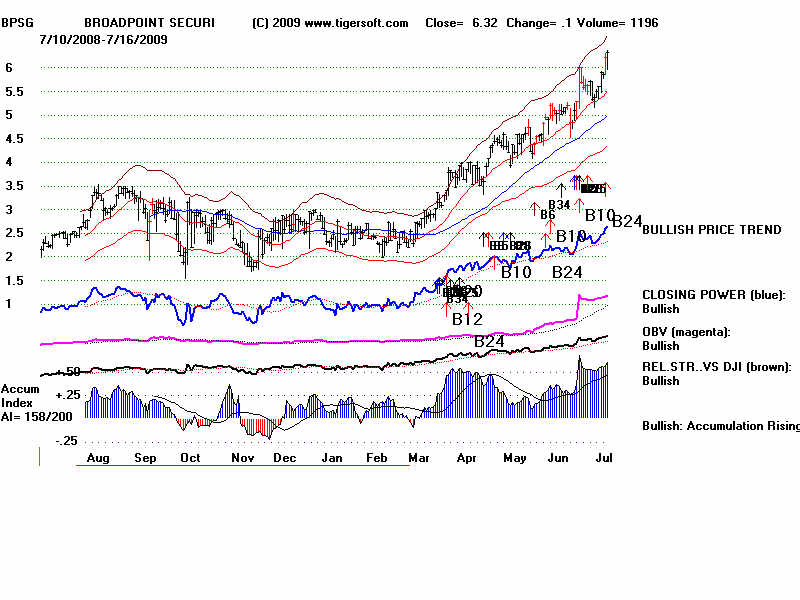
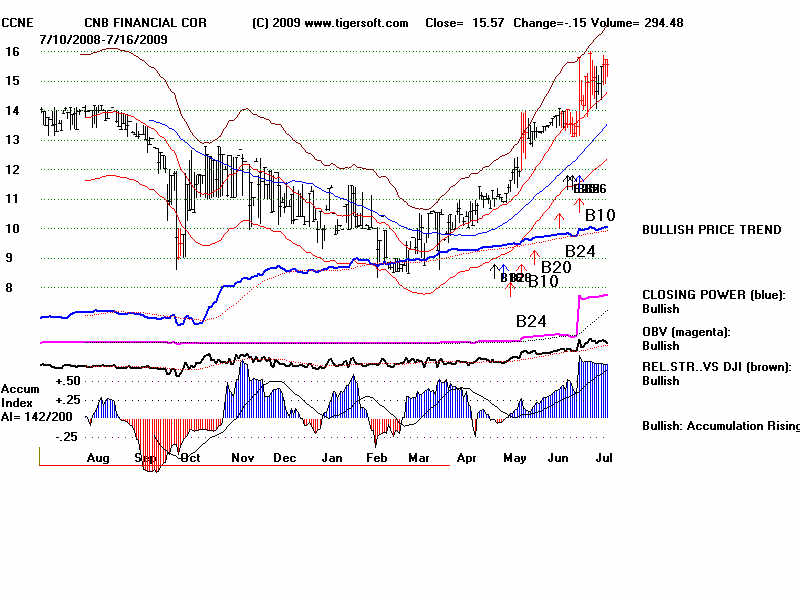
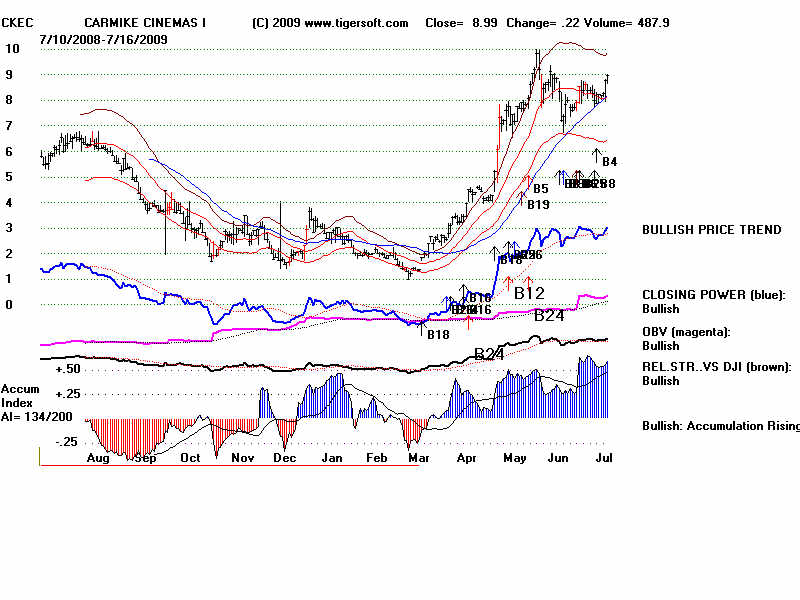
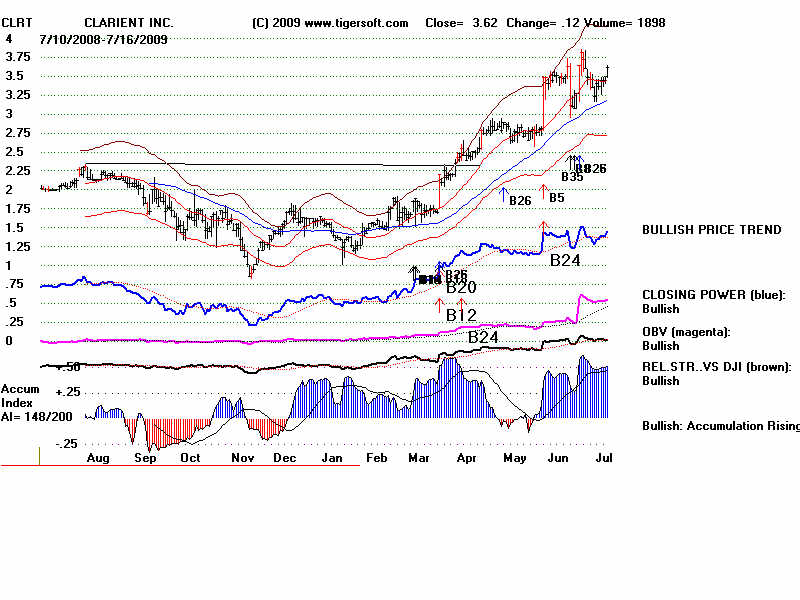
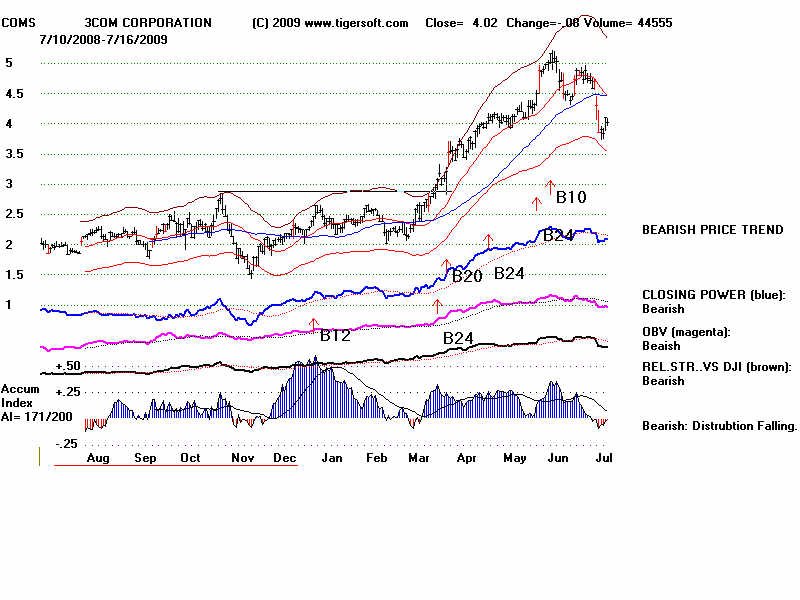
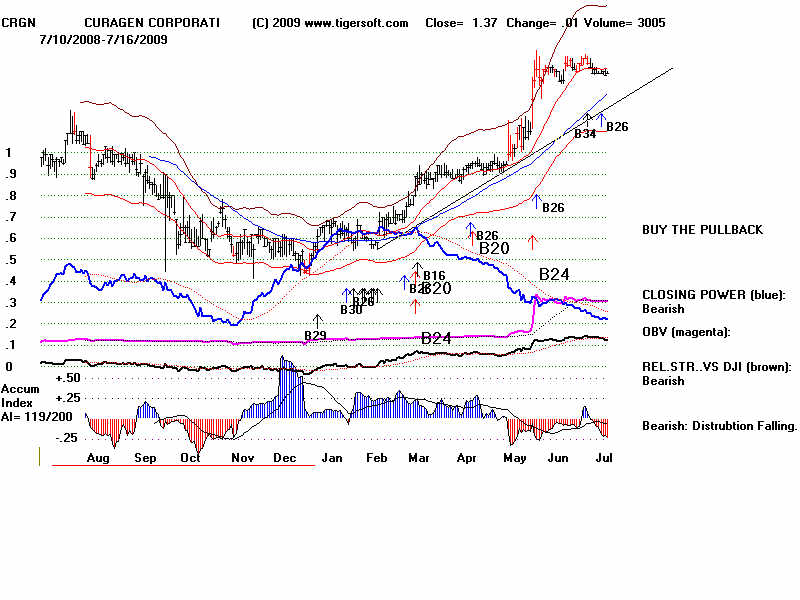
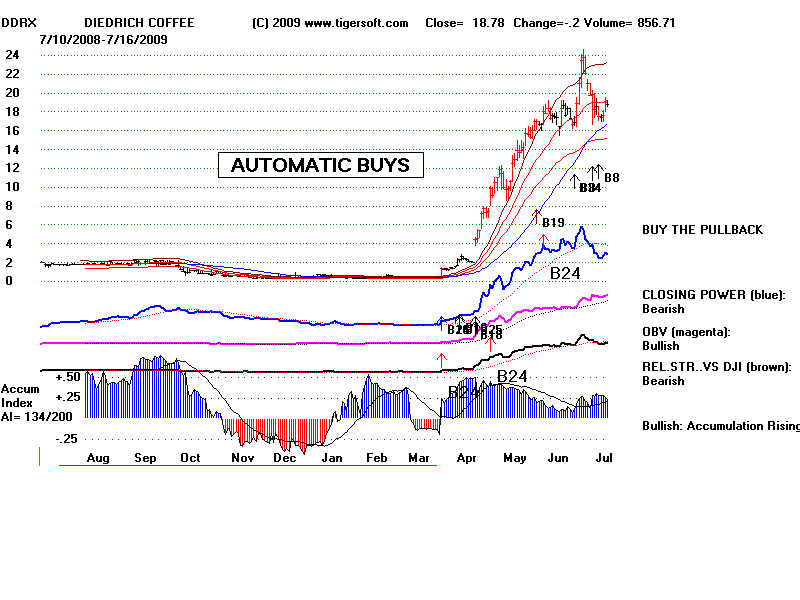
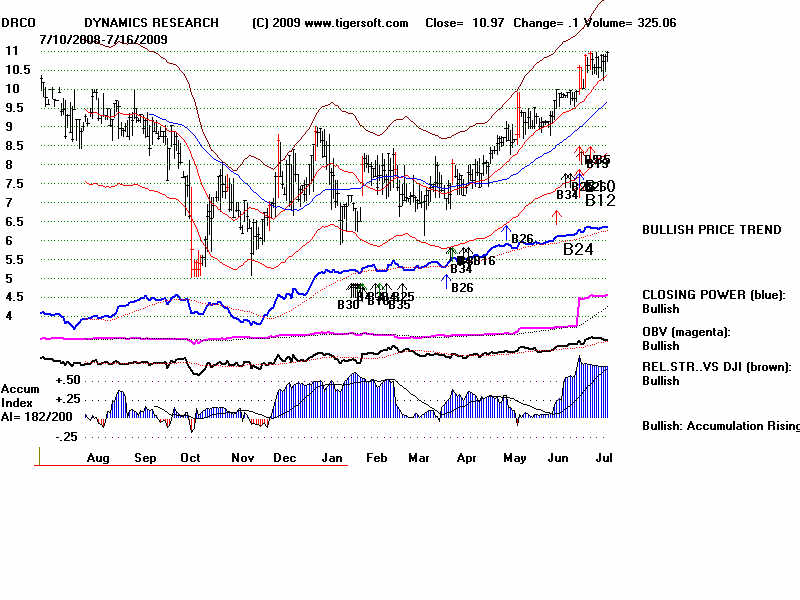
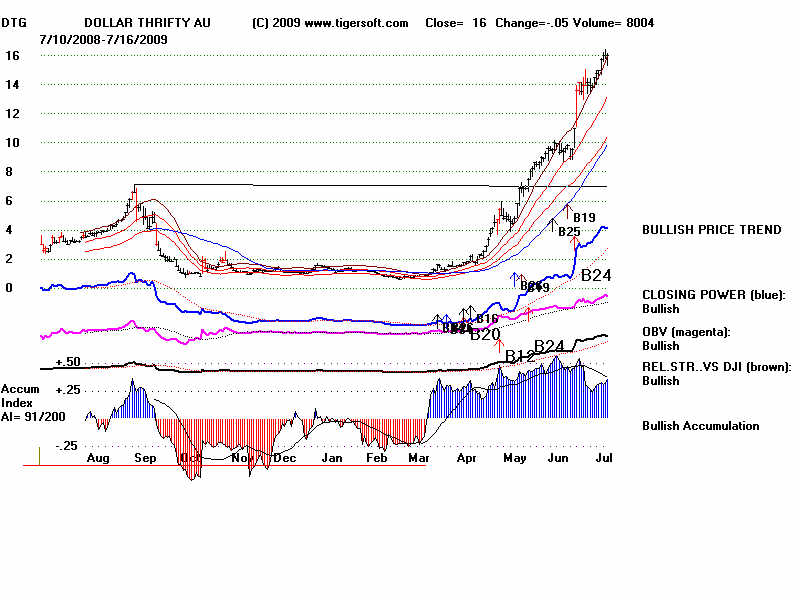
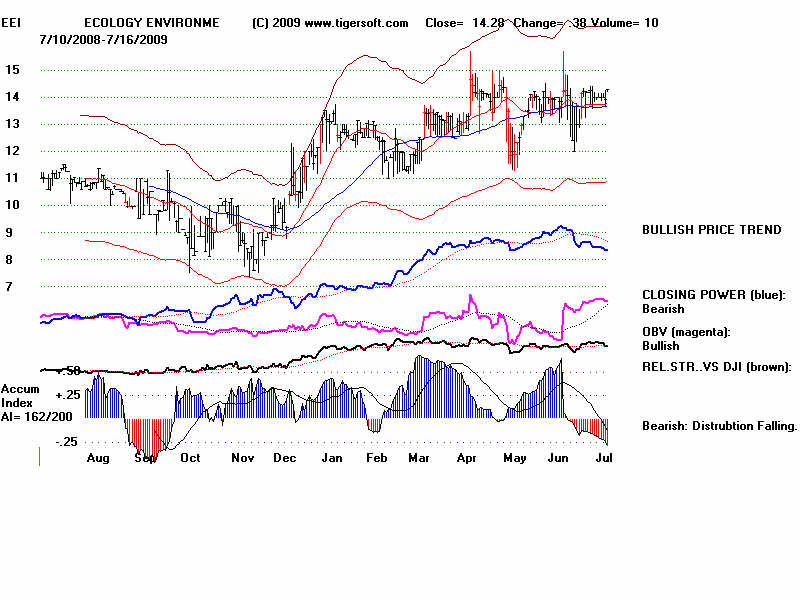
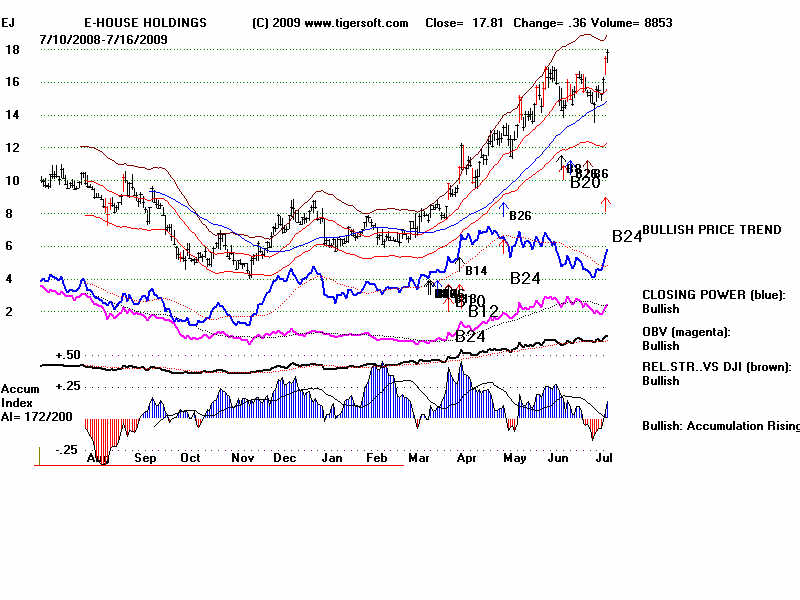
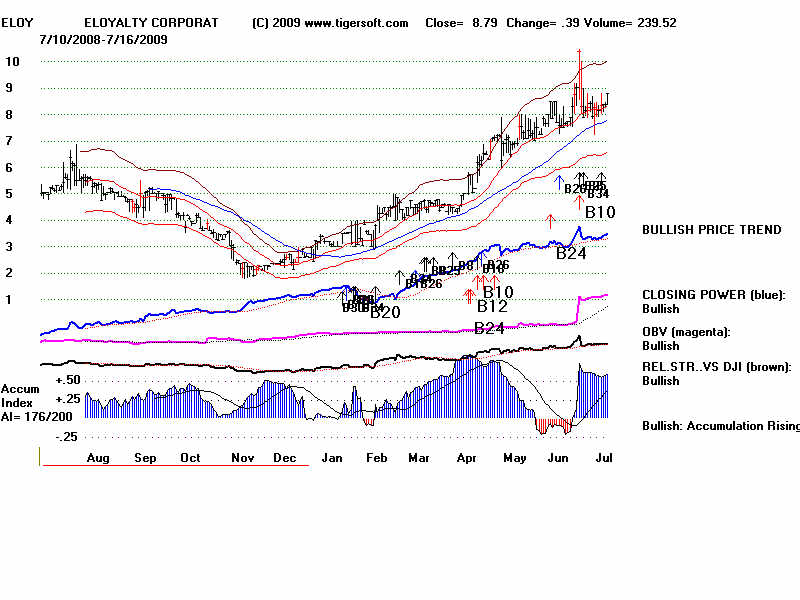
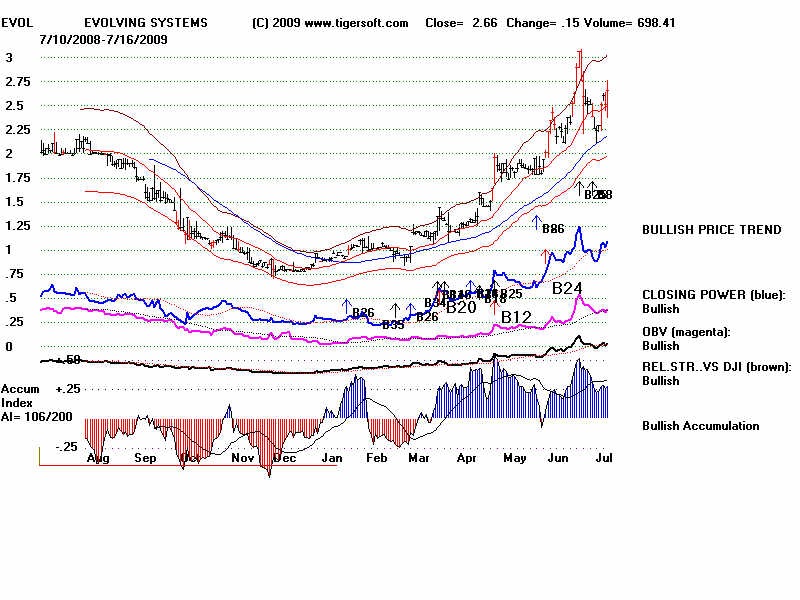
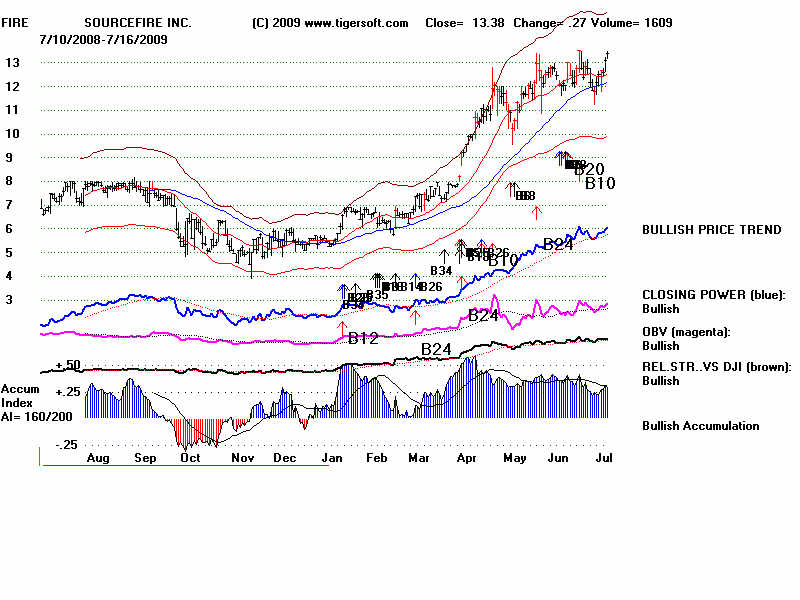
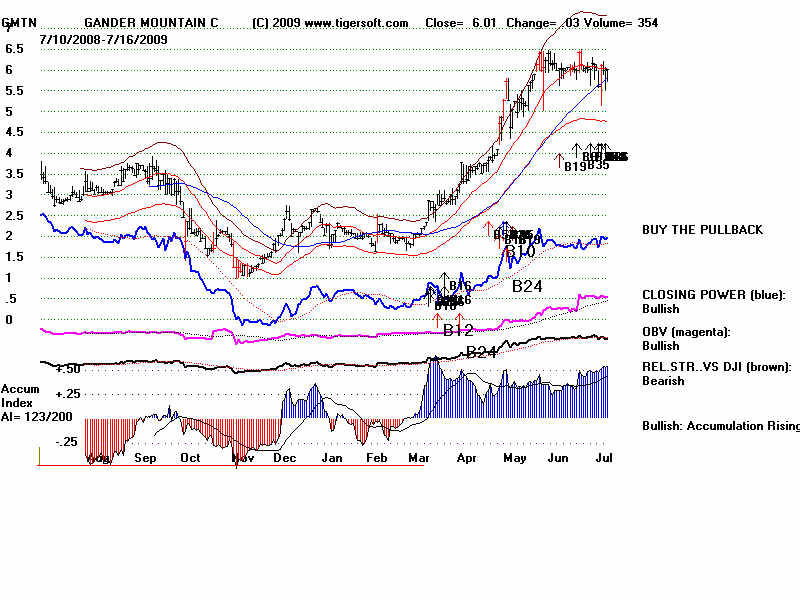
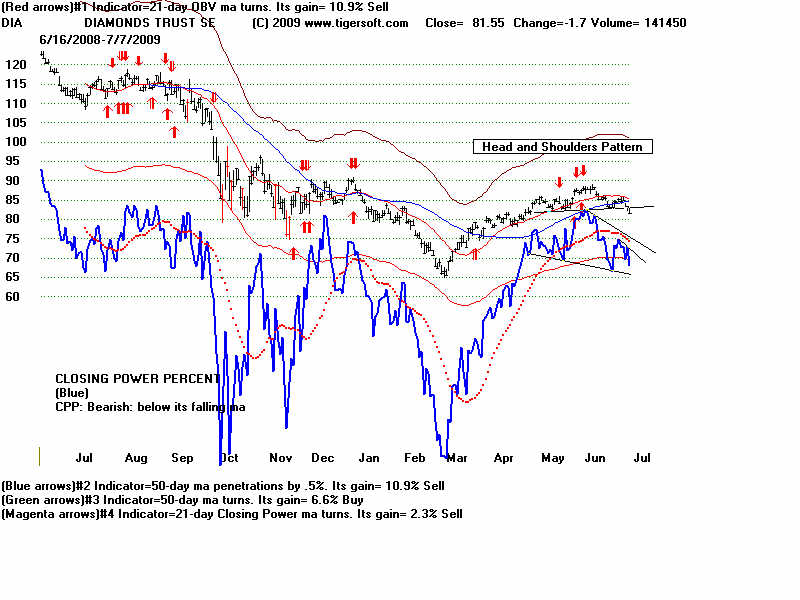
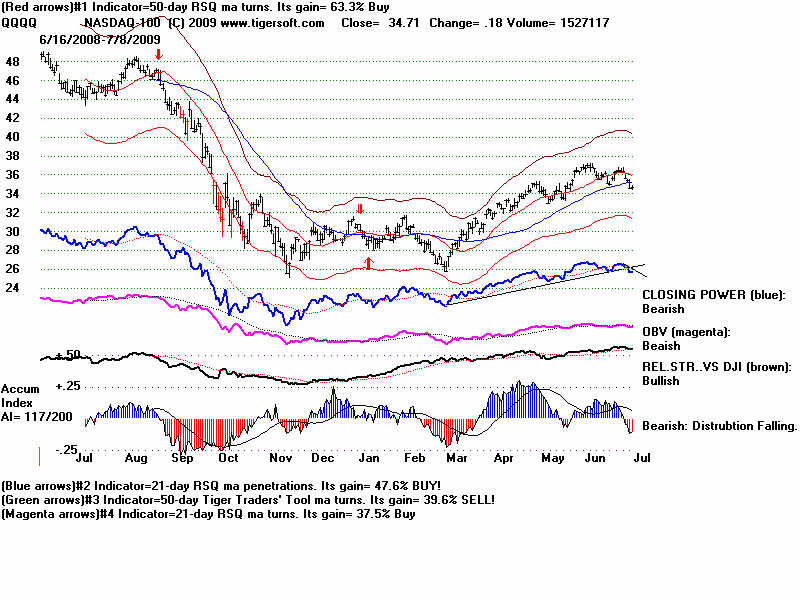
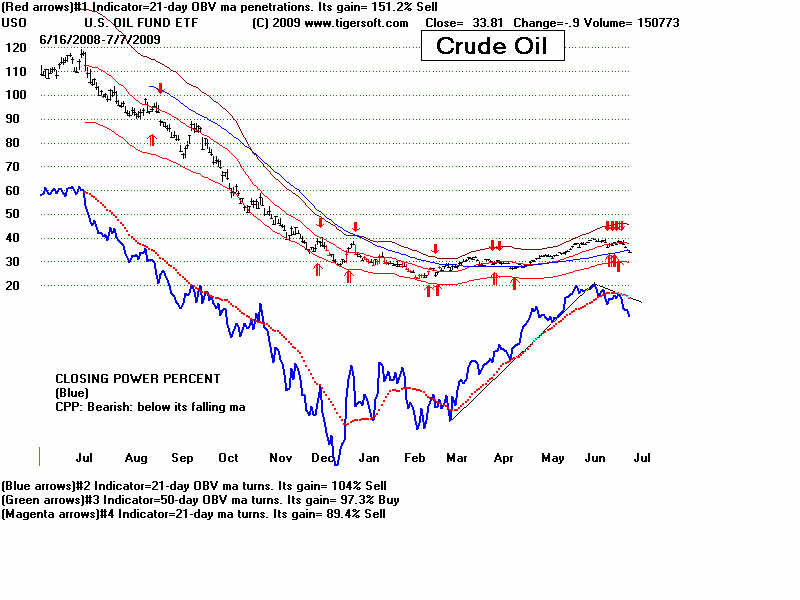
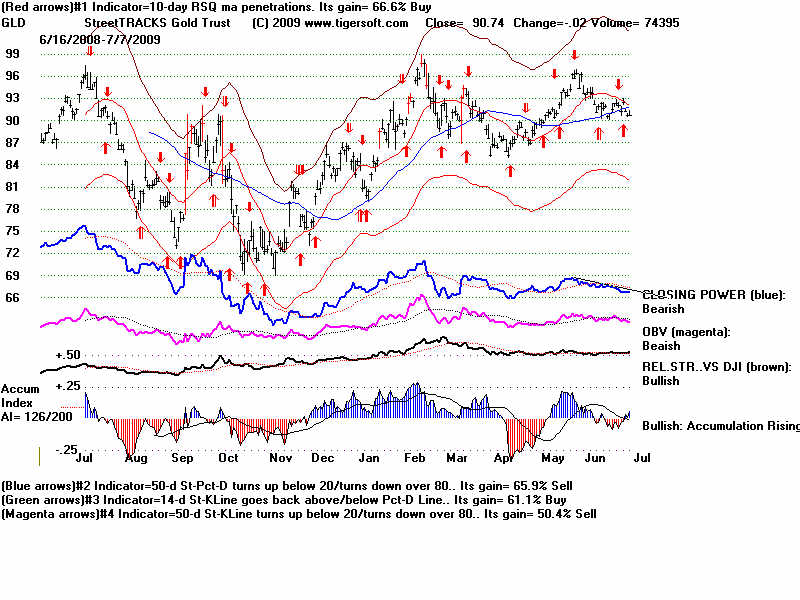
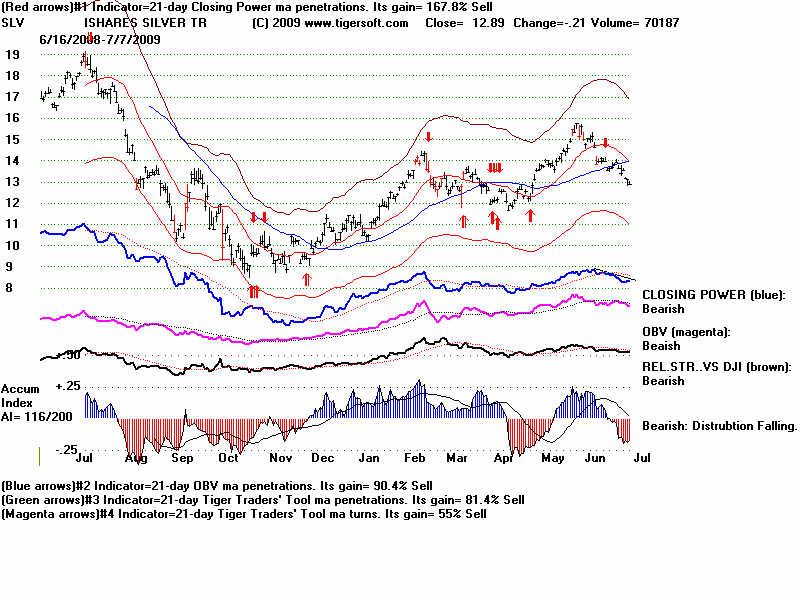
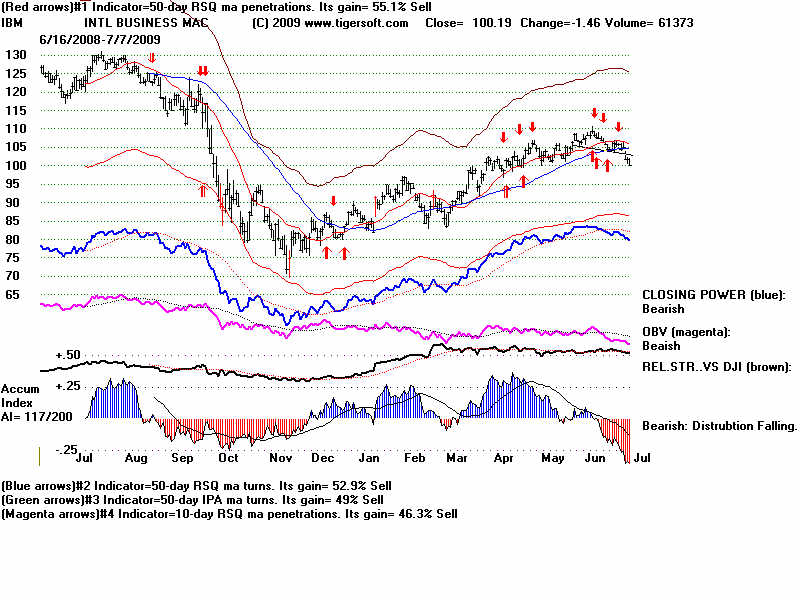
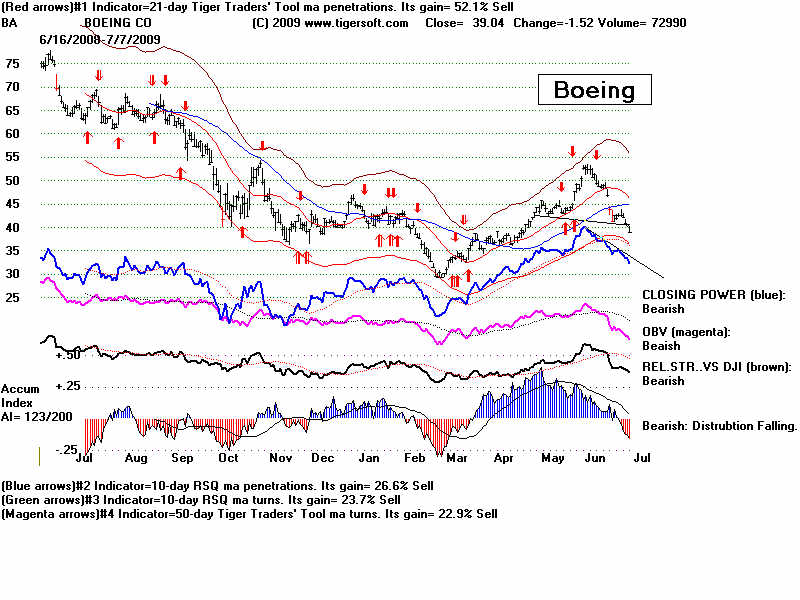
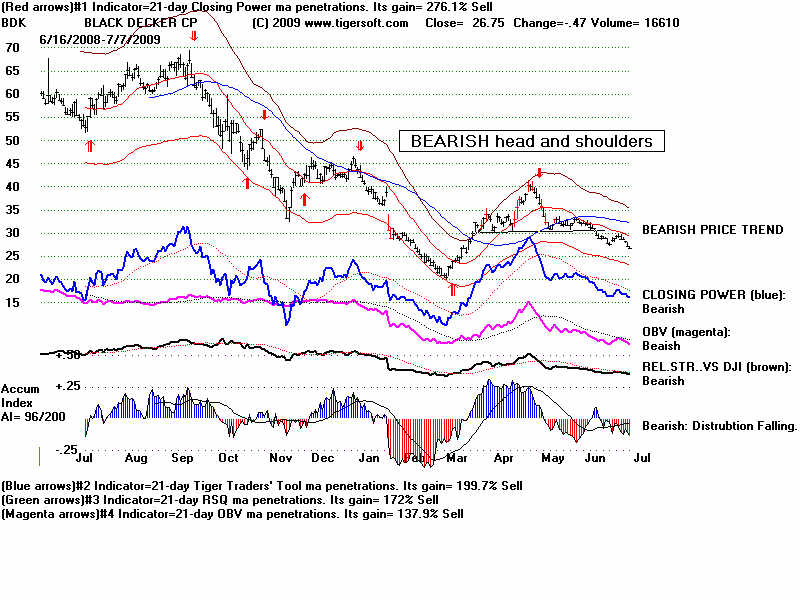
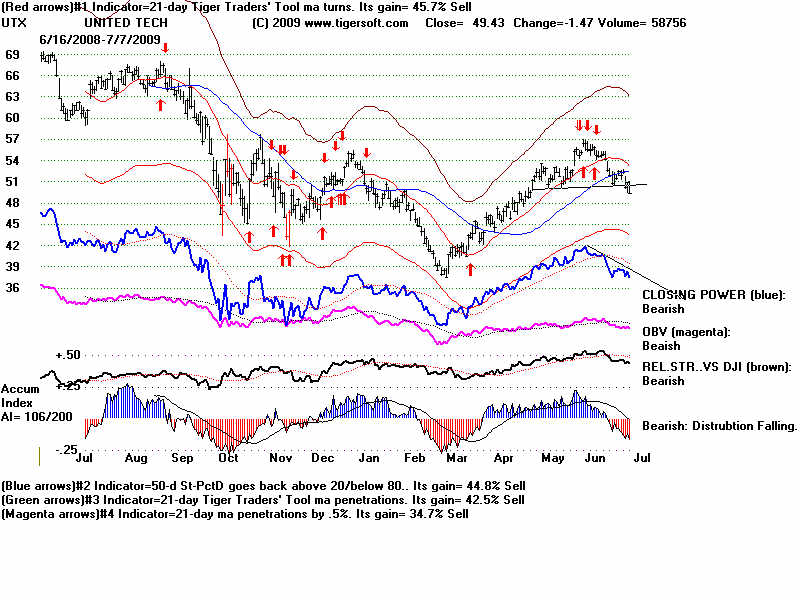
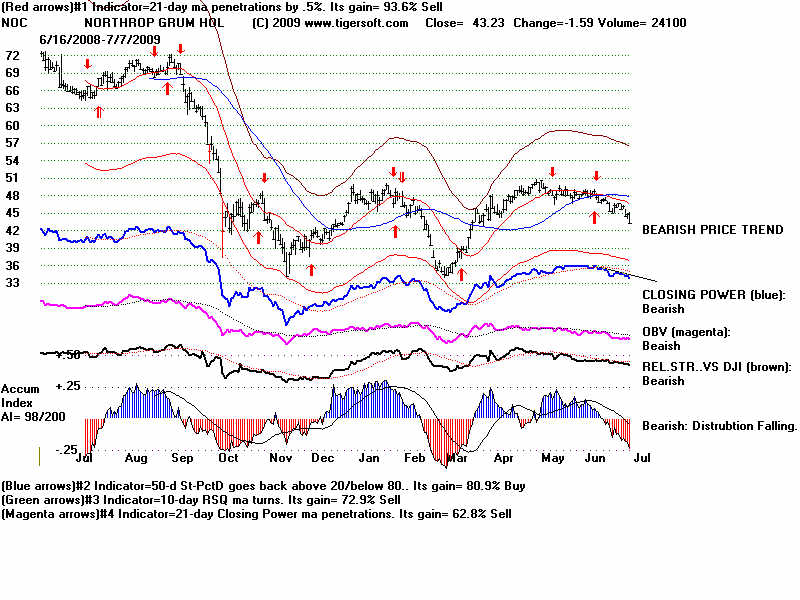
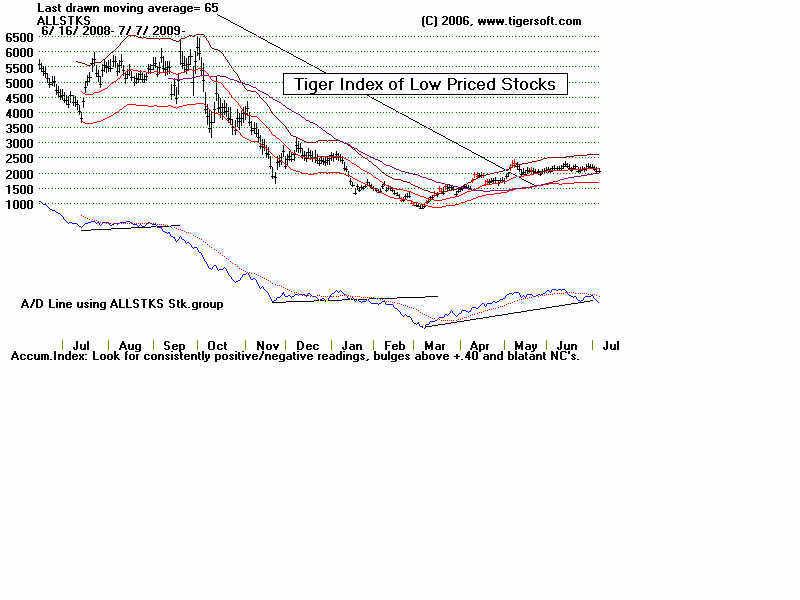
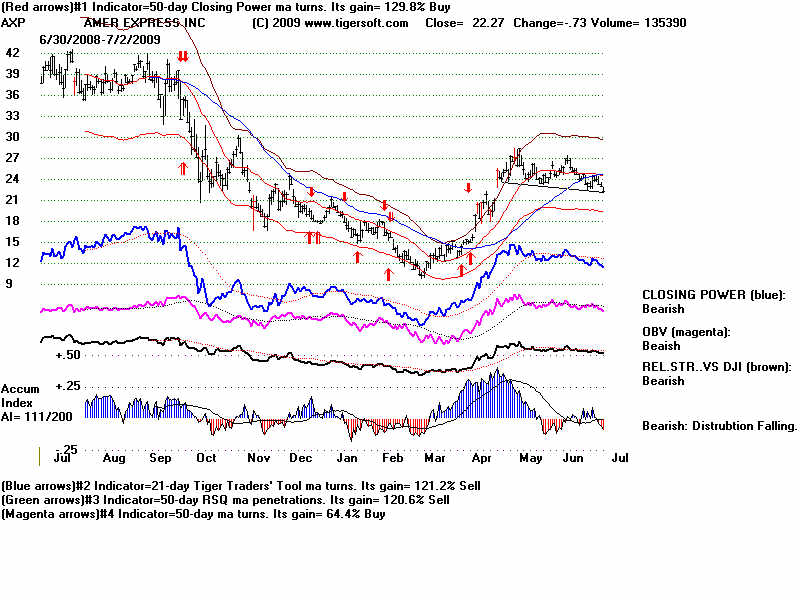
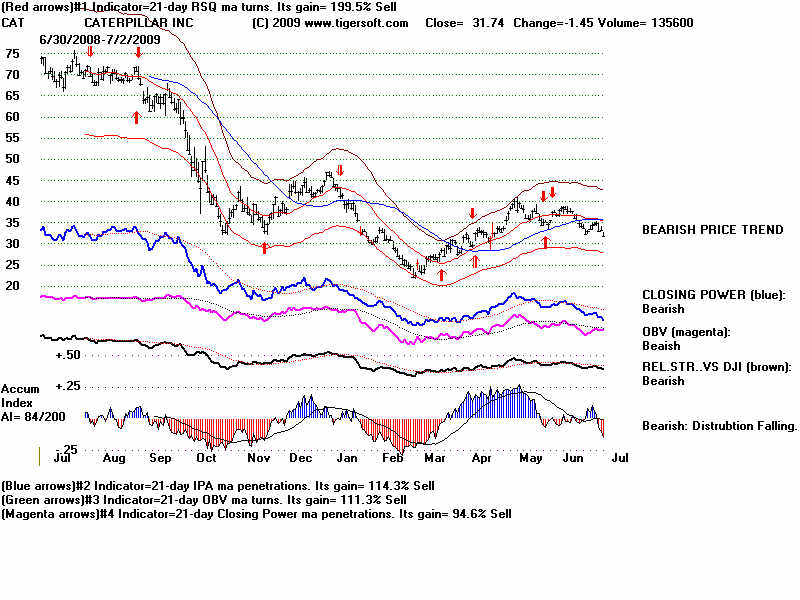
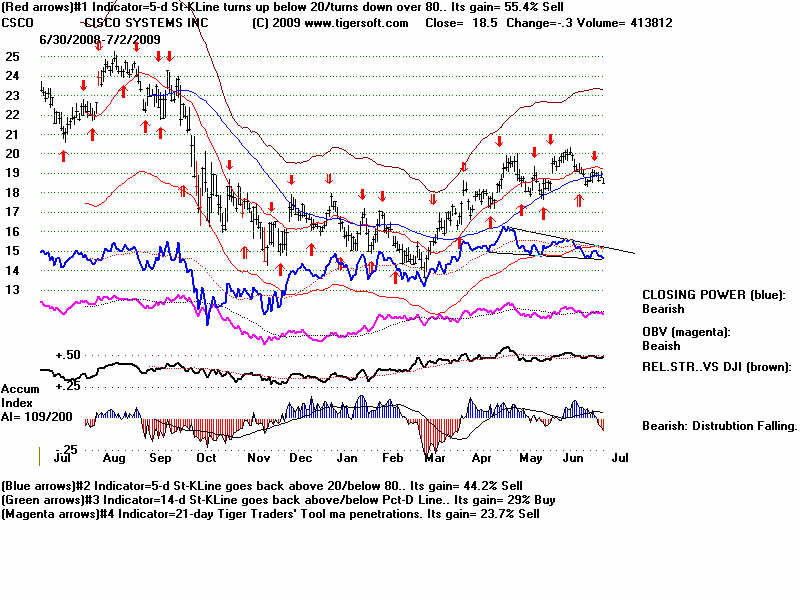
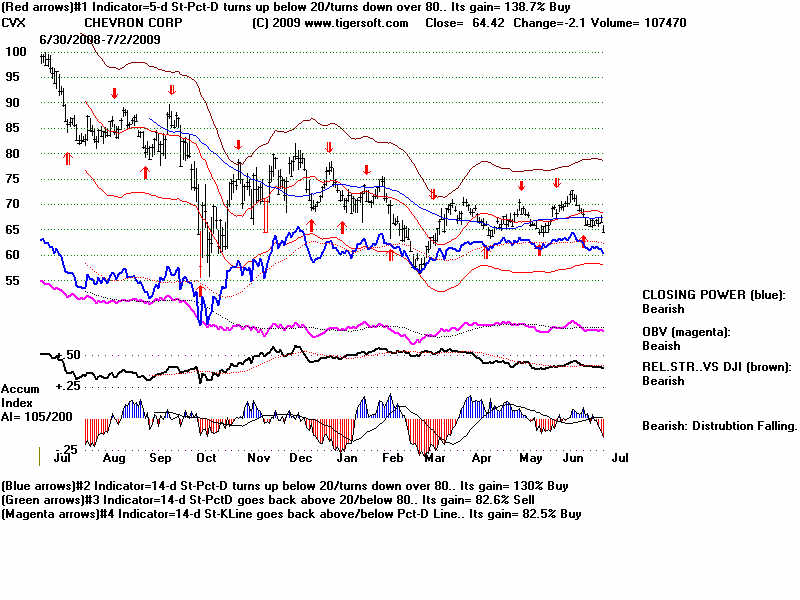
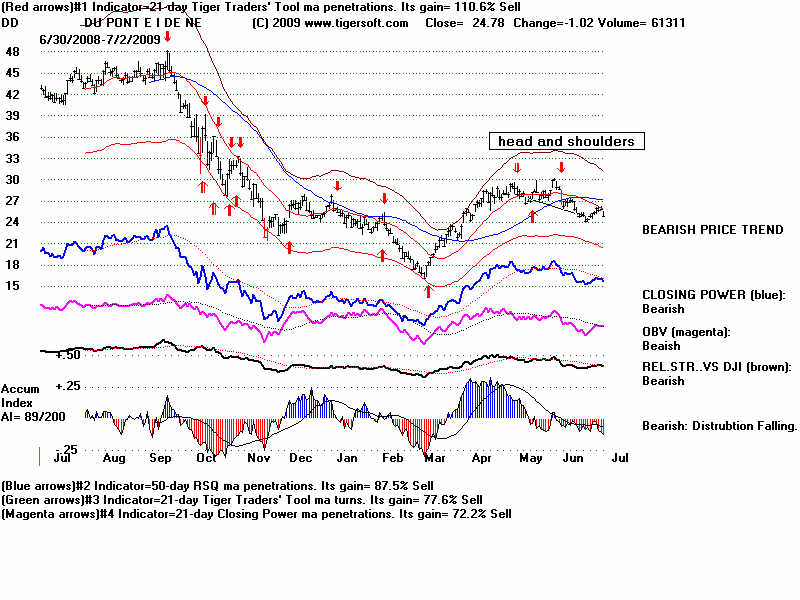
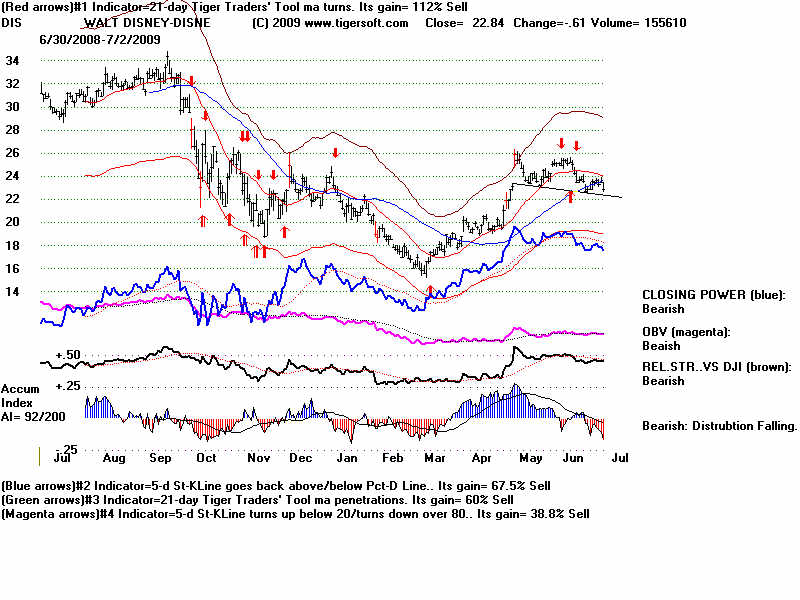
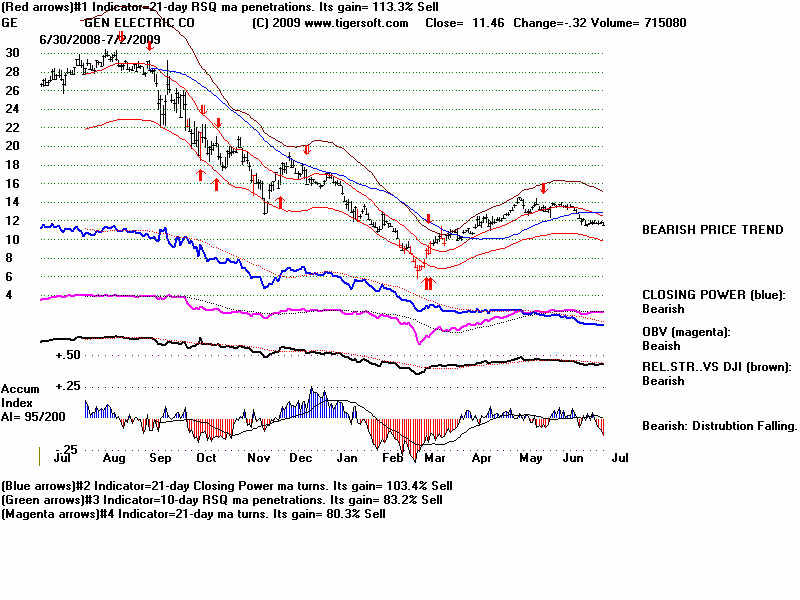
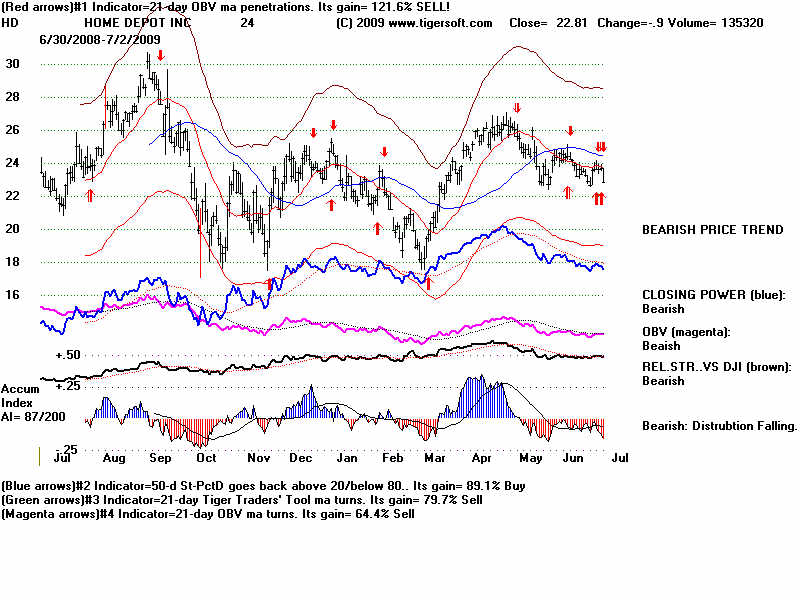
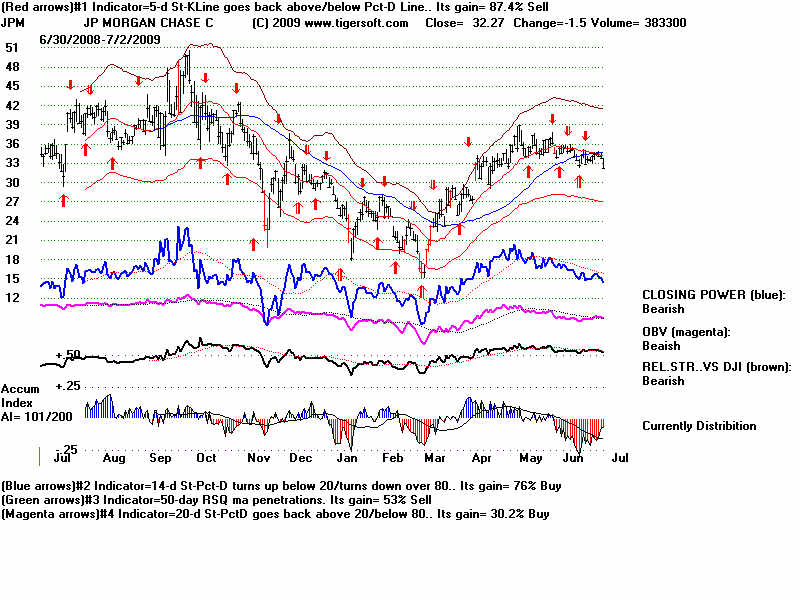
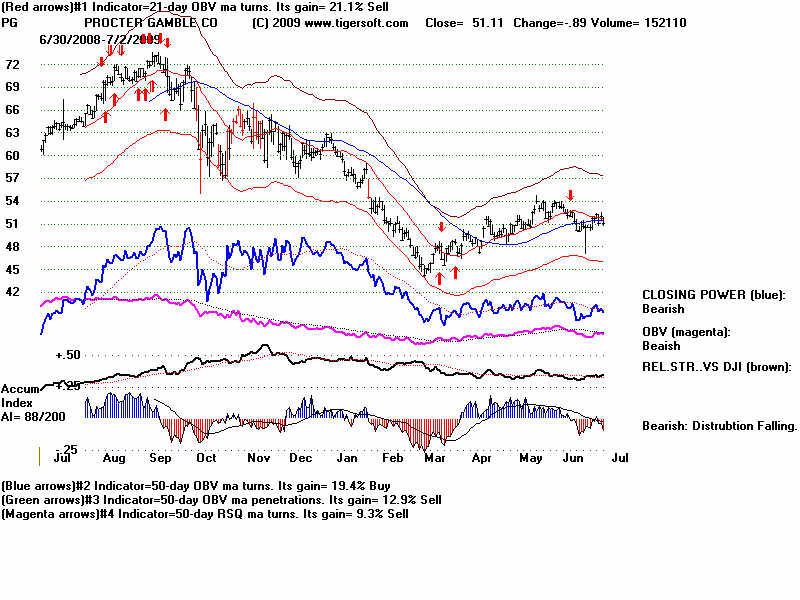
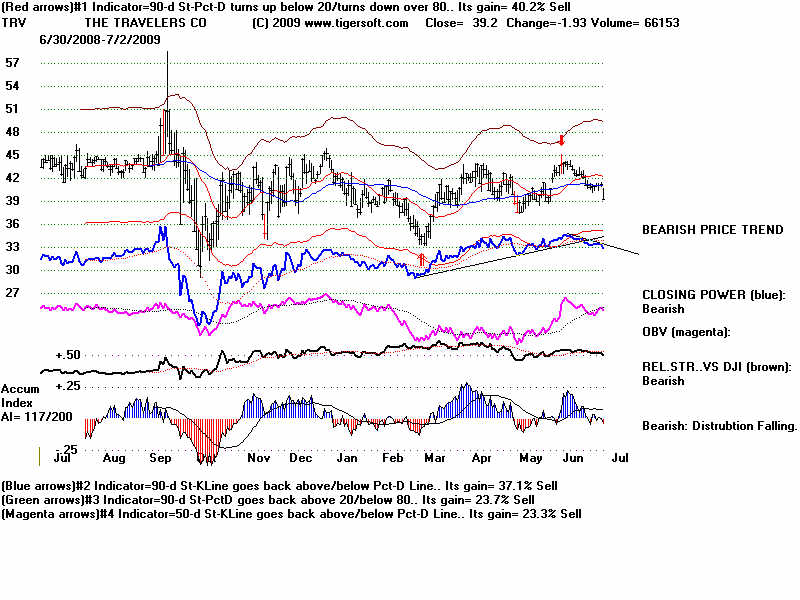
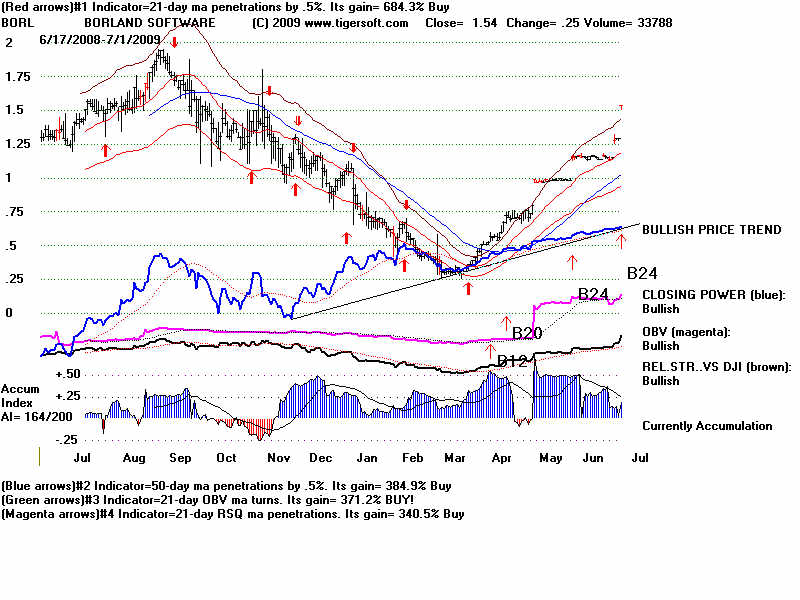
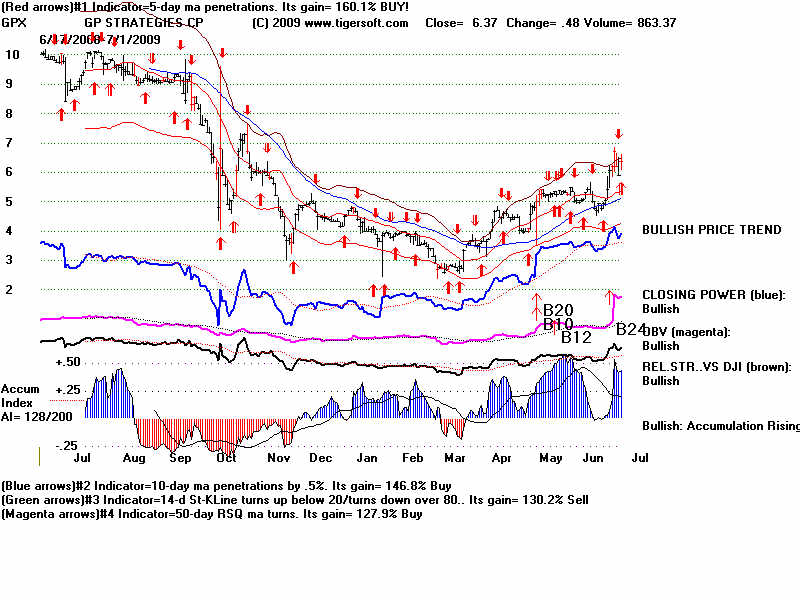
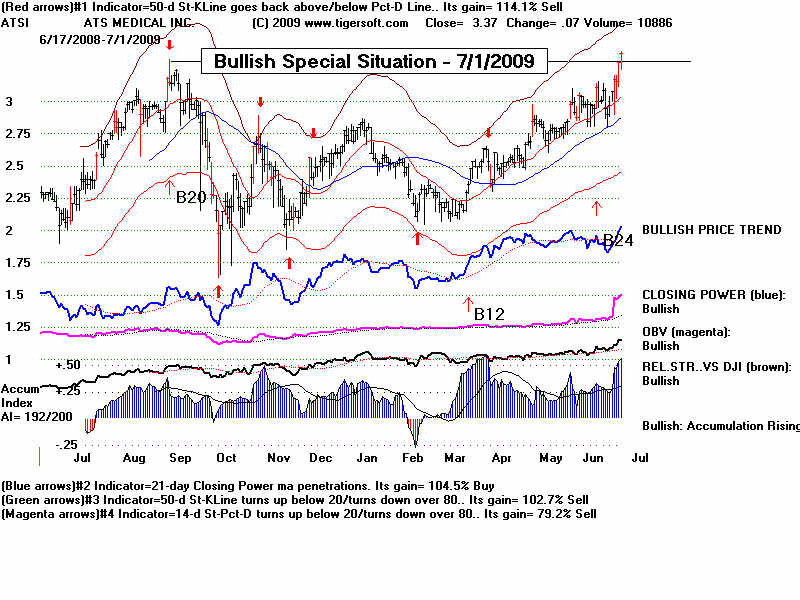
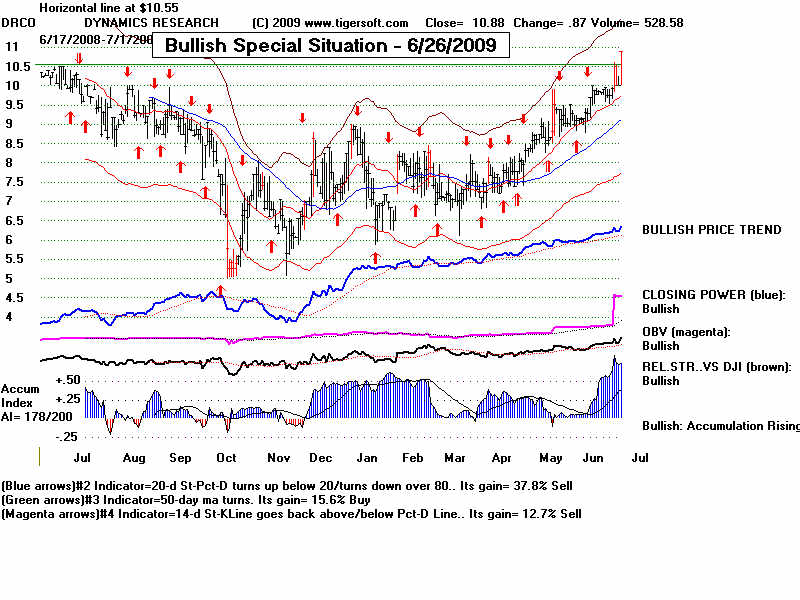
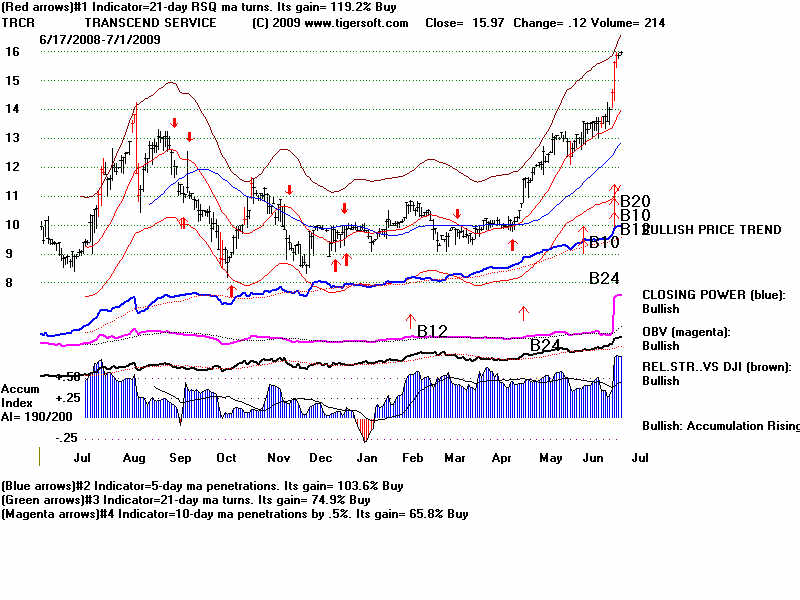
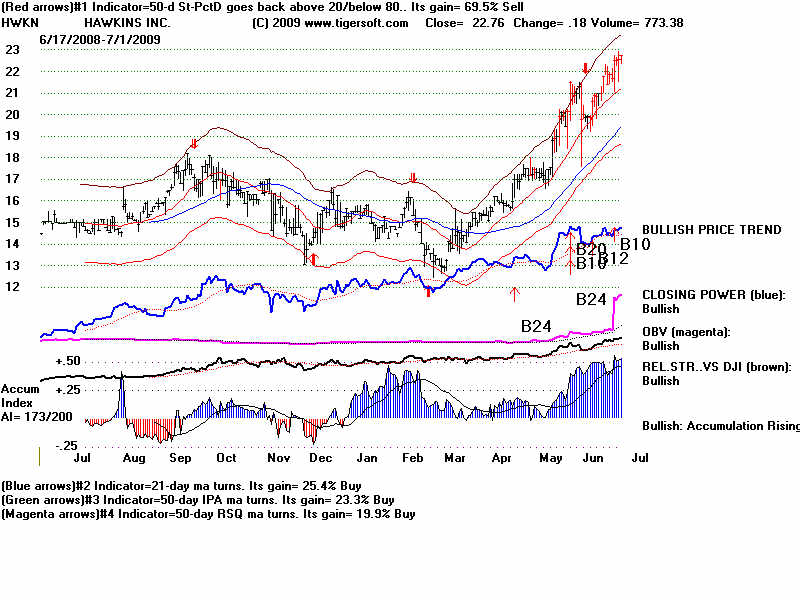
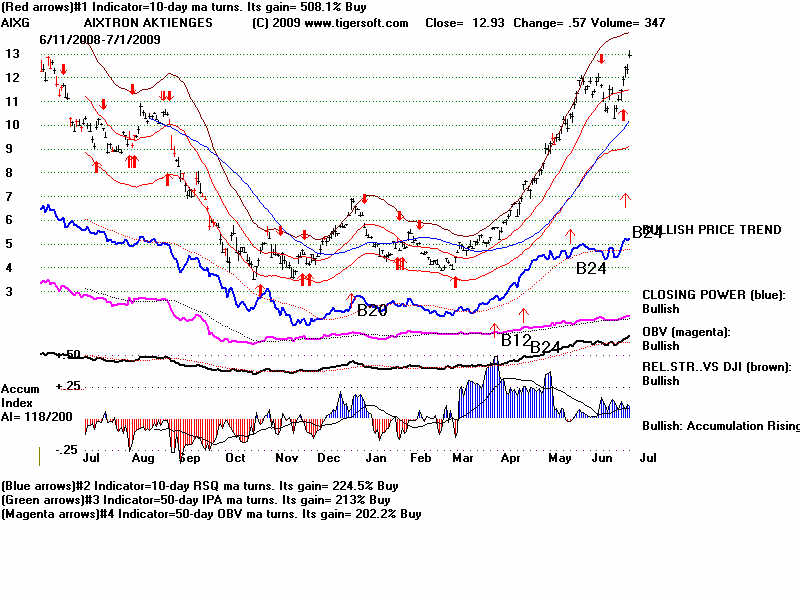
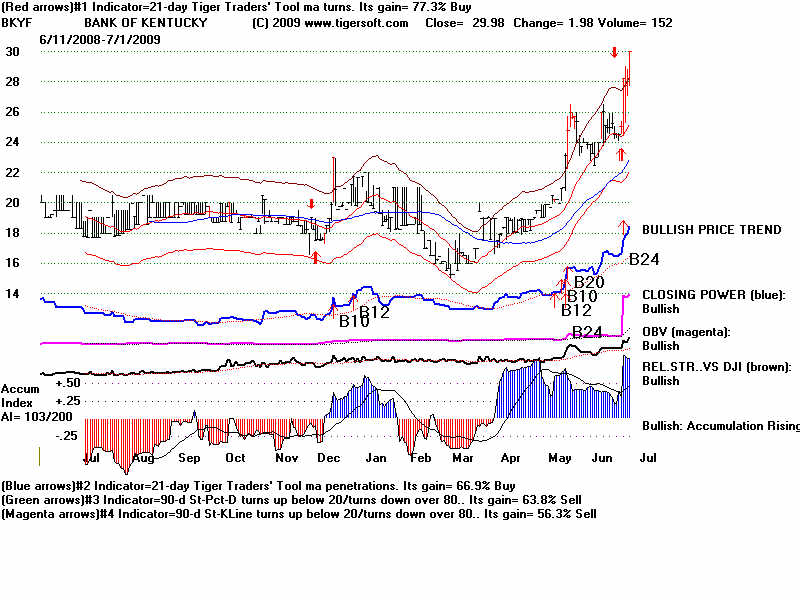
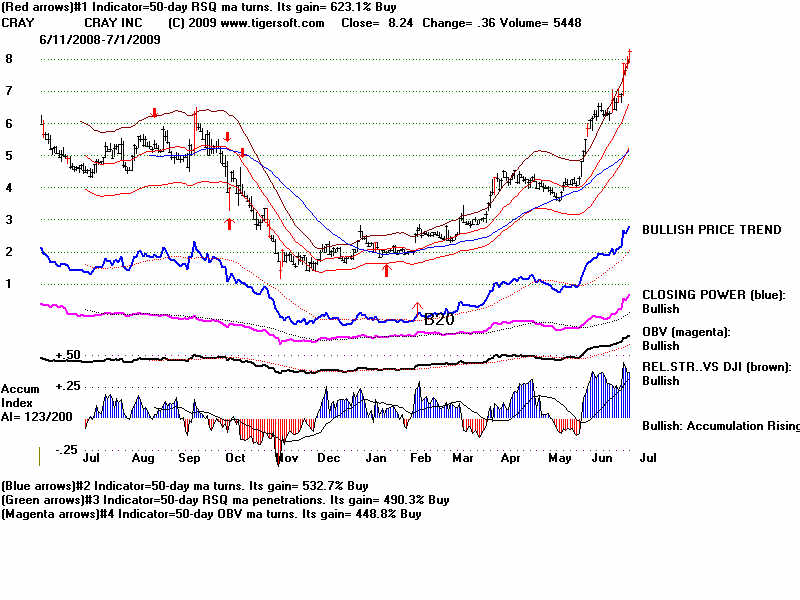
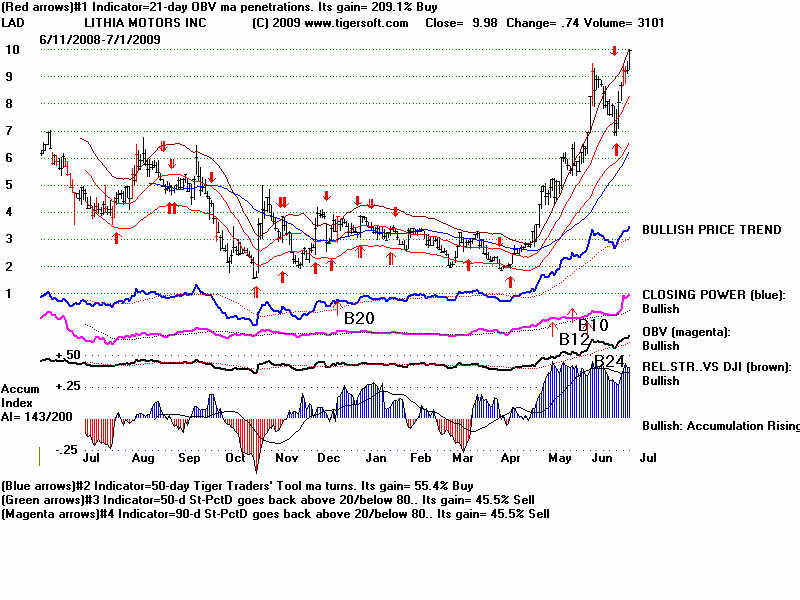
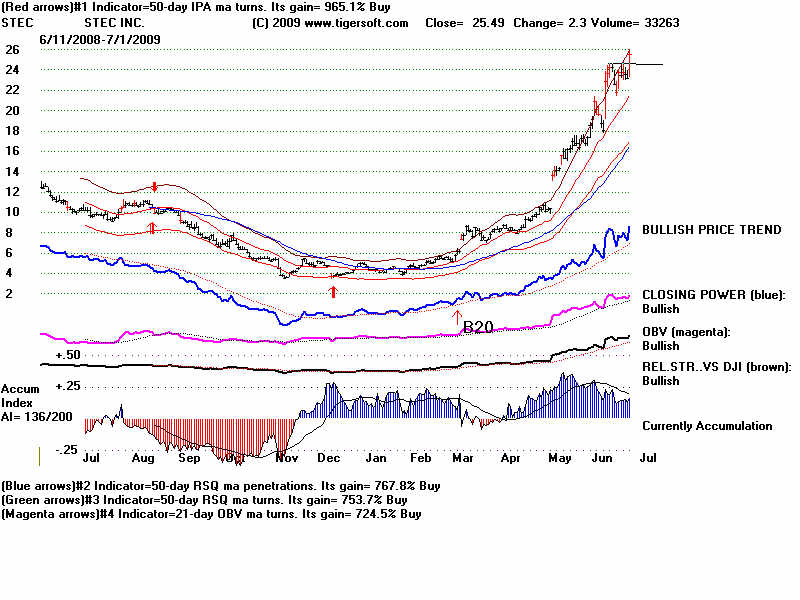
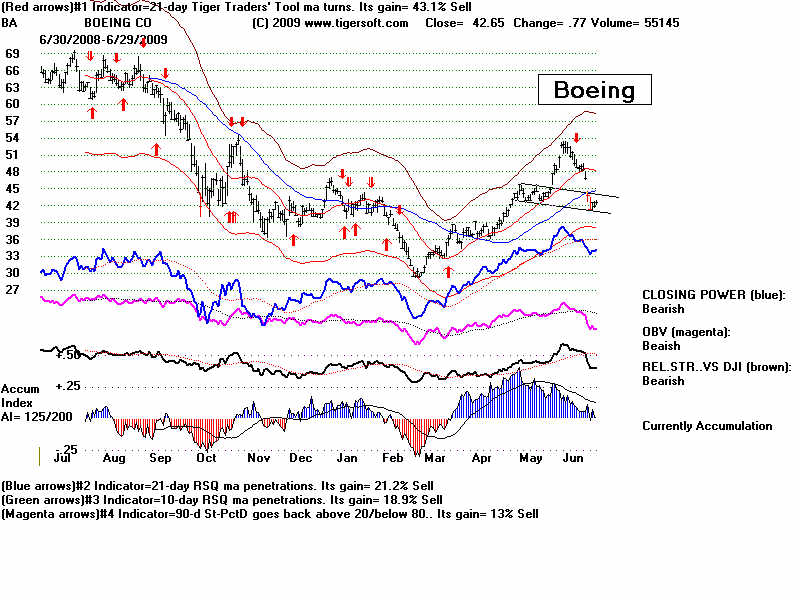
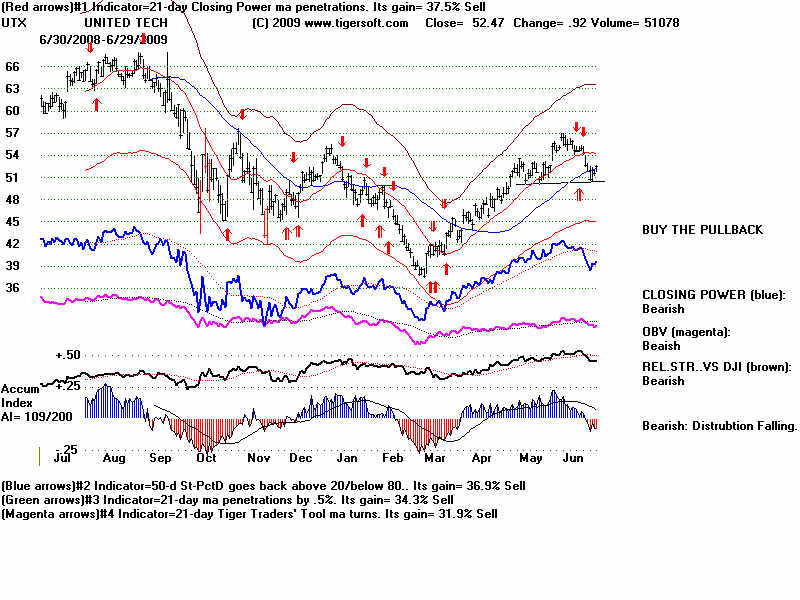
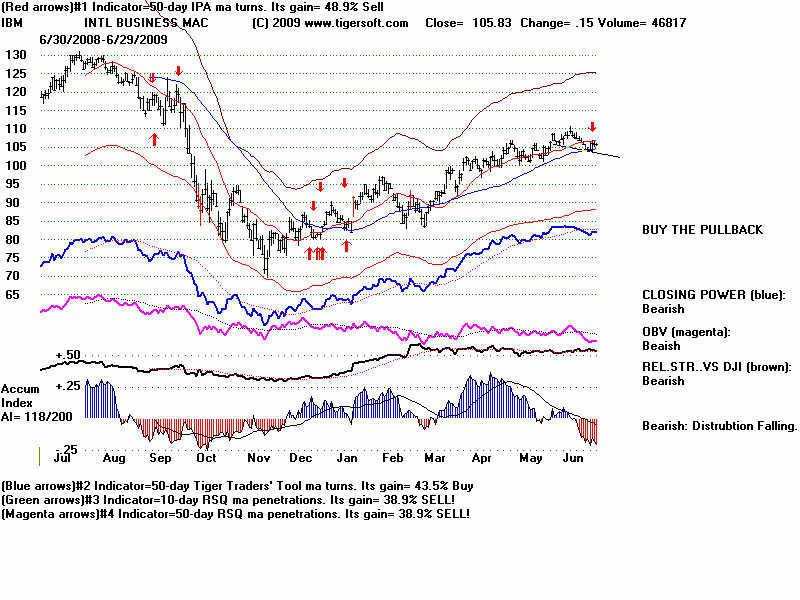
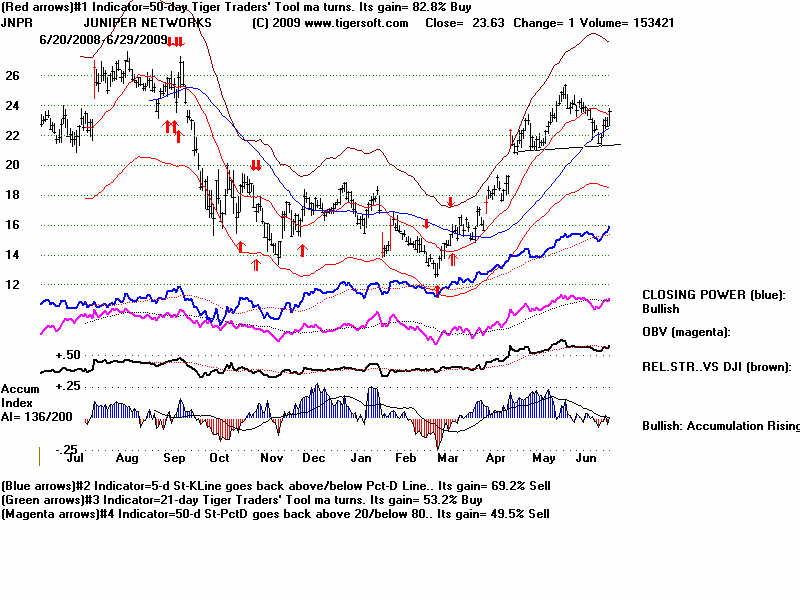
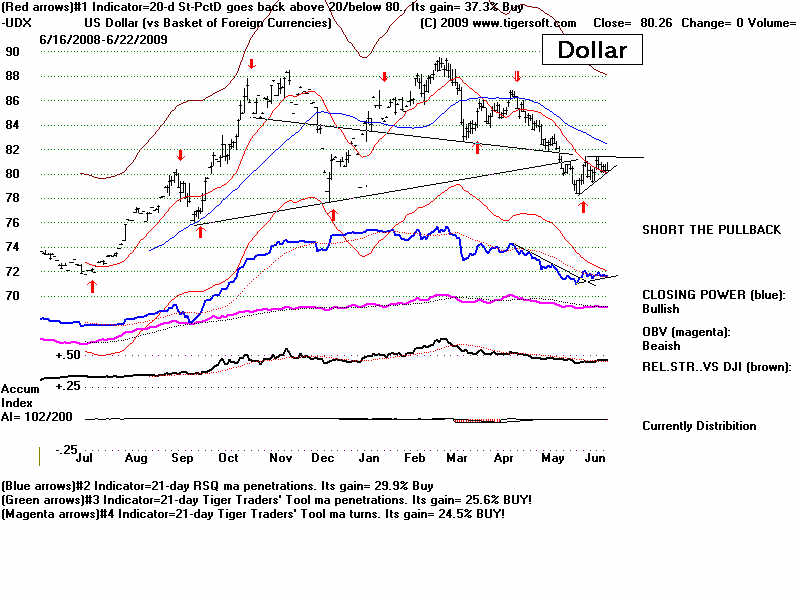
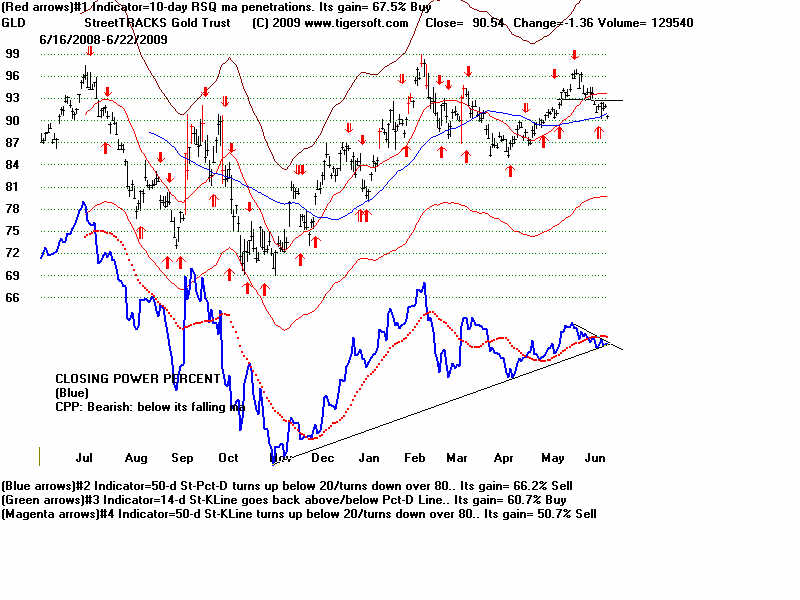
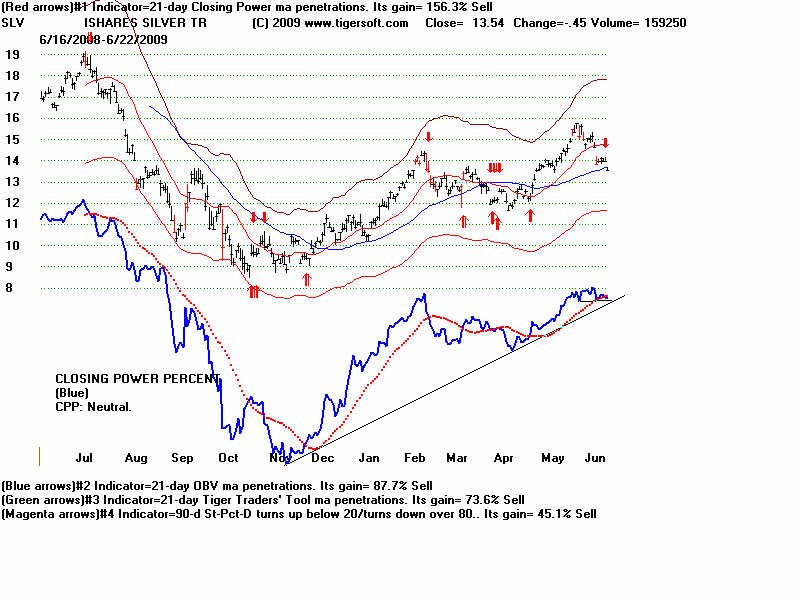
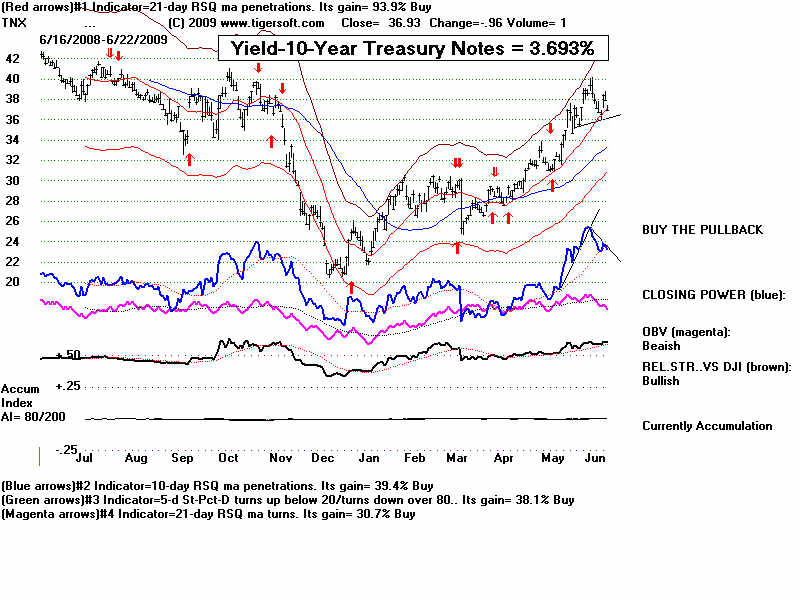
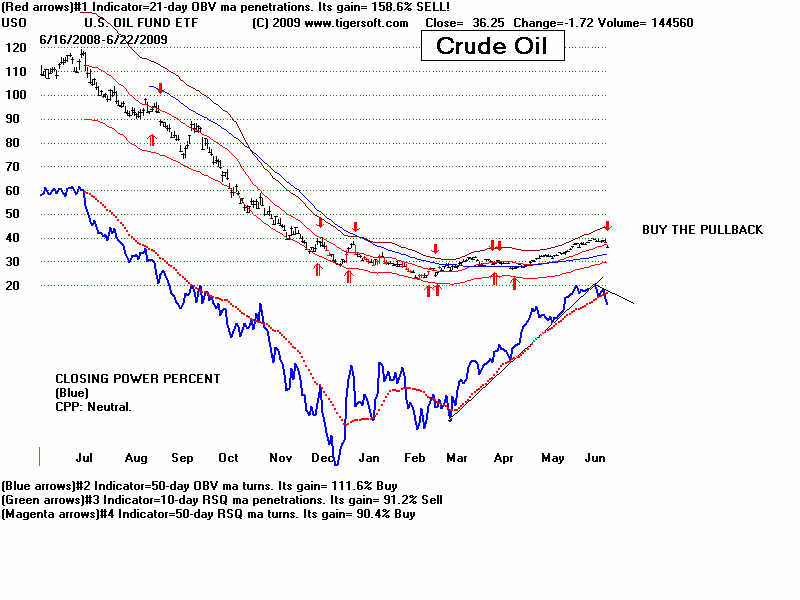
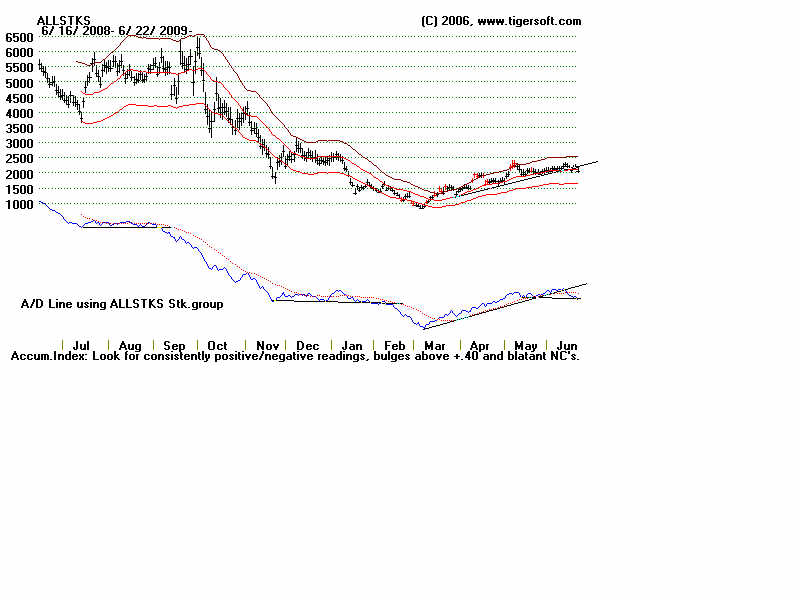
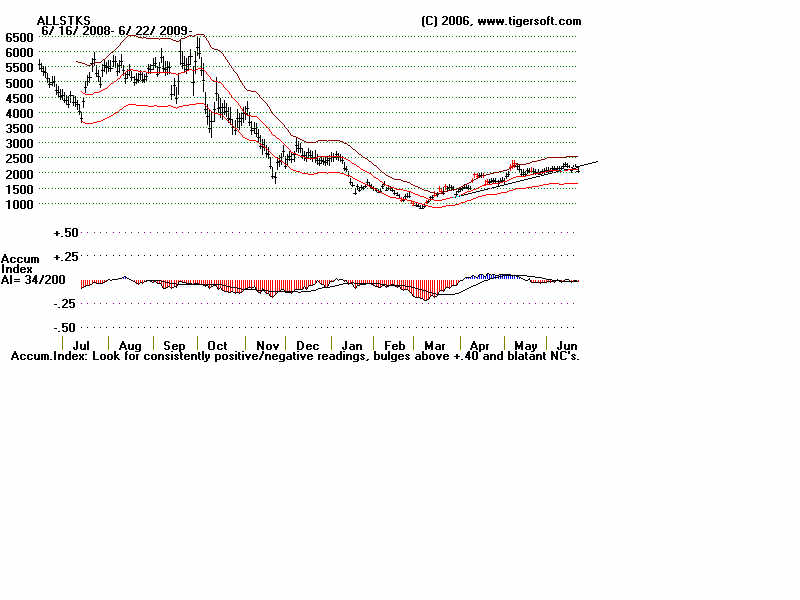
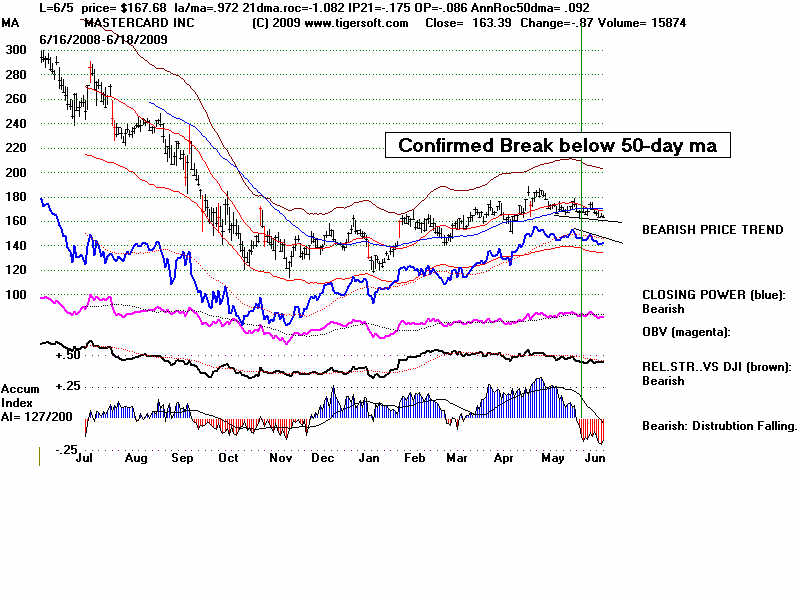
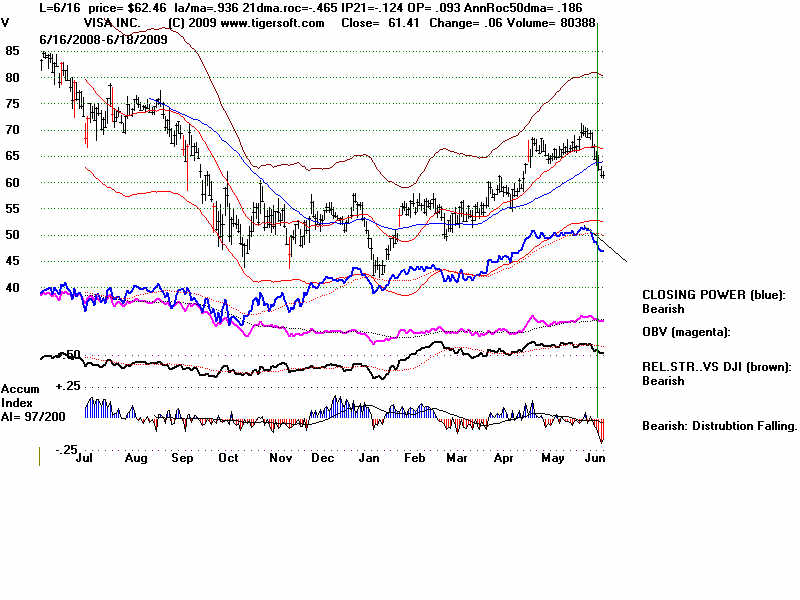
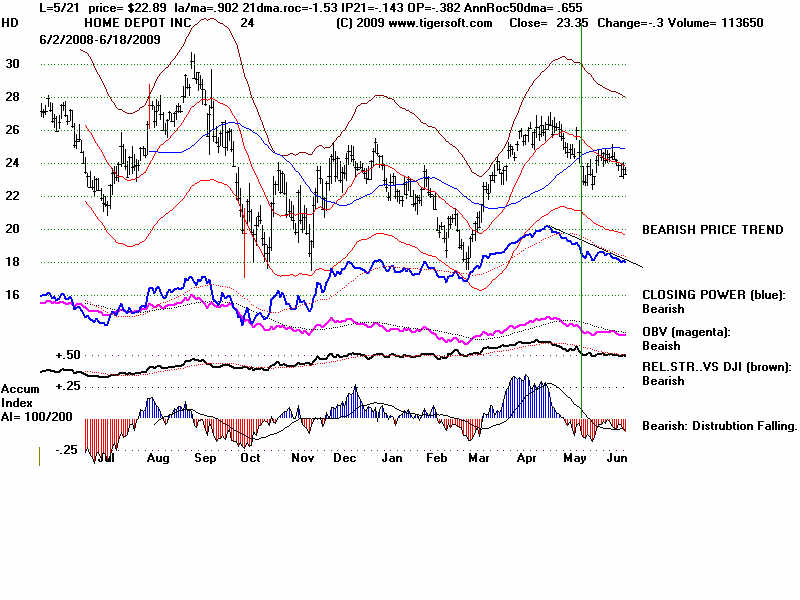
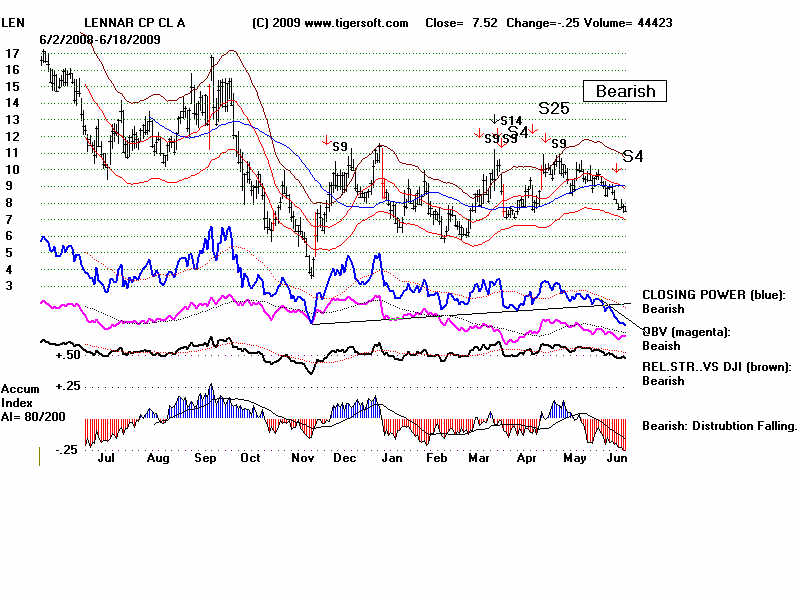
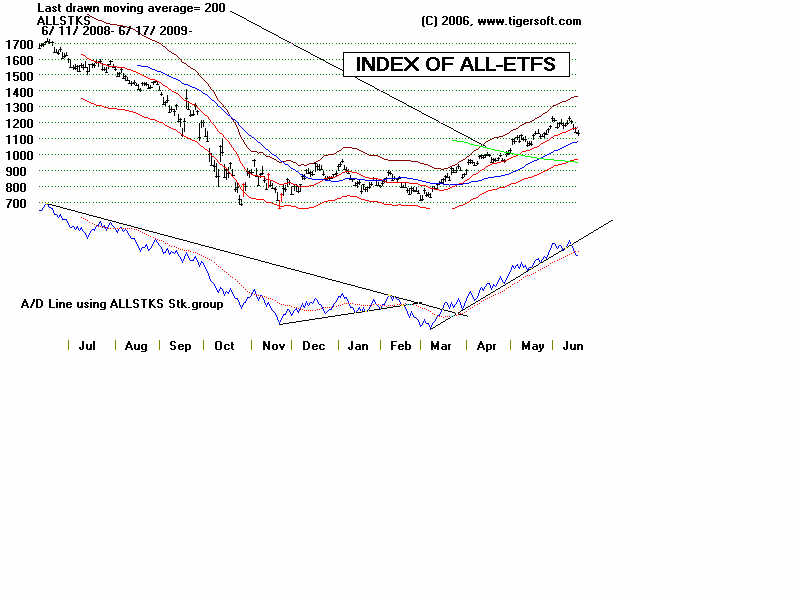
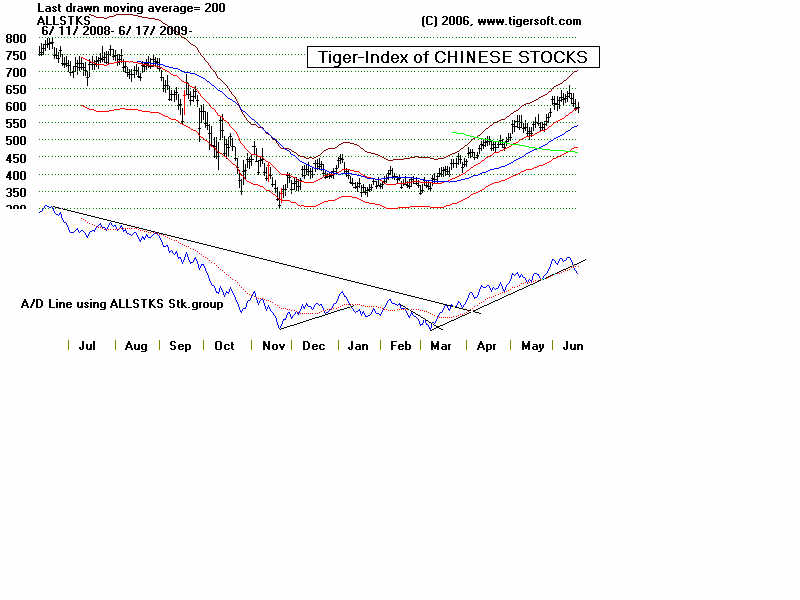
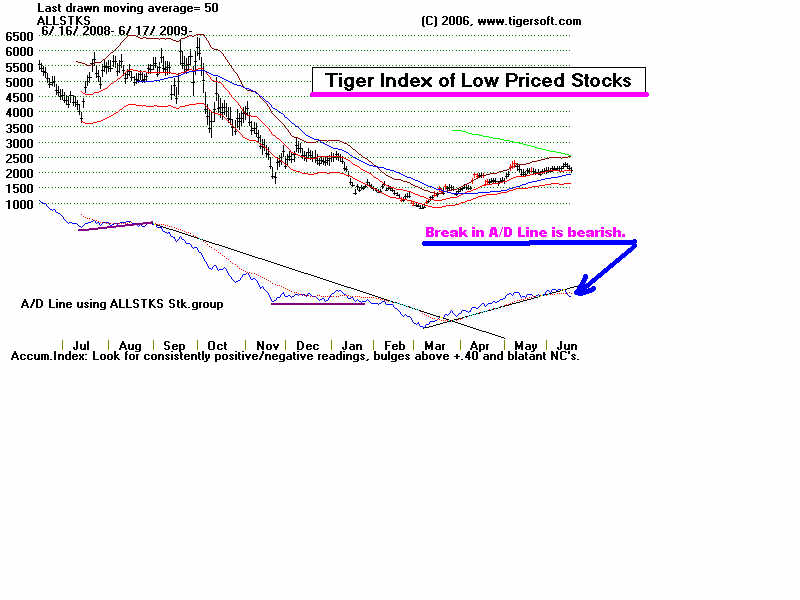
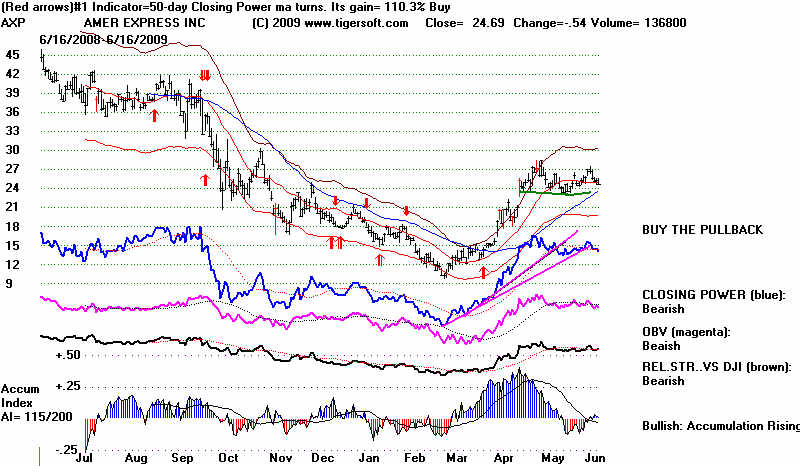
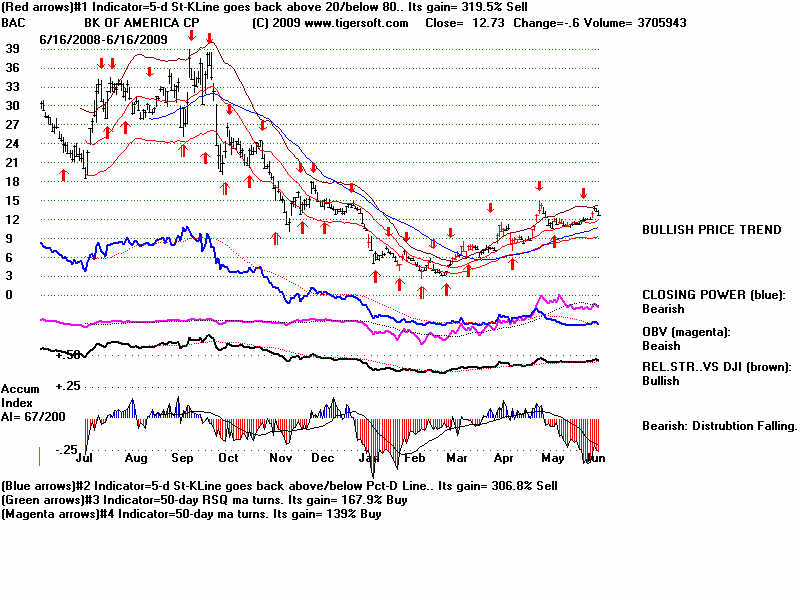
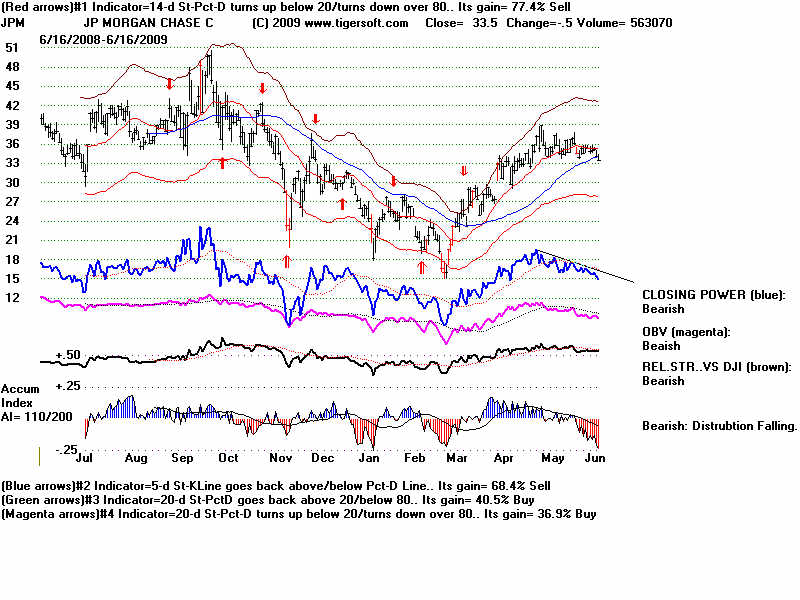
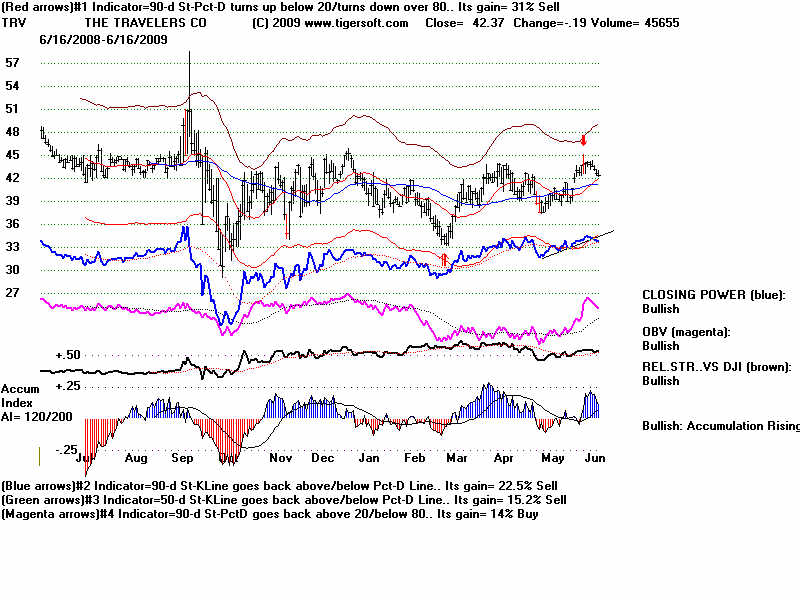
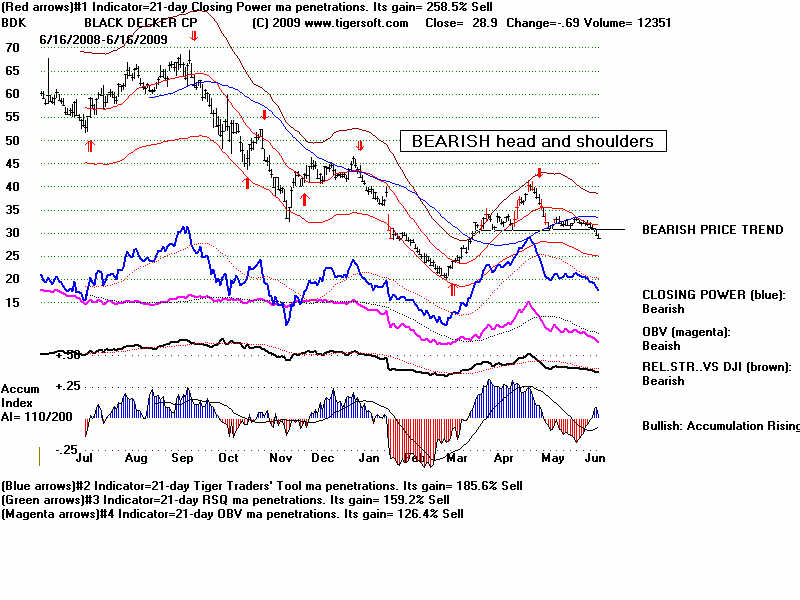
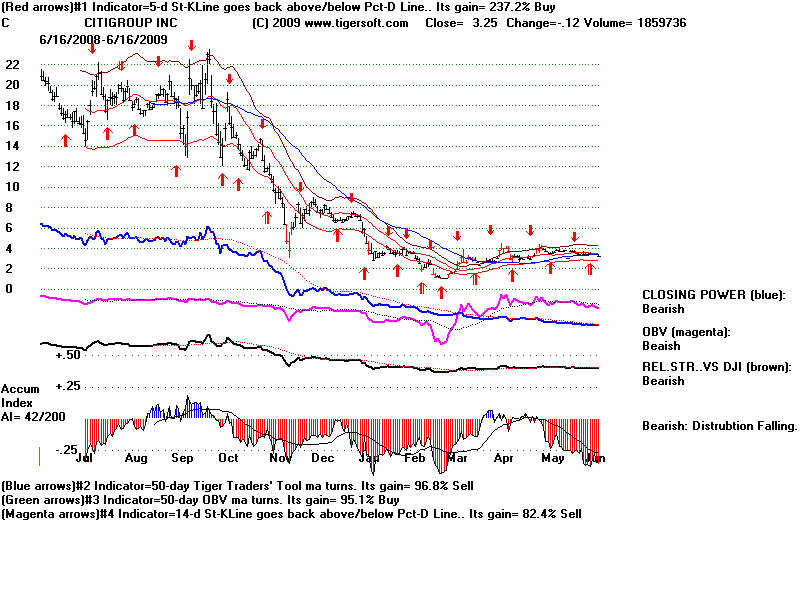
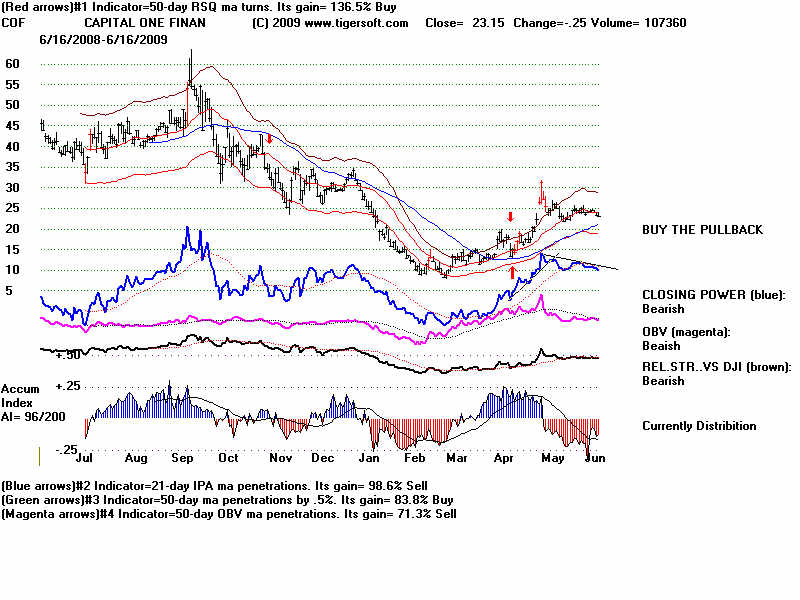
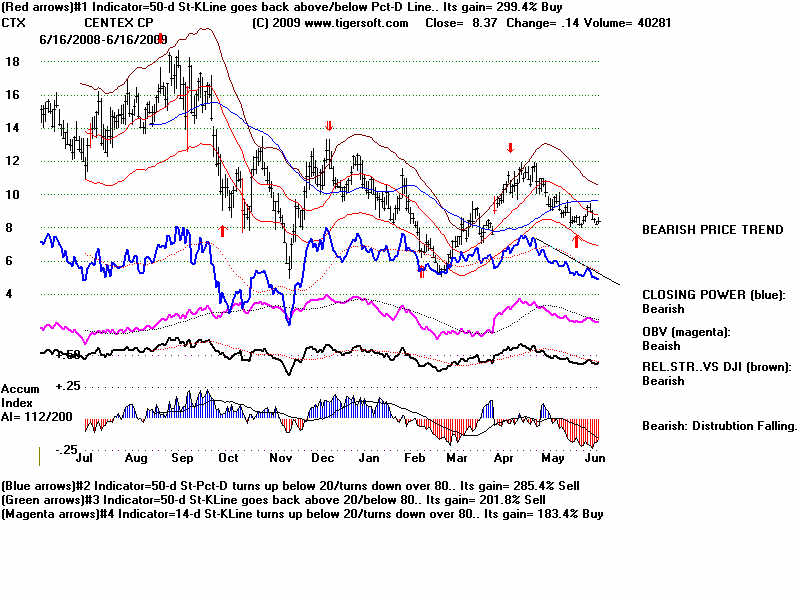
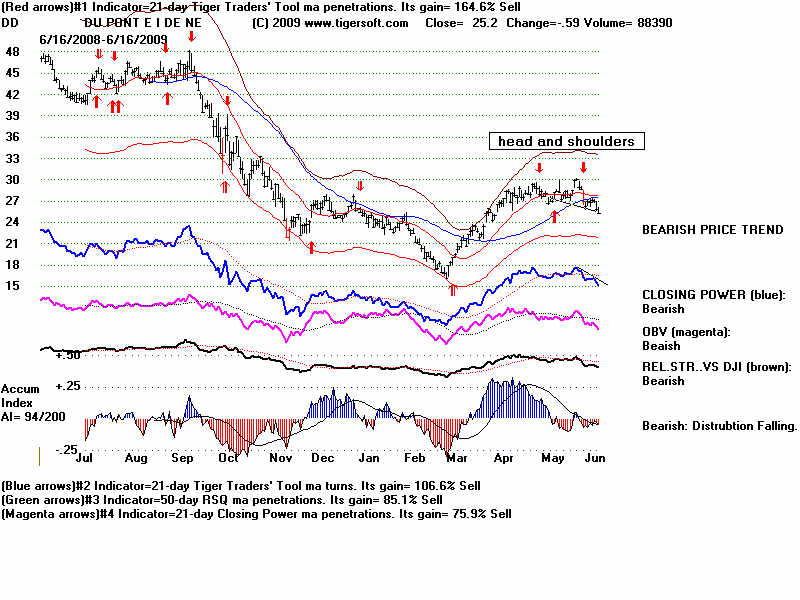
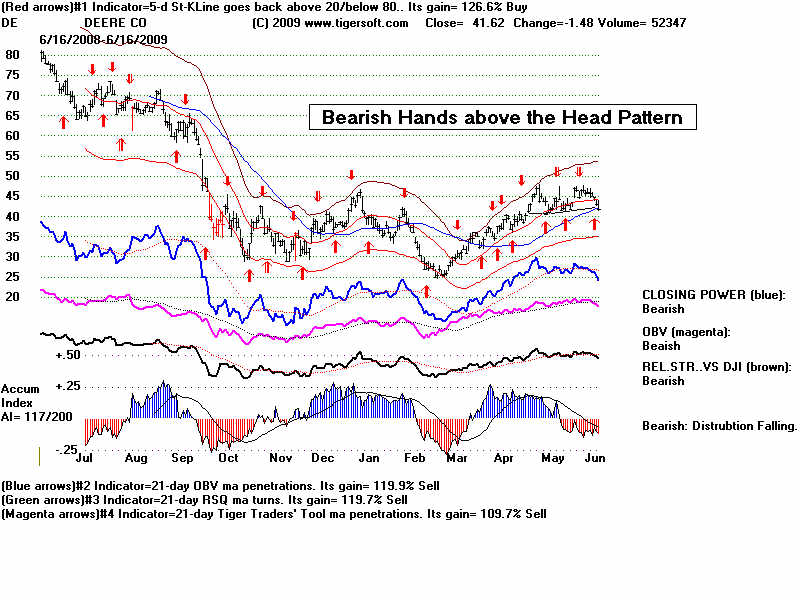
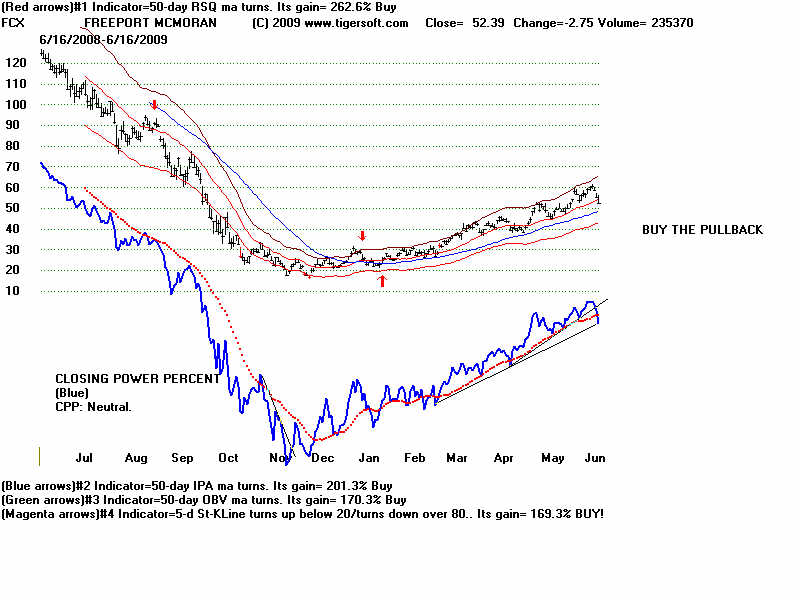
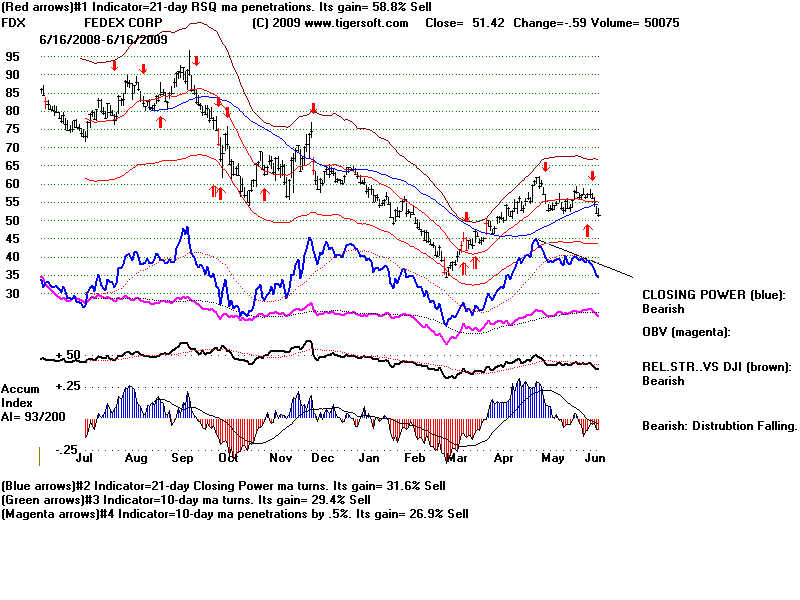
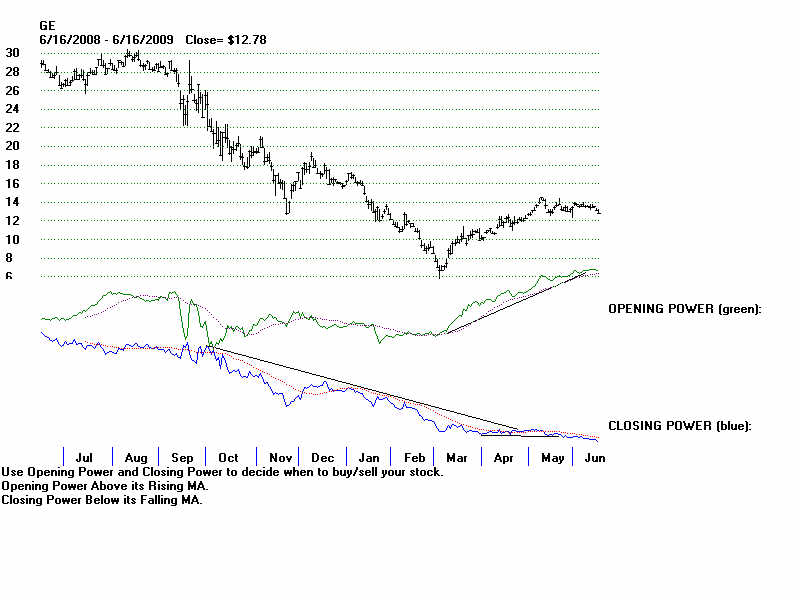
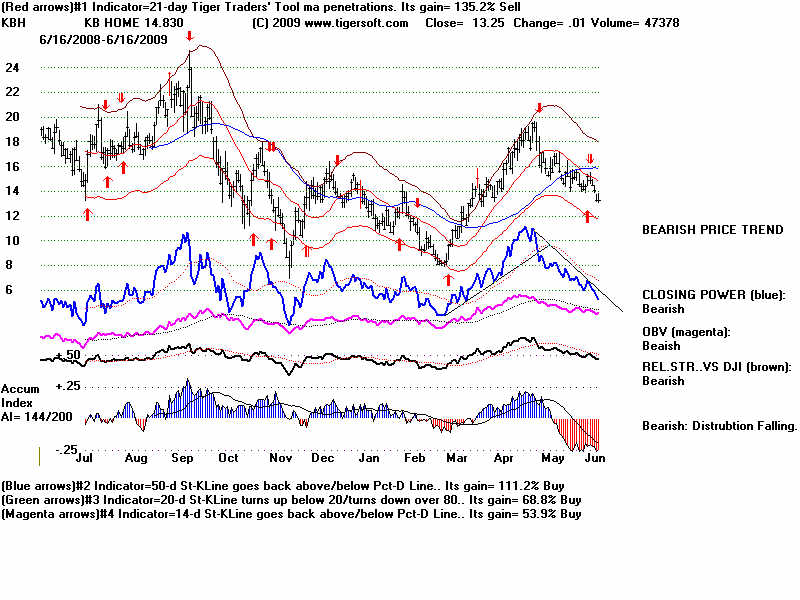
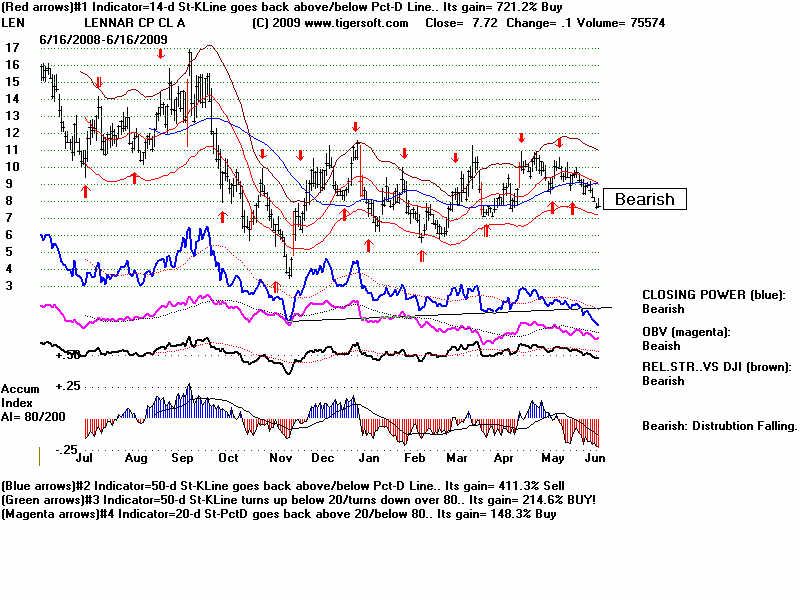
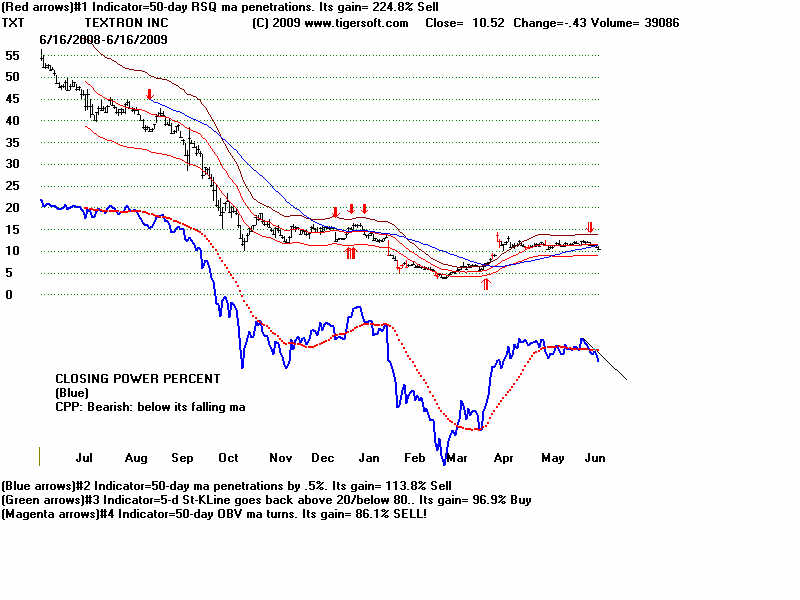
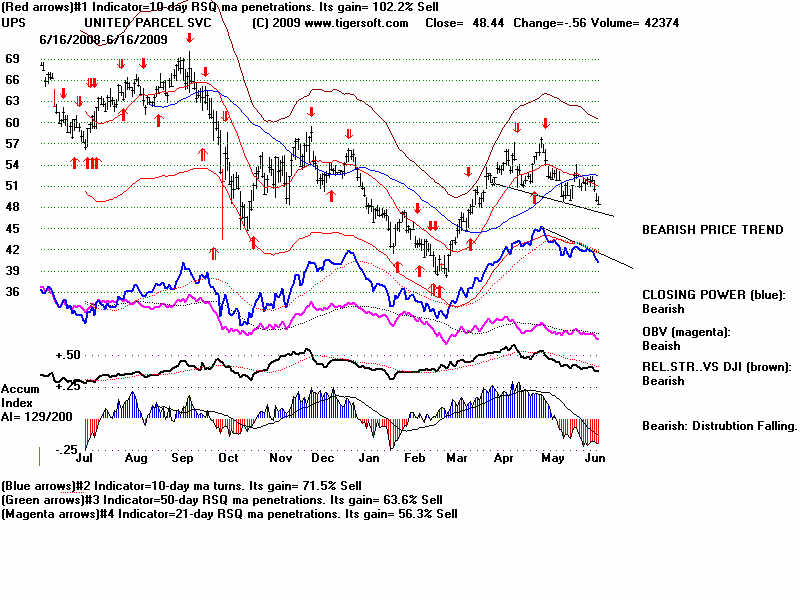