 TigerSoft and Peerless Daily Hotline
HOTLINES - 1/14/2010 - 2/12/2010
Important Notice: Redistribution of any text or concepts here is a violation of copyright laws. This is valuable intellectual property.
All violators will be subject to legal action. Please visit www.tigersoft.com Goggle TigerSoft and a technical subject, to get
additional examples and a further discussion of concepts and terms used here. See also our Books for sale. .
(C) 2009, 2010 William Schmidt, Ph.D.
===> Order form to Renew On-Line, "Nightly Peerless/TigerSoft Hotline " ($298)
Previous Hotlines:
10/21/2009-1/14/2010
8/30/2009-10/20/2009
7/31/2009-8/28/2009
7/1/2009-7/31/2009
6/14/2009-6/30/2009
5/1/2009 - 6/11/2009
3/30/2009-4/30/2009
NEW 2/6/2010 BLOG: Key Signs of A Market Top
TREND-BREAKS IN RECOVERY RALLIES FROM SEVERE BEAR MARKET BOTTOMS: SELL S6:
1930, 1932, 1933, 1937, 1938, 1971, 1975, 1983-1984, 2002
Judged Sell S6 - Computer cannot catch diagonal trend-breaks well.
2/12/2010 New Buy B17 Charts but No Text Here for this date.
Daily NYSE 40 (34) New Highs - NYSE 1 (4) New Lows Improvement from Thursday
Daily NASDAQ 43 (39) new highs - NASDAQ 5 (7) new lows. Big Improvement from Thursday
-----------------------------------------------------------------------------------------------------------------------------------------------------------
Overnight Market Action: Bloomberg Futures around the world before the US Markets open.
24-hour Spot Chart - Gold 24-hour Spot Chart - Silver Dollar and Currencies
5-Day DJIA - 2/12/2010

SPY and - PROFESSIONAL BUYING POWER

----------------------------------------------------------- NASDAQ -----------------------------------------------------------
NASDAQ shows consistently positive Accumulation A rally past right shoulder and 65-dma
would be very constructive, But first, it needs to reach the 2200 resistance there.


========================================================================================
--------- SUPERIMPOSED PEERLESS SIGNALS ON DJIA ---------
2/12/2010 10099 la/ma= .986
21dma-roc = -.674 P= -232 Pch= -58 IP21= -.008 V= -237 OPct = -.173


========================== DIA ==========================

NEW INDICATOR - TIGERSOFT PROFESSIONAL BUYING/SELLING POWER

QQQQ, Opening and Closing Power

NASDAQ Shows CCI Buy

=========================================================
2/11/2010 Buy B17 ETFs' Closing Power downtrendlines have been broken.
The 65-dma is judged to be the next target, based on what often happens after there
has been a break in a long A/D Line uptrend following a severe bear market. The goal
for this rally is 10,400 for DJI or about 2.6% above today's close; 111.30 for the SPY or
about 2.40 higher than today's close; 44.75 for the QQQQ or about 1.08 higher. It is bullish that
there are now more Home-Building stocks above than below their 65-day ma. Watch
leader HD, now at 28.99, to see if it can score a new high breakout above 29.4. The Tiger
Indexes for Oil and Gold stocks are still in uptrends and above their 65-dma. NOG and PVX
are two of the most "bullish" oil/gas stocks, as ranked by the Tiger Power Ranker. QPSA and
ISSI are two of the most Accumulated stocks among all stocks up the very most this year.
We often recommend traders work with the highest AI/200 stock in the DJIA on the long side/
HPQ is that stock. However, it is below the resistance of its 65-dma and the computer
rates as "bearish" its price trend, CLosing Powerm Relative Strength and Accum. Index.
If the DJI can get back above its 65-dma, the next barrier will be the point of breakdown, that
is the level at which the long DJI uptrend was violated. That is about 10545. Interestingly,
a rally to this level would also reach the resistance of the 3.5% upper band. Usually base-building
lasting at least two months is needed after breaks in long uptrendlines. .
========================================================
2/10/2010 New Buy B17 Not much new commentary, except it was interesting to
see Obama back-peddle about Wall Street CEO salaries. Today, he defended them, after last
week criticizing them quite harshly. Perhaps, he wants to shore up the market as he
did back in March last year when he assured Americans on the Jay Leno Show that
Wall Street had broken no laws in causing the financial collapse. Watch to see if
a strong close breaks the downtrends of the ETF's Closing Power for confirming BUYs.
| 12/10/2010 To
Pay or Not to Pay? Obama OK with New CEO Bonuses? Last week: Kenneth Feinberg, Obama's Pay Czar, Blasts Goldman Sachs CEO's $9M ...? Last week Obama sets executive pay limits - CNN.com |
2/9/2010 New Buy B17 But lengthy A/D Line trend-breaks like we saw recently (S6)
are more safely not reversed for a 3-3 weeks after the signal. So the Buy B17 is likely to
bring a rally only to the flat 65-day ma overhead for the DJI, QQQQ, SPY and many stocks.
The good news is that there has been no automatic Peerless Sell, as there was in the
nine earlier cases of Sell S6s and there has not been a string of 4 straight down days as was
true in each case of an earlier Sell S6/ The CLosing Power and A/D Lines are all still
declining. We would stay cautious and hedge. A failed rally to the 65-dma would
actually be bearish. as it would set up a bearish head and shoulders in the DJI and
NASDAQ and demoralize bulls.
The Dollar declined today. For two years, at least, it has had an inverse relationship to the market.
That the ETFs for Gold, Silver and Oil do not show rising CLosing Powers is a warning, I think,
that the reversal today in the Dollar may not produce a bigger decline in it. If the Dollar does
not weaken, the US stock market will probably not be able to get past the resistance of the
65-dma.


=======================================================================
2/8/2010 The Judged Sell S6 A/D Line Uptrend-Break
Is Still in Effect.
The ETFs' Closing Power Lines are still in effect. More SP-500 and NASDAQ-100
stocks are below their 65-day ma. The SP-500, NASDAQ and DJI are now at
their rising 30-week (149-day) ma. This should act as some support. The NYSE
is back to the support of its October lows. Its Accumulation Index and the NASDAQ's
have been (properly) since March. Ordinarily, a rally attempt would be expected.
However, breaks in A/D Lines after big advances from a severe bear market
(Judged Sell S6s) all bring deeper declines. That would suggest that any rally
next will be short-lived and not get past the DJI's 65-day ma. Let's watch to
seel if all the Accumulation that the NASDAQ chart shows can bring some kind
of a rally,
NASDAQ at Support with A Consistently Positive Accumulaton Index (AI/200=189)

===================================================================================
2/7/2010 JUDGED SELL S6 IN EFFECT - 18% AVG DECLINE FROM WHERE
A/D LINE BREAKDOWN OCCURRED.
SUMMARY: The DJI has fallen to the lower band and the rising 30-week ma.
The break in the NYSE A/D Line uptrend should, I think, be treated as a Sell S6.
Above is the study just done of all the cases like the present where there is such an A/D
break in a big rally up from a severe bear market bottom. Typically, there is much
more weakness. There was an average 18.8% decline in the DJI from the point
where the A/D Line uptrend was violated to the low in the DJI in the next four months.
Such breaks often have a rally to a flat 65-dma. That seems likely next.
One of the qualities that each of the 9 earlier A/D uptrend-break cases exhibited
was 4 straight down-days for the DJI. That has not occurred here. Another common
occurrence was a failure by the DJI to get past a flattened 65-day ma. Such
a failure took place on Wednesday. Another commonly seen characteristic
of these earlier Sell S6s, which is also seen here, was the four of more (red) down
days showing volume above the previous day's within a month of the trend-break.
A continuingly weak A/D Line is another trait in these S6s A/D Line breakdowns.
.
We may see a rally back up to 10400 to test the resistance of the 65-day ma
there. However, the ETFs' Closing Powers are in downtrends. The CLosing
Power Trend is our best way to determine what professionals and Wall Street
insiders are doing. Seeing the trends is easy and produces consistently positive
results.
A new tool is shown below in the A/D Line charts for groups of stocks. This is the
running percentage of stocks above their 65-day ma. Only 8.8% of the DJI
stocks are above their 65-day ma. Only defensive KFT and TRV in the DJI
show a rising CLosing Power above a 21-day ma. 74.5% of SP-500 stocks
are below their 65-dma. 71% of the NASDAQ-100 stocks are below this barrier.
Certainly, prices can rise back above the 65-day ma, but I would say the proof
should be left to them now to do it.
Be guarded now. Years that end in "0" have since 1890 all have had
significant decline. The 20% drop in 1950 was the least of them all.
Our Stocks' Hotline is short a number of weaker stocks and holds long a
handful of stocks still showing especially high Accumulation. Giving the
DJI several weeks to play out the bearishness of the A/D Line trend-break
is supported by the Sell S6 study. .
http://www.tigersoftware.com/TigerBlogs/2-5-2010/index.html Wednesday
SPY and Closing Power - Downtrendline Broken for a Buy


QQQQ and CLosing Power - Downtrend Line Break - Buy!


TIGER INDEX OF FINANCE STOCKS - At support.
TIGER INDEX OF HOME BUILDING STOCKS
Rally here must get past falling 65-dma's resistance

26 YEAR DJIA CHART

==========================================================================================
OLDER
HOTLINES
------------------------------------------------------------------------------------------------------------
2/4/2010 A Panic That Takes
Gold Down, Is A Very Dangerous Sign.
for the market as
a whole. While the drop today took the DJI only to the lower 4%
band, there are
plenty of worrisome technicals. The gap down on high volume
makes the
longer-term 30 yr chart show the DJI now coming down from the apex of a right
shoulder.
This is downright scary. A Buy B17 after long trend-breaks in a rally
from a severe
bear market low is not to be trusted. A 10% - 13% decline from the
top is the norm
in these cases. Instead of considering 10000 a likely bottom,
9200 or 9500 is
more likely, if we are lucky!


I have
suggested being hedged completely. This means selling stocks that
are below their
65-dma with weak internals (negative Accumulation.) My concern
is that the
situation could worsen, Obama's fiscal conservativism right now is dangerous.
The parallels
with 1937are eerie. With a 2/3 vote needed in the Senate, the US
is dangerously
close to being effectively grid-locked and unable legislateively
to adapt to new
circumstances, financial or otherwise. The worsening employment
picture cries out
for attention. Will it get it? Meanwhile banks will get more and
more populist
anger focused on them. Wall Street and stocks as a whole will thus
be under more
pressure. But I would emphasize fiscal policy most here. FDR's
reforms of
banking and Wall Street took place while the stock market was
nearly
quadrupling off the lows of 1933 just beforehe became President. The 1937
Crash grew out of
FDR's shift to fiscal conservativism to appease conservatives
in his party.
That was a big mistake. Obama should read about 1937, instead
of making a
speech every day.
Tiger's CLosing Powers
reversed steeply down today. The Peerless Buy B17
is in big trouble. The simultaneous
breaks in the 10 month up-trends of the DJI,
SP-500, OEX, NYSE, NASDAQ and NYSE A/D
Line uptrends were considered
dangerous two weeks ago. The DJI's
failure of the last rally to reach the upper band
and its rising wedge pattern were
additional bearish elements, along with the
clear breaking of the DJI's 65-day ma.
Yesterday, we noted it would be bearish
if the DJI proves unable to get past its
65-dma, but we were heartened by the
breaks in the CLosing Power
downtrendlines of the DIA and SPY (Tuesday)
and QQQQ (Wednesday). Unfortunatley
the market fell substantially more after
the openings today, so much so that new
CLosing Power lows were achieved.
That action makes their trends now DOWN,
especially in light of the increase
in volume today, the breakaway move down
and the simple fact that the DJI is
below its 65-dma. Today's breadth
numbers were abyssmal. There were only
277 stocks up on the NYSE and 2861 down.
Only 40 millions shares were traded
in the few advancing stocks.
What came as an unpleasant surprise was
how badly the market broke downwards
today, taking everything with it.
Our Stocks' Hotline will take profits in all but the very
highest AI/200 stocks and exit all long
positions where the stock is now below its
65-dma. We will add some new short
sales, too, among stocks making 12 month
lows today.
I believe there is a growing
awareness that Obama's fiscal caution and
conservativism will doom America
and the World to bad second dip in the
Recession. Since the DJI and
the market has assumed a "V" bottom, there
could be an ample snap-back,
perhaps even a 1937 decline. The parallels
between FDR in 1937 and Obama in
2010 are striking. I have mentioned them
here several times. These
ideas are expanded in the Blog that I wrote today,
http://www.tigersoftware.com/TigerBlogs/Obamas1937/index.html
Obama now keeps talking about trying to
better balance the budget in the
middle of a Recession. Of course,
this should be a long-term goal. But most
economists, certainly Keynesians at
least, feel strongly this is a disastrous way
to reduce unemployment or end a
near-Depression. In 1937, FDR tried to court
Southern Democrats by doing this. It was one of the key reasons for the 40%
DJI decline in the Fall of
1937. In 1938, FDR listened to Keynes, stopped heeding
his Treasury Secretary's advice and
loosened the purse strings again and the
market roared back. So, an Obama 1937-like
Crash cannot be ruled out. Remember
that years ending in "0" have a
bearish track record, going back to 1890.
Worse will be what happens when
Obama's next Stimulus and Jobs Bills are up
for a vote. The recession, one can
predict, will worsen with the new lay-offs that
his policy shift brings about coupled
with the big state and local government employee
layoffs. But in these desperate
times, Obama's pponents will use his own words
against him and he will be seen as too
vascillating and unsure to be trusted by
earlier supporters and independents.
Without effective Presidential leadership,
the 2/3 vote requirement will stand and
America will try to muddle through economically.
We will be revisiting what Japan went
through in the 1990s, Britain went through
from 1920 to 1939 and what America first
experienced in the 1930s. This will be very rough
on the stock market.
------------------------------------------------------------------------------------------------------------
2/3/2010
Tiger'S CLosing Powers Have Now
Given Buys, because their downtrends
on the DIA, QQQQ and SPY charts have been
broken above. With the Peerless Buy B17,
the odds favor a rally to the upper band.
But our Hotline remains hedged,
being long stocks above the key 65-dma
with positive internals and short
those below it with poor internals...
I hear Obama now talking repeatedly about trying
to better balance the budget in the
middle of a Recession. Of course, this should be
a long-term goal. But most
economists, certainly Keynesians at least, feel
strongly this is a disastrous way to
reduce unemployment or end a near-Depression.
FDR tried to court Southern Democrats in
1937 by doing this. It was
one
of the key reasons for the 48% DJI
decline in the Fall of 1937. In 1938, FDR
listened to Keynes, stopped heeding
his Treasury Secretary's advice and loosened
the purse strings again and the
market roared back.
So, Obama's 1937 cannot be ruled out.
(I have yet to hear anyone mention this
on CNBC.)
The Buy B17 that now operates produces a profit in more than 90% of its cases.
But January and Febriuary B17s are much weaker
than B17s that occur in
the rest of the year. The 10-month
uptrend-line breaks in the NYSE A/D Line and DJI are
important. Many people draw such
trendlines and have learned that the market
is apt to weaken for two or three months
afterwards, while it builds a new base,
often 10%-13% diwn from the peak. Still,
our Buy B17 now may surprise the pessimists.
A/D Line strength this past year has made all
the difference technically. There|
are certain to be fund managers who will buy on
the weakness that the market
has not conveniently provided much of since
last March's bottom. The internals
of the market are not deeply negative. In
fact, the Accumulation Index (IP21)
is positive.
I have said to delay buying until the CLosing
Power downtrend-line of the
ETF you are trading has broken its down-trend.
Such trend-breaks have
gained better than 40% trading only the long
side this past year. To be sure,
there are variations in its effectiveness over
the years. But it is reliable
and seldom produces big losses. Key
strength after the opening should be
expected pattern now. Another rally to
the 65-dma is needed, if only to show that
that resistance there cannot now be overcome.
A move past the 65-dma should
get the DJI to reach the upper band. But
the failure to get past the 65-dma
in a week from now will be bearish, as this
will turn down this key momentum indicator.
Today the
DJI's rally stalled at the key 65-dma. When you look at a great number
of stocks, you may be struck by how oftem that
moving average divides a stock
which holds up and then rallies from a stock
which breaks that barrier to the downside
and has trouble getting back above it.
Here are some examples in key SP-500 stocks:
AAPL = Below 65-dma, at its resistance as ma flatens out, weak internals
ABT - Bouncing up from 65-dma with Bullish internals
AMZN = Could not rebound up past 65-dma, at its resistance as ma flatens out, weak
internals
ANF = Cound not rebound up past its falling 65-dma and finally gave up trying.
AVY - Fell below 65-dma support late last week. Bearish internals. Unable to
rally.
AYE - Unable to get past falling 65-dma in December and then caved in as internals
weakened.
BMC - Unable to get past flat 65-dma ;ast week and slipping again.
DOC - Bouncing up from 65-dma with Bullish internals
This demonstrates that not all stocks or
industries are breaking down. The key general
market ETFs are an amalgam of many stocks.
Looking more deeply, You will be able
to judge which industries still have upward
momentum, by checking out their key
representatives in the DJIA or by producing
Index charts with TigerSoft.
Presently, we have no count of stocks above their
65-dma, though the Power-Ranker
gives this information for the 50-dma.
Because of the importance of the 65-dma,I will
work on new software to let us see a year's
chart of the percentage of stocks in a
Tiger directory that are above this ma. I hope
I can show it tomorrow night.
Using Closing Power trend-breaks you will often
be able to better time Peerless and
TigerSoft signals more safely. The
trend-breaks can be used to clinch these signals.
The same thing is true with chart patterns and
internal strength divergences. Thus
gold stock ANV's internal stremgth weakness at
its recent highs was clinched as
bearish when ANV's CP uptrend was violated.
We could then re-enter the stock
recently at its base when the CP down-trend was
violated. And we can now either
Sell at the apex of the potential right
shoulder or wait for the next CP uptrend violation.

---------------------------------------------------------------------------------------------------------------
2/2/2010
The DJI's Closing Power's Down-Trendline was BROKEN today.
That should make the Buy B17
sufficiently reliable to add to long
positions, even though the
trade may only take the DJI to the upper
band. The Closing Power
of the QQQQ is stil declining.
Home-Buildng Stocks are rebounding and seemed headed back to
the top of their
channel. Improving home prices will aid recovery by
taking pressure off
homeowners and banks (Wouldn't want to forget the
banks!>?)
Oil Stocks Are Doing Well. They are the leading group now. The Index has
rebounded from its
rising 65-dma. Watching for stocks that are holding at their
65-dma with postive
Accumulation is a good trading strategy. Watch NOG.
Thought it shows a head
and shoulders pattern, its high Accum will probably
over-ride that.
Chinese stocks recovered today from their rising 65-dma. See the chart below.
.
Buying stocks with good IP21 (Accumulation) levels at their rising 65-dma
gas yielded an
unusually high percentage of the best rebounders of the last two
days. These
stocks are up more than 10% since Monday morning:
ALV, AMR, BEAV (shown
below), ENT, CY and CBT.
A 11% correction is
possible. The DJI must get past the resistance
of its
65-day ma. But trend-breaks in the CLosing Power following
Peerless
signals are reliable. Breadth was good today. The NYSE A/D
Line
downtrend has been broken.
DJIA 1975


--------------------------------------------------------------------------------------------------------
2/1/2010 Buy B17. Wait for Closing Power To Break Its Downtrend to Buy More.
Good Rally Today, but
Closing Power Down-Trendlines Are Still Intact,. Another
good rally after the
opening tomorrow would break downtrends very likely..
So, despite the Buy B17, It Will Be Safer To
Wait for The Closing Power To break
Its downtrend
The key ETFs all show CLosing Power downtrends. Wait for the Closing Power
lines in the charts
below to rise above their downtrendlines before buying SPY,
QQQQ, DIA, USO or GLD.
The CLosing Power downtrend dropped further today.
Keep in mind that
CLosing Power jumps up by how far above the opening the close
is, but falls by far
the close is below the opening. Jumps at the opening like today's
are risky to buy into
when the CLosing Power is in a downtrend. Openings are also
dangerous to buy into
when the Tiger Day Traders' Tool is in a downtrend. This shows
that there is likely to
be more weakness than strength after an opening, because the
difference from the
daily openings to the daily lows is greater than to the daily highs
Personally
I still think a 11% correction is most likely, now that the key
uptrendlines have been broken, like we saw in 1975. The internal strength
readings
now, especially breadth, are much stronger than in 1937.
One day
rallies and next day fizzles just below the 21-day ma are what we should
look for if
the DJI matches npw the sell-off in 1975. On the other hand,
a
continuation of Monday's rally with good breadth and a closing near the
high should
make us more optimistic. Breadth was good today. Another's
day's
advance would be most helpful.
---------------------------------------------------------------------------------------------------------
1/29/2010 Buy
B17. Wait for Closing Power To Break Its Downtrend to Buy More.
There is hope, I think. New lows on the NYSE and NASDAQ did not expand
Friday
from Thursday.
Despite Friday's wearkness, there was no support failure in either
the Tiger Index of
Home-Building or Financial Stocks. HD rose +.67. The strength
in the Dollar is
helping the FED keep intererst rates low. It is also hurting Gold, Oil
(CVX -1.12) and XOM
(-.53) and exporting companies, particular high techs. The tech
wreck continued Friday:
IBM - 1.36, MSFT - .98, HPQ - .72, INTC -.52 and QCOM - 1.29
(-7 in two days.)
I would also suggest that tech stocks are traded more technically than
other stocks. The
break in the uptrends of the DJI and NYSE A/D Line have more
sway here.
1937 Again?
The weakness in industrial malterials stocks (since 1/11/2010: AA - 26% and
FCX (-24%) that we are
now seeing is a warning that the dreaded second economic
dip is starting.
The boost by the Government of autos and home--buildings is ending.
2009's buying
"spree" growing out of postponed buying in 2008 and replenished
inventory-building
appear to be ending. Military stocks like BA have held up well.
The average consumer
remains tapped out. Will the government make up for the
missing buying?
Maybe not.
Importantly, Obama is now talking of balancing the non-military parts of the budget.
That was the
mistake FDR made in the beginning of 1937, with dire consequences for
both the stock
market, the economy and employment. Reading about 1937 is
very helpful
here:
Bruce Bartlett "Is Obama Repeating The Mistake of 1937/"
1937-1938 Wikopedia: http://wapedia.mobi/en/Recession_of_1937%E2%80%931938
The DJI had almost quadrupled under FDR from his Innauguration in March 1933
(53.80) to March 8th (192.70). So, his Treasury Secretary, Morgenthau, was able
to sell FDR on the notion that the stock market was over-heating and another 1929
crash could be avoided by tightening fiscal policies. Was he wrong! Here are
1937 and 1937-1938 charts...
DJIA
1936-1937

DJIA 1937

DJIA 1974-1975
Personally
I still think a 11% correction is most likely, now that the key
uptrendlines have been broken, like we saw in 1975. The internal strength
readings in
the general market are stronger than in 1937.

---------------------------------------------------------------------------------------------------------
1/28/2010
Buy B17. But Wait to Buy More.
Wait for The Closing
Power Down-Trends To End before Buying more.
There is still a risk
of a weak close. The 1975 example is the closest historical parallel
I can find. A
10%-11% retreat from the peak occurred then. Such a decline
would take the DJI down
to 9500. When closings are strong, the rally will last.
While Wall Street probably
should not fear Obama very much, at least not directly,
it is likely that his
rhetoric legitimizes populist anger at Wall Street bankers'
(1) culpability in the 2008
Crash, (2) their absurdly high levels of pay given
their value to society and
(3) their special treatment at the hands of the last three
Administrations' Treasury
Secretaries, each of whom had particularly close ties
to Goldman Sachs.
It Will Be Safer To Wait for
The CLosing Power
Down-Trends To End before buying more.
Wall Street Fears Obama's Truman-Like Rhetoric. The
DJI made very little lasting progress in Truman's first term.
4/13/1945 DJI = 159.80
6/13/1949 DJI=161.60.
The key ETFs all show CLosing Power downtrends. Wait for the Closing Power
lines in the charts
below to rise above their downtrendlines before buying SPY,
QQQQ, DIA, USO or GLD.
See how reliable this has been in the ETF charts below
for all of 2009.
The CLosing Power downtrends were confirmed by
the new lows they
made tonight. Keep
in mind that CLosing Power jumps up by how far above
the opening the close
is, but falls by far the close is below the opening. Jumps
at the opening are risky
to buy into.
The 1975 chart is the historical chart I go
back to most often to find a parallel
with the current market.
in July 1975 a Buy B9 at the lower band failed. The DJI declined
to a point 11% below the
peak. A similar decline here would bring the DJI
down to about 9500. It
would be better to wait for the declining CLosing Power
trends to end. They
reflect institutional dumping, something taking place now.
We will probably add more
short sales in telecommunication stocks this weekend
to our stocks' hotline.
To find good short sales, besides looking for support
failures following heavy red
Distribution, be sure the CLosing Power is downtrending.
The Tiger Traders' Tool and
Asynchronicity Indicator (under Ind.2) are both making
lows and leadigng price
downwards. See the GS chart further below.
1975 Correction after 8 month advance of severe bear market bottom.
The B9 failed as
uptrend-lines were broken and internal strength indicators turned
positive. The DJI
first bottomed 10% below the peak.

Pot holes like we saw today in Qualcomm (QCOM)
are very un-nerving.
Who wants to own stocks
when negative surprises can be this big?
The weakness in
tech stocks will likely end when the QQQQ's Closing.
Power downtrend
ends. Heavily accumulated blue-chips IBM (-2.58) and HPQ (-1.66)
are being dumped
after their price trend-breaks. If stocks like IBM - that ordinarily
would hold up -
get pummeled this badly, then we want to pause and reconsider.

Bernanke's reappointment for another 4 years
should be bullish. See how the
market has always
risen after the occasion of appointment or anniversary
reappoinment of
the Fed Chairman since 1948. That year was significant.
Truman was the
last Democrat in office to appoint a Fed Chairman who was
not greeted
warmly by Wall Street. Truman fought profiteering "fat cats"
during the War
and attacked Wall Street, and "the profiteers and the privileged class."
In the 1948
campaign, he charged Republicans with being "cold(-hearted) men (who)
...want a return
of the wall Street economic dictatorship." He referred to them as "selfish
men who
have always tried to skim the cream from our natural resources to satisfy
their own
greed."
(Source: http://www.kellysite.net/truman.html )
Apparently, Wall Street is afraid that Obama's rhetoric is real and they want to show
him how they will fight back, namely by dropping stock prices and claim that he is hurting
business confidence. Everything I have seen of Obama outside the realm of rhetoric
makes me feel that Wall Street has nothing to fear from Obama directly. But it is true,
his rhetoric does legitimize populist rage against the cozy coddling of Wall Street by
Washington insiders. Goldman Sachs is and will be the lightning rod for this rage. It is sure
to become a whipping boy more and more and the 2010 Election Campaigns
take shape later in the year.
"(The) proposed new bank tax...over the next decade, seeks to
collect $90 to $100 billion. This amounts, on an annual basis, to about half
of this year’s bonus for Goldman’s gold diggers alone. It’s speaking loudly
and carrying a stick made of paper mache."
The risk for the bankers on Wall Street is that some smart politician somewhere
will realize that the 2008 debacle and Goldman's subsequent behavior is a
a perfect opportunity to become very popular with millions of ordinary tax-
payers who know they have been tbadly served by present elites in both
parties.


==================================================================================
Should we act on the Buy B17? YES.
I have said earlier this week
that we should wait because there is a good
chance of another 6% decline
in the DJI. But the market rose today when financial
institutions and potentates
were under maximum Congressional criticism. That is
Bullish. One reason it
rose was that the Fed's minutes for their last FOMC
meetings show that their
interest rate policies will likely go unchanged for another
six weeks. And Bernanke
will be confirmed tomorrow. The short-term
stock market track record
track record for such reappointments is clearly
Bullish. The DJI has
risen after each appointment and reappointment since
1947. See the data
below. In additon, the 5-day Stochastic-K on the DJIA
has turned up and risen past
20 for a short-term Buy. This has given good
short-term Buys in the last
year. The IDOSC is about to turn up for ts Buy. Finance
stocks are rallying from
their support. Gold is up. The tepid rally should
continue. Given the
resistance at 10700, the advance has limited head-room,
however. Rail stocks
will get a boost from the Administration's long-awaited
push for high-speed rail.
HOW THE MARKET BEHAVES
WHEN THE FED CHAIRMAN IS INITIALLY CONFIRMED
AND ON THE FOUR YEAR ANNIVERSARIES OF THAT INITIAL
CONFIRMATIN DATE: 1916-2010
 1. Charles S. Hamlin (August 10, 1914 ? August 10, 1916) - ?

   2. William P. G. Harding (August 10, 1916 ? August 9, 1922)
             8/10/1916  90.10  to 83.70 on 8/24/1916 ...to 110.20 on 11/21/1916
              8/10/1920  86.20  to 88.90 on 9/20/1920 and then down.
   3. Daniel R. Crissinger (May 1, 1923 ? September 15, 1927)
             5/1/1923 97.40 to 92.80 on 5/21/1923... then 85.90 on 10/30/1923
   4. Roy A. Young (October 4, 1927 ? August 31, 1930)
             10/4/1927 198.90 to 184.60 on 11/2/1927... then 200.90 on 12/19/1927
   5. Eugene I. Meyer (September 16, 1930 ? May 10, 1933)
             9/16/1930 237.20 to 157.50 on 12/16/1930
   6. Eugene R. Black (May 19, 1933 ? August 15, 1934)
             5/19/1933 81.80  to 100.70 on 7/18/1933
             and then down to 84.40 on 10/19/33
   7. Marriner S. Eccles¹ (November 15, 1934 ? February 3, 1948)
             11/15/1935 99.70 to 103.50 on 12/6/1935 and then sidewise.
             11/15/1939 - flat
             11/15/1943 - 131.60 to 136.70 on 12/27/1943
             11/15/1947 - 180.10 to 171.20 on 1/26/1948
   8. Thomas B. McCabe (April 15, 1948 ? April 2, 1951)
             4/15/1948 - 180.30 to 192.90 on 6/14/1948
   9. William McChesney Martin, Jr. (April 2, 1951 ? February 1, 1970)
             4/2/1951 - 246.60 to 262.80 on 5/4/1951...to 242.60 on 6/29/1951
  10. Arthur F. Burns (February 1, 1970 ? January 31, 1978)
             2/2/1970 - 746.44 to 792.37 on 4/2/1970 ...to 631.16 on 5/26/70
             2/4/1974 - 821.50 to 831.66 on 3/13/1974 ... to 814.30 on 5/28/74
  11. G. William Miller (March 8, 1978 ? August 6, 1979)
             3/8/1978 - 750.87 to 866.51 on 6/6/1978
  12. Paul A. Volcker (August 6, 1979 ? August 11, 1987)
             8/6/1979 - 848.55 to 897.61 on 10/5/1979
             8/8/1983 - 1163.06 to 1272.15 on 10/7/1979
  13. Alan Greenspan² (August 11, 1987 ? January 31, 2006)
             8/11/1987 - 2680.46 to 2722.42 on 8/25/1987
                                and then down sharply to 1738/74 on 10/19/1987
             8/12/1991 - 3001.34 flat...
             8/14/1995 - 4659.86 to 5216.47 on 12/13/95
             8/11/1999 - 10787.80 to 11326.03 on 8/25/95 ...to 10019.71 on 10/15/99
             8/11/2003 - 9217.35 to 10453.92 on 12/31/2003
  14. Ben S. Bernanke (February 1, 2006 ? )
             2/1/2006 - 10953.95 to 11642.65 on 5/10/2006 to 10796.14 on 6/13/2006
Geithner Dodged The Bullet with The Help of Most
Democrats
Today, Geithner hung tight at the Hearings today and did not
admit to any special
dealings with Goldman Sachs.
The Treasury Secty kept repeating how lucky we were that
he was there in 2008 when the
financial sky was falling to give Goldman Sachs $13 billion,
for free, in taxpayer money.
Given our good fortune that he was in charge, it was hard to
see why he could not explain
why he did not stop his NY Fed's explicit instructions to
AIG to cover-up the whole
arrangement. Maybe he is just modest to a fault?!
=======================================================================================
1/26/2001 Summary Buy B17 Still. But
watch the Congressional hearings
tomorrow. Bernanke and
Geithner are on the hot seat in Congressional hearings
in the morning. On
Friday, Bernanke will very likely win re-appointment. That
will be a boost for the
market only short-term, since his re-appointment has been
assumed and discounted for
some time.
Instead, watch the
financials and home-building stocks. Weakness from
them will probably drag the
market lower, even though other sectors will try
to shore it up. A 10%
decline by the DJI after the long uptrend-break has ample
historical precedent.
Trust in Obama's leadership keeps slipping. That hurts
the market. So, if
Geithner gets pinned for trying to cover up the 100% payments
to Goldman and other bankers
owning AIG credit default swap debts by the
American tax-payer to the
tune of more than $60 billion, it will badly hurt Obama.
All along, the President has
insisted, without full investigation, that Wall Street
and Geithner have never done
anything illegal in bringing about the Crash or
in getting massive taxpayer
bail outs. See the discussion at the top of www.tigersoft.com
It is constructive that
the DJI again held up today at the support of the 3.5% lower band.
The Buy B17 may bring a
recovery. But a 10% drop seems as likely as an immediate recovery
based on breaks in long
uptrends after bear markets: 1932. 1933, 1938 and 1975.
The market's components now
show different degrees of resiliency and weakness. Right now
Home-Building and Finance
Stocks are very close to significant breakdowns. Watch them.
Finance stocks correlate most
closely to the DJI among all industry groups. Over all
the years since 1986, the
Peerless Buys and Sells are most consistently profitable with
financial stocks. That
may suggest finance stocks will recover here. Or if finance stocks
fall with BAC, C and GS, they
will not hold up and the DJI would then be weak.
Most NASDAQ-100 stocks are
still above their rising 65-dma. Watch the most bullish QQQQ stocks,
AAPL, CHKR and CTSH but also
INTC and MSFT to see if they will continue to hold
above their 65-dma.
They are right at them now.
The Chinese bubble we
are told has burst. The short-term strength in the Dollar has weakened
Chinese stocks.
But I suspect the Dollar strength will not last. Gold and Oil stocks are
still above their
65-day ma. Inflation and a weak Dollar seems to help the stock market.
That was true, at
least, last year. Between 1977 and 1980, Gold quintupled. The Democrats
will opt for inflation.
Finance Stocks
and Home Building stocks are at important support, awaiting Bernanke's
confirmation and
indications that home buyers will continue to be subsidized so that housing
prices hold up and
mortgage foreclosures do not keep rising, thereby threatening banks,
Fannie Mae, Feddie Mac
and the FED's balance sheet, which is chuck full of toxic assets
and mortgag debt (used
as collateral by banks).
Tomorrow Geithner will be
questioned about the NY Fed's coverup of the AIG counter-
party payments on a 100% basis to
Goldman, Bank of America and others. The vote on
Bernanke's reappointment as Fed
Chairman is scheduled for Friday. So, as Johnny
Cash sang, "I hear the train
a-comin'." The Administration wants to railroad this
nomination through in a big way,
They want the low interest rates to continue.
Without Bernanke, they will likely
go up. Goldman opined today that that would
wreck the market (and the
recovery.) It seems Obama wants to hand off responsibility to the
Fed for the recovery and the level
of employment. For the last 10 months we have seen
that the Fed can lift the stock
market. Sadly, we have not seen it can create jobs.
Such
are the limitations of monetary policy. My opinions on this
appear on this link..
Goldman looks like a stock that
will go lower, even in a good market. See how insider
selling has taken the place of
earlier insider buying. I give a lot of reasons for this
shift from last year's bullishness.
See the top of www.tigersoft.com


DIA, Opening and
Closing Power
Both Opening and Closing Power are falling.
Professional Selling and Public Suspicion

SPY and CLosing Power
Trading range for Closing Power suggests more of a retreat here.

QQQQ and CLosing
Power
QQQQ is still at support of rising 65-dma
TIGER INDEX OF OIL STOCKS -
Uptrending...
1/25/2001
Despite the new Buy B17, a
10% retreat from the recent high seems as likely
as not. Waiting for the
CLosing Power downtrend-line to be violated to the upside
to confirm the Buy seems
prudent now. This is supported by a look back to 1998
at the charts of the SPY,
Peerless signals and the CLosing Power. Here is a new
study of TigerSoft and SPY since 1998, showing Peerless signals,
Closing Power,
Accumulation Index and Tiger
Day Traders' Tool. Please go here. The Tiger Day
Traders' Tool appears to work
best by spotting divergences between it and SPY
and then using the
trend-breaks in the Day Traders' Tool to take a position. It is
in a clear downtrend now. .
Today
the DJI's decline stopped exactly at the 3.5% lower band, used by Peerless
since the 1980s. But the
market does not appear ready to be bought. Volume was
low on the rally. Geithner's
testimony of Wednesday is important, as I have discussed below.
Bernanke will probably be
confirmed on Friday. But a 10% correction seems a
good possibility, given the breaks
in the 10 month price and A/D Line trends and the
bearish rising wedge pattern
as the DJI rose to the 10700. See the cases of 1915,
1933, 1937 and 1975 further below. I
suggest waiting for the CLosing Power downtrendlines
for the QQQQ, SPY and DIA to
break their steep down-trendlines.
Sunday Night's
Summary: Friday's close
bearishly brought a clear break in the NYSE
A/D Line's uptrend-line and a
rupturing of well-tested support at 10,271 but also a
new Buy B17. Unfortunately,
the recent decline is too steep and too quick to let
me put trust in the new Peerless
Buy without more of a retreat. A 10% fall from
the highs would take the DJI down
to 9700, the October lows, and the support
of the rising 30-wk ma.
There is ample historical precedent for such additional
weakness. Previous Buy B17s
in these curcumstances support the plan to
wait to buy
Watch the key ETFs' Closing Power
downtrendlines. When they are broken, it will
confirm the new Buy. Many individual DJI stocks show short-term technical
damage.
AAPL
and GOOG, among tech leaders show declines in key internal strength indicators.
Looking at each stock in DJI,
NASDAQ and SP-500, I do not see many longer term
reversals downward. The
65-day ma are mostly rising. Not many stocks
look as bad as GS. Perhaps T
(AT&T).
Geithner has said he will testify
before Congress on the 27th. This could shake up
up the market. There is no
way for the Obama Administration and the big banks
(especially Goldman) will look good after this. Bernanke will,
in the end, probably win
reappointment and new Wall Street
regulations will not be very severe. But Wall Street
can control markets. And
they can create fear. The media will help them,. So, right
now, I suspect they may want to
show Congress who is boss. So, the DJI and the
other markets may fall another
5%-8%. The futures look higher at the opening tomorrow.
Gold is up. But there will be
resistance at 10270, the point of breakdown below
recent support and it is weak
closings that we want to avoid.
A decline by more than 13% from
the highs would likely be a judged, emergency
Sell S10. That deep a decline
would not be consistent with my view that we are still
in a Bull Market. On our
stocks hotline, we will continue to hold out very high
Accumulation stocks. No ETF
puts are going to be bought - because of the Buy B17
and the still rising 65-dma. .
The DJI failed to reach the upper band last week and has instead
fallen in a week
to the lower band. It is leading
the entire market down. The long March-January DJIA,
SP-500, and NASDAQ price uptrends were
broken Thursday. That has been confirmed Friday
with a break in the NYSE A/D Line
uptrend. Am A/D Line uptrend break, I have said, is likely
to drop the DJI ten percent (10%)
from its high. A 13% decline would still be in keeping with a
market that will move higher.
See the DJI and QQQQ charts below.
A
further decline is suggested by the speed with which the DJI has fallen, the weakening
breadth, how often Mondays bring a
follow-through from a week Monday, the fact that DJI
broke a 4x tested support line at 10270,
that the Closing Powers for the key ETFs are declining
and a lot of history we will talk about
below. In addition, many individual DJI-30 stocks show
intermediate-term technical weakness:
completed head and shoulders patterns, breaks in long price
uptrends, false breakouts, Sell S9s on
breakouts, rising volume on the downside and Tiger Day
Traders' Tool NCs and declines.
But there is hope. A few of the DJI-30 stocks high levels of BLUE Accumulation and
"should" start to bounce back
after more early weakness Monday. Those are BA, IBM, HPQ.
and UTX. The Opening Monday is up
nicely.
New Buy B17 on Friday
Significantly, because the two most important oscillators we use - the Accumulation Index
and P-Indicaor - were both still
positive, at a + .033 and +145, respectively, Friday's close
bought a Buy B17 from the new Peerless
and an old B8/B11 from the old Peerless.
Buy B17s are quite reliably bullish. There have been 86 of them. Only 4
brought losses
at the time of the next Peerless signal.
Unfortunately, the 4 January B17s average only gains
of +5.95%. Still they were
all profitable. Buy B17s can sometimes bring temporary losses.
That is my main concern here. In an
earlier study of B17s a year ago I warned that in 22% of the
cases since 1942, the DJI fell more than
3% before ralling, sometimes as much as 12%.
"There have been 74 Buy
17s since 1942, The average gain was 10%.
Every single Buy B17 - DJI trade was profitable when the DJI was sold
at the time of the next major Peerless Sell. 39 of the 84 Buy B17s were
immediately
profitable. 18 were profitable "almost immediately", meaning the
trade's paper
loss did not exceed 3% and the DJI rallied within 6 weeks of the signal. (But)...
there were where 16 cases the paper loss ranged between 3% and as much as 12%."
The break in an 11-month well-tested uptrendline has to be worrisome under any
circumstances. The DJI could not get past 10700. The weekly chart of the DJI shows
that was the broken support before October 2008.

THE STORM OF GEITNER'S COVERUP GETS CLOSER
The market's break last week is particularly, worrisome because Congress
will question the Treasury Secretary when he was NY Fed Governor about his possible
criminal misconduct in trying to squech public disclosure before his own confirmation
hearings by the Senate of his role in the passing of $60 billion in tax-payer bailouts
through AIG to Goldman Sachs and other big banks. This pass-through of so much
taxpayer money is a grotesque travesty of justice. Obama says Geithner "knew nothing"
about the NY Fed cover-up instructions that went out to AIG executives after the money
went to Goldman, JP Morgan and other big European banks. But that may not be so.
How could he not know? And how was Bernanle involved. That could scuttle his hopes
for another term as Fed Chairman. And the net gets bigger. This nefarious, massive fraud
against taxpayers benefitting the biggest banks puts Obama right on the spot, too.
What did he know about this and when? Will he continue to turn on Wall Street for
obvious political reasons and risk the destruction of the bull market or will he try to
defend Geitner, and make himself even weaker politically. It will all come out, starting on
Janaury 27th, in Congressional hearings. GS Head and Shoulders Pattern Completed.
BREAKS IN UPTRENDLINES OF ADVANCES
FROM A SEVERE BEAR MARKET
Historically, breaks in long uptrends after a severe bear market warn us to look for more a
retreat than to just the lower band, despite the Buy B17.
========== Depth of Decline after A/D Line and Price UpTrend Break =========
Year High Date DJI DROP Next Low before rally to Upper Band
---------------------------------------------------------------------------------------------------------------------
1932 9/7/1932 79.90 18.1% 9/19/1932 65.10 ... Rally to upper band.
Buy B17 on 9/13/32 at 69.90. Another 6% fall.
1933 7/17/1933 108.30 18.1% 7/21/1933 88.70 ... Rally back to 105.30 on 9/18/1933
Buy B19 at bottom before rally.
1938 7/25/1938 144.90 10.4% 9/26/1938 129.90 ... Rally back to 157.50 on 11/10/1933
8/12/1938 B7/B17 was premature.
1942 subsequent bull market's uptrend continued up until 1946!
1971 4/29/1971 891.14 5.8% 8/10/1971 839.59 ... Rally back to upper band.
no timely Buy signal for rally to upper band.
1975 7/15/1975 881.81 10.2% 8/21/1975 791.69 ... Rally back to upper band.
B9 at lower band -7/22/1975 - premature
B17 - 9/16/1975- good.
1988 gradual recovery. Lower band held on B9
2004 2/11/2004 10737.70 7.7% 5/17/2004 9906.91 (B2) ... Rally back to the upper band
==================== DJIA - 2009-2010 ======================


QQQQ violated its 21-day ma. The Closing Power has broken its uptrend.
OBV is bearish, but the Accumulation Index is bullishly rising. It is still
above its 65-day ma.


The TIger Day Traders' Tool correctly warned of the last two retreats.
It measures downside volatility versus upside volatility after the opning
---------------------------------------------- HOTLINES -----------------------------------------------------------
Important Notice: Redistribution of any text or concepts here is a violation of copyright laws. This is valuable intellectual property.
All violators will be subject to legal action. Please visit www.tigersoft.com Goggle TigerSoft and a technical subject, to get
additional examples and a further discussion of concepts and terms used here. See also our Books for sale. .
Overnight Market Action: Bloomberg Futures around the world before the US Markets open.
Color Codes blue or green = new to this night's report or considered more important
black = from a previous night's report
Introduction. When reading this HOTLINE, please note the dates that show when the comments in a paragraph or set
materials were written. Always read the first comments at the top with the most recent date. They show the Buy or Sell
which now applies. Older comments are there entirely for background and to teach TigerSoft and Peerless technical analysis.
On a Peerless graph, only the new and latest signal applies. Again, always note the date at the top of a set of paragraphs.
INTRODUCTION.
Readers, our assessment of the stock market's future trends is based on the following.
Google TigerSoft and these subjects to get additional links, besides those shown below.
1) Peerless automatic Buys and Sells for intermediate-term trend.
Details of Peerless Signals are given here as they occur.
2) Price charts and moving averages.
3) Closing Power and Closing Power Percent for 2-4 week trends.
4) Accumulation Index to measure support on weakness or distribution on strength.
5) Volume (and OBV to a small extent).
6) Breadth: Advances minus Declines. P-Indicator, A/D Line
Tiger Charts produce this for groups of user specified stocks.
7) Stochastics when they are the best trading system. See QQQQ in 2003.
8) Relative Strength - QQQQ/DJI rising is bullish. Compare QQQQ Chart now, on this page, with 2003..
9) CURRENT Seasonality Example 9/1/2009
10.) CURRENT Sector Strength/Weakness Analysis. Example 9/1
11) CURRENT NASDAQ New Highs/New Lows. Interesting NH/NL Stocks. Example `10/15
12) News and Political Economy. See Tiger Blog
See also Predicting The QQQQ Using TigerSoft's Opening Power,
Closing Power and Tiger's Day Traders' Tool: 1999-2008
=========================================================================================
OLDER HOTLINES
1/21/2010 Hotline
We remain on a Buy. And a new Buy B9 would occur if the DJI falls much
lower. Studying 1933, 1938 and 1975, all years after severe bear markets,
shows that working with the NYSE A/D Line uptrend as long as possible pays off.
When it is violated, a 10% to 15% correction becomes probable from the
highs. So far, the A.D Line is intact. But Politics can trump breadth and introduce
new volatility as the market hastily adjusts to new realities that it had not foreseen.
Read below more about how we can improve our sensitivity to impending weakness using
the Tiger Day Traders' Tool. By itself, it can only give early warning of a market
earthquake. The regular Peerless system and Tiger internal strength indicators usually
win out in the end. Going back to 1915, I would say that there is very little that the
stock market has not correctly anticipated. So, if Obama's rhetoric scares you or your stocks,
know that the market has probably anticipated it and the uptrend is telling you that
corporate power is confident that it is still in control. That sense was supported nu today's
Supreme Court decision that corporations can spend any amount they like
on political campaigns.
I was fooled. I thought Wall Street would stay on good behavior mode
after what it did to investors in 2008. That happened in 1988-1989 after index
trading computers went crazy with sell signals in October 1987. But important
news is clearly over-taking the market now. And the fall-out from it all is
uncertain. So, investors with profits are taking them now, especially since the
DJI's long wedge pattern is breaking down.
I stated that a few months ago that good breadth can trump low volume
on a rally. Now it seems that politics can trump good breadth and bring a big
increase in volatility. When Obama turned off the anti-Wall Street rhetoric
early in March last year, the market started to rally. Now he is turning it back
on and it is falling. Obama's rhetorical about-turns may serve his political
purposes, but they scare investors who want a higher degree of stability
and certainty. The young Kennedy had to learn the hard way that picking
a fight with a corprate giant would tank the market. That was in the Spring
of 1962. Carrying a big stick is all well and good, but Obama should have studied
more history. Speaking softly works better. Action works best.
Volatility is important as a predictor of the market. Peerless gives a Sell S6
when day-to-day closing volatility is low after a substantial rally. We narrowly
missed one of these recently. So, we need to go beyond the S6 rule. One
simple way is to watch for early signs of weakness by having the Tiger charts
show when daily downside volatility after the opening becomes much greater
than upside volatility. Tiger's Day Traders' Tool shows this presently in the
way it turns down quickly at the first signs of impending weakness after a rally.
Look at its chart of SPY for example. See how the most recent high of the
TIger Day Traders' Tool did not confirm the last high. I need to publish this indicator
regularly and show it appled to ten years of an ETF, like the DIA, QQQQ or SPY.

Bullishly for stocks and corporate power, the Supreme Court has re-issued
its determination of 1886, that corporations are "people" and enjoy the privileges
of all American citizens. Today, in a 5-4 decision, they have declared unconsitutional
a myriad of laws, state and Federal, and lower court decisions that limited
how much corporations could legally spend on political issues and campaigns.
Absolute free speech exists for corporations. Legally they now can spend as
much as they want to buy candidates and elections. Dissenters warn this ruling
has the potential to wreck American democracy, because it places all political offices
on sale. Elections and candidates will be much easier to buy, especially Senators
in small states. Ironically, it will also encourage political shakedowns of corporations.
It is well within reason to expect corporate logos and names to replace red power ties
and eventually the Republican and Democratic Party.
Bearishly in the news today, Obama is now picking a fight with Wall Street banks.
In a patently obvious effort to recapture some of the public approval he clearly
has lost for coddling Wall Street too much to date and surrounding himself with
their spokesmen, he now says he wants a new Glass Steagal separation of investment
and commercial banks. Wall Street reacted today, as they most often do when there is
talk of government regulation, exactly as a pampered child would. They wailed
and wailed about the unfairness of it all and now are taking their toys home, as it were.
And all the bearish news is not out. Geitner will appear before Congress on Monday
to explain why his NY Federal Reserve tried to conceal from the public his embarassing
decision to have American taxpayers pay all of AIG's debts to big banks, 100 cents on the
dollar. This will hurt Obama, as he seeks to defend Geithner. He is clearly trying
to use his anti-bank rhetoric today to confuse voters who he hopes will not
pay attention to the Geithner hearings. Goldman got $12.7 Billion from US taxpayers
as a result of Geithner's secret-at-the-time decision as head of the NY Federal
Reserve.
Goldman Sachs reported quarterly earnings today of $4,700,000,000 ($4.7 BILLION)
Yet it fell nearly 7. Like GS, JPM is also testing important support, a violation of
which would complete bearish head and shoulders patterns. As GS led the
market up, we must watch to see if it leads the market down below support.


----------------------------------------------------------------------------------------------------------
1/20/2010
Chinese Gov't Staged Selloff Leads To US Weakness
Peerless and its technical indicators are still rising. The rising wedge pattern the DJI
has been trapped in looks like the price pattern seen at the end of 1915 shown below.
But the OBV Line is stronger and there has been no Peerless Sell, as would have been
seen near the top then.
COULD A CHINESE MARKET CRASH HAPPEN?
WOULD IT LEAD TO A US BEAR MARKET?

Today the Chinese market sold off badly, Yesterday, we showed that the one A/D Line in
decline among all the major indices was the one for Chinese Stocks. We also noted last
week that the Chinese market had become very effervescent in some areas, many of which
we had played on the long side.
Reading about China is instructive, if only because they probably now own us and could
do great damage to our standards of livings if they stopped buying our Treasury bonds.
Roubini warns of a CHinese real estate bubble.
See also China Property Bubble May Lead to U.S.-Style Real Estate Slump ...
Forbes wrote:
"Take a close look, however, and you may come away thinking China
resembles nothing so much as Japan shortly before its stock and property markets
melted down two decades ago. A speculative frenzy of borrowing and bidding up
is at work. If and when prices crash, there will be hell to pay..." It's a Ponzi scheme
whose head is the central bank," "
Steve Forbes is certainly no fan of China, so I don't take seriously what he says, but it
is true that China would be badly hurt if the US was run by tariff-supporting Republicans,
and that may be the longer-term fear that Brown's victory in Massachusetts may have set off.
They would also be badly hurt if the US Dollar were to fall dramatically. Today, the Dollar
rose sharply. See the chart below.

In the past, the Chinese government has shown considerable skill in stimulating
their economy and then cooling it off when speculative excesses appear to great. It does this
by itself selling shares in stocks, reducing capital that the Central Chinese Bank of China
makes available and by imposing direct restrictions on stock speculation, something the
Fed has not directly done since 1968 in the area of margin requirements. So my guess
is that the Chinese market will not easily collapse, "ponzi-style" any time soon. It will stabalize
and then rally again, but probably after additional weakness. The Dollar's strength today
reflects hot Global Money seeking the most stable currency.
I am not sure how to study the Chinese stock market directly for the elast ten years.
So here are the charts of GRR -the Asia Tigers Fund. It invests in Asia stocks, except Japan.
First, here is the current chart, Its Accumulation Index is still postive. So, it may not
even break its rising 65-day ma.
What is important to see is, first, that previous years' peaks take time. If history repeats,
we should get ample warning of a major top forming in GRR.
More important, GRR seems always to top out after the DJI does. That was true before the
biggest US declines: in 2000, 2002, 2004 and 2007. So, a top in GRR is not an immediate
predictor of the DJI, rather a DJIA top predicts a top in GRR form 3 to 1o weeks later. That
makes GRR normally a good defensive play late in a bull market.
Date of DJIA TOP Date of GRR Top DJIA LEAD TIME
1/14/2000 2/9/2000 3 weeks
3/12/2002 5/28/2002 10 weeks
2/11/2004 4/2/2004 7 weeks
10/9/2007 10/29/2007 3 week
Current GRRR Chart - 1/20/2010

GRR and QQQQ - EARLY 2000 TOPs
DJI topped three weeks before QQQQ. A 3-month top pattern was needed for GRR


GRR and DIA AT MAY 2002 TOP
GRR topped 2 months after DJI. Internals were much stronger at QQQQ than DJI.


GRR a\nd DIA AT EARLY 2004 TOP
GRR and DIA peaked at about the same time.
Note extensive top pattern needed in GRR.


GRR and DIA AT OCTOBER 2007 TOP
DJIA peaked a week before GRR in 2007.
A 4-month top pattern needed for GRR
Top was called by negative non-confirmation by Accum. Index


---------------------------------------------------------------------------------------------------------------
Peerless Remains on A Buy
The market Still Remains on A Peerless Buy. Closing Power and A/D Uptrends Continue
Wall Street is on its "best behavior" after 2008. New highs jumped, confirming
the big advances by much watched AAPL and IBM. Institutions and Individuals
that have been waiting for a pullback, are capitulating and buying big positions
in the most expensive stock, to put a lot of money to work quickly.
GOOG + 7.62 AAPL + IBM + MA +2.10 RTP + 6.10
See how the NYSE A/D Line Breadth, DJI/NASDAQ.ETF Accumulation, ETFs CLosing Powers
and OBV Lines are confirming the uptrend and the advance today. Look for breakouts
by the key averages soon.
Volatility and volume are not low enough to bring a Sell Compare the DJI's OBV Line
now (just below) with that of January 1916, just before weakness that brought
a 13% decline. (See second below)
DJI 2009-2010

DJIA - 1915-1916

Most A/D Lines Are Uptrending
The A/D Lines for the averages and foreign ETFs are rising steadily. Here are the A/D Lines
for the DJI-30, NASDAQ-100, SP-500, Foreign ETFS and Financial Stocks. These uptrends
should give us confidence to still buy and hold now.


 /
/Chinese Stocks are the exception.

Low priced stocks making new highs and previously showing high Accumulation, to the point
we would consider insider buying are making some very nice advances. MSPD illustrates
this. Speculators are clearly in the market.

SABA has just made a flat-topped breakout after six months of hesitation. It would
surprising for it not to rise, at least, the height of its pattern, 4.5-3.5, fromt he point
of breakout, 4.5. And if the stock surpasses 5, it becomes more credible AND
marginable. The heavy blue Accumulation shows planned and careful buying.
"Someone knows something here."

Note, too, that biotechs are coming to life.

===================================================================================
1/17/2009 Hotline --- Peerless Remains on A Buy
Is The DOW's Friday 100-Point Drop A Sign of More Weakness Ahead?
Counter-trend weakness before a three day weekend is common. This coming week will
be a much better test of the market's strength. The market has been rising when gold rises.
Right now, spot Gold is up $7. So, that bodes well for tomorrow. But, since 1966 the DJI has
risen only 43.6% of the time over the next two weeks. After that it typically strengthens.
I should noted that our Tiger Elite Service had no trouble finding lots of stocks whose AI/200
score is above 190, whose current Accum. Index is above +.40 and whose Closing Power is
very strong. Mostly, they are funds or companies investing in and trading bonds. True, they are
defensive. But their strength also suggests big investors are not concerned about a near-term
sharp rise in interest rates or inflation. The market seems to want to stabalize in the zone
10000 to 10600. Lateral action after the big move up since March is constructive and typical
of markets that will eventually go higher after some backing and filling. We will be watching
breadth closely as well as how the Geithner coverup of the $13 billion taxpayer gift to Goldman
plays out. In my opinion, Geithner would NOT have been confirmed as Treasury Secretary if there
had been no cover-up in the Fall of 2008 by the NY Fed when he was its head. That Obama
will not appoint an independent prosecutor shows how the Office of The President has become
dangerously arrogant, corrupt and out of touch. This will all come out soon enough. And it should
drive bank stocks lower. It would be a surprise for their weakness not to effect the rest of the
stock market.

Strategic Global Income Fund, Inc. operates as a closed-end, nondiversified management investment company.
The fund invests primarily in U.S. corporate bonds, asset-backed securities, commercial mortgage-backed securities,
U.S. treasury bonds and notes, foreign government bonds, international corporate bonds, short-term investments,
mortgage-backed securities, and U.S. government obligations. Its portfolio includes investments in beverages,
commercial banks, consumer finance, diversified financial services, food products, media, road and rail, thrifts
and mortgage finance, electric utilities, and oil and gas sectors.
Watch the NYSE's A/D Line Uptrend.
A break in the A/D Line uptrend would - if it next occurred - probably change the
whole complexion of our market in 2010. But that has not happened yet. And
there is precedent for the A/D Line staying above its uptrend for more than
a year. See 1942-1943 below or the 1958-1959 example in the report I have just
completed: Behavior of The A/D Line in New Bull Markets after Bear Markets.
New Minor Signals: 40-Day Minor B11s and S11s Show A/D Line Non-Confirmations
(1) These reliably reinforce current Peerless signals.
(2) When traded against the current Peerless signal and the trend of
the 65-day ma, they may bring moves back only to the 21-day ma. If
they do not, it shows how strong the current trend is.
(3) Both B11s and S11s work well if the DJI is in a trading range.
(4) While a number of significant market bottoms show B11s, more
often the A/D Line is weaker than the DJI at the bottom, showing
how widespread the state of panic is.
(5) I can find no cases of major tops called with S11s without there
also being a major Peerless Sell.
After testing, new Peerless Software will include these as minor Signals
to be used as explained above.

A/D Line non-confirmations (NCs) of new highs often occur at major market tops.
But defining A/D Line NCs is tricky and even clear-cut A/D Line NCs, like the one
shown below in December 1942, do not necessarily bring declines that are big
enough to reliably trade. In the second chart below, I have added a temporary
B11 and S11 to show A/D Line NCs that do not confirm a 40-day DJI price high
or low. The new year, 1943, markedly improved the upwards slope of the
A/D Line and DJI prices. Eventually, the A/D Line was broken. If that does
not occur for more than a year, the ensuing decline may be quite shallow, as
it was in 1943, shown in the second chart below. Note another thing. A/D Line
NCs like those triggering a Buy B11 or an S11s work sporadically, when all
the data back to 1929 is examined. Minor NCs may have no effect on prices.
That shows a strong and resilient uptrend. They may bring small retreats by the
DJI back to the 21-day ma. That was true in 1961 when a Democrat had just
become President and is true now. In such cases - and you can see the 1961
case in the study mentioned, and the A/D Line NC signals this past year in the
third chart above - a break in the A/D Line uptrend will likely bring a shallow 5%
to 10% decline and a test of recent lows or the lower band. A Peerless Sell
and a new Sell S11 makes the A/D Line uptrend break more important.
1942 Ended With What Might Be Considered a Bearish
A/D Line Divergence. So did 1988. But in both cases,
rhe following years brought substantial rallies.
.

Eventually, in May the 1943 A/D Line broke its uptrend, after a Peerless Sell S9.
That began a five month, 10% correction, before the bull market resumed. If
the A/D Line now can avoid breaking its uptrendline for 13 months, the parallel
with the the 1942-1943 case would probably be important. And in the
ensuing trading range, monor A/D Line NC B11s and S11s would likely
work well.

===================================================================================
1/14/2009
Study The New Highs/Lows
Peerless is still on a Buy. The Accumulation Index for the
DJI could be higher. But breadth remains superb. The A/D Line
is in a powerful and steady uptrend. The ratio of new highs to
new lows is very positive. The DJI is lagging the more speculative
indexes. The key ETFs' Closing Power are rising. Wall Street
is on its "best behavior" after its misconduct and fraud (which
Goldman denies) in 2008.
In the news Treasury Secretary defends the 100% payout to
Goldman and other big banks by the taxpayer when AIG went
bankrupt and its debts were repaid. If he is so proud of the
billions he allowed the big banks be paid by the taxpayer,
then why did his NY Fed office try to cover this up in 2008
and 2009? Stay tuned. Geithner is not going to make it, I
predict. That will hurt Wall Street big banks and possibly
the stock market. Wall Street's special influence in the
Obama Administration will be disclosed if Geithner is challenged.
Let's see if the Republicans can step up to the plate now.
In the 1970s, before I wrote Peerless, I was much influenced
by Nicolas Darvas' system for playing new highs. See the Blog
I wrote in 2007. In particular, I would watch the ratio of NYSE
new highs to new lows. As long as the 10-day ma ratio was 4:1,
the market was safe enough to keep buying breakouts. I
watched the market mainly with weekend charts I subscribed to.
What I noticed was that before a big decline would start, there
would be a number of false flat-topped breakouts. That is
still something to look for. But now, I would look for the key signs
that a breakout is apt to be false. In particular, I count the number
of breakouts that occur with the current Accumulation Index
(termed "IP21" here, after the original name of the Accum. Index)
that are in negative territory.
First, I go to
http://dynamic.nasdaq.com/asp/52weekshilow.asp?exchange=NYSE&status=HI
Second, I either download these stocks or build a directory of
just these stocks using the BUILDER.exe program on our data page.
Third, I run the older TigerSoft program (dated 7/27/2006) and
rank these new highs for Current Accumulation (IP21) using
Ranking Results + User Set Ranking... + 21 + OK + 3 + OK
The seventh column displays the stocks by IP21.
(You can also use our spread sheet program after
running the Analysis. From Peercomm. just click View at the top,
then Tiger Spread Sheet and then click the heading for "IP21".
This ranks the data by IP21. )
Here I compare the number of stocks with a current Accum.
Index (IP21) value greater than +.25 (considered healthy)
with the IP21 number under zero (bearish). Thursday night |
the ratio was 75 to 14. That seems healthy. What we do not
want to see are stocks starting to look like MED.
MED - False Breakout Picked Up on by IP21 NNC
(Accum. Index - Negative NC on new high near upper band.)

It should be empasized that a negative non-confirmation (NNC)
of a new high by the Accumulation Index, which is often
a Tiger S9, does not always bring a quick reversal and breakdown.
If the Accumulation has been steadily very positive, a brief
dip into negative territory may mean very little at the
time of the NNC and the stock may keep rising. But this
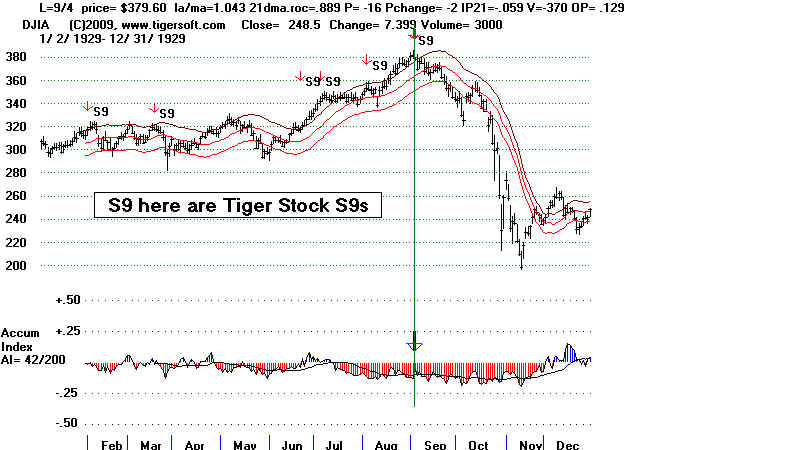
is a sign of dangerous speculation. See the chart of CTEL
below and then the DJI chart of 1929! (With Peerless
charts of the DJIA, such IP21 NNCs are called Sell S12s.
The Peerless DJIA Sell S9 is actually a NNC by the
P-Indicator. See Peerless Sell S12 Sell S9 )
CTEL's SPECULATIVE ADVANCE FEATURES NNC oF NEW HIGH
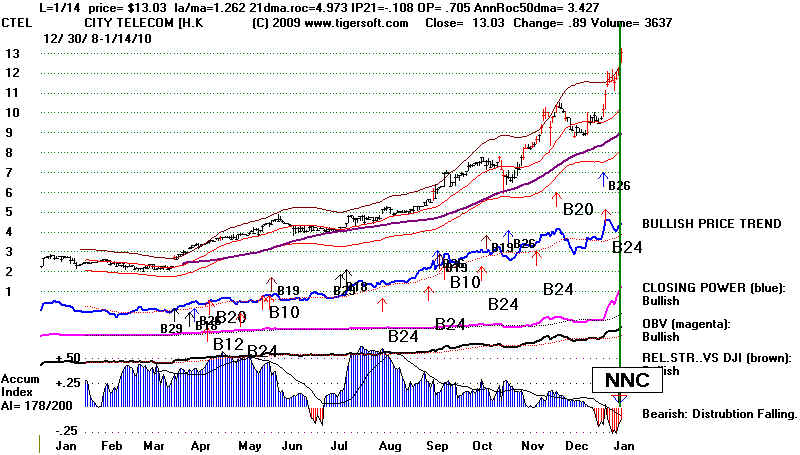
TigerSoft IP21 NNCs are bring S9s when the DJIA is
treated like a stock. (If this is confusing, just know that
both types of NNCs (AI and P-Indicator) are bearish.
And they are doubly so, when both indicators are negative
as the DJI reaches the upper band.)
It should be also be said - and emphasized - I looking for
stock breaking above flat tops that show high Accumulation.
I take this to represent insider Buying. CLC (below) seems perfect,
until you ask the question: "Why has it taken the stock so
long to breakout?" We usually do better if we find these
such stocks soon after a fresh and reversing Peerless Buy.
as in our Stock's Hotline's MSPD.
.
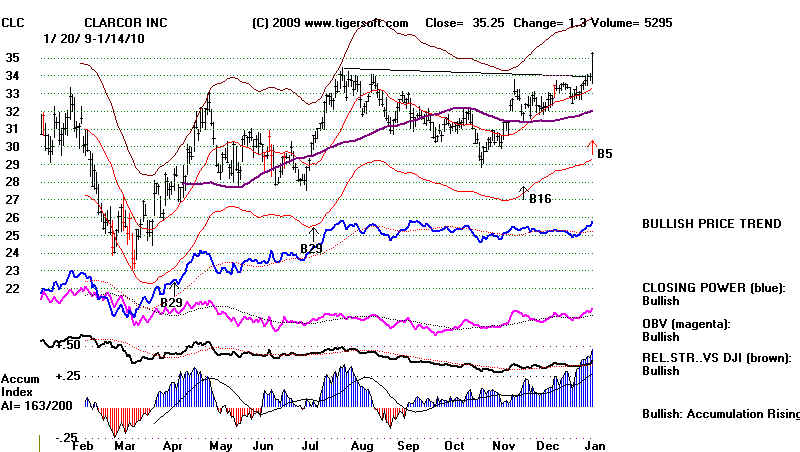
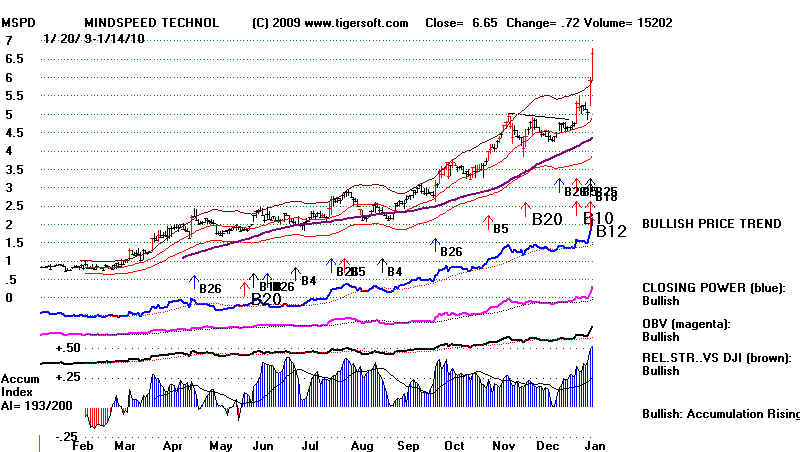
=====================================================================================
1/13/2009
Peerless Remains on A Buy B13.
Sticking with The Peerless Signal Usually Pays Off.
Once again the DJI shook off news that might have sunk a technically vulnerable
market. The creme of Wall Street's elite bankers had their integrity challenged
publicly by Congress and the immense biblical JOB-like tragedy of the Haitian
earthquake should and would normally shake our rosy confidence that man can always
prevail over natural calamities. I take these to be signs that the market wants to go higher.
What vehicle should users employ to take advantage of Peerless Buys and Sells.
The answer may be obtained with historical studies using the Peerless software's ability to
let the user super-impose the DJI based Peerless Buys and Sells signals on any chart
the user wishes. Using DIal Data I can get the data back to 1980 on any stock that is
still extant and trading now. (So, could users if they want to pay $40/month and would like
me to set them up with this capability).
To help us decide how best to use Peerless I gathered the data year by year since
1999 when the major ETFs, DIA, QQQQ and SPY, were established. I super-imposed the
DJI signals on the DIA, QQQQ and SPY for each year and let the computer calculate
the trading gains for each year from the first signal of the year. I think this shows that
the QQQQ is generally the best instrument to buy using the Peerless signals. AAPL has been
a great stock to trade using the signals. Its current chart is not so bullish looking now.
So, I post below some other QQQQ stocks that now look attractive.
Three sytematic approaches should be mentioned. One could reasonably search the NASDAQ-100
using Tiger's POWER-STOCK-RANKER software:
(1) Buy the highest Power Ranked DJI stock, now ISRG, but it has tripled since March
and shows weakening Accumulation; or
(2) Buy the highest Ai/200 stock, ADBE (see below); or
(3) Buy the highest current Accumulation Index stock with a rising CLosing Power, FISV.
As it turns out, FISV seems ready to score its own breakout past 50 and should be watched closely
for that. (See chart further below.)
|
Trading Results Using Peerless
Buys and Sells on DIA, QQQQ, SPY and AAPL: 1999-2009 June-Dec 1999 March-Dec 2000 Feb-Dec 2001 Feb-Dec 2002 DIA +10.8% +22.6% +5.6% +30.7% QQQQ +38.5% +11.5% +9.3% +9.3% Buy/Hold +77.5% -45.2% -15.6% -28.6% SPY +12.4% +22.4% +6.9% +6.3% AAPL +97.4% -20.1% +12.3% +1.2% ========================================================================= Mar-Dec 2003 Feb-Dec 2004 April-Dec 2005 Jan-Dec 2006 DIA +39.9% +11.4% +4.6% +24.6% QQQQ +54.5% +10.4% +13.5% +19.5% Buy/Hold +51.5% +14.2% +13.9% +1.7% SPY +37.5% +12.0% +7.2% +19.9% AAPL +57.0% +94.4% +94.7% +43.9% ========================================================================= Mar-Dec 2007 Mar-Dec 2008 Jan-Dec 2009 DIA +25.3% +10.0% +42.3% QQQQ +33.0% +11.4% +61.7% Buy/Hold +21.5% -30.9% +62.8% SPY +20.9% +13.7% +51.8% AAPL +114.5% +21.1% +136.6% |