www.tigersoftware.com/1-HOT-07009/index.htm
Sunday 8/30/2009
NOTE - This address will change on August 31st Monday.
Current Subscribers should get renewal notices by Friday evening.
if you did not get one, email us. It may be that your email
address was changed or our emails blocked.
Order form to Renew On-Line, "Nightly Peerless/TigerSoft Hotline " ($298)
. Previous Hotlines:
7/1/2009-7/31/2009
6/14/2009-6/30/2009
5/1/2009 - 6/11/2009
3/30/2009-4/30/2009
(C) 2009, William Schmidt, Ph.D.

Important Notice: Redistribution of any text or concepts here is a violation of copyright laws. This is valuable intellectual property.
All violators will be subject to legal action. Please visit www.tigersoft.com Goggle TigerSoft and a technical subject, to get
additional examples and a further discussion of concepts and terms used here. See also our Books for sale. .
Overnight Market Action: Bloomberg Futures around the world before the US Markets open.
Color Codes blue or green = new to this night's report or considered more important
black = from a previous night's report
Introduction. When reading this HOTLINE, please note the dates that show when the comments in a paragraph or set
materials were written. Always read the first comments at the top with the most recent date. They show the Buy or Sell
which now applies. Older comments are there entirely for background and to teach TigerSoft and Peerless technical analysis.
On a Peerless graph, only the new and latest signal applies. Again, always note the date at the top of a set of paragraphs.
INTRODUCTION.
Readers, our assessment of the stock market's future trends is based on the following.
Google TigerSoft and these subjects to get additional links, besides those shown below.
1) Peerless automatic Buys and Sells for intermediate-term trend.
Details of Peerless Signals are given here as they occur.
2) Price charts and moving averages.
3) Closing Power and Closing Power Percent for 2-4 week trends.
4) Accumulation Index to measure support on weakness or distribution on strength.
5) Volume (and OBV to a small extent).
6) Breadth: Advances minus Declines. P-Indicator, A/D Line
7) Stochastics when they are the best trading system. See QQQQ in 2003.
8) Relative Strength - QQQQ/DJI rising is bullish. Compare QQQQ Chart now, on this page, with 2003..
9) CURRENT Seasonality Updated 7/29
10.) CURRENT Sector Strength/Weakness Analysis. Updated 7/29
11) CURRENT NYSE/NASDAQ New Highs and New Lows. Interesting NH/NL Stocks. Updated 7/29
12) News and Political Economy. See Tiger Blog
See also Predicting The QQQQ Using TigerSoft's Opening Power,
Closing Power and Tiger's Day Traders' Tool: 1999-2008
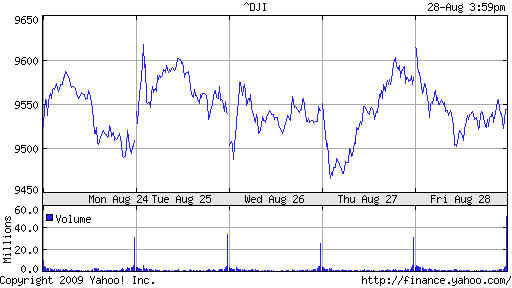
8/30/2009 9450 = support. 9620 = resistance.
Special Charts:
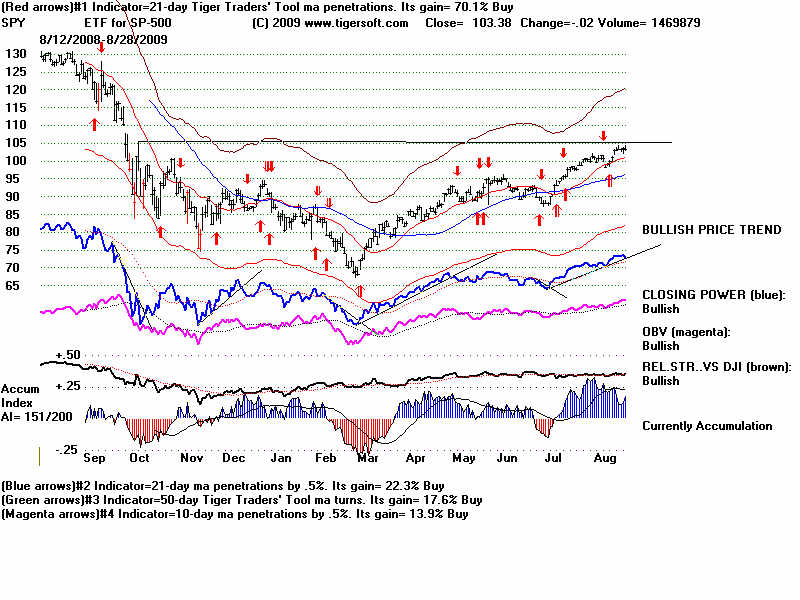
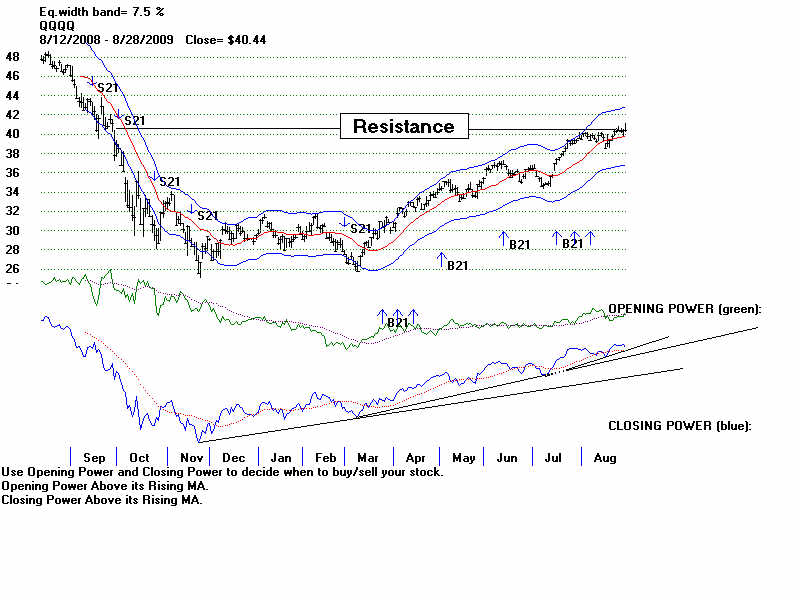
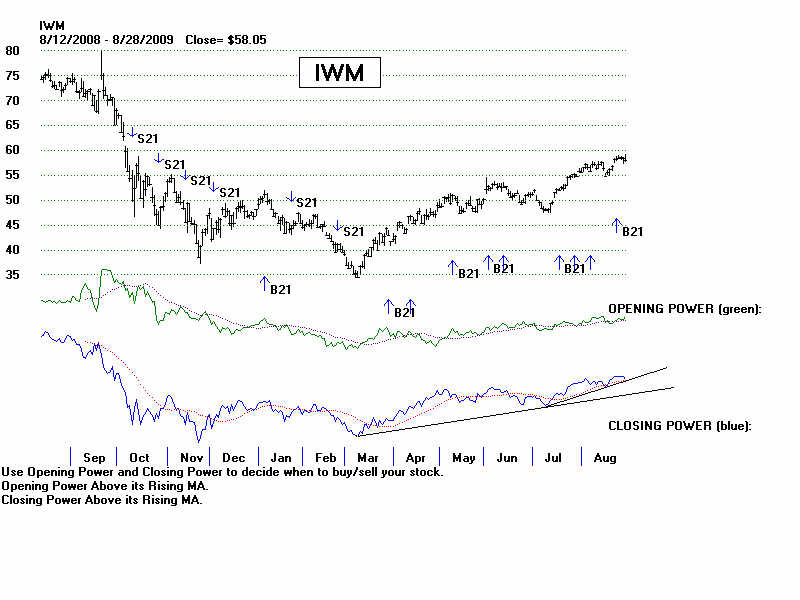
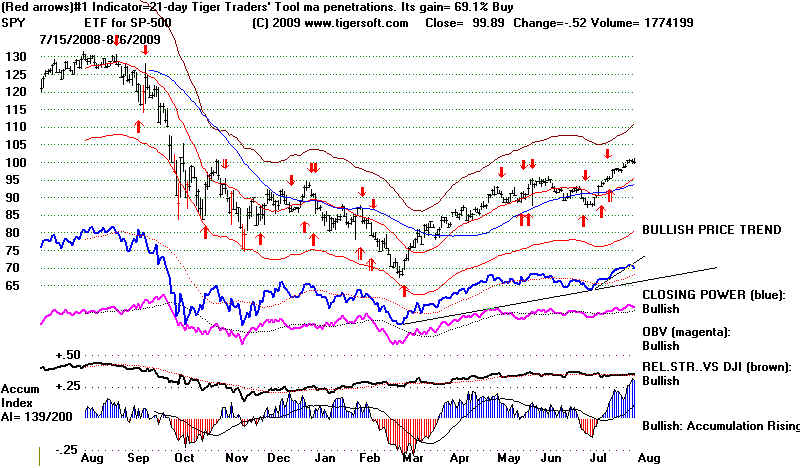
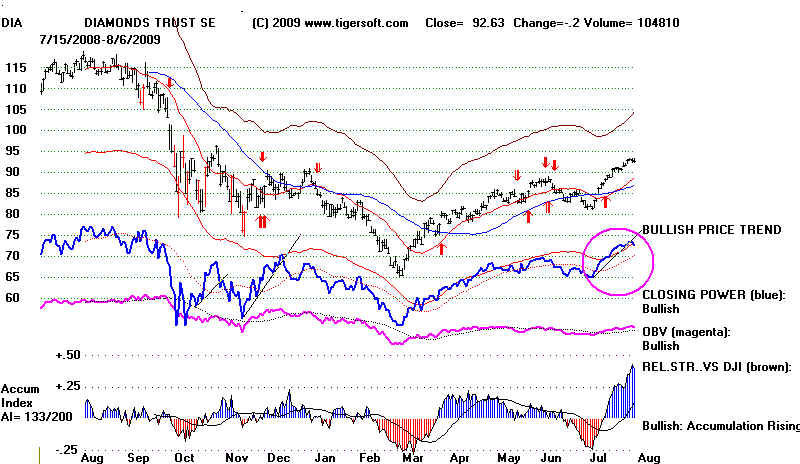
DIA SPY QQQQ IWM All show rising Closing Powers
Dollar Crude Oil Gold Perpetual Contract Silver Perpetual Contract
27 key stocks:
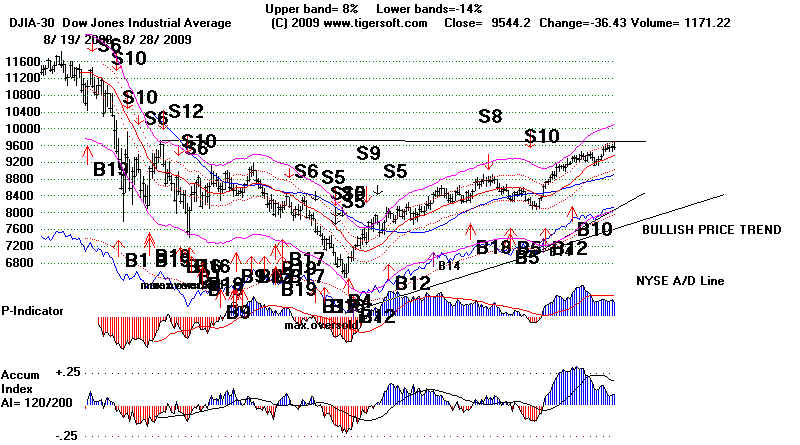
-------- SUPERIMPOSED PEERLESS SIGNALS ON DJIA ---------
8/28/09 9544 la/ma=1.02 21dma-roc .497 P= 375 Pch= -85 IP21= .086 V= 158 Opct=.311
|
====================================================================================
8/30/2009 Same as Yesterday. Still on A Buy.
Though the DJI fell on Friday, it did achieve 8 straight up-days. That I showed on Wednesday is ordinarily
associated with prices that rise, at least, 5% more and usually do not retreat as much as 5% without a
Peerless Sell.
The uptrends of the NY A/D Line and Closing Powers for the QQQQ, SPY, DIA and IWM are still intact.
But weakness in them would break their uptrend-lines that began from their July lows. That would bring
another test of their rising 21-day moving averages. The DJI's 21-day ma is now rising at an annualized rate
of .497 and the DJI now shows an IP21 of .086. A week ago I studied tests of the 21-day ma in a market
rising off major lows. I wrote then that "Only if the annualized rate of change of the 21-dma slips below .15,
would the DJI be expected to drop to the lower band in the starting phase of a bull market. Usually it takes
an IP21 under .02 along with a loss of upward momentum to make the market stumble to the lower band in
the first 6 months of a new bull market. The longer there is no such pull-back, the weaker the internals
have to get before there is a decline.
It is probably a good idea, however, to limit purchases of stocks to those showing very high Accumulation,
above 165, and to try to buy these stocks on their own retreats to near their 21-day ma. The Tiger Data page
now has a new download, only those stocks with AI/200 scores of 165 or higher. They make up less than 7%
of all stocks
Seasonality is still bullish for another week. Since 1965, the DJI has risen 61.5% of the time in the five trading days
after August 30th. After September the DJI has historically shown a strong tendency to fall, for all time periods
from 1 day to a month.
For now, I think it is bullish that only 8 stocks in the DJI-30 show Closing Powers below their 21-day ma:
JNJ, LFT, KO, MCD, PG, T, VZ and WMT. Except for Walmart, these are all defensive stocks that may
now being sold to buy relatively more speculative stocks. Negative Accumulation readings are seen only in
DJI-30 stocks: INTC, KFT, KO, MCD, PG, T, VZ and WMT. I would expect more stocks to show weak IP21
readings if a bugger decline lay ahead, though the inclusion of Intel in this list is certainly a negative.
======================================================================================================
8/26/2009 Peerless Remains on Buys (B14,B12,B10) - A/D Line and Closing Powers Still Rising.
An up-day tomorrow for the DJI would be distinctly bullish.
The DJI has now risen 7 straight days. Sequences of 7 are not rare. They are
are more often bullish than not. Surprisingly, 8 straight up days is distinctly bullish
unless there a Peerless Sell S1, S9, S12 or a head and shoulders pattern soon or
simultaneously occurs. Usually 8 straight up-days are a sign that the uptrend is not over,
and may have considerably more to go. Below are the 40 occasions since 1915. (Tiger/Peerless
users can see the statistics for "streaking" behavior with a chart on the screen using "Operations"
+ "Streaking: Daily Probabilities". In 18 cases the DJI rose more than 10% more. In 7 more
cases it rose between 5% and 10%. In only 1 case did the DJI fall more than 5% without a
Peerless sell signal first.
8 Straight Up Days - Only The First in A Year
Date DJI Maximum Days Consequences
>10% 7/29/1915 79.80 8 DJI rose to 99 at end of 1915.
>10% 10/28/1921 73.80 9 DJI rose to 102.60 on 10/17/1922.
8/21/1923 92.20 8 DJI rose to 93.40 on 8/30/1923,
fell to 88.50 on 10/31/1923 (under 5%),
then rallied to 101.10 on 2/5/1924
>10% 4/29/1926 144.40 8 DJI fell to 138.70 on 5/20/1926 (under 5%)
then railed to 162.90 on 8/10/1926
>10% 4/22/1927 157.40 8 DJI rose to 199.80 on 10/3/1927
>10% 7/20/1927 177.80 15 DJI rose to 199.80 on 10/3/1927
2/28/1929 317.40 9 DJI fell to 296.50 on 3/26/1929 (over 5% loss)
>10% 7/1/1929 335.20 12 DJI rose to 381.20 on 9/3/1929
>10% 7/21/1936 165.20 9 DJI rose to 184.90 on 11/17/1936
>10% 4/18/1945 163.80 9 DJI rose to 195.80 on 12/11/1945
8/2/1946 202.80 8 DJI fell to 167.30 on 10/8/1946
This decline would have been easy to see coming.
There was a classic head and shoulders pattern and
multiple S10s.
5/18/1948 188.60 8 DJI rose to 193.00 on 6/11/1948
A Sell S1 and head and shoulders top then warned of
a decline. DJI fell to 176.00 on 9/27/1948
>10% 9/13/1954 351.10 9 DJI rose to 487.50 on 9/23/1955
>10% 4/15/1955 425.50 9 DJI rose to 487.50 on 9/23/1955
9/1/1955 469.60 10 DJI rose to 487.50 on 9/23/1955
>10% 3/11/1958 455.90 8 3% decline. DJI fell to 440.10 on 4/7/1958
DJI rose to 583.70 on 12/31/1958
7/6/1959 660.10 10 Simultaneous S9/S12.
DJI rose only to 678.10 on 8/3/1959
11/30/1959 659.10 10 S9 a week later.
DJI rose only to 673.70 on 12/15/1959
5/23/1960 623.60 8 Simultaneous S9/S12.
DJI rose only to 656.40 on 6/9/1960
>9% 3/7/1961 667,10 8 DJI rose to 732.60 on 11/14/1961
>10% 3/13/1963 677.60 8 DJI rose to 767.20 on 12/10/1963
>8% 3/18/1964 819.40 9 DJI fell to 800.30 on 6/8/1964 (less than 5%)
DJI then rose to 891.70 on 11/18/1964
>8% 9/11/1964 867.10 8 DJI rose to 939.60 on 5/14/1965
>8% 9/14/1965 916.60 9 DJI rose to 991,14 on 1/19/1966
4/24/1967 887.53 9 Simultaneous S12. DJI rose only to 909.63 on 5/8/1967
5/3/1968 919.21 9 S12 gives warning. DJI fell to 869.65 on 8/9/1968 (more than 5%)
DJI rose to 985.21 on 12/3/1968
>10% 12/1/1968 794.29 12 DJI rose to 950.82 on 4/28/1971
4/15/1971 938.17 10 DJI rose only to 950.82 on 4/28/71
Sell S9 and Head and Shoulders pattern.
7/27/1972 936.71 9 S9/S12 two weeks before.
DJI fell to 851.90 on 8/22/1973
4/17/1975 819.46 8 DJI rose to 881.81 on 7/15/75
>7% 4/19.1983 1174.54 8 DJI rose to 1246.30 on 6/16/83
>10% 6/17/1987 2407.35 11 DJI rose to 2722.42 on 8/25/87
8/3/1987 2557.08 8 DJI rose to 2722.42 on 8/25/87
A second streak of 8 or more in a two month period
after a long advance, should be considered "climactic
behavior", in which a top must be expected soon.
>10% 7/13/1989 2537.32 9 DJI rose to 2791.41 on 10/9/1989
>6% 12/311992 3168.83 11 DJI rose to 3413.21 on 6/1/1992
5/17/1996 5448.27 9 A few days later there was a Sell S1. DJI rose only to 5762.12 on 5/23/1996
11/13/1996 6274.24 10 DJI rose only to 6549.37 on 12/30/1996 where there was a Sell S9.
>10% 12/30/1998 9274.64 8 DJI rose to 11026.14 on 5/11/1999
>10% 3/21/2003 8521.97 8 DJI rose to 10453.14 on 12/31/2003
>10% 4/11/2007 12484.62 8 DJI rose to 14000.41 on 7/19/2007
More tomorrow night....
===============================================================
8/25/2009 Peerless Remains on Buys (B14,B12,B10)
The DJI now up almost 46% from its March bottom. Certainly, a decline now is possible, though
we should expect Peerless to give a Sell first. The P-Indicator and the, Accumulation Index
usually fail to confirm a final false high by the DJI by being in negative territory or, as in
July 1975, the NYSE A/D Line breaks its uptrend first.
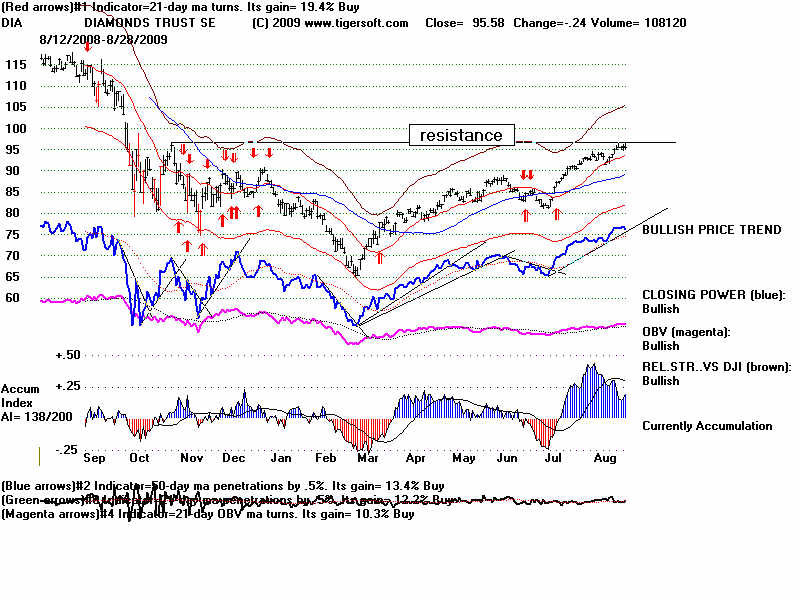
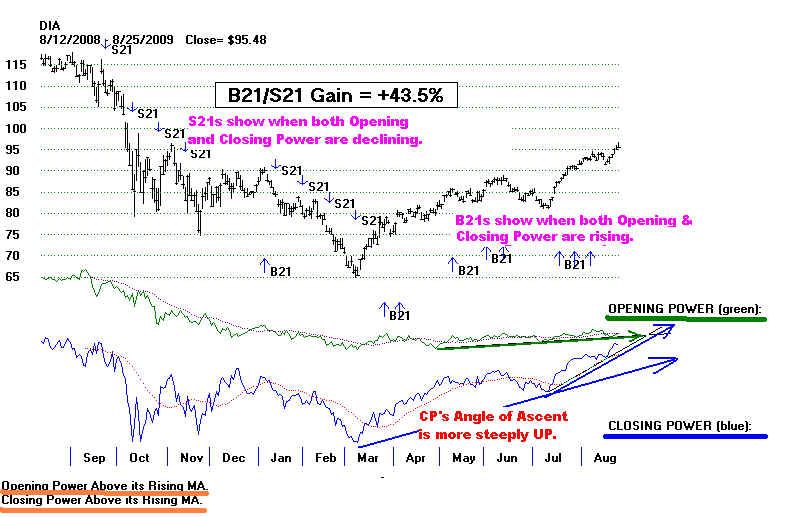
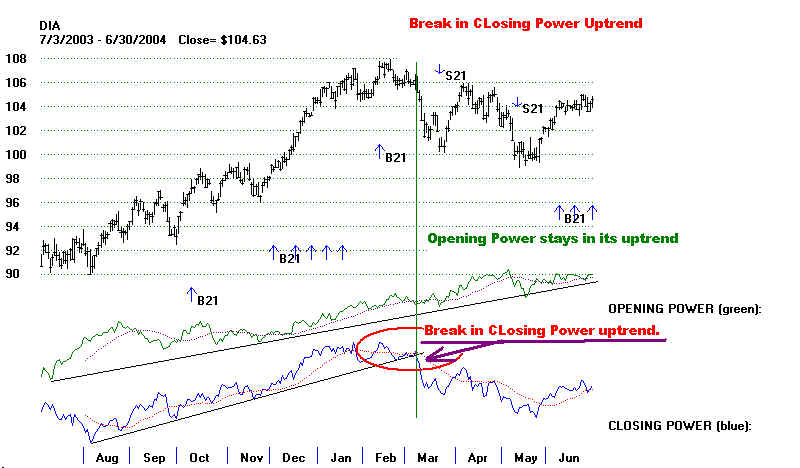
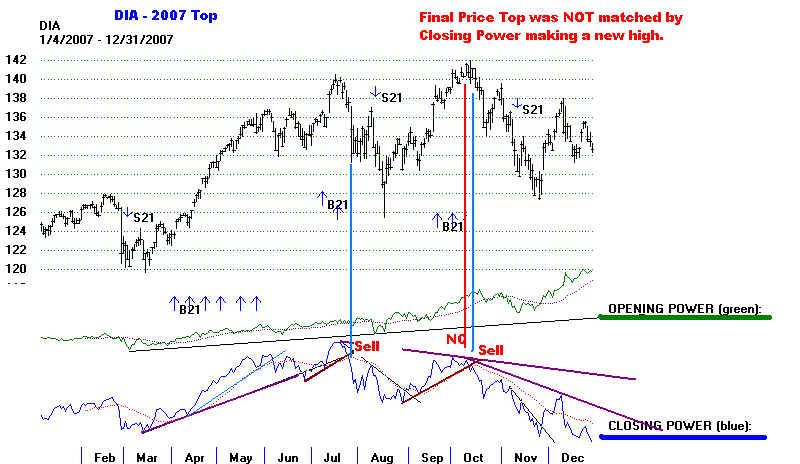
Before the the market can go into much of a correction, the uptrend of the Closing Power
of the DIA must first break its uptrend. That is our theory. And that is what happened in
2004 and 2007. First, see below the chart of the DIA now. Compare the Closing Power now
and its action at tops in early 2004 (which was followed by a decline until October 2004) and
in 2007. Notice how the uptrends of the Opening Power continued to rise after the tops
were made. Our theory holds that the broader public does not realize that a top is made
and keeps buying. But professional fund managers, as a whole, do sense a change. Their
buying swings around to net selling. This is what the break of the Closing Power's uptrend
tells us.
Presently, when the Opening Power is above its 21-day ma, openings average 0.2% higher
each day. And when Closing Power is above its 21-day ma, closings average 0.56% higher
than the level of the opening. Taken together, this suggests the DJI averages a daily move
of 0.76% higher when both Opening and Closing Power are rising, as now, though that
remains to be studied more closely.

------------------------------------------ 2003-2004 Top in DIA ------------------------------------------
----------------------------- 2007 Top in DIA ----------------------------
==============================================================
8/24/2009 Peerless Remains on Buys (B14,B12,B10)
The DJI keeps eating up the overhead supply of stock. It is normal for it to sell off
from its highs while doing this but then not decline much subsequently. Even with the
mid-day sell-off, there were more than 100 advancers than decliners. The key uptrend
to watch now is the NYSE A/D Line, I believe. The Closing Powers for the DIA, SPY,
QQQQ and IWM are each in uptrends. Oil stocks (XOM +7%, CVX +6%, bank
stocks (AXP +7% and BAC +4%), CAT (+8) and BA (+6%) have been the biggest
boosters to the rally, but the QQQQ is up a respectable 4%. Most of the key stocks
I look at each night are rising with good internals. See the charts of 27 key stocks.
Obama's reappointment of Bernanke is giving a lift to financial stocks. CitiGroup, Bernanke
and Geitner say, will not be allowed to fail. That is encouraging public speculators in it and giving the
market confidence. Look at the newer Opening and Closing Power TigerSoft chart of CitiGroup.
The signals show that the best moves are made when the Opening and Closing Powers are
moving in the same direction: "Both Down" - DD (down,down) or "Both Up" -UU (up, up)
having screened a directory of stocks with TigerSoft Power Ranker and using "Tiger Selections"
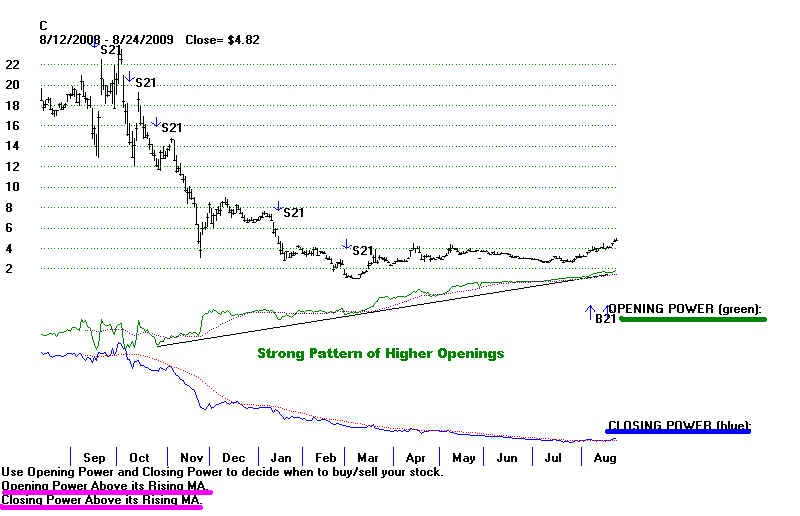
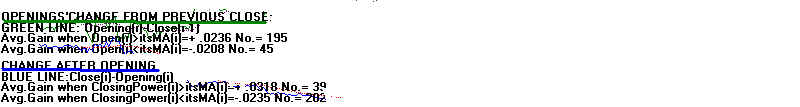
Something interesting is occurring there. The Buy B21s tell us that both the Opening and
Closing Power are rising. This is bullish, just as the Sell S21 advises us when both
the Opening and Closing Power are bearishly falling. What I want to point out some key
trading aspects of C's Opening and CLosing Powers. If you place the older TigerSoft chart
on the screen, you will see that the chart advises you what the average daily gain is
from Opening to the next Day's Close for the past year when the Opening Power is
above its rising 21-day ma. It is a remarkable 2.36%/day when the Opening Power is above
its 21-day ma, as is true now One could have made a lot of money buying C at the close and selling into
the typical strength of the next day's Opening for the 195 trading days this past year when
the Opening Power was above its 21-day ma. Right now, the relatively rare condition of the Closing
Power being above its 21-day ma is true. The average gain from Opening to C;ose on the
39 days this past year when this was true was 3.18%, Both conditions are now true. If the
gains of the past year were to repeat, it would mean a 5.5% gain from Close to the next Day's
Close. This suggests the power of moves in C when both the Opening and Closing Power
are above their 21-day ma.
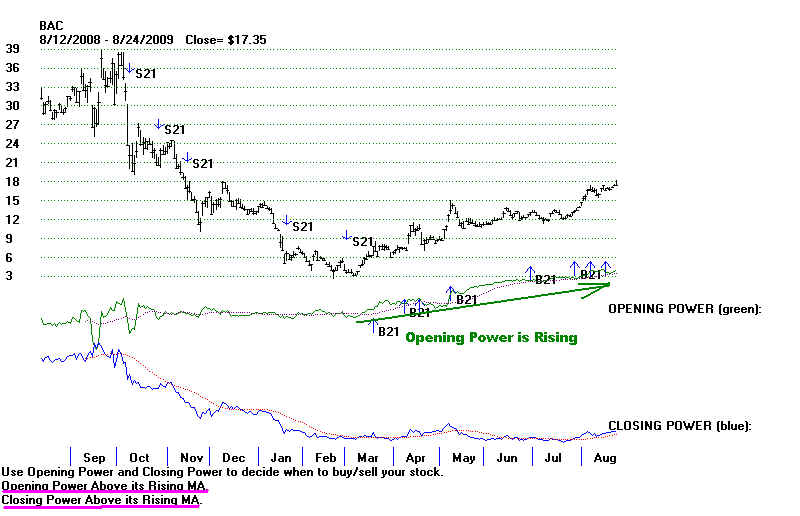
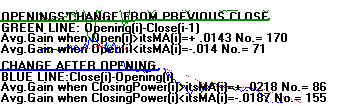
BAC (Bank of America) can be traded the same way. As with C, its Opening and CLosing Powers
are above their 21-day ma. BAC gains on average 1.43% over night when its Opening Power
is rising in the 170 cases this past tear. When the Closing Power is above its 21-day ma, the
additional average gain from Opening to Close is 2.18%. If these two numbers were really additive,
the present condition would seem to indicate an average gain of 4.61% daily.
I need to get busy and write a program to give us these values for all stocks, all at once
and also show the true average daily gain when both conditions are true.
The Federal Government can make (and break) any company it wishes. Free enterprise
at the corporate level is a myth. But if its interventions can cause a Depression to be avoided, then
Government action is a good thing and necessary. Unfortunately, we have seen the Federal
Government not only is not very good at controling intemperant bubbles, it helps make them.
It may well be making one right now.
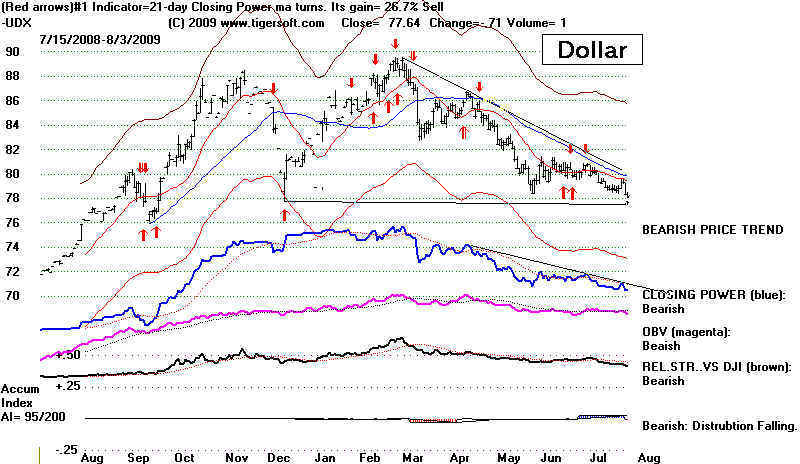
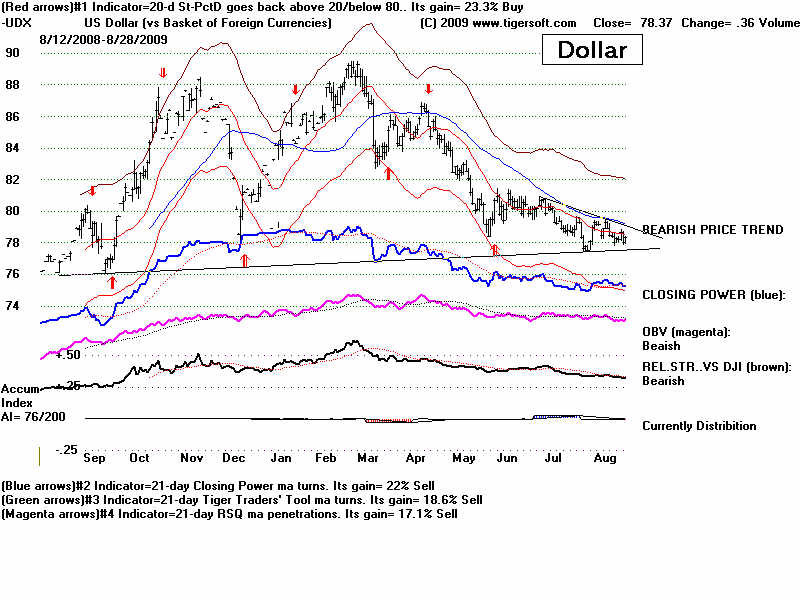
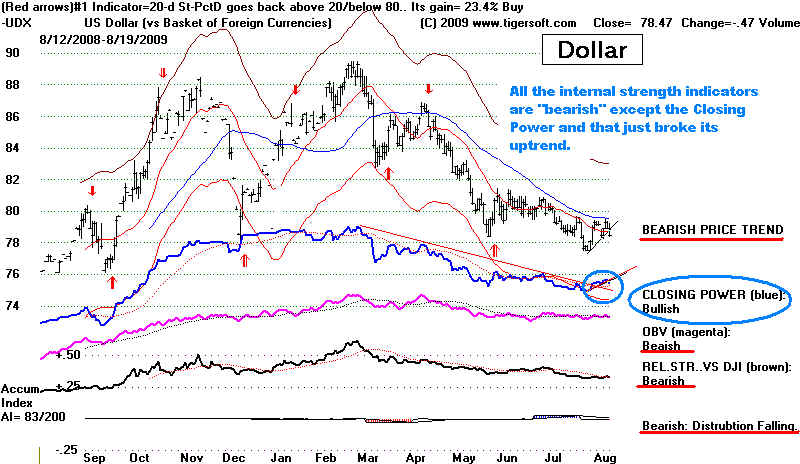
There is another risk, of course. And that is what might happen to the Dollar. Right now
it is being supported. But for how long? We'll keep watching it each night. A breakdown in
the Dollar would seem to be only a matter of time, given the size of the federal "rescue" deficits
Dollar Crude Oil Gold Perpetual Contract Silver Perpetual Contract
==================================================================
8/21/2009 Peerless Remains on Buys (B14,B12,B10)
No sell is in sight. The internal strength indicators remain too positive to produce one.
Please see the new weekend report on How to Use the Tiger Power Ranker with the DJI up
already 45% since the March bottom,
The DJI has now risen more than 45,2% from its bottom in a little more than five months.
How does this compare with the moves up from other bear market bottoms. The only gains this large
were in the 1930s: 1929-1930, 1932, 1933, 1938 and 1974-1975. The rally surpasses even the
wonderful start of the 1982-1987 bull market. Only 1932 and 1933 saw gains of more than 48%.
Is this still a dangerous market? Not so long as the NYSE A/D Line does not break its
uptrend. Stay with the up-trend. Tops are made when the P-Indicator and/or the Accumulation
Index dip towards or past zero.
There is reason for thinking that the market will move up much more. My suspicions last
year were that Paulson (who came from Goldman Sachs) and the major Wall Street
banks, especially GS, hood-winked Congress and especially the publicly less responsive Senate
into giving them trillion of dollars, far more than they needed and infinitely more than they
deserved. If this was so, and Obama has not bothered to investigate the matter but is reveling in
the market's recovery, then the stock market should continue to rise very quickly, as the bailout was
never needed in the amout it was given. (A trillion dollars in credit distributed to every American
would have served the country better. The banks would get the money anyway. )
. We do have to be concerned if unemployment numbers do not show a steady improvement.
In the past there has been a 6 month - 12 month lag between the stock market and unemployment
numbers. For example. unemployment peaked in December 1982, at 10.8%. This was 5 months
after the market took off in August. We have now seen the market shoot upwards 5 months. And
right on schedule, the "official" July unemployment rate did drop to 9.4% from 9.5% in June. The
turn-around in the economy therefore seems to match the 1982 experience.
Bear Market Low Peak in 6 Months Peak in Next Year. Peak in Two Years.
12/19/1917 65.90 5/16/1918 84 10/18/1918 89.10 11/13/1919 119.60
+27.5%
8/25/1921 63.90 2/21/1922 85.8 8/23/1922 100.30 3/20/1923 105.40
+34.2%
5/20/1924 88.30 11/18/1924 110.70 5/20/1924 128.70 2/11/1926 162.3-
+25.4%
11/13/1929 198.70 4/17/1930 294.10 Bear market continues
+48.0%
7/8/1932 41.20 9/7/1932 79.90 Bear market continues.
+93.9%
2/27/1933 50.2 7/18/1933 108.70 2/5/1934 110.70 decline to 85.50 on 7/26/34 2/18/1935 107.20
+116.5%
3/31/1938 98.90 7/25/1938 144.90 11/19/1038 158.10 decline to 123.8 on 4/11/39 9/13/1939 154.10
+46.5%
4/28/1942 92.90 10/21/1942 115.10 4/6/1943 136.0 sidewise for 7 months 3/13/1944 141.00
+23.9%
3/16/1948 165.40 6/15/1948 193.20 10/27/1949 189.30 decline to 161.60 on 6/13/449 3/16/1950 207.90
+16.8%
9/14/1953 255.50 3/12/1954 299.70 9/13/1954 351.10 rallied 9/14/1953 482.90
+17.1%
12/18/1957 426.20 6/17/1958 479.00 12/18/1958 572.40 rallied 12/15/1959 673.70
+12.4%
10/25/1961 566.00 4/11/1962 694.10 8/23/1962 616.00 rallied 12/13/1962 734.90
+22.6%
10/23/1962 558.00 4/23/1963 714.90 10/21/1963 752.30 rallied 10/20/1964 881.50
+28.1%
10/7/1966 744.32 2/8/1967 860.97 9/25/1967 943.08 sidewise 10/7/1968 956.68
+15.7%
5/26/1970 631.16 11/11/1970 779.50 4/28.1971 950.82 down to 790 low 5/26/1972 971.25
+23.5%
12/6/1974 577.60 5/14/1974 850.73 5/15/74 840.70 7/15/1976 881.81
+47.2%
3/1/1978 743.33 8/18/1978 896.83 9/12/1978 906.44 2/13/80 903.84
+20.7%
8/12/1982 776.92 1/10/1983 1092.35 6/16/1093 1246.30 11/29/1983 1287.30
+40.6%
12/4/1987 1766.74 4/12/1988 2110.88 10/20/1988 2181.19 10/9/1989 2791.41
+19.5%
10/11/1990 2385.10 3/5/1991 2972.52 8/28/1991 3055.23 6/1/1992 3413.21
+24.6%
11/23/1994 3674.63 5/23/1995 4436.44 11/22/1995 5041.61 11/22/1997 6571.76
+20.7%
10/7/1998 7741.69 4/7/1999 10085.30 8/5/1999 11326.03 1/14/2000 11722.98
+30.3%
3/12/2003 7552.07 9/4/2003 9587.90 2/11/2004 10737.70 3/4/2005 10940.85
+27.0%
3/9/2009 6547.05 8/21/09 9505.96
+45.2%
==============================================================
8/20/2009 Peerless Remains on Buys (B14,B12,B10)
DJI - 9600 seems where we are headed. 10,000 would likely be heavy reistance.
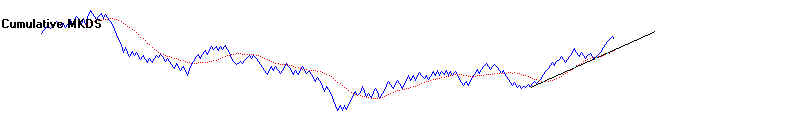
The breadth of the advance is still very bullish. Today breadth improved from Wednesday's
levels. Volume was almost two times higher in the average advancing stock in the NYSE
than the average declining stock: ( 875,000,000/2228 versus 162,770,000/807 ) The Cumulative
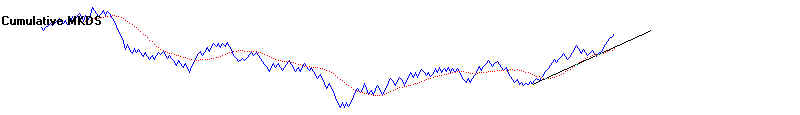
Inverted MKDS, which should - if the market is bullish - move up with the DJI, is now in a
confirning rising trend and is above its 21-day ma. On the NYSE there were 40 new highs today
and zero new lows. On the NASDAQ, the numbers were 29 and 2. Volume did rise today
on the NYSE compared with Wednesday.
The only problems are dubious consumer spending (but Visa and MA show rising CLosing Power
now, though their Accumulation Indexes are negative.) and the Dollar which closed at 78.38,
still quite a ways above its 12-month low of 76. A very weak Dollar would seriously hamstring the
Federal Reserve and the US Government's efforts to bailout and stimulate.
Bullishly, the NYSE A/D Line made another 12 month high, even though the DJIA is 2400 points
below its 12 mo high. The P-Indicator and Accumulation Index are only half their levels when the DJI
was challenging 9400. Back in the 1975 bull market, this condition set the stage for a push upwards
of an additional 8% rally before there is another retreat back to the lower band.
The Bullishness of Tests of A Strongly Rising 21-dma
with Very Positive IP21
On 8/17/2009 the DJI fell slightly below the 21-day ma. Its CL/MA was .995 on that day.
The annualized 21-dma ROC (rate of change) was a relatively high .509 and the IP21 was .124.
This shows strong momentum and high accumulation. The study I have done tonight at the
bottom of today;s hotline shows that rebounds up off the 21-day ma are much more likely when
the IP21 (current Accumulation Index) value is high or even above +.02, so lomg as the upward
momentum is very positive. The IP21 predicts expected support (accumulation). Only if the
annualized rate of change of the 21-dma slips below .15, would the DJI be expected to drop
to the lower band in the starting phase of a bull market. Usually it takes an IP21 under .02
along with a loss of upward momentum to make the market stumble to the lower band in the
first 6 monnths of a new bull market. The longer there is no such pull-back, the weaker the
internals have to get before there is a decline. See 1959 and 1980 for example.
Besides breadth, we want to watch the annualized rate of change of the DJI's 21-day ma. It
now stands at .606. I would hypothesize that DJI declines to the lower band are most often postponed
until there is more loss of upwards mementum and the Annualized ROC is below .15 and or
the current Accumulation Index (IP21) drops below .02. Let's see if the historical data supports this.
Some conclusions will be pointed out this weekend from the data below.
TOWARDS A SCHEME OF PREDICTIONS ABOUT
PRICES WHEN THERE IS A DIP TO THE 21-DMA
What is important, is that we can use the data below to make some predictions for the market
when the DJI falls to a point near its 21-day ma. And we can make these predictions using only
two variables: Annualized Momentum and Accumulation. This should be very helpful on
future dip to the 21-day ma...
DJI Tests of Its 21-DMA
in What Appears To Be A New Bull Marker: 1930-2009
Green shows the next move was up from the 21-dma.
Red shows the next move was down.
Date CL/MA 21-dma ROC IP21 Result
-----------------------------------------------------------------------------------------------------------
2/20/30 .993 .621 .015 DJI rose from 263.40 to 294.10 on 4/17/30
4/24/30 .991 .235 .013 DJI fell from 286.20 downwards in bear market
9/12/32 .998 .56 -.069 DJI fell from 72.30 to 65.10 on 9/19/32
9/22/32 .998 .098 -.049 DJI fell from 72.70 to 50.50 on 10/10/32
7/9/33 .907 -.146 DJI fell from 103.60 to 88.70 on 7/21/33
8/10/38 1.006 .413 -.063 DJI fell from 142.40 to 129.90 on 9/26/38
6/22/42 .997 .416 .102 DJI rallied from 102.80 to 108.70 on 7/14/42
7/24/42 .999 .414 .203 DJI rallied from 106.49 to 115.00 on 10/13/42
3/19/43 .998 .083 .118 DJI rallied from 129.30 to 142.400 on 6/2/43
4/27/43 1.000 .044 .02 DJI rallied from 134.40 to 142.400 on 6/2/43
7/23/43 1.00 .315 .136 DJI fell from 143.80 ro 130.70 on 12/1/43
5/3/48 1.004 .251 .147 DJI rallied from 181.10 to 193.00 on 6/11/48
6/21/48 .991 .025 .003 DJI fell from 189.70 ro 181.20 on 7/19/48
11/18/53 .996 .073 .09 DJI rallied from 274.50 to 292.90 on 1/26/54
2/25/54 1 003 .241 .107 DJI rallied from 292,60 to 328,40 on 6/2/54
3/24/54 .997 .276 .134 DJI rallied from 296.90 to 328,40 on 6/2/54
8/6/54 .999 .114 .168 DJI fell from 343.10 to 335.80,40 on 8/9/54
8/24/54 .998 .100 .106 DJI fell from 346.30 to 335.80,40 on 8/9/54
5/15/58 1 004 .353 .111 DJI rallied from 457.90 to 510.30 on 8/4/58
6/25/58 1.004 .264 .034 DJI rallied from 471.50 to 510.30 on 8/4/58
7/15/58 1.004 .10 .026 DJI rallied from 478.80 to 510.30 on 8/4/58
8/18/58 .997 .381 .192 DJI rallied from 502.70 to 567.40 on 11/17/58
10/28/58 .996 .175 .036 DJI rallied from 536.90 to 567.40 on 11/17/58
DJI then fell to 540.50 on 11/25/58
2/3/59 .999 .042 .023 DJI then fell from 592.30 to 574.50 on 2/9/59
At some point, a ralliy that does not stop obtains momentum and goes further up for longer
than normal. April 1959 S9s brought only drops half way between the lower band and the
21-day ma. The top did not occur until July 1959 with an S9.
11/30/60 .995 .383 .109 DJI rallied from 597.20 to 694,10 on 4/11/61
1/3/61 1.000 .307 .046 DJI rallied from 610.20 to 694,10 on 4/11/61
2/10/61 .997 .208 .111 DJI rallied from 639.7 to 694,10 on 4/11/61
3/15/61 1.005 .468 .10 DJI rallied from 662.9 to 694,10 on 4/11/61
3/28/61 1.000 .162 .022 DJI rallied from 669.50 to 694,10 on 4/11/61
4/21/61 1.003 .103 .058 DJI rallied from 685.20 to 701,10 on 5/8/61
5/25/61 .998 .138 .008 DJI then fell from 690.10 to 680.60 on 6/19/61
12/14/63 1.006 .327 .08 DJI rallied from 648.10 to 688.90 on 1/18/61
2/21/64 1.00 .07 .12 DJI fell from 681.60 to 659.70 on 3/1/64
and then rallied to 726.30 on 6/3/64
2/16/67 1.001 .057 -.022 DJI fell from 851.50 to 836.64 on 2/27/67
and then rallied to 873.72 on 3/27/67
2/22/71 .992 .194 .14 DJI rallied from 868.98 to 948/15 on 4/29/71
3/25/71 1.002 .334 .111 DJI rallied from 800.81 to 948/15 on 4/29/71
5/13/71 .995 .048 .071 DJI fell from 936.34 to 874.42 on 6/22/71
1/21/72 1.006 .298 .042 DJI rallied from 907.44 to 966/96 on 4/12/72
3/28/72 .998 .161 .023 DJI rallied from 937.01 to 966/96 on 4/12/72
4/25/72 .991 .052 - .004 DJI fell from 946.49 to 925.12 on 5/9/72
2/25/75 1.002 .875 .10 DJI rallied from 719.88 to 834,72on 5/6/75
3/21/75 1.007 .278 .038 DJI fell from 763.06 to 742,88 on 4/7/75
It then rallied to 875 on 6/30/1975
5/2075 .998 .209 -.023 DJI fell from 830.49 to 817.04 on 5/28/75
It then rallied to 875 on 6/30/1975
7/17/75 .997 .491 .06 DJI fell from 864.28 to 784.16 on 10/1/75
5/10/78 1.005 .759 -.027 DJI rallied from 822.16 to 866.51 on 6/6/78
5/24/78 .999 .061 .009 DJI rallied from 837.92 to 8 66.51 on 6/6/78
6/14/78 1.005 .109 -.042 DJI fell from 854.56 to 812.28 on 6/26/78
6/30/80 .998 .234 .032 DJI rallied from 867.92 to 952,39 on 8/12/80
8/19/80 .999 .142 .072 DJI moved up and then down near 21-dma
10/22/80 1.002 -.086 -.095 DJI fell from 955.12 to 917.75 on 10/30/80
The 1982-1983 Bull Market shows same pattern - with the added concept that the first retreat
back below the 21-day ma quickly finds buyers and he rally resumes.
9/28/82 1.003 .466 .013 DJI rallied from 919.33 to 1058,87 on 12/28/82
10/29/82 1.003 1.555 .13 DJI rallied from 9991.72 to 1058.87 on 12/28/82
In 1995, the DJI was rallying into all-time high territory, so the path of least resistance was up.
The same principles worked. Both the Annualized ROC and IP21 stayed quite positive for all
buy two weeks of the year.
After March 2003, the DJI rallied without retreating to the lower band. Each dip to the 21-day ma
worked out as good buying opportunities.
3/31/03 1.002 .151 .164
4/10/03 1.003 .976 .14
4/25/03 1.003 .404 -.016 Market kept rallying despite negative IP21
5/19/03 .995 .217 .104
9/18/03 1.001 .257 .11
11/11/03 .998 -.032 .064 2% dip followed and then rally.
11/25/03 1.000 .190 .057
The period from August 2006 to January 2077 had numerous successful tests of a rising 21-dma
without a pull-back to the lower band.
9/7/06 1.002 .166 .018
11/3/06 .998 .119 .117
11/27/06 .996 -.041 .041
2/9/07 1.000 .131 .049
2/26/07 .999 .123 .041 DJI finally fell to a point just below the lower band.
2009 Bull Market:
4/22/09 1.00 .167 .083 DJI rose from 7886.57 to 8770.92 on 6/11/09
5/21/09 .998 .583 -.017 DJI rose from 8282.13 to 8770.92 on 6/11/09
6/16/09 .991 .328 .046 DJI fell from 8504.67 to 8163.60 on 7/7/09
8/17/09 .995 .509 up so far...
===================================================================================
8/19/2009 Peerless Remains on Buys (B14,B12,B10)
Not much of A Pull-Back for The Averages. Investors Still Want in!
The DJI continued up from the support of the rising 21-day ma. There were more than 600 up than
down. The A/D Line for the DJI-30, SP-500, QQQQ and Low Priced Stocks all rose. The internal
strength indicators improved for the DJI. The point of breakout for the B10, about 9100, seems to have
held. That suggest a challenge of the highest recovery close, 9398, this year and then 9625, the Election
Day Close.
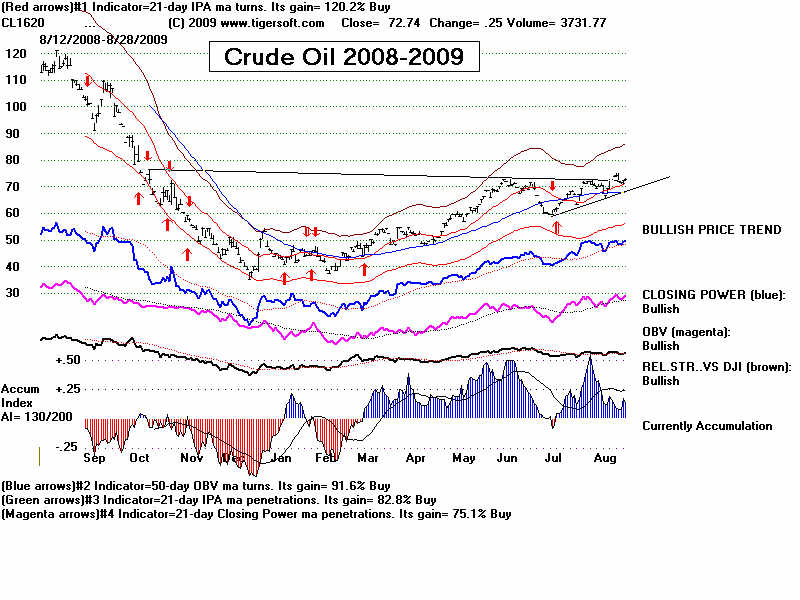
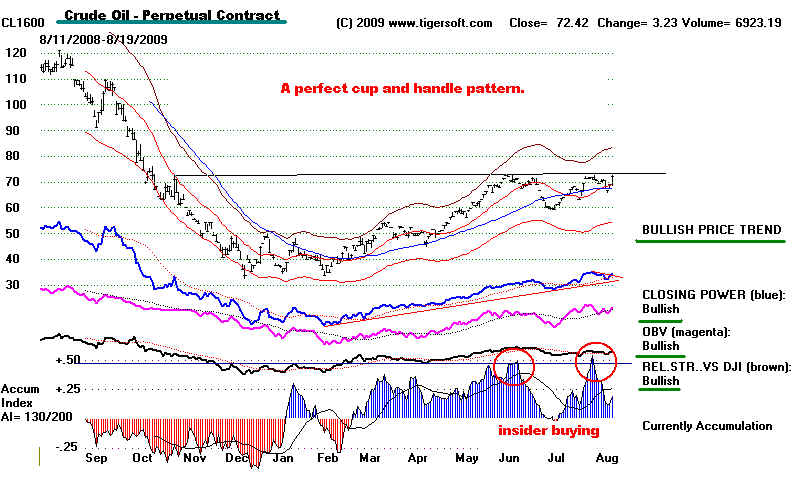
As often happens, the high priced oil stocks in the DJI lifted the averages when Crude Oil
prices rise. Crude oil is close to a breakout that would be bullish. The cups and handle pattern
it now shows is classic. Chevron rose 1.22 and XOM impoved 1.51. They could easily move
up 10% if the perpetual contract of Crude Oil closes up .58 above 73. XOM looks like a good
trade using the TigerSoft optimum trading system. Look also at CRED (recent B12 and B24).
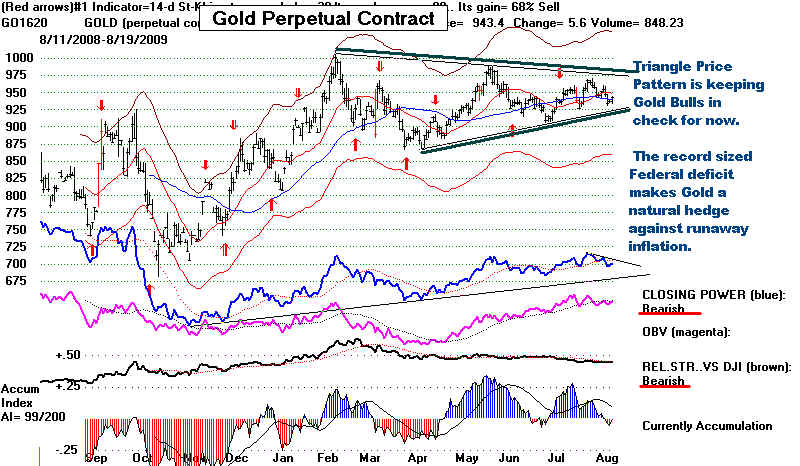
OII and SM (all "bullish') if there is such a breakout. These are the "bullish" Power-Ranked
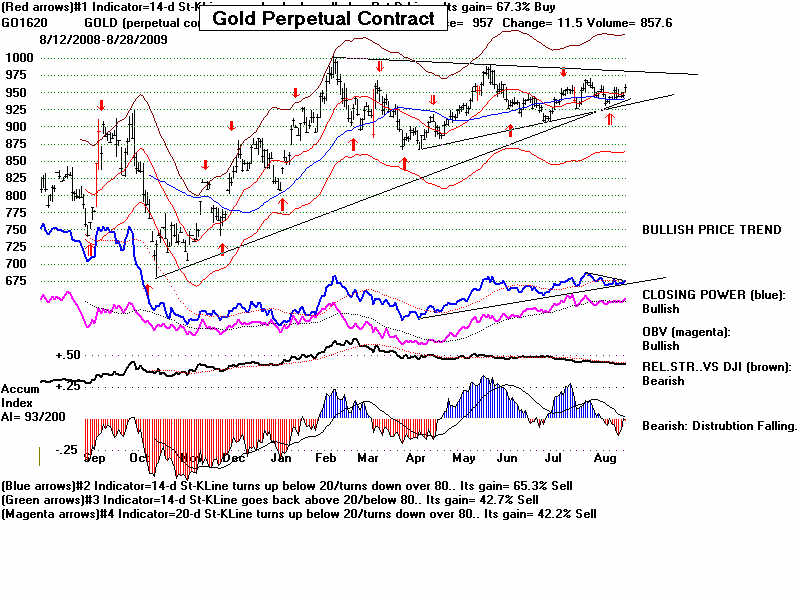
stocks in OILSTKS. If the Dollar down break down, I would think that will also lift Gold. But,
clearly from the way it keeps recovering from 78, there is some Treasury intervention to hold
the Dollar up.
Technology stocks rested, but the Closing Power for the DIA and SPY made bullish new highs.
A convenient decline is not being provided late-comers to the bull market. They may be forced
to buy on strength. The steep uptrend of the NYSE A/D Line is still above its rising 21-day ma.
More spectacular price swings are still showing that hot money is very confidenct. SPDE below
is on the verge of being de-listed by the NASDAQ!. Today's volume in CERS (2.88 +1.09)) was
higher than all the volume for the last year. More interesting was the huge jump in volume in
tripler, EDAP (4.2 +2.83) which got FDA approval for a urological ultrasound device. Once
the genie of rampant speculation is freed and encouraged, and that's what Obama and the FED
have done, by guaranteeing that the big banks cannot fail, it is hard to be put back in the bottle
of reason. EDAP is interesting. Wells Fargo owns 507,484 chares of EDAP and Goldman Sachs
owns 133, 644. EDAP advanced from 4 to 22 in 23 months in early 2006. You can compare the
charts for EDAP below for these two time periods. My thinking is that the stock ought to go to
at least 10 with the FDA approval.
EDAP 2005-2006

EDAP 2008-2009


============================================================================
8/18/2009 Peerless Remains on Buys (B14,B12,B10)
More profit-taking is likely in some of the low-priced stocks that have run up so much.
The supporting power of the rising 21-day ma was on exhibit today. The DJI rose
on lighter volume than it fell Monday, but breadth was again very good. The DJI
will need now to get back above 9230 to show the breakdown Monday was temporary.
9230 was the 5-day support level that failed on Monday. Buying at 8999 and the
lower band with a new Buy B9 would seem to be the best option right now.
Seasonally, the DJI has been up 59% of the time over the next 3 trading days after August
18th since 1965. But after that, it typically starts to slip. Over the next 21 trading days,
the DJI is more likely to fall than rise, advancing ober this time 48.7% of the time and
showing a .6% decline on average.
Just below is the A/D Line fpr the 15 stocks that best predict the DJI the next day
on a day-to-day basis by virtue of their moves today.

Please read te comments of the last few days. The warnings still apply. A dip to the lower band
would nring up a Buy B9 most likely and more head-room, if we assume that a rally to 9600 lies
ahead.
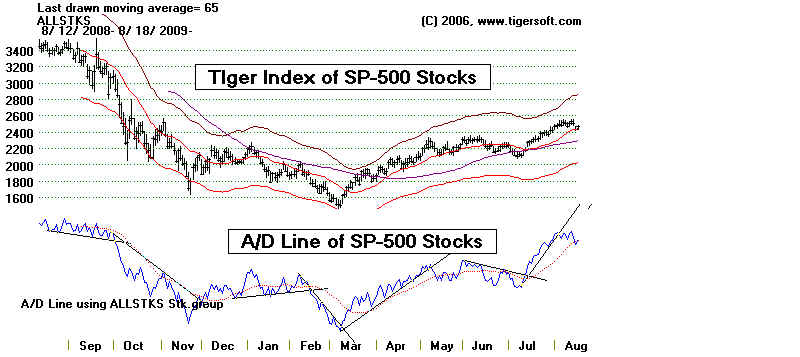
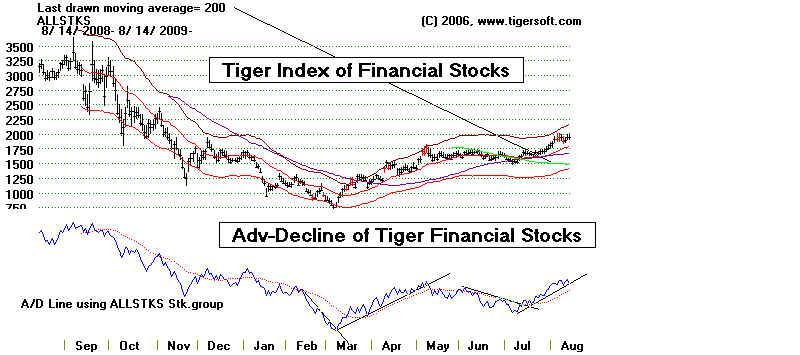
Below is the Tiger Index of the SP-500 stocks, weight by price times volume AND its A/D Liine.
.==============================================================
8/17/2009 Peerless Remains on Buys (B14,B12,B10) A Decline to The
Lower Band Should Bring A New Buy.
More more profit-taking is likely. If there is a rally, 9210-9230 is apt to act as resistance.
This is the point of breakdown yesterday. A number of "explosive super stocks" have
rallied 300%, 500%, 1000% since the March bottom. How much more can they be
expected to rise? Profit-taking is due. But that does not mean a start of a new
bear market. The P-Indicator and Accumulation Index are still very positive. So a decline of 3%
more would likely bring a Buy B9. As it is, the DJI has closed slightly below the rising 21-day
ma. That moving average should now act as some support.
The breaking of the NYSE A/D Line uptrend wothout a Peerless Sell seldom brings
a severe decline. See yesterday's report.
This is still a market of stocks. So, I would be very wary of stocks that have risen
unreasonable amounts. Study the report I did this past weekend showing dozens of
explosive super stocks going back to the 1990s. A close below the 65-day ma is the
point at which we have to sell these stocks. Many times, there is a slight breaking
of the rising 50-day ma and then a good rally. Only when the 50-day ma turns down
are these stocks in danger of a total collaspe.
See http://www.tigersoft.com/BiggestG/index.html
We Are In The Begining of A Bearish Seasonal Period.
Be cautious. Tale some profits. After all September is coming up, and it has the worst record
for any month. And then comes the month of October, which has so often brought a
severe selling climax. See just below the track record for Septembers and Octobers
in the year after the election since 1915. Declines in August slightly outnumber
Advances, 12 to 11. September is worse. The were 13 declining Septembers and only
10 advancing Septmbers. Octobers mark a point of reversal. And the last three
months of the year bring advances much more often than declines.
DJI Performance by Month: 1915-2009: Years after The Presidential Election
Julys Augusts Septembers Octobers Novembers December
18 up 11 up 10 up 13 up 15 up 17 up
6 down 12 down 13 down 10 down 8 down 6 down
DJI Performance by Month:1965-2008: All
Years
==== Probability of The DJI Rallying Each Month ====
Julys
Augusts Septembers
Octobers Novembers December
Up% 52.5% 56.4%
30.8%
59.0%
66.7%
74.4%
Change 0.4% -0.2% -0.8%
0.5%
1.0%
2.1%
I have already advised using a stop just below the 10-day
ma when stocks are so
over-extended that the downside risk to the 50-day ma is more than the upside
postential.
There also comes a point where we must be very alert for reasons to take profits in
stocks that are up a lot. Ten days ago, I wrote a report showing 17 red warning flags.
Let me give four more examples of top formations we must be ready for and use to
sell when spotted in order to avoid significant declines.
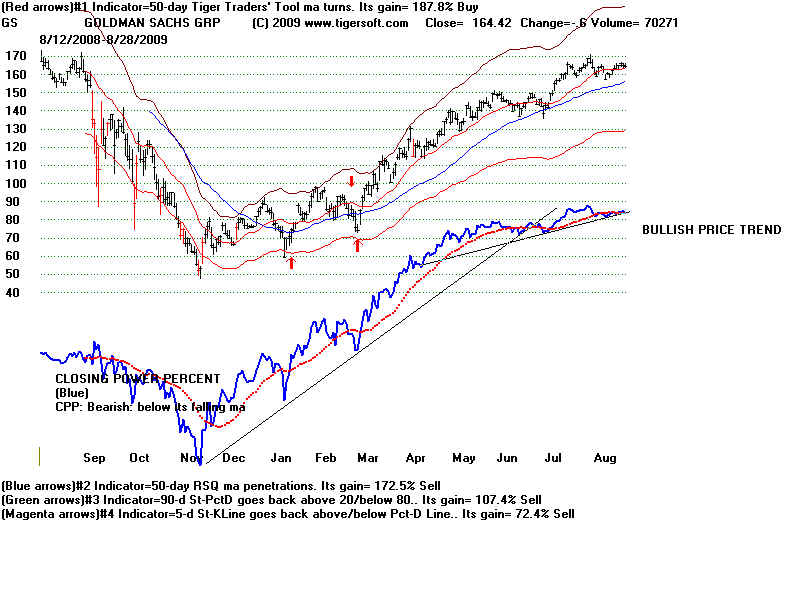
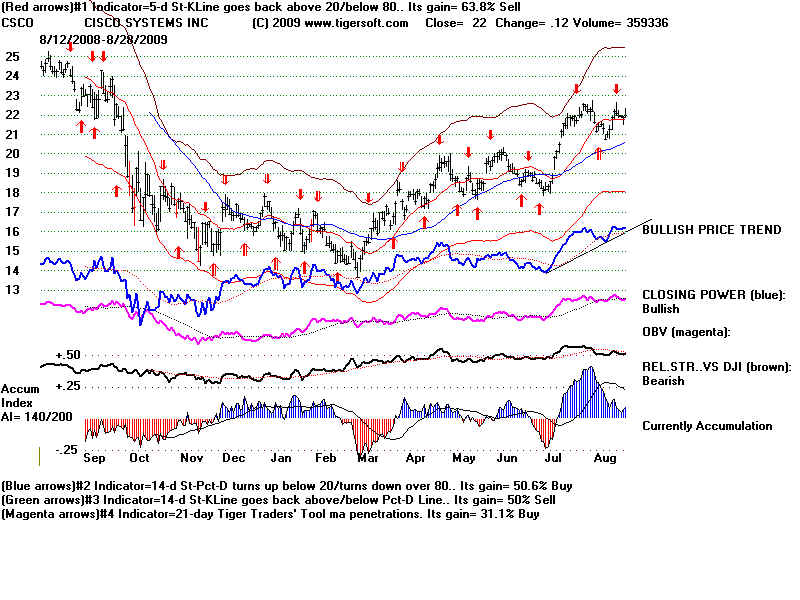
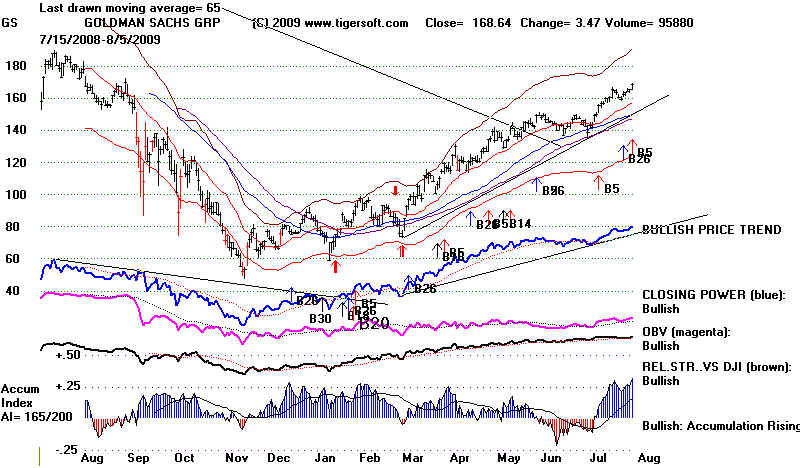
1) Head and shoulders patterns are distinctly bearish, even when the Accumulation Index
are positive. This what we see in the current patterns of stock market leaders
Goldman Sachs
and Cisco: GS 157.25 -5.48 (D) and CSCO 20.73 -.58 (D) This is a common pattern
at tops. Right now, I don't see so many of these to become very bearish.
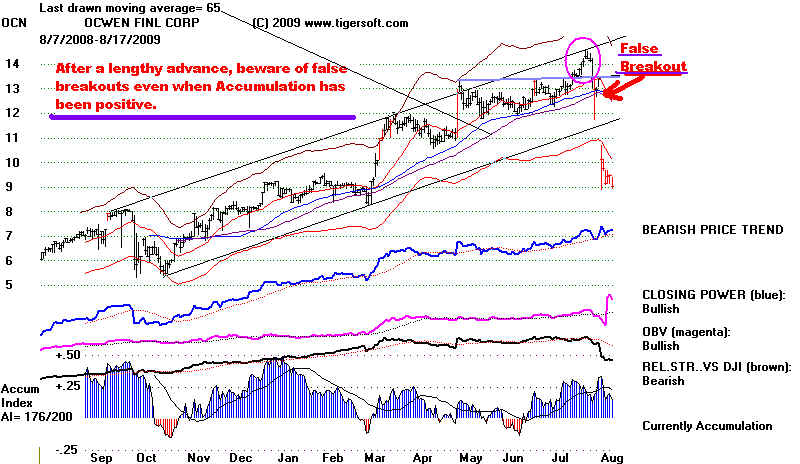
2) False breakouts above well-tested flat resistance are very bearish because they
trap short-term trading bulls with mounting losses and make the stock more vulnerable
because some of the stock's shorts were run in on the brief price breakout and
so there is that much less cushion on the decline. See the chart of OCN below.
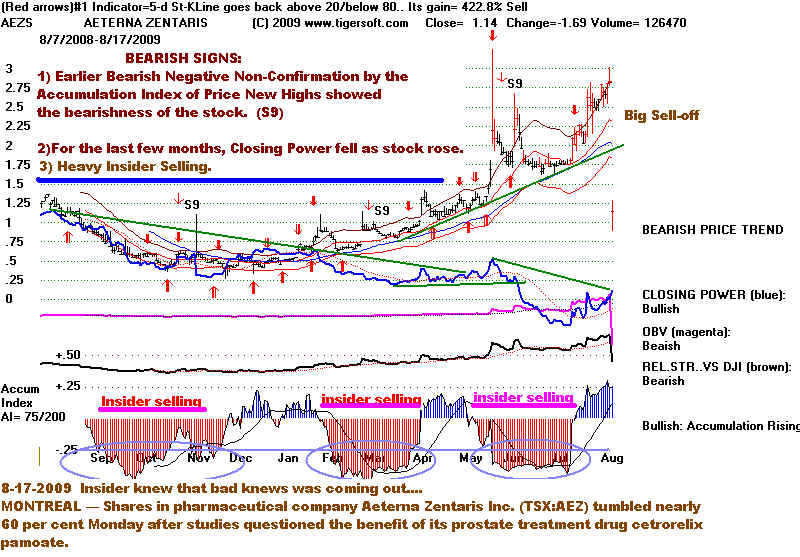
3) I think one of the easiest ways to recognize a top is by noticing when
a stock is making
a series of new highs with the Accumulation still negative: the example today is AEZS.
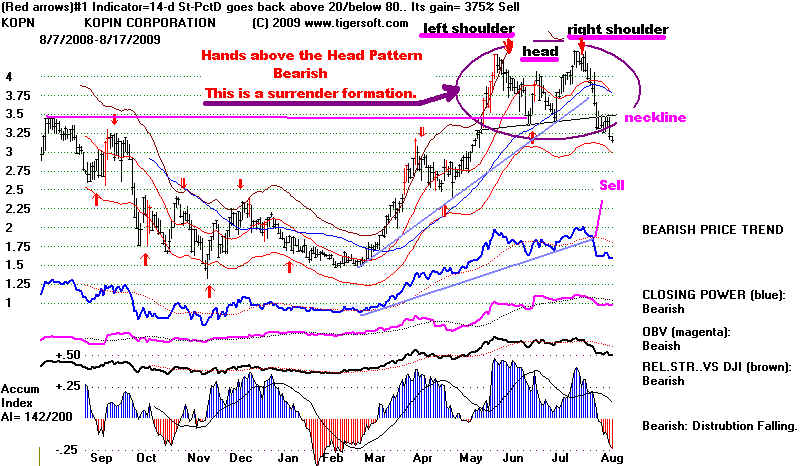
4) Chart patterns showing a hands above the head pattern are
bearish. These patterns show
excessive speculation. In such cases, don't wait for a price closing below the
neckline to sell.
Use trend-breaks in the Closing Power if the pattern develops, even when there still is
blue Accumulation shown.
.==============================================================
8/14/2009 Peerless Remains on Buys (B14,B12,B10) - But A Warning...
When you do all your stock homework, as I have done today by having the
Power-Ranker
look at all 6000 stocks, and we still come up with nothing to buy, it is not a good sign
for the market,
especially when it is up 35% in five months, when so many low priced stocks have had
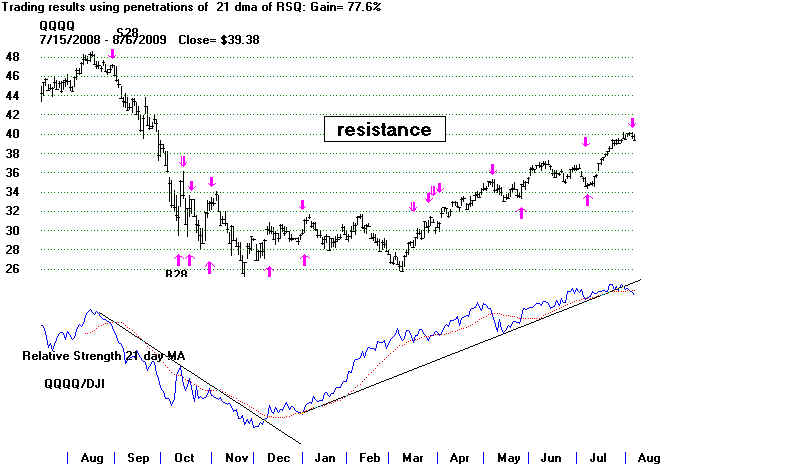
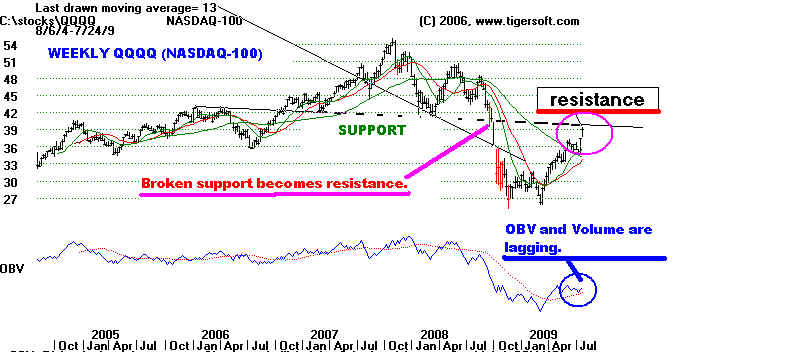
moves of a life-time up in this short period and when the QQQQ has reached important
resistance, as 40-41 is. .
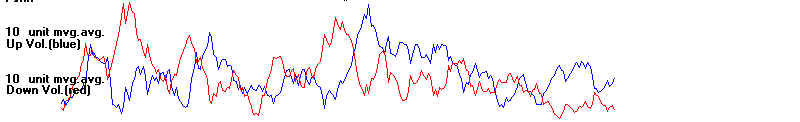
In the chart just above, we see that the 10-day ma of NYSE Up Volume has broken its
uptrend.
Down volume is not uptrending, but that may change today, if the market does not rally
aftter
a very weak opening.
Below is the NYSE A/D Line for the last 12 months. Always watch this line.

Breadth, as measured by the NYSE A/D Line, is still
uptrending strongly. The steep uptrendline
may, however, be broken this week. That would likely set the stage for a drop to the
shallower
uptrend. Until there is a break in the second uptrend, there cannot be much of a
decline. And even
then a break in the steep AD Line uptrend in the first 8 months after a bear market low,
usually only
sets up a minor decline and a new trading range, around the recent highs, as the DJI falls
back
about 10%. There are important exceptions, however. Fortunately, a Peerless
Sell signal would
normally be expected to warn us if this were one of those cases when the A/D Line
uptrend-
break is going to lead to a much bigger decline. In the 6 of 7 cases (red and
green), the declines
following a break in the A/D Line were less than 2.5%. In one case, there was a 7.1%
decline.
Cases of A/D Line Trend-Breaks where There Was No Sell In the Weeks before.
1. 1938 DJI rallied immediately and to the upper band, where there was a Sell S9.
2. 1963 DJI fell from 717 to 620 - 7.1% decline.
3. 1971 Very small decline
4. 1975 DJI fell from 838 to 815.
5. 1982 DJI rallied immediately.
6. 1995 DJI rallied immediately.
7. 2003 DJI rallied immediately.
Red shows a case where the A/D Line was broken without a
prior or just aftwards.
These are the cases that seem most like ours at present.
Green cases show are ones in which there is no prior Sell signal, but one soon follows.
This may still prove to be what happens in our present case.
SIGNIFICANCE OF BREAK IN A/D LINE UPTREND IN FIRST WAVE UP FROM A BOTTOM
A/D Line
Sell S4/S9/S12 Result
UP Trend-Break
4/16/1930 292.20
S4/S9/S12
This was top just before 1930-1932 bear market began
9/9/1932 76.20
S8/S12
This
was top before decline to 50.
(1) 12/21/1938
149.60
S9 on next rally After the S9 at 153.60, the DJI falls to
121 in April '39
S9 on 1/3/1939
1942 Bottom's Subsequent A/D Line uptrend-line was not violated for more than a year.
10/30/1947 170.9
S4 on 10/22/1947 DJI falls to 165.70 on 2/11/1948
1954 Bottom's Subsequent A/D Line uptrend-line was not violated for more than a year.
. 1957
Bottom's Subsequent A/D Line uptrend-line was not violated for more than a year.
6/8/1961 701.60
S15
DJI falls to 679.30 on 7/18/61 and then rallies
an S9 in August which begins a top formation
that is not completed until March 1962.
(2) 2/7/1963
716.59
no sell
DJI falls to 659.70 on 3/1/1963 and then
rallies strongly.
5/15/1967 882.41
S12
DJI falls to 847.77 on 6/5/67
(3)
3/22/1971
910.60
S9 on next rally After the A/D Line trend-break, the
DJI falls
only to the 21-day ma. It then rallies to an
S9 on 5/6/1971, after which it declines from 937
to 7909 over the next six months.
(4) 5/19/1975
837.69
S8 on next rally After the A/D Line trend-break, the
DJI falls
only to 815 on 5/29 It then rallies to an
S8 on 7/1/1975, after which it declines to 792
on 8/21/1975.
6/16/1978 836.97
S8 on 6/13/1978 DJI declines from 854.56 where S8 was
to 807.17 on 7/6/1978.
8/18/1980 848.63
S2/S1 three days before DJI declines to 934.73 on 9/9/1980.
(5)
11/22/1982 1000.00
no Sell
DJI immediately rallied to upper band.
The S9 there only brings a decline to the lower band.
3/24/1987 2023.87
S1 two wks before DJI fell only 1979.77 on 3/28/1988 (B9)
4/10/1991 2874.50
no Sell
DJI immediately rallied to upper band.
(6) 9/26/1995 4765.60
no Sell
DJI went sidewise until late October and
then rallied The December 1974 Bottom's
Subsequent A/D Line uptrend was not violated
for 10 months.)
(7) 7/16/2003 9094.59
no Sell
DJI went sidewise for three weeks and
then rallied
A/D
Lines for Key Sectors
A pause is taking place among the leaders in the 2009 Post-March
Surge. The Futures show
the
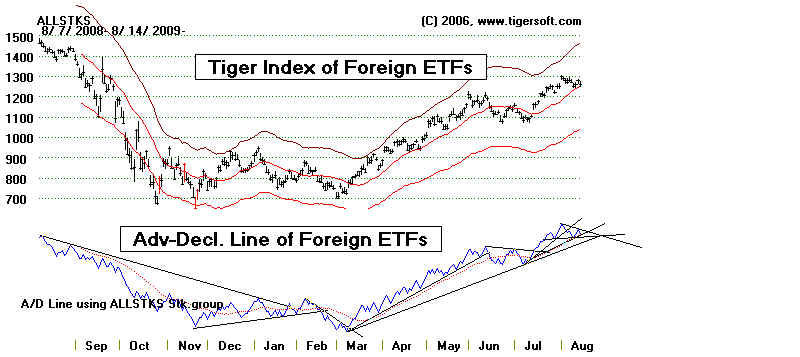
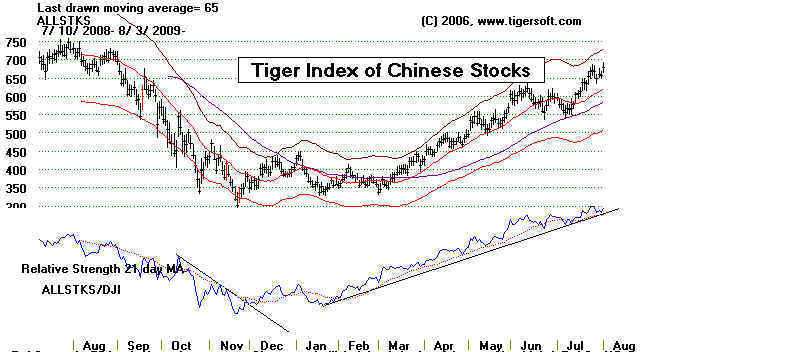
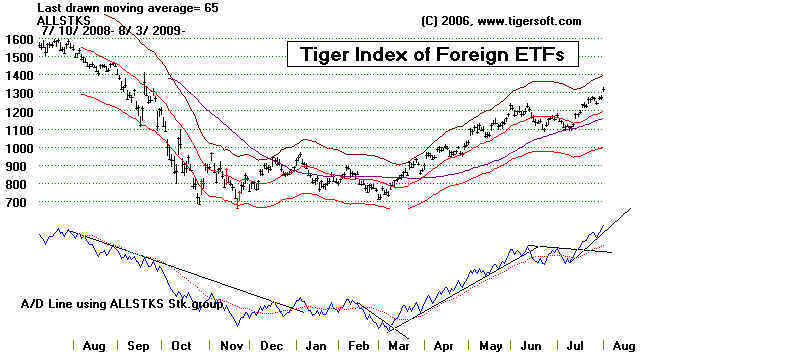
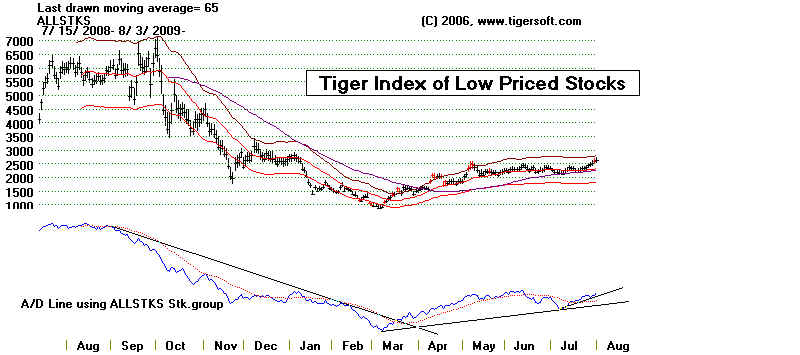
DJI may open 100 points lower today. Just below, the A/D Lines for Chinese Stocks,
Foreign ETFs and Low Priced Stocks have broken their steep uptrends. Financial
Stocks and
Housing Stocks still have their A/D Line uptrends intact. The first three show
that the advance is
getting tired. Socialism for the Banks and Housing stocks continues to be paying off
if you
own
stocks in these areas. Their Adv.-Decl. uptrends are still intact, though that may change
next
week.
-------------------------------------- Chinese Stocks
--------------------------------------------

---------------------------------------- Foreign ETF Stocks
----------------------------------------------
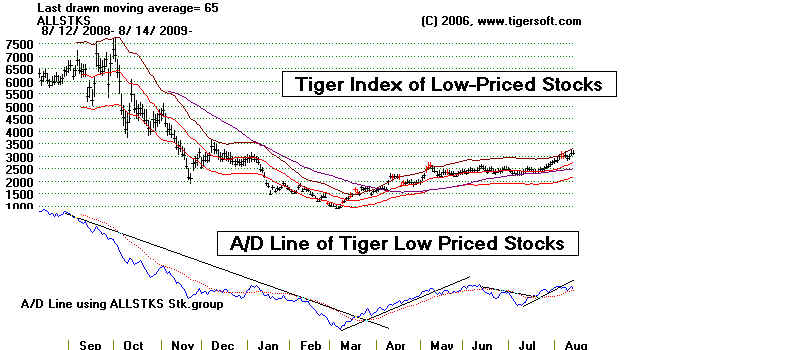
---------------------------------------- Low Priced Stocks
----------------------------------------------
---------------------------------------- Financial Stocks
----------------------------------------------
---------------------------------------- Home-Building Stocks
----------------------------------------------

======================================================================================
8/13/2009 Peerless Remains on Buys
(B14,B12,B10)
There's Probably More Upside Ahead..
Before there can be a significant decline, we usually see some group of stocks form
top
patterns. A head and shoulders pattern is the most common such development.
When
that pattern is seen, we need to see the Accumulation Index be negative on the
right
shoulder, otherwise the bearish pattern is suspect. We can test this theory now
by
watching Goldman Sachs, GSm which shows a potantial head and shoulder pattern
developing, but also shows a very positive Accumulation Index now. Goldman Sachs
Again
breadth was positive as the DJI pushed up on light volume The 9600 October rally
peak
would seem to be a good target for the DJI. The NASDAQ and the QQQQ are
falling behind the DJI. But over the last 50 tradig days, the QQQQ is still up 3%
more than
the
DJI. 40-41 is its resistance.
The
NASDAQ now shows a negative reading from the Peerless relative strength "NASDJI"
Indicator even as the NASDAQ rallies. As long as the NASDAQ's Accumulation Index is
as
high as it is now, over +.35, we are probably safe for a while lomger, juding feom
my
study
of the period 1988-2000 But the loss of powr in the NASDAQ relative to the DJI
shows
the rally is running out of stamina. The turning negative of the Accumulation Index
next
with
the rallying continuing would be a real problem At the last bull market's
start in 2003,
the
pattern of a negative NASDJI and a very positive Accumulation Index only developed
in
December, 9 months from the market bottom. That was three weeks before the NASDAQ
peaked and six weeks before the Peerless S9 in February 2004 halted the rally for 7
months.
Today the
Accumulation Index for the DJI stands at +.206. This is very good number, but we
have to
note that today the Accumulation index fell below its 21-day ma. This pattern
of
of high
IP21 (.>+.194) falling back below its 21-day ma is also associated with somewhat higher
prices and
then sidewise hesitation. If the Accumulation Index were under .163, it probabilty
would then
be for a decline somewhat below the lower band. But that is not true now.
2/3/1994
Sell S4 IP21 crossed below its ma and IP21=.151 DJI fell almost 10% from its high..
2/27/1991
IP21 crossed below its
ma and IP21=.207 ... DJI rose a little and stabalized.
11/4/1988
IP21 crossed below its
ma and IP21=.161 DJI next fell 5% below its 21-dma.
8/27/.1987
IP21 crossed below its ma and
IP21=.149 DJI next fell 5% below its 21-dma.
12/24/1986
IP21 crossed
below its ma and IP21=.162 DJI turned up sharply in
Janaury.
6/24/1986
IP21 crossed below its ma and IP21=.155 DJI next fell
5% below its 21-dma.
3/10/1986
IP21 crossed below its ma and IP21=.21 DJI rose 15%
12/2/1985
IP21 crossed below its ma and IP21=.194 DJI rose 8%
=================================================================================
8/12/2009 Peerless Remains on Buys
(B14,B12,B10)
Today produced an impressive reversal. Volume could have been more
convincing.
But,
we'll gladly take what we can get. After a down opening, the market moved broadly
up.
This caused the Closing Powers to reverse their short-term downtrends. A new
high
was
not made by the DJI, but breadth was excellent. There were 1428 more up than down.
Nearly all Closing Powers for the major market ETFs and stocks we followed can be
classified now as neutral or rising. I think it's very constructive that were 33 new
highs
and
only one new low on the NASDAQ. Seasonality is not strong after this week. But
the
rally
shows that there are lots of buyers who want aboard this market.
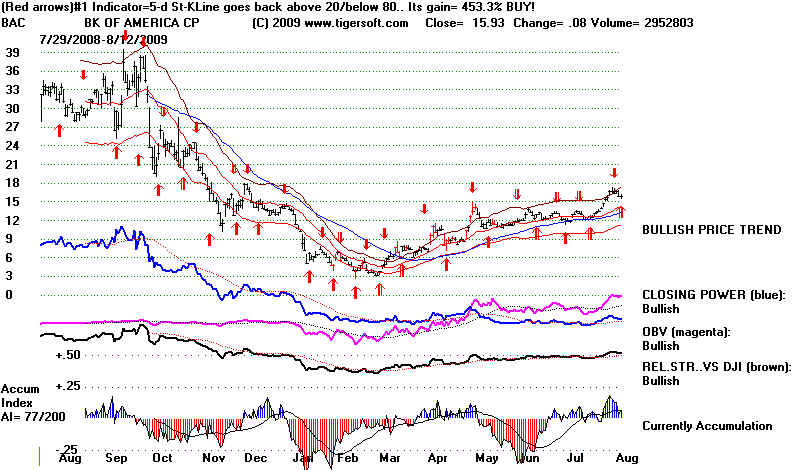
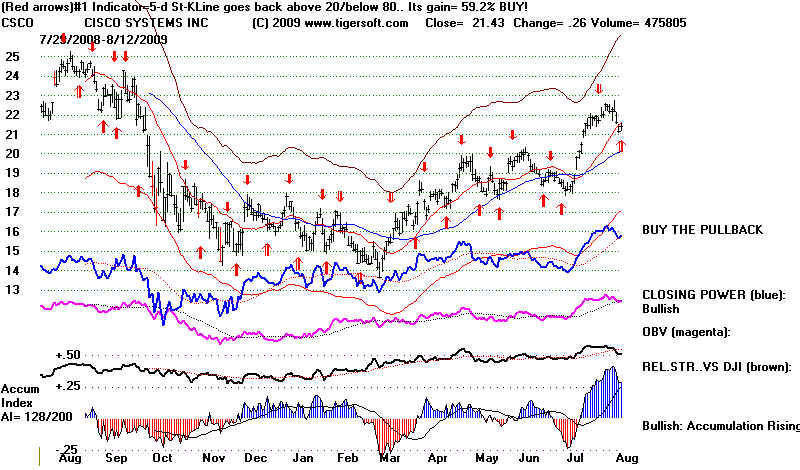
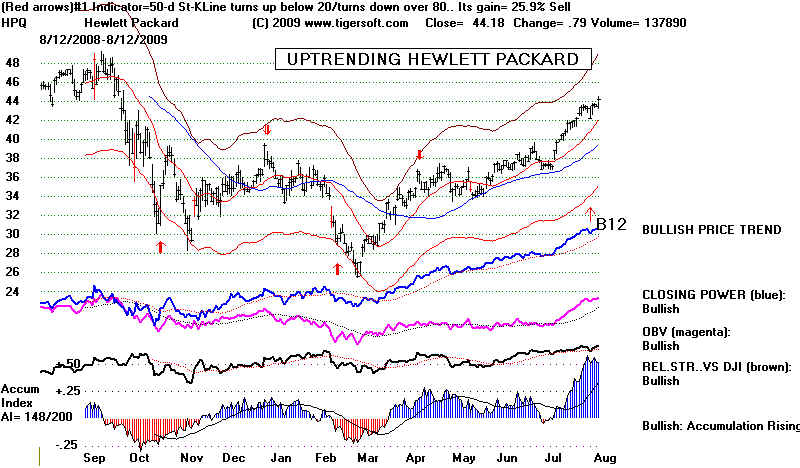
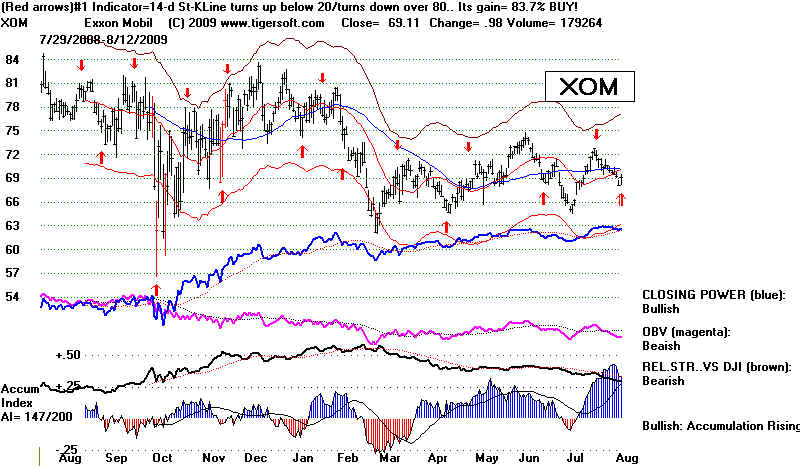
Four key DJI stocks, BAC, CSCO, HPQ and XOM got TigerSoft Buys today.
That
should help the DIA and the markets as a whole. It is rare for a DJI
stock to get
a very bullish TigerSoft Buy B12, HPQ did that today. It is working its way up
through
the 44 ressitance from its broken support there last Fall, I take this as a bullish
sign,
XOM still has a higher consistent Accumulation score. Below are their charts,
BAC, Bank of America, also got a short-term buy today and an important vote of
confidence from the Billion
Dollar Super Bear - John Paulson. It was anoounced
today that his hedge fund bought $3.7 billion worth of Bank of America, 168 million shares
in the 2nd quarter.
===============================================================
8/11/2009 Peerless Remains on Buys (B14,B12,B10)
Closing Powers for the
major market ETFs have broken their uptrend-lines and are
declining,
A retreat to 9230 seems likely. 9000 is better support. The Closing Powers
should tell us
when to play the upside again by breaking their downtrends.
===============================================================
8/10/2009 Peerless Remains on Buys (B14,B12,B10)
The DJI has been moving up
while steadily staying above its upper 3.5% band
since April. On
that occasion the DJI needed to re-group by falling back to its rising 21-day.
That may also be needed
now, as the Closing Powers for the major market ETFs have
broken their
uptrend-lines. A retreat by the QQQQ from its resistance at 40 and SP-500
from the round
number 1000 should not come as a suprise. More of a decline seems unlikely.
But the rising
21-day ma seems the best support.
===============================================================
8/7/2009 Peerless Remains on Buys (B14,B12,B10)
After 9500-9600 Is Reached, A
Profit-Taking Pullback
towards 50-day ma seems most likely.
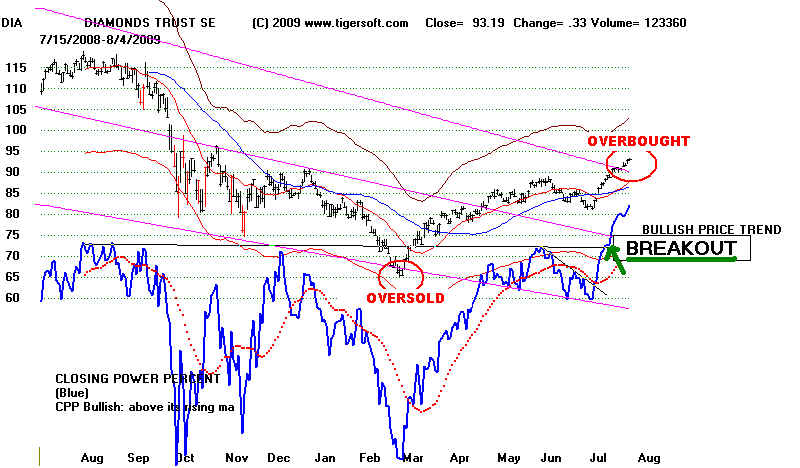
The DIA'S steep Closing Power
uptrend has been violated. This means Professionals
are distributing stock to those who buy at the
opening. In June 2003, a similar technical setup
led to a retreat to a rising 50-day ma for DIA
and QQQQ. The 95-96 area is resistance
from the October 2008 technical rebound.
I expect DIA to reach that level because of the
breakout at 90-91, as the market moves up to
the next level where sell orders are likely
to be concentrated. Higher prices are
also likely for the DIA because the Opening Power
is still rising and the Closing Power might
still resume its uptrend, since it is still above its
21-day ma.
DIA shows a Closing Percent Power uptrend break.
------------------------------------------------------------------------------------------------------------------------------
SP-500
The Advances-Decline
for the SP-500 stocks is in a pronounced uptrend, though
it is not quite as
strong as the NYSE A/D Line, which is making 12 month highs because
it includes more
interest rate sensitive issues. The TigerSoft fixed rule Buys are placed
on the chart for the
period that the Index was above its 65-day ma. The SPY's CLosing Percent
Power has violated its
steep uptrend. Since rallies normally need strength after the opening,
this warns that a
pullback is likely, unless there is a renewed surge of professional buying
after the Opening.
Friday's results may be a little distorted as traders take profits before
a weekend.
------------------------------------------------------------------------------------------------------------------------------
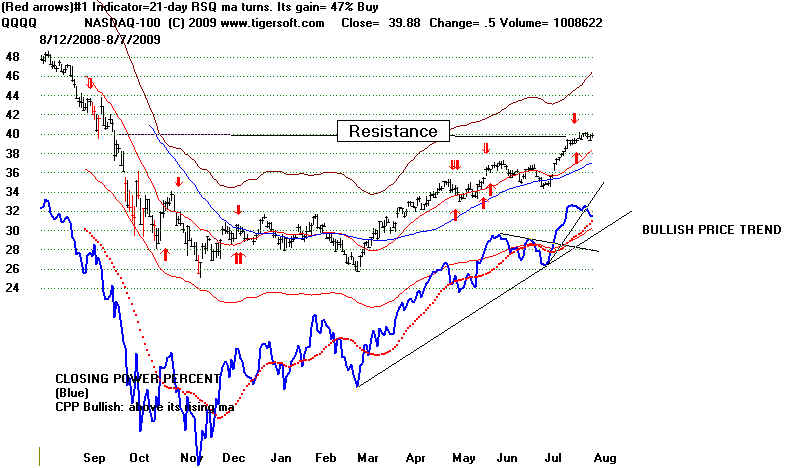
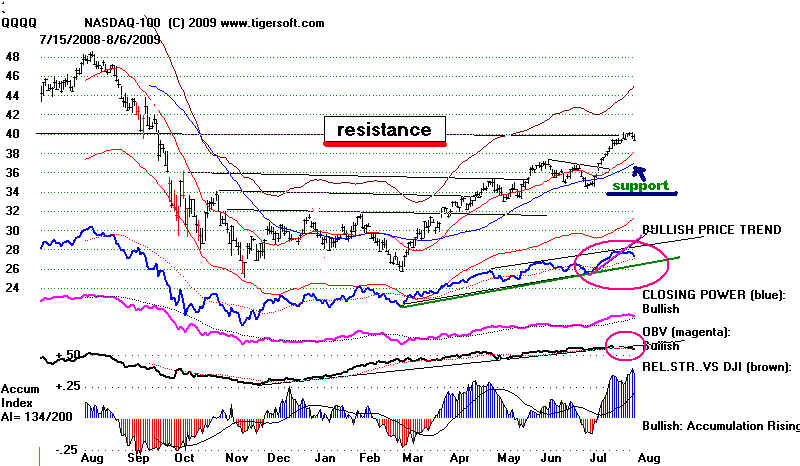
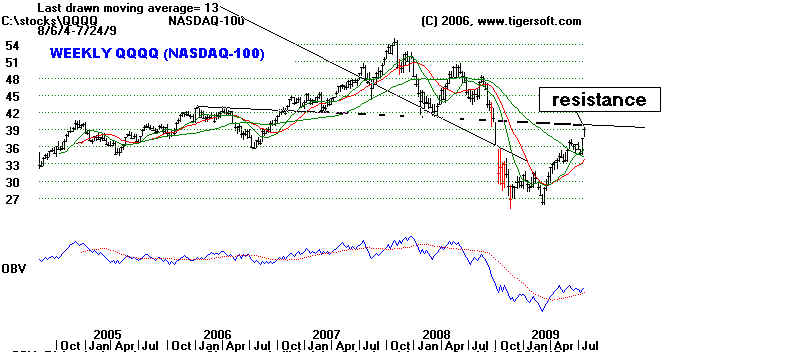
NASDAQ-100 - The QQQQ has reached the 40
resistance from broken
bottoms in
March 2007, February-March 2008 and September 2008.
See the weekly chart posted last week.
Volume rose last week compared to the previous week, but is below
its 5 week ma. The A/D Line for the NASDAQ-100 stocks is rising.
Many NASDAQ-100 stocks look they should be bought on breakouts
to recovery highs because the internals are very strong and the CLosing
Power is already making a new 12-month high: Examples: COST, PCAR
and SPLS.
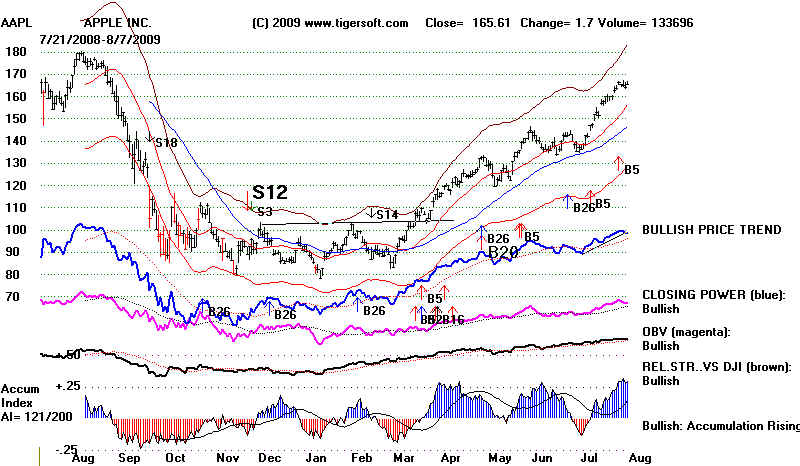
Leading stocks like AAPL and ADBE are still advancing strongly
and show high levels of Accumulation, but are also getting over-extended,
as they lead the bullish advance and having now made three runs up to points
more than 15% above the 50-day ma. Below is the chart of AAPL. It is my
contention elsewhere that AAPL usually shows distribution and
a distribution top before there is a significant general market decline.
It is certainly over-extended but its internals are still strong.
Its Closing Power uptrend has just been marginally violated.
Look through the QQQQ stocks.
More than 1/3 show lots of Accumulation and
are still rising: ADSK, ALTR, AMAT, BBBY, BRCM, CA, CHKP, COST, CSCO,
CTAS, CTXS, EBAY, EXPE, FAST, FISV, FLEX, GRMN, INFY, INTU,
JNPR, LBTYA, LINTA, MHCP, MICC, MRVL, NTAP, NVDA, PAYX, PCAR (Buy-36.08),
QCOM, SBUX, SPLS (Buy-22.95), TLAB, URBN, XLNX
Only a very few look weak: FSLR LEAP, PPDI
,
QQQQ-100 - Warnings. Pullback to 50-day ma/65-day ma seems
much closer.
1) Rising A/D Line.. Watch to see if it can
make a new recovery high.
2) CLosing Power is now in a downtrend
correction.
3) Relative Strength is on A Sell.

------------------------------------------------------------------------------------------------------------------------------
==============================================================
8/6/2009
Still on a Peerless Buy... B14/B12/B10 But Profit-Taking
In
Over_Extended Stocks WIll Probably Continue.
Profit-taking in
over-extended low priced stocks accelerated today. The August 7th
Blog today
gives as a presentation of such stocks now and what are the 17 red warning flags
that bulls
should be able to spot. At the same time, a few others with high accumulation
stocks
are
breaking out from good bases. The profit-taking today was presaged by the
developing
weakness
seen recently in the Tiger Relative Strength Quotient (QQQQ/DJIA) Line.
See
below. It has broken its 9 month uptrend-line. The DJI will probably hold
up better.
Both the
DIA's Opening and Closing Powers are above their rising 21-day ma.
But the
steep Closing Power uptrend-lines for the SPY, DIA and QQQQ have been violated,
but their 5
month uptrend-lines are still in tact. This suggests a further market decline to
remedy the
extreme over-bought condition in a number of stocks. The longer-term Blue
Closing
Power uptrendlines will probably have to be tested. I am made more confident of
this
prediction upon viewing the stocks shown in the new study below and taking into account
the
resistance levels achieved by the QQQQ (40) and SP-500(1000). But without a Peerless
Sell,
intermediate-term investors should just hold positions tightly in general market ETFs.
Use closing
stops beneath over-extended low-priced stocks, especially when the conditions
mentioned
in the August 7th study are present.
Biggest Six Month Stock Gainer
How much coffee can consumers drink?
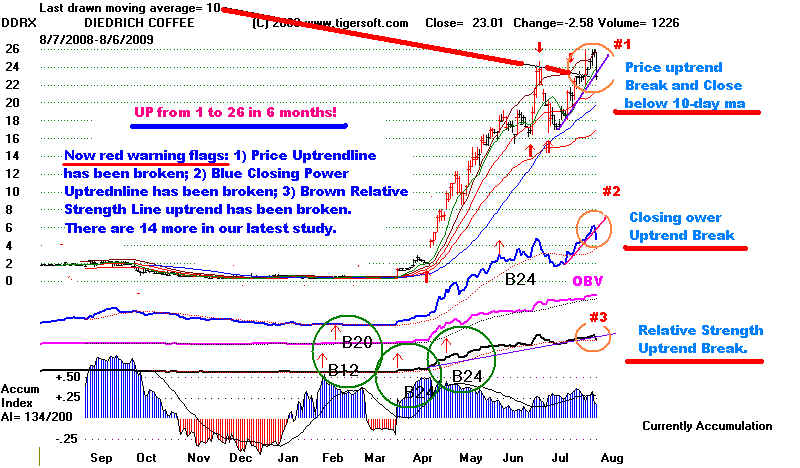
August 7, 2009 Bulls Should Be Able To
Spot The Red Warning Flags
in Over_Extended
Low-Priced Stock
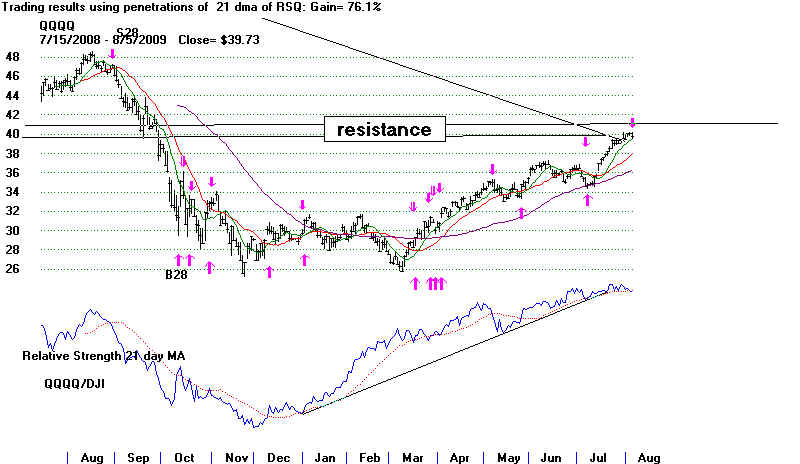
========== QQQQ RELATIVE STRENGTH UPTREND BREAK ====================
Steep QQQ Closing Power and Relative
Strength Uptrend-Breaks
Steep SPY Closing Power Uptrend-Break
Steep DIA Closing Power Uptrend-Break
==============================================================
8/5/2009
Still on a Peerless Buy... B14/B12/B10
The steep A/D Line rise's
uptrendline in still in tact. But volume rose on what
was a generally
weak day, except for Banks and publicly funded hedge funds (GS and MS).
The QQQQ's
Closing Power steep uptrend has been violated even though its Accumulation
Index is now
above +.35, a rare condition. The QQQQ has reached and is having trouble
penetrating the
40-41 resistance level. See the weekly chart of the QQQQ just below.
The SPY's Closing
Power uptrend-line is being tested now. The SP-500 is at the round
number,
psychological resistance of 1000. Before we get to concerned, note that both
the Opening and
Closing Power are rated as "rising" by the computer for the DIA, QQQQ,
SPY and IWM.
In this situation, we usually let prices run until the Closing Power has
broken its
uptrend.
The QQQQ's Relative Strength Line versus the
DJI has just broken its 21-day ma.
With a trading
system built on this one indicator having gained 75% for the last year,
this should not
be pooh-poohed as only a short-term (1-8 weeks) signal. So, working with
stops just below
a 10-day ma of over-stocks seems reasonable, despite the still operative
Buys from
Peerless.
The boom in low priced stocks does not appear to be
ending. Like all Bubbles
whether funded
and promoted only by private capital excesses or by government
guarantees and
hand-outs to "private" hedge funds like Goldman Sachs or small
electronics
companies feeding at the Defense Department trough, these binges
always go to
excess. But they usually go higher than 90% of the observers expect.
I witnessed this
in:
1968 with low priced stocks and small electronics companies,
in 1972 with the "nifty-fifty stocks",
in 1980 and 2008 with oil stocks and commodities,
and in 2000 with internet stocks (2000)
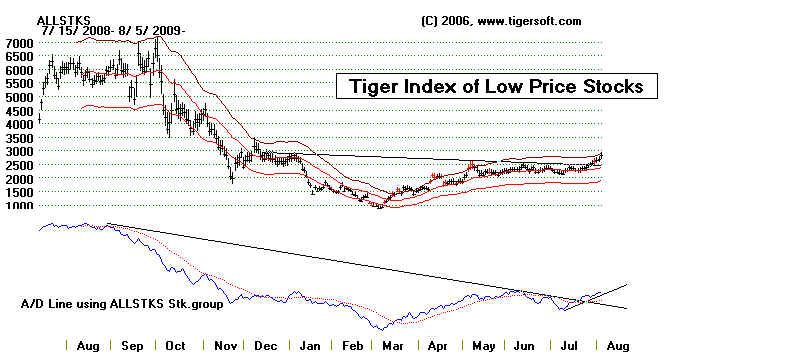
The Tiger Index
of Low Priced stocks and its A/D Line remain strong. Look at how
its A/D
Line uptrend continues to rise. The public still has not been invited to this party.
Cynics
would say that these stocks will rise until then and that this shooting star
advance is
Wall Street's way of luring them back into the market. See yesterday's
Blog for
showing how TigerSoft spots these stocks - Savvy Insiders Are
Right Again.
And WHEN TO
SELLl - http://www.tigersoft.com/When-To-Sell.htm
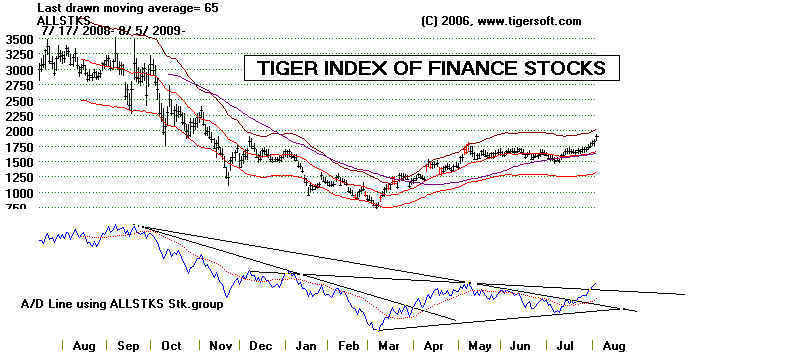
Finance stock, especially banks and government guaranteed
hedge funds, are very
powerful.
Goldman Sachs is their leader. In a day or two, I will post a Blog study to show
how the market
does when finance stocks and GS, in particular, take over the market's
leadership.
TIGER
USERS, The trends of the 50-day and 65-day ma are very important.
You can put trading Buy
signals for the part of a chart where the stock is above the 50-day
ma using the first choice
under Signals(3)
=====================================================================================
8/4/2009
Still on a Peerless Buy... Breadth Remains Very Good.
ETFs' Closing Powers Are Rising.
But volume remains low. All this has been a
bullish combination so far. If volume were to rise now, it would show something is
different. and the public is being invited into join the party very late. Right now
the
DIA is "in the zone". Both Opening AND Closing Power are rising. The
Closing
Percent Power has achieved a 12 month, flat-topped breakout. That has to be
especially bullish.
Sometimes, The Hardest Thing To Do Is To Do Nothing.
I appreciate that the DIA is now more than 3 standard deviations away from its least
squares linw. But, as you can see from the charts of 1942 and 1975, the first
advance
in a big bull market can go a lot further and higher continue a lot longer than 90% of
traders expect or are comfortable with. The trick is not to try to be clever and
call a
top too soon for the market - I think. Peerless will give a Sell at some point. But
we are not there yet. To be safe and comfortable, work with a closing stop under the
10-day ma with over-extended stocks.
Lots of Explosive Super Stocks
What I like most about this market most is that our stratgies and tactics for finding the
current era's explosive super
stocks are working even better than they did in 1982-1983,
1988, 1991, 1995 and almost as well
as in the go-go internet bubble years of 1997-2000.
But at what point do we have to be
concerned about a new bubble, where too much money
is being placed into too few
stocks? As long as breadth stays so positive, I think we can
relax and enjoy the rise.
See the comments below. The Blog for 8/4/2009 shows how important
it is to believe in the potential
of the bulges of Tiger Accumulation as representatives of
insider buying and then actually
Buy on the next new highs, because the bulges represents
SAVVY insider buying. The
Blog looks at how bulges of TigerSoft's Accumulation Index
correlate with reported insider
buying on Yahoo.
http://www.tigersoftware.com/TigerBlogs/8-4-2009/index.html
BUY WHAT INSIDERS ARE BUYING
SELL WHEN INSIDERS ARE SELLING
Example - Odyssey Exploration -
2007

To my surprise, that they would actually do something, the new SEC has just brought
charges against a number of
insiders at Odyssey Exploration for not waiting until the
public announcement to buy shares
in OMEX after the company discovered and started
bringing up $500 million in sunken
treasure off Gibraltar. (On July 15, 2009, the
SEC charged six Odyssey insiders
with insider trading.)
----------------------------------------------------------------------------------------------------------------------------
8/3/2009
New Buy B10 Today Tells
Us Only That The DJI has made 6 Month
New High with Good Internals
The recovery continues with excellent breadth even as
volume lags. The Buy B12 did what
it was supposed to and told us to respect the breadth
and let the rising A/D Line run. The
failed head and shoulders pattern in early July was a
"bear trap". Moving above that pattern's
right shoulder proved, as expected, to lead to much
higher prices for the DJI. As is common,
in early bull markets, there are lots of stocks that
showed intense accumulation and insider
buying now leading the advance to new high after new
high.
Today, there were more than 2000 up than down on the
NYSE, a ratio of nearly 5:1.
This far along an advance, such good breadth seems
quite bullish. Ever since the bottom
on March 9th, very good breadth has trumped the
bearishness of lower volume. Why change
what has been working? The Closing Power is
still in an uptrend for the major ETFs.
The leading stocks above have not formed bearish top
patterns or shown bearish divergences.
Looking elsewhere, the Chinese market continues to
lead the world markets higher,
without a hitch so far. We see a confirming A/D
Line for Chinese Stocks and Foreign ETFs below.
Meanwhile, the low priced stocks' A/D Line is still
uptrending, too.
The only two problem I
see is that the NASDAQ and QQQQ have now regained 50% of what
they lost between 2007-2009. The NASDAQ now
seems weaker as a whole than the DJI
or the SP-500. Such rotation is normal.
The QQQQ's Relative Strength is not showing
such weakness, I must quickly add. It is
reaching its 40-41 resistance seen looking at a 5-year
chart. So pullbacks to the zone between a
rising 50-day and 65-day ma will eventually
occur in the stocks leading the advance, even though
they show high Accumulation. I would,
work with stops below very over-extended stocks'
10-day mvg.avgs.
The second concern is
the fate of the Dollar. It is close to breaking to decisive 6-month low.
Some gold stocks do look very bullish, others like
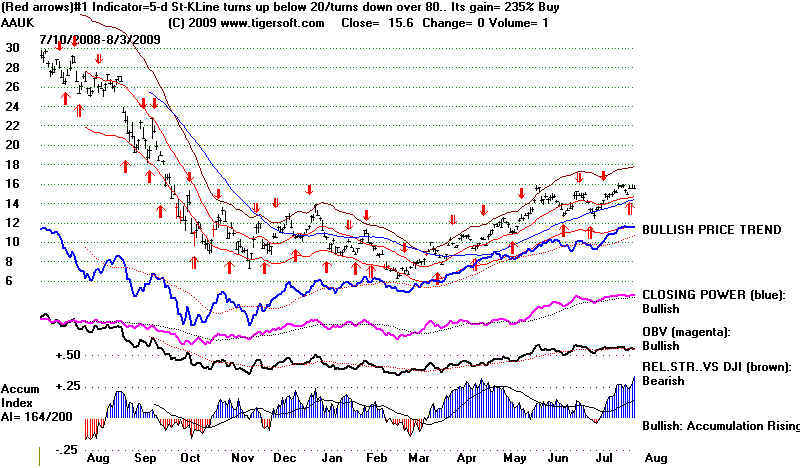
leader NEM do not. Below are some of the
stronger gold stocks' charts. AAUK, BHP and
possibly TCK look like Buys. Below is the
chart of AAUK