TigerSoft and Peerless Hotlines |
 |
6/11/2009 DJI 8739 +0.37% NASDAQ +.50% USO 38.97 +2.04% +.03% SLV -.13%
 |
Readers, our assessment
of the stock market's future trends is based on the following. Google TigerSoft and these subjects to get additional links, besides those shown below. : 1) Price charts and moving averages. 2) Peerless automatic Buys and Sells for intermediate-term trend. 3) Closing Power and Closing Power Percent for 2-4 week trends. 4) Accumulation Index to measure support on weakness or distribution on strength. 5) Volume (and OBV to a small extent) 6) Stochastics when they are the best trading system. 7) Seasonality. 8) Who's buying or selling and why. |
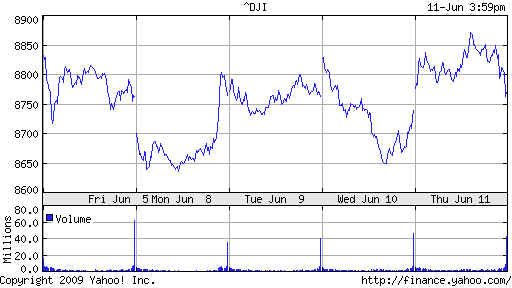
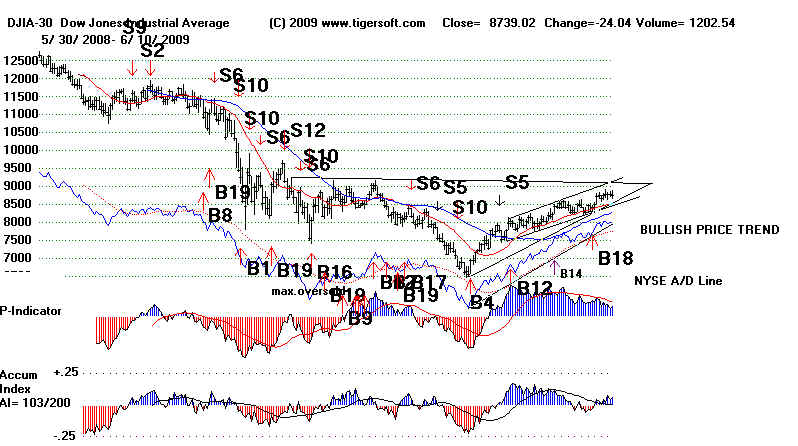
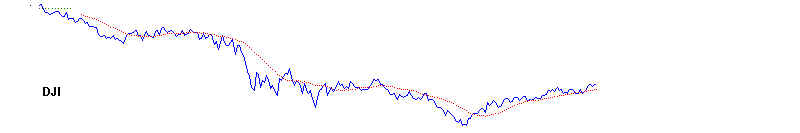
6/11/2009 The
DJI closed well off its and failed to hold its gains over 8850.
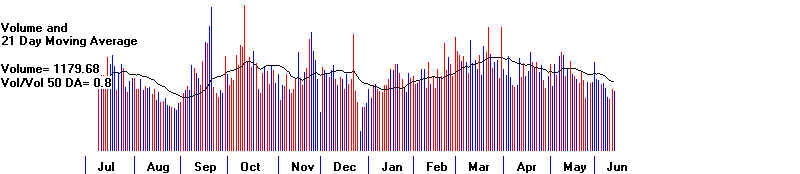
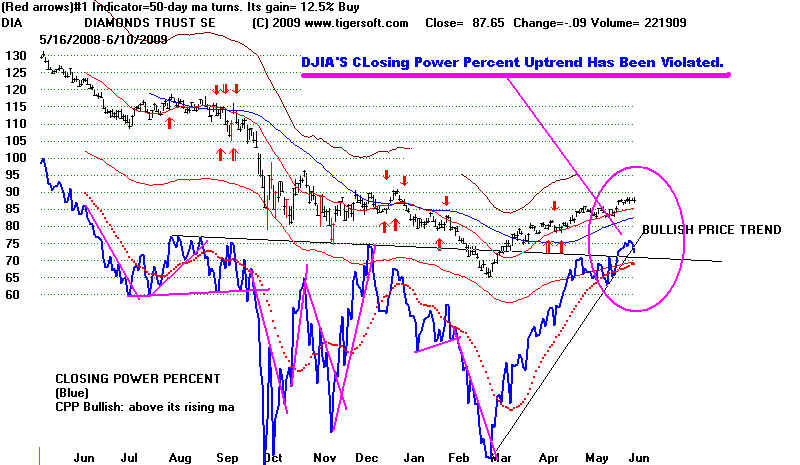
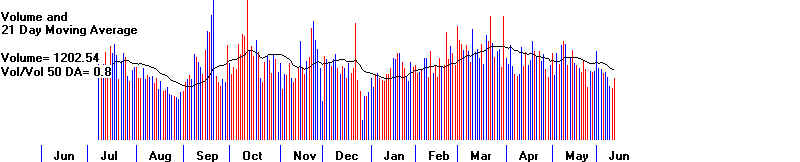
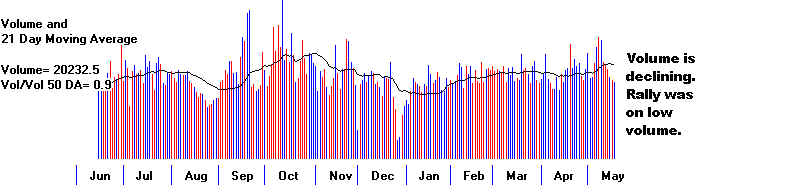
Volume remained low. Its
ETF's Closing Power Percent did break its uptrendline today.
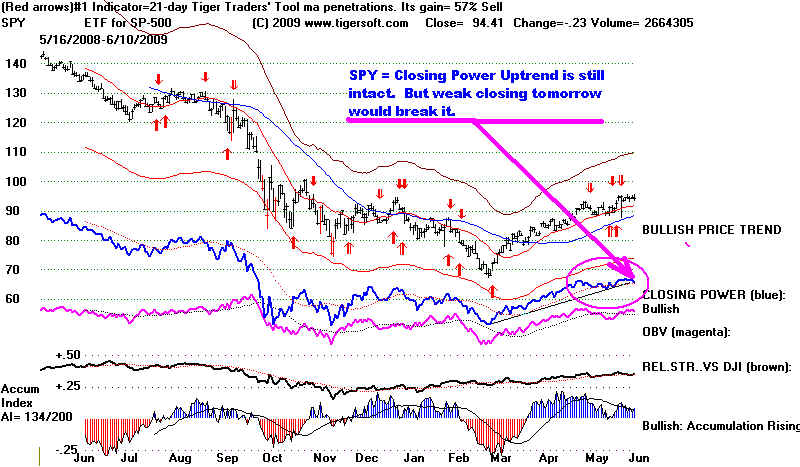
The Closing Power of the SPY could
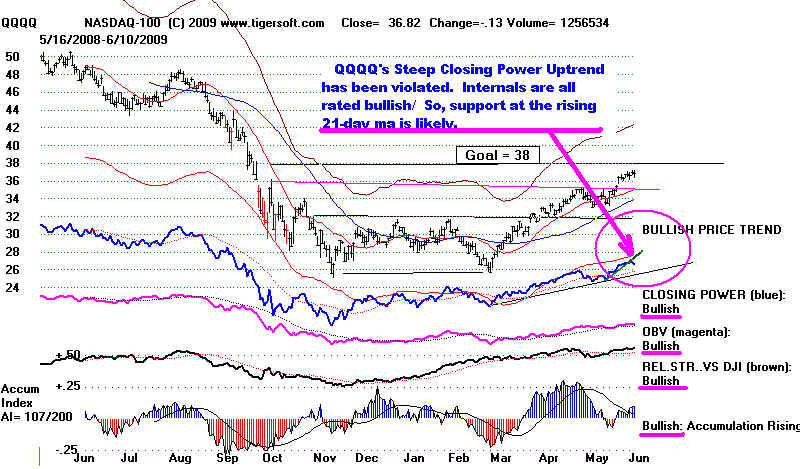
easily be broken tomorrow. Watch that. The QQQQ's
CP's steep uptrend has been
violated. But the internals suggest only a shallow retreat.
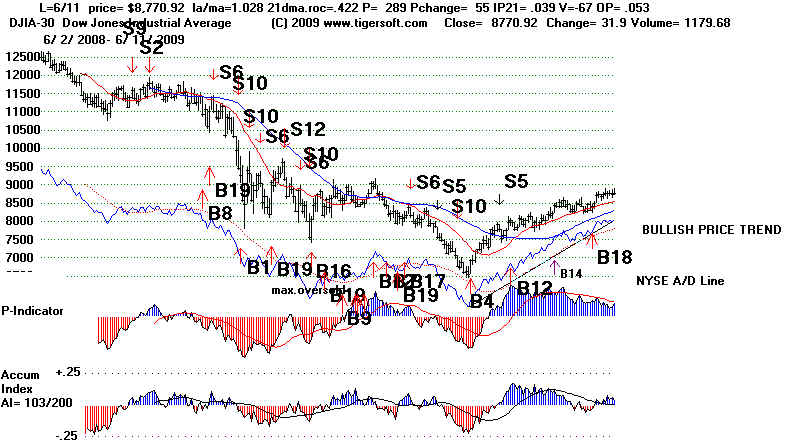
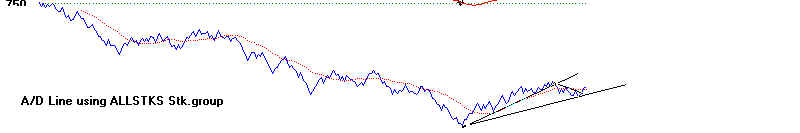
The NYSE A/D Line uptrend is still
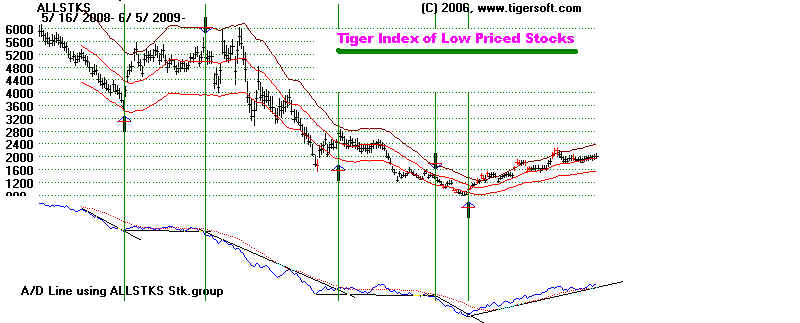
intact. This helps hold up secondary stocks. Low priced
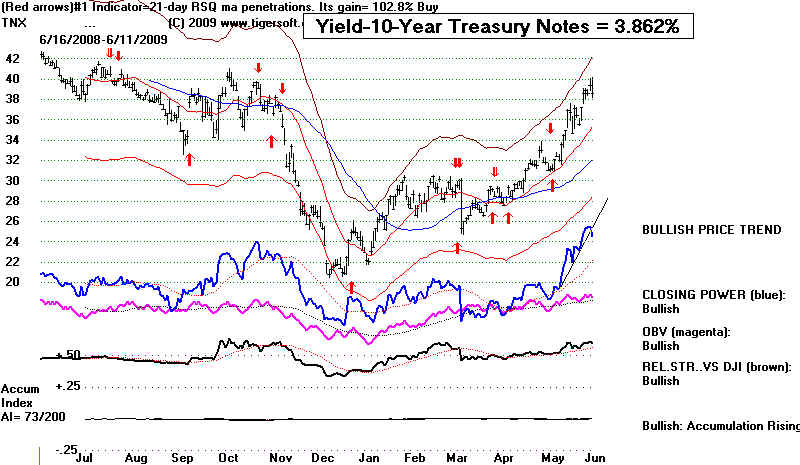
stocks rose sharply today as
Treasury Note interest rates eased. The Tiger Index of Low
Priced Stocks' ITRS shows these
stocks have out-performed the DJI by 40% over the
last month.
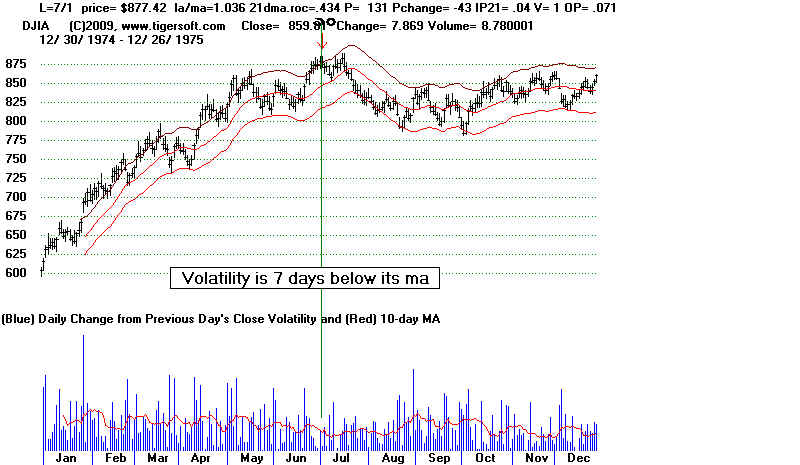
The DJIA's very low volatility
after a big rally off a bear market bottom is associated
with a decline to at least the
lower band. As the DJI's internals are weakening, I would
think a decline to 8200 is more
likely than not. Low priced stocks may ignore this decline.
Look at them individually.
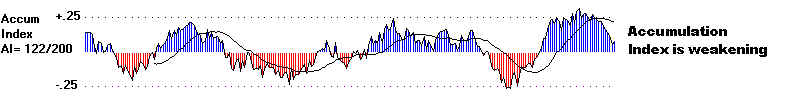
Bulging Accumulation means likely support. Don't sell
these. I have not put the new
S8 into the software yet. Consider it a minor signal
for now. I am not
recommending short sales on the DIA yet.
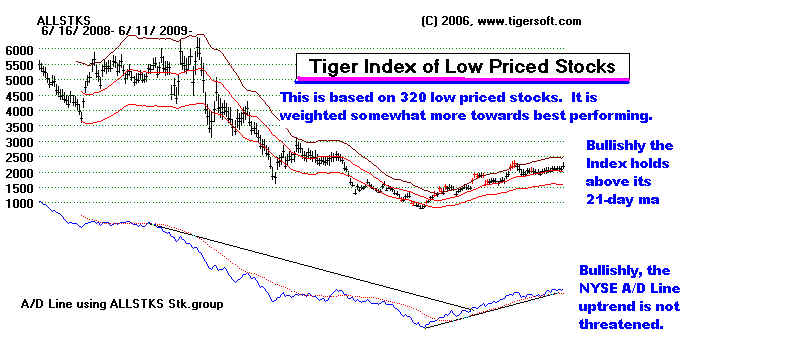
ITRS shows this index has outperformed the
DJI by 40% over last 50 days.

Key Charts: DJIA, SPY, QQQQ, DIA, Dollar, Gold, 10-Yr.Notes
6/11/09 DJIA AND SUPER-IMPOSED
PEERLESS SIGNALS STOCKS
SPY
QQQQ
DIA
US DOLLAR
10-YEAR NOTES INTEREST
RATES
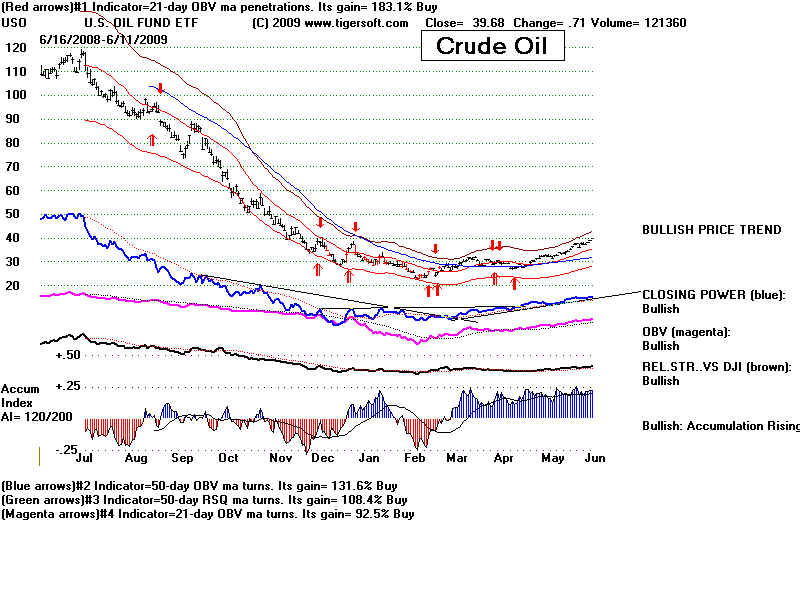
CRUDE OIL
====================================================================================
6/10/2009
Provisional New Sell S8 Based on Low Volatility on Big Rally after a
Bear Market.
The intermediate-term CLosing Powers' and the NYSE A/D Line uptrends are
still rising. But I think the
historical study of the new Peerless Sell S8 justifies profit-taking
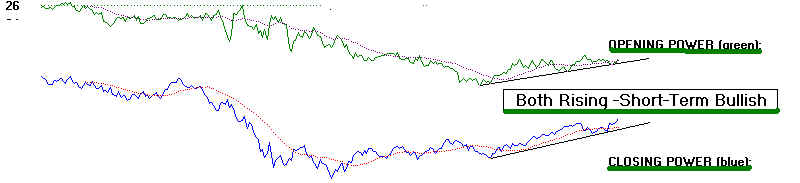
tomorrow. It's true that both the
Opening and Closing Powers are rising. That is a boost for
the bulls now. Traders may choose
to wait for a particular ETF's or stock's Closing Power
uptrend to be violated.
That's reasonable. But rather than sell when others are selling,
let's sell into the opening
tomorrow. See discussion of this signal on 6/9/2009. The exception
would be individual stocks showing very
high and rising Accumulation and Closing Power trends.
Broad weakness tomorrow would cause the
NYSE uptrend to be violated. If that takes place,
look for more selling among a broad group
of stocks for at least a few days, as the DJI
retreats probably back to its rising
50-day ma at 8275.
This S8
signal is not perfect. But in only 3 of the 11 parallel cases of S8s, did the DJI
rally
initially after this signal. These
rallies against the Sell S8s lasted only a week and ranged from
3% to 8%.
For a few hours this morning, it looked like we might be
getting a key reversal downwards,
where hey indices would open at their highs, turn down
sharply and close at their lows on higher volume.
But that was not to be, even though the interest rates on Treasury notes are rising sharply and that may
force the Fed to start raising interest rates, thereby
weakening the economic recovery. What caused
the turn-around was Obama's sudden reversal and shift to
the right (Where else? How many times have
we seen this pattern?) on the issue of the pay and bonuses
to be allowed bankers and CEOs getting
TARP billions money. Geitner, his Treasury Secretary, denounced a
$500,000 cap on such executives'
pay,
something Obama had campaigned for. That's when the market seemed to recover.
The moral
is that Wall Street holds the stock market hostage.
If Obama wants a recovery led by rising stock prices,
he's going to have to learn not to shake the boat and
threaten the power elite's privileges.
But the stock market is not out of the woods because of a 2 hour 100 point recovery.
We will
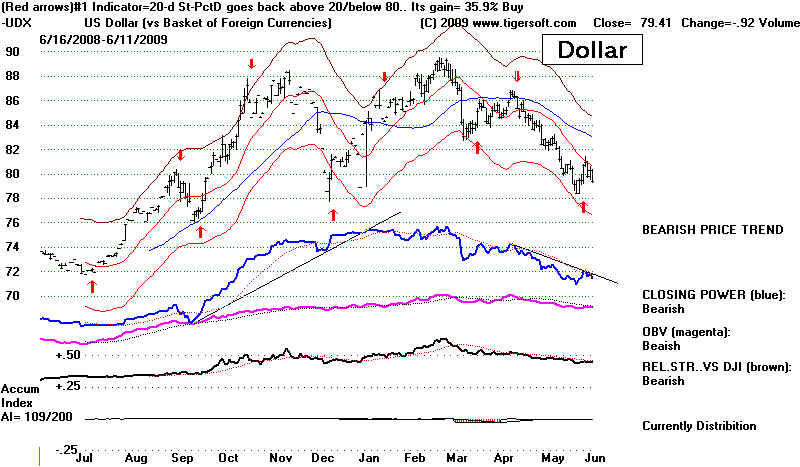
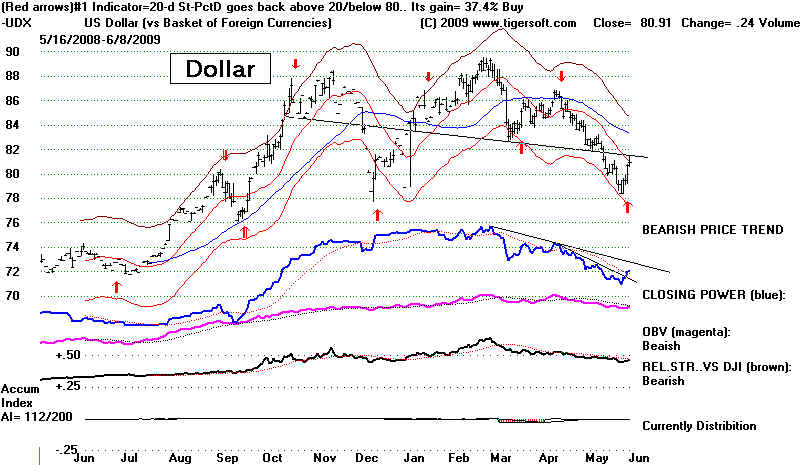
have to keep a watch on interest rates and the US Dollar.
A drop by the Dollar below 80, may get the
Fed to shift priorities towards protecting the Dollar with
higher interest rates. The alternative strategy,
Helicopter Bernanke's dropping billions on banks, is
starting to get a bad press, as it was reported that the
the Fed
lost $5.25 billion in the first quarter on just AIG and Bear Stearns. The Dollar
is still above 80.
Below that, the pressures to protect the Dollar will
probably win out, and interest rates will rise.
SELL S8 on 6/10/2009
Key Charts
6/10/09 DJIA AND SUPER-IMPOSED
PEERLESS SIGNALS STOCKS
![]()
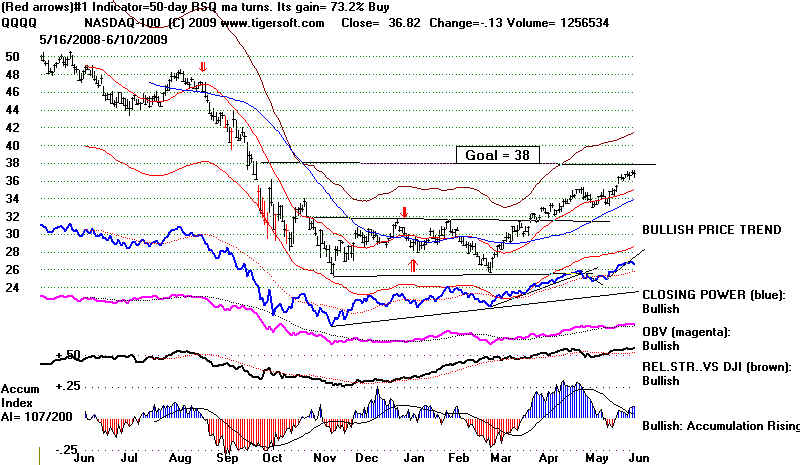
QQQQ Still shows slower Closing Power trend s
still up.
But the short-term uptrend has been violated. After a
long advance with Opening Power rising, it is usually
best for traders to abide by breaks in the steeper uptrend.
Opening Power (not shown) is rising.
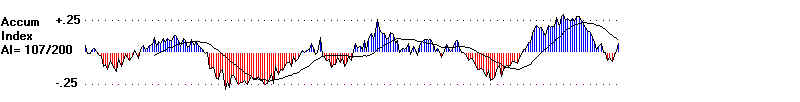
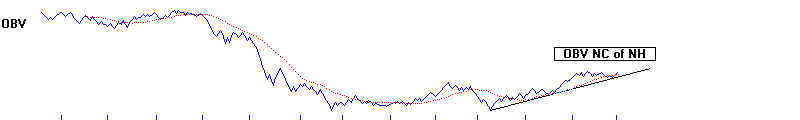
OBV, Relative Strength and the
Accumuolation Index are
rated as bullish.
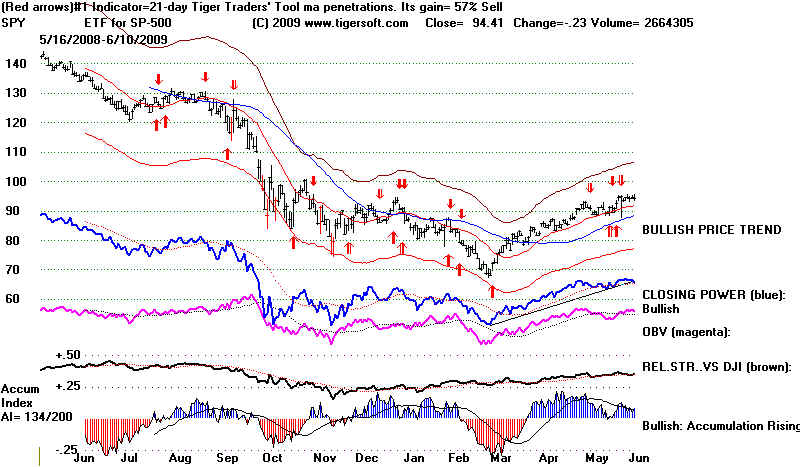
SPY
Still shows rising Closing Power trend.
But it is close to
being broken. With none of the
other indicators
considered "Bullish", a break in
Closing Power should be
considered a SELL for traders,
with the expectation
that a decline back to the
21-day and possibly the
50-day ma may ensue.
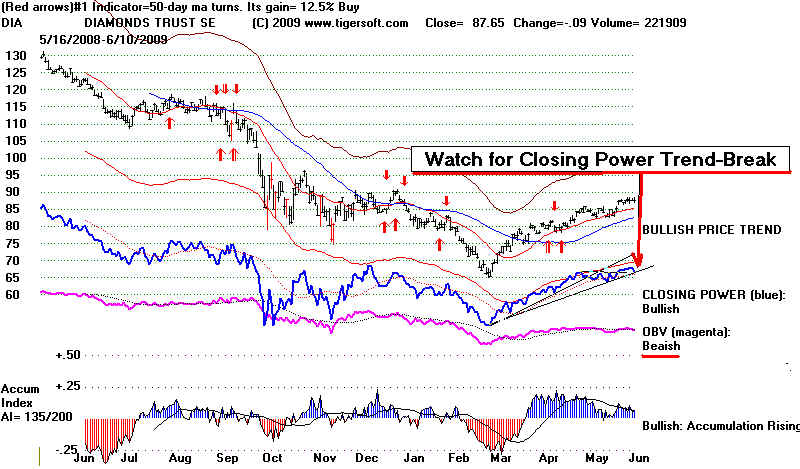
DIA Still shows rising Closing Power Percent
trend.
Opening Power is also rising (not shown).
Volatility keeps falling.
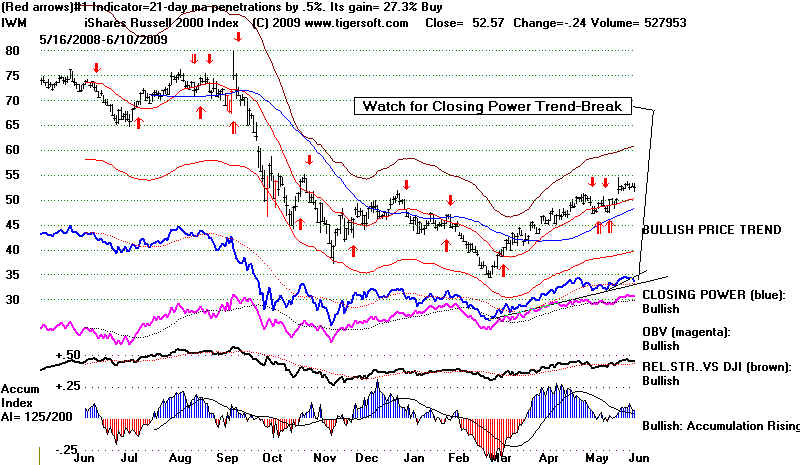
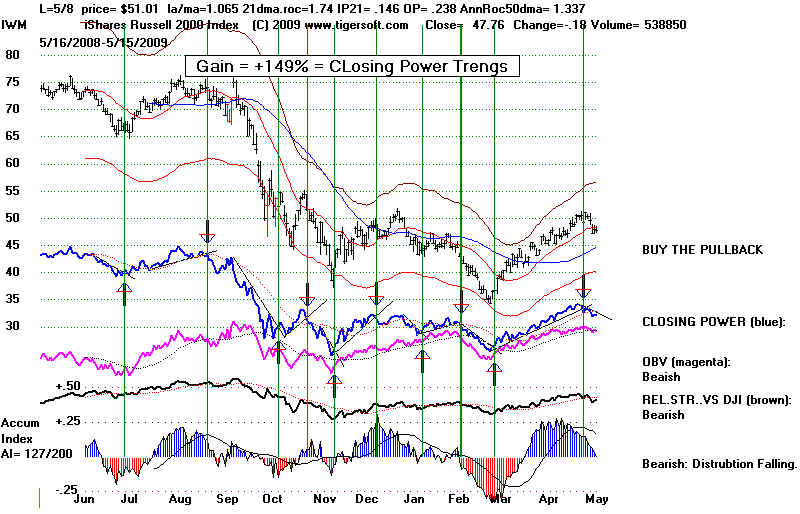
IWM - Russell-2000's steep Closing Power
uptrend has
been violated. Usually this invites a
further decline.
The longer term CLosing Power trend is still
intact,
but may be violated on further weakness.
Still on A Buy, but Such Low Volatility Is Usually Bearish.
Sell if There Are Closing Power Up-Trend-line Breaks.
6/9/2009 Have any of you noticed how prices in the stock market
sometimes pivot and
reverse after there has been a day of two of very little change in closing prices? The
October 1987 peak showed the DJI closing at 2639.20 on 10/1, 2640.99 on 10/2 and 2640.17
on 10.5.
From this point the DJI then declined all the way to 1738.74 on 10/19/74. Compare
this
with the DJI's closing of 8763,13, 8764,49 and 8762.06 on 6/5, 6/8 and 6/9, 2009,
We have no new Peerless Sell signals and the Closing Powers are still rising,
as is the NYSE A/D Line. But volatility has become dangerously low. This is
like taking
a walk on a high diving board. Or, mixing metaphors, we have reached a point in the
advance
where the cannon ball is no longer rising. Gravity then takes over. Traders
will start to
take profits The Accumulation Index is not high enough at .047 to give us much hope
that
there will be buyers just beneath the market. Obama
says he will impose limits on bankers'
salaries
and bonuses. I would think Wall Street will cry like a baby about this and try
to
force him to withdraw such proposals by showing him how stock prices can be dropped
quickly
if he become too much a populist. June is not a good month seasonally. So,
while the
market may go a little higher, and reach the 38 objective for the QQQQ and 9000 for
the DJI, be prepared to sell if the CLosing Power uptrends or the NYSE A/D Line uptrend
is violated. As you can see from the research I did tonight, a low volatility
"S8" probably
should be added to the Peerless arsenal. The main reason for not doing do is how
good the
breadth has been. I think selling half of our long positions tomorrow is reasonable
if
the CLosing Power uptrend-lines are violated. even if the existing Peerless system has not
yet given a Sell.
Click on some these charts to get an idea of how a new low volatility Sell signal has
worked:
1932, 1933, 1935-1936, 1939, 1945-1946 and 1975
Low Volatility Sell Signal after Recovery Rally from 1973-1974 Bear Market.
================= 1975 ==================
Sell S8
|
NEW SELL SIGNAL - Sell "S8" (That is its tentative name for now.) It is based on unusually low volatility after a 3-month rally of more than 10% by the DJIA, provided that index is not in all-time high territory where the path of least resistance is up. The rate of daily change in closing prices must have stayed under its 10-day ma for 6 straight days. This signal seems to work particularly well after there has been a substantial jump up from a bear market low. There have been 11 such earlier cases when the DJI was not in all-time high territory. In 8 cases the DJI fell more than 8%. There were only 2 cases where the paper loss was this big. Here are the cases since 1928 when the DJI was not in all-time high territory. DATE What DJI did subsequently Key values: last/21-dma, OBVPct., IP21 (Current AI), annualized rate of change of 21-dma (1) 8/30/1932 DJI moved up for a week from 74.30 to 80 and then fell to 58 in 2 months Key values: la/ma = 1.098 OBVPct= .246 ip21=.01 roc=3.46 This was on a recovery from a bear market low. 8% paper loss before a profit. More than 20% decline. (2) 9/29/1932 DJI fell from 71.50 to 59 in 2 weeks. Key values: la/ma =.988 OBVPct=-.107 ip21=-.069 roc=.46 This was just after a recovery from a bear market low. More than 15% decline. (3) 10/31/1932 DJI fell from 61.90 to 58 in a week, rallied to 67 and then fell steadily to 50 4 months later.. Key values: la/ma =. .97 OBVPct= -.087 ip21=-.139 roc=1.779 This was just after a recovery from a bear market low. 8% paper loss before a big profit. More than an 18% decline. (4) 7/14/1933 DJI rose from 105 to 109 in 3 days and then fell to 89 a week later. Key values: la/ma = 1.059 OBVPct= .17 ip21=-.103 roc=1.316 This was on a recovery from a bear market low. 4% paper loss before a profit. More than 15% decline. (5) 9/17/1935 DJI fell from 133.10 to 128 in a week and two mo later hit 148. Key values: la/ma = 1.027 OBVPct= .316 ip21=.04 roc=506 Only 3% profit before rally. (6) 3/25/1936 DJI rose from 157.90 to 162 in a week and fell, a month later hit to 143 Key values: la/ma = 1.017 OBVPct= .221 ip21=.016 roc=.546| 3% paper loss before a profit. More than 8% decline. (7) 7/31/1939 DJI fell from 143.30 to 131 in 3 weeks and then rallied to 156 2 weeks later. Key values: la/ma = 1.03 OBVPct= .328 ip=21.099 roc=1.03 This was on a recovery from a bear market low. More than 8% decline. (8) 9/27/1939 DJI from 150 went sidewise for 7 months and then fell to 114. Key values: la/ma = 1.028 OBVPct= .27 ip21=.068 roc=1.479 More than 22% decline. (9) 2/25/1946 DJI fell from 206.60 to 186 in 2 weeks and 5 weeks after that. rose to 208 Key values: la/ma = 1.024 OBVPct= .43 ip21=.268 roc=.877 More than 9% decline. (10) 10/25/1950 DJI fell from 231.50 to LB at 221 in 8 trading days and two weeks later hit 236. Key values: la/ma = 1.011 OBVPct= .286 ip21=.049 roc=.281 More than 5% decline. (11) 7/1/1975 DJI fell from 877.42 to 784, 10 weeks later. Key values: la/ma = 1.036 OBVPct= .01 ip21=.04 roc=.434 This marked the recovery high after the 73-74 bear market for 6 months. More than 9% decline. (12) 6/9/2009 Key values: la/ma=1.03 OBVpct= .059 ip21=.047 roc=.264 |
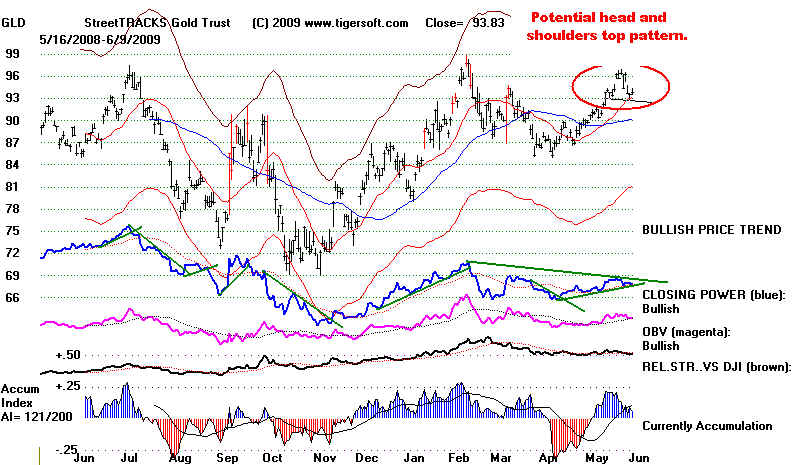
Why does Gold show a head and shoulders' pattern? Is the FED going to
raise interest rates? Is the US going to sell some of its gold?
==================================================================================
6/8/2009
Peerless remains on a Buy and the internal strength indicators that we keep mentioning are
all still rising for the QQQQ, SPY, DIA and IWM. Volume and volatility are very low.
Have Buyers run out of gas? Or federal TARP money? Not so much, that they cannot bid
prices up off today's lows in the last hour. Sure, this is probably program trading,
But what
do these program traders know that the skeptical public does not? The rise in
interest rates
without weakness in the US Dollar or the stock market, I think,
bullishly suggests growing business
confidence and investment demand for capital is rising and
the FED has not yet communicated its
intentions to raise rates to its investment banking collaborators. So, we look for
stock higher prices,
but would be quick to take profits on a Peerless Sell or a break in the A/D Line or
Closing Power uptrend-lines. A DJI move above 9000 would get headlines and public
attention. That could be the cover under which the buyers for the last 2000 points
in the
DJIA take profits as better economic news is announced by an Administration eager to score
political points to maintain momentum for its political agenda before the Summer.
The number of Fidelity Select funds out of 42 that are up for the last 21-trading days has
stayed steady between 35 and 38. That's another sign of remarkable breadth since the
market has been rising now for three months.
We do become more cautious if we watch the Closing Powers of banks stocks:
BAC - quite bearish, except for
it being above its rising 50-day ma.
Short sellers are being run, it seems.
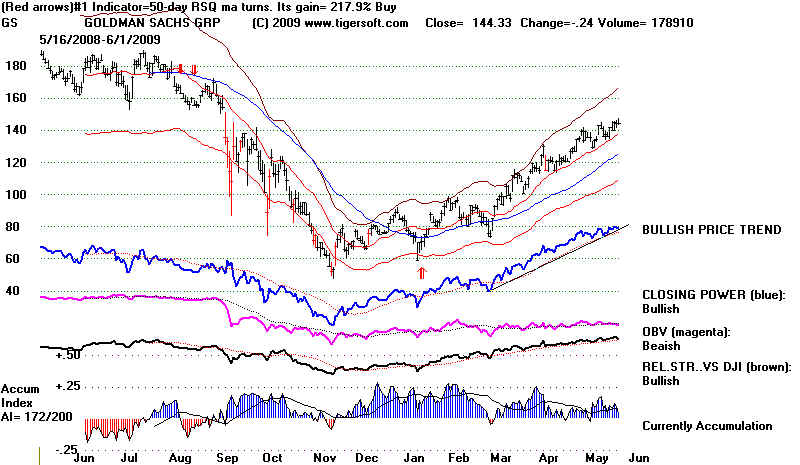
GS - Bearish rising wedge pattern, negative Accumulation but still rising CLosing Power
and 50-day ma
JPM - quite bearish, except for
it being above its rising 50-day ma.
WFC - neutral Closing Power and bullish Accumulation.
but the highest priced DJI stock and volatile tech stocks appear to be in firm uptrends::
IBM, AAPL, AMZN GOOG, RIMM - bullish internals and
rising CLosing Powers
and the volatile foreign ETFs that the Peerless Buys and Sells trade so well are mostly
in confirmed uptrends.
Russia - Bullish internals, but
Closing Power is sitting on its uptrend.
India - Negative Accumulation and
steep Closing Power uptrend has been violated.
Brazil - Bullish Relative Strength but CLosing Power is sitting on its uptrend.
Mexico - Closing Power has broken uptrend.
====================================================================================
6/5/2009
We have no Peerless Sell signal yet. Breadth will need to deteriorate more for a
Sell on
strength or for the NYSE A/D Line uptrend to be broken The Accumulation Index will
need
to drop below 0 to match its levels at the peaks in the DJI recovery-peaks in 1932, 1933
and 1938. It now stands at .023 with the DJI 3.4% over the 21-day ma. The
Closing Power
will need to break its uptrend to bring a short-term decline. It's true that
seasonality is now
bearish. But this is not a normal market. Breadth has been outstanding since
the March 9th
bottom. Look below for studies of this. Breadth has been bullish well beyond
past precedent.
Such good breadth trumps the low volume. The consequence is that we are seeing a
stealthy,
under-publicized bull market in lower priced stocks. I would say that this means
that Wall
Street is not yet inviting the public back to the party to buy the stocks they have bought
very cheaply, after scaring the public to justify their lavish government handouts.
Realize
that one out of every 100 stocks traded in the US is up 400% or more. Read the Blog
I wrote
this weekend:
The
Great 2009 Bull Market. Why Is Wall Street Concealing
The Huge
Surges in Low Priced Stocks?
The A/D Line of the 350 low priced stocks (#14
lowprice on Tiger Data page) is still uptrending.
When that line is violated, we can start to worry as investors in these stocks.
So, the DJI continues to trend up. An objective of 9000
still seems reasonable. That's where
the next well-tested, horizontal resistance level is. We can get such objectives by
measuring
the height of recent trading ranges have been and adding their heights to subsequent
breakouts. The DJI recently broke above its trading range, 8200-8600. Adding
that pattern's
height yields a target of 9000. If you carefully study charts from 1932, 1933, 1938,
1974-1975,
you will see this pattern in the advances off the bottoms as the tops are reached.
Another
element in 3 of 4 of these cases is that right before the top, there are 6 or 7 days of
declining
volatility, where we use our Peerless/TigerSoft measure of the daily change. As you
can
see from DJI chart above, we have seen only 4 such days most recently.
==================================================================================
6/4/2009 The DJI is apt to back and fill at the 200-day
ma resistance now reached. Volume is just
too modest to offer much hope of a powerful new surge. 9000 still seems a good
target. Big
money accumulation has subsided significantly, if we judge this from the
Accumulation Index
on the DJI, NASDAQ or the major market ETFs. And that is not all. We
have now entered a
period when seasonality starts to be bearish both on a short-term and an intermediate-term
basis,
for all periods after this date since 1965 and for Junes in the years after a Presidential
Election
since 1917. These statistics are shown near the bottom of this page.
Fortunately, we still show
the last Peerless signal to be a Buy. The Closing Powers are all still rising.
So, is the NYSE A/D
Line. Hesitation and churning by the DJI as it approaches 9000 seems very likely.
HOW WILL WE SPOT THE TOP TO THIS RALLY?
How might we expect to spot the signs of a top to this
rally? Let's look to the big rallies
off
the bottoms in the 1930's extreme bear markets. The DJIA rallied very strongly
off
the bear market low in July 1932 and peaked after almost doubling its value at its low.
It
did surpass its declining (green) 200-day ma at 70 after a hesitation and rose 13% more.
The
top took place on high volume churning with little price movement just below 80.
There
was
an Sell S12 and an S2 from the regular Peerless just before the market started declining.
The
Accumulation Index had turned negative (-.05) with the DJI closing at the 5.4% upper band.
The
next day the NYSE A/D Line uptrend was broken. Consider the second extreme 1930s
bear
market. The market peaked in July 1938, after the severe 1937-1938 (48% down)
bear
market, in a similar way. The DJI rallied 13% above the 200-day ma and peaked with a
Peerless
Sell
S12 at the top and then a break in the NYSE A/D Line uptrend. By comparison
now, the DJI
has
closed at the 200-day ma, and 3.3% above the 21-day ma and sports a +.046 reading
from
the
Accumulation Index. If the 1932 and 1938 experiences repeat here the DJI will go 13%
higher and reach 9800. The biggest difference is noteworthy. Then, volume was
very high on the
rally. That's why I think it will harder for the DJI to get much past 9000.
1932 DJI - How July-August Rally Ended

1938 DJI - How July-August Rally Ended
7/27/1938 S12 - la/ma=1.014
P-88 Accum. Index = -.009
V=131 Opct =-.011

SPECULATION IN "CATS AND DOGS" EVENTUALLY IS BEARISH.
Gaudy speculative advances usually are warnings. That was as true in 2008 (big
advances in low priced energy stocks) as it was in 1968 or 2000 with stock having a
tech sonding name. But for the time being, we are enjoying the advance, which may
well continue until the FED starts raising interest rates.
Until then, the gaudy recovery gains in many NASDAQ-100 and smaller stocks
will probably continue. This deprives investment capital from big DJI-30 stocks.
Note that
Democrats historically have tended to favor smaller technology stocks and low-priced
stocks.'
Their bull markets are too infrequent and afford way too much opportunity to now ignore.
With low priced stocks, look for high accumulation bulges, strong closing powers and OBV
and
Relative Strength confirmed break outs on very high volume. A stock with a story
usually has
mor eupside potential. Check the story by searching the message boards of the stock
in question.
Generally, picking stocks like this work out well if we hold wuntil the stock's 50-day ma
is violated.
That is the main theme in my Explosive
Stocks book. But you have to diversify to be safe. There
are always unpleasant surprises, even for insiders, as when a Florida judge
suddenly says you must
turn over to
Spain all the gold you have recovered after years of research and underwater
exploration
from the wreck of a sunken 17th century Spanish gallion in internatinal waters.
Links - Explosive
Super Stocks now.
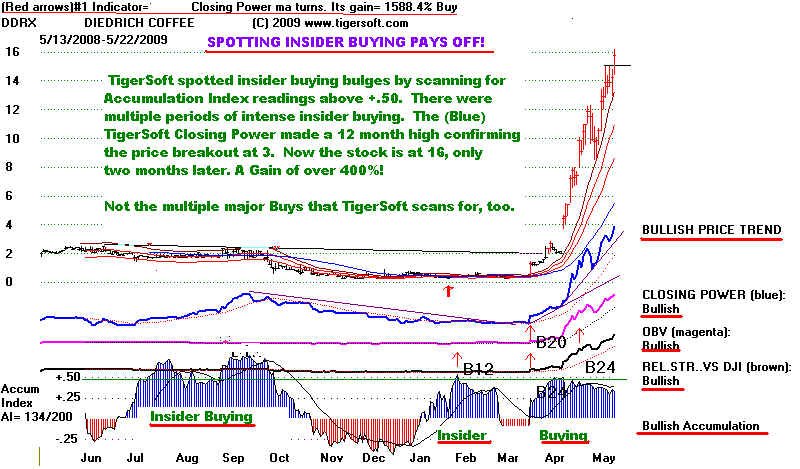
The importance of a strong Closing Power and bulging Accumulation can be seen in
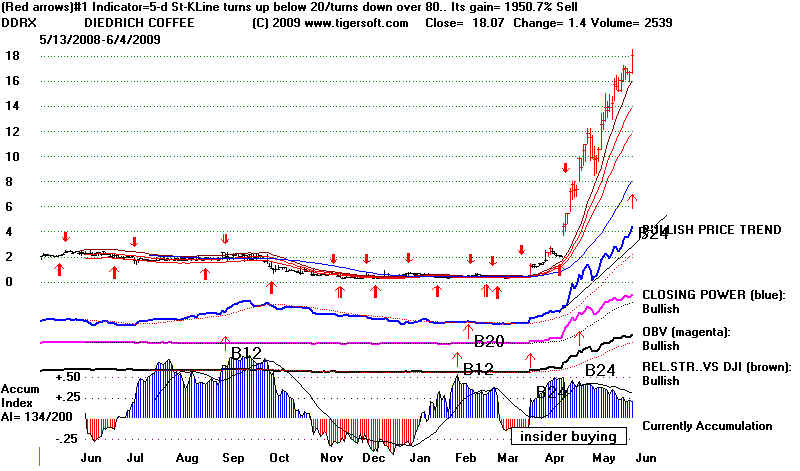
many stocks making new highs today. Here are some examples: ARQL, ATRI, CLRT, DDRX (wow),
SHOR, SYMM
and VITA. By this reckoning, stocks whose
Closing Power is making new
12-month highs will soon be making 12-month price new highs. We can see
if this is true
by watching these NASDAQ-100 components.
Stocks
Price Now
12-month Price High
---------------------------------------------------------------------------------
AMZN
85.68
92.04
BIIB
53.43
73.45
FISV
44.68
54.68
GENZ
62.44
84.00
ORCL
20.34
34.62
People ask me if they should trade stocks, where the gains can be extraordinary,
or
major market ETFs. I think it's best to show trading skills and emotional
self-control
trading ETFs before one gets into stocks, where the volatility can be very challenging
and
where one should probably have 7 or 8 stocks at a time, for money management safety.
To
use Obama's favorite phrase, "that beong said" here are many key stock charts:
.
FINANCE STOCKS: GS, MS, V, MA
QQQQ - LEADING TECH STOCKS: AAPL, ADBE, QCOM, EBAY, RIMM
High Accumulation helps, too: EXPE and CTXS
GOLD, SILVER, USO, DOLLAR, 10-year Notes
and strong commodity - COCOA
SPY, DIA
=======================================================
6/3/2998
The DJI fell back from the 200-day ma resistance. But we still show the last
Peerless
signal to be a Buy. The Closing Power is still rising for all the key ETFs.
And, as important,
the NYSE A/D Line uptrend has not been violated. The weakening volume internals are
warnings
sufficient to adopt a wait and see approach, but not sufficient to sell.
The picture is mixed. Don't blame the messenger for this. Users of our
software will have to decide how they want to use all the main tools we emphasize.
What is important to see is this: The three best systems each work well in producing
Buys and Sells, even though they give somewhat different signals from time to time.
The point is that you can profitably Buy and Sell the major market ETFs using any
of these 4 tools and approaches:
1) The Peerless signals ( Peerless Signals ),
2) The Closing Power trend-breaks ( http://tigersoft.com/--1--/index.html
),
3) The NYSE A/D Line trend breaks,
4) Confirmed
Cross-overs of the 50-day ma. using the Accum Index.
If you are shell-shocked from last year's plunge, you could
apportion money in 3
parcels, using each system at this time. If you are not long, then wait to Buy. The
DJI has reached a point of resistance and volume still is too low to think that the market
will run away to the upside. You could also only take positions when all 3 systems
are
on Buys and wait for all systems to give Sells. That will be less profitable.
But it's
safer. The trend is our friend. Using confirmed cross-overs of the 50-day ma
works
very well over a year's time, though there can be whip-saws in the short-run. See
the
materials I have recently put on www.tigersoft.com
I try regularly to see if we can derive useful trading rules by
looking at the current
key
values and any statistics that stand out.and may prove to be salient when back-tested to
1928.
Tonight, I checked to see if the DJI's CCI indicator (Commodity Channel Index) falling
below
200 with comparable key values, negative Accumulation Index and negative OBV- Pct
but
positive breadth (P-Indicator) showed a pattern historically in what followed. Some
days
we
learn something useful. Today, the results are
ambivalent and inconclusive when
we use the data from 1928-1942 for study. The CCI's dropping
below 200 (oversold) is
not a
reliable Sell with key values like those shown today.
The key values we can generate easily for any day of data are a big part of how
Peerless was built and back-tested. The key indicators and today's key values
are
shown by putting a vertical line on a DJI chart. Here they are tonight:
LA/MA (DJI close divided by 21-day ma of daily closes)
1.027 (near upper band)
ROC (Annualized rate of change of the 21-day ma) .351 (moderate rise)
P-I (21-day ma of NYSE Advances/Declines) 221 (Moderately high)
IP21 (Current Accumulation Index) .008 (low compared to LA/MA)
V (21-day ma of Adj. Up Volume-Down Volume) -96 (bearish relative to LA/MA)
OBVPct -.018 (bearish relative to LA/MA)
We watch Gold,
Silver, Crude Oil and
the Dollar. A weakening Dollar puts pressure on
the Fed to raise
interest rates and brings back commodity inflation, something which
badly eats away
at consumer buying power. Watch the CLosing Power trends here.
They are still
rising for Gold, Silver and Crude Oil.
================================================================================
6/2/2009 The DJI has rallied and reached the twin resistance of
its inverted head and
shoulder
pattern's neckline and its 200-day ma. The financial stocks could bring the
DJI down
again. The weakest ones do look vulnerable: C, BAC amd JAM. Others
like GS and MS still have Closing
Power uptrends. The Advance-Decline Line for the
financial
stock is still in a weak uptrend. AXP. MA and V are neutral in that they show
conflicting internals after big rallies. .
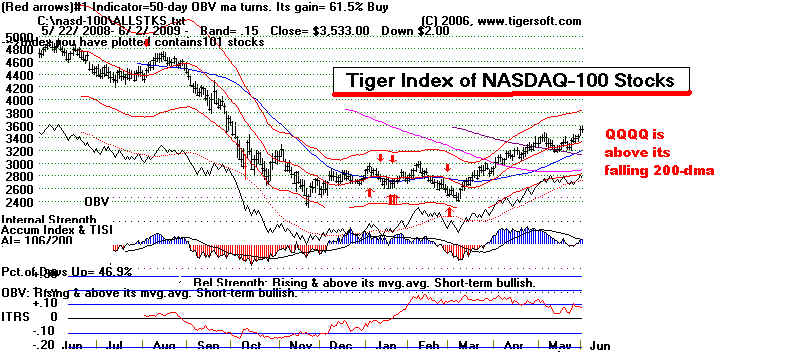
Much more bullish are other sectors of the market, name the NASDAQ-100,
low
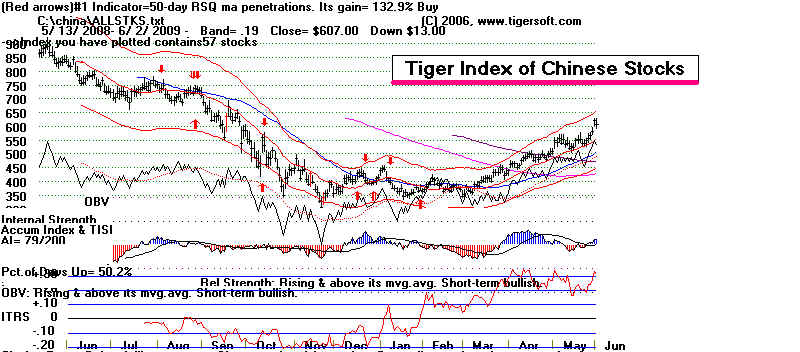
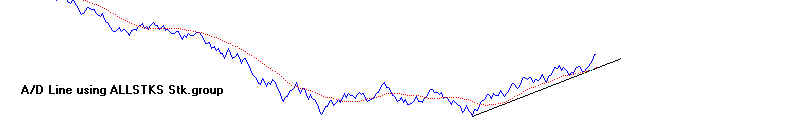
priced stocks, Chinese Stocks and foreign ETFs generally. The Tiger Index of these
groups shows much they are much stronger than the finance-stock laden DJI. Their
Advance-Decline Lines are in very steep uptrends. It would be difficult to stop so
much
upward momentum. See these charts below. And, of course, the DJI now has
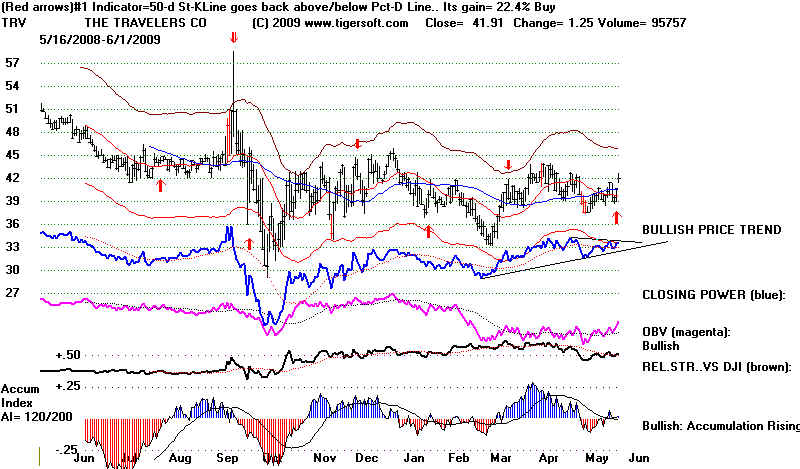
two
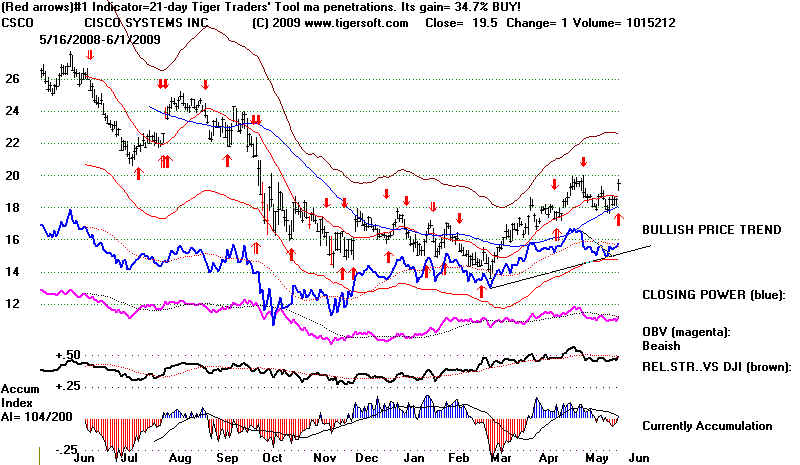
stronger looking stocks, TRV and CSCO.
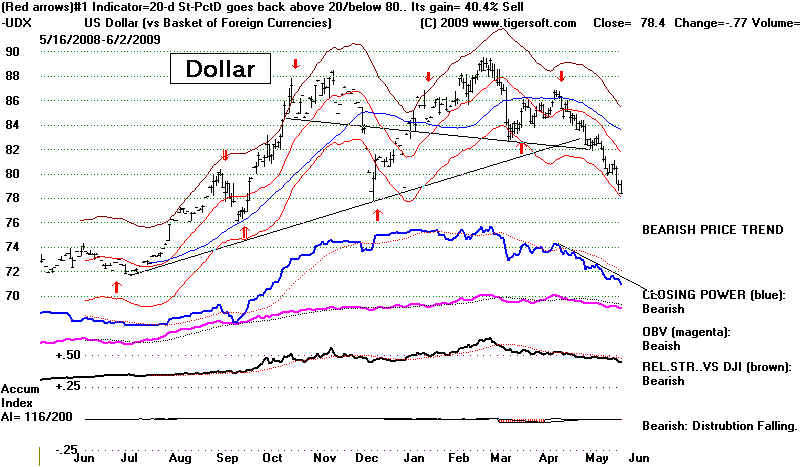
The biggest problem I can foresee comes from the possibility of a much weaker
Dollar than the Fed can tolerate. Extreme weakness would almost certainly cause
them to raise interest rates to attract foreing investors into Treasury instruments.
Chinese students are said to have laughed loudly and heartily when Geithner told them
that their country's investments in Treasuries were safe because the Obama administration
favored a strong Dollar.
TIGER INDEX OF NASDAQ-100 STOCKS

TIGER INDEX OF FOREIGN ETFS


TIGER INDEX OF CHINESE STOCKS
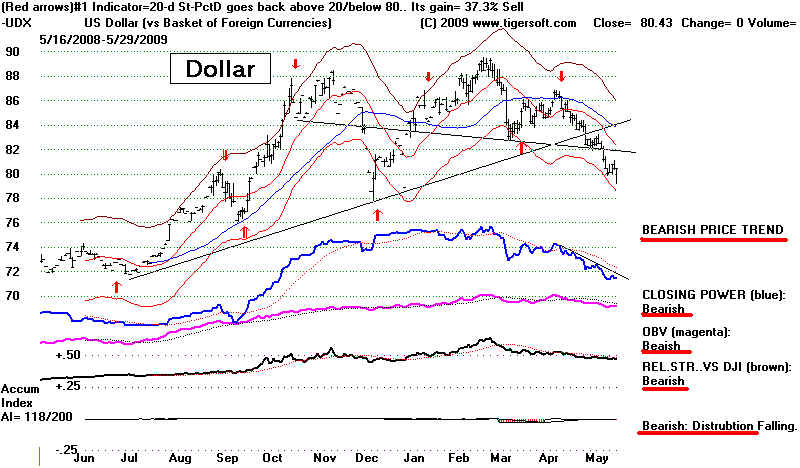
US DOLLAR IS BELOW $80.
FINANCE STOCKS AT FALLING 200-Day MA.
=======================================================
6/1/2009 Peerless Still on Bullish Buys.
The markets rose strongly today, despite the GM bankruptcy. The addition of
Travelers and Cisco to replace CitiGroup and General Motors in the DJI produces an
artificial and temporary surge in these stocks, as they are added to funds matching the
DJI-30.
The DJI has now reached its declining 200-day ma. That is usually resistance on the
first
tagging. Seasonality turns bearish after 3 more trading days. So, a pullback
would not be
surprising. But there is apt to be more strength first. The Closing Power
Lines for all the ETFs
are rising. So are the Opening Powers. That is a bullish short-term
combination, even when
volume is light, as now. I think it is reasonable to look for the DJI to reach 9000
on this move
and for the QQQQ to reach 38.
Many low priced priced stocks are enjoying a powerful advances. Breadth (NYSE
advances minus declines) is more than uptrending. It is uptrending in a way that is
unprecedented
The steadily very positive P-Indicator readings are much stronger than anything seen in
the
1930s. The economic woes of Main Street are not holding Wall Street back.
Bull
markets often start even when unemployment is very high.
|
Unemployment
Did Not Start Declining Significantly until Almost A Year after The Stock Market Turned up Sharply in August 1982. Expect More Bad Economics News But Don't Expect The Stock Market To Decline Much in It. Official Rate of Unemployment 1981-04-01 7.2
1981-05-01 7.5
1981-06-01 7.5
1981-07-01 7.2
1981-08-01 7.4
1981-09-01 7.6
1981-10-01 7.9
1981-11-01 8.3
1981-12-01 8.5
1982-01-01 8.6
1982-02-01 8.9
1982-03-01 9.0
1982-04-01 9.3
1982-05-01 9.4
1982-06-01 9.6
1982-07-01 9.8
1982-08-01 9.8 Stock Market Bottom and Powerful Rally
Fed Starts to lower interest rates.
7/20/1982 3rd Rate Cut 11.5% Bullish drop in Discount Rate after decline.
8/2/1982 11.00% Market explodes upwards
8/16/1982 10.5%
8/27/1982 10.0%
1982-09-01 10.1
1982-10-01 10.4
1982-11-01 10.8
1982-12-01 10.8 Peak
1983-01-01 10.4
1983-02-01 10.4
1983-03-01 10.3
1983-04-01 10.2
1983-05-01 10.1
1983-06-01 10.1
1983-07-01 9.4
1983-08-01 9.5
1983-09-01 9.2
1983-10-01 8.8
1983-11-01 8.5
1983-12-01 8.3
1984-01-01 8.0
(Source - http://research.stlouisfed.org/fred2/data/UNRATE.txt )
|
6/1/2009
---------------------------------------------------- QQQQ
---------------------------------------------------------
38 is price target based on width of previous base, 26-32, and adding the
difference to the
point of breakout. The internal strength readings now offer agreement to the idea
that
the upside potential in the QQQQ is only modestly higher, under 10% higher.
Most important indicators:
Closing Power Percent: Still Bullish as new
price confirmed by CPP new high.
Relative Strength Quotient did not confirm
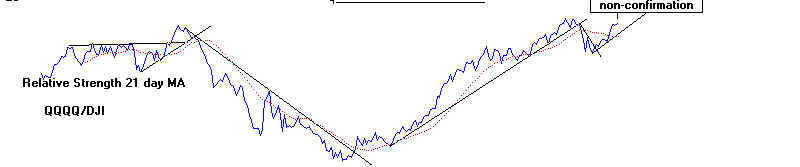
NH Still uptrending.
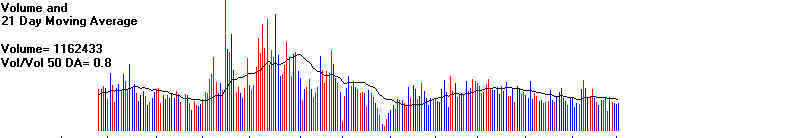
Volume did not confirm price breakout.
Opening and Closing Power - Both bullishly rising.
Accumulation Index - positive
but below its falling 21-day ma.
OBV (On Balance Volume) - uptrending but did
not confirm price breakout.
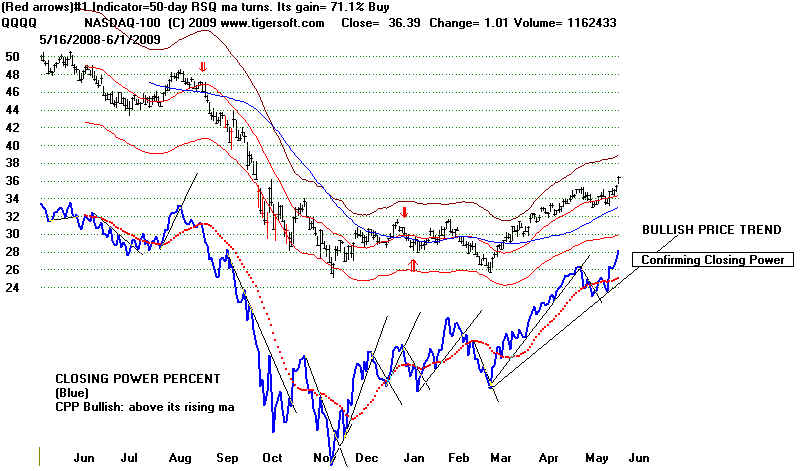
NH not confirmed by
Relative Strength Quotient
Travelers - TRV now in the
DJI-30
CISCO - CSCO now in the DJI-30
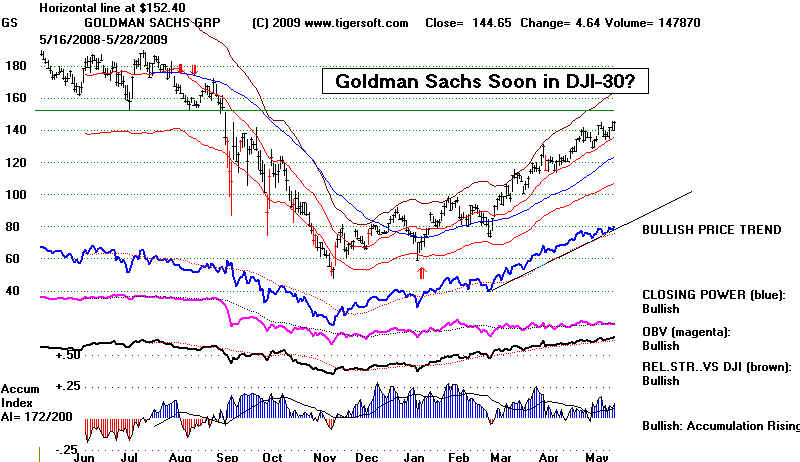
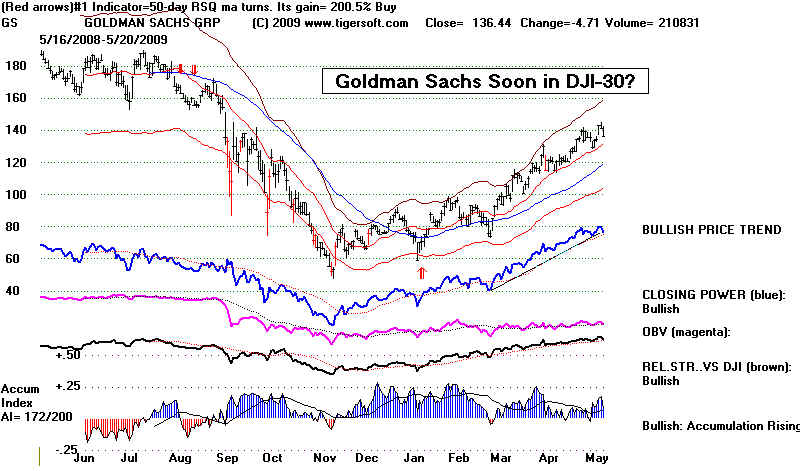
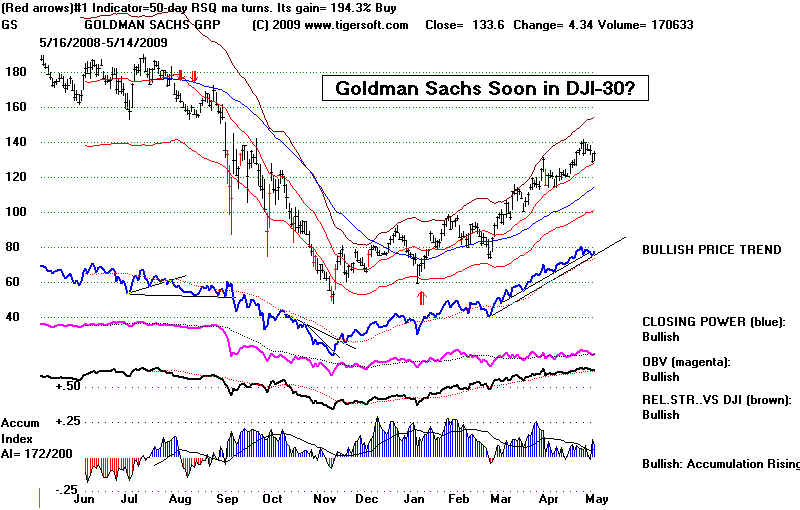
GOLDMAN SACHS - The most bullish of the big Wall Street firms still
shows a confirmed uptrend.
=====================================================================================
5/30/2009
Peerless is still on a Buy. The Dollar is
at important psychological support, 80.
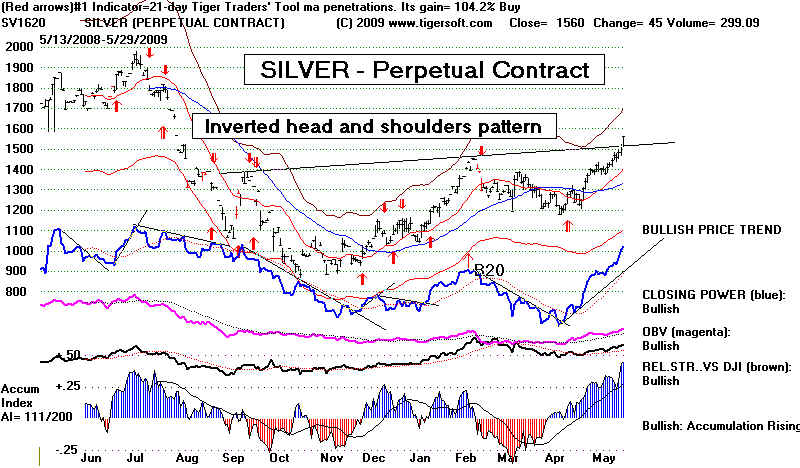
Gold and especially
silver stocks are rising. The ETFs' Closing Powers are still uptrending. The
QQQQ's
relative strength is
bullish, suggesting speculators have confidence that prices will continue to rise.
The breadth has been
especially positive. See comments in previous hotlines. This is a
characteristic
of new markets.
The recent B18 never occurred using the data for the bleak 1930s and frequently
was seen two months
into a new bull market. We have been concerned about the low volume.
Friday the NYSE volume
rose quite auspiciously. The declining 200 day ma at 9000 seems a good
target for this move.
SILVER - PERPETUAL CONTRACT
COMPLETED INVERTED HEAD AND SHOULDERS PATTERN
QQQQ - STRONG CLOSING POWER
Price Objective 38-39

====================================================================================
5/28/2009 Today brought another bounce in
the narrow trading range that the DJI has been stuck
in for a month. Volume did not expand. That is what is needed. But the
day brought a Buy B18
from the Peerless system.
Almost 90% are profitable when reversed and the average gain
at the time of the next Peerless sell is more than 9%. What makes a B18 interesting
now is that
it often was followed by a strong new bull market: 1942-1944, 1949, 1958, 1985, 1995-1996
and
2003 and never occurred in the 1930s.
We need Closing Power breakouts to confirm any further advance by the QQQQ,
SPY, DIA, MDY or IWM.
Gold, Silver and Oil are benefiting from growing concerns that the Fed will
have to
print billions and billions of dollars, because it cannot find enough buyers of the
Treasury
instruments it wants to sell without raising interest rates.
At the bottom of this page are a number of lower priced stocks that are making new highs.
Low
priced stocks showing high accumulation and new Closing Power highs are making spectacular
advances. Is this because low-priced stocks have been beaten down for a long time
or does
it
have something to do with professionals not wanting to go short stocks ahead of the
SEC's
announcement in a few weeks about the new rules that will apply to shorting.
Goldman Sachs' chart is still point up sharply. Their control of
the Obama's decision-making
through
Geithner and Summers is not in jeopardy, hence we see rising financial stocks.
See
also http://www.tigersoftware.com/TigerBlogs/April-7-2009/index.html
======================================================================================
5/27/2009
There is still no
Peerless sell signal. The Buy B12 is the last major Peerless
signal. But selling volume and big money distribution on strength are now
distinct problems. See how the OBV is falling for the DJI below. The
Accumulation
Index is now in red negative territory and below its 21-day mvg.avg. That the
Closing Powers are still rising gives us hope still that any decline from here will
be limited, as does the still rising NYSE A/D Line. 37 of the 43 Fidelity Select
Funds
are still up for the last month. The DJI is now 50 points below its 21-day ma.
With the P-Indicator a +313 now, a 2%-3% decline could easily bring a new
Peerless Buy signal. There are a number of NASDAQ low priced stocks that show
very high Accumulation and a rising Closing Power. These are the stocks we continue
to favor.
Could we have just seen the end of a bear market rally? 8-10 week bear market
rallies
were common between 1930 and 1933. We have to protect ourselves. Accordingly,
if the DJI were to fall below 7182, back more than 50% again from its highest close,
14164.53 in 2007, I would say that that would make us switch to the extreme bearish
mode.
We would have to prepare for the worse. This would have saved someone from
all manner of trouble in the next two years from 1930 to 1933. In 1930, when
the DJI
fell down more than 50% from its highest close in September 1929 (381.20), the bottom
fell out and prices plunged from 190 to 42.
That the DJI ran up twice as much from August 1982 to its top in October 2007
as the DJI did in the 25 years up to the September 1929 peak is quite worrisome
when you think about and wonder if Obama and his Wall Street minions really know
what to do now to avoid what happened in the 1930s.
But is a big plunge really about to start? We can learn a lot about bigger and
deeper bear
markets by studying the 1930s. Here is the chart for 1930. See how
Peerless
would have told you when to get out in the 2 month rally in the Summer. See the
Sell S9s and S12s.

A customer and colleague from Connecticut has just sent me breadth data for the period
I was missing, from 1926 to 1943. At his request, I can't release the data itself.
But this
data allow Peerless signals that use breadth to be seen for the first time in the charts
for
these years.
The really key lessons from my initial studying these charts are:
1) that there are always breadth divergences at the tops in the 1930s' bear
market rallies.
2) that there are always Sell S9s and or S12s.
Since breadth divergences and Sell S9s and S12s are not evident yet here, we should gather
some comfort. In addition, bearish head and shoulders patterns that are very
apparent
in these earlier formations are not evident now. On the other hand, while Buy B12s,
like the one we saw a month ago, occurred soon after the bottoms at key bottoms in
June 1932, March 1933 and June 1938, big surges in trading volume were also present.
There has been no such surge here. That has to cause concern now.
There is another difference
worth noting. The DJI was not able to rise above its 100-day
ma after mid 1930 until June 1932, except briefly in February 1931. When it exceeded that
ma after February in 1932, 1933 and 1938, the market was in the process then
of more
than doubling. By getting past 8050, the DJI surpassed the 100-day ma this April.
OBV Is Clearly Down-Trending

=========================================================================
5/26/2009 The DJI jumped up from its 21-day ma support today. It should
challenge its
8600 flat resistance. Volume did pick up on the rally. But it is still very
low,
suggesting to me the rally is alive courtesy of program trading banks flush with
TARP money. Shorts are unsure of themselves because the SEC is expected
to make their trading more difficult in a few weeks. The trend is still up.
The
NYSE Advance-Decline Line and DIA, QQQQ and SPY Closing Power Lines
turned up smartly today and are declining. Flat topped resistance like we see
for the DJI, DIA, NASDAQ and QQQQ are more likely NOT to be tops. I
believe a move to 9000 is still a possibility in the next few weeks. That the
DJI is above its 50-day ma and breadth has been very strong makes it more likely
that negative non-confirmations by the Accumulation Index will not bring a
big retreat. The P-Indicator needs to drop closer to zero to get a sell signal on
a new high. Presently, the P-Indicator is +319, while we do have negative readings
from the Accumulation Index (-.034), V-Indicator (-34) and the ObvPct (-.118).
Again today, there more than 2400 advancing stocks on the NYSE. This is the
15th such very good breadth day in 10 weeks. This has no precedent. Smaller
companies, technology stocks and blue chips are all rising. Watch to see
if the
NASDAQ can close above 1790, the QQQQ above 35.40, the SPY past 93.05,
MDY past 107 and IWM above 51.40. A valid breakout is more likely to see
breakouts in all these. Watch volume to. It should increase for the rally to
continue.
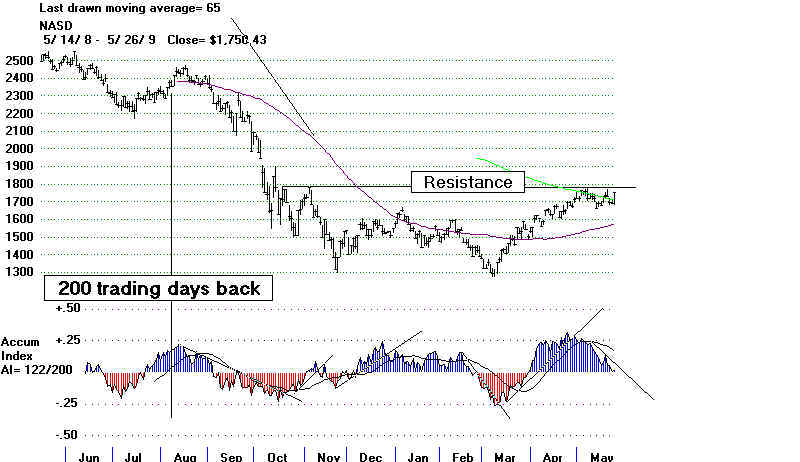
========== NASDAQ ===============
1790-1800 is flat resistance. Flat resistance is easier to ascertain. So, it is less
likely to be used by professionals and is more likely to be exceeded. On the
other hand, volume is low. Without more volume, a breakout past 1800 may well
be a trap for bears who are short.
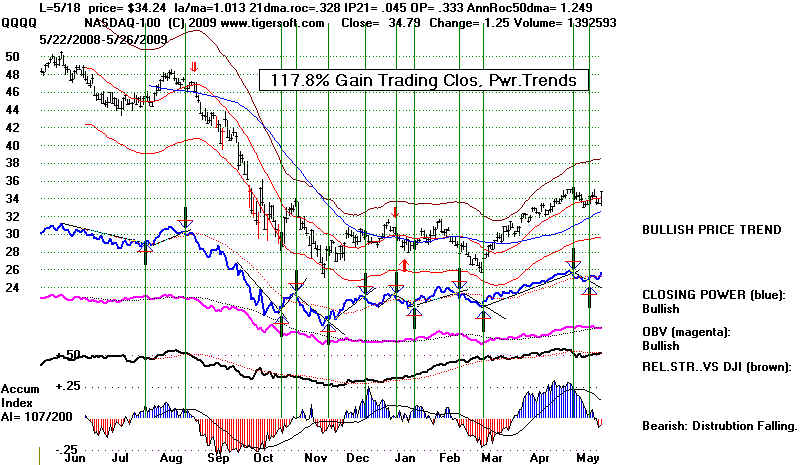
QQQQ's Closing Power is trending up. Trading Closing Power trends
has been profitable this past year. Taking positions at the openings
and allowing for commissions and slippage, the gain is +117%.
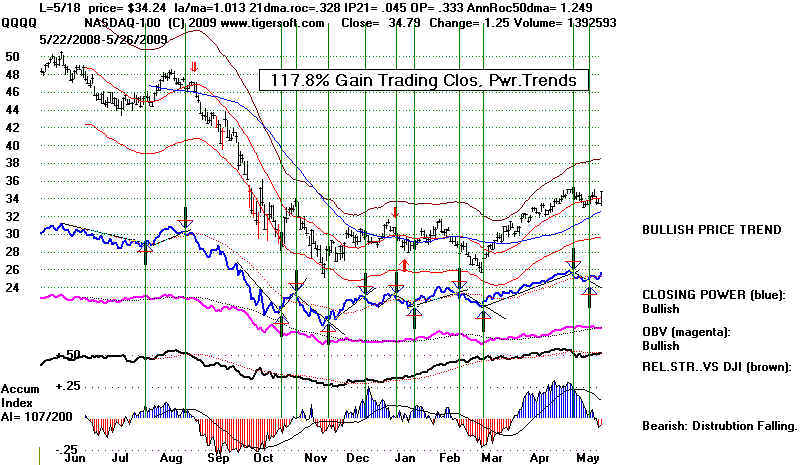
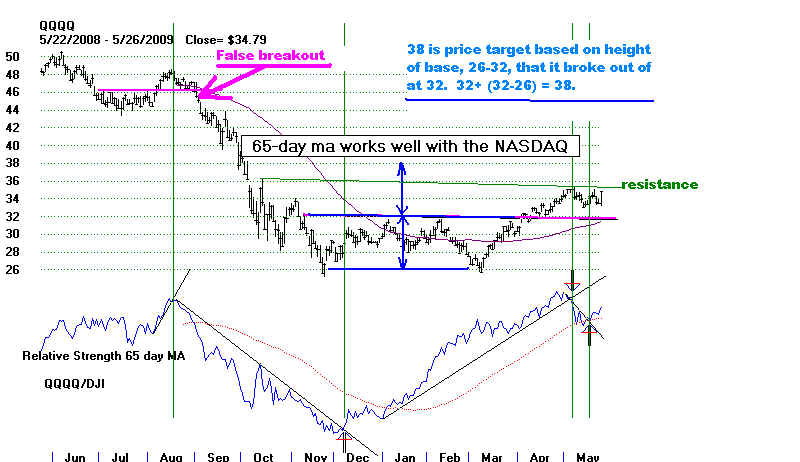
========== QQQQ
===============
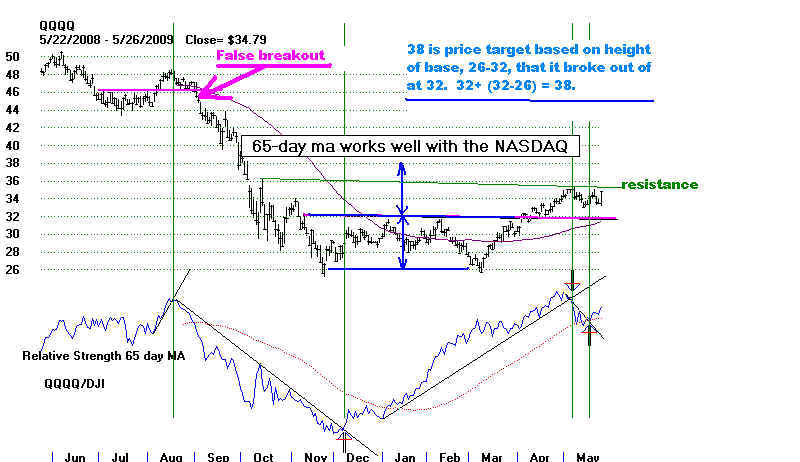
The QQQQ faces flat resistance at 35.5-36. A breakout there should
let an advance reach the 38-38.5 target obtained by using the size of the
base pattern it broke out of. The move may prove false, as did the August
breakout in 2008.
=============================================================================
5/24/2009
More Weakness Will Likely Mean A Decline to The Lower Band and 8000
If Volume Picks up on The Decline, A Deeper Decline Would Become Probable.
The Buy B12 still stands unreversed unless we change the Peerless rules. Presently
a Sell S12 can only appear when the P-Indicator has a much lower, closer to negative,
value
than it had last week when the DJI tagged the upper 3.5% band with negative readings from
the Accumulation Index and On-Balance-Volume Percent. A further review I did this
weekend
of allowing an S12 when the P-Indicator is quite positive but there is a negative
non-confirmation of
of an intra-day DJI rally to the upper band by the Accumulation Index is still
inconclusive. If we
also require the DJI to close well off the highs to get an S12, not more than 1.7% over
the 21-day ma,
that would, indeed, have given proper Sell S12s in January and last week. But these
are the only
two cases since 1942 and that is not enough for our standards.
What else can we read from the market's behavior?
The DJI has fallen back to the point of breakout in its inverted head and shoulders
pattern. If the breakout is valid, a subsequent decline should not go any
lower. But a decline
any lower would suggest a false breakout by the DJI. That would be bearish. It
would also
mean a closing below the flat 21-day ma. That would be bearish. In addition,
more weakness
this coming week would likely break the A/D Line uptrend and make the Closing Powers's
secondary uptrends be violated. Combined with the bearish June seasonality in years
after
a Presidential election, I would say that any more weakness from here is likely to
be compounding.
Certainly, that would likely bring a drop to the DJI's 50-day ma, which now crosses at
8000,
about where the lower 3.5% band is.
A decline below that could bring a retest of 6500. At this
stage, the internals of the market look too strong for that. But we will have to
watch volume.
If it starts to expand on a drop below 8000, it will look very much like what happened in
February.
Too Much of A Good Thing, Too Quickly? Imagine being short this!
There have been some very dramatic and exaggerated moves in low
priced stocks. Many
seasoned traders would suggest this shows "sloppy trading", where too much money
is going
into too few stocks. Look at the chart of DDRX above. (If their coffee is as
potent as their stock,
get a swig before the next big sales meeting!)
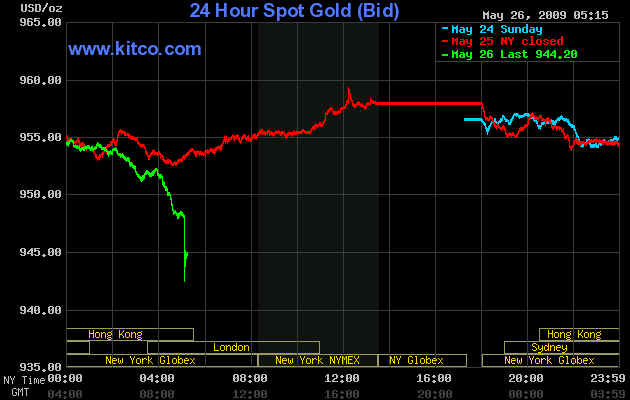
Last week's rise in gold is also a warning. Too often, it signifies a weakening
Dollar. That in
turn, usually means higher interest rates, though Bernanke seems be resisting that.
Some say
he is using the printing press to buy new Treasury offerings, since China is not inclined
to buy
them as it once did. That, in turn, is boosting the price for imported oil. These
are bearish forces.
So will be the national protests against the Fed and Obama's multi-trillion dollar bailout
for banks
that are planned for June 10th. See - http://www.anewwayforward.org/doit.php
Some believe
that all currencies are now being debased. If true, that would help the Dollar, if
it is true. I note
late tonight that Gold has been hit by an overnight wave of selling.
Gold is above its rising 50-day
ma. So, this may make for a good point to buy in.
There have been five straight down
days. A recovery might be expected, except that
none appeared on Friday, when it should have started if pre-Memorial Day trading had been
typical.
Of greatest concern, was the low volume on the rally. That makes us suspect that too
much of the recent rally's buying was artificially created by the trading desks of banks,
such as Goldman Sachs, using TARP money to get their stocks up so that they
could get
investors to pay top dollar for their new shares' offerings.
Accordingly, we have reduced the number of stocks we are long on our hotline, but have not
recommended shorting
the major market ETFs.
QQQQ SPY DIA
Dollar Gold Silver Oil
Banks: GS MS V MA JPM BAC WFC
Technology IBM AAPL GOOG RIMM QCOM ADBE AMZN
=====================================================================================
5/21/2009
DJI -1.54% NASDAQ -1.89%
Another Rally Seems More Likely Than Not.
The NYSE A/D Line's secondary uptrendline is still intact. Breadth has been superb.
36 of
the 42 Fidelity Sector funds are up for the last month. The taste of fast profits is
in the mouths
of a number of early bulls. Look for them to add to positions on weakness. The
Closing Powers'
moving averages are still rising. And the rising 50-day should be expected to act as
good support.
Peerless still shows the last signal to be a Buy B12. A market recovery the day
before Memoral
Day would be of no surprise. There is a gap in prices up to 8400 that looks like it
should be
closed. I would think the high priced DJI stocks might bounce tomorrow.
The top highest
priced DJI stocks make up 35% of the DJIA average. IBM has a CLosing Power that is
sitting on its uptrend and could bounce. XOM is at its rising 50-day ma. With
oil prices still
uptrending at this time of year, CVX could also rebound, though it is below its 50-day ma.
Watch MMM and JNJ. Their CLosing Powers have reached their rising 21-day ma and
their
Accumulation indexes are positive. Next week, if the market history since 1965 is a
guide,
has a 61% chance of a rally. So, the Buy B12 may yet bring another rally from the
8200-8300
support. But, as you can see, the internals are all weakening and the flagrantly
negative
non-comfirmation of yesterday's rally was certainly a big caution, as I showed last
night.
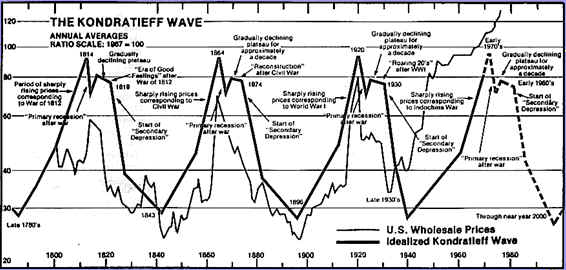
In the back of all of our minds, I think, is a keen sense that it will take years to
repair the damage
done by unregulated banking excesses. It seems each new generation must learn the
mistakes
that previous generations learned the hard way. That is the message I derive when
looking
at the famous Kondratieff Wave. A retest of 6500 in the absence of a "B"
bottom is certainly
a reasonable expectation. Gold's rise is often a bearish sign, too. But,
first, let's see if there
isn't another rally into early June, as history suggests.
http://www.angelfire.com/or/truthfinder/index22.html
The Weakness in Bank Stocks May Get A Lot Worse
They have pulled back to their price-uptrendline. This is a high inflection
point.
I find it curious that the Fed would tell the world that its economic
projections for
2009
were too optimistic. Are they trying to talk down the stock market? If they
can
rekindle fear, investors will they may think, again buy Treasury notes and thus hold
up
the Dollar. And as a bureaucracy, they obtain have more power in bad economic times.
The Dollar's weakness is just starting, if the Gold Bugs are correct about fears of
hyper-inflation stemming from the Fed's extra-easy money policy. A much
weaker Dollar
could
mean a number of bad things, from higher energy prices to the disappearance of
consumer buying power. It would certainly put pressure on the FEDs to raise interest
rates
to
keep foreign banks from starting a run on the Dollar. That would choke off the
recovery
and
give even fewer incentives for banks to make loans again. Compounding this bleak
outlook, the Fed is being asked by Geithner and Obama to take on more and more
powers in the area of supervising banks getting TARP money and protecting shareholders
from
fraud, something which the SEC has failed miserably in doing. I predict that Obama
and
Geithner are unintentionally inviting much closer scrutiny of all the Fed's sub rosa
operations.
Ron
Paul sees a chance to open the eyes of more and more people to the dangers of giving
http://www.youtube.com/watch?v=7PC9fkLMZ...
http://www.youtube.com/watch?v=bW4YZ6R53
even
so much power to an agency which already essentially operates in secret with no
Congressional
control. A debate about the FED's powers and contempt for transparency is long
over-due.
It
will worry central bankers and Wall Street. That may be the next act of the drama
about
bailouts that may emerge this Summer, as Geithner insists any TARP money paid back, he
can immediately loan out again to banks without new Congressional
authorization. Nothing
good
in the short run can come from having light shine on Wall Street's dark side.
Gold Silver Crude Oil
Financials GS, WFC, JPM BAC
Technology Stocks: IBM. CSCO, AAPL, QCOM, GOOG, RIMM
=======================================================
5/20/2009 Buy B12. Should Today Have Given A New
Sell S12?
The DJI hit the upper band today. Why is there no Sell S12 with the
Accumulative negative?
The Accumulation
Index has dropped to -.038. The answer is that Peerless back-testing has
shown me that we
must also factor in breadth, NYSE advances minus declines. But what if we create
a new Sell S12
variation based on daily statistics like today's? That would mean creating an Sell
S12
variation based
on:
1) the DJI closing 1.6% or more over the 21-day ma
2) the DJI's high being 3.8% or more over the 21-day ma
3) the Accumulation Index being -.038 or lower.
4) the On-Balnace-Volume Pct. being =.035 or lower
Here are all the cases after 1942 when the daily key values
met this criteria:
Date DJIA
DJI Outcome
1.
12/7/1956 494.8
Fell to 470 2/5/57
2.
5/22/1961 702.4
Fell to 680 (3%) and then rallied to 735 and fell sharply the next
year
3.
10/12/1978 896.4 Fell 12.2% to next Buy. Also an S9
(8/18/1982 829.3 Rallied strongly. This can be eliminated by having B12 take-off
over-ride this.)
4.
12/7/1982 1056.94 Fell to lower band and Peerless buy.
5.
12/28/1982 1058.87 Rose
to 1092 and then fell
to lower band at 1030.17 and B9.
6. 4/8/1999
10197.69 Rose to 11107.19 on 5/13/1000
7. 12/7/1999 11106.65
Rose to 11722.98 on 1/14/2000 and then fell below lower
band. B17 10973.
8.
2/27/2002 10127.58 Rose
to 10632.35 and then started a bear market.
9.
12/5/2000 10898.72 Fell
to lower band at 10200. No Buy there. Next Buy 3/23/01 9504
10.
1/5/2009 8952.89 Fell to lower band 8448.56 and next Buy. Kept falling.
11.
5/20/2009 8422.04
In 4 or 5 of the 10 cases (We can leave out the case of 8/18/92 when
there was a high volume B12 just
before this
case.), the DJI fell immediately to at least the lower band. But in four cases it
kept
rising, by more
than 4%. This is not conclusive enough to use without more study. It does
suggest that
we must watch now
for more evidence that this will be one of the cases where there DJI falls to the lower
band.
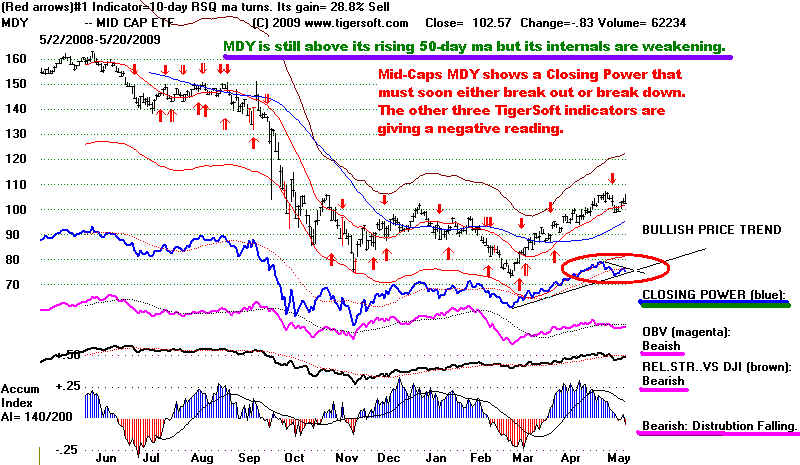
The market's internals are weakening. The Closing Powers for the DIA,
QQQQ, SPY, IWM and
MDY have now
dropped below their rising 21-day ma. Still. they cannot yet be said to be declining
until they
zig-zag to new lows. Even though that would be bearish, the rising 50-day ma would
limit
the resulting
decline, as discussed earlier.
The most bullish aspect of the current technicals remains in force. The NYSE A/D Line is
in a pronounced
and steep up-trend. The P-Indicator stands at a robust +406. Even after
today's
sell-off, there
were 123 more up than down on the NYSE. It seems clear that most stocks still look
very cheap
compared to last Summer. But "V" bottoms are rare. A 10% decline
followed by a
a high volume
recovery to new highs would probably put the market on more solid grounds. And
the nagging fear
remains that this is a program-traded rally made possible by taxpayer TARP money.
Finance stocks
are losing steam. Goldman Sachs, their leader, is about to show a broken Closing
Power uptrend.
The FED lowered expectations for a recovery in 2009. That will make it harder
for the public to
be induced to buy stocks away from the trading desks of Goldman Sachs on additonal
strength.
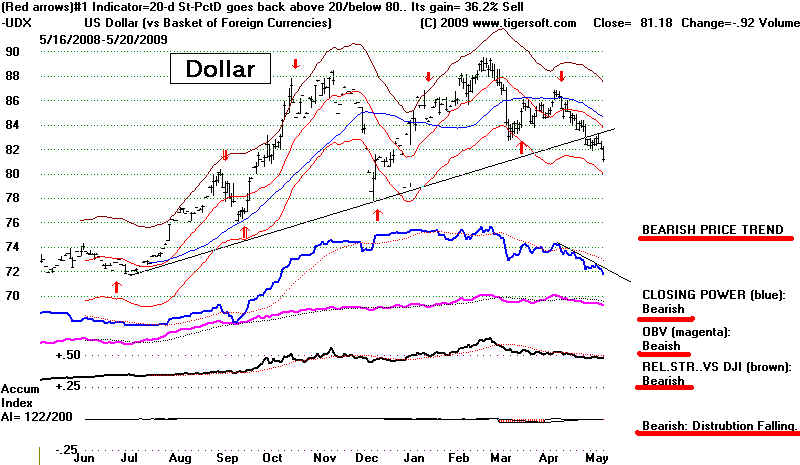
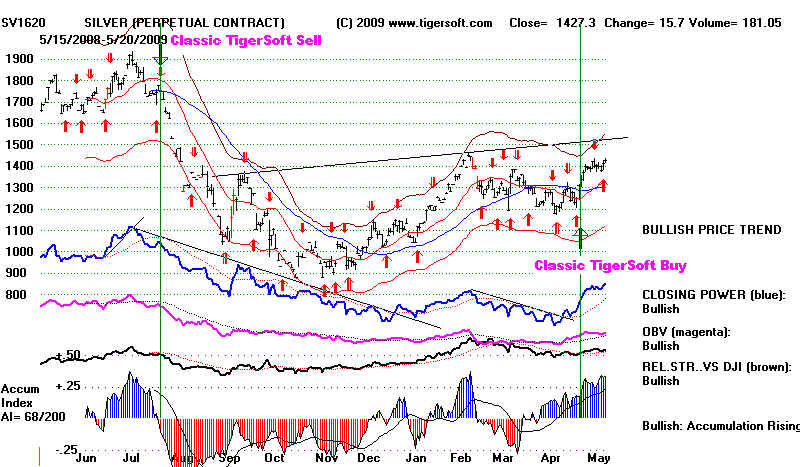
5/20/2009
The Dollar is breaking down and weakening. Silver has given
a classic Buy by making
a confirmed move above its 50-day ma with very positive Accumution. This is a
pattern
that produces very good advances in Silver. Note that the ETF for Silver. SLV, is
not as
good for watching internals.
Most DJI Stocks are giving off bearish short-term
warnings.
AXP - classic bearish head and shoulders
pattern.
Boeing - strong Accumulation, but at
resistance.
CitGroup - Closing Power is making new
lows.
Chevron drops fall below 50-day ma is
confirmed.
DIA - Closing Power may be topping out.
Key difference from earler CP tops: it is above its 50-day ma
DIS Closing Power uptrendline is being
tested.
Home Depot gives sell by confirmed falling
below its 50-day ma. But the 50-day ma is rising.
HPQ - shows emerging head and shoulders
price top and Closing Power is at its uptrendline.
IBM's Accumulation Index turned negative.
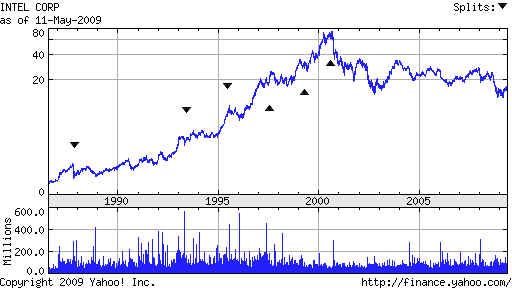
Intel is at apex of right shoulder in
head and shoulders pattern with weak AI being negative.
JPMorgan's Closing Power shows a
completed head and shoulders pattern.
KO shows a classic Red Stochastic Sell.
MSFT gives a Sell at flat resistance
with Accumulation Index negative.
AT&T gives classic bearish signs.
====================================================================================
519/2009 Buy B12 Still Operative. 9000 Remains
Our Target.
But The Accumulation Index Shows More and More Distribution.
If this were an extreme bear market rally, we would look for a top right about
now, as a 10 week
rally in these conditions is the average. But because the DJI has gotten back above
the earlier 40%
down-from-the-12-month high level at 7780, we think this is unlikely. That the
breadth has been
so good seems bullish enough to cancel the bearishness of the apparently low volume on the
rally.
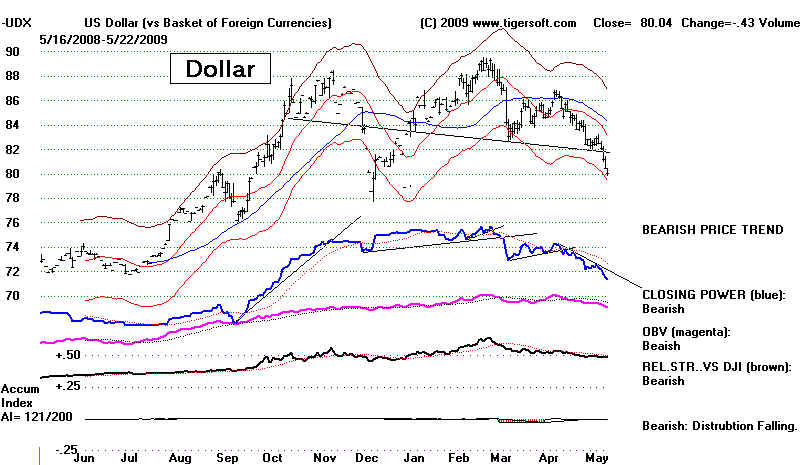
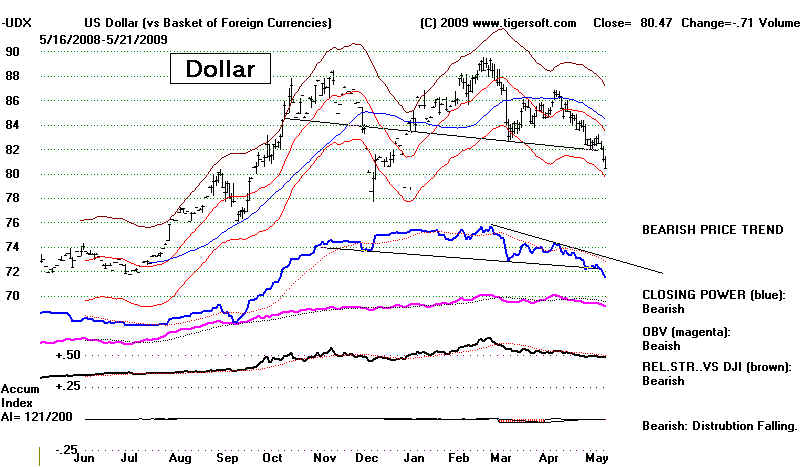
The US Dollar may be turning down. That is inflationary. For the time being,
deflation and depression
are bigger concerns. But if the Dollar should decline sharply, that would bring the
FED to raise
interest rates and we would be locked into a world of "STOP-GO" Fed policies and
a return to
stagflation and markets like those between 1966 and 1982. Obama's expansion of the
war in
Afghanistan seems comparable to Nixon's expanding the war to Laos and Cambodia from
Viet Nam.
Peace would be better for the markets and the Dollar. General Dynamics made a
confirmed
recovery high today. The military industrual complex is safe with Obama!
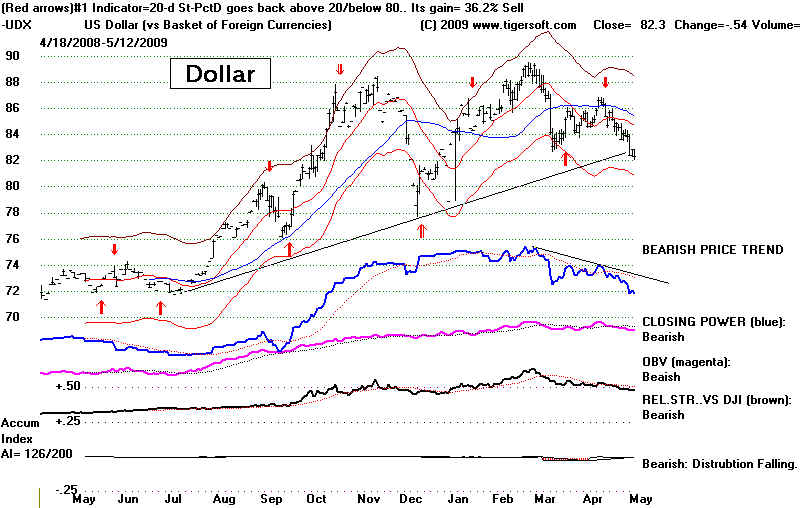
US Dollar Looks "Toppy" 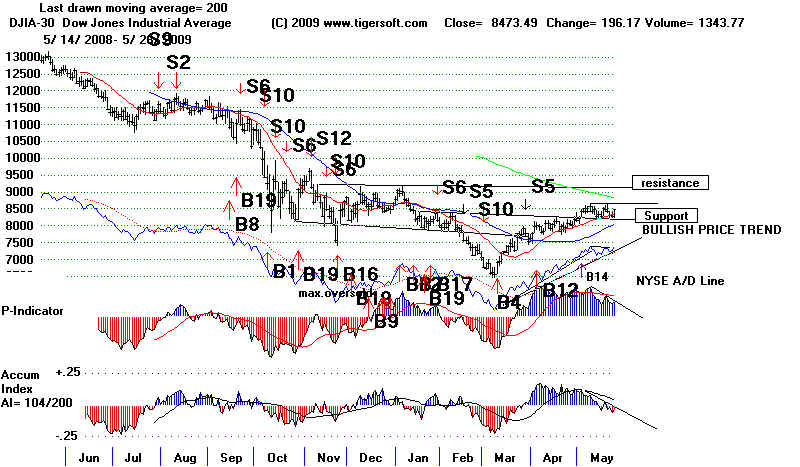
Watch the Secondary Closing Power
Uptrends
The last Peerless signal remains a mahor Buy B12. 8520 did act as resistance
today.
Volume is too low to eat up the overhead supply of stock quickly. Breadth was
positive despite
the late sell-off. The secondary Closing Power uptrends are still intact. A
breaking of them should
bring another retreat to 8250. The NASDAQ and NASDAQ-100 are now under-performing
the DJI. This is not necessarily immediately bearish. But it points to the
deterioration
we are seeing in the internal strength indicators, especially the Accumulation Index.
Watch how the NASDAQ behaves next. A move above 1800 would be very bullish,
especially if there is a rise in volume. On the other hand, greater weakness by the
NASDAQ
vis-a-vis the DJI will make the NASDAQ's RELDJI go more negative as it did last Summer.
I also take it as a bullish sign when the QQQQ outperforms the DJI, like it did in 2003.
This
shows that buyers want more speculative technology stocks. This shows
confidence.
NASDAQ
QQQQ - 2008-2009

Our concern for a month has been
that the rally has been artificial, in the sense
that it has pushed too much by banks bidding up their own or each others' shares with TARP
money
in order to make them attractive at higher prices for new stock offerings. That
notion was supported
today as Goldman Sachs got around to recommending Bank of America just as the latter was
raising
$13.47 billion by selling 1.26 billion shares at 10.77. Wells Fargo, Goldman and
Morgan
Stanley have each raised billions in private offerings.
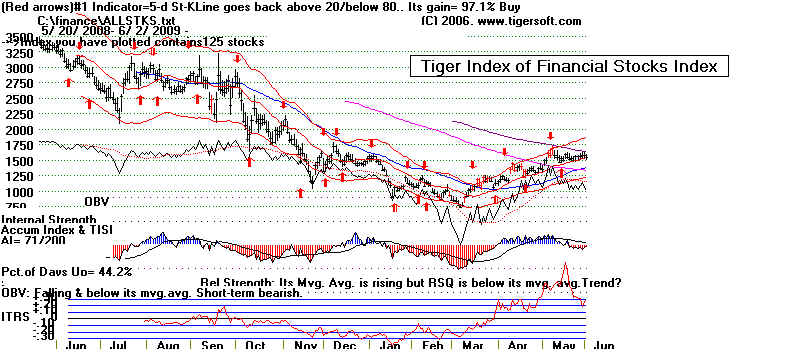
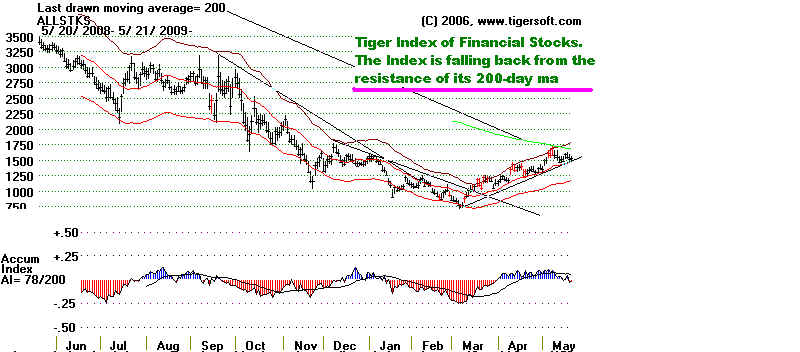
Tiger Index of Financials is still in uptrend. This group led the market
down. We have to
watch it for another down-ward leg. Its trend is still up, but you can see that the
Accumulation
Index is weakening.
Usually bigger declines start only after there are
important signs of internal strength
weakness on a rally to a high near the upper 3.5% band. We did reach that today.
Breadth and
the P-Indicator are still strong. But the Accumulation Index is bearishly only
slightly positive.
In normal markets, this would probably bring a retreat, at least, to the 21-day ma.
But volatility
since last October has made the "normal" 3.5% upper band too low. A 5%-7%
band has acted as
a better top bracket since then. The DJI's closing at its lows on high volume makes
the
Accumulation Index drop. A bigger move down here might also be expected to bring a
day or
two of "churning" near the upper band with little change in price, day to day.
Because the last Peerless signal is a Buy and the secondary CLosing Power uptrendlines
are still intact, I would stick with the upward momentum for now and see if the DJI is
able to make to 9000, where I reckon the strongest resistance is.
=====================================================================================
5/18/2009 DJI
+2.85% Buy B12 Still Operative. 9000 Seems A Good Target.
The DJI rebounded from the support of its rising 21-day ma
and the point of breakout
in the inverted head and shoulders pattern. The rally broke the steep downtrends of
the Closing
Power for the DIA, QQQQ and the SPY. Breadth was superb. There were 7 times more up
than
down on the NYSE. Up volume was 14 times down volume. This continues the
exceptionally good
breadth that is the basis of the rally. This means that nearly all stocks are recovering.
The best
action is on the NASDAQ and among lower priced stocks. 23
stocks made 12-month highs today
on
the NASDAQ.. See some of them at the bottom of this page. Today's
rally would seem to go
a long ways to remove our concerns about the broken NYSE A/D Line uptrend and the broken
Closing Power uptrend.
The DJIA is challenging the 8510 peak reached four trading days ago. I expect that
to be
exceeded quickly, if not tomorrow. Backing and filling, but moving higher, is one of
the characteristics of a market moving up through previous trading levels on relatively
low volume. 9000 seems a good target. You can see that the falling 200-day ma
crosses there
and there are peaks in this area from December 2008 and January 2009.
Volume remains low. Look at the NASDAQ below or the volume
for any of
the general market ETFs. This suggests that the rally may well be driven by banks
playing with
TARP money in an effort to raise capital to pay back what thy owe the government.
Nothing
in the TARP bailout required banks to make loans and not speculate with the taxpayers'
money!
The real intent of the money was never to free the frozen credit markets. It was to
save the
biggest banks, because they were a central part of the US elite's power . We can see
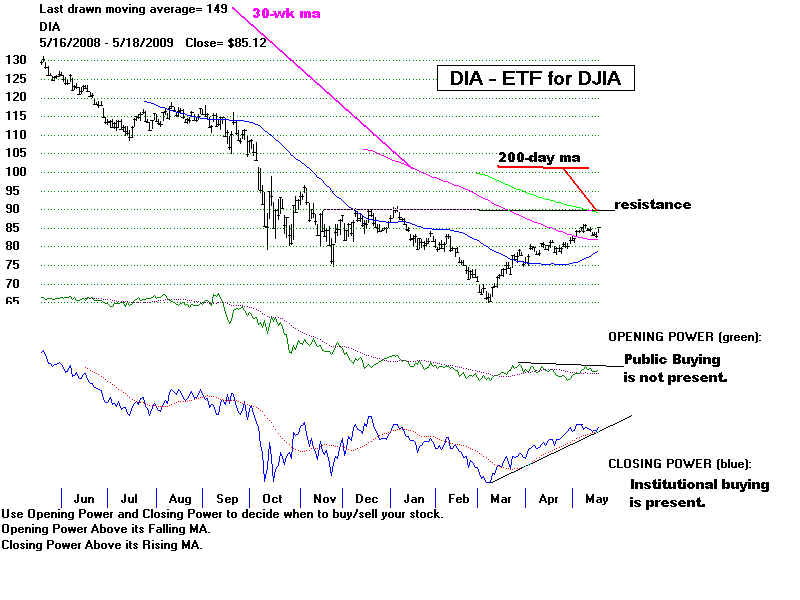
from the flat
Opening Power for the DIA for 6 weeks that the public (which pushes up openings when it is
bullish)
is not a positive factor in the market. Before the rally ends, I would expect the
public to have to
be brought back into the market as buyers to take away the stock bought at the trading
desks
of the biggest banks, like Goldman Sachs. Clearly, they want to raise
investment capital.
Typically underwriters for a secondary offering drive up prices and stabalize the market.
Prices are in the run-up phase now, I think.
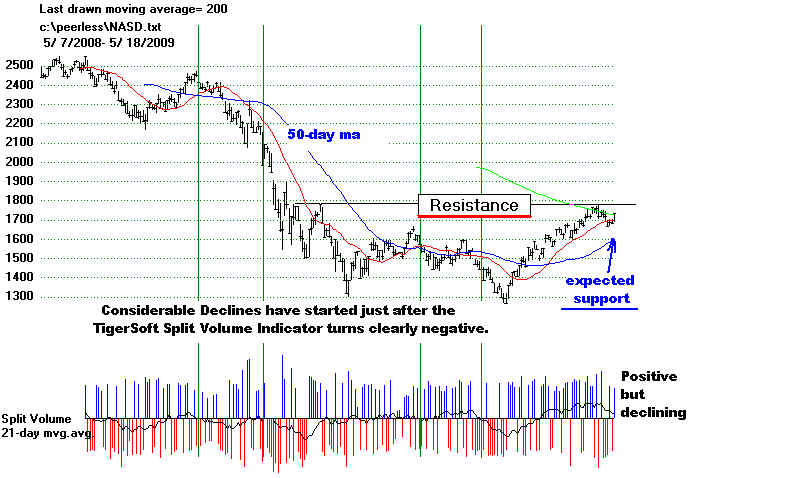
Clearly the Accumulation Index is weakening. But the Split-Volume for the DJIA
is far away from turning negative. I would think the top on this move will occur
when the
DJIA makes a recovery high with the Accumulation Index and Split Volume much closer to
zero.
Peerless should then give a timely sell signal. Of course, a rupturing of the 50-day
ma would
change this still bullish outlook. For now that key ma is rising nicely and not
being threatened.
.. .
DIA - DJIA ETF
NASDAQ - 1800 Target.
Finance Stocks C, BAC, JPM, GS
Technology IBM
GOOG AAPL RIMM ADBE QCOM
ETFs QQQQ, IWM, SPY, DIA
Dollar Oil Gold-GLD Silver-SLV
Mexico - EWW
5/15/2009 Operative Peerless Buy B12 versus A/D Line and Closing Power
Uptrend Breaks
The Closing Powers are downtrending. Most stocks are likely to keep falling
back until
the CP downtrends, like that shown below forIWM, are breached to the upside. Similarly,
the
break in the well-tested NYSE A/D Line uptrend is reliably bearish. A big
decline and
a re-test of 6500 are not likely and not expected. Peerless still shows a Buy B12 as the
last
major signal. And the internals of the DJI's action offer hope that if the DJI does
violate the
8250-8300 support from the upside-penetrated neckline in the DJI's inverted head and
shoulders
pattern, the decline will not go below 7800-8000. The higher number is where the
lower band is.
7750-7800 was effective support a month ago. The rising 50-day ma in most stocks and
ETFs
should find a lot of buyers who are waiting for a pullback to buy. Examination
of many stocks
this weekend finds most are in simply pulling back after a big gain. Good short
sales, as we judge
them, are hard to find. Clearly lowprice stocks showing insider buying and
accumulation have
been favored since the market turned up. That seems still true.
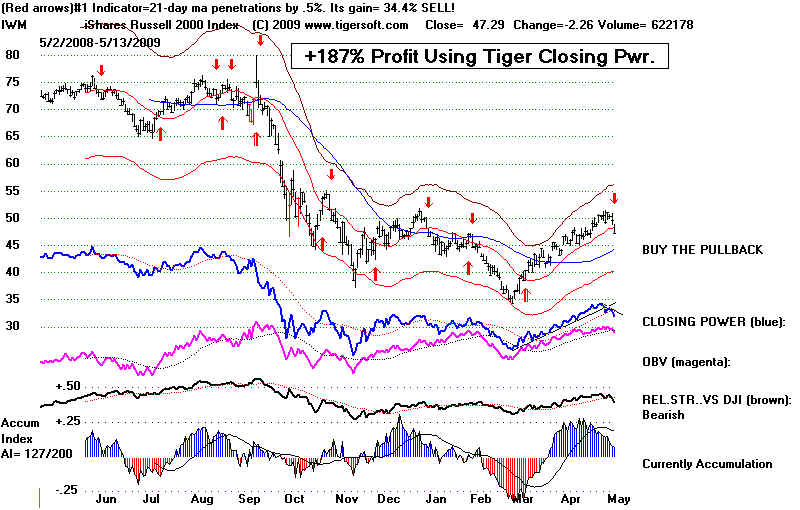
Russell 2000 ETF
Key Charts:
NASDAQ - AI<its MA
QQQQ - falling Closing
Power. AI<its MA
SPY - falling Closing Power.
AI<its MA
MDY - falling Closing Power.
AI<its MA
IWM - falling Closing Power.
AI<its MA
Finance: BAC, C, JPM GS WFC
Key Tech Stocks: IBM APPL RIMM GOOG QCOM
Oil Gold Silver Dollar
5/14/2009
The DJI rebounded 46.4 from the 8300 point-of-Breakout and now support. It
is also
just above the
support of its rising 21-day ma. Instead of breaking down today after yesterday's
A/D Line
trend-break, the market turned up from support with the best gains going to the NASDAQ.
Peerless users
will appreciate that the Buy B12 has not yet been reversed with a Peerless sell signal.
But, I remain
cautious because the Closing Power uptrends were violated. These Closing Power
downtrends need
to reverse course to confirm the extant Buy B12. Also a plus, the QQQQ has
not yet closed
more than 2% below its rising 21-day ma. So, its behavior is still consistent with
the
start of a bull
market, such as in 2003. See how in
2003 the weakness in the relative strength of the
QQQQ versus the DJIA turned briefly
"bearish". (The Tiger program rates Relative Strength
"bearish" when the RSQ:QQQQ/DJIA Line is, as now and briefly in early 2003 below
its falling
21-day ma.
The bullish solution to this situation will be for the RSQ to go back above its own
21-day ma and for
its CLosing Power to rise back above its down-trend and start zig-zagging higher.
Cautious
bullishness is still our stance. A DJI close below 8200, breaking support, would then
mean a decline to
the lower band at about 8000. Since the P-Indicator is still quite positive, a
new Peerless Buy
signal there would seem likely. What bulls will not want to see is a much deeper
decline than
8000, as that would suggest that downside volatility is again expanding.
A Bear's Opinion
Resistance is
growing to Geithner's TARP-II. Here
are the opinions of one of those getting TARP
funds
from Geithner. Mark Patterson, chairman of MatlinPatterson Advisers, one of
those supposed
to be behind the
joint public-private rescue says: "It’s a sham. The banks are insolvent.
The US
government is
trying to sedate the public because they are down to the last $100bn (£66bn) of the
$700bn TARP
funds. They think they’re doing this for the greater good of society...“The US
government has
thrown 29pc of GDP at this crisis compared to 8pc in the early 1930s. The Fed’s
balance sheet has
risen from $900bn to $2.7 trillion to bail out the system. America has to do it
because the only
way out is to debase the currency, but that is going to lead to some very high
inflation three
years down the road....We’re going to see a
catastrophic increase in the number
of LBO’s
(leveraged buyouts) going into default because they’re knee-deep in debt and no
solution
exists since they
can’t refinance”.
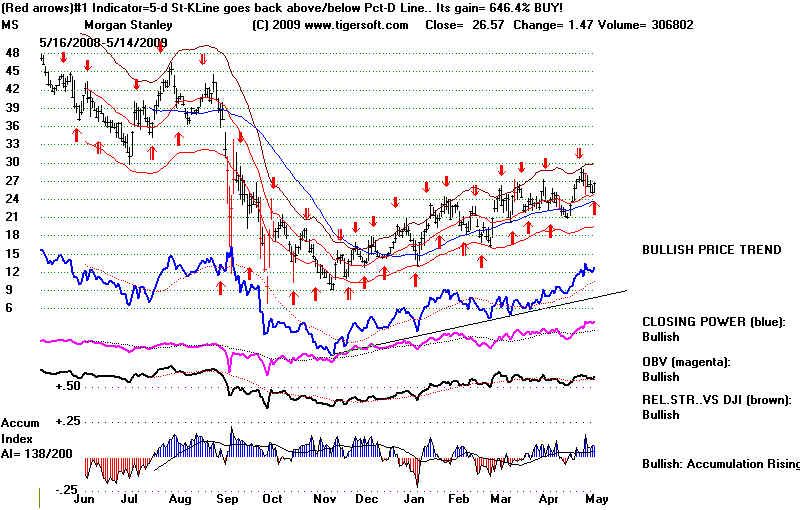
Goldman Sachs and Morgan Stanley Keep Rising - The Rally Is Still Alive.
Key Charts:
NASDAQ - AI<its MA
QQQQ - falling Closing
Power. AI<its MA
SPY - falling Closing Power.
AI<its MA
MDY - falling Closing Power.
AI<its MA
IWM - falling Closing Power.
AI<its MA
Finance: BAC, C, JPM
Key DJIA Stocks: IBM, MMM, BA, UTX
5/13/2009
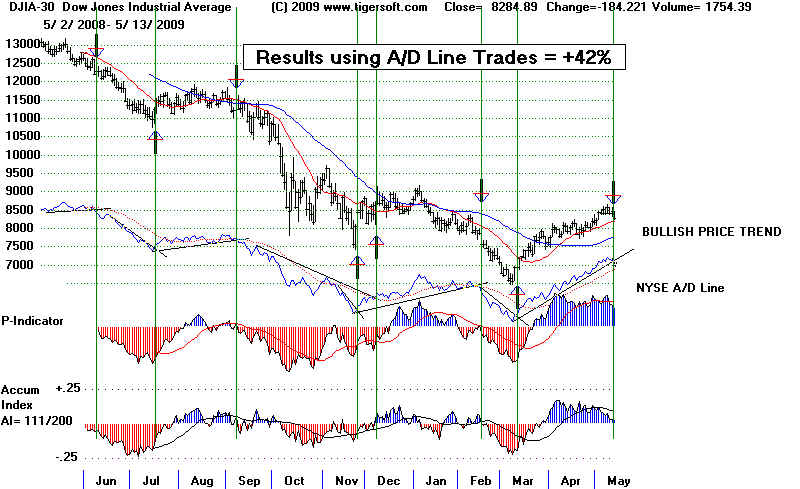
The NYSE A/D Line Uptrend Was Violated Today.
The DJI retreated today to the point of breakout, 8250-8300. where the neckline in an
inverted head and shoulders pattern had been reckoned. That "should" act
as support.
If it does not, a bearish "false" breakout is set up. The rising 21-day ma has
almost been
reached. Normally we would also expected this to act as support.
Similarly, the QQQQ
is retreating back to its base-pattern's breakout point at 32. It closed at 33.02,
so there is
more leeway there. These may levels may act as support, but today's break in
the NYSE
uptrendline and the breaks in the Closing Power uptrends are clearly bearish. Safety
requires doing some selling, even though there may still be a recovery.
Today the NYSE Clearly violated its uptrendline. In the original Peerless system,
first
published and sold in 1981, this would have been treated as a Sell S6. The NYSE A/D
Line uptrend is well tested and lasts the minimum of 4 weeks, showing there is something
to be reversed. These signals were left out of the automatic Peerless system because
of the difficulty in programming what is an acceptable trendline. But the concept is
still
valid and worthy of back-testing. Valid A/D Line trend-breaks tend to come in sets,
where they work very well for 6 months or a year at a time, each one. That has
certainly
been true here. Look atthe success of such a simple system here based on the these
A/D Line trend-breaks. These A/D trend-breaks would have gained +42% over the
past year. (The regular Peerless reversing signals would have gained 89%.).
The operative Peerless signal still remains a Buy B12. But how important is
an A/D
Line uptrend-break when a Buy B12 operates? I have earlier said that if the DJI
cannot
achieve a clear price breakout above its bottoming pattern's resistance, such a break
usually brings a decline to at least the lower band and sometimes a re-test of the
old lows. Volume is needed to confirm a price breakout. Volume has been
distinctly
missing on the advance above 8300. Moreover, the January Buy B12 failed (partly
because
the Accumulation Index was only barely positive when this signal took place) without there
being such a price breakout. The A/D Line uptrend was soon broken. The DJI
then fell to 6500.
We do not want to be in that position again.
I am looking back at the market history of the first A/D Line uptrend breakdowns following
a Buy B12. The conclusion I have tentatively reached looking at all the cases
between 1942
and 2009 is that such breaks usually bring a decline to the lower band and last at least
a month's decline, though there is considerable variation among these cases if one
includes
the cases where prices do achieve a breakout. Watching for the new NYSE A/D Line
downtrend
to end, brought excellent Buys. This study will be completed later tonight.
Here are the most
important earlier cases: 1947-1948,
1948-1949, 1950, 1950-1951, 1953, 1970,
1974, 1974-1975,
1975-1976, 1982
Adding to the short-term bearishness, today the TigerSoft Closing
Power uptrends
have been violated for the SPY and DIA. This indicator's uptrends were
violated Friday for
the QQQQ, MDY(Mid-Cap ETF) amd IWM Russell-2000 ETF). Bearishly,
the QQQQ,
MDY and IWM have downtrending Closing Power Lines. That is to say, there was a brief
rally
but today the Closing Power made a new low. See IWM below. Click the links just
above
for the charts.
From the break in the NYSE uptrend-line and the break in the Closing Power
uptrend-lines, I have conclude it advisable to take more profits in long stock
positions, unless
the market opens up tomorrow morning and stays positive. We don't want gains to turn
into losses.
Buy B12s do not always launch a bull market. They can also be part of the
base-building
process. See the 1957-1958 and 1974-1975
cases. Traders may want to use just these trend-breaks
to go long and short. I would prefer not to go short until we get a Peerless Sell
signal to reinforce
and validate the downtrends.
Other charts of interest:
Financials: C, BAC, MA
Technology: IBM, INTC
Dollar Gold Silver Oil
-------------- Russell 2000 ETF
---------------
5/12/2009 Watch Intel (INTC) To See How Strong
NASDAQ and QQQQ are.
DJI +0.60% NASDAQ -0.88% GLD +1.13% USO +1.05%
Nothing
has changed with today's mixed decline. The operative Peerless signal remains a Buy
B12. The
NYSE A/D
Line uptrend remains intact, but breadth was poor today (There were 470 more down than up
today.) and
the TigerSoft Closing Power uptrendline is also intact, but it could be broken tomorrow.
Breaks
in these
trendlines would almost certainly bring a decline to 81.80-82 on the DIA. Because the
internals of
the market
remain quite positive, it seems reasonable to think that DJIA-8000 will be very good
support.
It should be
noted that the QQQQ (NASDAQ-100) is now at the support its rising 21-day ma. Watch
to
see if it can
rebound from there. If the market is as strong as it was from April to June 2003,
when
a new bull market
was starting, the QQQQ should not close more than 2% below its rising 21-day ma.
The QQQ's CLosing
Power uptrend has already been violated and its Relative Strength line is now
bearishly below
its 21-day ma. I would guess that the point of breakout at 32 will have be be
tested.
Note the
deterioration in the QQQQ's Accumulation Index. When the QQQQ is below its falling
200-day ma, this
is most often a very good Sell signal. The situation now is ambiuous because
the 200-day ma is
falling but the QQQQ is sitting on its 200-day ma. The rising 50-day ma will
probably be
excellent support near 50 if the decline continues immediately. Seasonally,
the next
two weeks are up
only 47.8% of the time since 1966. The average decline is 0.6% for this period.
Watch INTC tomorrow. The European Economic
Union has this evening fined them more than $1 billion
for monopolistic
practices vis-a-vis competitors like AMD. The chart is at support.
It |would be
suprising if it
did not get hit tomorrow pretty sharply at the opening. This has been
anticipated.
INTC's internals
are all negative, even as the stock is at support. INTC is in the DJI-30.
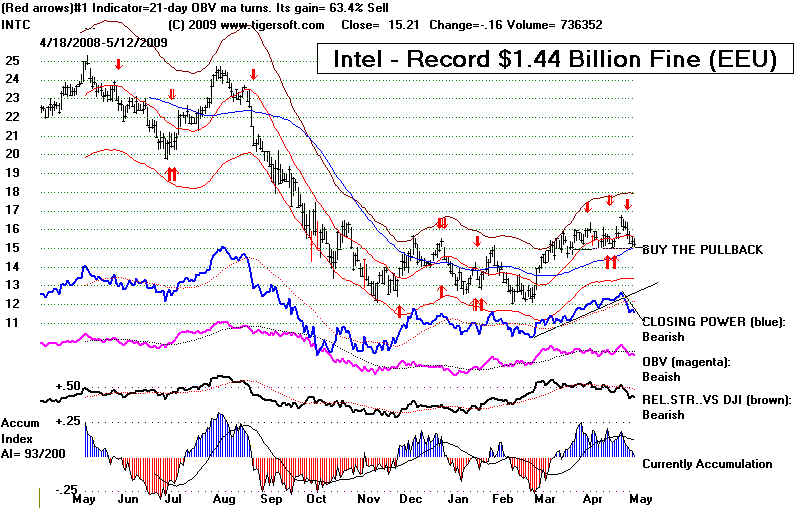
Long-Term INTC Chart
Finance Stocks in correction
C BAC JPM GS MA KEY
Dollar
MORE KEY CHARTS::
GOLD (stock) SLV IAG
QQQQ
SPY
DIA (1)
DIA (2)
5/11/2009
8 Weeks
of Rallying. Some Profit-Taking Was Due.
Peerless Still Is on A Buy. Watch Closing Power Uptrends.
News that Goldman Sachs will have to pay $60
million to the State of Massachusetts and
that state's
holders of toxic mortgages which it fraudulently sold as "AAA" might normally
have
been excpected to
shock Wall Street, since it gets to whether Wall Street should be trusted, or not.
Investors might
also have worried that other states would use this precedent also to go after Goldman
and other
brokerages that sold these mortgages. But apparently, either the market is very
strong
technically, or
investors are totally innured to Wall Street misconduct, or Obama has already let it
be known that he
will shelter Wall Street, because the decline was relatively contained.
And as if to prove the point that nothing dismays invetsors these days, the market
shrugged
off the spreading
news that the FED cannot account for a trillion dollars it has given or loaned to
banks. The
Fed's Inspector General seems not remotely up to the task of keeping the FED honest.
This is the same
Fed that Geithner and Obama would give more powers to, in the cases of
the need for a
government takeover of failing financial institutions.
 Does Anyone at the Federal Reserve Know Where the 9 Trillion Is . The inspector general tasked with overseeing and auditing the Federal Reserve knows pretty much nothing about what the Fed is doing. That's the conclusion that comes from watching the exchange Tuesday between Rep. Alan Grayson (D-Fla.) and inspector general Elizabeth A. Coleman. Coleman could not tell Grayson what kind of losses the Fed has so far suffered on its $2 trillion portfolio, which has greatly expanded since September. |
She appeared unaware that the Fed engages in trillions of dollars in off-balance-sheet exchanges. She is not investigating the role of the Fed in allowing the collapse of Lehman Brothers. She did not know where the Fed has invested its $2 trillion on the liability side of the balance sheet. "I do not know. We have not looked at that specific area at this particular point on," she said. "We do not have jurisdiction to directly go out and audit reserve bank activities
specifically," she said, though the IG's Web site proudly declares that her office
"conducts independent and objective audits, inspections, evaluations, investigations,
and other reviews related to programs and operations of the Board of Governors of the
Federal Reserve System." |
The DJI may test 8300 tomorrow, but Tuesday is known as a
"turn-around day." The
operative
Peerless signal is still a Buy, a Buy B12. The Closing Power uptrend for the QQQQ
was
violated Friday.
The same indicator's uptrend may be violated for the SPY and DIA tomorrow.
But the uptrend
also may hold and produce a recovery. The Buy B12
and still rising NYSE
A/D Line uptrend
give us hope that the 9000 target we have mentioned for the DJI still will
be reached on the
present rally.
The NASDAQ's relative strength ("NASDJI") is weakening in the chart below.
Its turning
negative would be
bearish, especially since the NASDAQ is backing off from the resistance line
shown below and
its falling 200 day ma. And today the NASDAQ's Accumulation Index has
fallen below its
21-day ma. In the past when the DJI was still in a bear market - below key
resistance and
suffering from a declining 200-day ma - the falling of the NASDAQ's Accumulation
below its 21-day
ma has generally been a good Sell signal. See the NASDAQ charts of 2000, 2000-2001,
2001, 2001-2002 and 2002, 2007, 2007-2008, 2008, 2008-2009 (below) But when
the NASDAQ breaks
above key
resistance and above its rising 200-day ma, the fact that the Accumulation Index falls
below its
21-day ma is
often a very bad Sell signal. See 2002-2003.
So, watching the NASDAQ now is important.
If it continues
to rally, and it fell very little today, then it will confirm the bullishness of the Buy
B12 and the
rising NYSE A.D
Line.
NASDAQ-1
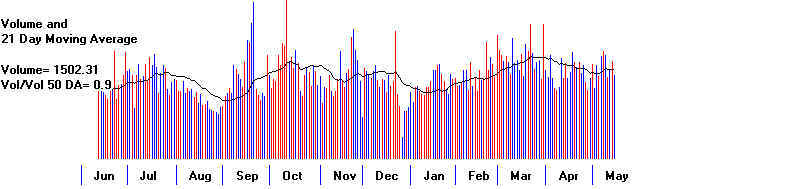
NASDAQ-2
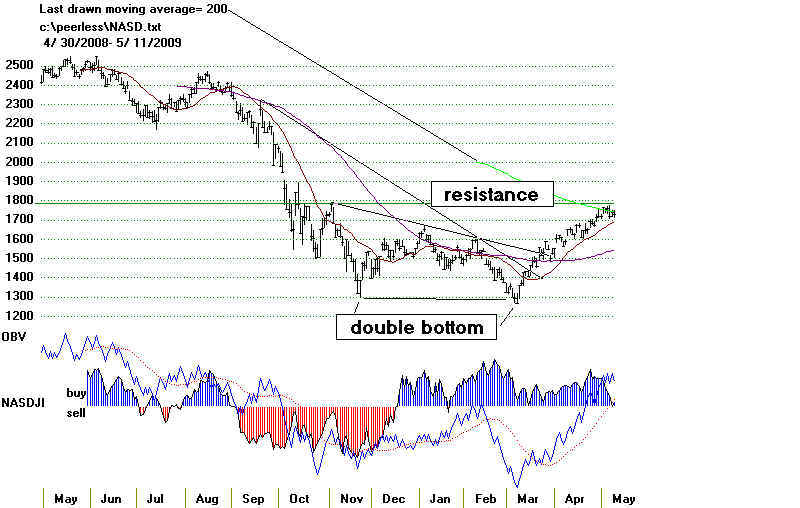
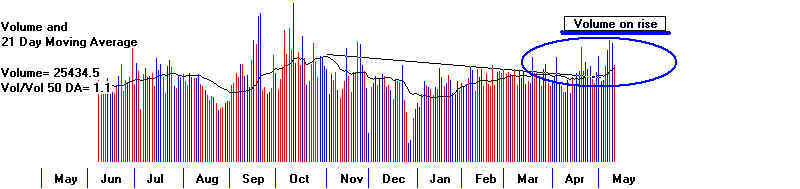
SPY - Closing Power is still
rising.
DIA - Opening and Closing Power are
rising.
QQQQ - Uptrend-line of Closing Power was
violated.
BAC, JPM. GS. MA. V, US Dollar, GLD, SLV
5/10/2009 DJI +1.96% NASDAQ +1.33% SP-500
+2.41% GLD +.60% USO +3.18%
Buy B12 is Still Operative Peerless Signal. NYSE A/D Line uptrend
continues.
Closing Power Lines are still rising and in uptrends for the DIA and SPY.
But the Closing Power uptrends have been violated for QQQQ and MDY (Mid-Caps).
The Rally Is Sputtering. The Indices May Need To ReGroup and Get Back in Synch.
The DJI could not bring itself to decline for two consecutive days Friday. The
last three
days' NYSE volume as a whole was more than at any time since mid-March. It is
bullish
when volume picks up after a breakout, such as DJI had when it surpassed 8300..
There were almost 5 times more up than down on the NYSE. NYSE up volume was
almost 6
times down volume. The public is definitely becoming more interested in buying
stocks again.
We see this also in the fact that Opening Power for the DIA is back above its 21-day ma
and is rising. For now, we have the best of all world, the Opening and the
CLosing Power
are rising. If the CLosing Power uptrend is violated next week, it will mean, very
simply,
that the public is buying shares from professionals, including banks like Goldman Sachs
that
used their TARP money to buy stock much more than make loans.
----- DIA ---- Public Buying Is Evident from Rising Opening
Power. ------
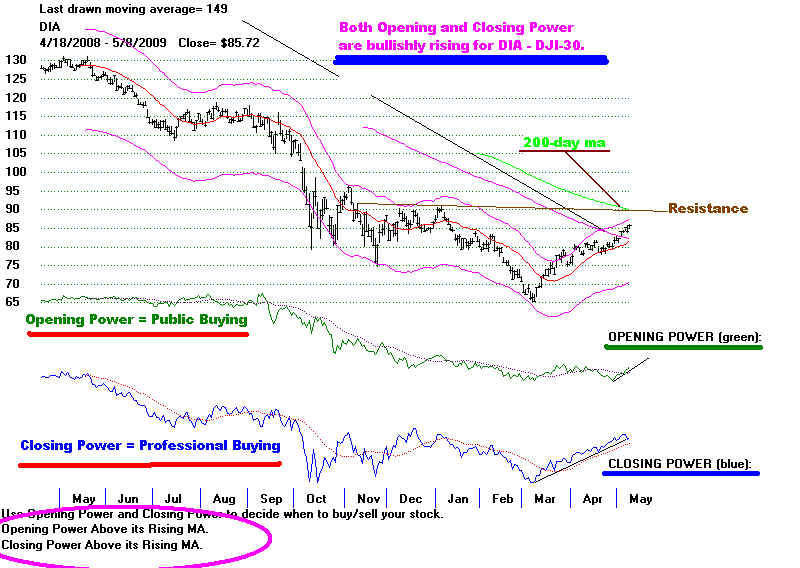
Finance stocks are enjoying a sustained advance, despite
fears that the Stress Tests were
designed
to bolster confidence in them, more than test their solvency if unemployment
passes
10%.
. 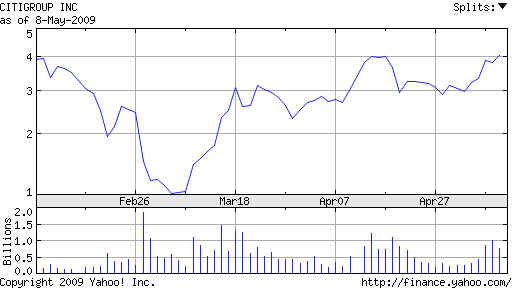
Look at GS, JPM, BAC, AXP, V, MA.
Even CitiGroup's price has enjoyed a big
boost,
though. Its internals have not been strong. The CLosing powers for these
remain
in powerful uptrends.
US DOLLAR
The Dollar broke its 8 month uptrendline Friday. The US Treasury will have a much
harder
time finding buyers for its securities. Investors are selling them to buy stocks.
That will
eventually cause interest rates to go up. In the mean time, the FED must print a lot
more
dollars. The Gold stock, GOLD, we
mentioned as setting up for a buy a month ago just made
a 12-month high. GLD SLV The start of a bull market in 2003
saw the Dollar ($USD) fall from
97.5 in June 2003 to 80 in January 2005. I would expect it to be weak if equities
seem safe
again.
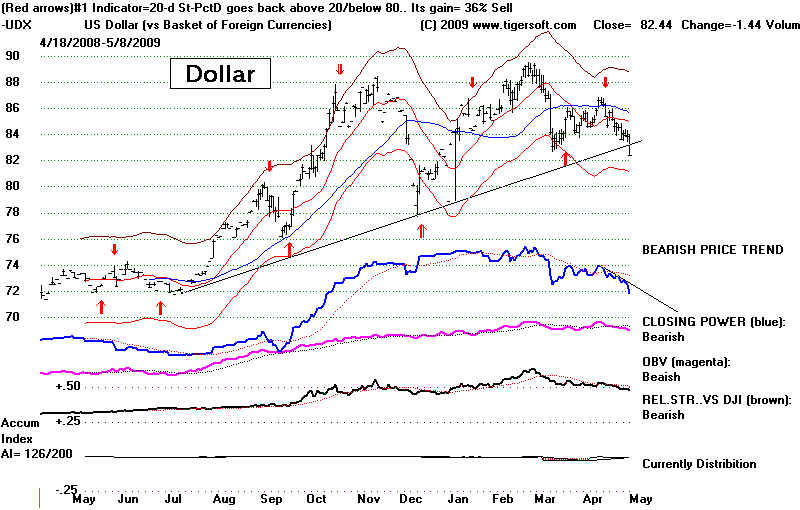
QQQQ Relative Weakness
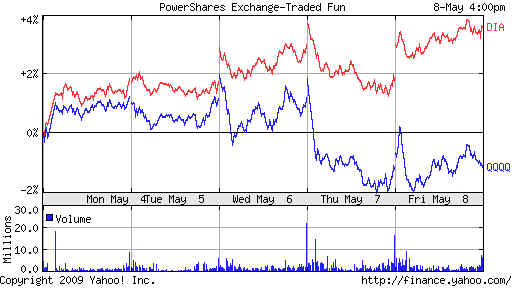
Tech stocks on the NASDAQ have started to lag. How much of a
problem is this? We
will want to watch them closely. If this is the start of a new bull market - like in
2003,
the QQQQ's retreats will stop just below the rising 21-day ma. Buying there or when
its
5-Day Stochastic Pct-D crosses back above 20 or when the Closing Power Down-trendline
is broken above should be profitable, as they were in 2003.
In a bullish environment, it is normal for the more volatile QQQQ and DIA to rotate in and
out of favor, but the predominant pattern is for the QQQQ to outperform the DJI or DIA
when the latter rallies. When, as now, the DJI rallies and the QQQQ does not, it
should get
our attention. The bull market's engine is sputtering. More defensive stocks
are being bought.
The QQQQ is down for the last five days .30, less than 1%, so, we may be worrying about
nothing. Watch the weakness also in leading tech stocks.
IBM, MSFT, INTC, HPQ AAPL, RIMM, GOOG
QQQQ - 2008-2009
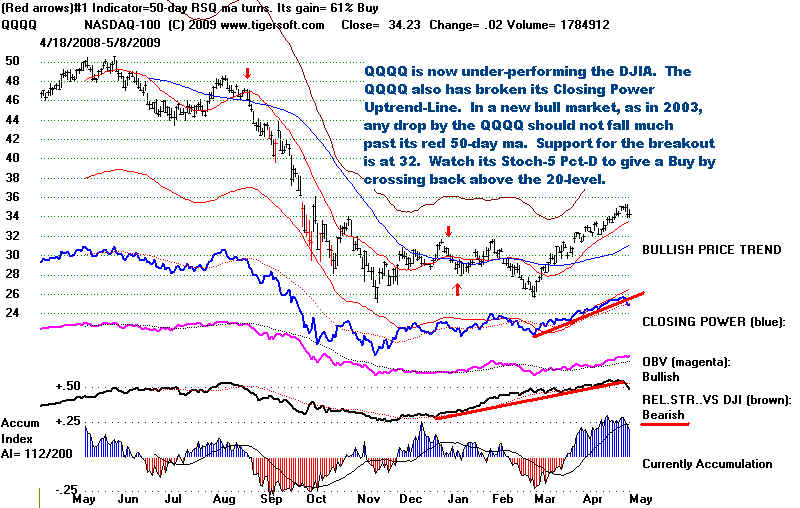
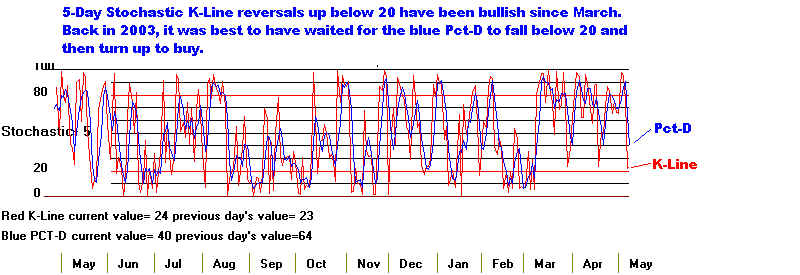
QQQQ - 2003
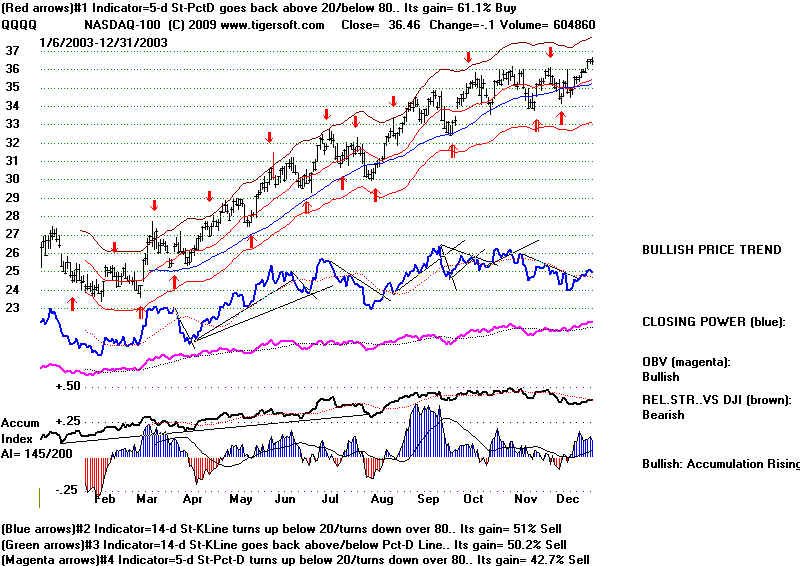
Below is 5-day Stochastic - Blue dips below 20 and moves back
above that level were correctly bullish Buys in 2003's bull market.
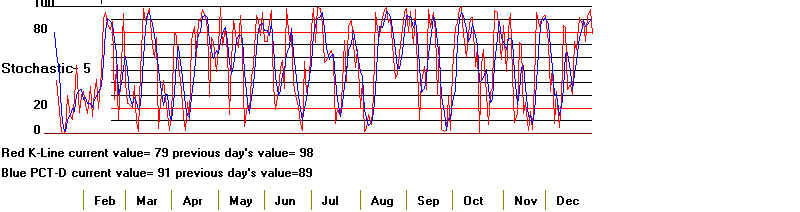
5/7/2009 DJI -1.21% NASDAQ -2,44%
SP-500 -1.32% GLD -011% USO +0.16%
The Peerless Buy B12 is
unreversed. The inverted head and
shoulders pattern
still is bullishly in effect. The NYSE A/D Line uptrend line is still bullishly in
tact.
We can easily superimpose the Peerless Buys and Sells on the charts of ETFS
and see what the gains would have been the last year, assuming one starts with $10,000,
all proceeds are fully re-invested with each trade and that commissions and slippage
amount to $40.00 per trade. Our software lets you see what the gains would
have
been trading these signals at the next days opening. Here are some typical results.
Super-Imposed Peerless Major Signals
Starting on 7/30/2008
DIA ETF for DJIA
+74.5%
SPY ETF for SP-500
+104.4%
QQQQ ETF for Nasdaq-100
+96.0%
MDY ETF for Mid-Cap
+178.3%
IWM ETF for Russell-2000
+176.9%
Besides Peerless, we have come to use trend-changes in TigerSoft's Closing Power
for Buys and Sells. Though, the basis for the signals is very different, the results
are very
similar. This suggests using the two systems together as a check on each other is a
valuable exercise. The problem with the Closing Power (CP) and the CLosing Power Pct
(CPP)
is that there is no automatic way to generate the Buy and Sell signals and compare gains.
The process is tedious and necessarily a little subjective. We first have to draw
the trendlines
in the Closing Power. A little practice makes this pretty easy. Then we
have to put signals
on the points of the trend-break, using "Lines" + "Vertical LineL User Set
B28/S28" +
+ "B" for Buy or "S" for Sell. This is time-consuming because one has
to point the mouse
at the exact place where there is a trend-break. When we do that we get the
following
results:
Trend-Changes in Closing Power
Starting on 7/30/2008
DIA ETF for DJIA
+
82.1 %
SPY ETF for SP-500
+101.2 %
QQQQ ETF for Nasdaq-100
+166 % (See chart just below)
MDY ETF for Mid-Cap
+ 140.%
IWM ETF for Russell-2000
+ 182.8%
I have not computed the trading resuults for CPP trend changes for each of these.
The results for the QQQQ using trend
changes of the Closing Power Pct are
similar, but not exactly the same.
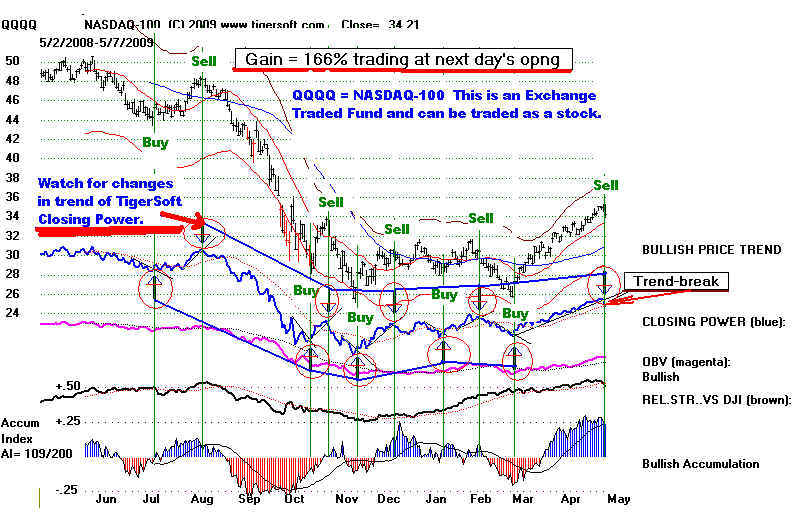
Warnings of Trend-Change
Today brought breaks on the extended and well-tested Closing Power (CP)
and Closing Power Percent (CPP) Trend-Lines for the QQQQ. Since the CP and CPP
are still above their 21-day ma, and the ETFs and indices above their own 50-day
ma., the
decline, if there is one, should be limited and minor, i.e. under 3.5%. Note how far
down from
the Opening that the Close was today for the DJIA, NASDAQ, DIA, QQQQ or SPY.
This weakness drops the Closing Power indicators quite a bit for each ETF.
Nevertheless,
since there is no Peerless major Sell and the NYSE A/D uptrends are still intact, after
at most a small decline, 9000 still seems a valid objective.
I do want to readers to notice that seasonality is no longer bullish and it is bearish
that volume keeps rising on down-days. Let's see if the shakeout continues. The
strength
of this rally has been remarkable. There have not been 3 straight down days since it
started. 8200-8300, where the neckline of the head and shoulders
pattern is, should be
good support uf a decline materializes after what looks like a strong opening
Friday.
If 8200 is violated, then there will be trouble ahead.
Obama's wager on big banks with taxpayer money is boosting the market now.
But very little is being done for Main Street. Another bubble is the likely result.
Enjoy the rally a little longer. Bear market rallies average about 10 weeks in
length.
That gives us another week or ten days of strength, even if this is ultimately to be
a bear market rally. Volume will have to pick up soon if this is really a bull
market.
Closing Power Percent (CPP) and SPY
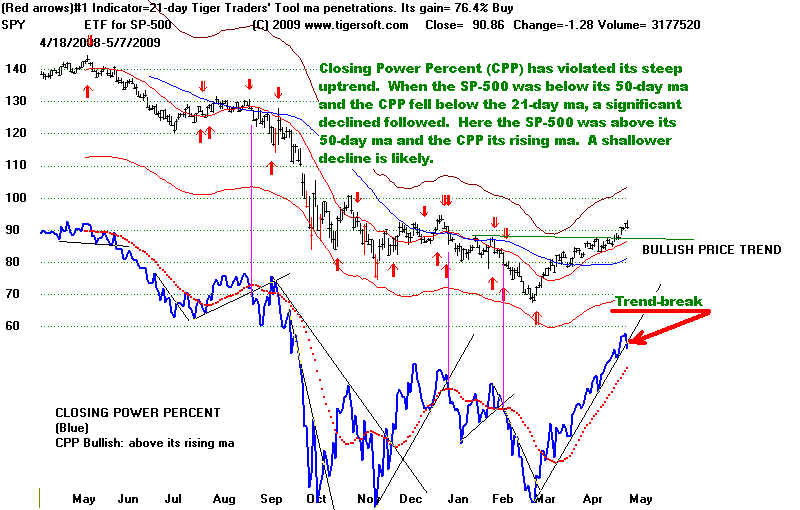
Very Well-Tested Russell-2000 Closing Power Trend-Break Is Bearish.
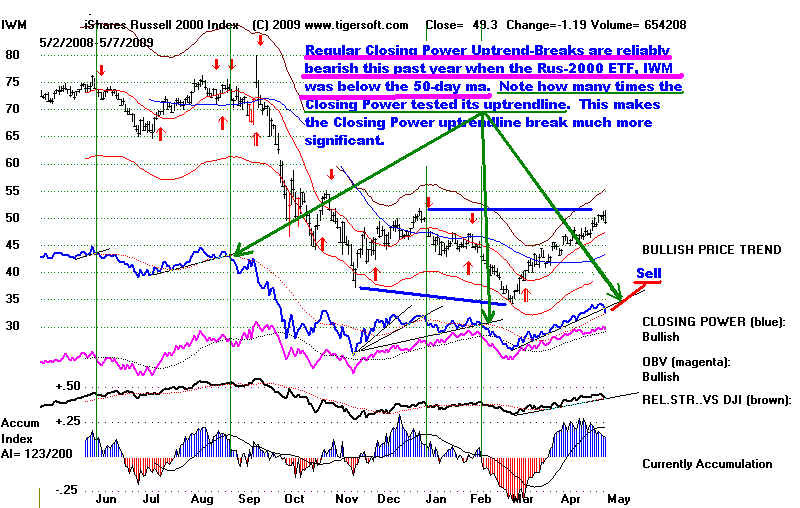
5/6/2009 Still Operative Peerless
Buy B12/B14...
9000
on the DJIA Remains the target now..8200-8300 is Expected Support.
DJIA
+1.21% 8512.28 +101.63
The DJI is now 5.4% over the 21-day ma. The P-Indicator, representing NYSE breadth,
is now a very
robust +601. The Accumulation Index has fallen below its 21-day ma, but is still
+.076. To
give a Sell, it will probably have to go negative as a new recovery high is made.
The regular
Closing Power uptrend lines for the QQQQ, SPY and DIA are still intact. But these
uptrends
are coming closer
to being violated. That would set up a minor decline of perhaps 2% to 3.5%
in the DJI.
-------- Newer More Sensitive Closing Power Percent and SPY
-----------
QQQQ Regular Closing Power Uptrend Is Still in Tact
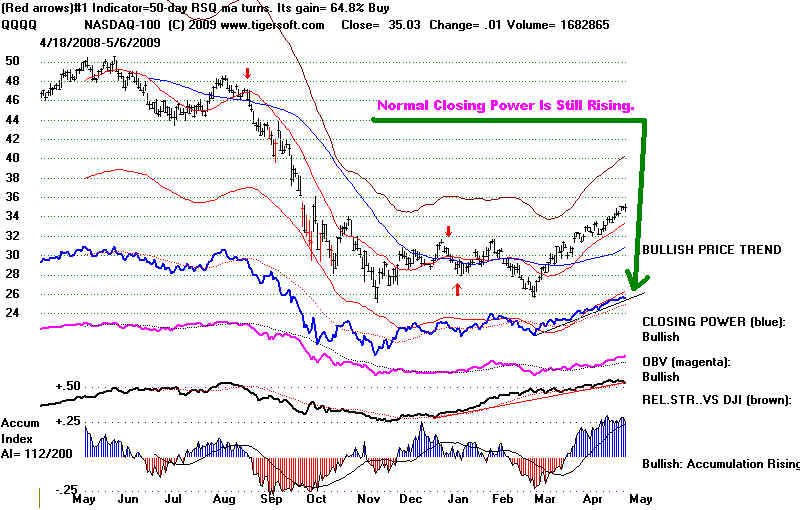
If we look at the brand new Closing Power Pct (CPP) uptrend-line, we see
that the line
has today
slightly been violated. (Elite subscribers will be able to download this update on
5/7/2009
and deploy it as
"CPP" under "Indicators-3".) A break in the regular
CLosing Power uptrend
would suggest a
mild pull-back back to 8300. However, for now, the Buy B12 and completed
head and
shoulders pattern breakout past 8300 would over-ride the bearishness of a break in
the very steep
uptrend- n the CPP Indicator. So, I would let the market continue to rally and
do no selling.
Our stock positions are doing very well.
QQQQ - New Closing Power Percent (CPP) Uptrend Was Slightly Violated Today.
More research here will be offered soon about how to use this more sensitive indicator.
I will show this indicator and the QQQQ since 1999 tomorrow evening, so that we
reach better conclusions. Here are its charts in last bear market.
QQQQ: New CPP Rules: 2002-2004:
For now, I would trust the uptrend of the regular Closing Power.
Closing Power Percent (CPP) and QQQQ
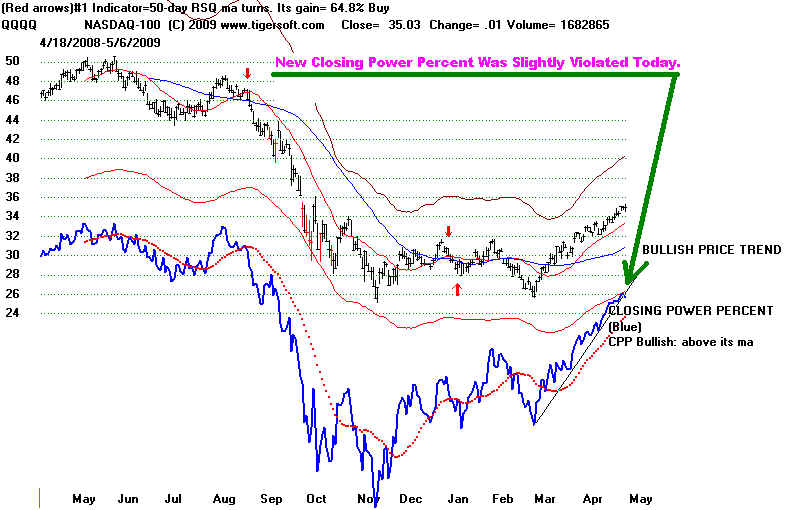
Should you buy at this stage? High accumulation stocks can be bought on breakouts
above well-tested
resistance and on retreats to their rising 21-day ma. What about the DIA,
QQQQ, SPY?
Harder to say. But there is more upside potential even now, if 9000 is the target,
than there is
downside risk. As I calculate it, there is still 500 points upside and 300 points
risk.
Understand, that
it would be necessary to be ready to take a loss if the 8200-8300 support fails.
Breakouts above
flat resistance bring nice advances normally and set up the point of breakout
as a key support
on the next test.
Volume improved today, but it remains low. This leaves me with the unsettling sense
that much
of the rally owes to big banks like Goldman Sachs trading for their own account
very
aggressively with taxpayer bailout money. We'll see if there is a trickle-down to
Main
Street.
Obama has clearly bought into the "Wall Street orthodoxy or "Party
Line" that what
is good for
the big NY banks will eventually trickle-down to Main Street. This is the Democrats'
version of
"Supply Side" economics. Only a few in Congress dare to really oppose the
biggest
banks,
rhetoric aside.
5/5/2009
Still Operative B12/B14..
The DJI's breakout above 8300 should permit a rally to 9000-9100. The NYSE A/D
Line and the
CLosing Powers for the QQQQ, SPY and DIA are all uptrending. Even a break in
their uptrends,
given the price breakout at 8300, cannot be considered important intermediate-term
Sells unless you
are a perfectionist and are concerned about a 2%-4% decline.. Peerless will have
to give an
automatic Sell Signal for us to predict a decline of more than 4%, OR the DJI will
have
to drop back
below 8200, thereby showing a false breakout.
Roubini
calls this a false rally. It may be. Volume is low and banks like Goldman
Sachs
have every reason
to run up prices, in hopes that the US Treasury will be foolish enough to pay
top dollar for
theshares it will buy to re-capitalize BAC, C, WFC and others. Leaked reports
indicate that Bank
of America will need $34 billions more liquidity to pass the "Stress Tests".
QQQQ QQQQ-CPP All indicators are
bullishly rising. There is some weakening of its strength
relative to the DJI. This may be explained by the fact that it is at its falling 200-day
ma.
SPY SPY-CPP Closing
Power is still bullishly rising.
The Accumulation Index
for the SPY is still above its 21-dma
DIA DIA-CPP
GLD SLV US-Dollar
--------------------------------------------------------------------------------------------------------------------
NEW
TIGERSOFT INDICATOR - Closing Power Pct. (CPP)
Closing Power has been calculated using absolute
price changes since it was invented
in 1999 by
TigerSoft. But when calculated using percentages, its changes of direction after a
big decline are
easier to spot. So are important CPP non-confirmations of new lows. Just below
is the new
Closing Power Percent Indicator (CPP) for the SPY. This indicator is making a new
recovery
high and is past
its December peak. We want to try bands with this indicator, too. Look for
that
tommorrow night.
Closing Power Percent (CPP) and SPY and IBM
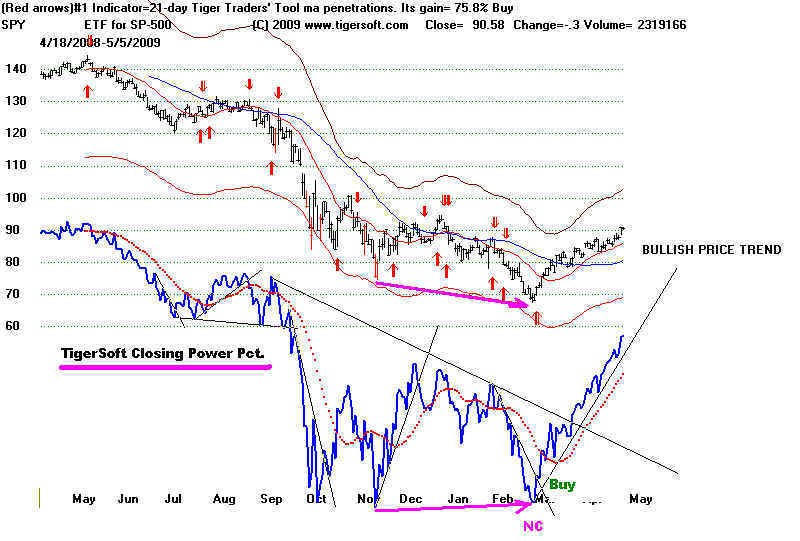
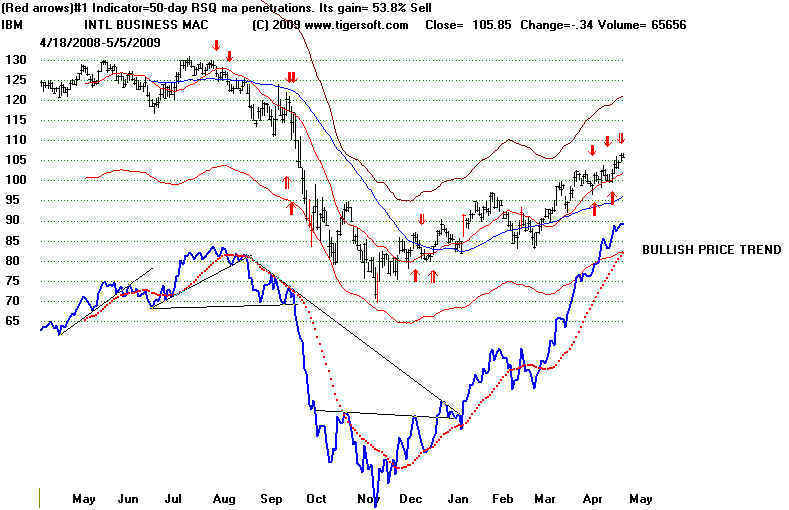
Notice bullish CPP
inverted head and shoulders pattern.
5/4/2009 Today's breakout and B14 augment the Peerless
judgement about the market.
Buy B14s take place when there is a very high ratio of NYSE advancing stocks' volume
compared to declining stocks' volume. Today that ratio was 1622 to 83.87, more than
17:1.
There have been 26 B14s since 1942. The average gain was 13.1%, but in 11
cases
the gain was less than 5%. The average gain was so big because of the 8 cases in
which
the B14s gained more than 18% at the time of the next Peerless Sell.
Only 3
of the 26 Buy B14s would have been sold at a loss.
The A/D Line uptrend is still intact, as are the Closing Powers for the
QQQQ, SPY and
DIA. The inverted head and shoulders pattern appears to have been completed.
A pullback is always a possibility. But I would reckon that 9000-9100 is the
next target.
That is where the 200-day ma crosses and where a 3x-tested resistance line crosses.
Breadth was again superb today. There were 6x more up than down on the NYSE and
NYSE Up volume was 18x Down volume. One day of such excellent breadth is not
significant.
But this is the 5th such day since the rally started on 3/9/2009 that the ratio of NYSE
advancers to decliners was 6:1. Such a bullish sequence has no earlier
precedence.
3/10/2009 2936 225
3/12/2009 2864 284
3/23/2009 2871 282
4/2/2009 2728 410
4/9/2009 2744 393
Is The Rally Program Trading Driven To Help The Banks Sell Shares
at Much Higher Prices to The US Treasury?
What if the panic of 2008-2009 is not only over, but it was concocted by the biggest
players on Wall Street to get a trillion dollars from the US Treasury and taxpayer?
Too cynical? I don't think we can be cynical enough where so much money is at stake.
The rally looks good, except for volume. Even if program trading by the biggest
players like Goldman Sachs is playing a big role in the advance, we should enjoy the
ride. My guess is that banks stocks are rallying with very heavy volume, unlike
the rest of the market, because Wall Street bankers have been let in on a little secret,
namely that Obama will try to get Congress to approve the government's buying of
common shares, instead of preferred shares this time around, in Bank of America,
Wells Fargo, CitiGroup and any other banks that "fail" the stress test and
require
new capitalization. This would explain the program trading that lies behind
much of
the rally.
See my Blog on the subject:
- http://www.tigersoftware.com/TigerBlogs/April-25-2009/index.html
See "Inverted Head and
Shoulders Patterns in The DJI: 1939-2003".
Last signal B12,
NYSE A/D Line uptrend and at flat, well-tested resistance
All 3 internal strength indicators are rising above their rising
ma.
NYSE Volume is low.
NASDAQ The NASDAQ has reached and
fell back from the resistance of its 200-day ma.
Volume is higher than recently.
NASDAQ-2 Accum. Index is still above
its 21-day ma. Turns by the AI back below its 21-day
m gave very good sells this past year.
QQQQ All indicators are bullishly
rising. There is some weakening of its strength
relative to the DJI. This may be explained by the fact that it is at its falling 200-day
ma.
SPY Closing Power is
still bullishly rising. A break in uptrend would be bearish.
The Accumulation Index
for the SPY is still above its 21-dma
GLD SLV US-Dollar
Though often these Gold and Silver move in opposite
directions to
the Dollar, all 3 are falling back from a falling 50-day ma. This is bearish.
DJIA
stocks: IBM CVX XOM JPM Higher priced DJI stocks with still
uptrending
Closing Powers. Weakness tomorrow would likely bring bearish breaks in these
uptrends.
--------------------------------------------------------------------------------------------------------------------
Recent Hotlines
5/3/2009
The last Peerless major signal is a Buy B12 and lots of stocks look bullish. Most
are above a rising 50-day ma with positive
and rising Accumulation Index and Closing Power
values.
Ordinarily, I would not be so concerned about the market's health if volume was
higher
on the present rally
and if the DJI did not still show a pattern of lower highs and lower lows.
Moreover, politics is a
wild card. We do not know what the banks' "Stress Tests" will show
when released on
Thursday. What else have the banks not disclosed?
The concern about low volume may be excessive because so much trading is now occurring
in NYSE stocks off the
NYSE. Accordingly, volume on the NASDAQ may be a better measure of
the amount of trading
volume. It is
actually rising slightly.
Coming back to essentials, what is defintely the case is that (1): the Closing Power's
uptrends for the DIA,
QQQQ and SPY are still in tact. So, professionals are still buying shares
much more than they are
selling. And (2) breadth, NYSE Advances-Declines, is very positive.
There are no other
cases back to 1942 of so many days over a six week period during which the daily
ratio of NYSE advances
to declines was 5:1. Moreover, (3) technically stocks are mostly above
rising 50-day ma with
confirming internals and (4) they look cheap compared to what they were a
year ago.
Inverted Head and Shoulders Patterns in History
The chart pattern the DJI is now sketching out shows an emerging inverted head
and shoulders' pattern.
A decisive breakout closing past the neckline, 8200-8300, is
still needed.
These price patterns in the DJIA when completed are quite reliably bullish.
And even when they fail
at the neckline, a bull market is still not too far away, after another
test of the right
shoulder's nadir or a nominal new low. We can learn a lot by looking
at these cases.
Perhaps, the most important discocery I have made looking back at such
patterns for the DJI is
that volume does not always increase dramatically on the rally or
when prices get past
the necklines of these patterns, yet prices rise anyway very bullishly.
This is contrary to the
conventional wisdom among technicians. To see such lower volume
cases, in the link
below, look at April-May 1939, August 1950 and June 2003
(after the breakout
above the neckline.) Compare these cases with those there were very evident
increases in volume:
July 1949, briefly in November 1957, November 1962, January 1967,
January 1975, April
1978 and January 1990. The market rallied with or without a big volume
rise once the neckline
was exceeded.
Look at the study I just finished here:
http://www.tigersoftware.com/TigerBlogs/May-3-2009a/index.html
Another aspect of inverted head and shoulders pattern is clear in all the cases
where we can examine
both the P-Indicator and the Accumulation Index. In every case, when
the DJI was running up
to the breakout or broke out above the neckline, the P-Indicator was
making a 6-month high
and the Accumulation Index was above +.25: July 1949. August 1958,
November 1962, January
1967, Janaury 1975, April 1978, late January 1991, April 2003
( 2 months before
neckline was exceeded. The very high levels of the P-Indicator now
and the Accumulation
Index are therefore bullish, though we need to watch the Accumulation
Index fpr the NASDAQ to
see if it breaks down below its 21-day ma before the DJI breaks out.
If there is a move past 8300-8400, we should see the P-Indicator and the Accumulation
Index move to new
highs. If they do not, it will be a warning. In that case and the DJI
does not make such a
confirmed breakout, take your trading cues from the NYSE A/D Line
uptrend. A
violation of it will then be bearish and suggest another retreat, either to re-test
the DJI lows near 6500
or lower band at 7500. Watch and use in the same way the NYSE A/D
Line uptrend if there
is no closing breakout past 8300.
See "Inverted
Head and Shoulders Patterns in The DJI: 1939-2003".
Last signal B12,
NYSE A/D Line uptrend and at flat, well-tested resistance
All 3 internal strength indicators are rising above their rising
ma.
NYSE Volume is low.
NASDAQ The NASDAQ has reached and
fell back from the resistance of its 200-day ma.
Volume is higher than recently.
NASDAQ-2 Accum. Index is still above
its 21-day ma. Turns by the AI back below its 21-day
m gave very good sells this past year.
QQQQ All indicators are bullishly
rising. There is some weakening of its strength
relative to the DJI. This may be explained by the fact that it is at its falling 200-day
ma.
SPY Closing Power is
still bullishly rising. A break in uptrend would be bearish.
The Accumulation Index
for the SPY is still above its 21-dma
GLD SLV US-Dollar
Though often these Gold and Silver move in opposite
directions to
the Dollar, all 3 are falling back from a falling 50-day ma. This is bearish.
DJIA
stocks: IBM CVX XOM JPM Higher priced DJI stocks with still
uptrending
Closing Powers. Weakness tomorrow would likely bring bearish breaks in these
uptrends.
====================================================================================
4/30/2009 8168.12
Resistance Reached. No Peerless Sell Signal Yet. But We're Much Closer to A
Resolution.
The Closing Power uptrends are all still intact. So, is the NYSE A/D Line uptrend.
The Buy B12 Has Not Been Reversed.
Often a declining 30-wk ma is bearish. The DJI has reached that point and turned
down today
on an increase in volume. Similarly, a 200-day ma is bearish. The NASDAQ
reached that level
today, but did not close down for the day. I definitely want to continue holding our
high accumulation,
strong Closing Power stocks.
http://www.tigersoftware.com/TigerBlogs/April-30-2009/index.html
Unfortunately, the DJI closed 100 points below its
opening. This shows professionals
were selling into strength. This is the opposite of what we want to see to remain
bullish.
Weak breadth tomorrow often leads to spill-over weakness on Monday. So, unless there
is strength from the opening or a strong recovery in the second half of trading tomorrow,
it looks like the NYSE A/D Line uptrend and the uptrends of the Closing Powers may be
violated before the DJI can breakout on a closing basis over the 8250-8300 resistance.
You may want to anticipate this if you are a short-term trader. In that case you
will take
comfort in the fact that the DJI's Accumulation Index has closed today slightly below
its 21-day ma. If the DJI were now in extreme bearish mode, (which is not so because
we are no longer down more than 40% from the 12 month high), this last event would be
a Sell S6. Another thing: the new Peerless manual, which I am fitfully working
on and
will release when it's done, mentions the importance of the fifth test of resistance as
most
often being a key pivot-point of reversal.
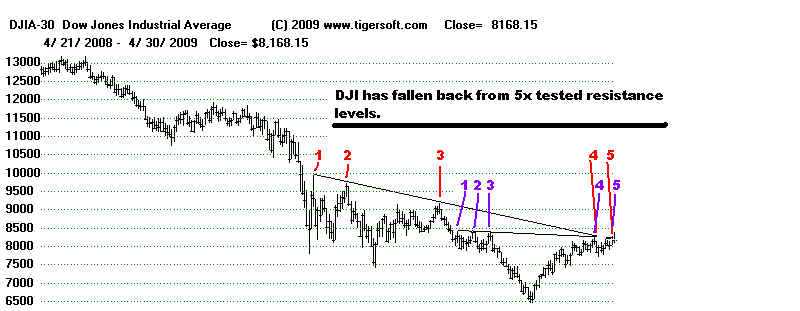
Watch the Accum. Index and Its 21-Day MA
I want to stress that penetrations of the AI below its ma often give very good sell
signals,
especially when the 50-day ma is declining. That is only true here for the DJIA and the
DIA.
It is not yet true for the NASDAQ, SPY or QQQQ.
Peerless has always been an intermediate-term system, so I have to say wait for a clear
break
in the NYSE A/D Line uptrend. Going back to 1965, the DJI, on average, is up
59.1% of the
time over the next two weeks, but for the month of May rises only 47.7% of the time and
only 45.5% of the time over the next two months. By itself, this suggests that there
could be more
upside action.
DIA (DJIA-ETF below) - Closing Power is bullishly rising.
The DIA is falling back from its falling 30-week ma. It could not
achieve a decisive breakout past its flat neckline resistance.
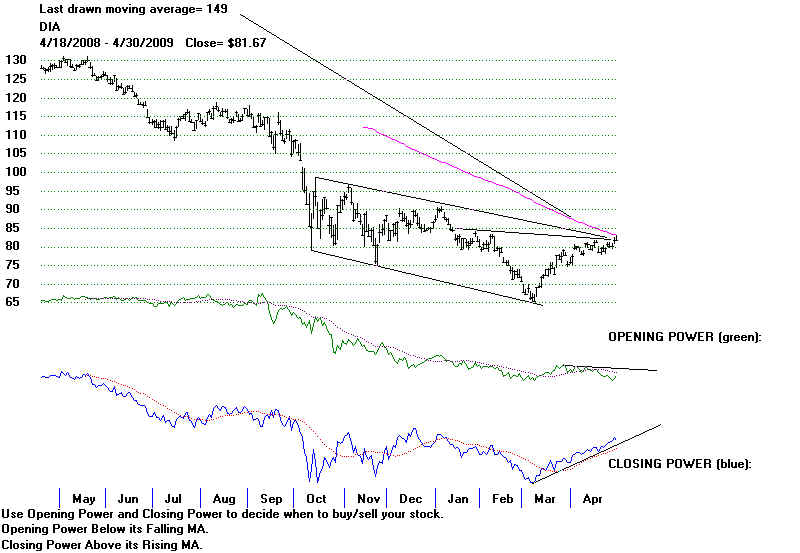
4-29-2009
DJI Chart with superimposed signals. We are using the normal more,
not the bearish mode,
as the DJI is back above a line (not drawn below) that is 40% down from the highs of last
April.
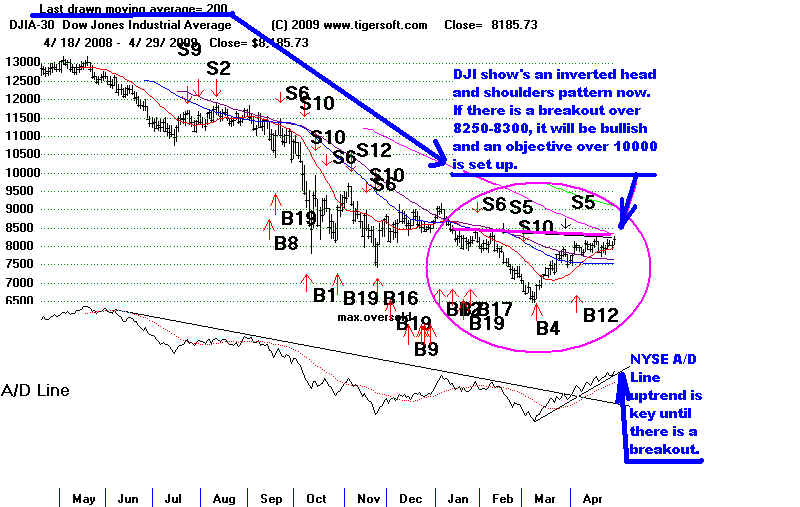
We saw really excellent breadth today, There were 2597
up on the NYSE
and only 493 decliners. Up volume was 8x down volume. I have previously
said that
this rally is special because of the high number of days when daily NYSE advances were
5x the number of declining stocks. I have also said that such very good
breadth goes
a long way to make up for the generally low volume in the intermediate-term.
Eventually
the low volume will prevent the rally from surpassing a resistance line. That target
will be 9000 if we get a clearer breakout closing past resistance. There is a good
chance
the 8250 intra-day resistance will be exceeded tomorrow at the
close. That will make
the inverted head and shoulders pattern take shape so that others will see it, become
more sanguine and buy.
The DJI still will then have to get past its falling 200-day ma at 8326 and then the
falling
200-day ma at 9100.
The DJI's internal strength indicators are all too high now to make us expect a big
reversal downwards. For example, they are much higher now than they were right
before
the DJI retreated in November 1974, from a similar resistance and then made a new low.
2009 11/7 before
decline
21-dma-roc (annualized momentum) =99.6%
74.3%
P-Indicator =
+66
124
P-ch =
+175 -31
IP21 (Current AI) =
.129 -.005
V-Ind =
222 0
OBVPct =
.275 .034
Right now, there's no way to rule out a pullback from the well-tested 8200-8250. A
break
in the NYSE A/D Line before the DJI surpasses 8300 on a closing basis would signal a
retreat
to the lower band near 7600, at least, in the next move for the DJI. A break in the
NYSE A/D
Line uptrend would also have a ripple negative effect on many of the secondary stocks that
are doing so well.
DJI-Signals Last signal B12, NYSE A/D Line
uptrend and at flat, well-tested resistance
DJI-1 All 3 internal strength
indicators are rising above their rising ma.
DJI-2 Volume is low.
NASDAQ The NASDAQ's NASDJI relative
strength indicator remains very positive.
But the NASDAQ is approaching its declining 200-day ma now at 1754,
41 points or 3% higher.
DIA Closing Power is bullishly
rising. The DIA's Closing Power is bullishly ahead of
its price line.
QQQQ All indicators are
bullishly rising. There is some weakening of its strength
relative to the DJI. This may be explained by the fact that it is at its falling 200-day
ma.
SPY
Closing Power is bullishly rising.
GLD SLV
DJIA stocks: IBM CVX XOM JPM
4-28-2009 The DJI's chart shows that a
very bullish inverted head and shoulders
pattern has emerged. It will take much more volume to confirm a breakout above the
8300 neckline. But if that pattern is bullishly completed with an upside breakout,
in keeping with the now active Buy B12, then 9000 and 10,000 become realistic upside
targets
while lower priced high accumulation stocks run upwards, as in a new bull
market.
Unfortunately, one severe day's decline with very bad breadth will cause the
NYSE A/D Line uptrend to be violated for a judged Sell S6. In these circumstances,
market
history shows a decline to the lower band and 7500 is almost a certainty, with an outside
chance for a deeper decline back to 6500. The pattern's symetry requires an upside
breakout
in less than a week. Seasonality is bullish for a week. But in it is
distictly bearish for the
next month or two. Since 1965, the DJI has risen only 47.7% of the time in the
month
after 4/28 and after two months, the DJI is only up 43.2% of the time. Because the
Closing
Power is still uptrending for the SPY, QQQQ and DIA, I would give the DJI the rest of the
week to mount its rally. If it does not, I would assume the resistance is just too
much at this time.

DJI-Signals
DJI-Volume
NASDAQ
DIA
QQQQ
SPY
See how breaks in the NYSE A/D Line uptrends before a horizontal breakout
brought declines back to at least the lower band, but in 1974 and 2003 back to the
previous
lows.
1957-1958 1966-1967 1974 1979-1980 1982 1990-1991 1998 2002-2003
The 50-day ma is resistance, especially if the Accumulation
Index is negative.
GLD SLV
The DJI-30 is being boosted by the rising Closing Power Lines of the higher priced
DJIA stocks: IBM
CVX JPM

A reader forwarded this piece to read about the ZOMBIE
BANKS.
http://www.gamingthemarket.com/2009/04/not-too-big-to-sink.html
Thanks!
4-27-2009
The DJI has reached resistance at 8100. The last two day's hourly chart looks
bearish. Do you see the head and shoulders' pattern with the neckline at
7980, the
lows of today? We have no new Sell Signal. I have said "stay with the
rally as long as
Closing Powers of the DIA, SPY and QQQQ are above their uptrends. And also abide
by the rising NYSE A/D Line uptrend." But once, these are broken, there will
likely be
a bigger pullback. Short-term traders often play a resistance-level, like
8100, as a place to sell
short, provided they are ready to cover if there is a price breakout. They play
support levels,
like 7810, as places to buy, provided prices rebound and do not pullback more. From
an
intermediate-term perspective, I would say we should still stick with the rally. The
market might
have sold off a lot more based on fear of a deadly and economically paralyzing pandemic
emerging. But it did not. That left stocks in stronger hands if another good
rally starts.
It is important that the next rally succeed in taking the DJI over 8100-8200.
There is more and more criticism of Geither's TARP-II as favoring banks excessively.
Wall Street needs confidence badly. But, I don't see how making taxpayers have to
risk a trillion more
to bail out the banks that are "too big to fail" will help the overall system.
Anyway you look at it,
the facts still remain that it was the biggest banks' highest executives' greed that
caused the
financial bubble and bust. There are better alternatives to making credit again
become available
to consumers, buisiness and Main Street. But the FED and the Treasury see things
only through
the eyes of the biggest bankers. If I am right, then I fear that even a breakout
above 8200 will only
mean another month's relief rally rather than a new bull market. The smaller
high accumulation
stocks are worth holding for that possibility.
But, the rally may stall out in a matter of days as it did in
November 1974. The long 1973-1974
could not end with a "V" bottom and required a re-test of the lows after
resistance proved too
much for the first good rally, in October 1974. We will watch the NYSE A/D Line
uptrend closely.
See DJI-1
DJI -1974
See below how the developing head and shoulders pattern failed in November 1974.
The breaking of the NYSE A/D Line was the key to getting out and waiting for a re-test
pf the lows.
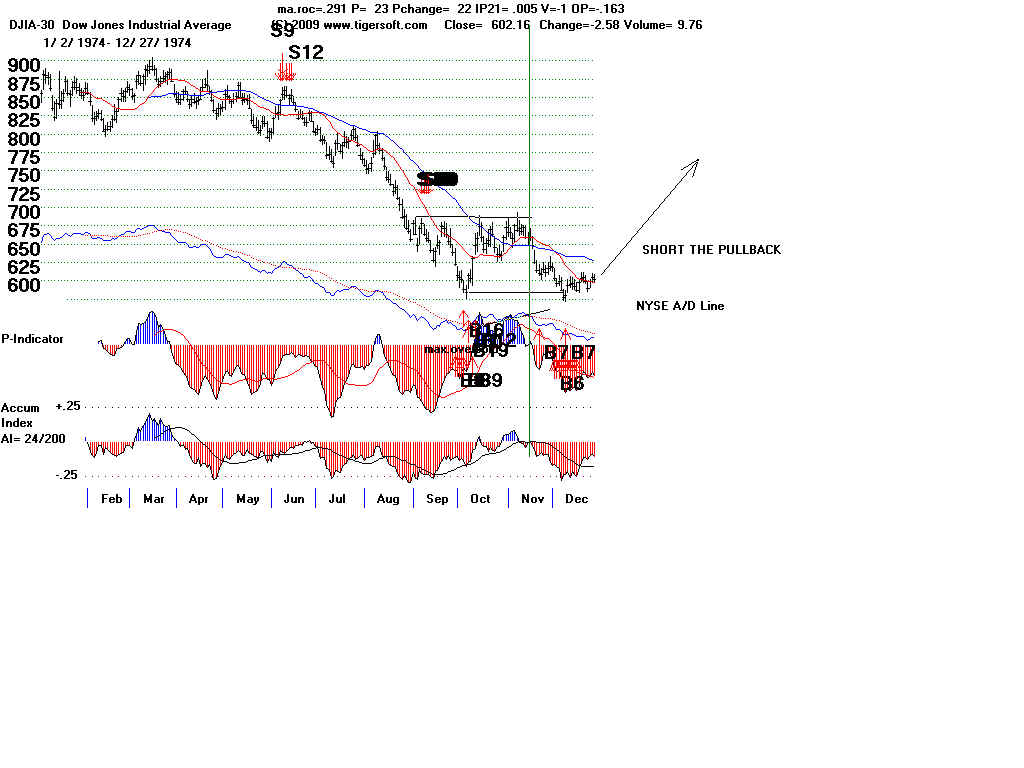
=========================================================================================
4/26/2009
Obama Is Pumping Financial Stocks and Wall Street Up.
He Is Counting on It Trickling Down To Main Street before Hyper-Inflation Starts.
DJI Has Readed A Key Resistance Level. Low Priced Stocks' Advances Suggest
A New Bull Market.
The DJI has now rallied and tagged its 4x tested horizontal resistance at about
8258.
Very often there is a pullback on a fourth test, with the fifth test being the decisive
run that either produces a breakout or a retreat.
If there is a clear breakout and DJI close above 8300 with an increase in volume,
I would treat that as a bullish inverted head and shoulders pattern and probably
a Buy B10. This is a reliably bullish pattern if, say, 8300 is exceeded on higher
volume.
That the P-Indicator stands at a +543, the IP21 (Current Accumulation Index)
is now +.129 and the Opct is +.236 lends confidence to any breakout.
Even if there is a shallow retreat by the DJI back 8859, possibly occassioned by the fears
that we may see another flu pandemic like 1918, 1957
or 1968, I doubt if a bigger decline
will unfold. But watch the NYSE A/D Line uptrend just in case. In 1918 and
1968 the
DJI rose. In 1957 it fell. If the DJI does not achieve a breakout first, then
we have to
do some selling, especially the DIA, when either the NYSE A/D Line or the Closing Powers'
uptrend lines are violated.
DIA-2003 If the DJIA breaks out over 8300, I would it expect to
behave similarly to how the DIA moved up when it cleared the
89-91 barrier in May 2003. When the Closing Power finally does
break its rising uptrendline, look for a decline no deeper than the
50-day, or possibly the 65-day ma.
DIA - 2003 - Role Model for Market Now
DJIA - Superimposed Peerless Signals
The signals below are based on using the
40% down from the 12 month highs as the dividing line
between the
normal Peerless (above it) and the extremely bearish mode (below it). It may be
that
we should
use a different way to switch out of the Bearish Mode. One might be to require a
high
volume advance
before leaving the bearish mode. That has been absent here. We might want to
use
a move to a
new recovery high or a move past the 149-day ma to switch out of the bearish mode.
If these
approaches were used, then there would have been a Sell S3 on April 13 with the DJI at
8057.81.
We mentioned that, but shyed away from it in otder to give more chance for the
rally to
run its
course for averages and indexes other than the DJI-30. Breadth has been especially
good.
That has
enabled us to make some nice gains in stocks that look like the classic cases from the
Explosive
Super Stocks Book
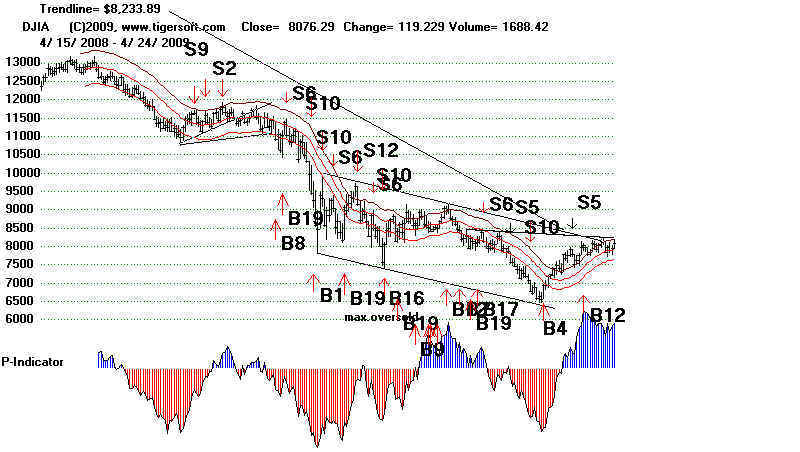

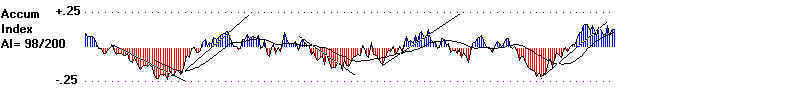 NYSE volume declining
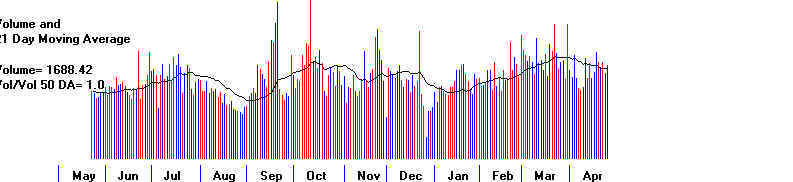
|
4/23/2009 As I write this, 5 hours before the Openng. the Futures are up suggesting a recovery. Today the Closing Power for the DIA turned up sharply rather than break down. And, bullishly, the DJI did not drop below its rising 21-day support. The first decline to the rising 21-day ma, as we are now seeing, usually acts as good support. So, we are advising that traders take the small profits in the short of DIA at 80. So cover (This paragraph has been re-constructed. It was dropped by mistake in the re-ordering of the paragraphs on 4/24/2009.) The DJI has stalled out at the 8000 resistance. It has entered a very narrow trading range with neckline support at 7750 and resistance at 8260. An upside breakout would be very bullish. That would confirm the wonderful breadth we have seen. While the Closing Powers of the DIA, QQQQ and SPY are rising an upside breakout is favored. on the other hand, volume for the exchanges and the NASDAQ have been too low to make the rally look like the beginning of a bull market. So, we have to wait for prices to end the DJI's present stalemate. While we are waiting, we are pleased that low priced stocks under high accumulation are being bid up. The bottom of this page shows some of them. If the NYSE Advance/Decline Line in broken below, we will have to expect a further retreat. But even then, the P-Indicator and Accumulation Index are so positive, only a shallow decline would seem likely, possibly only 7500, before another rally develops. What History May Teach Us Now The DJI has rallied for six weeks. It is up 24.2% since 3/9/2009. There may be more to go to the upside and then to the downside if we judge this by making simple comparisons between the current bear market and the bear market of 1929-1932, although it should be noted that we have now had six intermediate-term declines to new lows, as also occurred in the longer bear market. If we can say that more trading is now compressed in half the time, it might be significant that we have had six separate down-waves. That's all there were from 1929 to the 1932 bottom. But arguing that the current bear market could last much longer, we have to note that this bear market has lasted only 18 months, while the 1929-1932 bear market lasted 32 months. Bear market rallies in the earlier period averaged 10 weeks. The present rally has lasted 5 weeks. Back in the 1930s, bear market rallies after the first big recovery ranged from +23.4% to +35.0%. Ours now is only slightly more than the minimum of 23.4%. Conclusion: If we believe that the faster flow of information has not compressed the time of a market's moves, then there is likely more upside potential short-term and, after that, more downside threat, too, once this rally is over. Since the DJI's top on 10/09/2007 we see the following swings: Top 10/9/2009 14164.53 1st Decline 10/9/2009 - 11/26/2007 14164.53-12743.44 10.0% length= 6 weeks Ist Rally 11/26/200 - 12/10/2007 12743.44-13727.03 +7.7% length=3 weeks 2nd Decline 12/10/2007 - 3/10/2008 13727.03 - 11740.15 14.5% length = 12 weeks 2nd Rally 3/10/2008 - 5/2/2008 11740.15 - 13040.00 +11.1% length = 7 weeks 3rd Decline 5/2/2008 - 7/15/2008 13040.00 - 10962.54 15.9% length = 10 weeks 3rd Rally 7/15/2008 - 8/11/2009 10962,54 - 11782.35 +7.5% length = 4 weeks 4th Decline 8/11/2009 - 10/27/2009 11782.35 - 8175.77 30.6% length = 10 weeks 4th Rally 11/20/2009 - 11/4/2009 8175.77 - 9625.28 +17.7% length = 2 weeks 5th Decline 11/4/2009 - 11/20/2009 9625.28 - 7552.29 20.5% length = 6 weeks 5th Rally 11/20/2009 - 1/2/2009 7552.29 - 9034.69 +19.6% length = 6 weeks 6th Decline 1/2/2009 - 3/9/2009 9034.69 - 6547.05 27.5% length = 9 weeks 6th Rally 3/9/2009 - 4/17/2009 6547.05 - 8131.33 +24.2% length = 5 weeks. |
|
DJIA CHART: 1973-2009 See below the sprawling Head and Shoulders Pattern 1997-2009 with a neckline of 7500 and and a potential right shoulder apex target of 11700. Note also how far up the market has risen without a correction since 1982. Has the last 25 years all been a bubble? Scary! Below 7500 will be trouble. That's why we show these charts!  Source: http://www.the-privateer.com/chart/dow-long.html |
More Research Materials Here and Shown Below
1. New Years: The Year after A Presidential Election: 1917-2005
2 Februarys and Marches in Year after Presidential Election Years
What Happens When There Is No October Bear Market Bottom?
3. EURO and GOLD
4. Lessons from 1962
5. Bear Market Recovery Rallies: 1930-1933, 1937-1938, 1957-2008
6. Volume at Bear Market Bottoms
7 Fidelity Sector Funds' One Month Performance Ranking.
8 Seasonality and DJI
9 NYSE and NASDAQ New Highs and Lows.
10. 1929-1938 Charts with New Peerless Signals
11. Climax Lows
12. Extreme Bear Markets
13. Bear Market Comparisons
14. Interesting New Highs: 4/8/2009
Non-Public Blogs
History of QQQQ since 1999: TigerSoft's Closing Power and Day Traders' Tool
Calling Significant Bottoms in The 1930s.
TigerSoft Charts' Signals and Internal Strength Indicators
New On-Line Instructions for TigerSoft,
See TigerSoft Data page for Hints and Research Links on TigerSoft signals and indicators.=====================================================================================
1. New Years: The Year after A Presidential Election: 1917-2005
Taken altogether, in the 23 cases since 1917, the DJI is more apt to stumble early in the new year
after a Presidential Election Year. The red data below shows that the first meaningful move is down
in 14 cases. But, in 8 cases it rose. In one case, it was flat. This suggests that if there is a decline
after a few days' rallying, the decline will likely last, at least until February 12. On the other hand,
if there is a rally, it is likely to last longer, at least to March 7th.
Blue=Up Red=Down
Year DJI Up or High or Low or down
at start
of yr.
---------------------------------------------
1917 96 2/5=92 . .. Trading range 90-99 and breakdown in August.
1921 73 3/11=72.30 ...recovery back to 80 on May 6 and down until August=64
1925 121 3/31=116.80 ...rally to 159 in October.
1929 307 3/26=296.50 ... June to Sept run, 297 to 382
1933 60 2/27=50.20 ...then rally to 110 on 7/19
1937 179 HIGH 3/10=194 ... decline back to 168, then up to 189 and then decline to 112 by Nov.
1941 131 2/14=117.70... May bottom=115.5 rally to 130 in August, then down
1945 153 HIGH 3/7=161.50 ...retest of 152 3/27 and then rally.
1949 175 2/25=171.10 ... bottom in June 162 and then rally to 200 in Dec.
1953 292 2/18=281.10 ...fell to 256 low in Sept and recovery.
1957 496 2/12=454.80 ...rally to 520 in July and down to 430.
1961 610 rallied steadily all year.
1965 870 HIGH 5/13=940 ... fell to 840 in July...rallies to 970
1969 950 2/26=906.80 ...rally to 970 in May and then down to 770 in Dec.
1973 1230 steadily down to 6/25=869, then rally to 985 in Oct...then down.
1977 1000 steadily down to 10/25=800
1981 978 2/13=931.60... rally to 4/28=1017 and then decline to 820 in Sept.
1985 1200 steadily up all year.
1989 2150 steadily up all year.
1993 3300 steadily up all year.
1997 6500 3/11=7085..decline to 6499 in April and the up to 8200 in July.
2001 10775 3/22=9389 ... rally to 11257 and down to 8250 in Sept
2005 10800 4/19=10127 ...then gradual recovery.
2. Aprils and Mays are Bullish Months but
June is usually a down-month
in The Year After A Presidential ElectionBreaking the data down for where we are in the 4-year Presidential Election year cycle
shows the bearish and bullish political factors more clearly at work on the market. Just as
the incumbent Party may be expected to try hard to stabilize the market in the year before a
Presidential Election, it is likely it will make the wrenching changes in the year after the Election
and seek to produce a run-up in the stock market in the 2nd and particularly the 3rd year of
the cycle. That certainly emerges from Arthur Merrill's research.
By this theory, we should expect Obama to do his "bashing" of Wall Street executives
now and blame the Bush Administration for the consequences. And that is what is in the news.
Example. Obama Blasts Wall Street Bonuses - BusinessWeek This typically starts after the
the Inauguration. The data show this. Januarys in the year after a Presidential Election
are about as bullish as all Januarys since 1965, 1.5% avg gain versus 1.4%, respectively
and showing 70.4% and 67.4% respectively. But Februarys and Marches in the Presidential
Election year are much worse for stock prices.
Years after A Presidential Election
In 1917, 1921, 1925, 1929...2001 and 2005, Februarys produce average DJI declines
of 1.4% and rallies only 34.8% of time. In 7 of these 24 Februarys, the DJI fell more than 3.4%.
When January was down as it was in 2009. Februarys were twice as likely to decline when
January was down. When January was down more than 4%, 1957, 1973 and 1977,
February was always down. This takes on added significance when we consider that January 2009
was down more than any January on record, a whopping 8.8%
Marches generally do better than Februarys when all the years since 1965 are considered.
But they are distinctly negative in years after a Presidential Election. .While their average change is
about zero, these Marches produce gains only 39.1% of the time. When the previous February was
down, which is true 65.2% of the time, Marches were down 10 times and rose only 5 times.
Year After Presidential Election Year
Month By Month Pct Gains: March to June
See the charts for the bearish years at http://www.tigersoft.com/SpringTops/
March 31 April 30 May 31 June301917 96.70 +6.3% 93.20 97.40 95.40 1921 75.80 (-0.7%) 78.60 73.40 68.70 1925 116.80 (-4.4%) 120.00 129.90 129.20 1929 308.90 (-2.7%) 319.30 297.40 331.30 1933 55.40 +7.8% 73.10 UP 90.00 98.10 1937 186.40 (-4.3%) 174.30 174.70 169.30 1941 122.70 (-0.7%) 115.50 116.20 123.19 1945 154.10 (-3.9%) 165.40 168.30 166.20 1949 177.10 +2.3% 174.10 168.40 167.40 1953 279.90 (-1.5%) 274.80 272.30 268.30 1957 474.80 +2.2% 494.40 504.90 503.30 1961 676.60 +2.2% 678.70 696.70 683.90 1965 889.10 (-1.6%) 922.30 918.00 868.00 1969 935.50 +3.3% 950.20 937.60 873.20 1973 951.00 (-4.3%) 921.40 901.40 891.70 1977 919.10 (-1.8%) 926.90 898.70 916.30 1981 1003.90 +3.0% 997.80 991.80 976.90 1985 1266.78 (-1.3%) 1258.06 1315.41 1335.46 1989 2418.80 +5.5% 2480.14 2440.06 2660.66 1993 3435.11 +1.9% 3427.55 3527.43 3515.08 1997 6583.48 (-4.3%) 7008.99 7331.04 7672.79 2001 9878.78 (-5.8%) 10734.97 10911.94 10502.40 2005 10503.76 10192.51 10467.48 10274.67 2009 7522.02 (-6%) ================================================================================================ 15 down 10 down 10 down 15 down 9 up 13 up 13 up 8 up When March was down April rose 9/15 of cases
|
|
|
4. Lessons form
1962 When JFK Challenged US Steel 3/3/2009 Study Bottom Fishing Lessons from 1962 Also A Time When Wall Street Felt Challenged by The President In the Spring of 1962, JFK scared Wall Street when he took on the head of US Steel, Roger Blough, about his raising steel prices at a time when Kennedy had just successfully pressured unions in the steel industry not to raise labor costs. "Within 24 hours Kennedy launched investigations by the FTC and Justice Department into collusion and price rigging by the steel companies." To further show the steel industries he meant business, JFK began to stop Pentagon contracts from going to the steel industry. In the background, the Cuban Missile crisis was gathering. It did not surface publicly until October. The bottom in 1962 was best called by the post-1942 Buy B16 and the crossing of the DJI above the 10-day ma. Note that the OBVPCT registered the biggest bullish divergence at the bottom. That is in keeping with the best way the 1932 bottom would have been called. 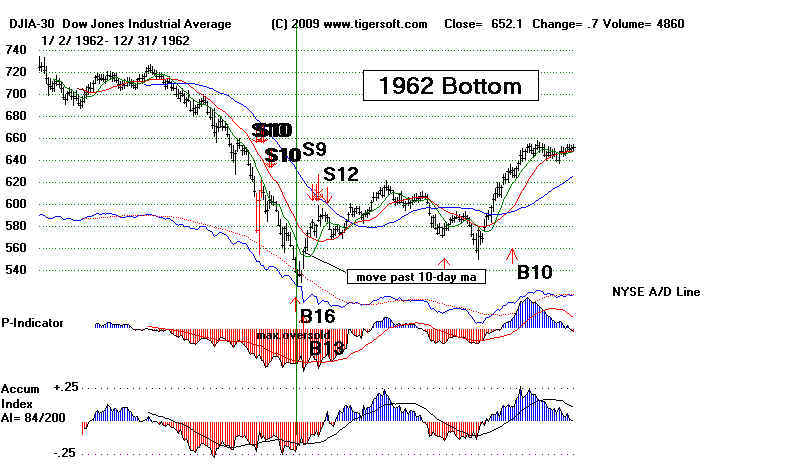 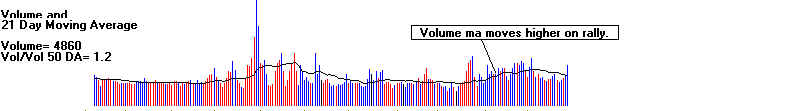 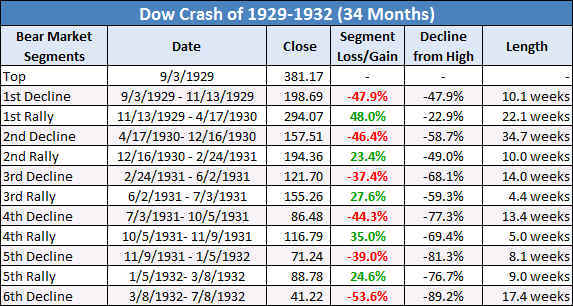 |
5. Bear Market
Recovery Rallies
1929-1937 and After 1957
Rallies in extreme bear markets can rally much further. 24% seems the limit,
unless it's the first rally in a bear market or it's the start of a new bull market.
1st day 23% up or more
2/24/1931 This was top and decline followed.
21-dmaROC= 1.762 LA/MA= 1.103 IP21=.10 OPct
=.50
1st day 23% up or more
6/24/1931 DJI rallied 3% more and then declined.
151.60 to 155.30
2.652
1.129 .087
.002
1st day 23% up or more
10/8/1931 DJI rallied 10% more before
resuming decline 105.80 116.80
-2.443
.97 -.107
-.311
1st day 23% up or more
3/8/1932 DJI immediately declined.
1.626
1.086 -.071 .
189
1st day 23% up or more
7/27/1932 DJI rallied from 51.30 to 79.90
2.248
1.143 .175
.23
1st day 23% up or more
3/16/1933 DJI next fell from 62.90 to 55.40, or 10%
and started bull market.
1.347
1.124 .084
.366
1st day 23% up or more
6/22/1938 DJI rallied from 123.90
1.056
1.095 .08
.235
Bottom Formation in DJI: 1962- 2008
Year
Percent up to Resistance
Flat top Number of
tests of lows in 6 months
1957-1958
8%
yes
9 (inverted head and shoulders pattern, 5 months)
1962
15%
yes
3 (inverted head and shoulders pattern)
1966
10%
yes
5 (inverted head and shoulder pattern)
1970
14%
yes
2 (rising bottoms)
1974
16%
yes
2 (double bottom over 3 months)
1978
5%
diagonal 3 (inverted head and shoulders
pattern)
1980
6%
yes 3
(over a month)
1982
9%
yes 3
(over 5 months)
1987
16%
yes 6
(over 3 months)
1990-1991
12%
yes 4
(inverted head and shoulders pattern, 5 months)
1998
9%
yes 4 (over
2 months)
2001
16%
yes 1 (over
1 month)
2002-2003
23%
yes 3
(inverted head and shoulders pattern, 8 months
|
7. SECTOR STRENGTH FIDELITY SECTOR FUNDS Use this study to monitor ever-changing sector strength. Twenty One Day GAIN - 6/10/2009 Now 37 of the 42 the Fidelity sector funds were up for last month. -Twenty-One Day Gain Strongest Pct Change Networking +15% Automotive +13% Electronics +13% Technology +11% Gold, Energy +10% Weakest Banking -6% Home FInance -4% 8. Seasonality and The Market June 10, 2009 1965-2008, the DJI has risen these percentages of the time: -------------------------------------------------------------------------------- 61% after the next 3 trading days. Avg Gain = + 0.2% 61% after the next 5 trading days. Avg Gain = + 0.3% 43% after the next 10 trading days. Avg Gain = - 0.3% 50% after the next 21-trading. Avg Gain = - 0.2% 50% after the next 2 months Avg Gain = -0.1% 59% after the next 3 months Avg Gain = -0.1% ============================================================================== 9. NYSE and NASDAQ New Highs NYSE and NASDAQ New Highs (note link) and http://online.wsj.com/mdc/public/page/2_3021-newhinyse-newhighs.html http://online.wsj.com/mdc/public/page/2_3021-newhinyse-newhighs.html http://online.wsj.com/mdc/public/page/2_3021-newhinyse-newhighs.html If you would like to see the stocks that make new highs each night - and that is a useful trading approach when used as described in our Explosive Super Stocks - use TigerSofts Power-Ranker and the data in HOTSTKS. The daily new high stocks are added each day. New New Highs Lows ------------------------------------------------------------------ 610 NYSE 6 2 6/10 NASD 21 6 6/9 NYSE 9 2 6/9 NASD 31 5 6/8 NYSE 8 1 6/8 NASD 25 1 6/5 NASD 13 1 6/5 NYSE 26 3 6/3 NYSE 13 1 6.3 NASD 27 1 6/2 NASD 29 3 6/1 NYSE 25 0 6/1 NASD 38 4 5/28 NYSE 8 1 5/28 NASD 19 2 ==================================================================================== 13. Bear Market Comparisons (Source: http://dshort.com/charts/bears/four-bears-large.gif )
|
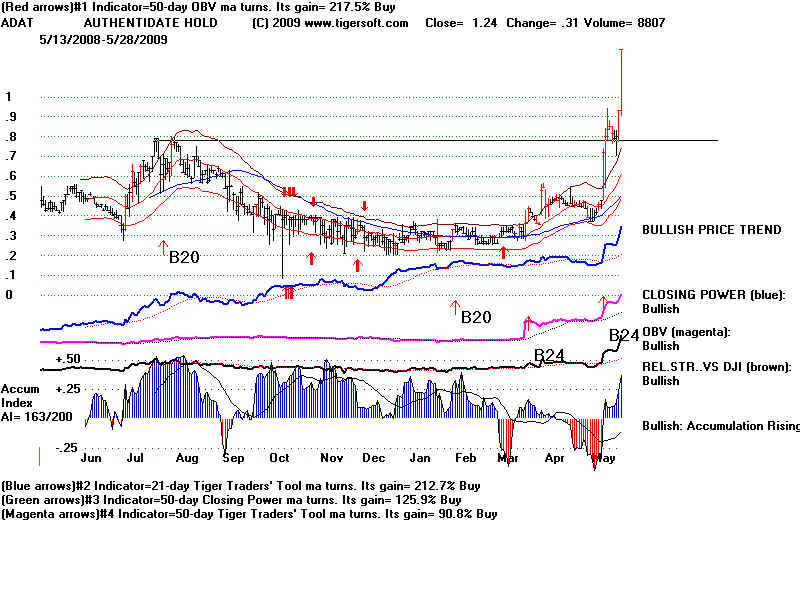


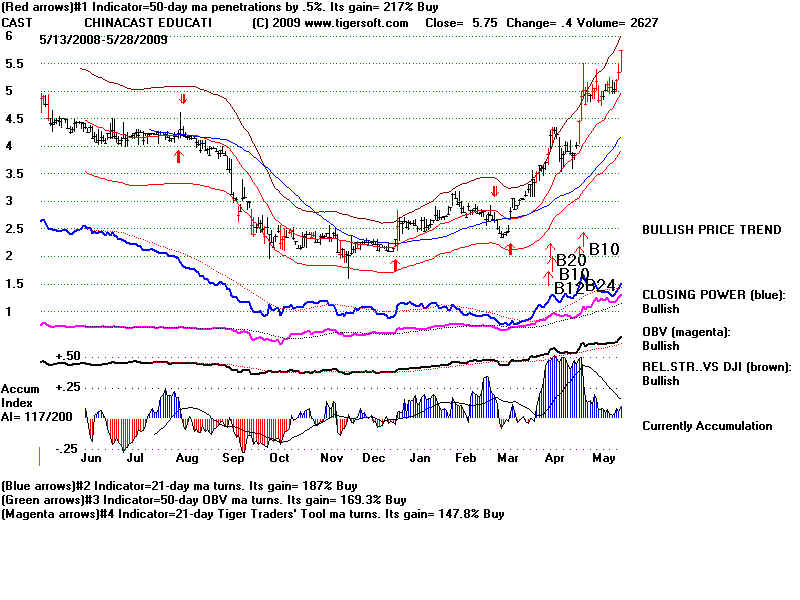
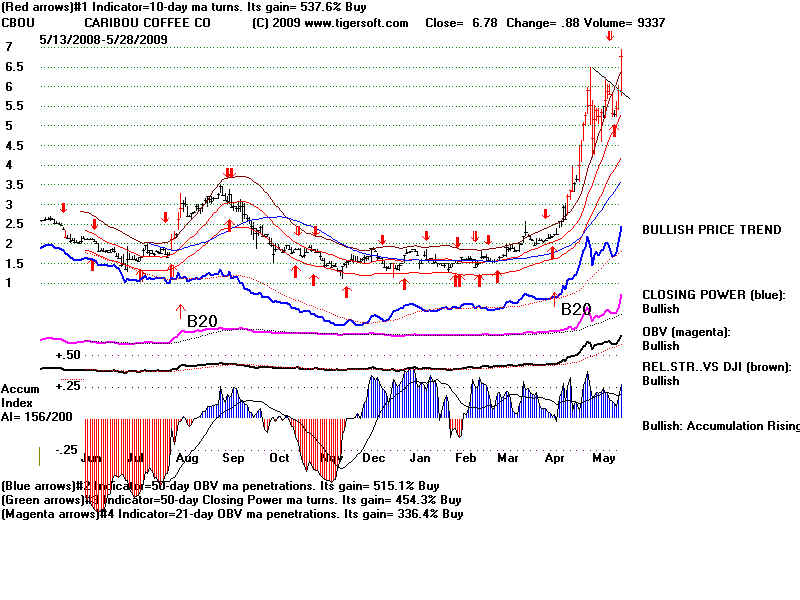

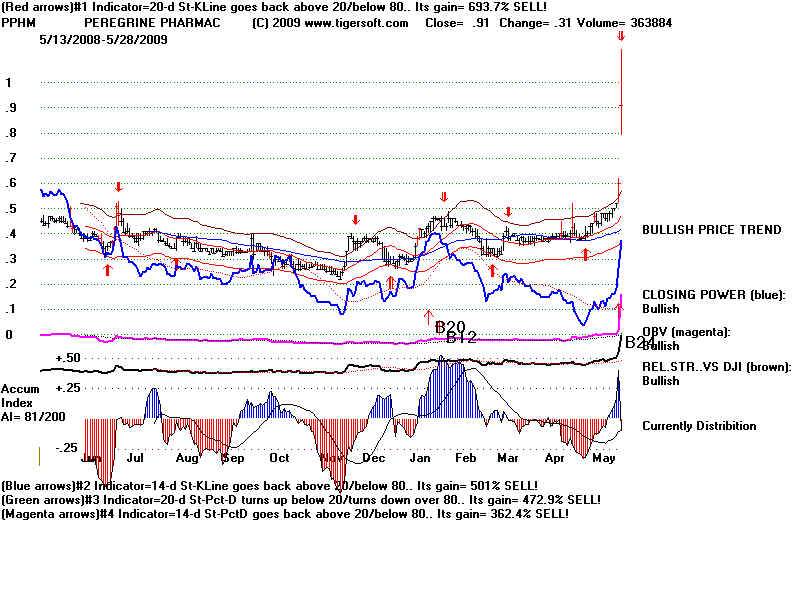
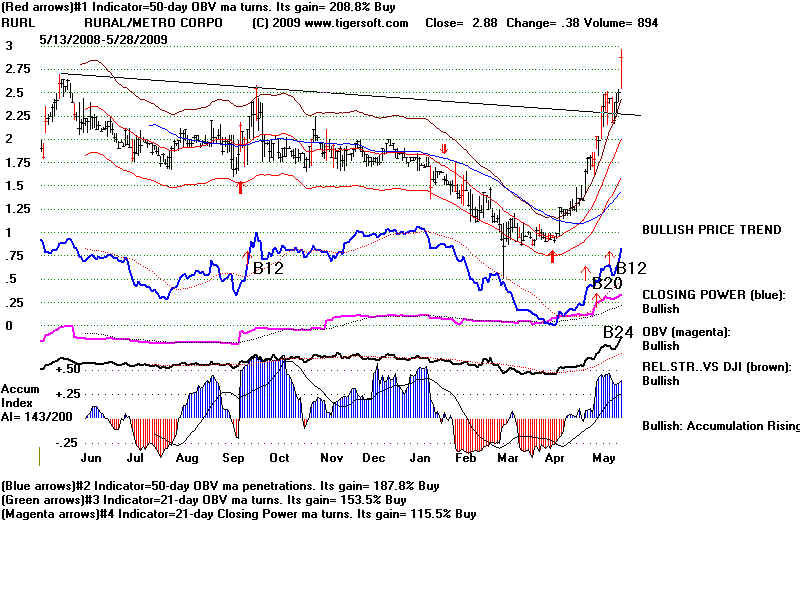
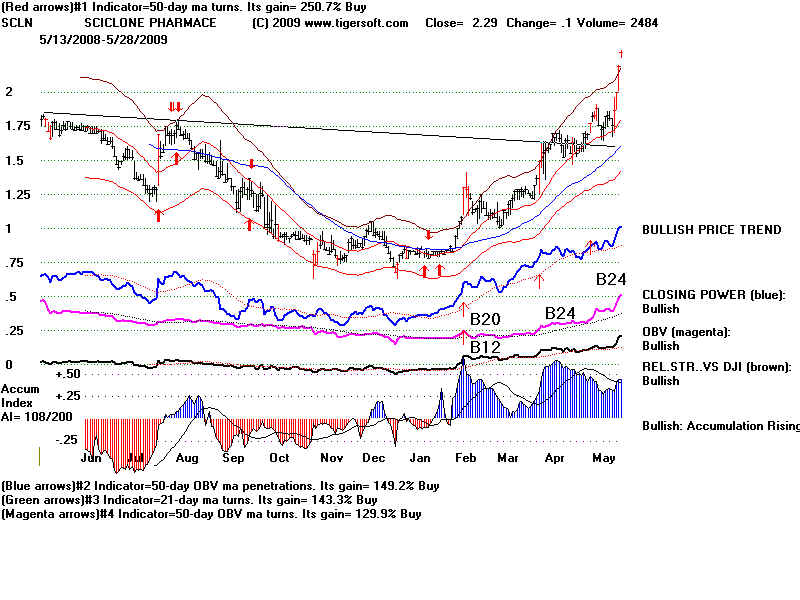
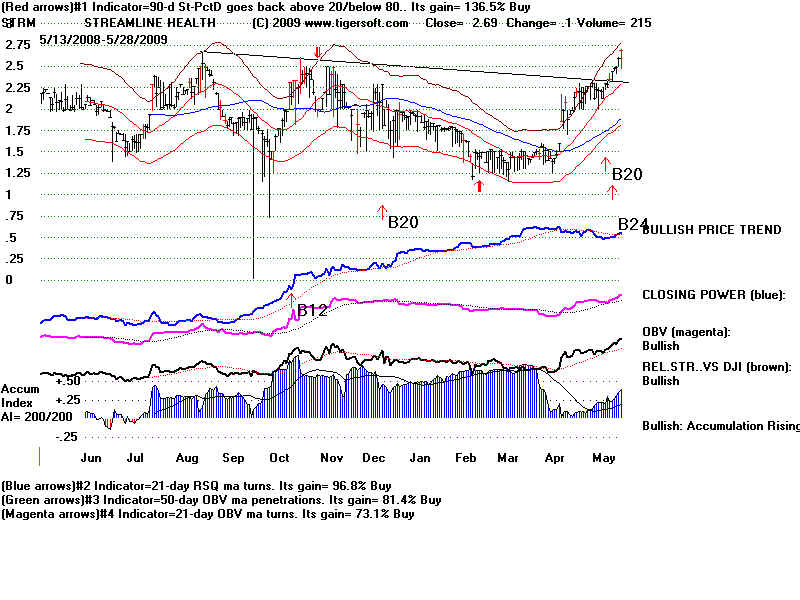
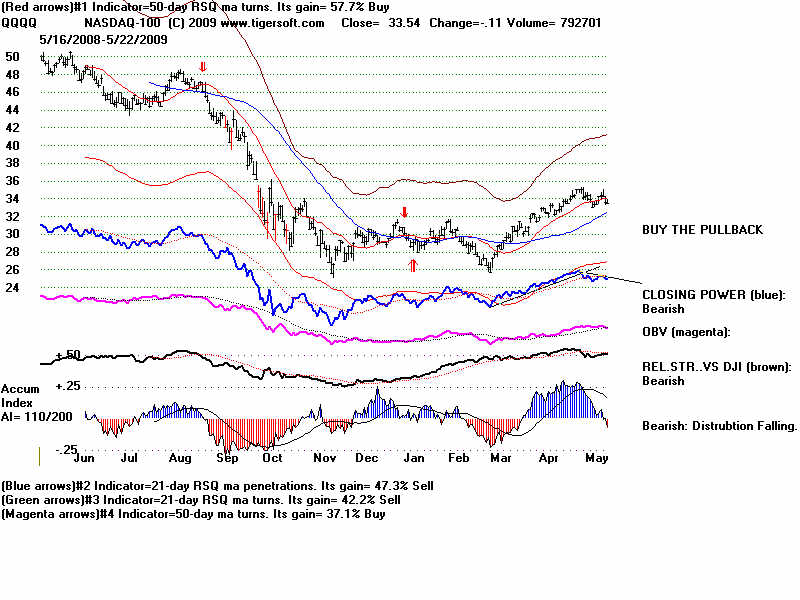
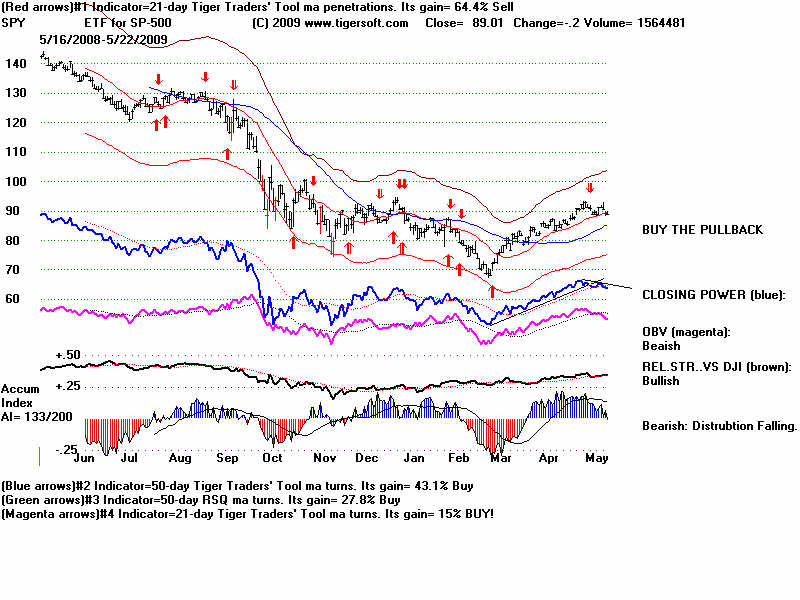
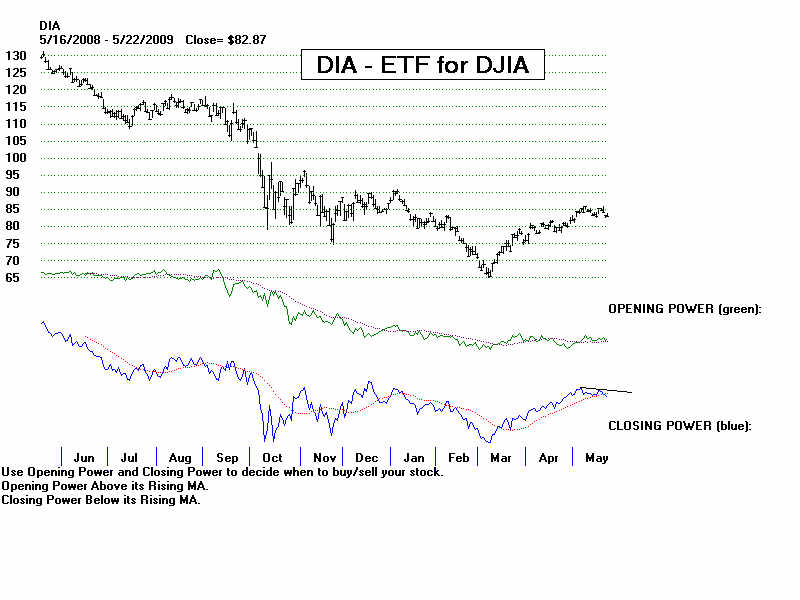
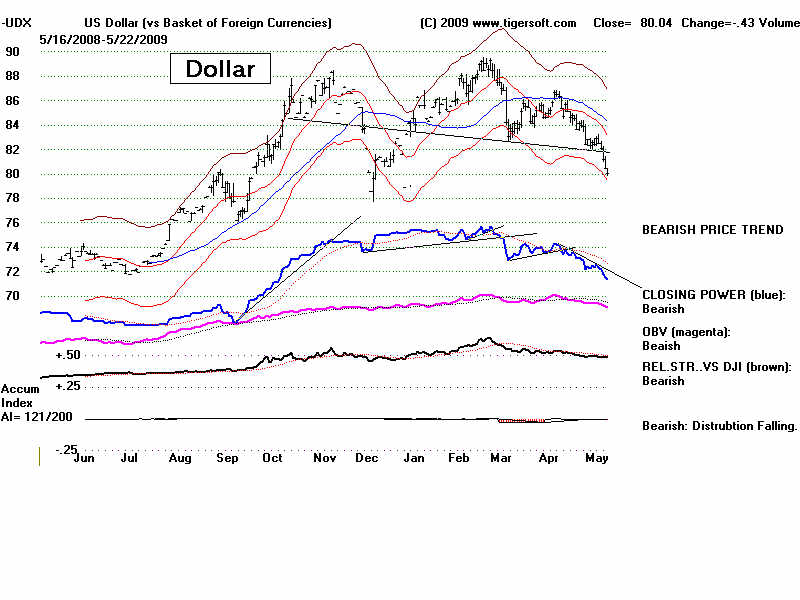
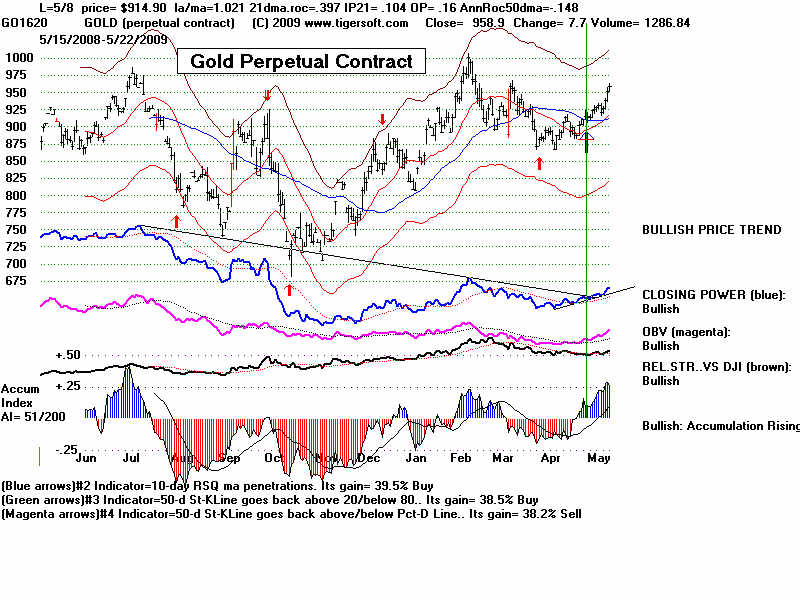
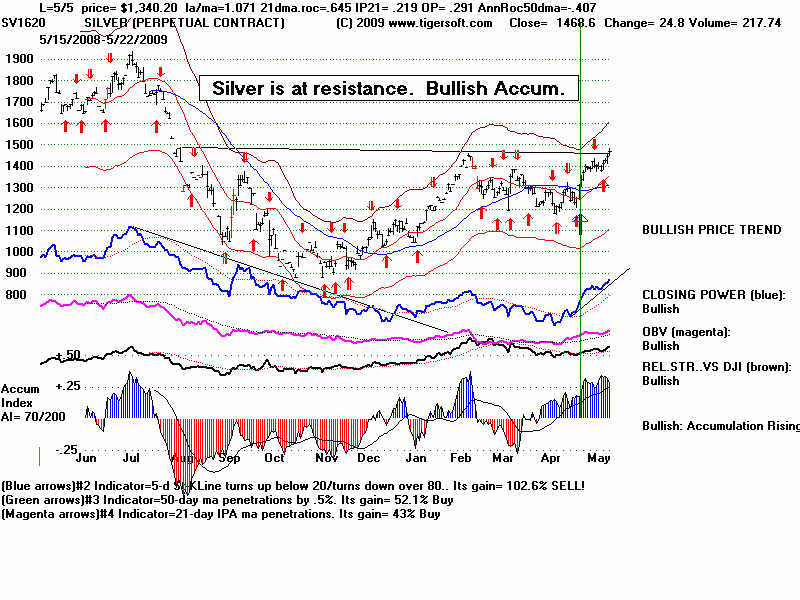
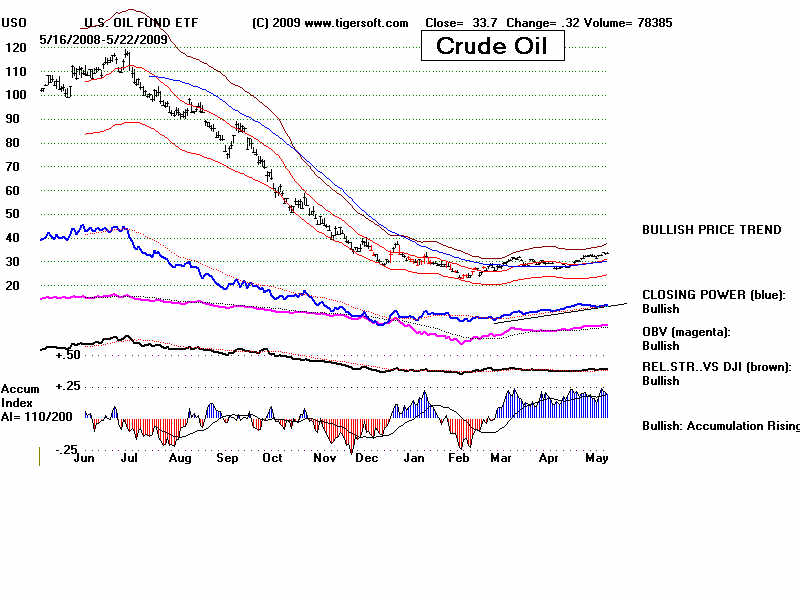
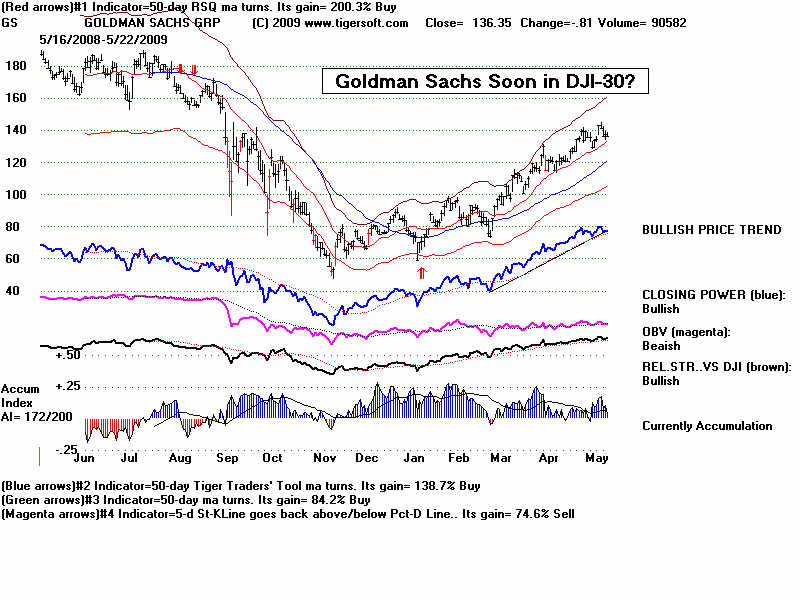
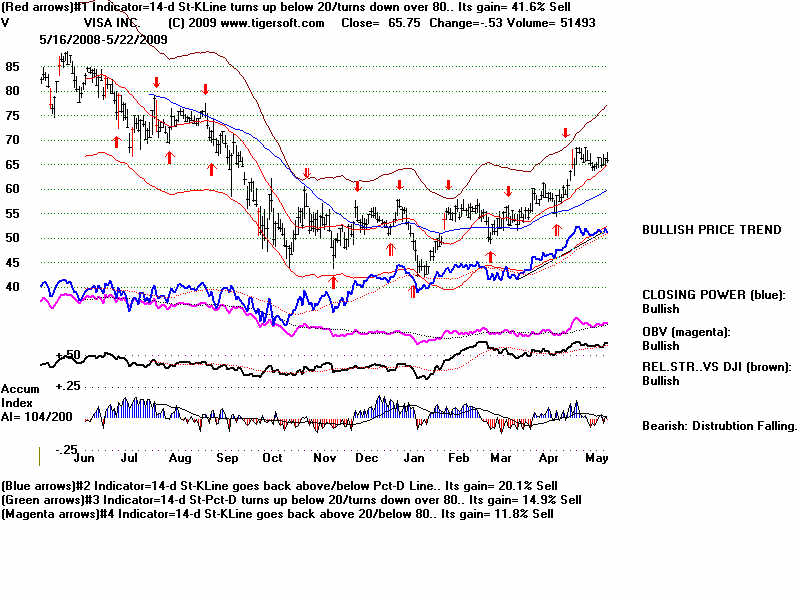
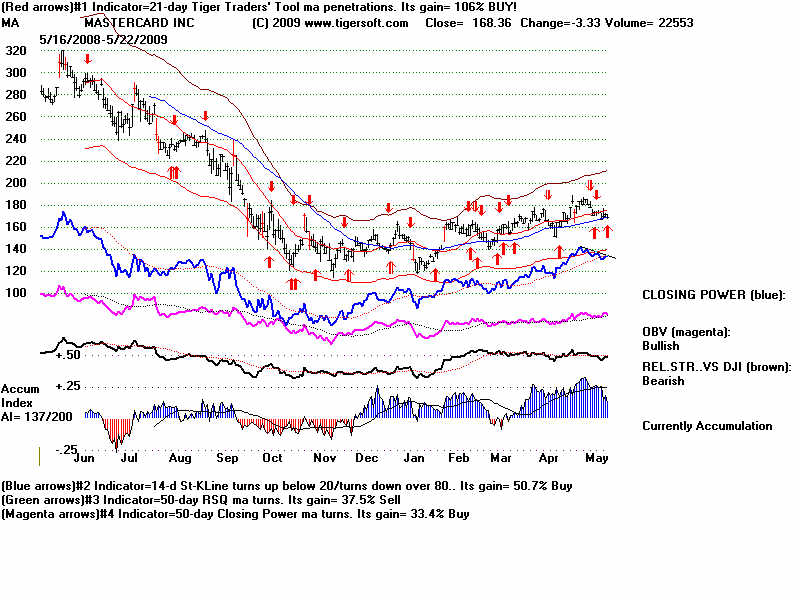
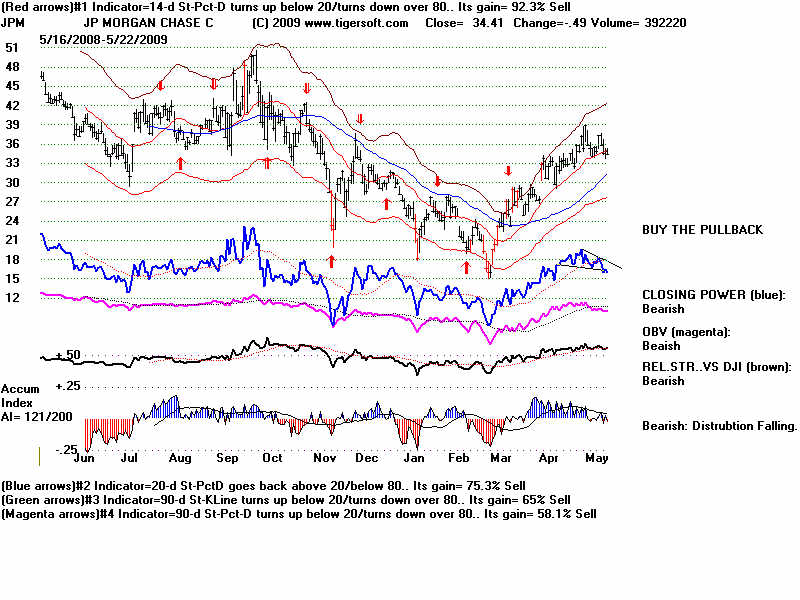
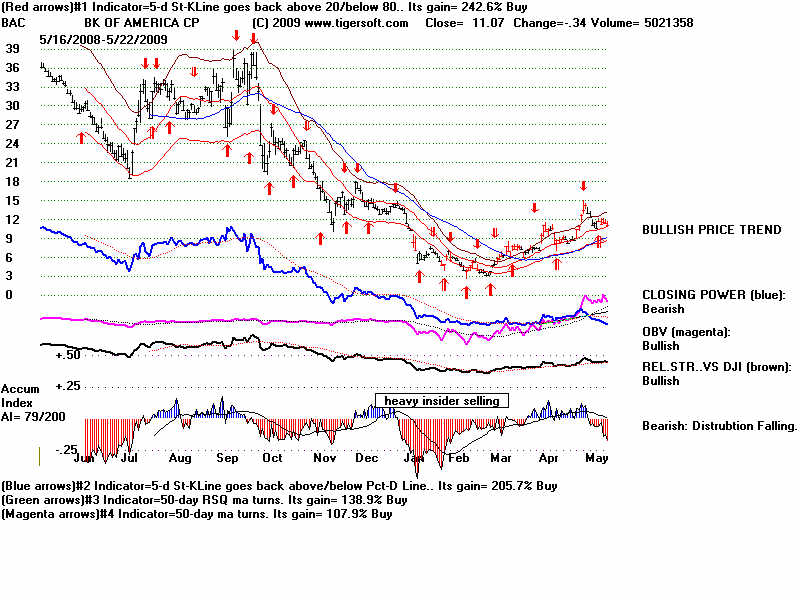
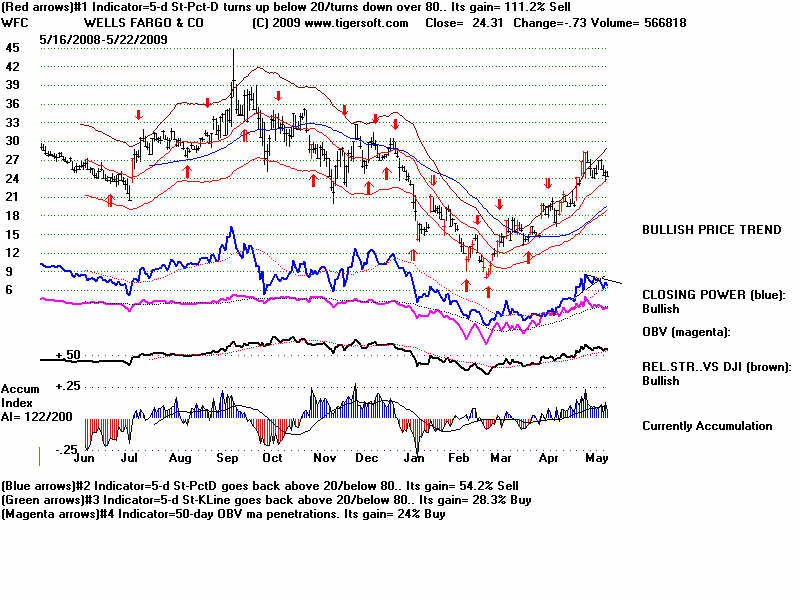
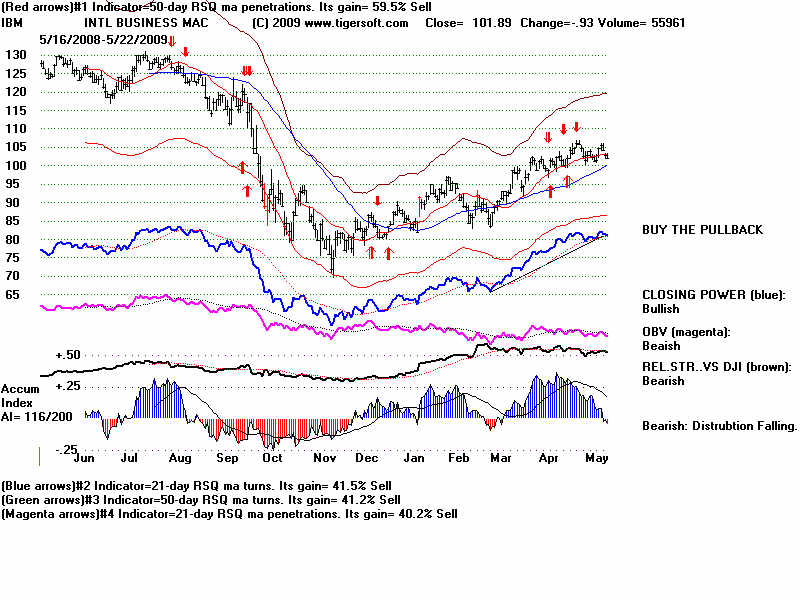
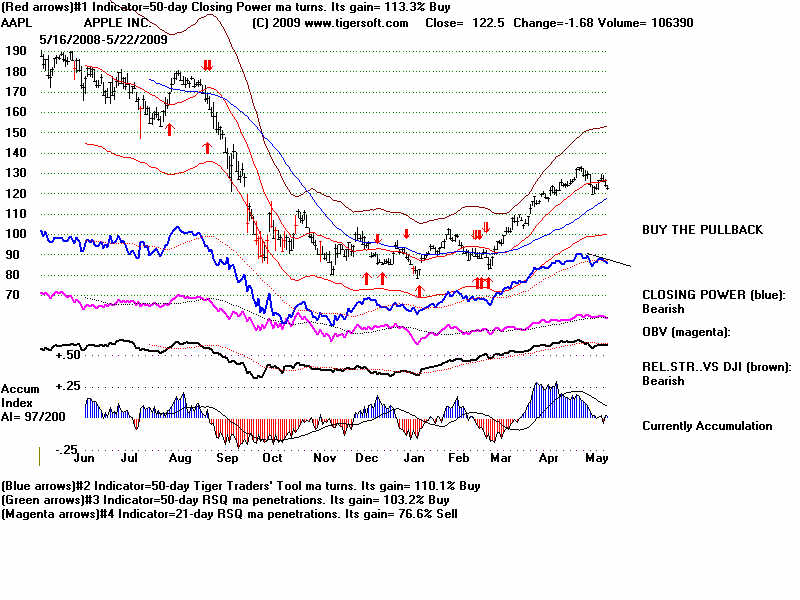
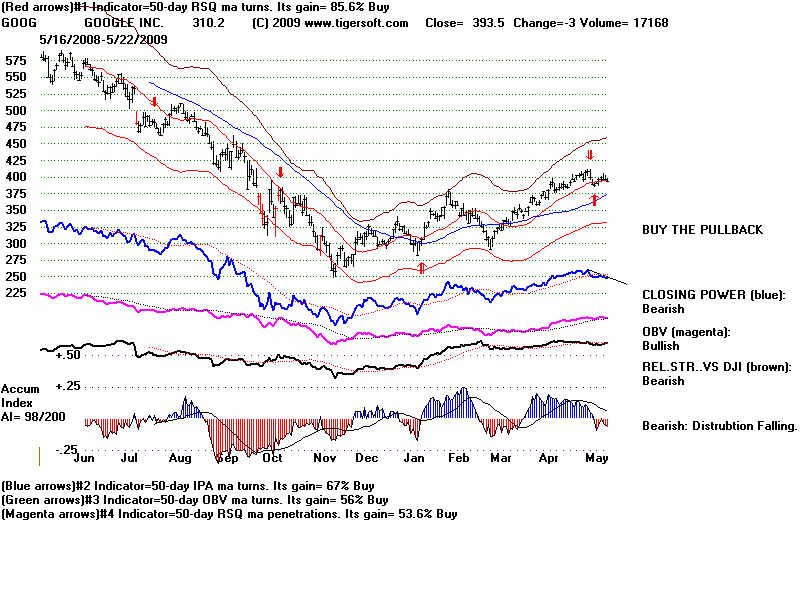
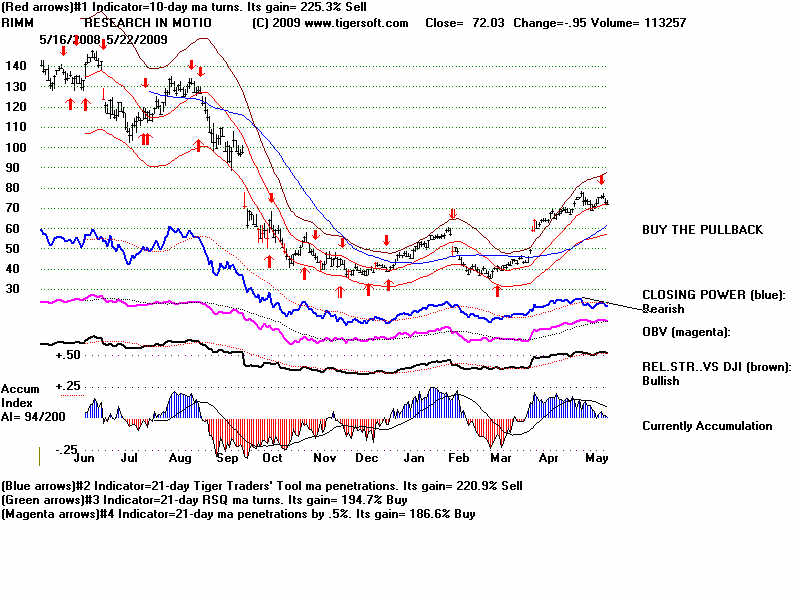
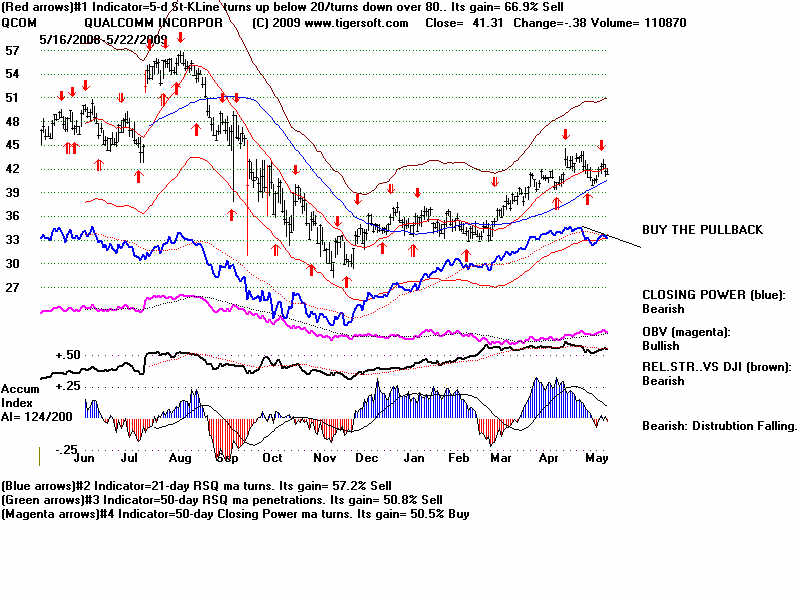
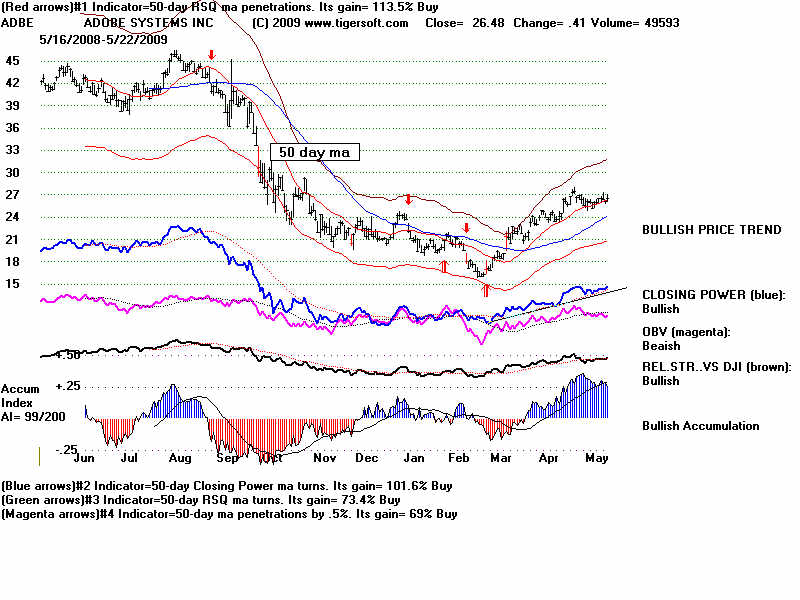
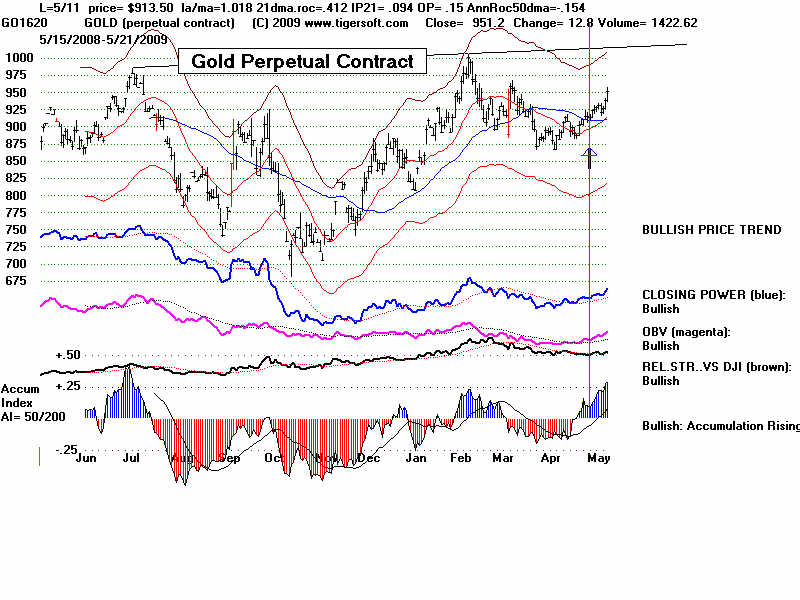
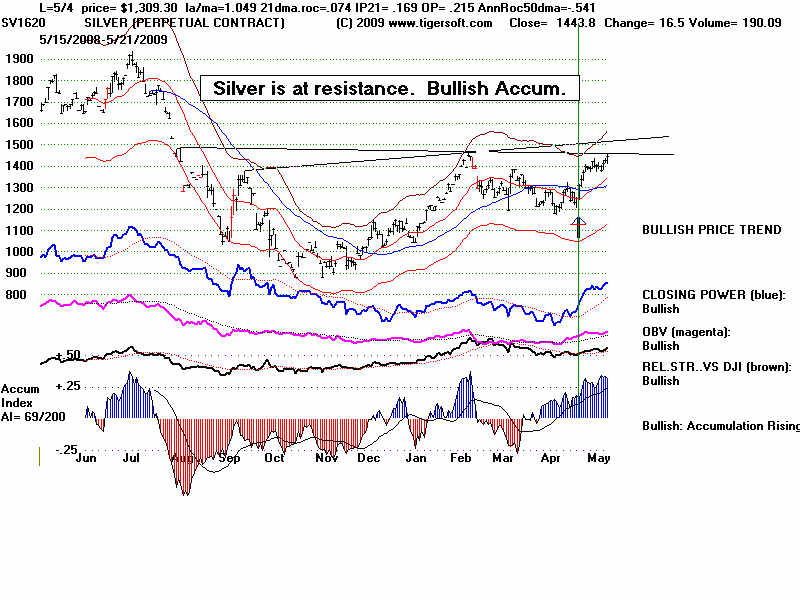
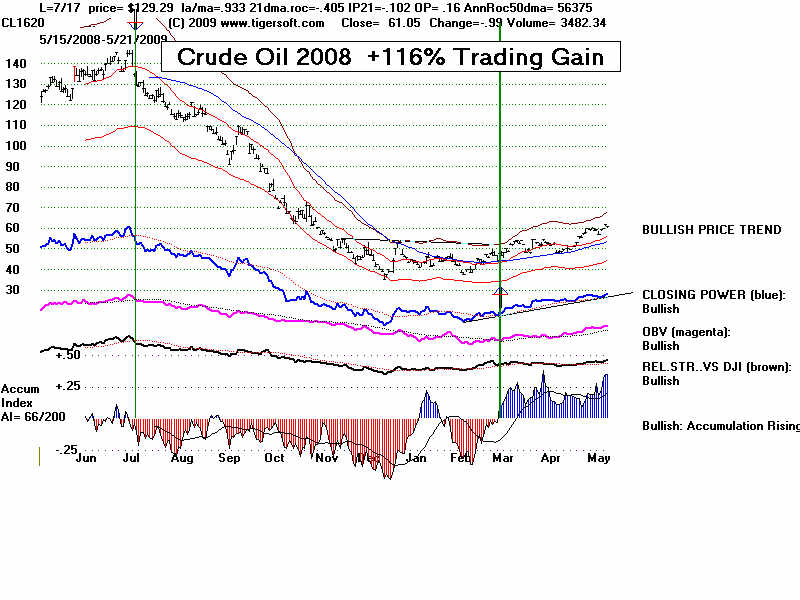
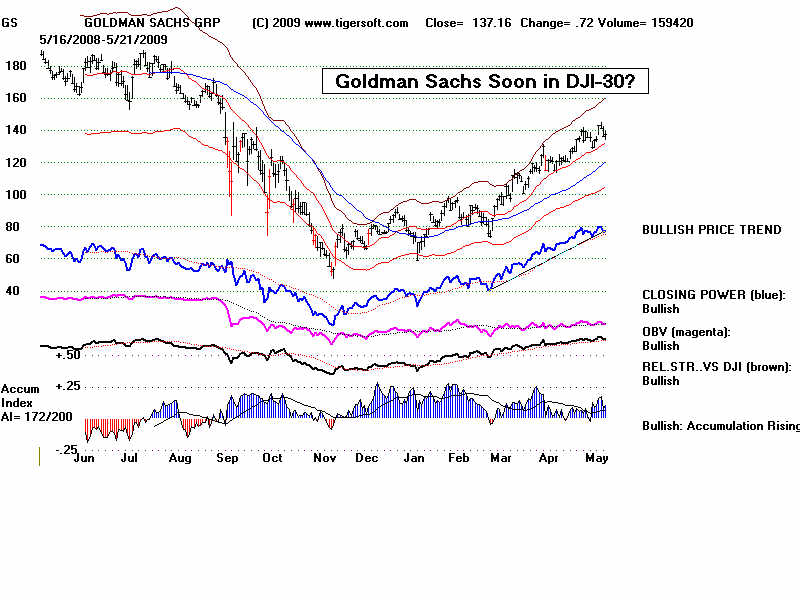
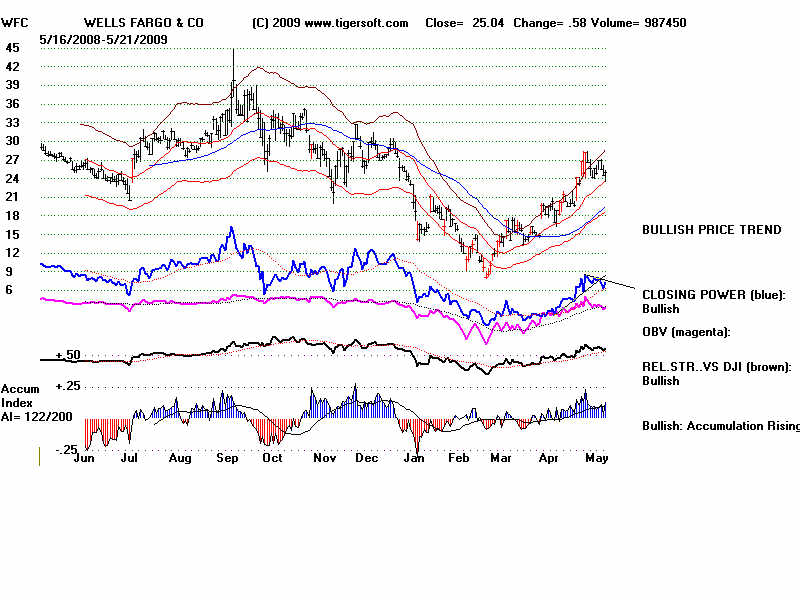
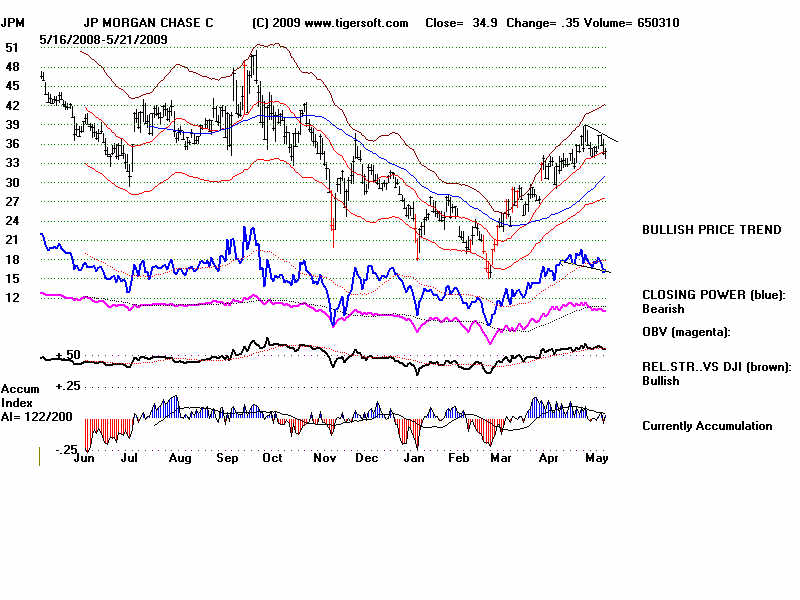
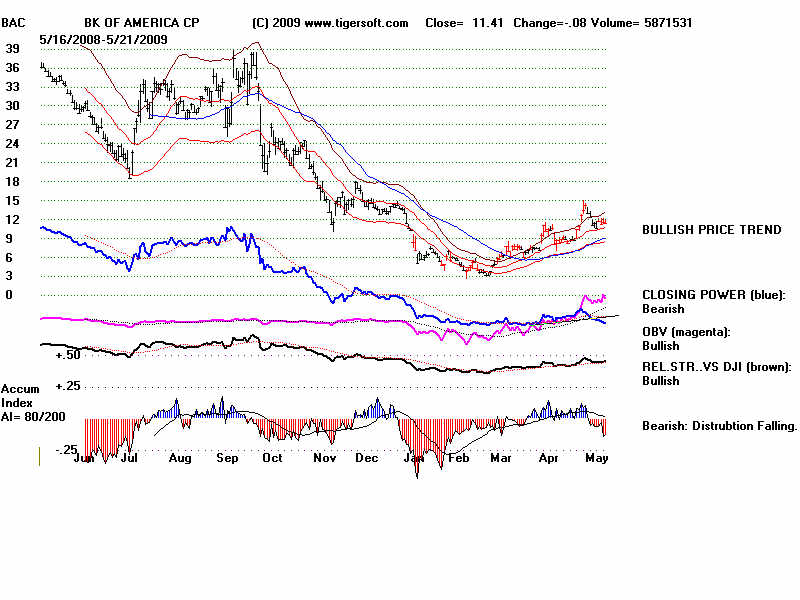
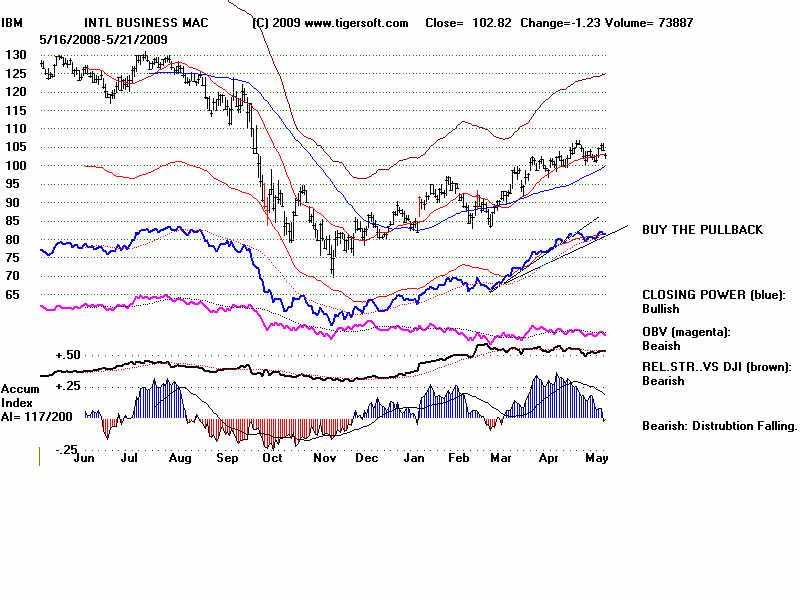
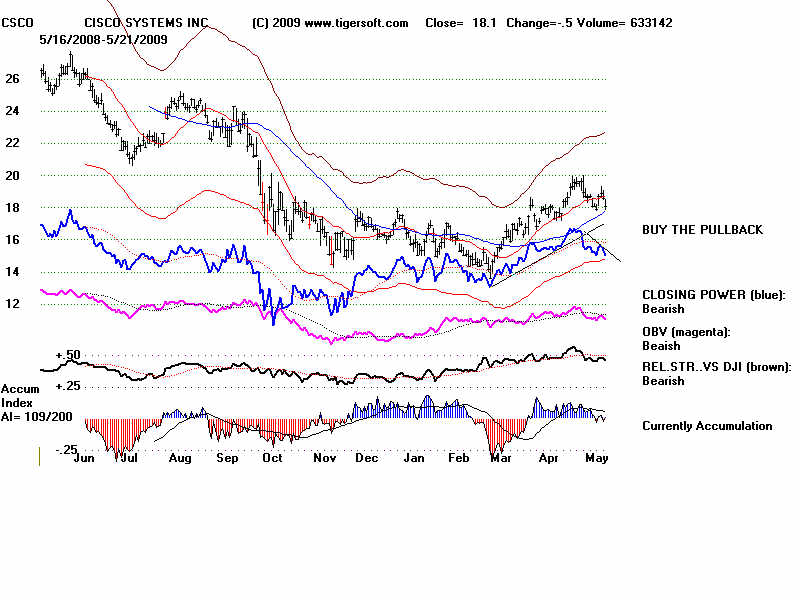
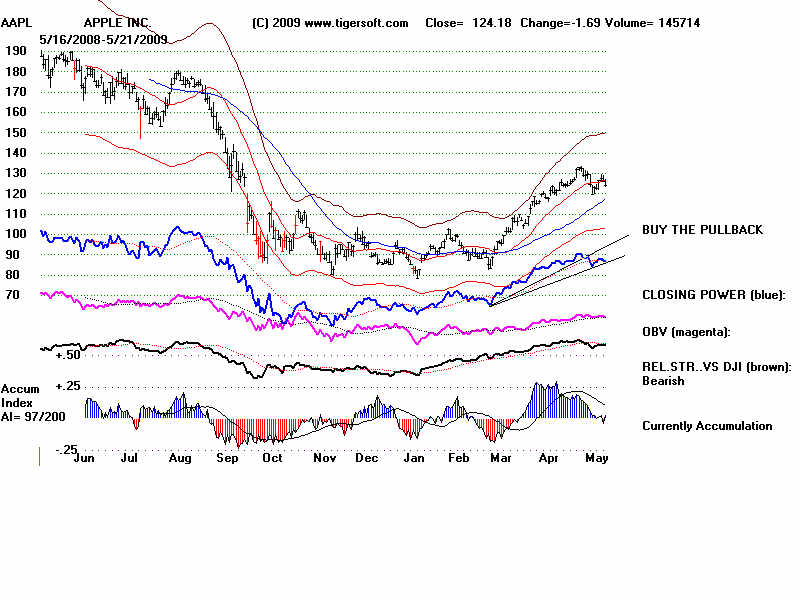
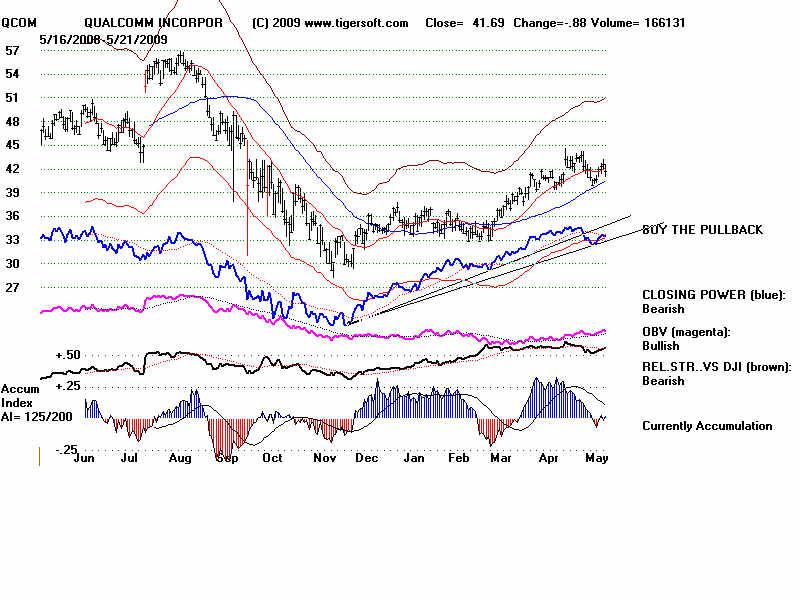
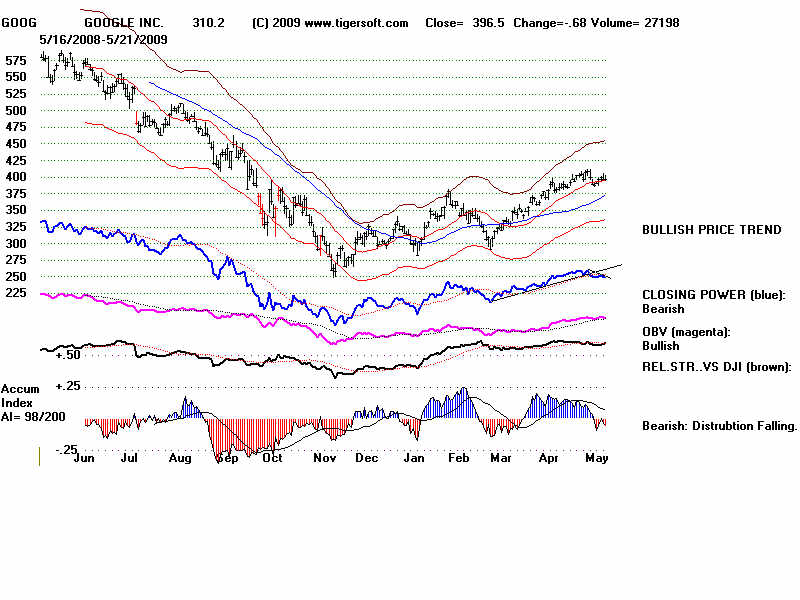
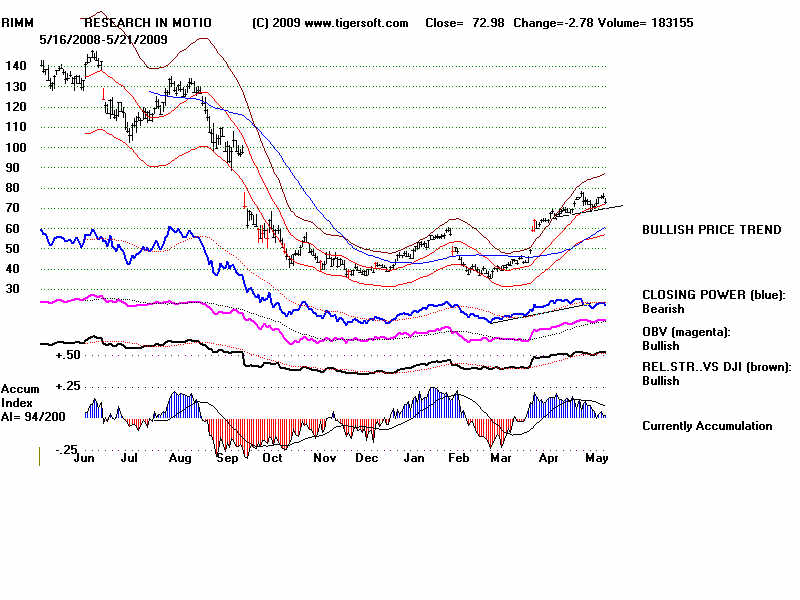
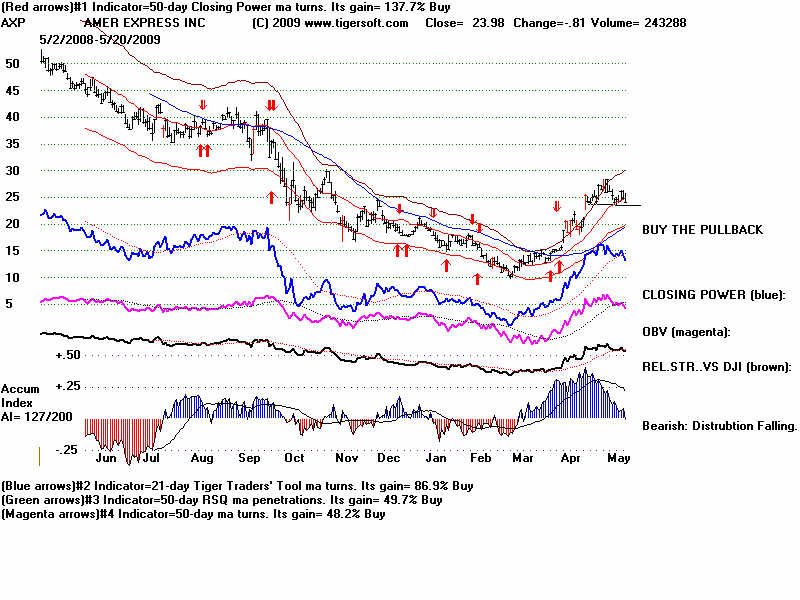
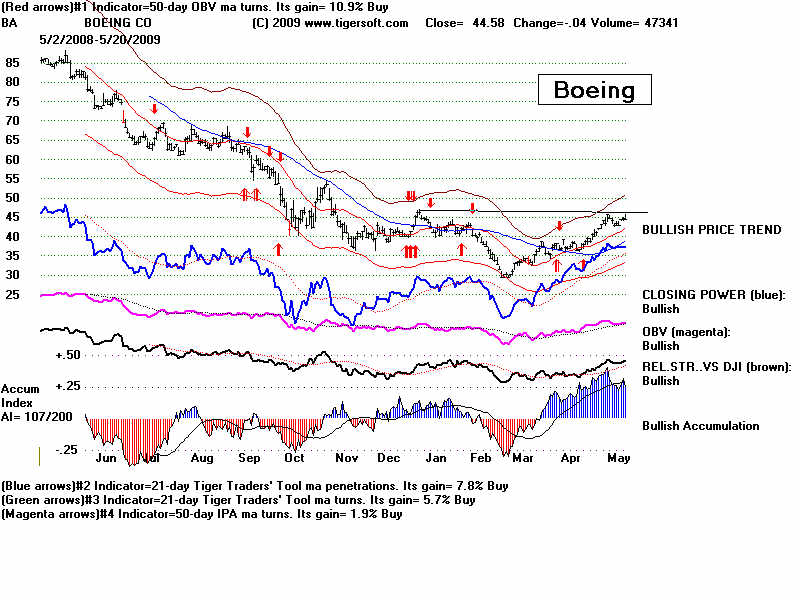
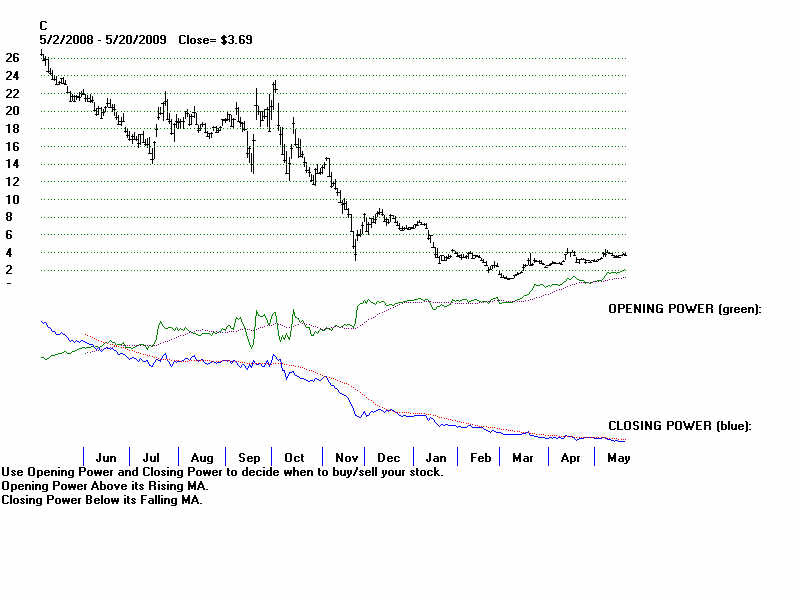
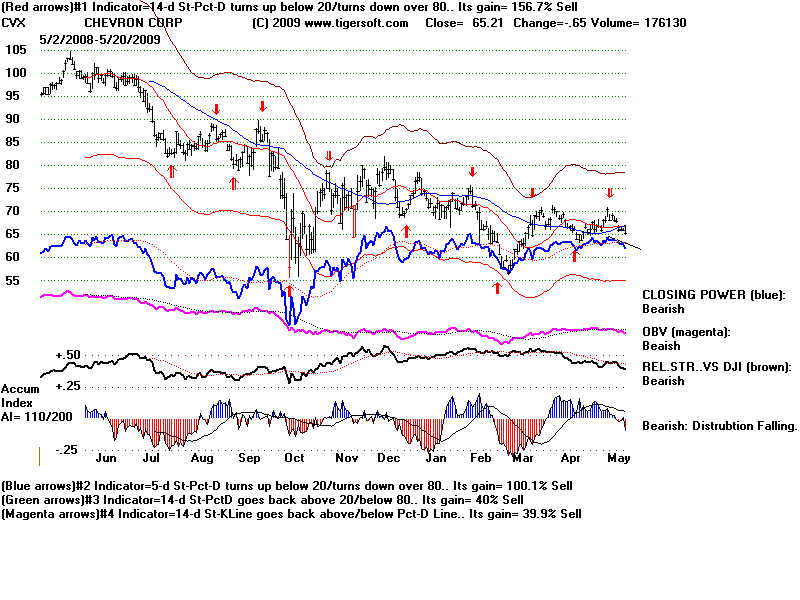
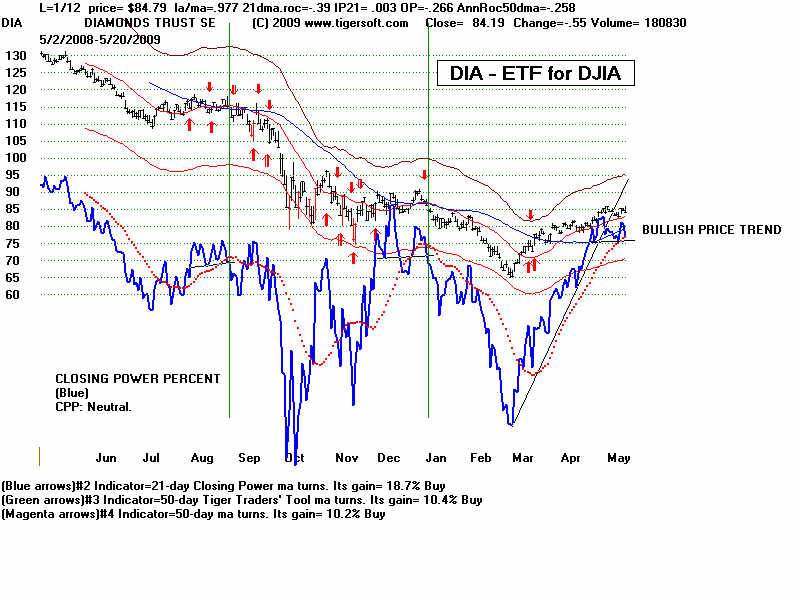
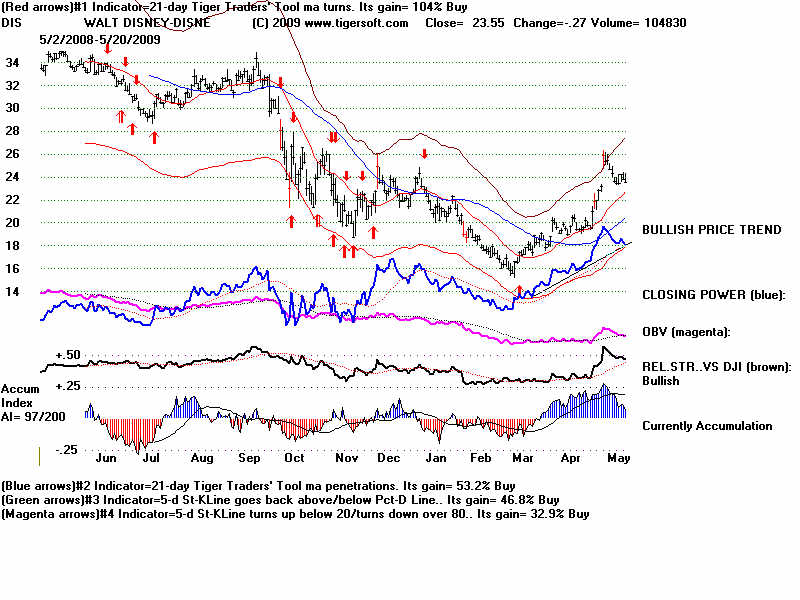
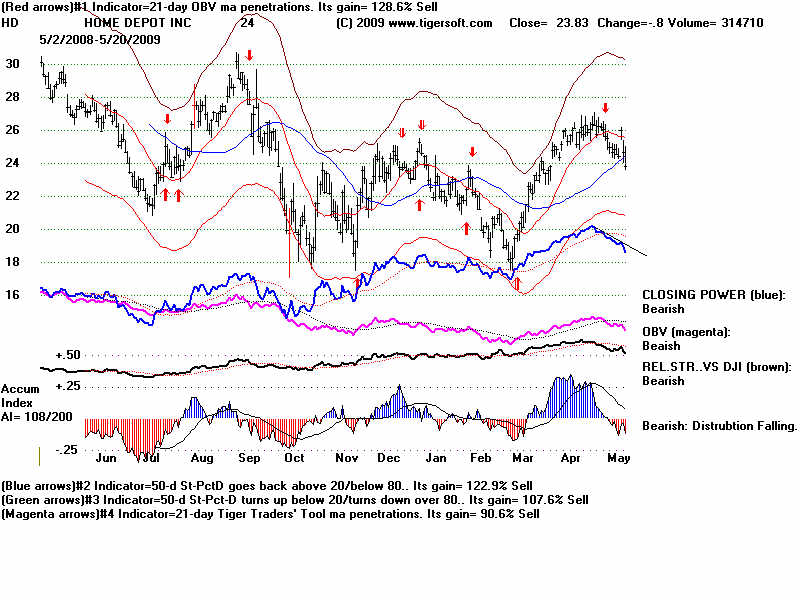
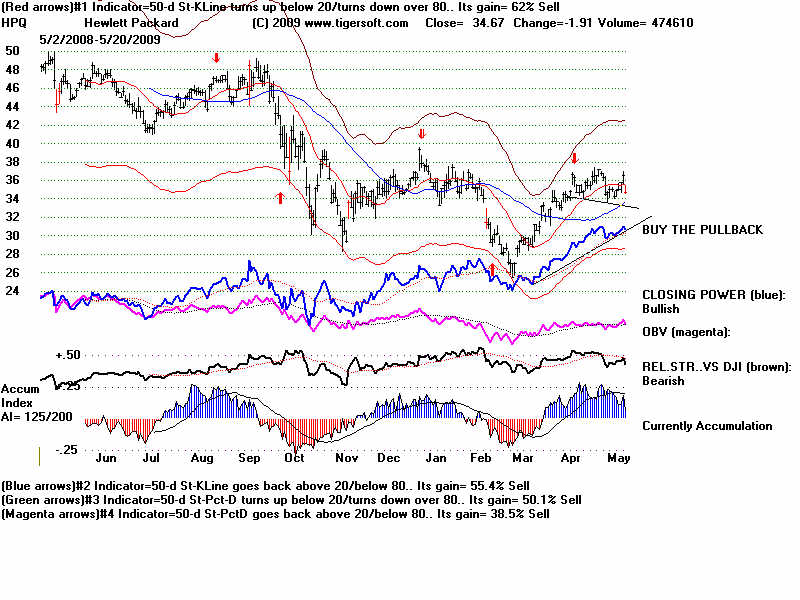
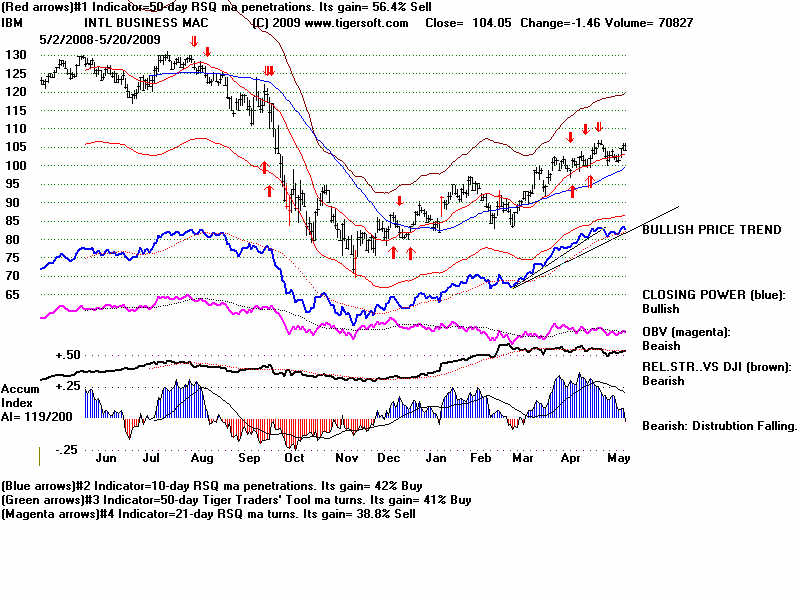
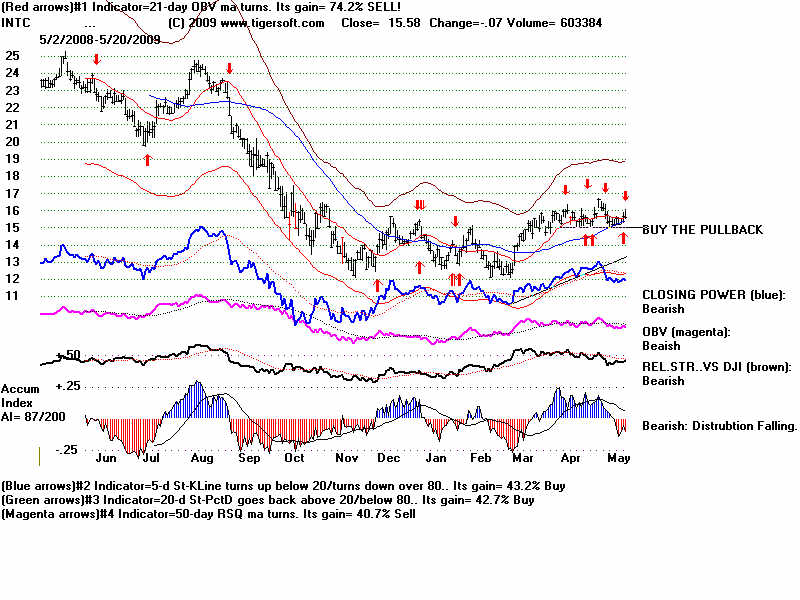
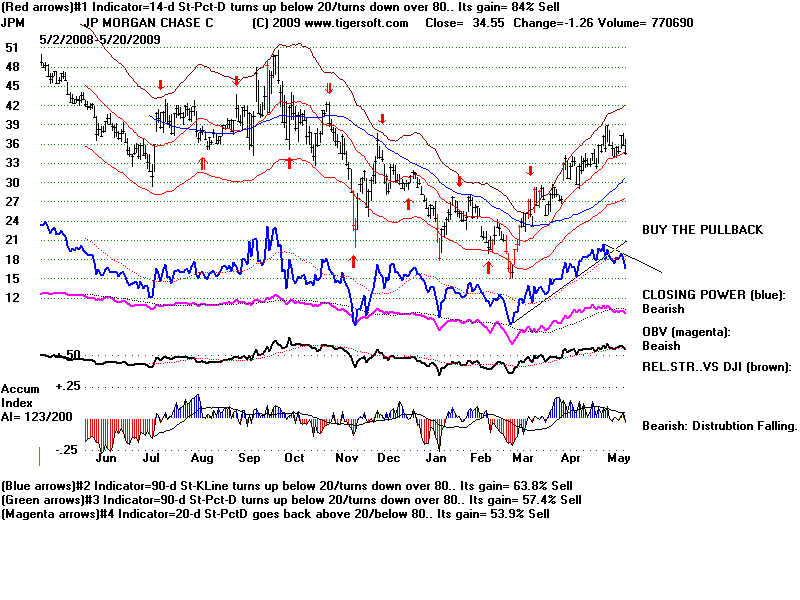
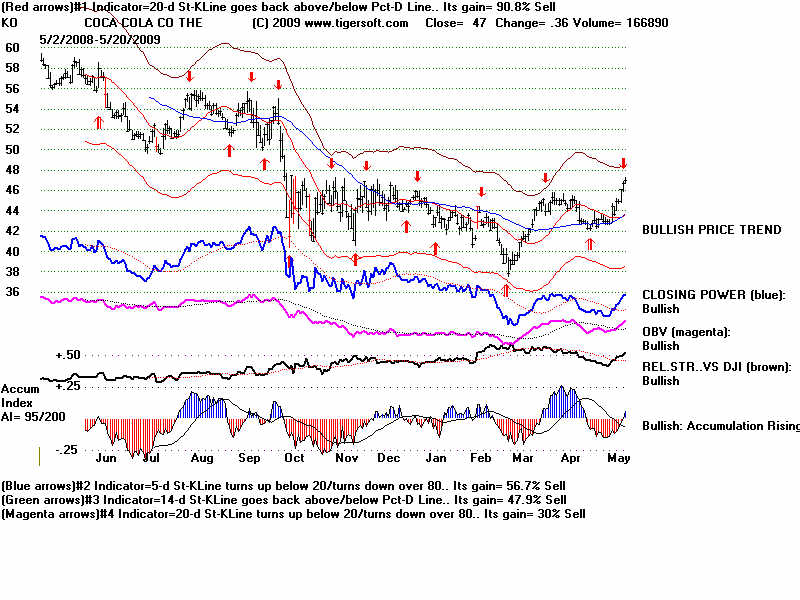
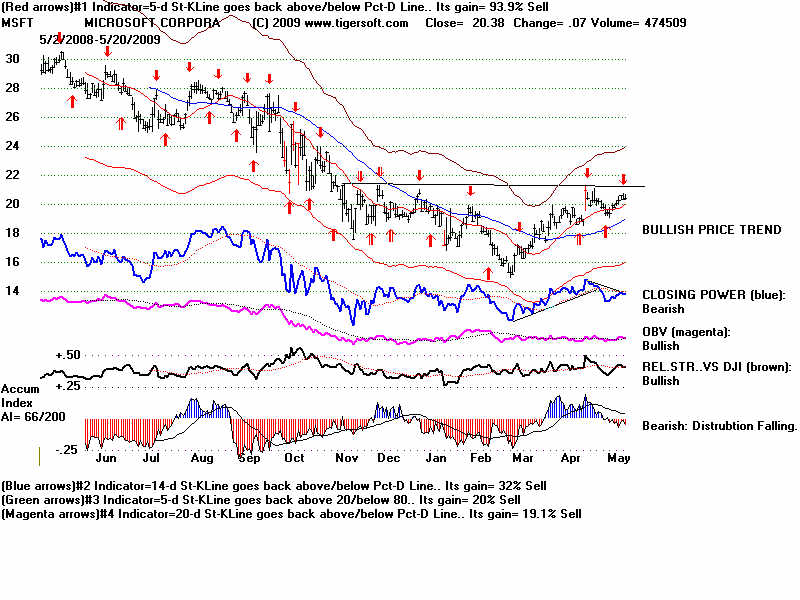
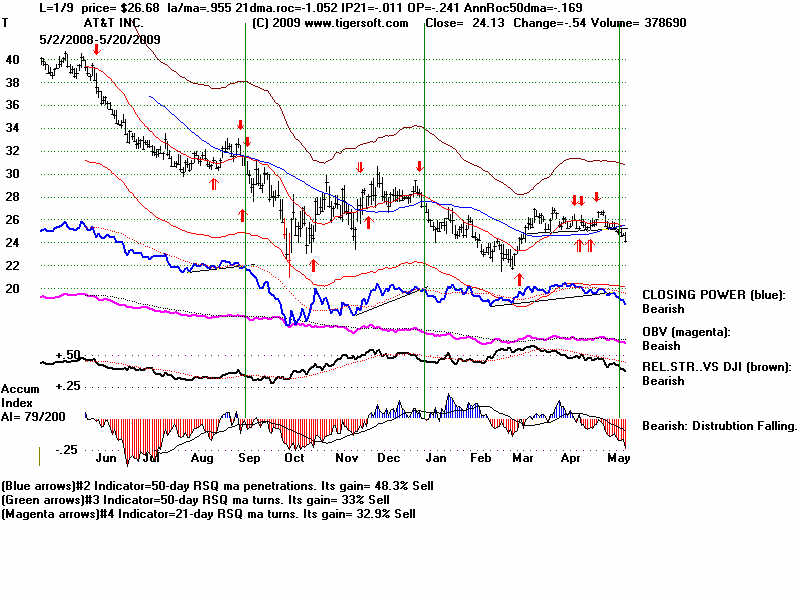
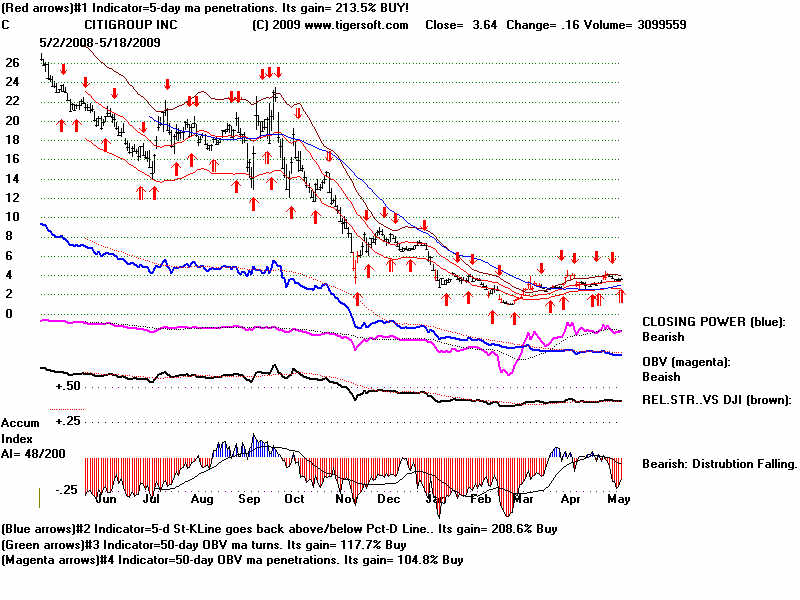
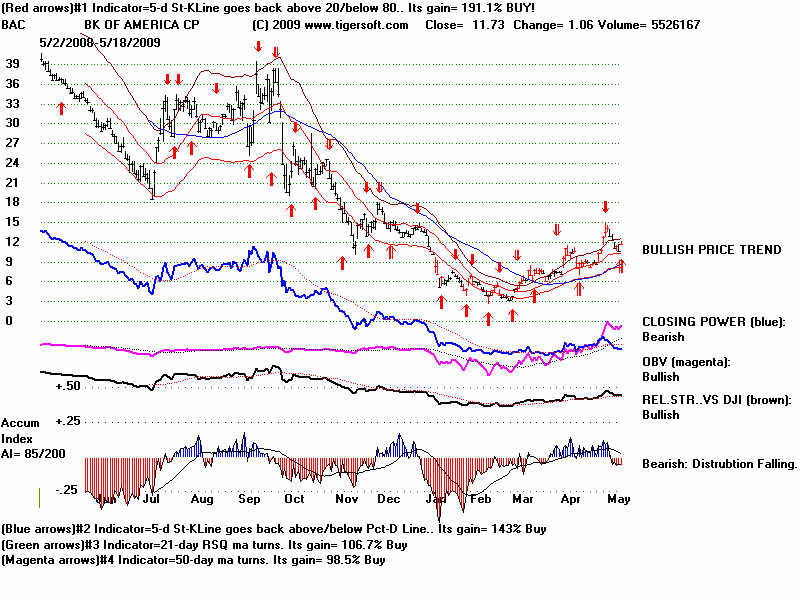
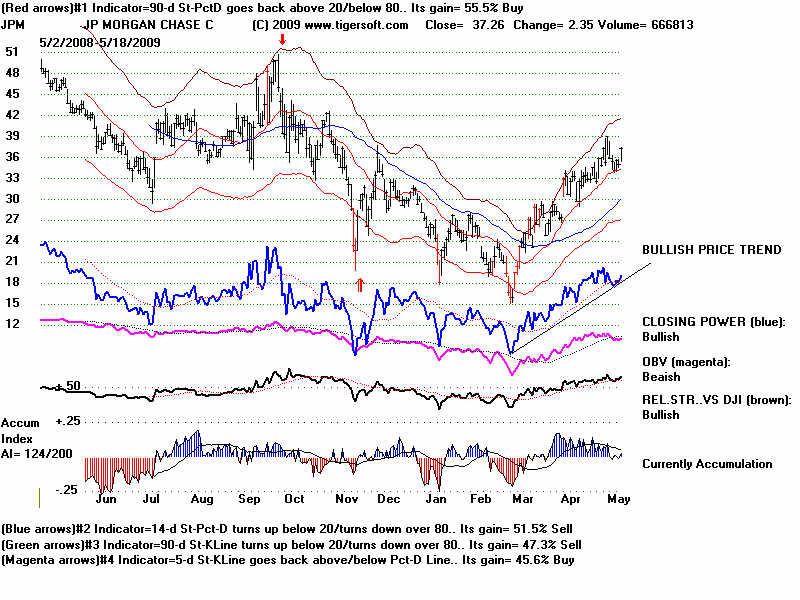
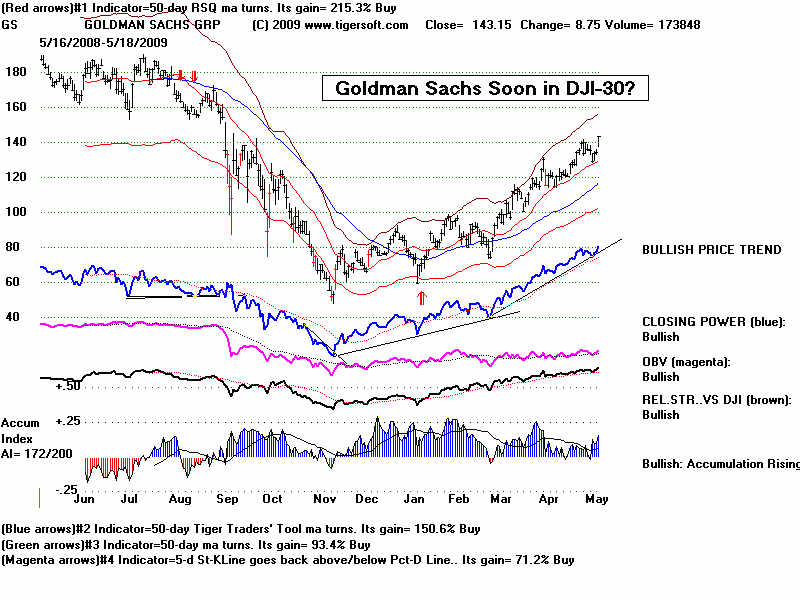
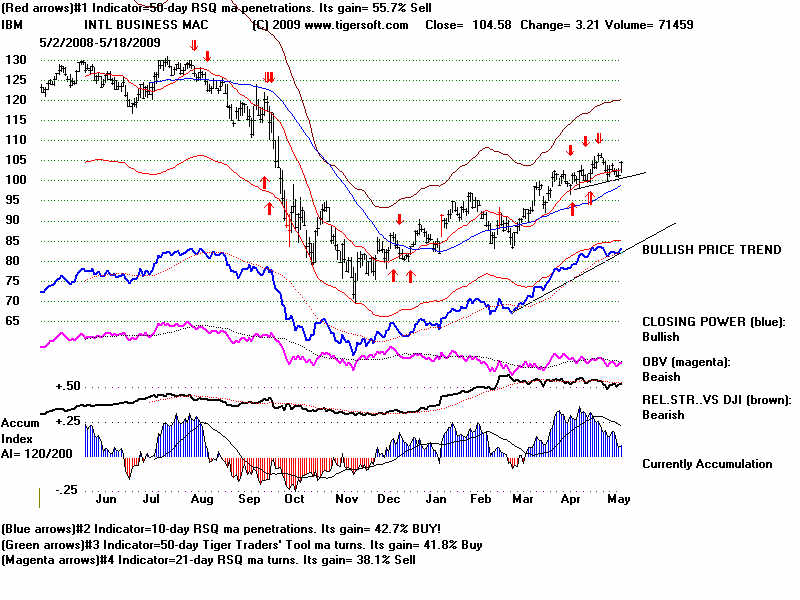
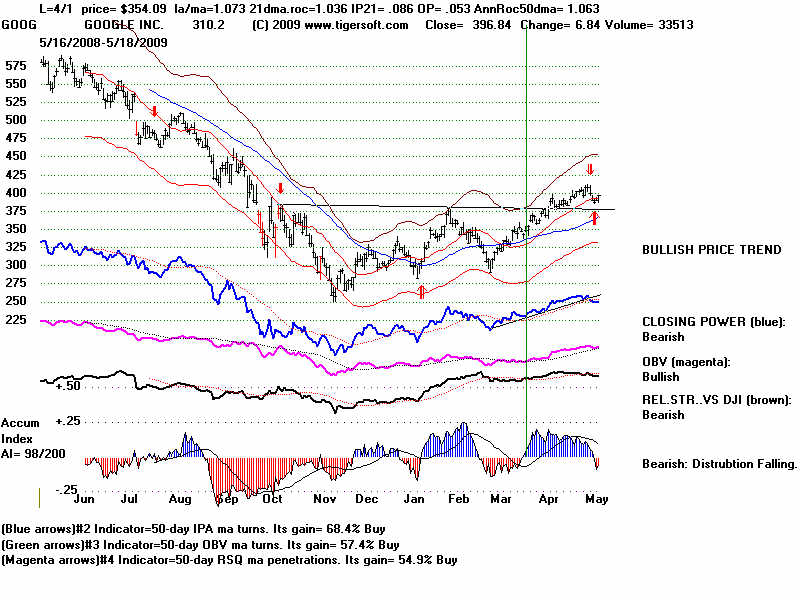
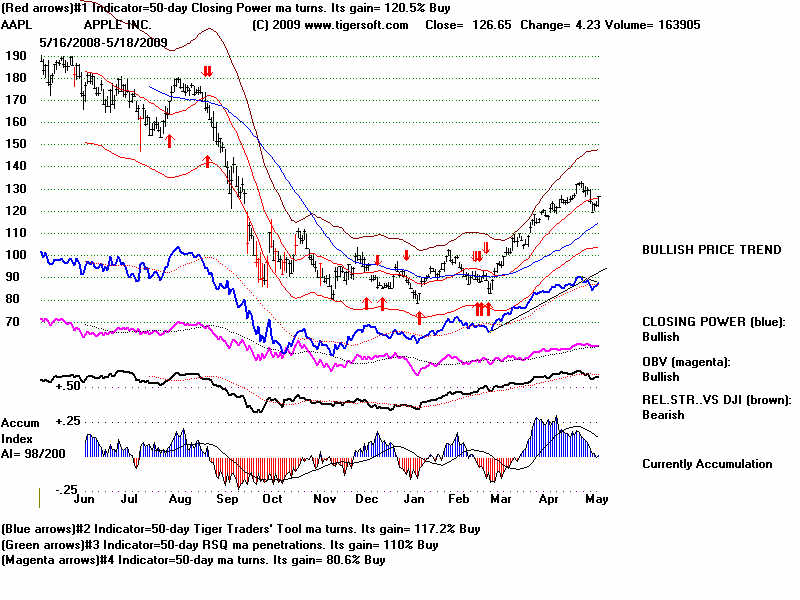
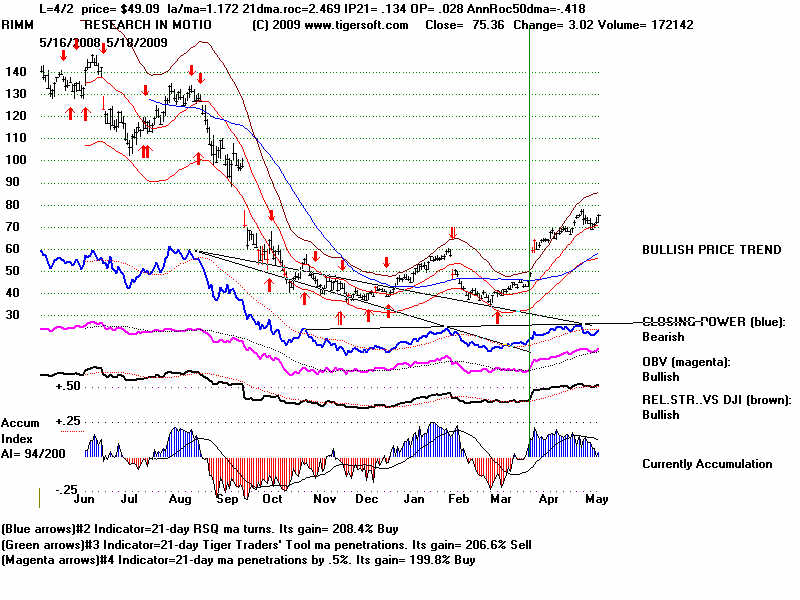
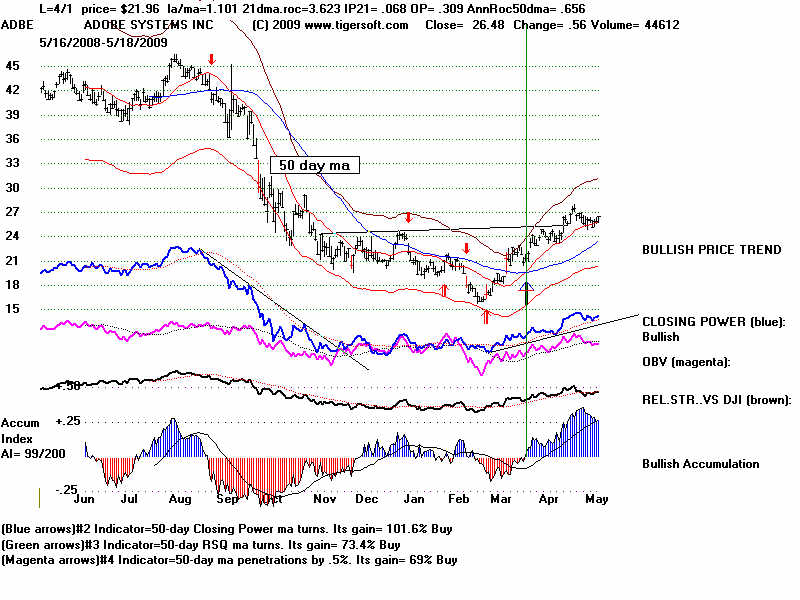
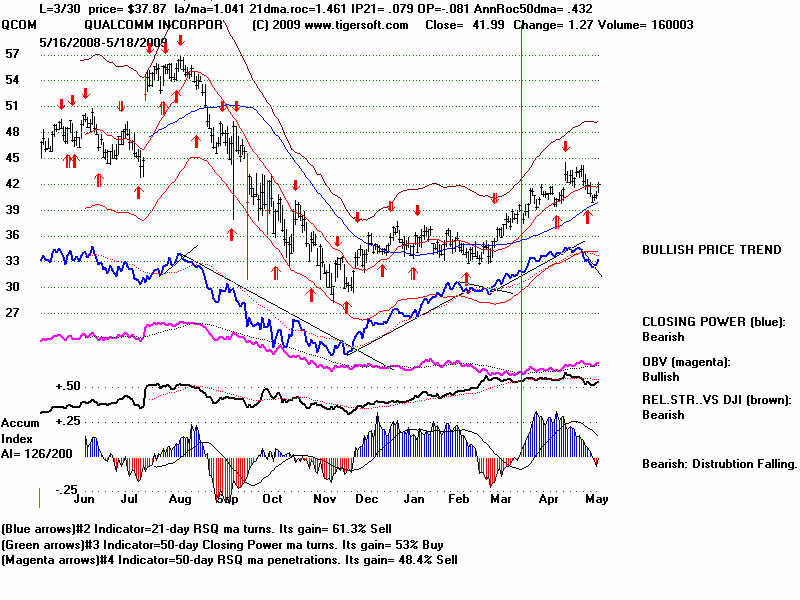
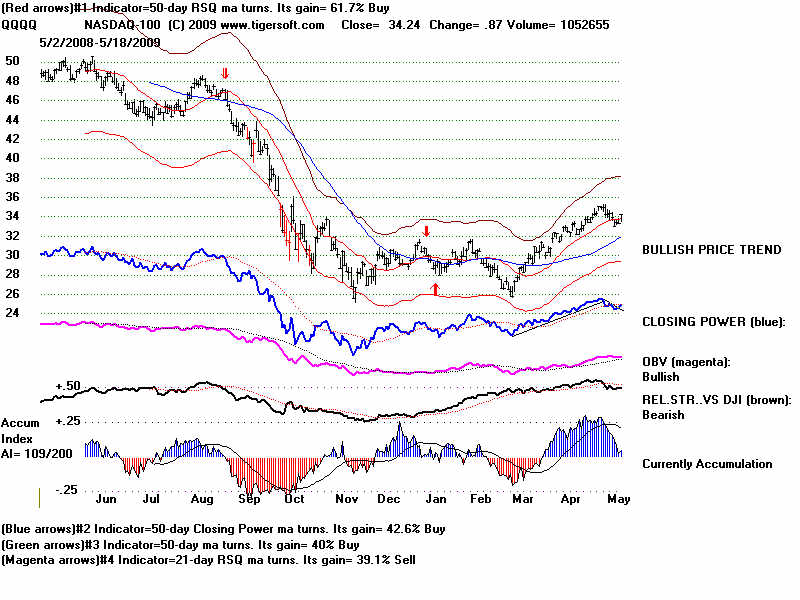
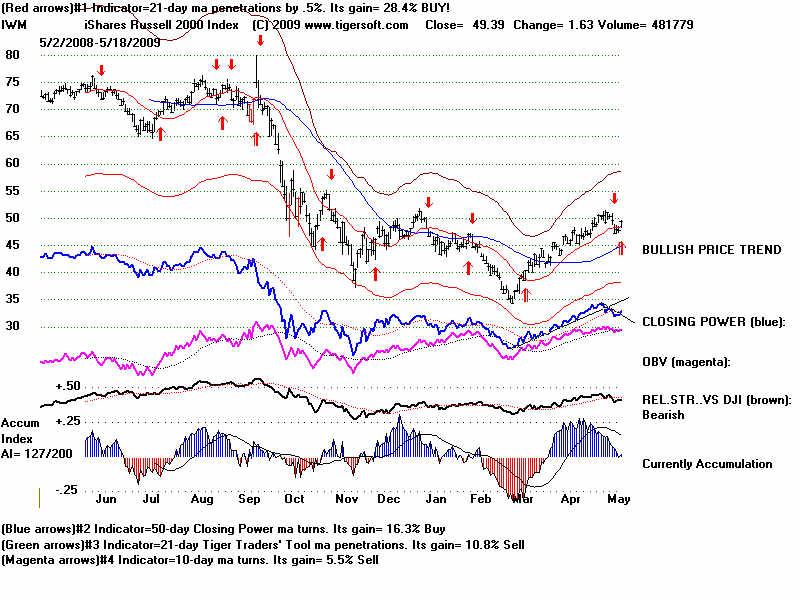
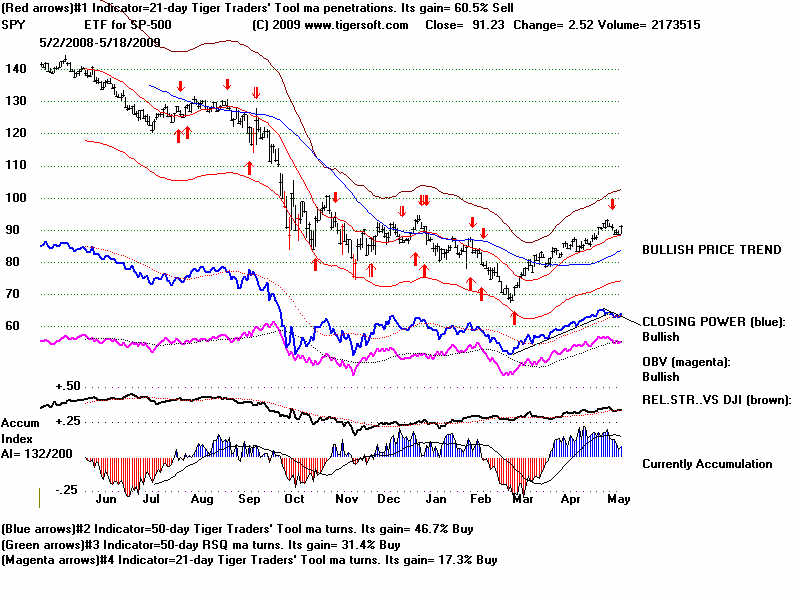
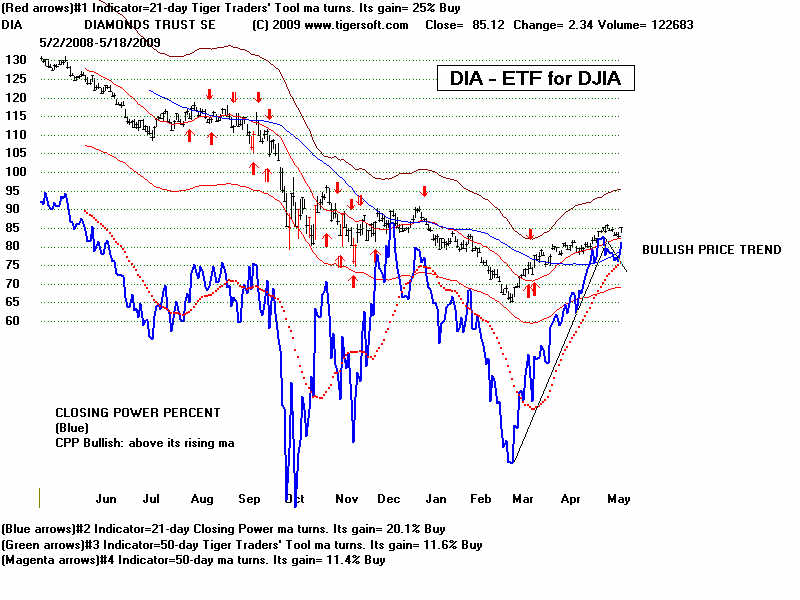
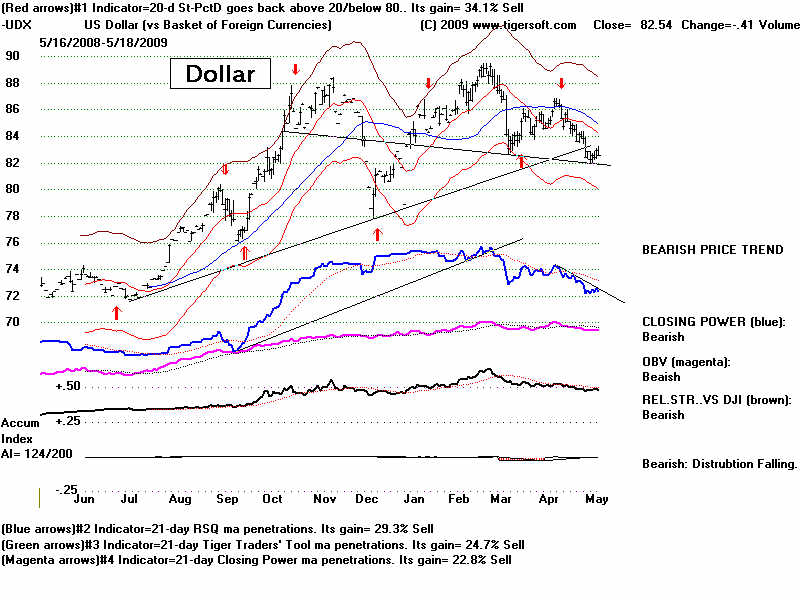
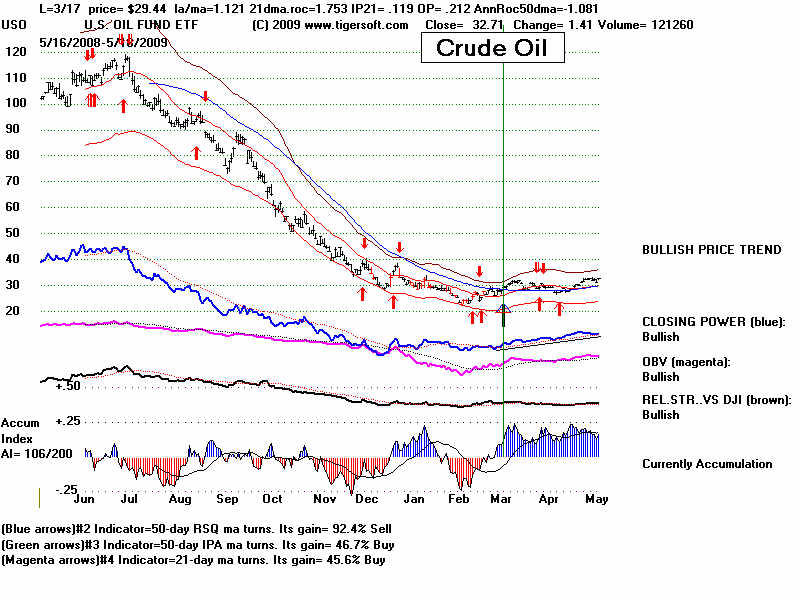
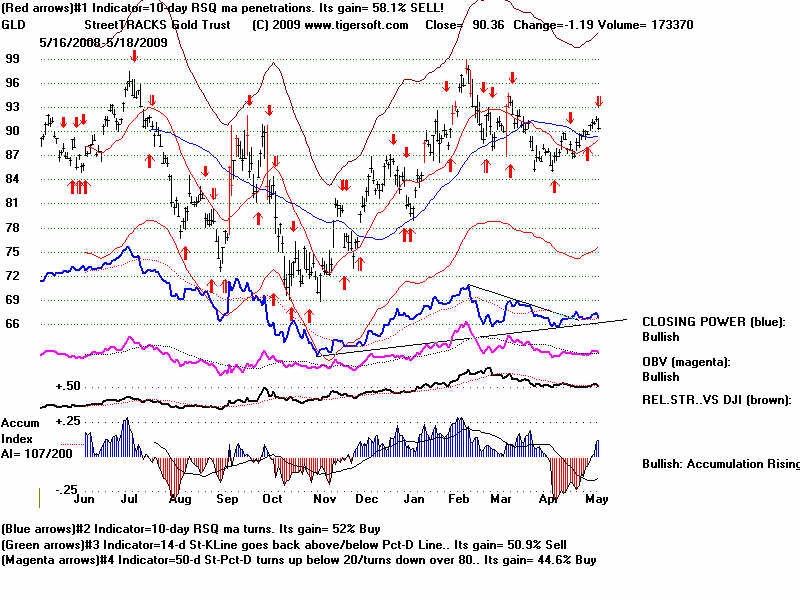
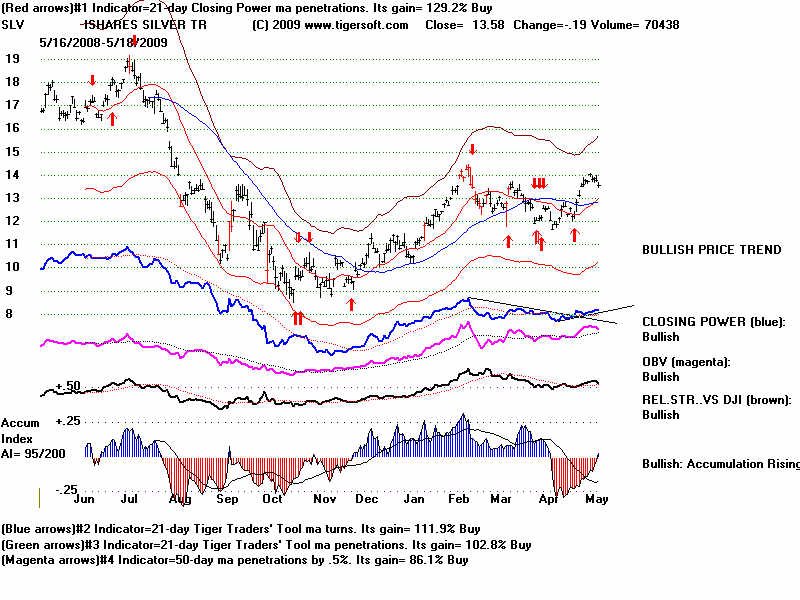
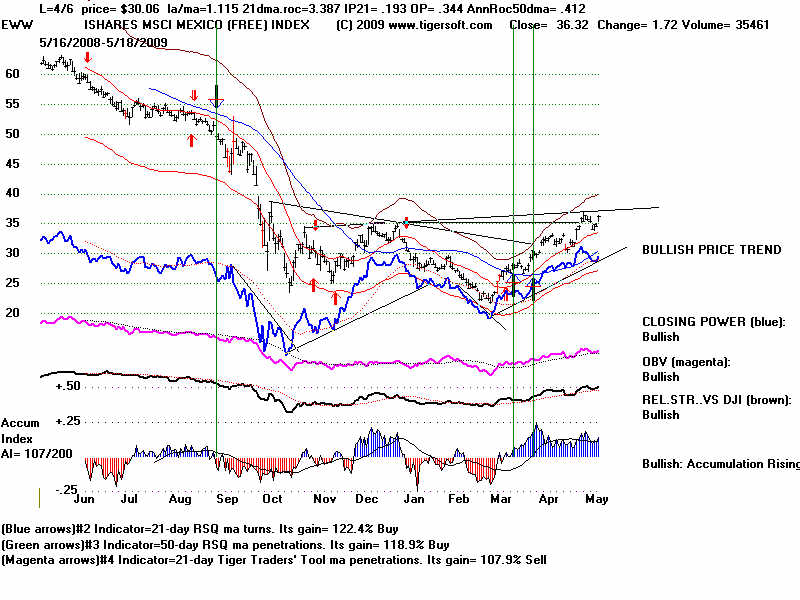
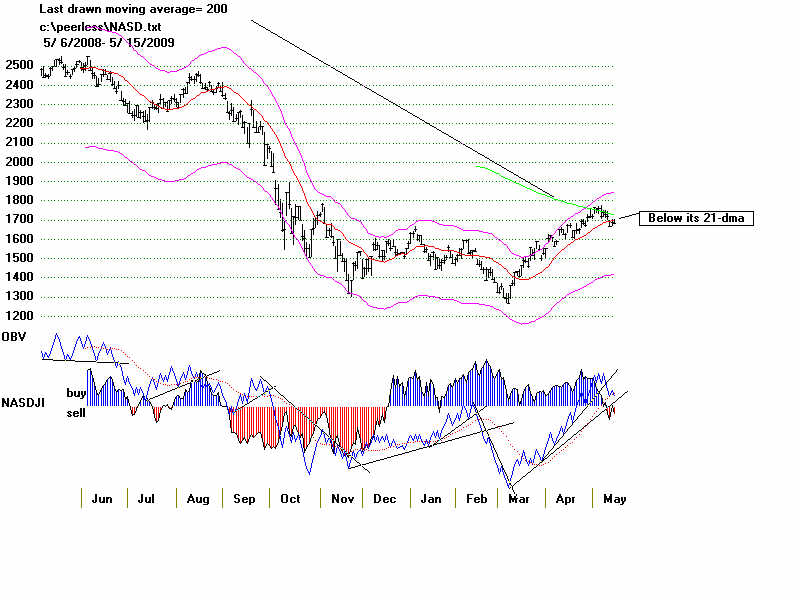
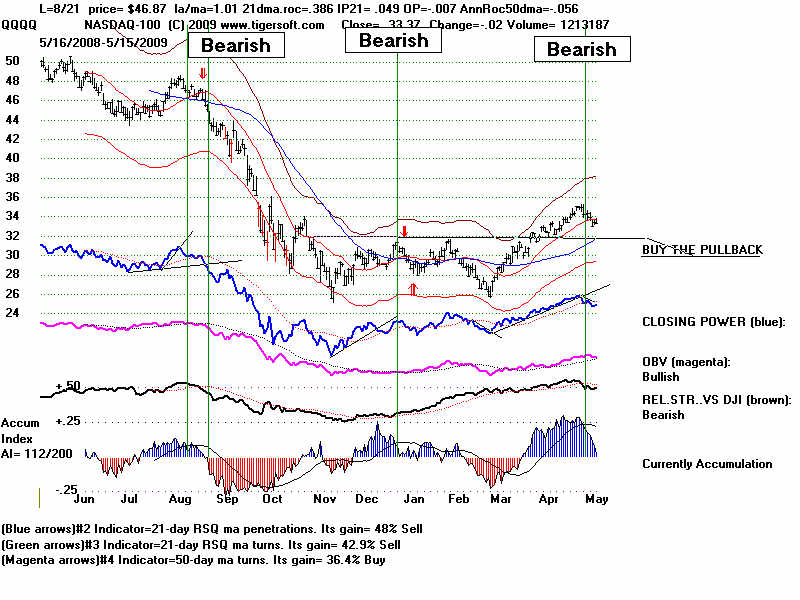
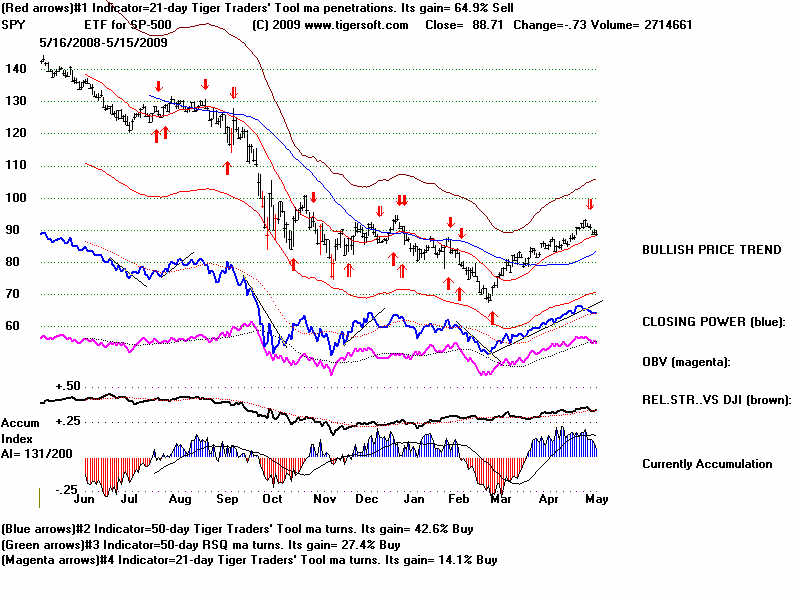
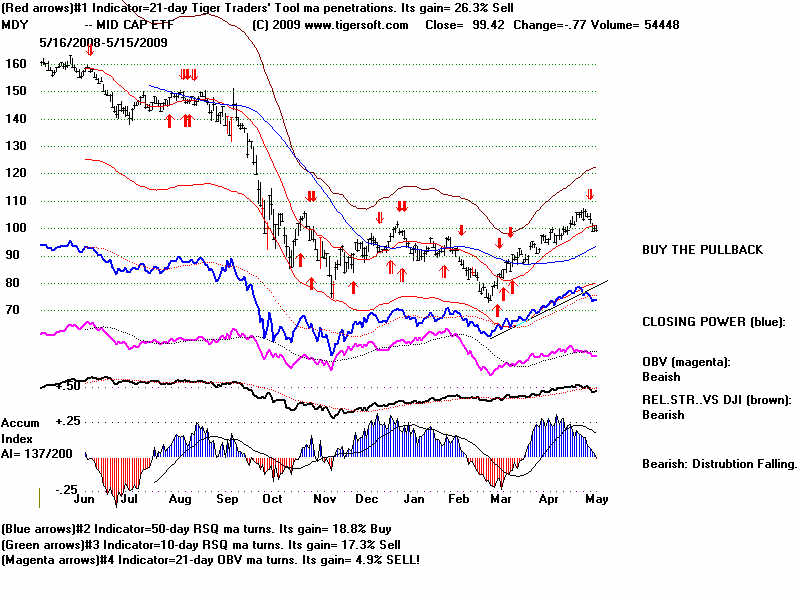
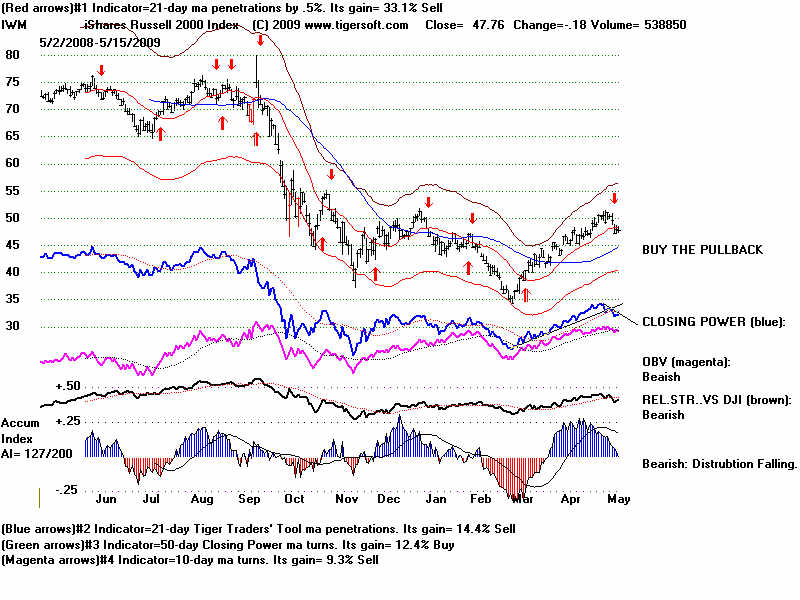
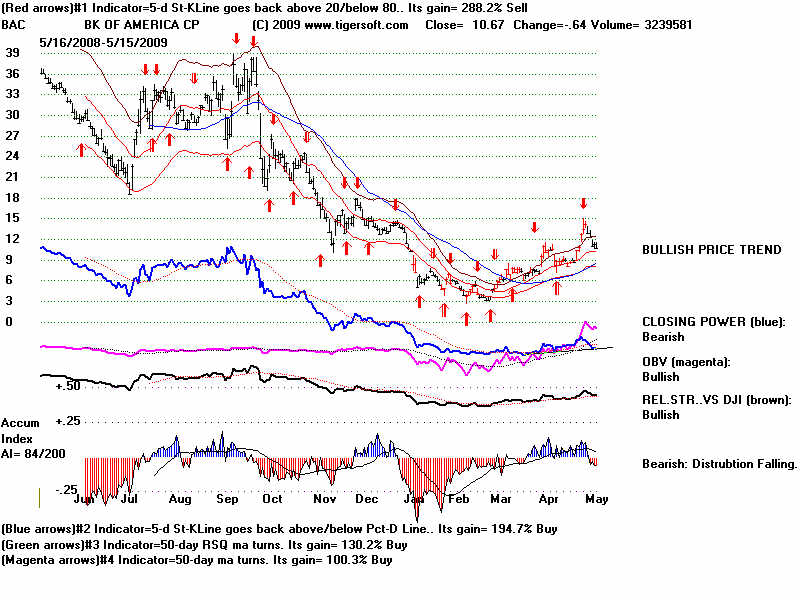
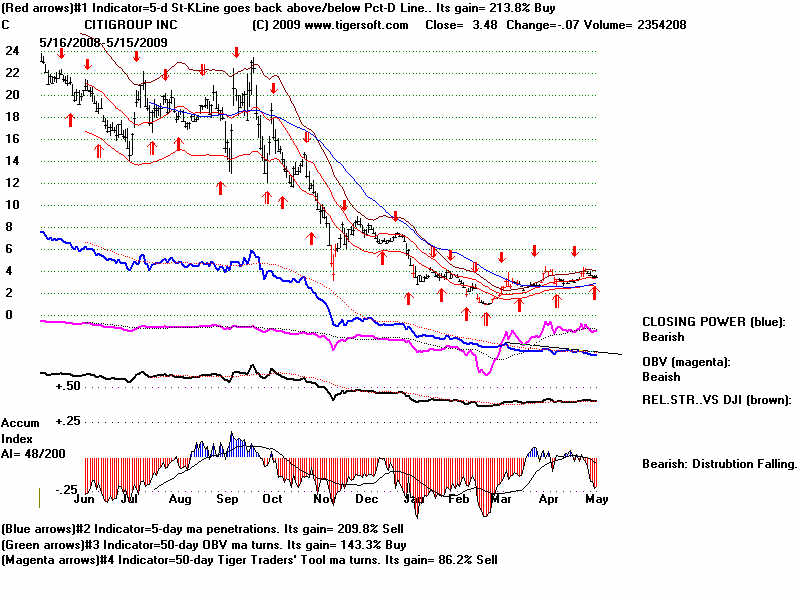
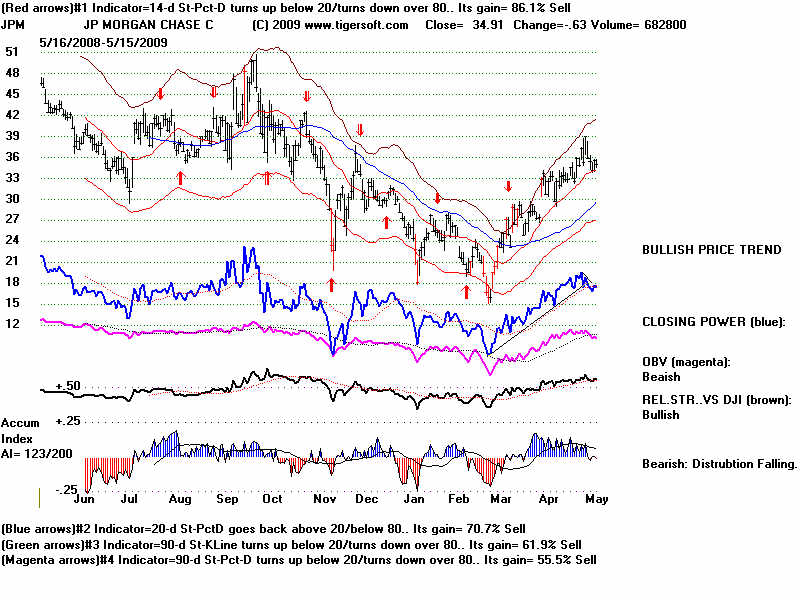
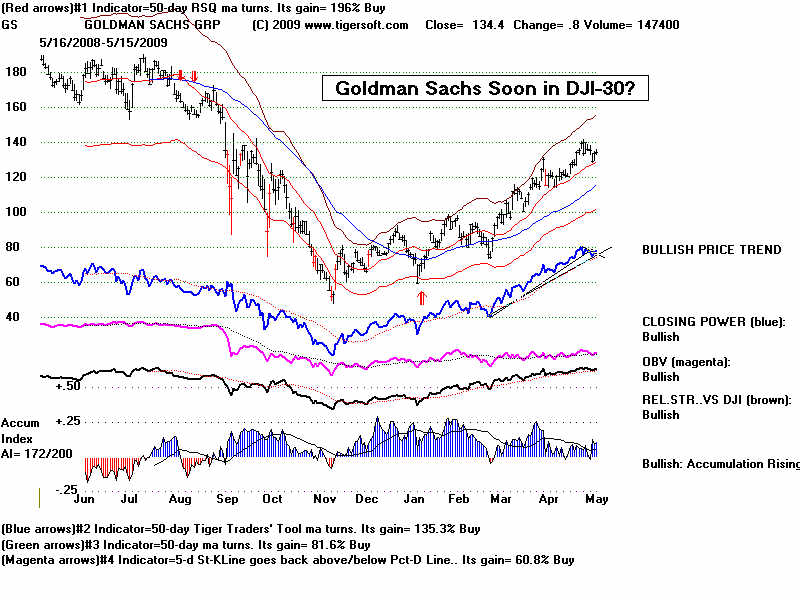
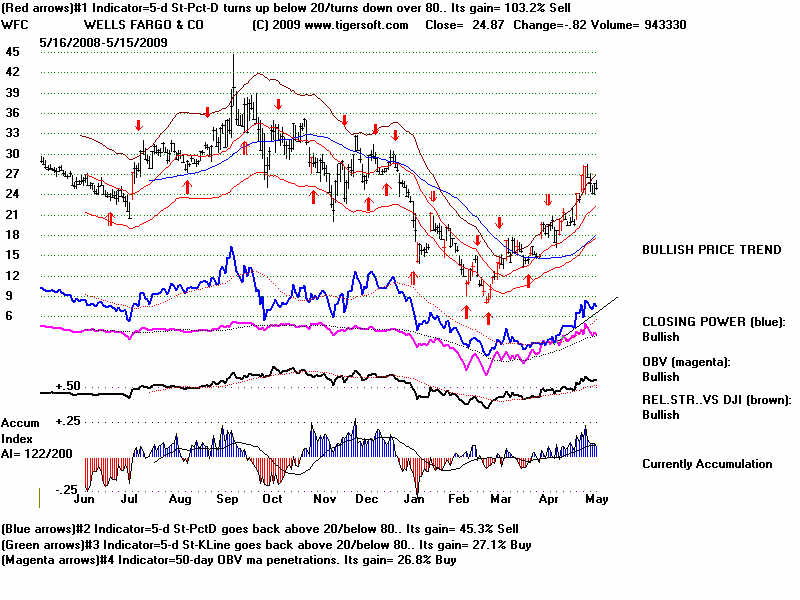
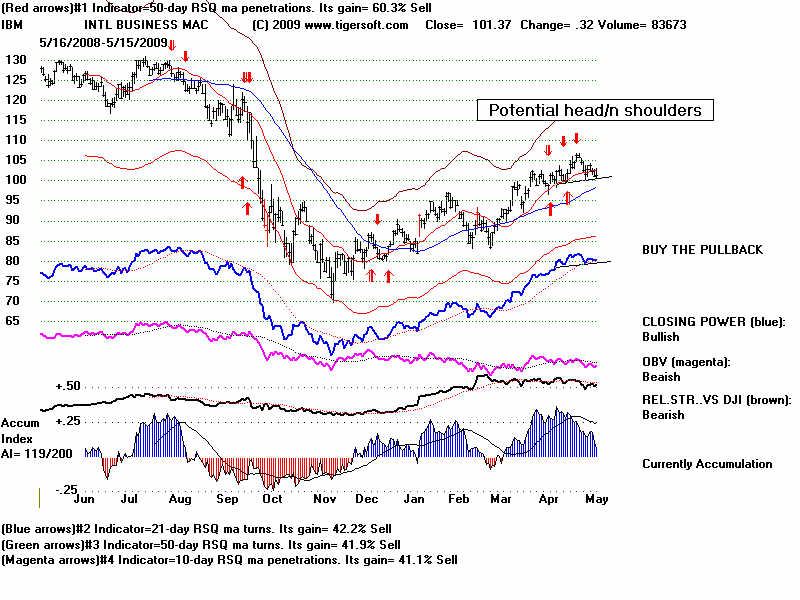
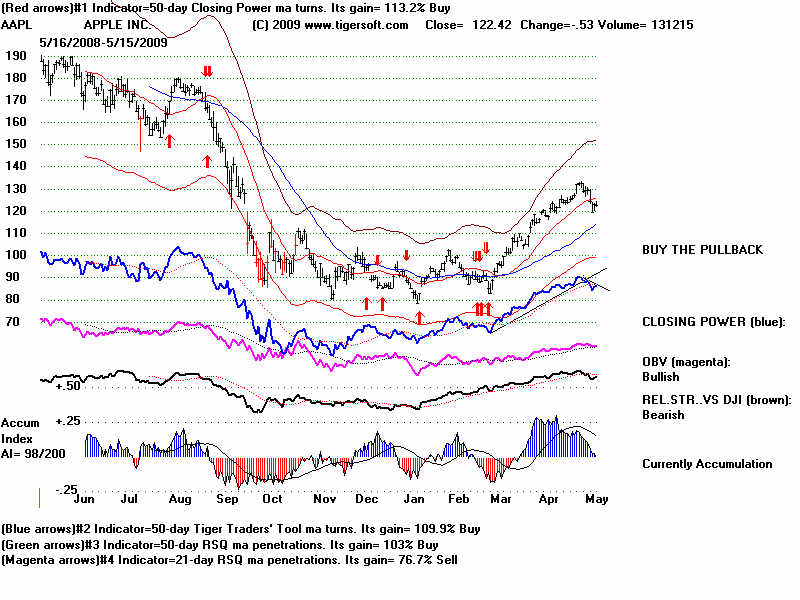
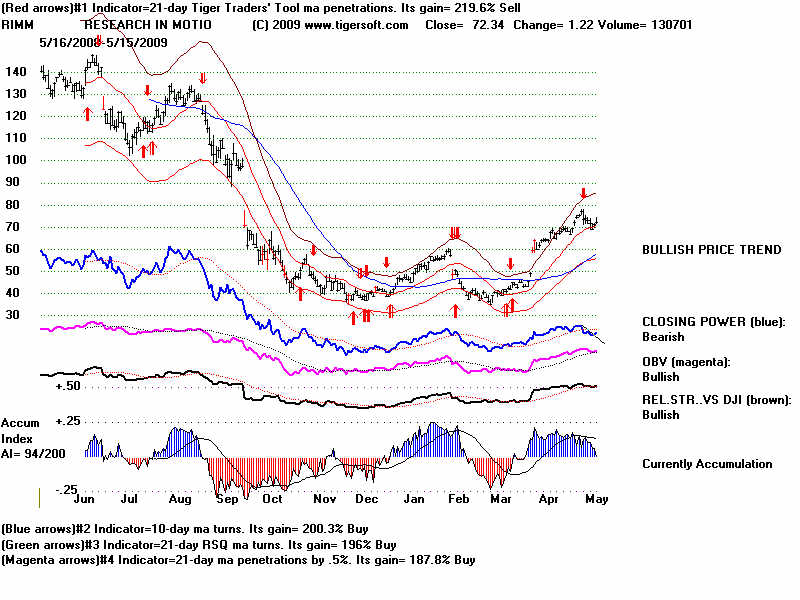
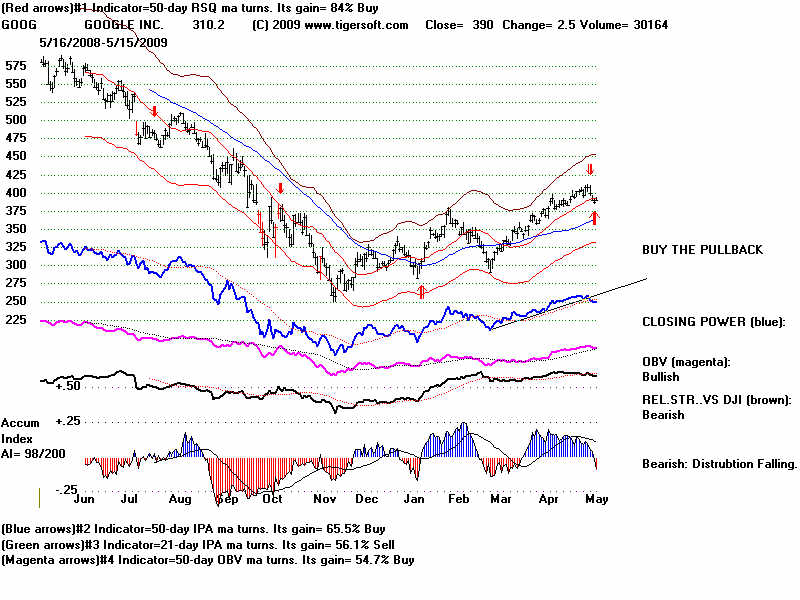
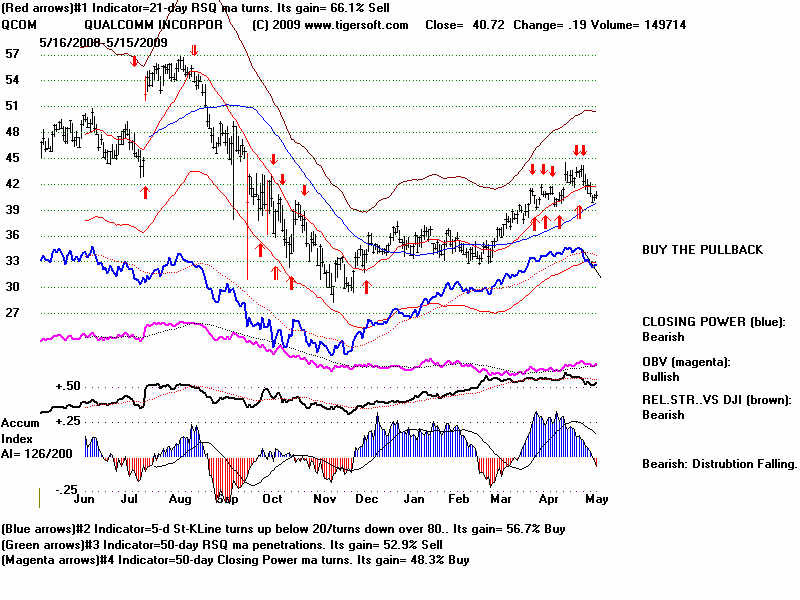
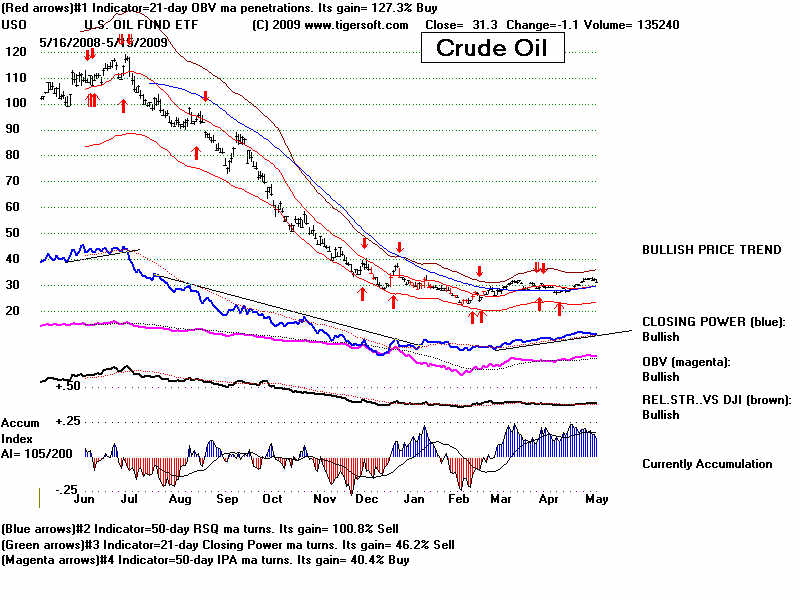
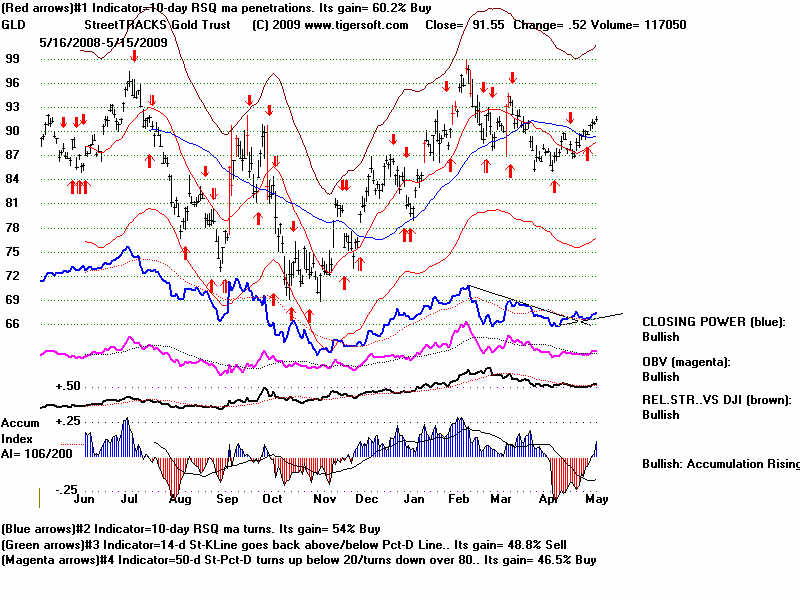
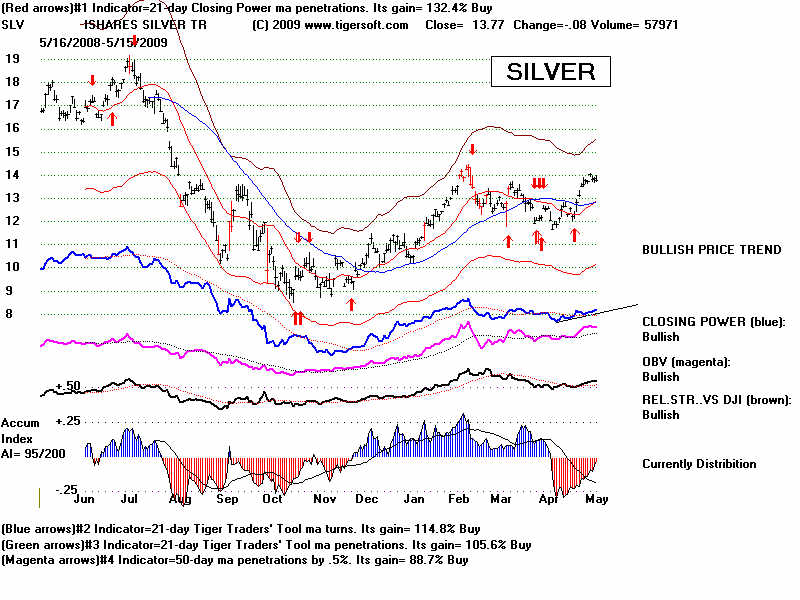
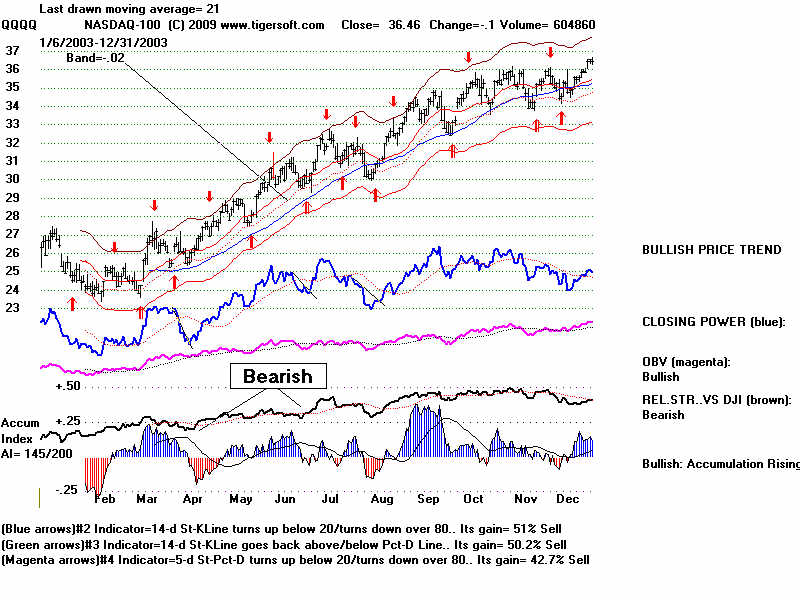
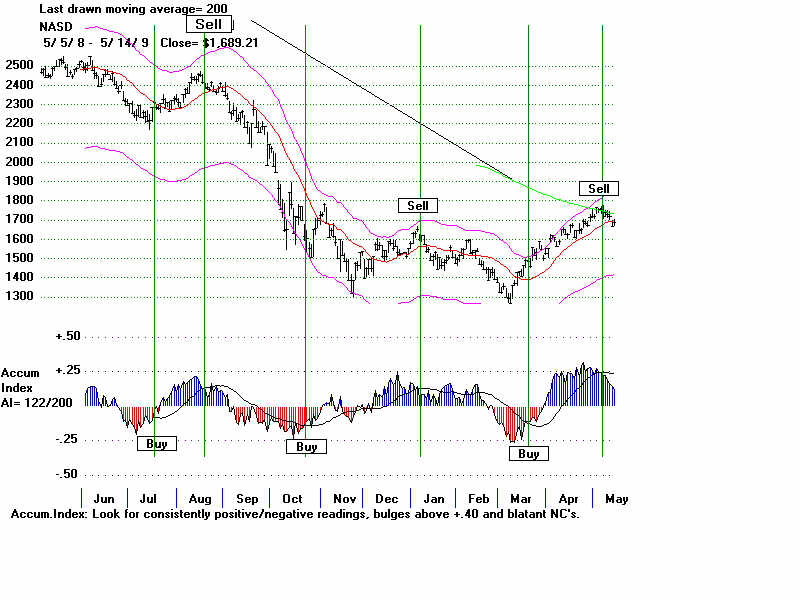
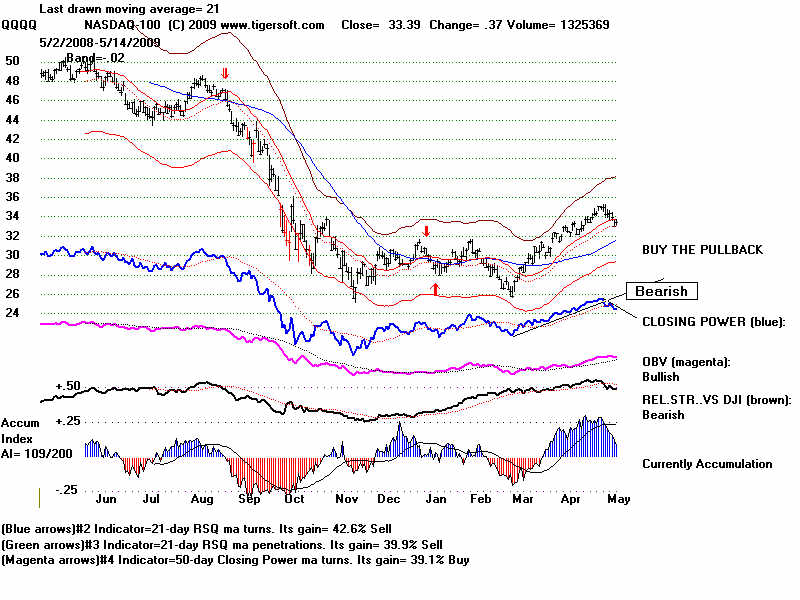
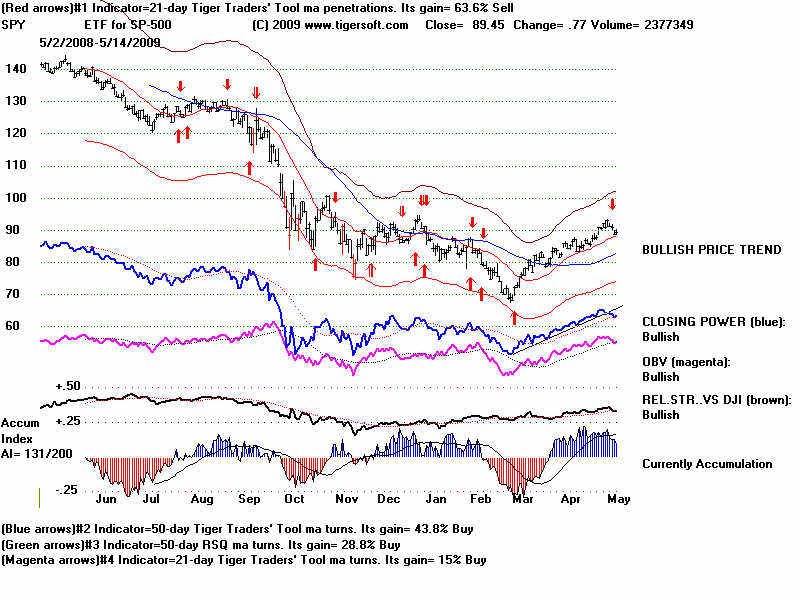
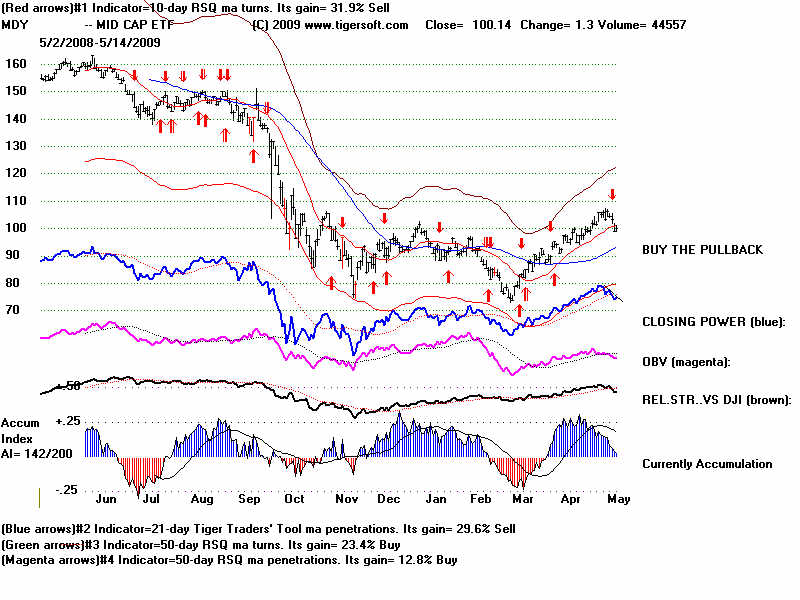
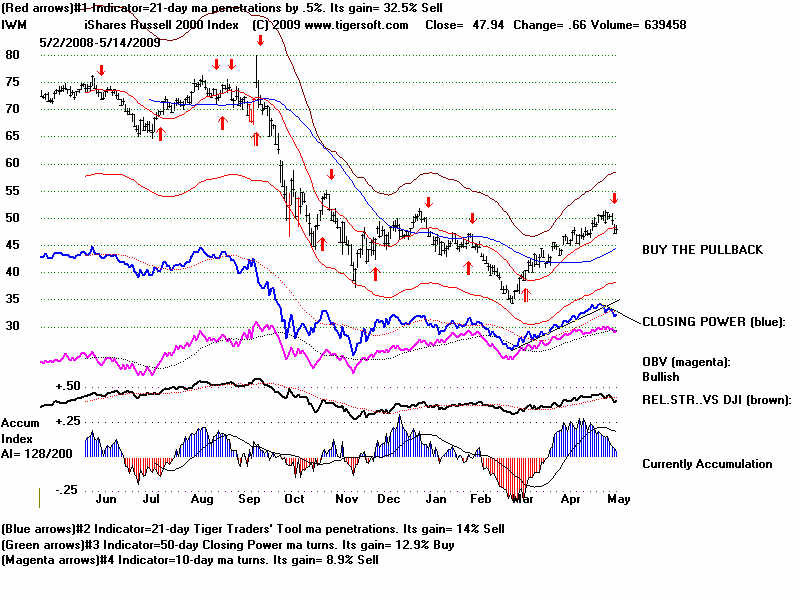
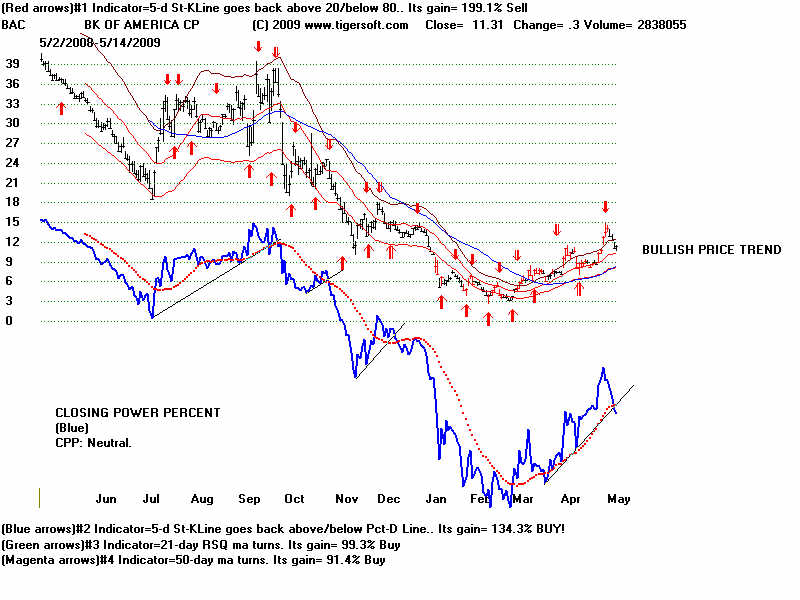
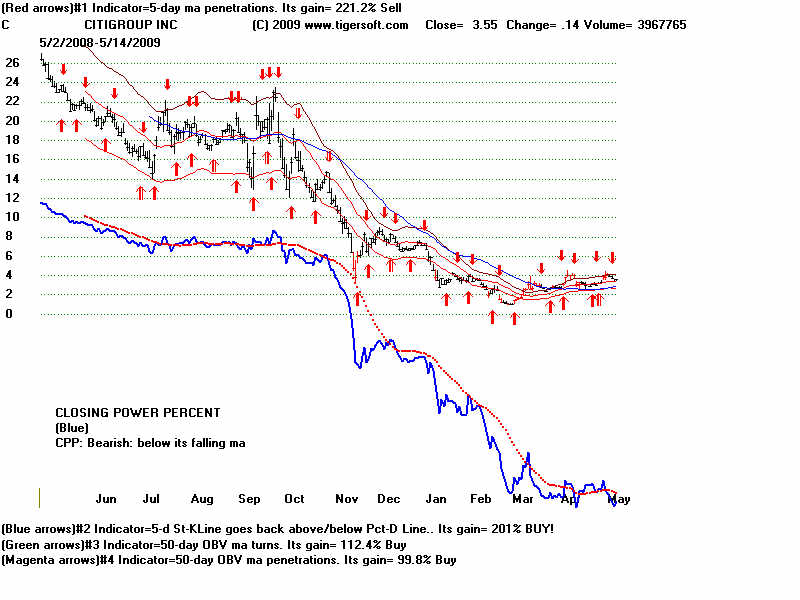
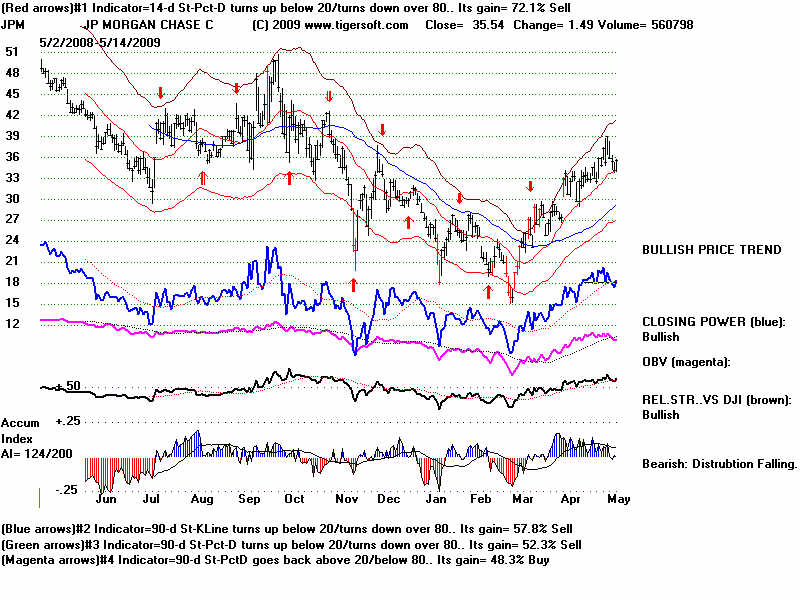
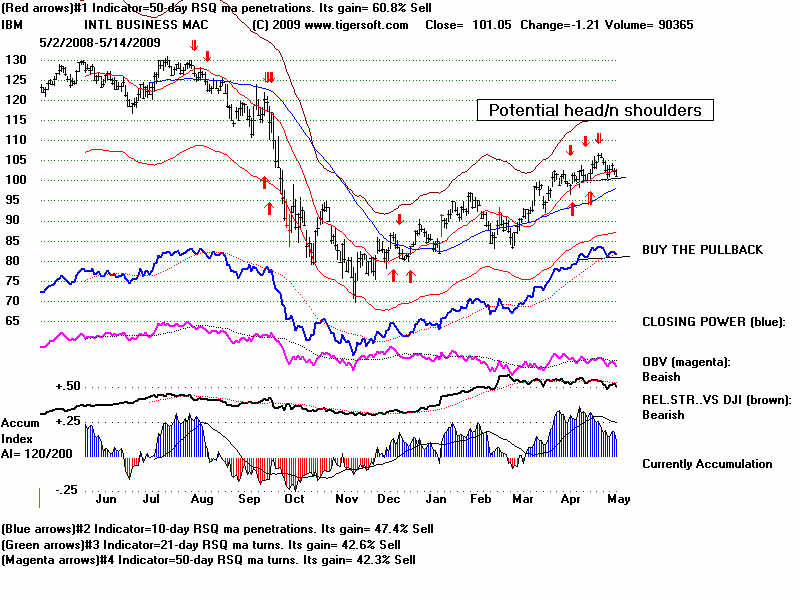
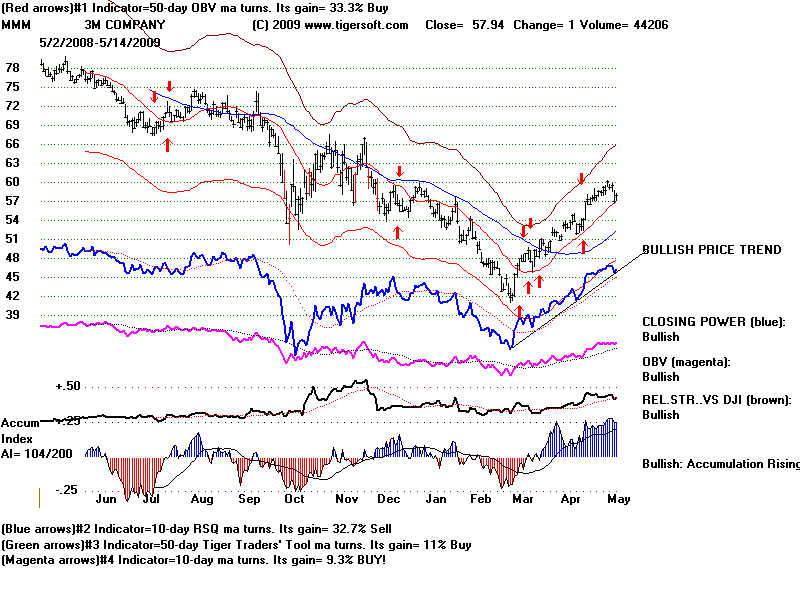
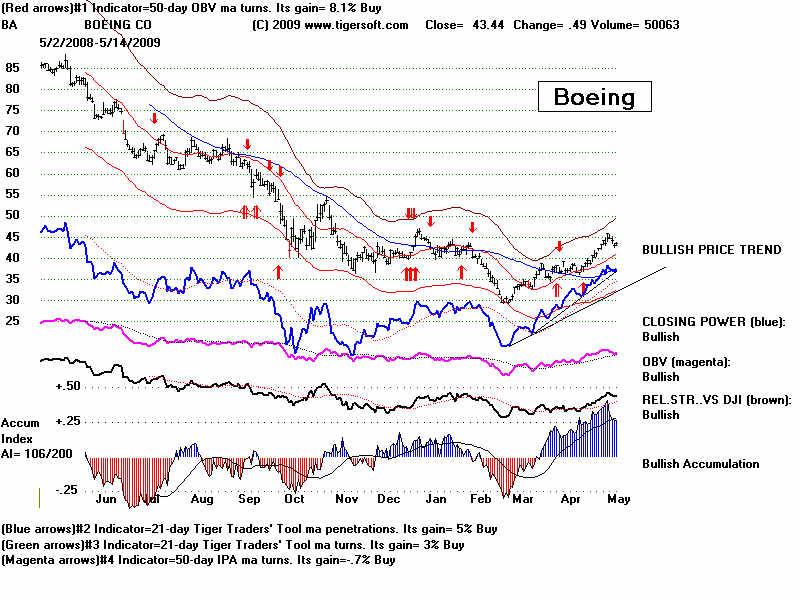
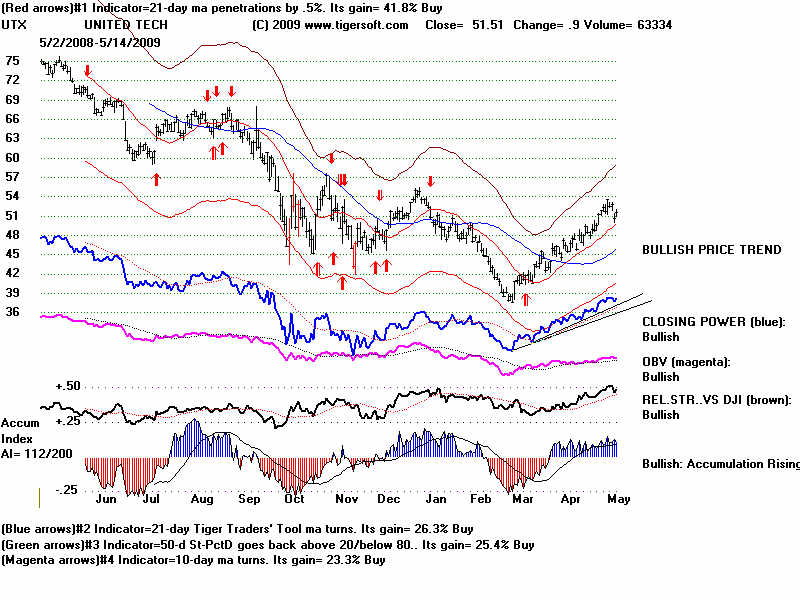
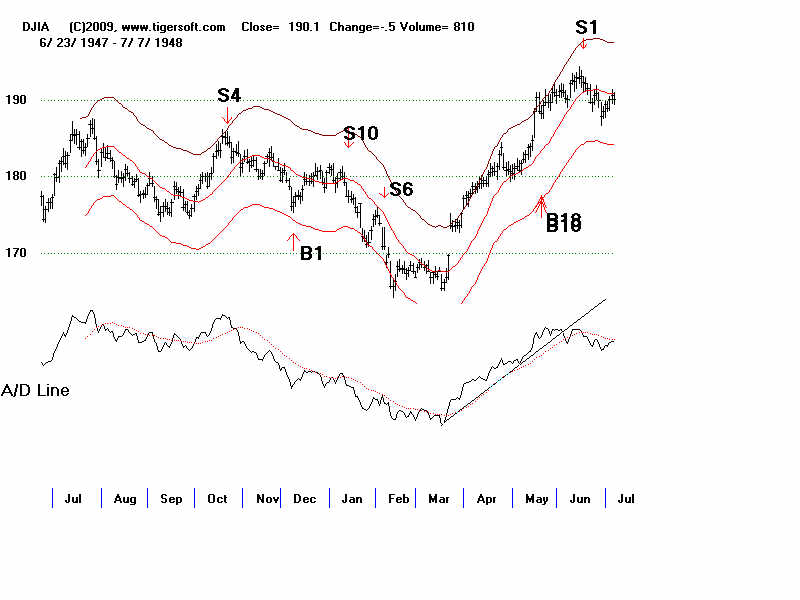
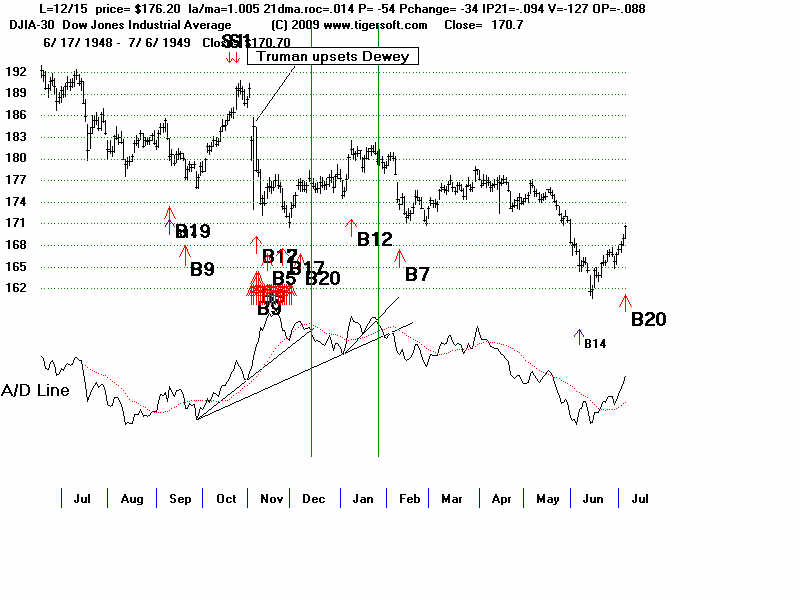
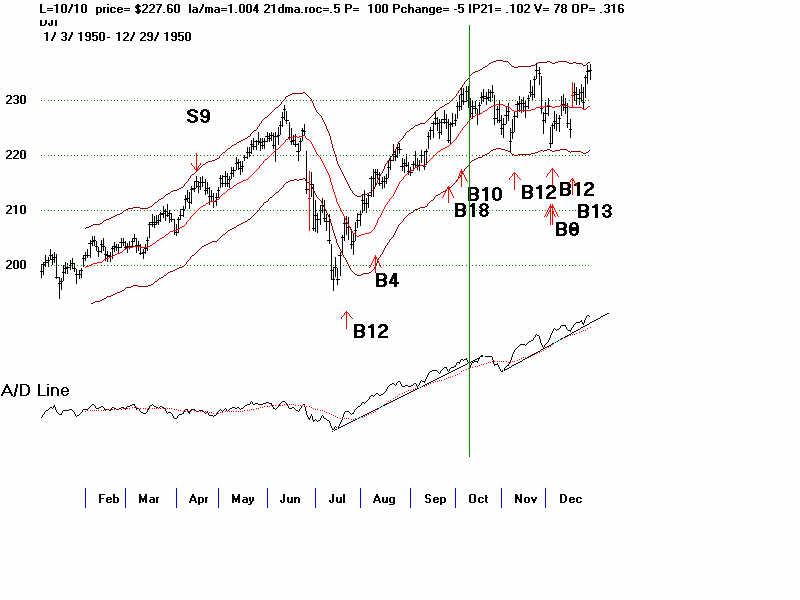
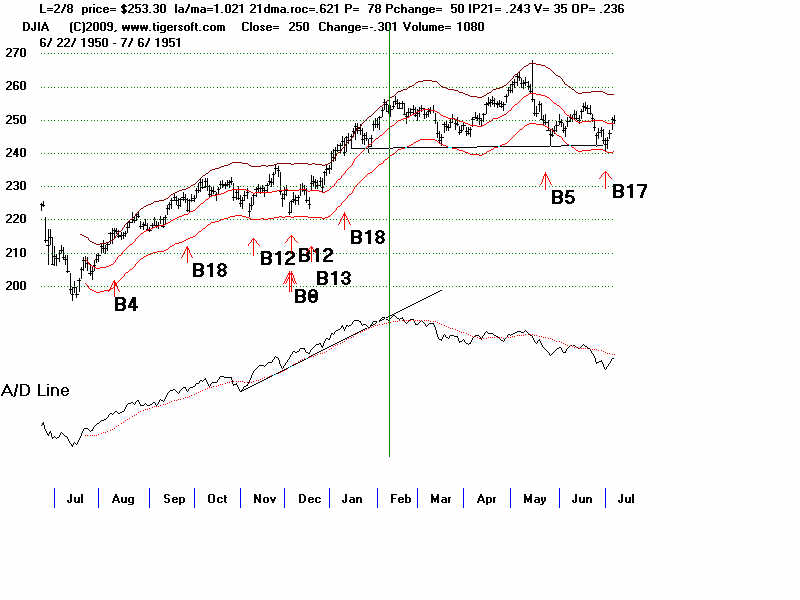
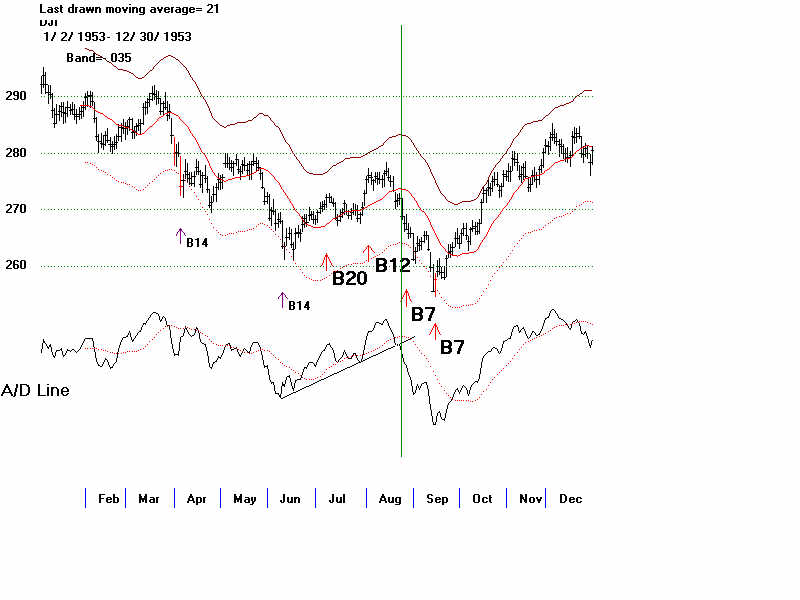
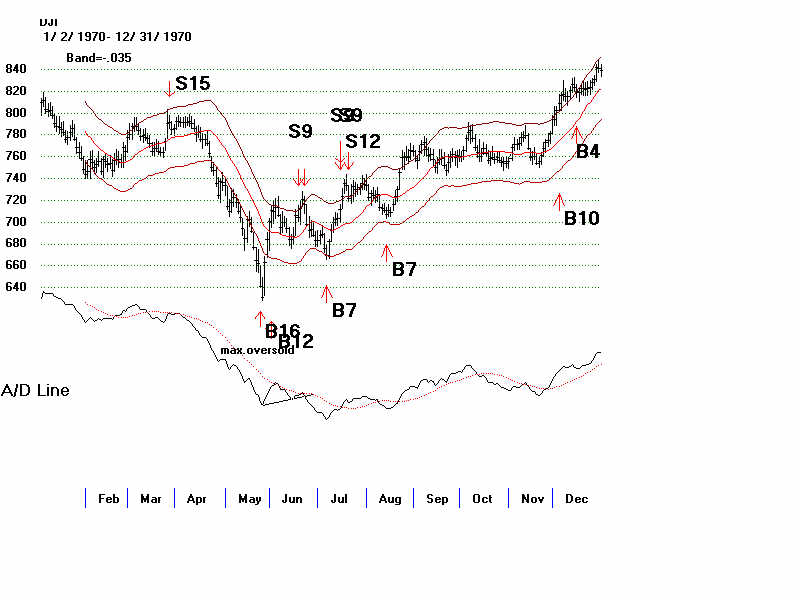
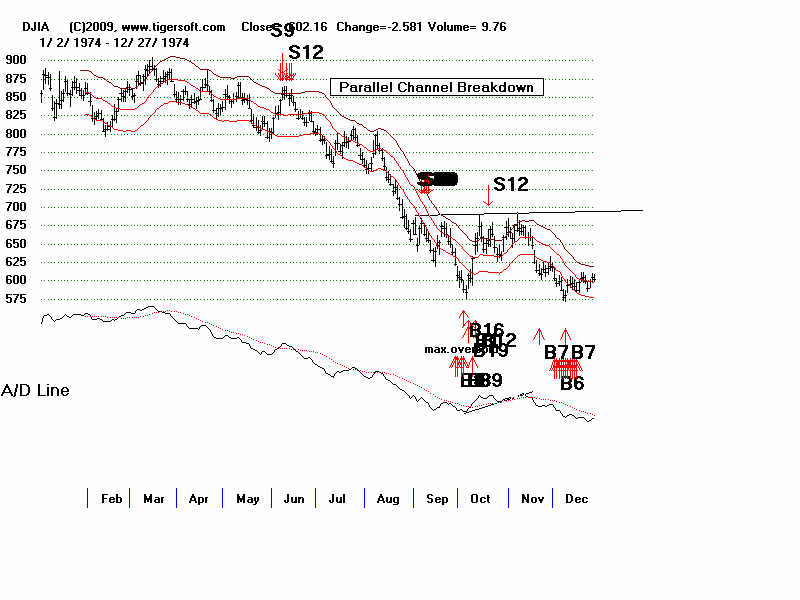
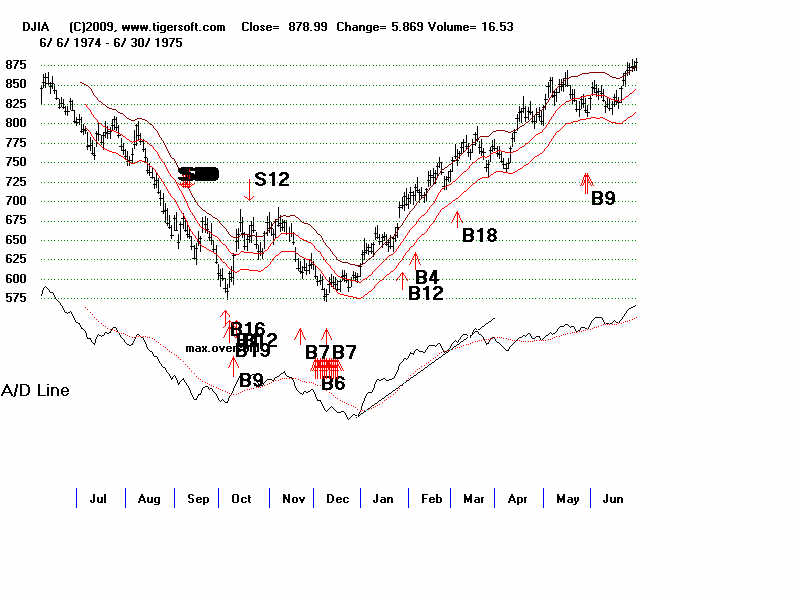
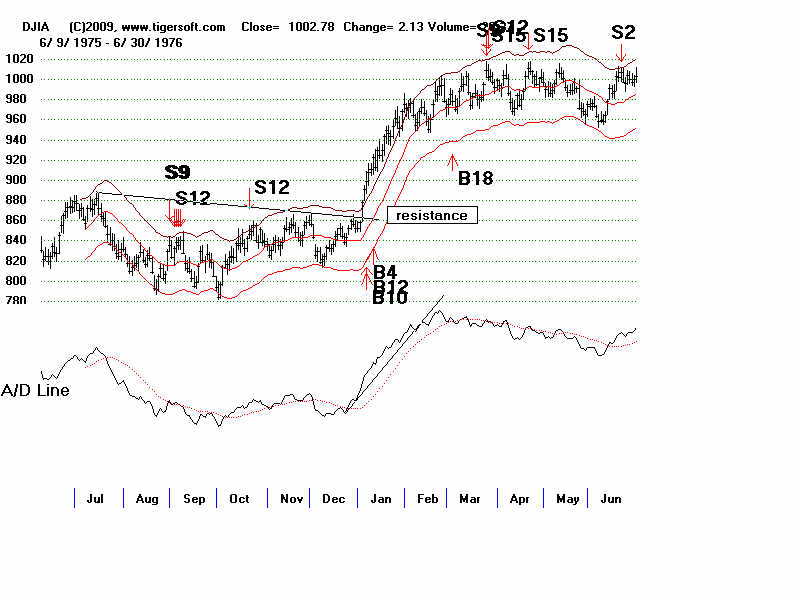
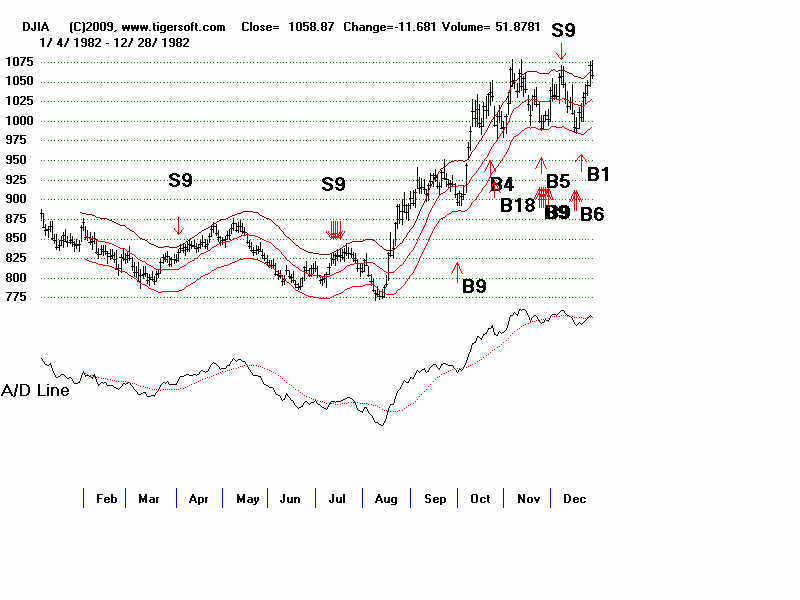
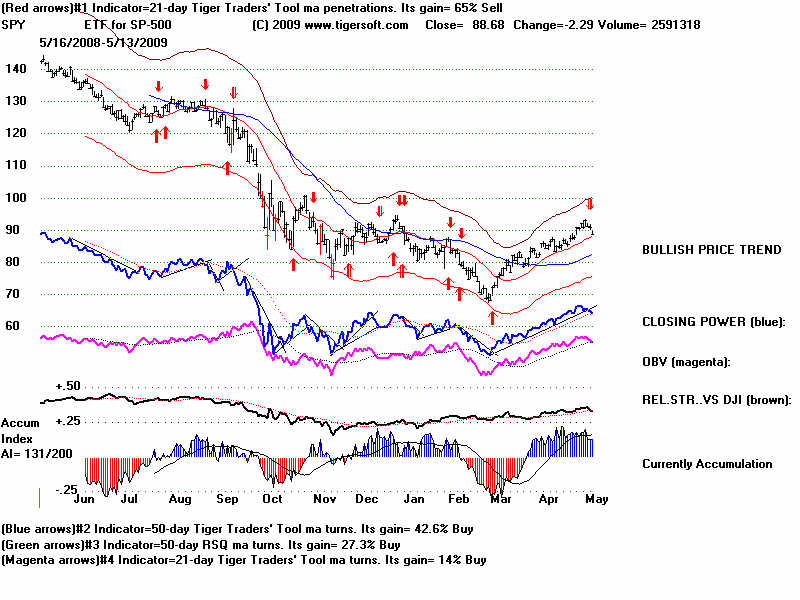
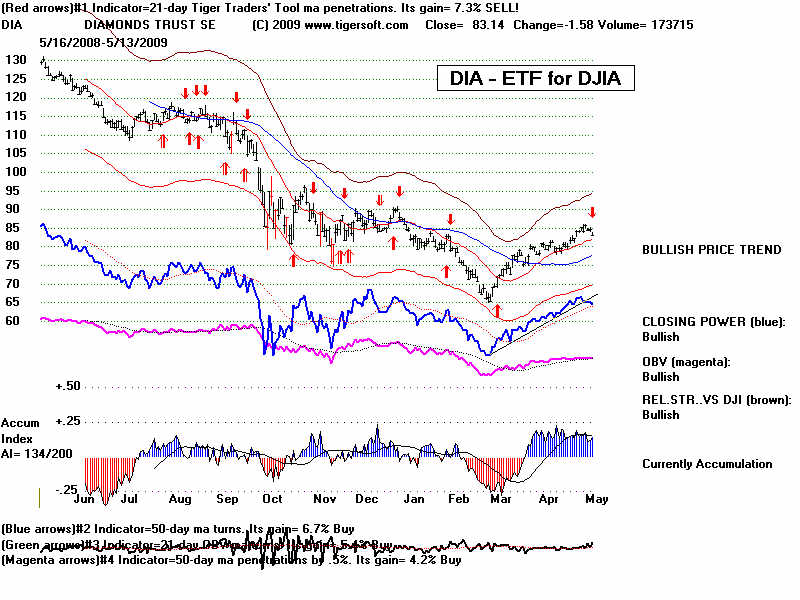
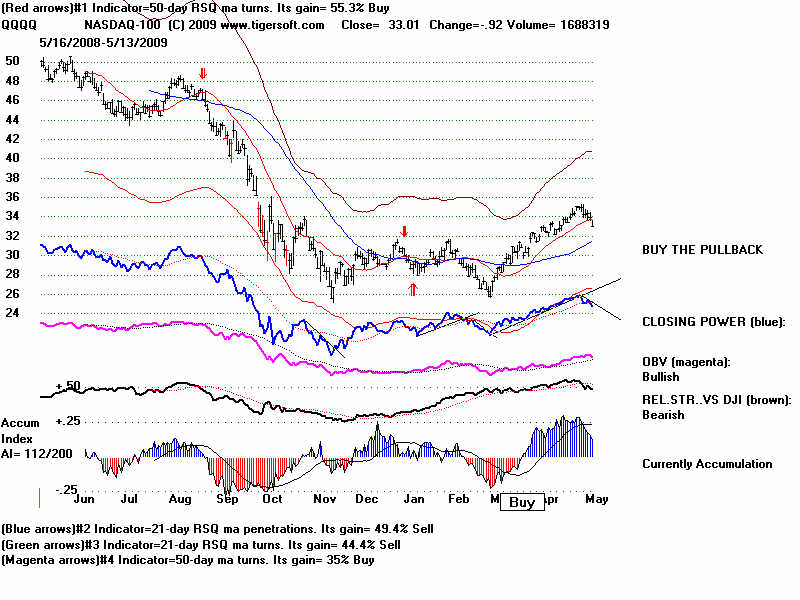
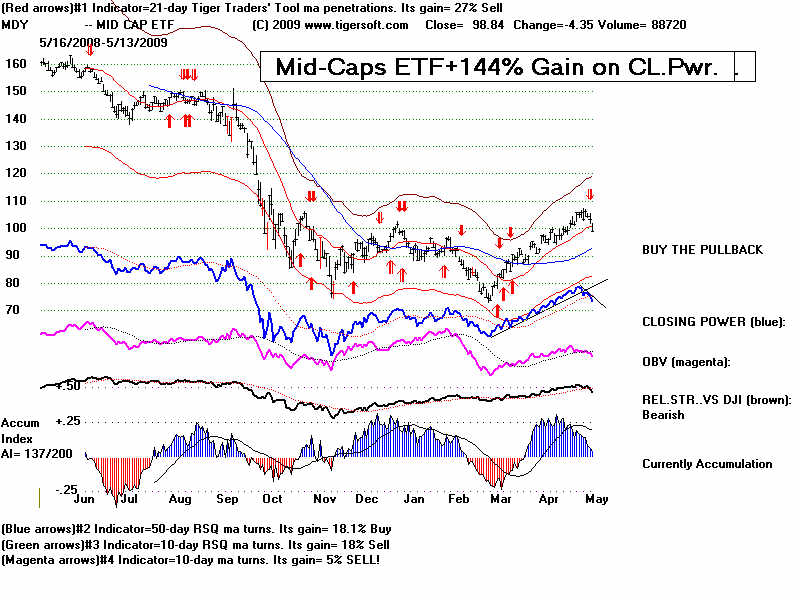
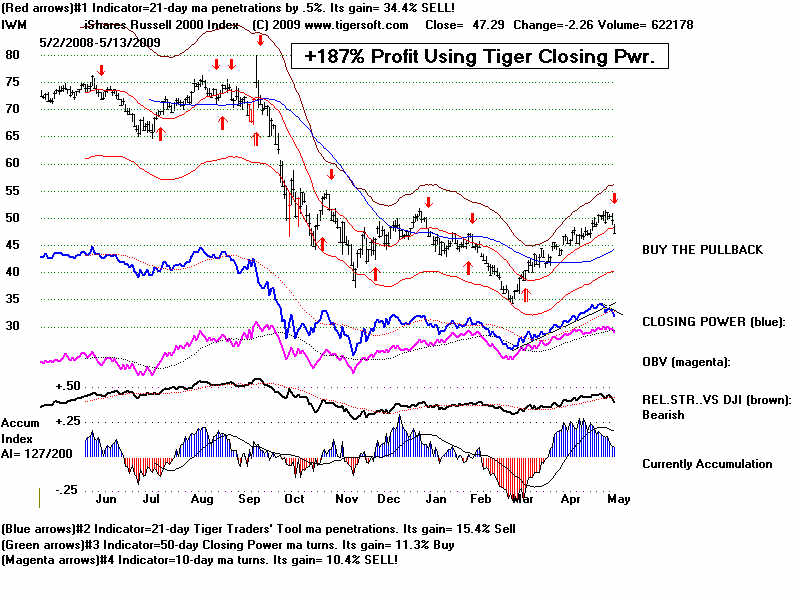
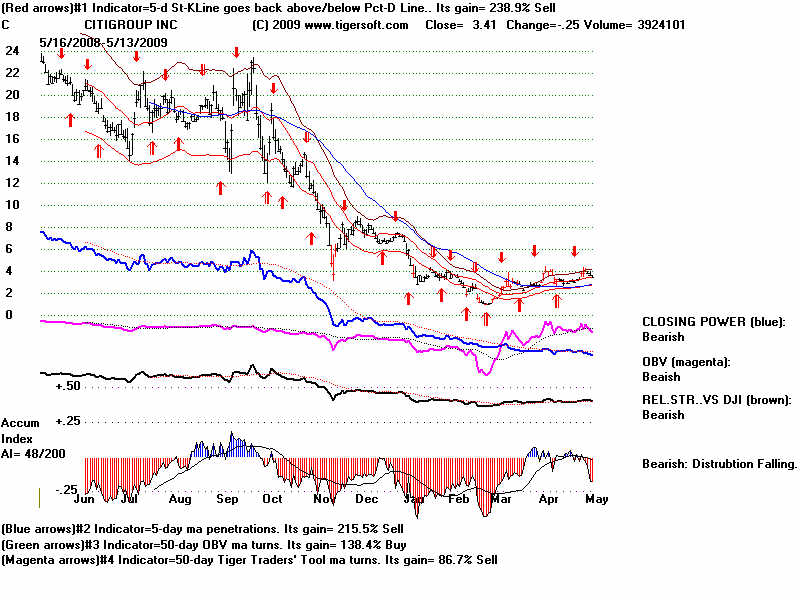
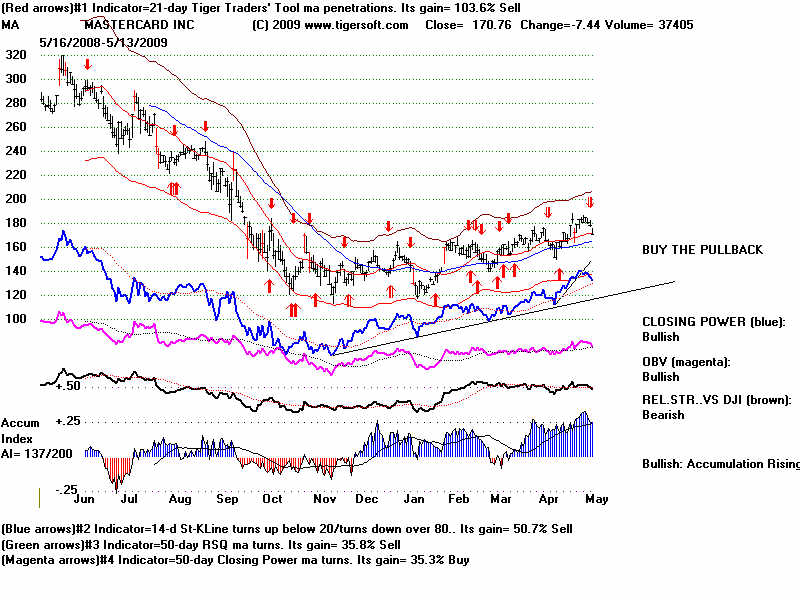
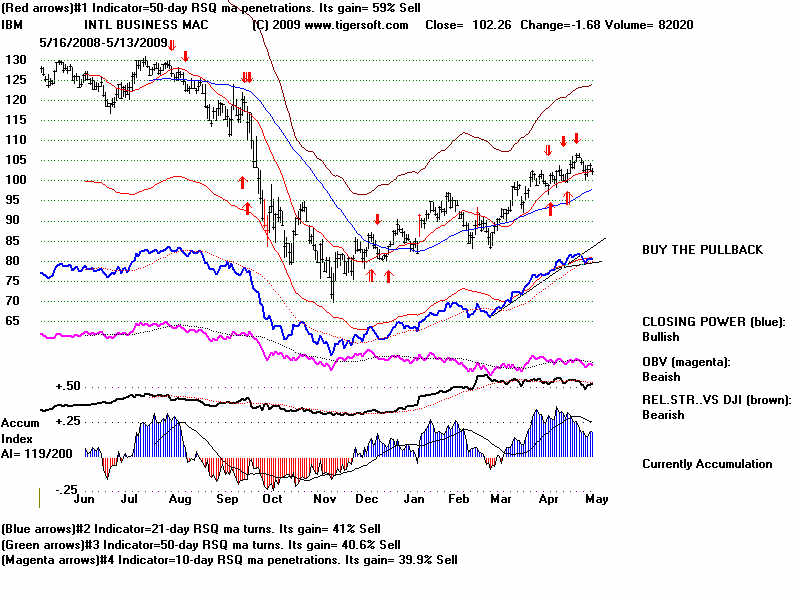
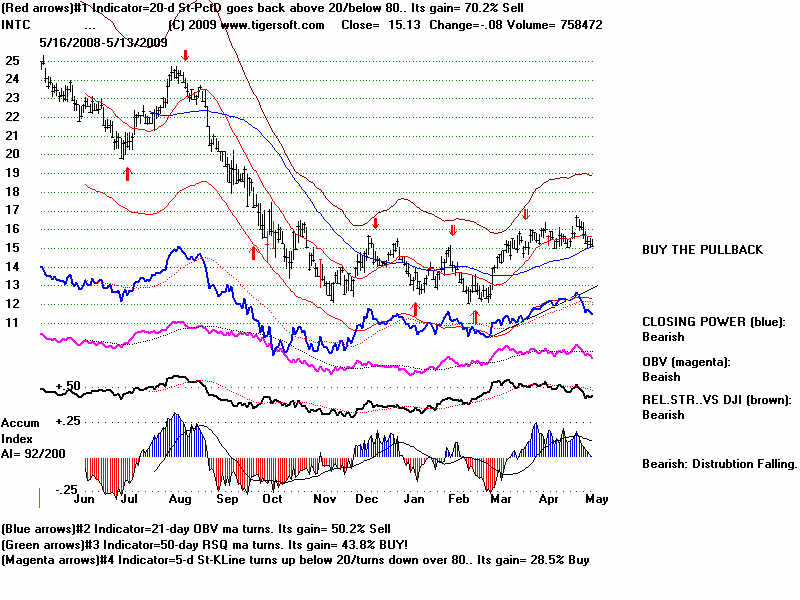
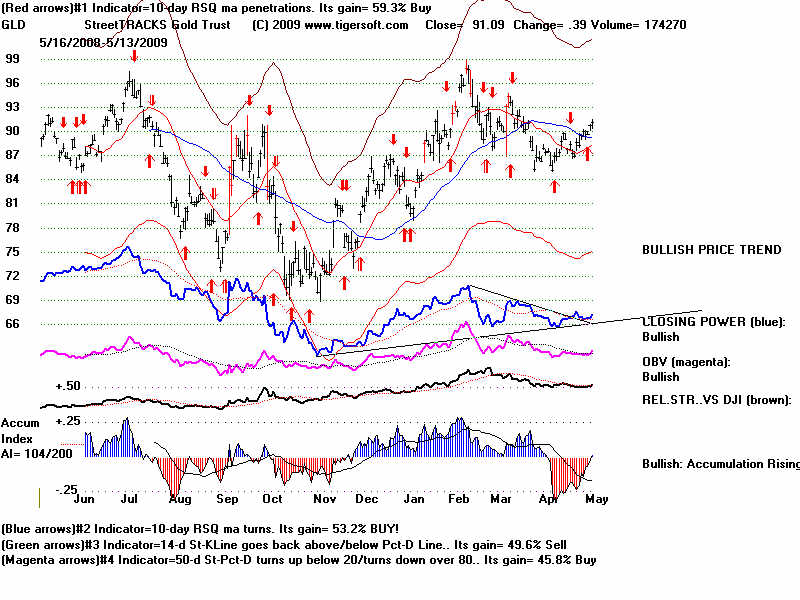
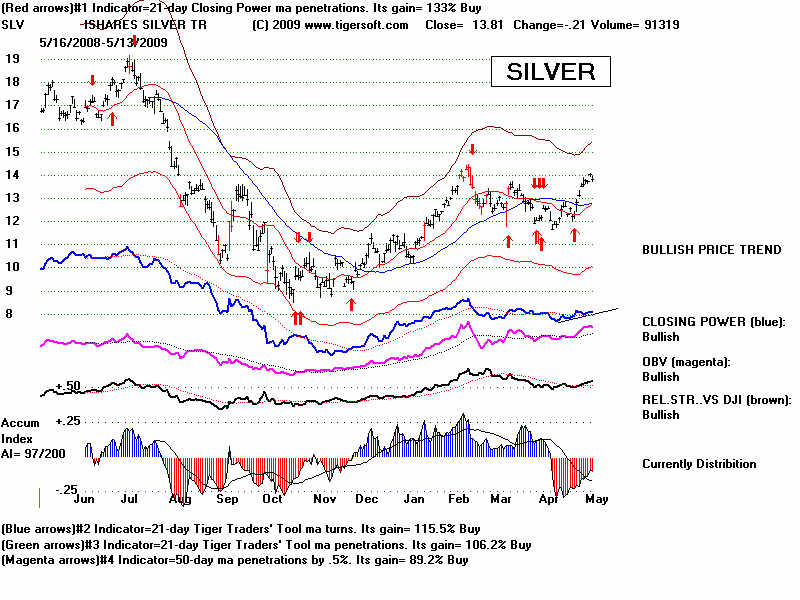
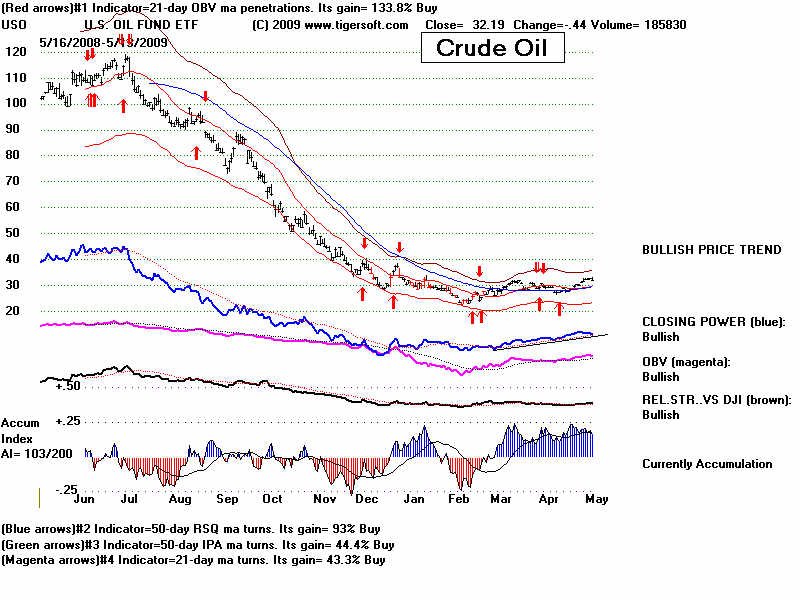
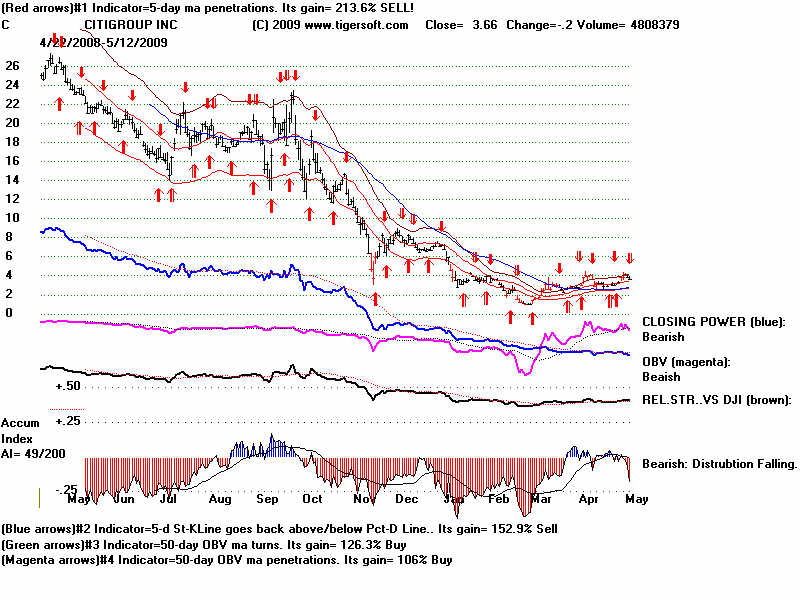
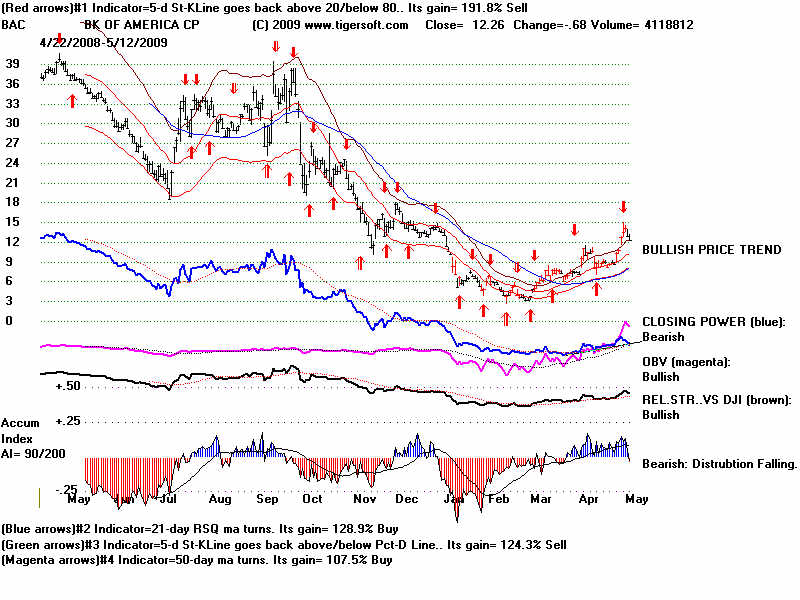
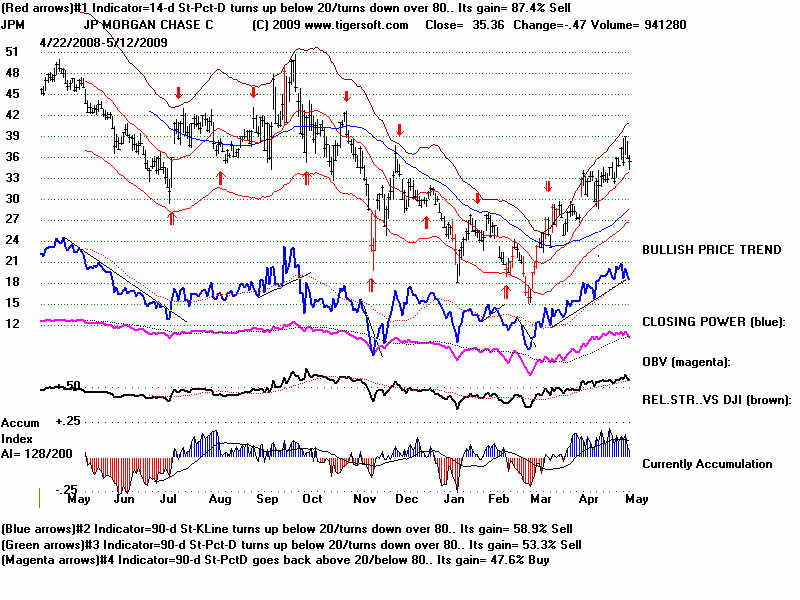
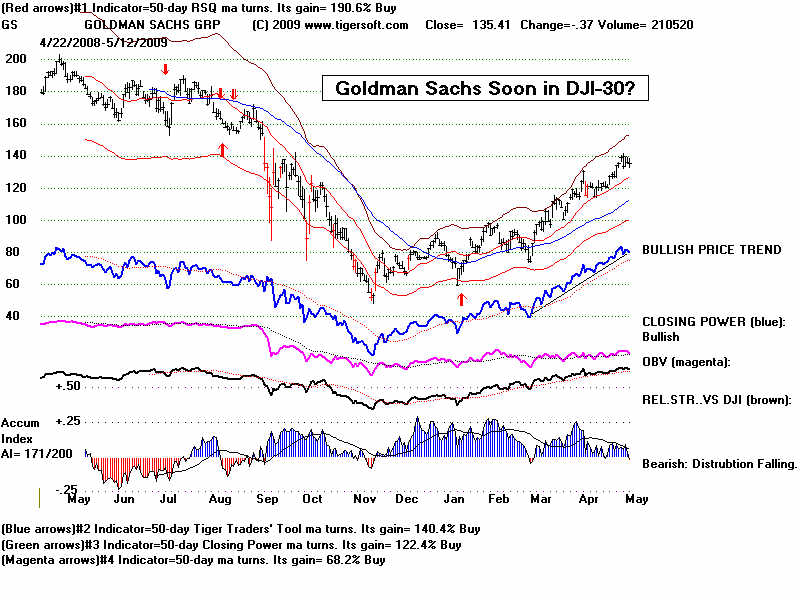
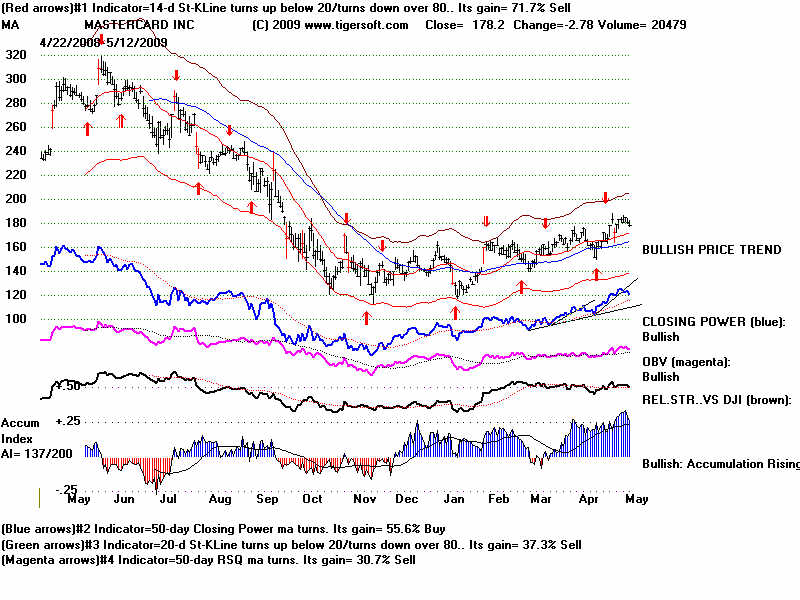
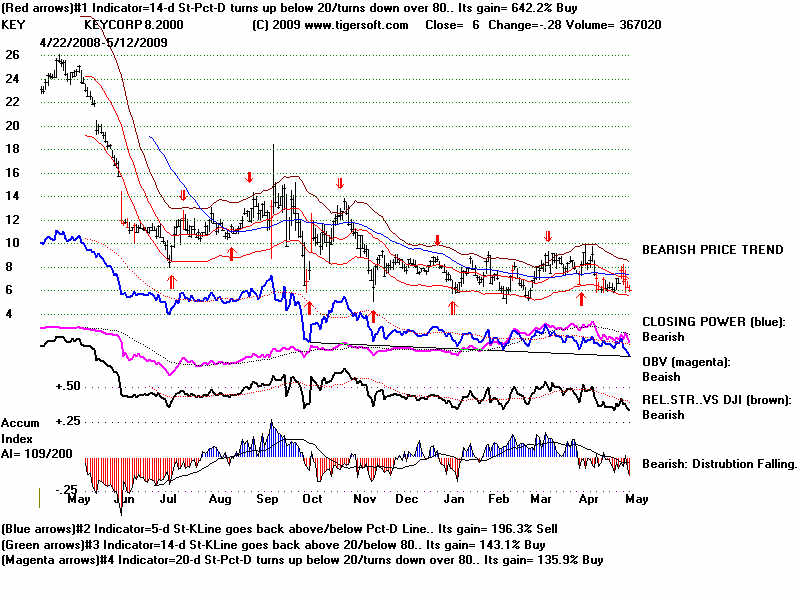
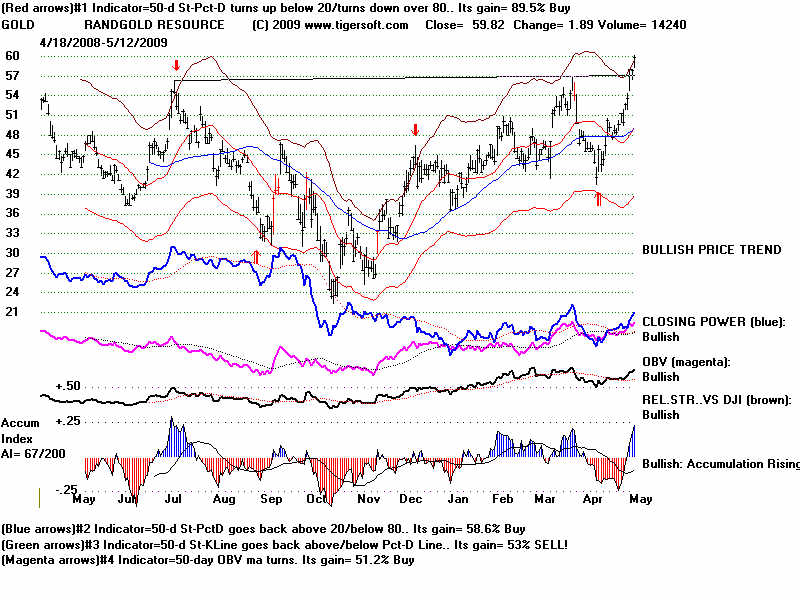
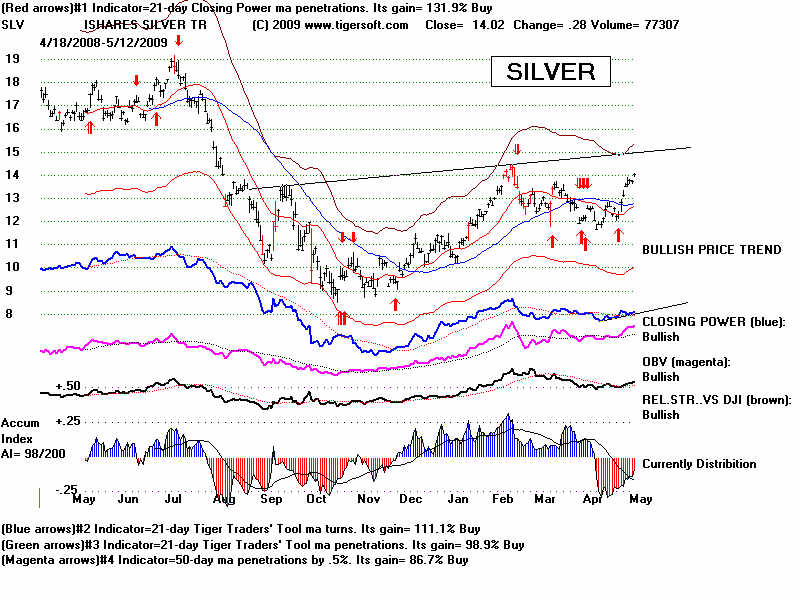
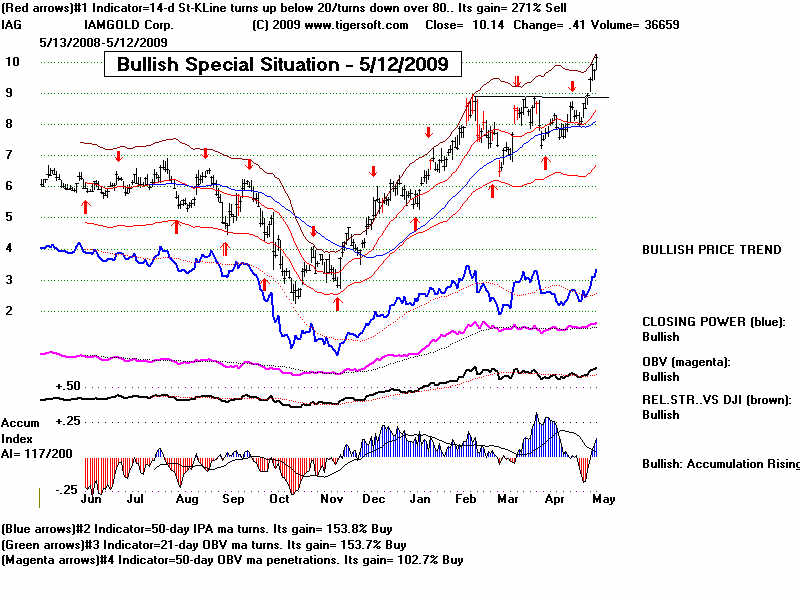
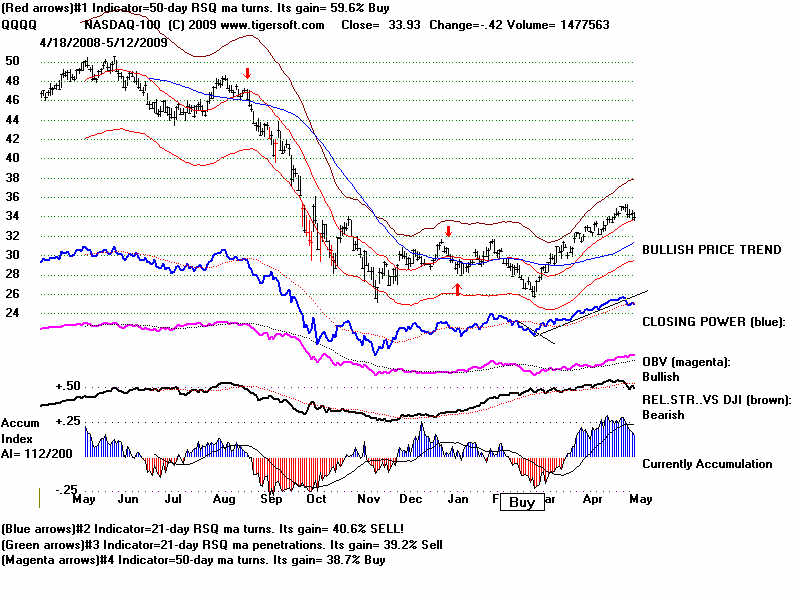
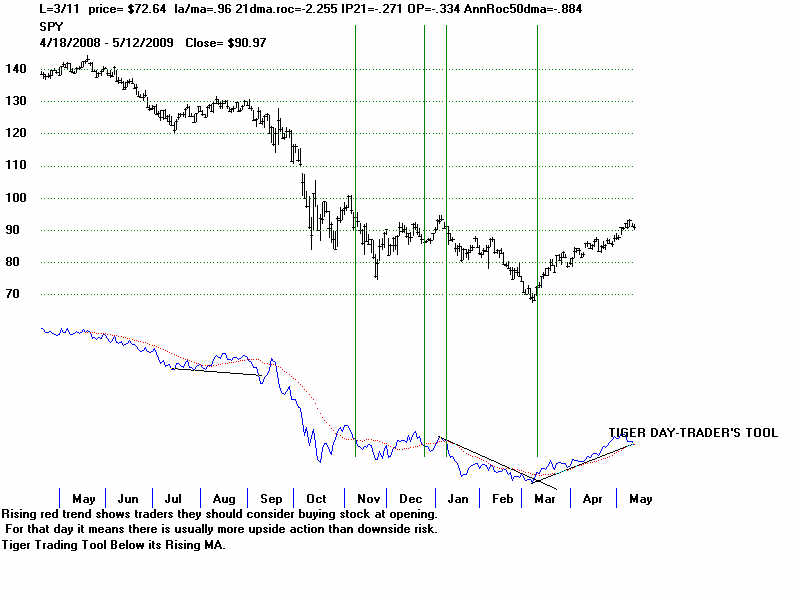
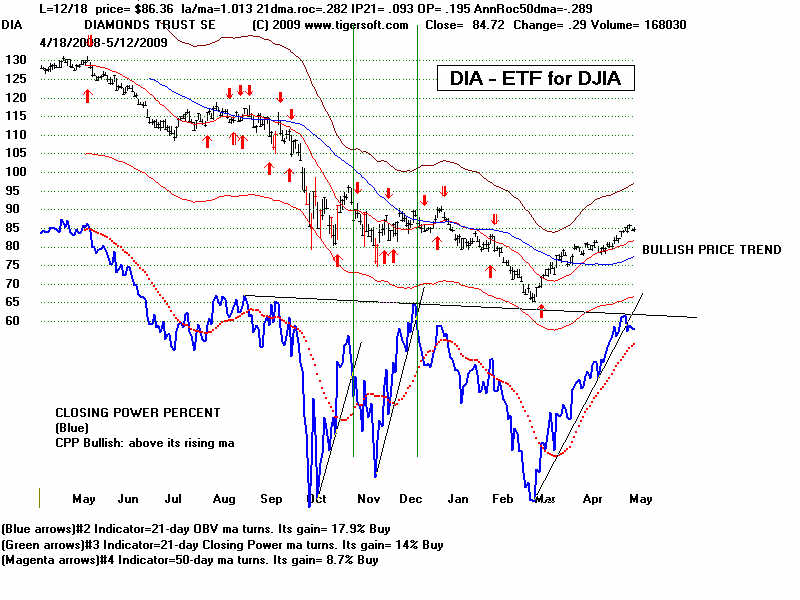
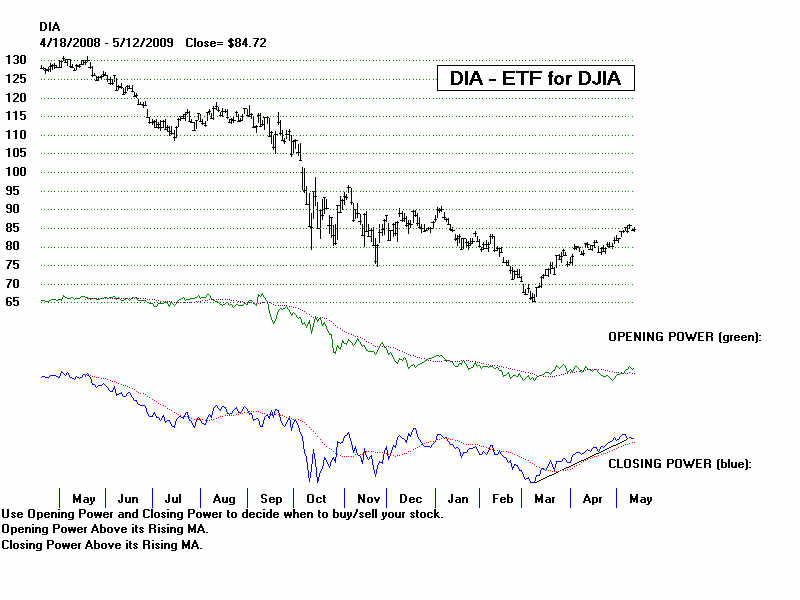
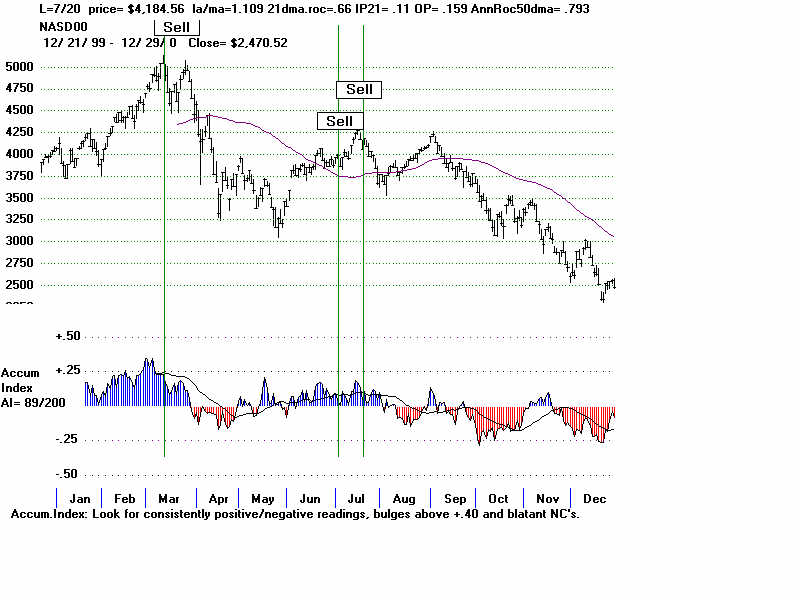
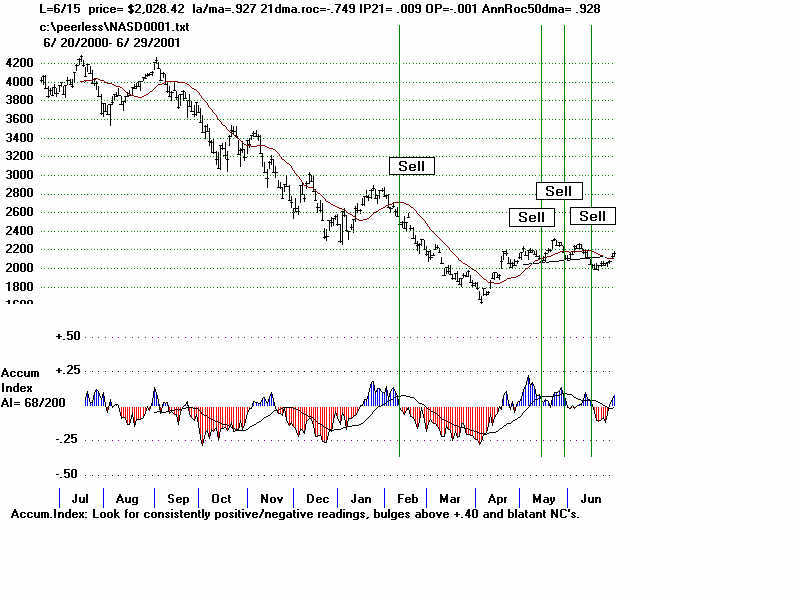
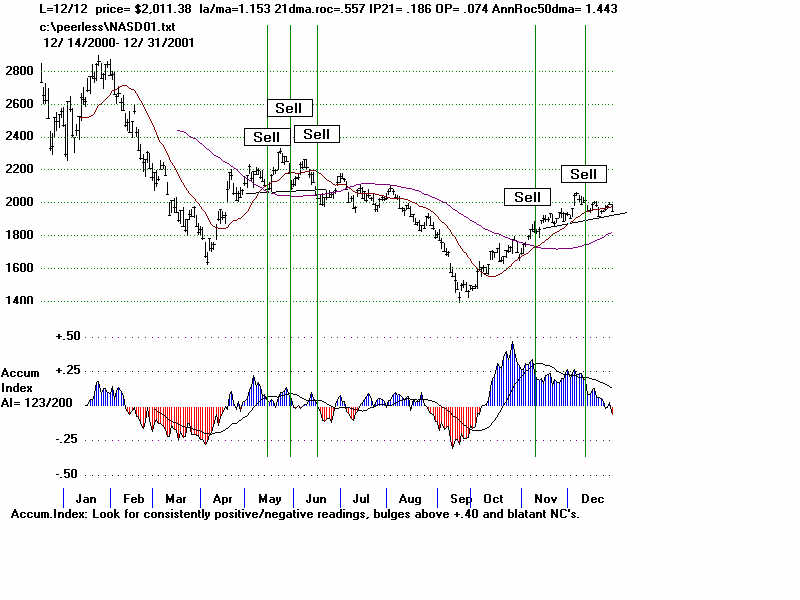
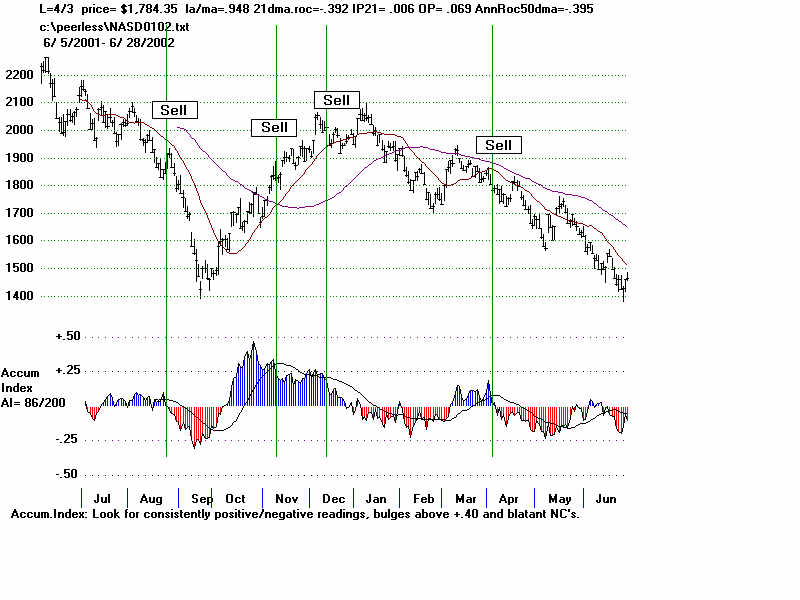
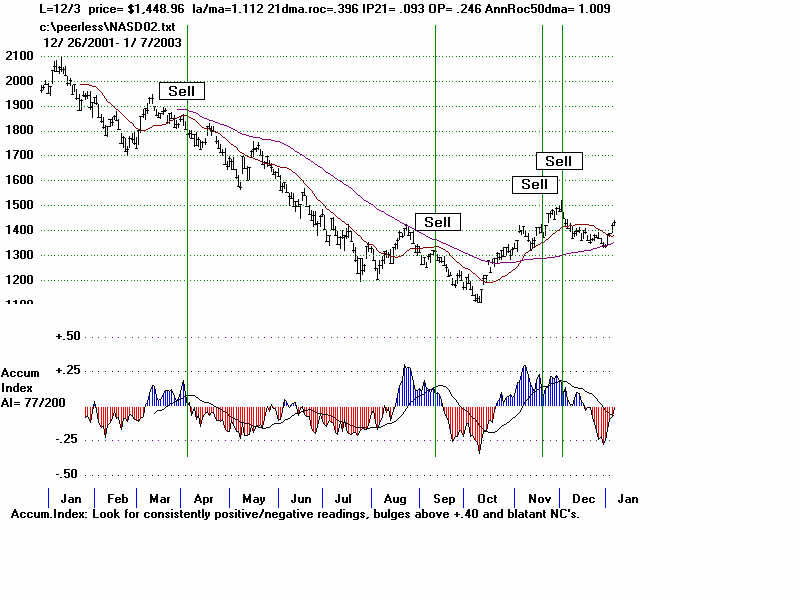
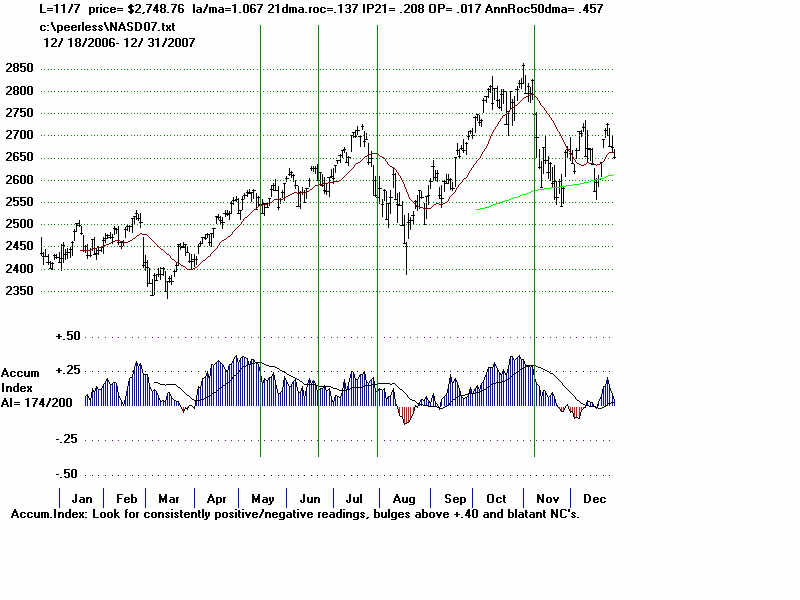
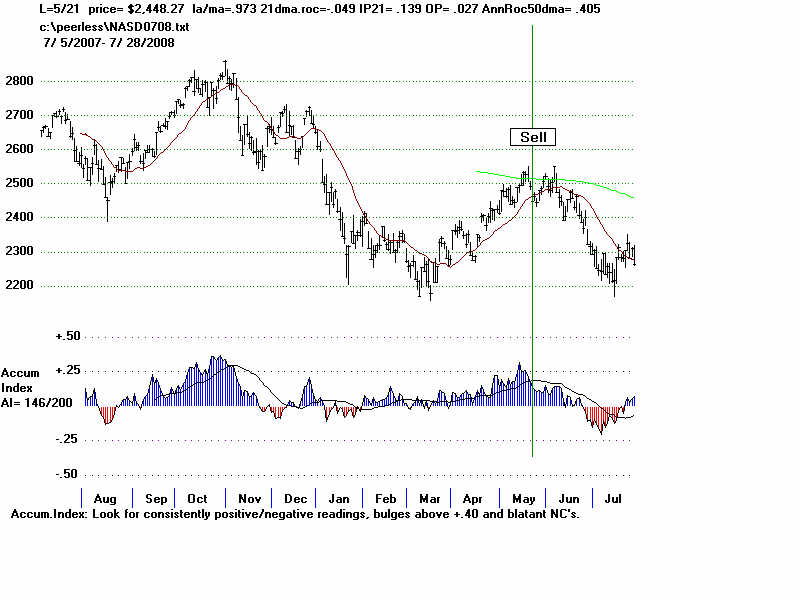
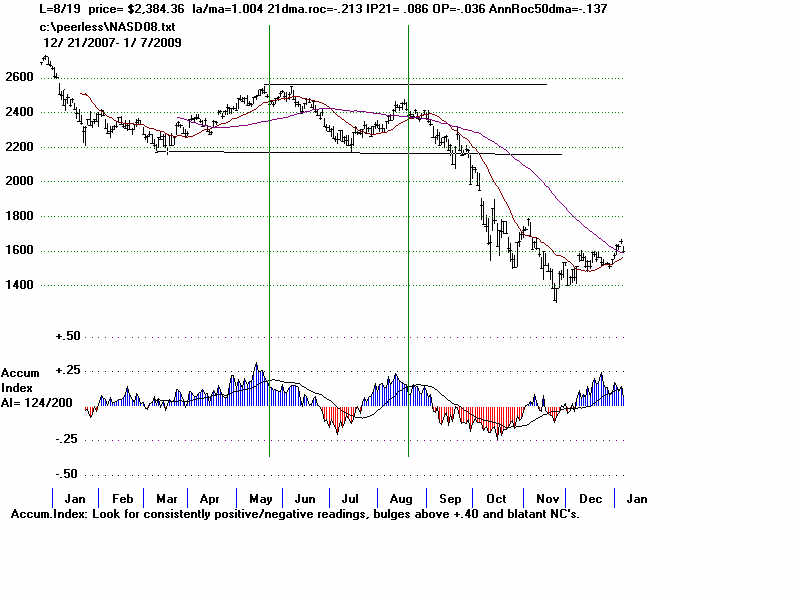
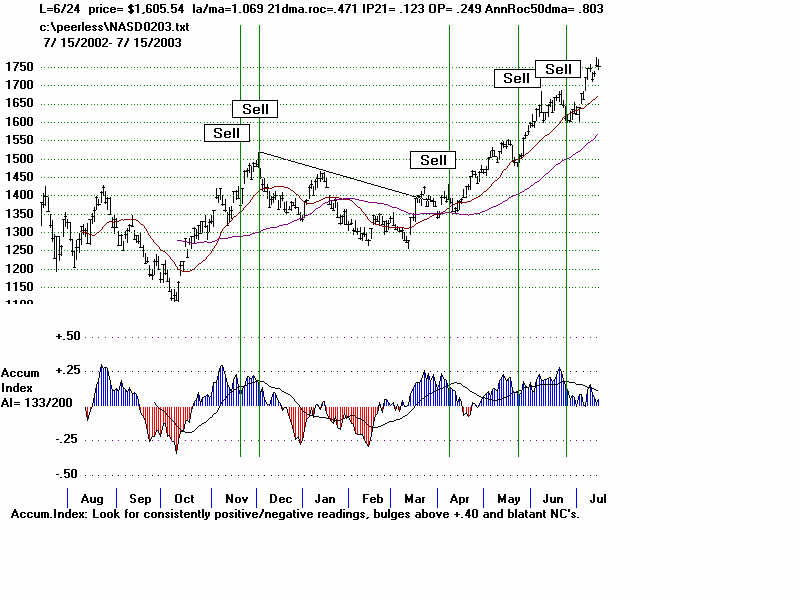
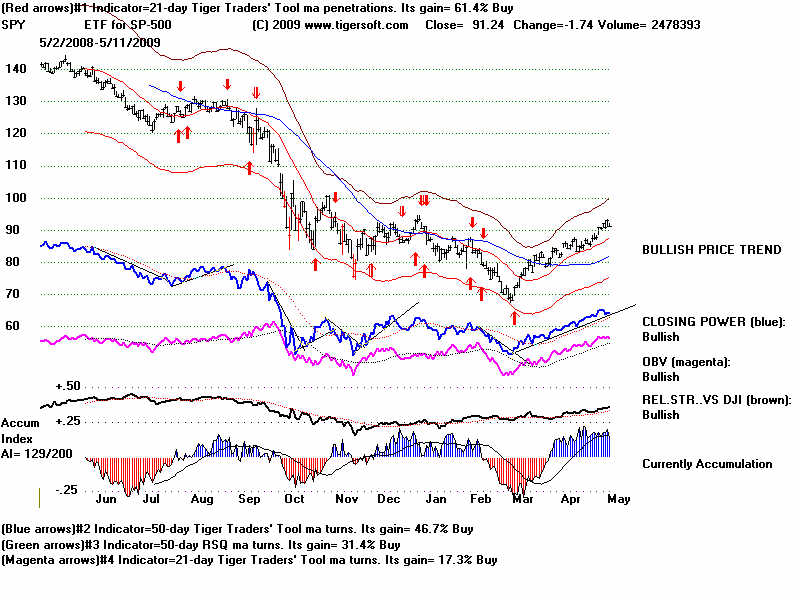
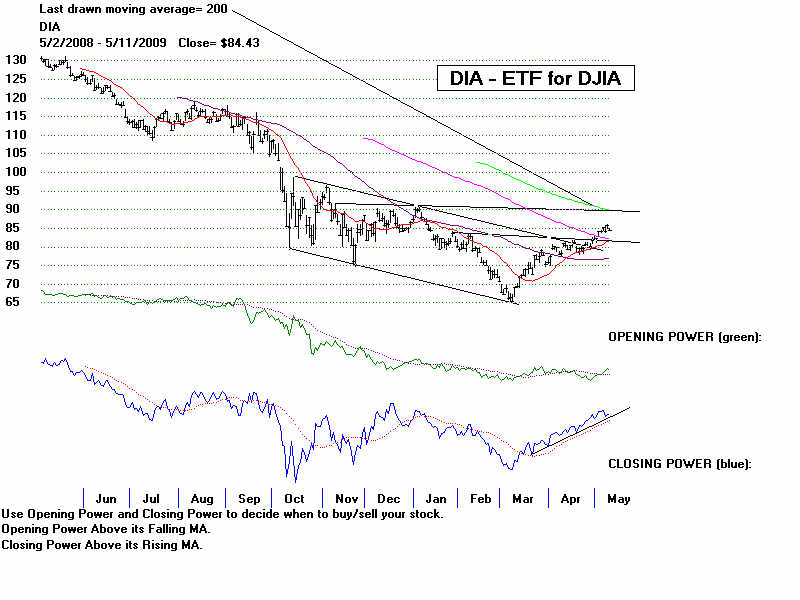
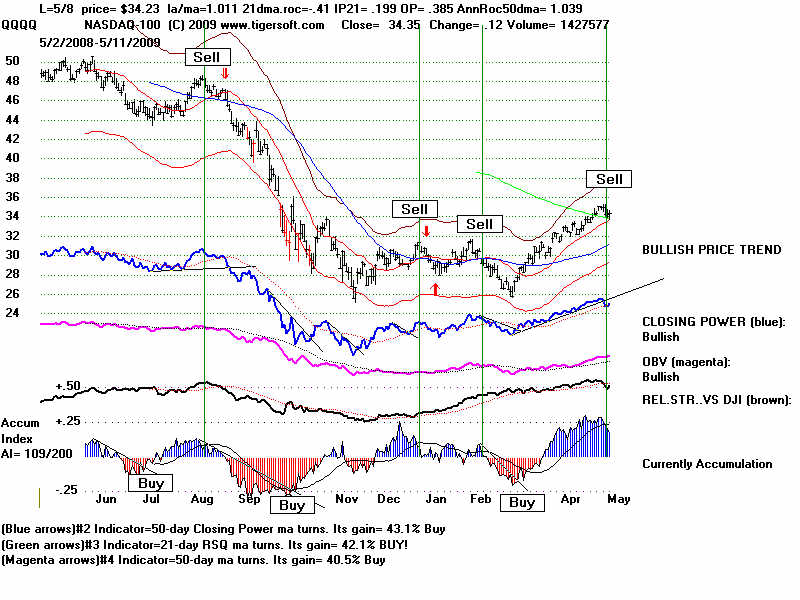
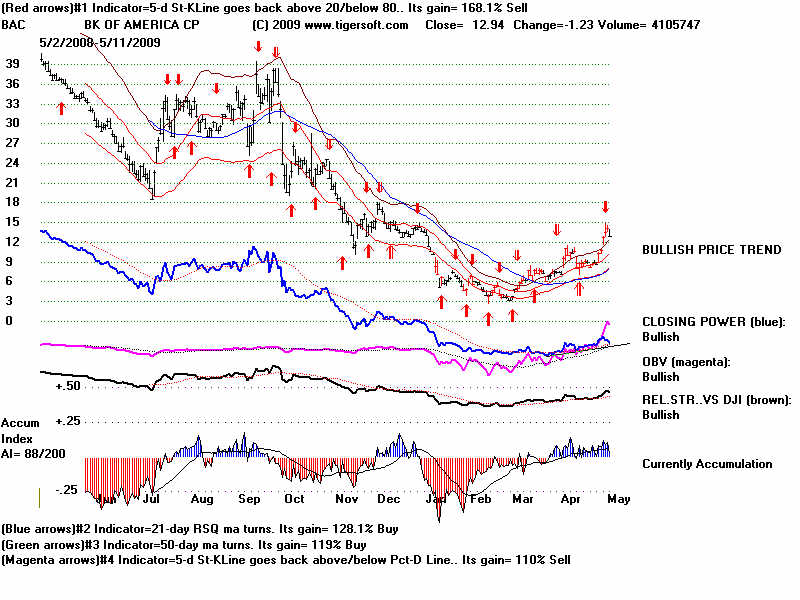
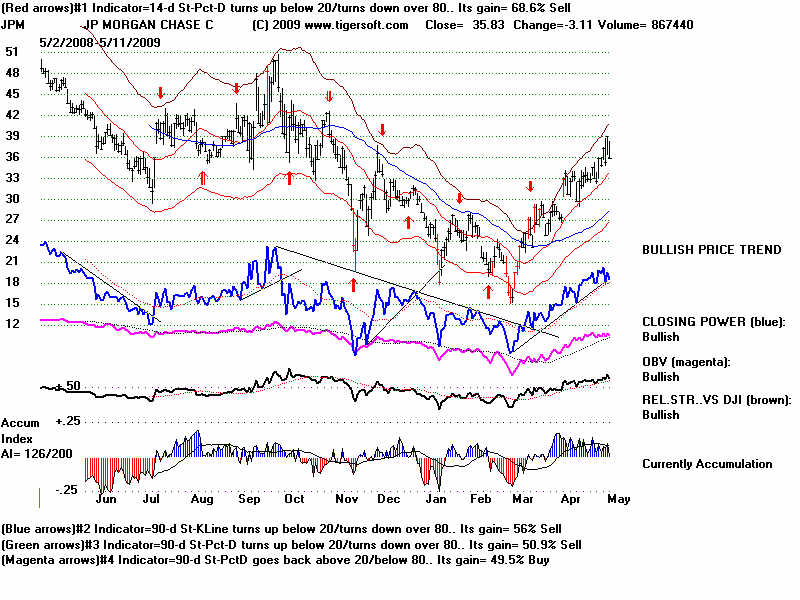
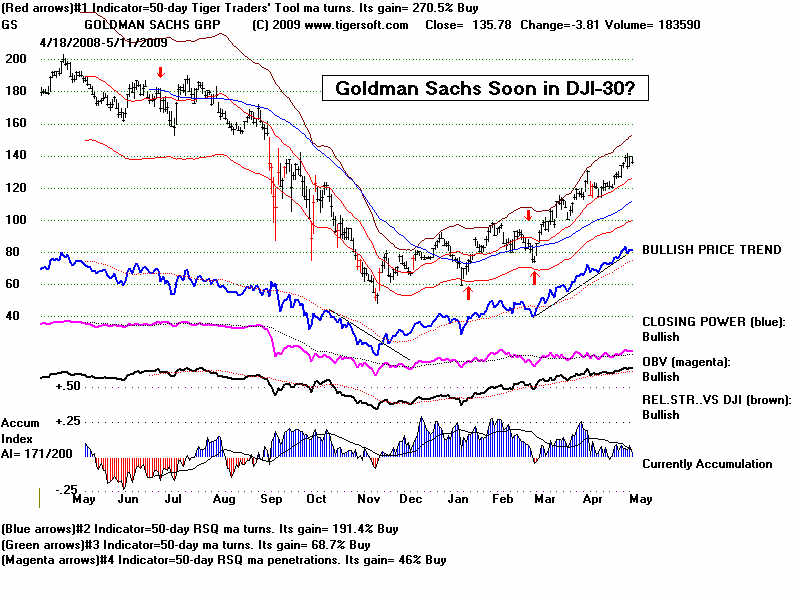
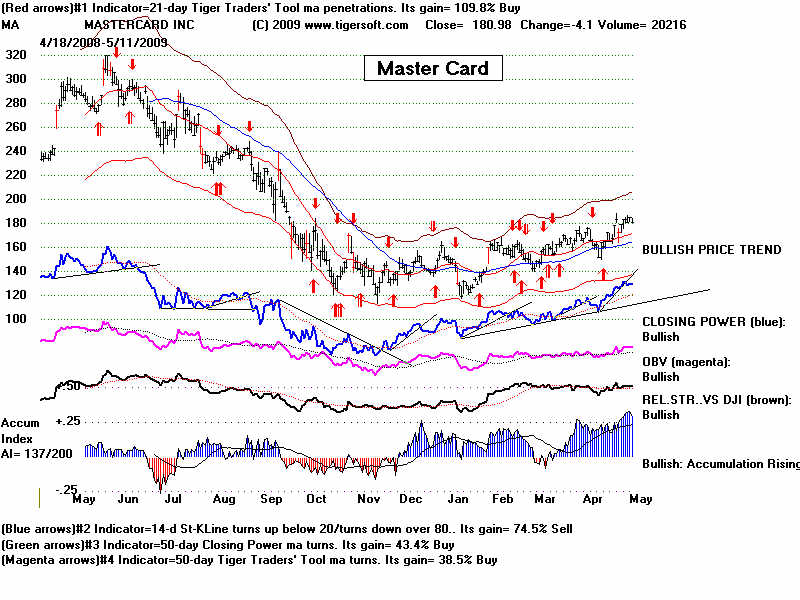
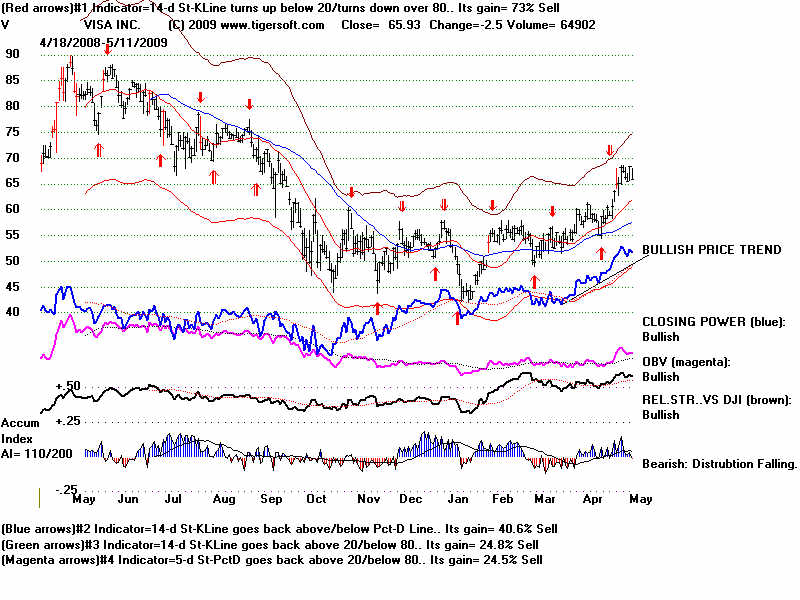
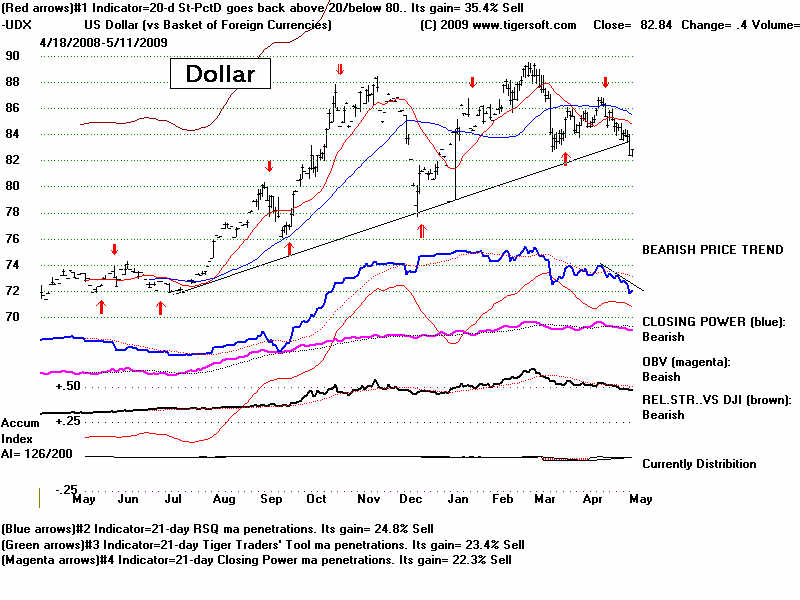
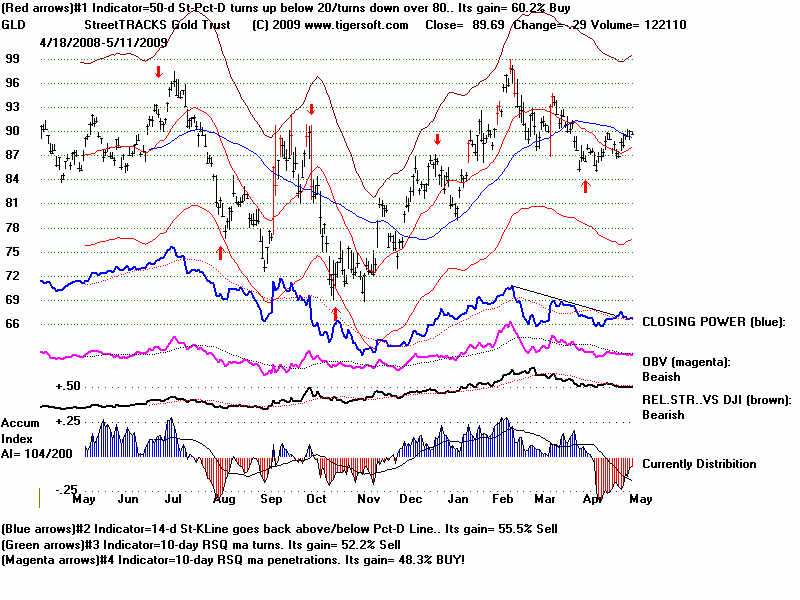
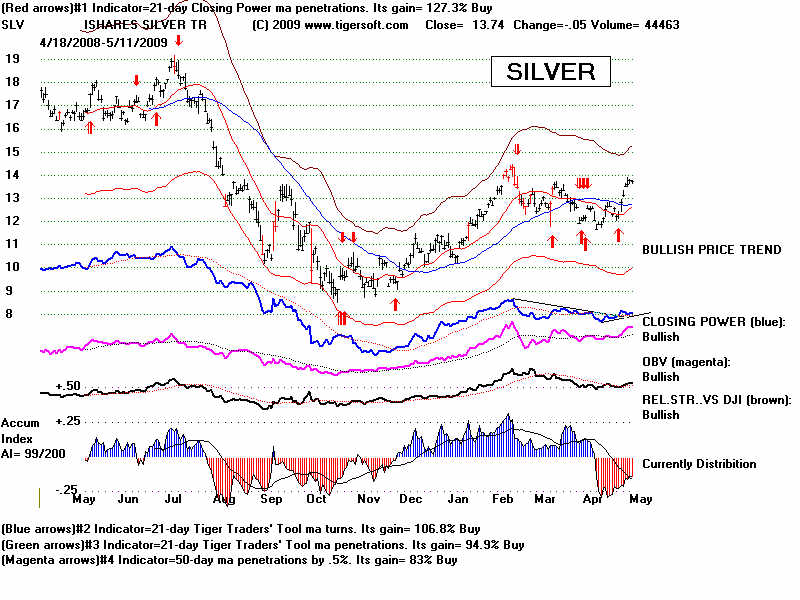
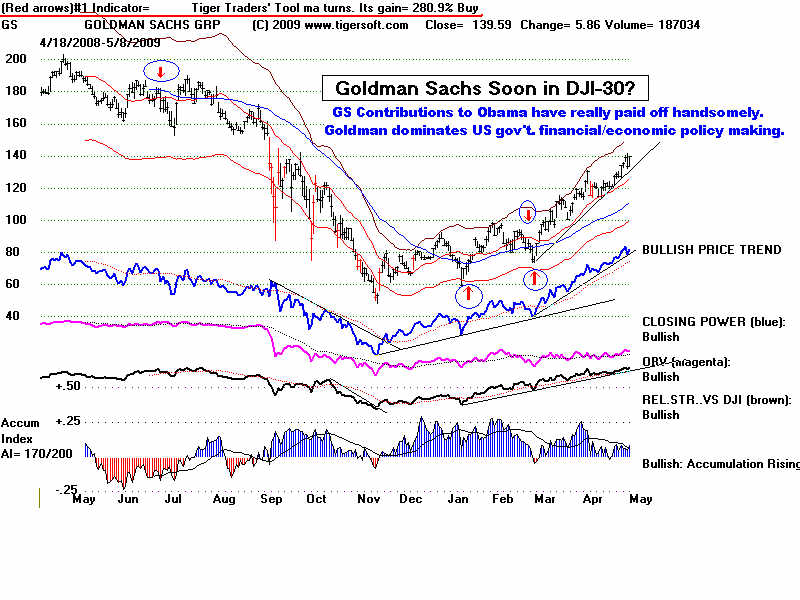
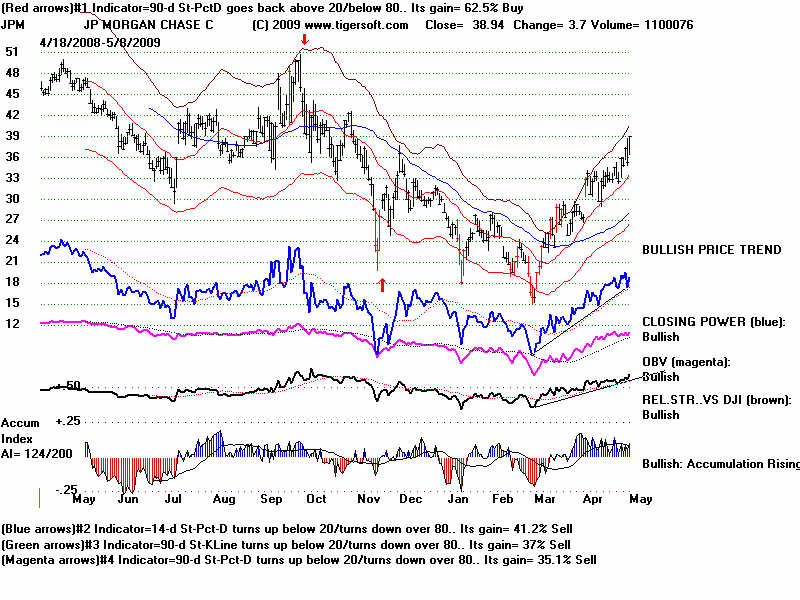
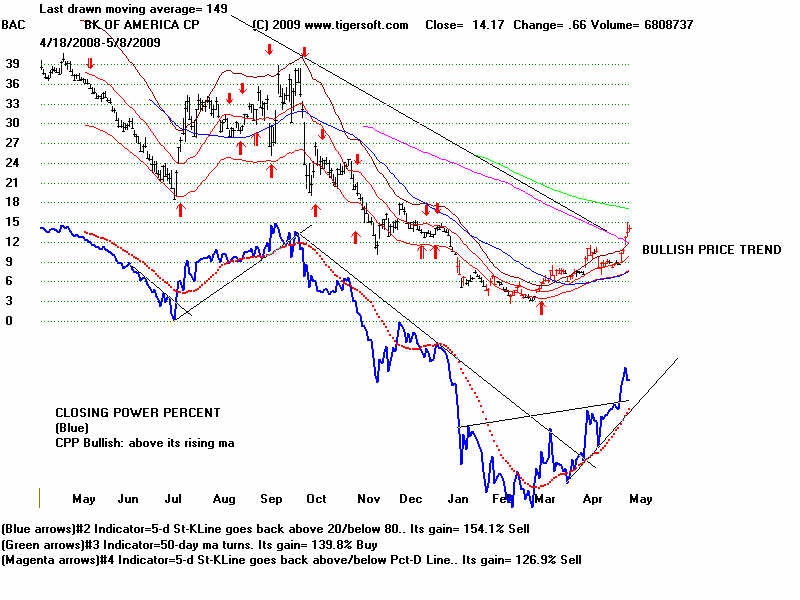
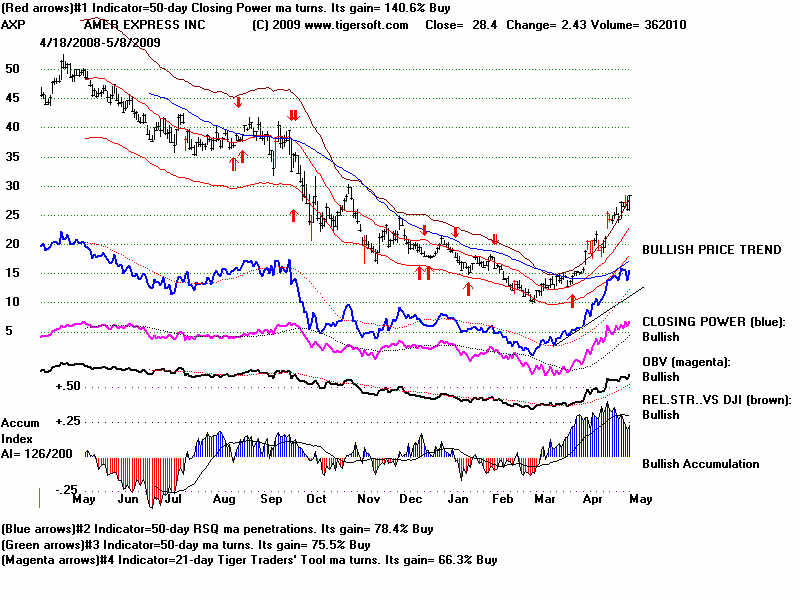
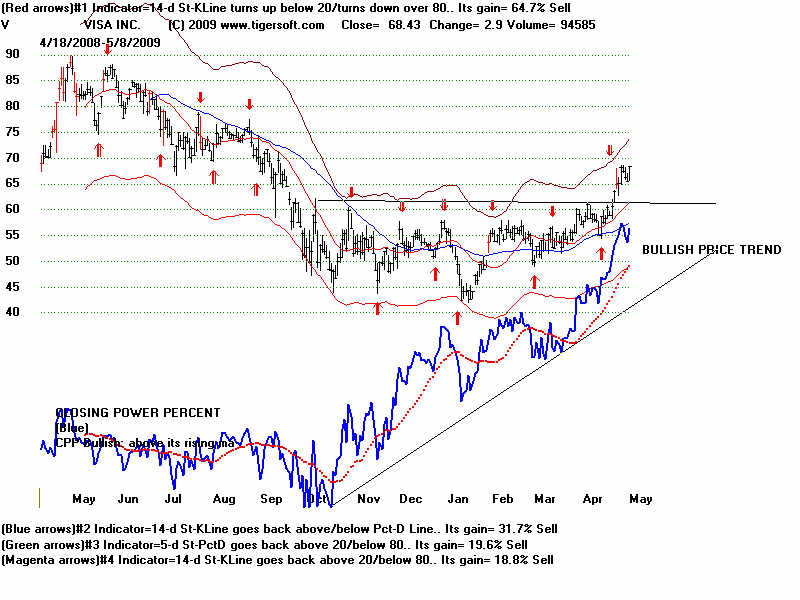
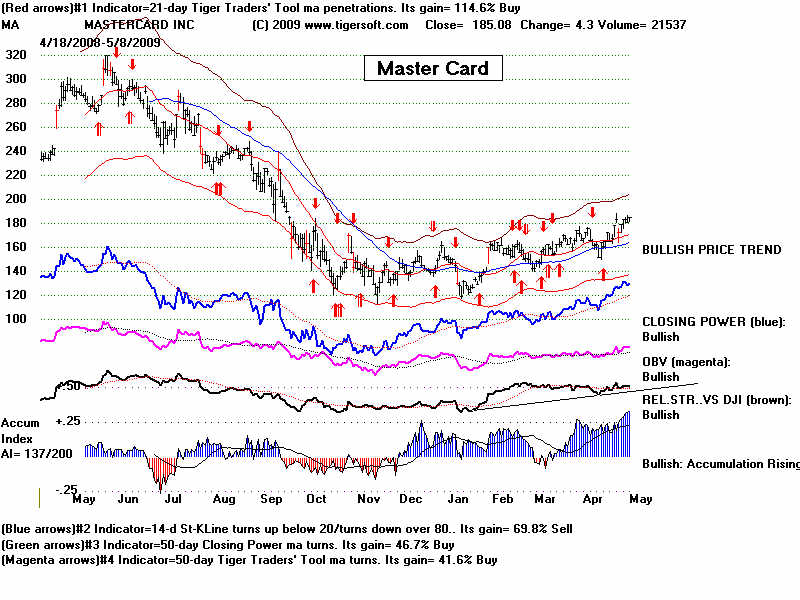
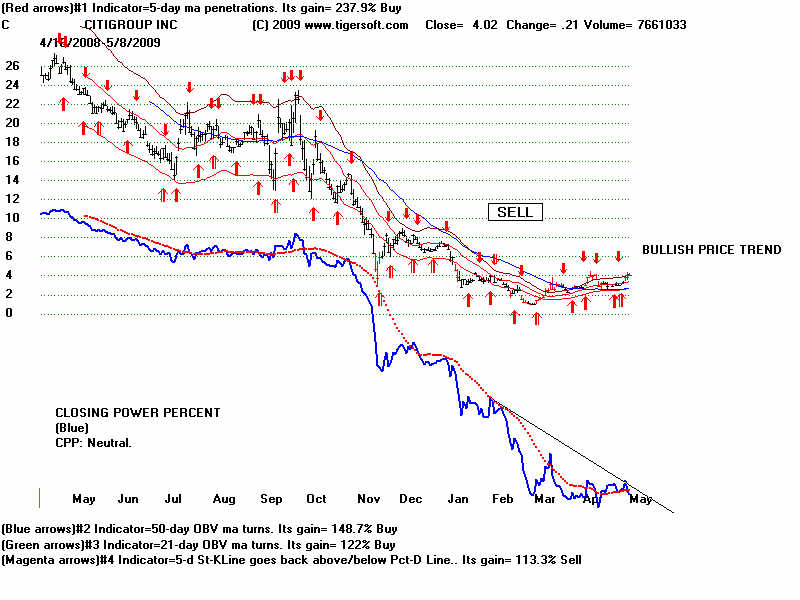
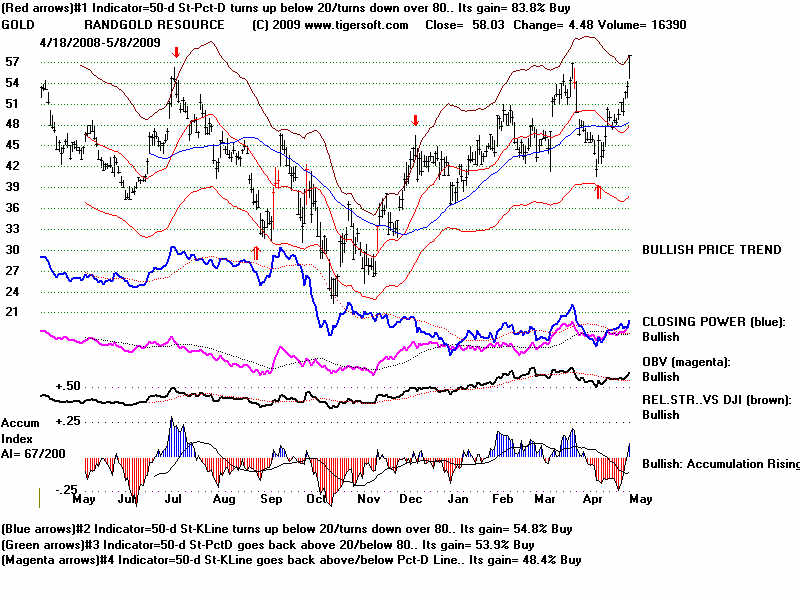
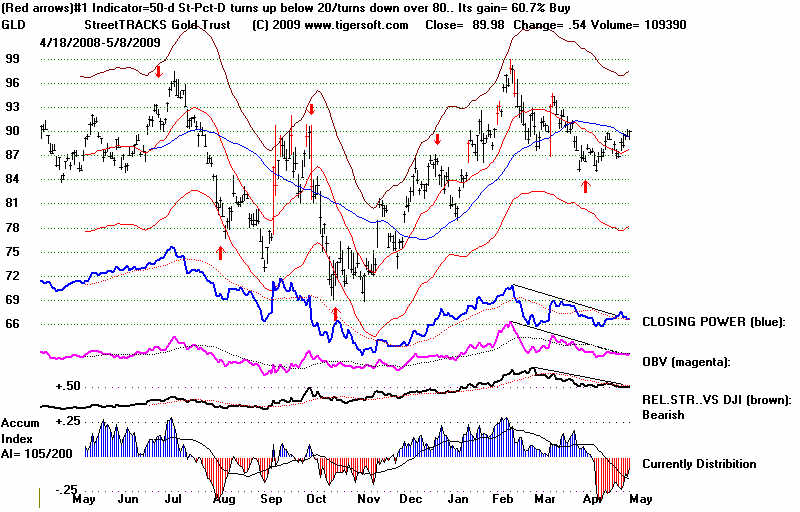
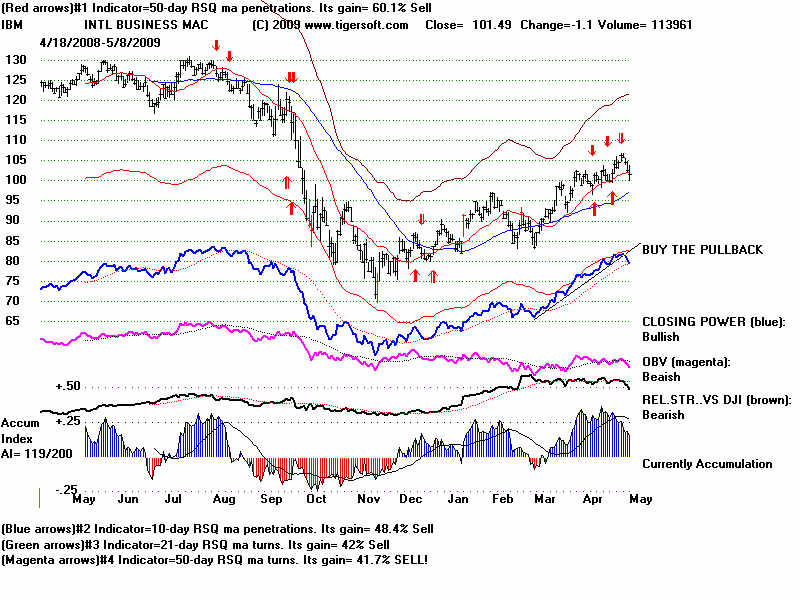
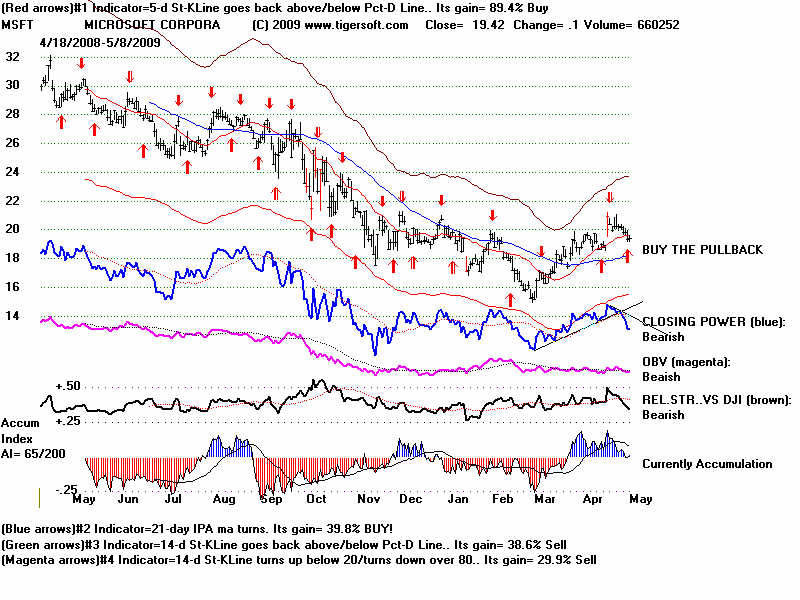
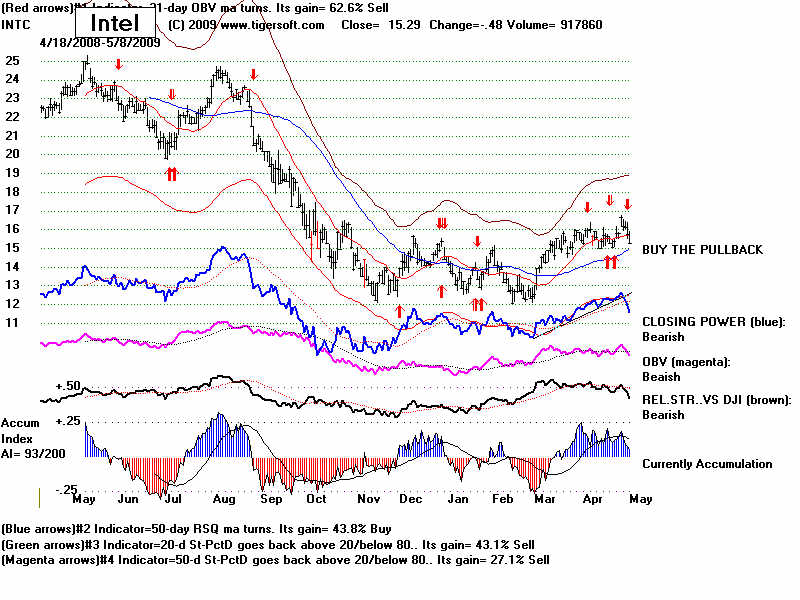
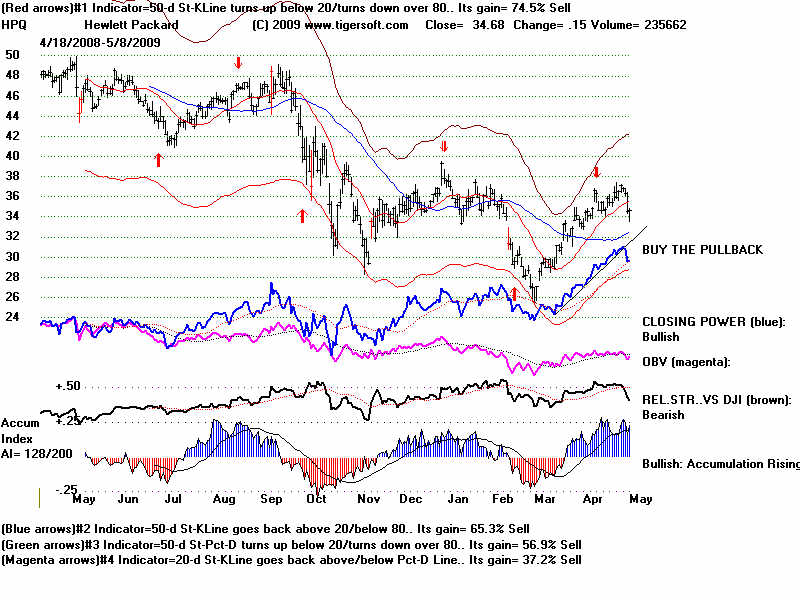
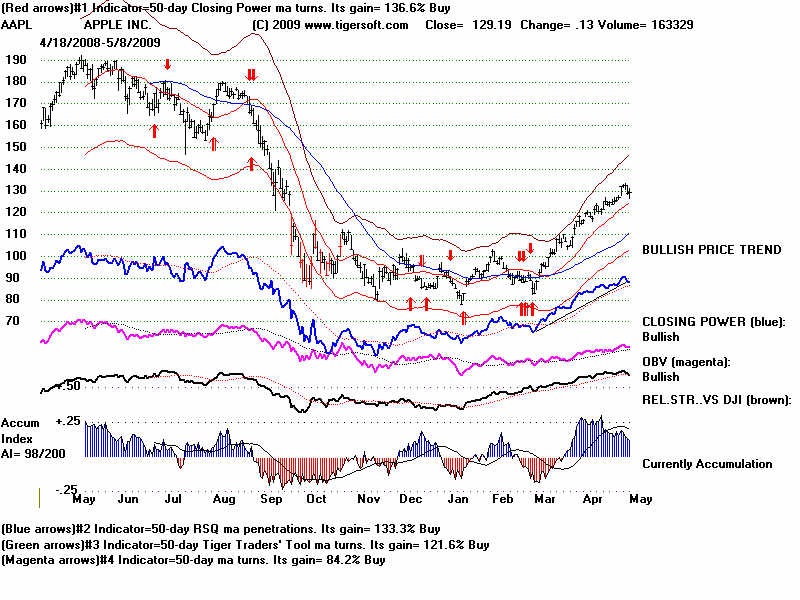
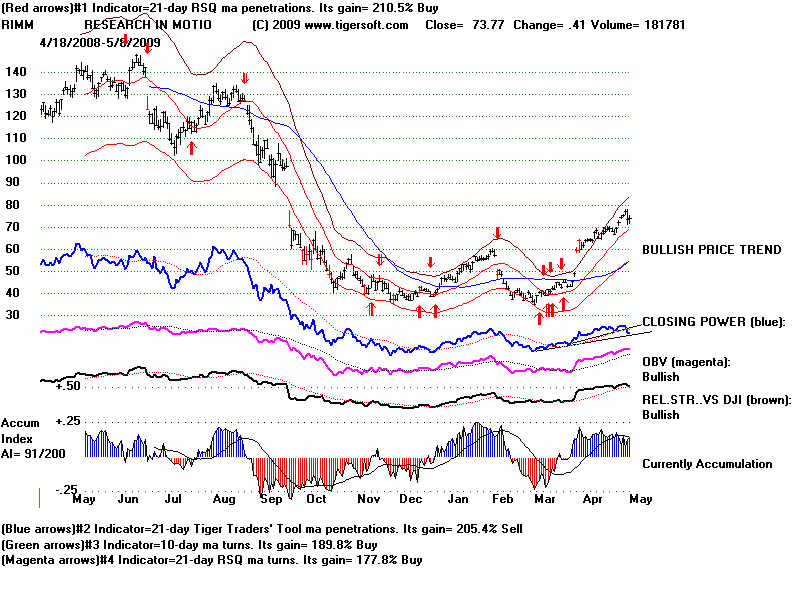
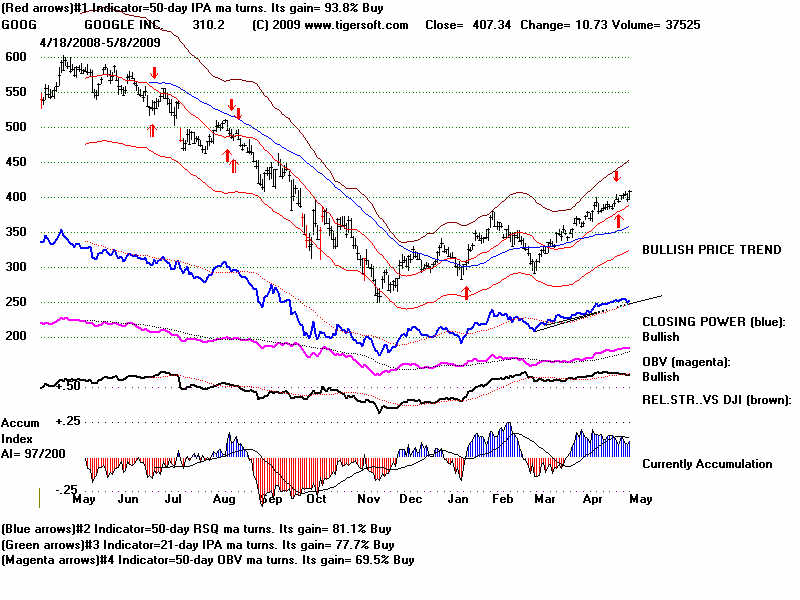
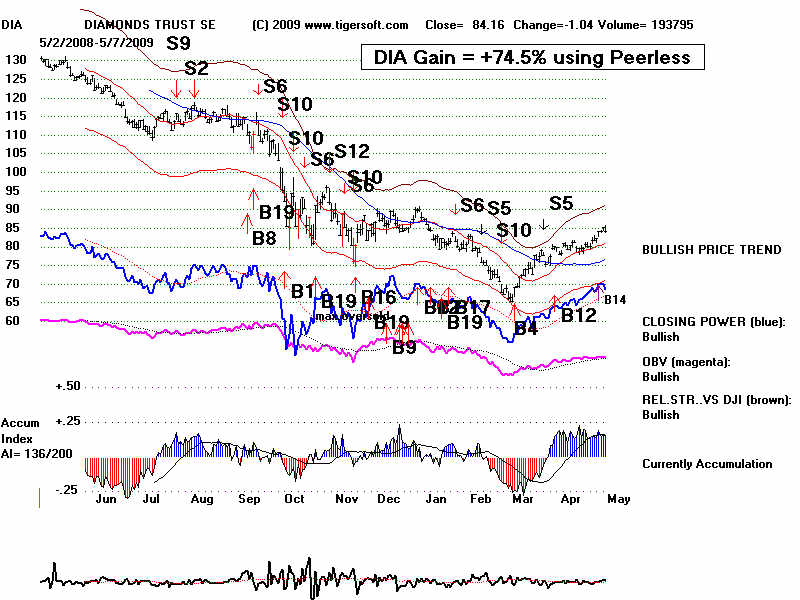
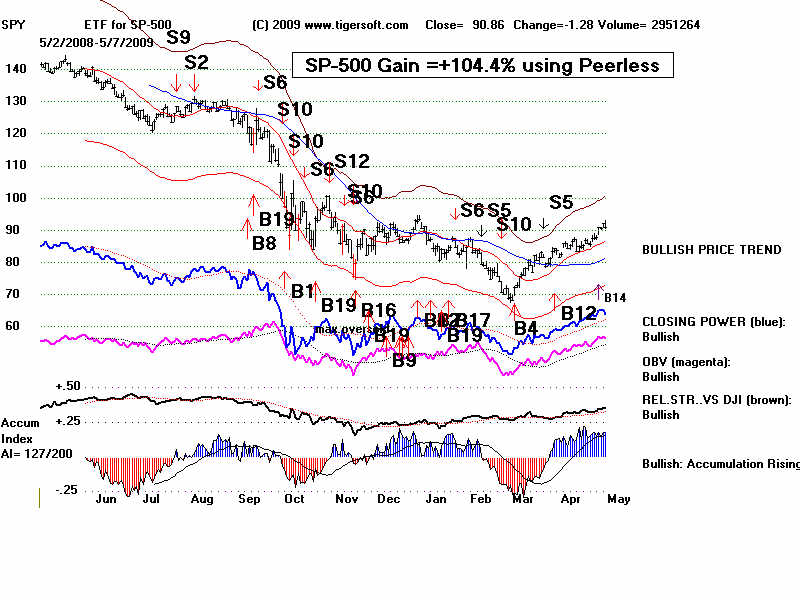
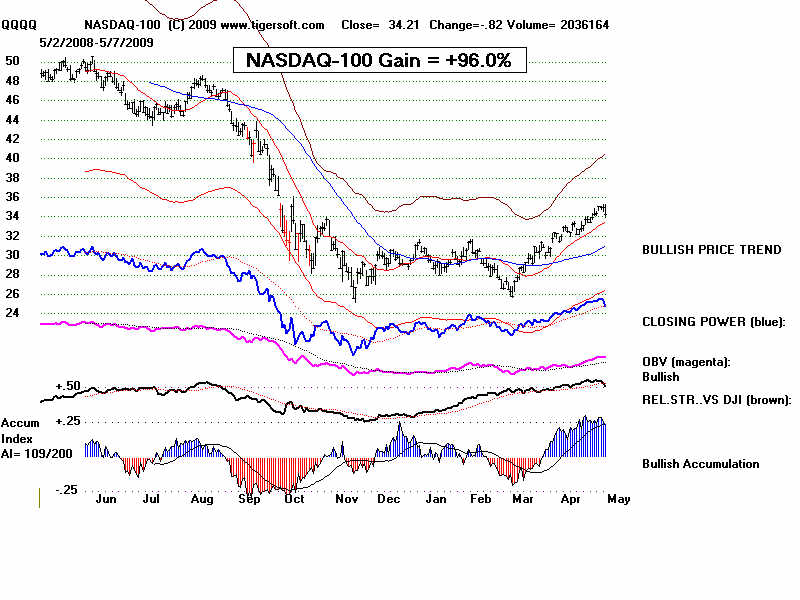
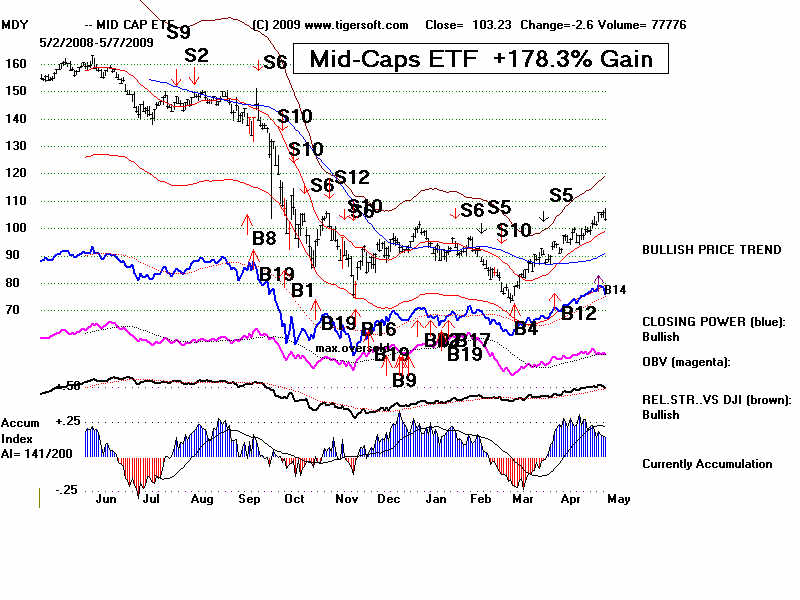
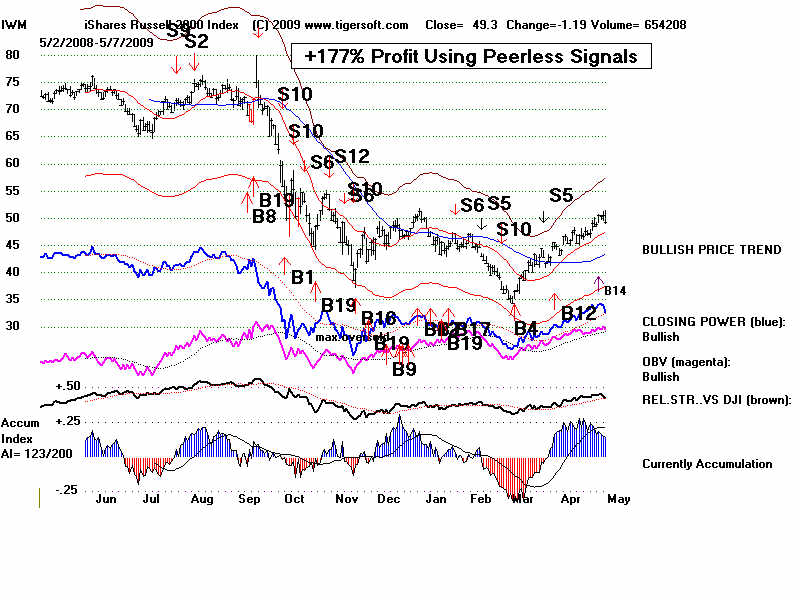
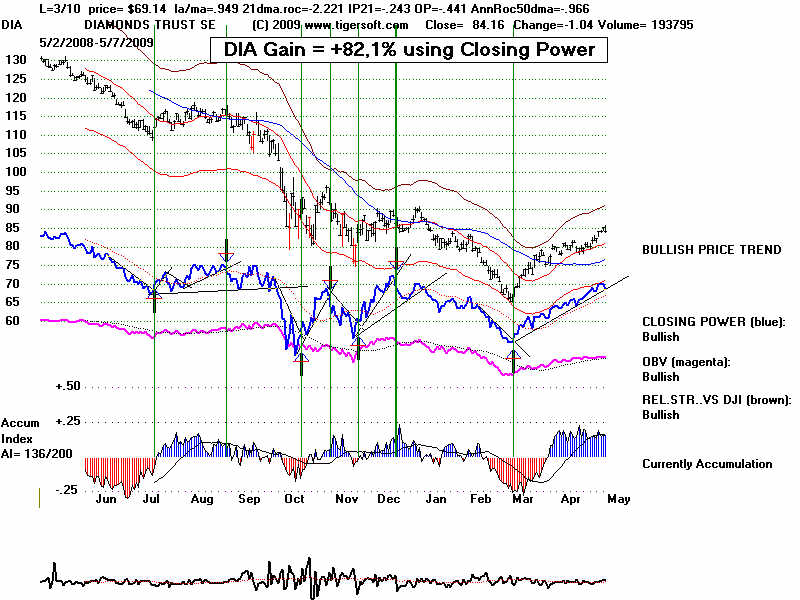
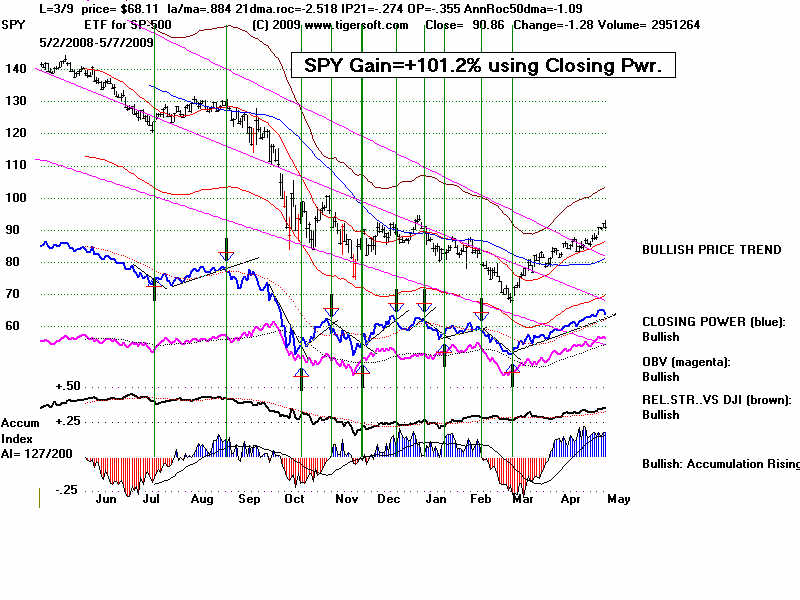
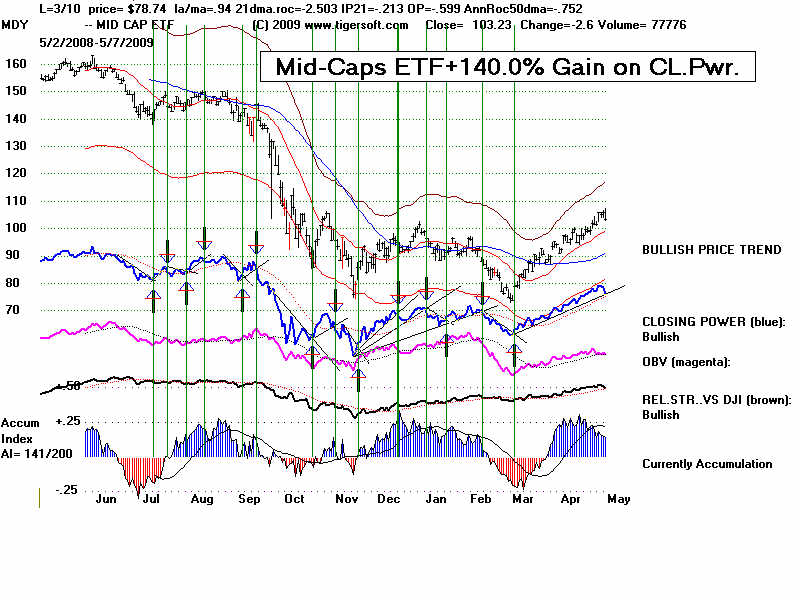
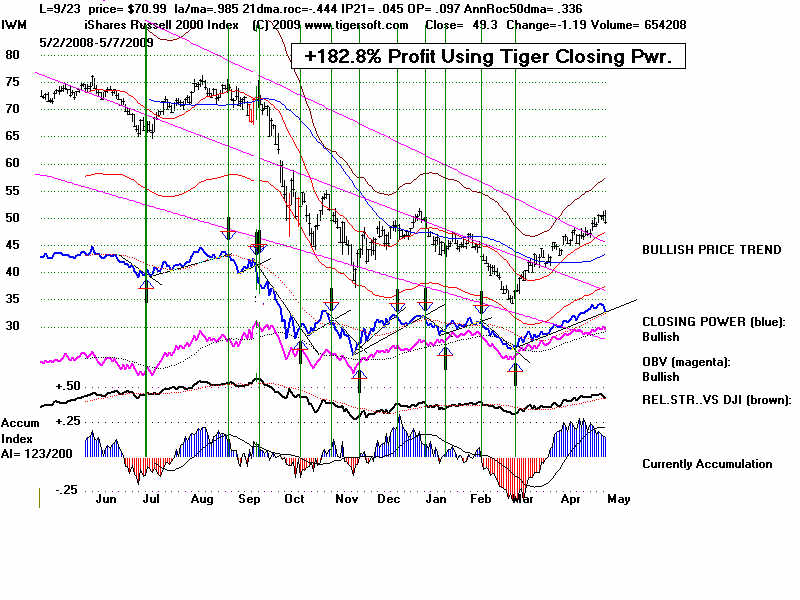
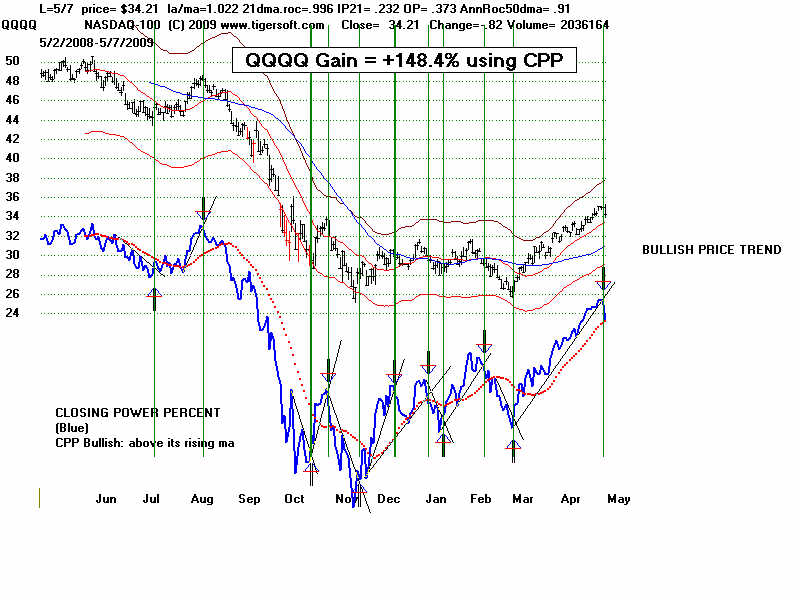
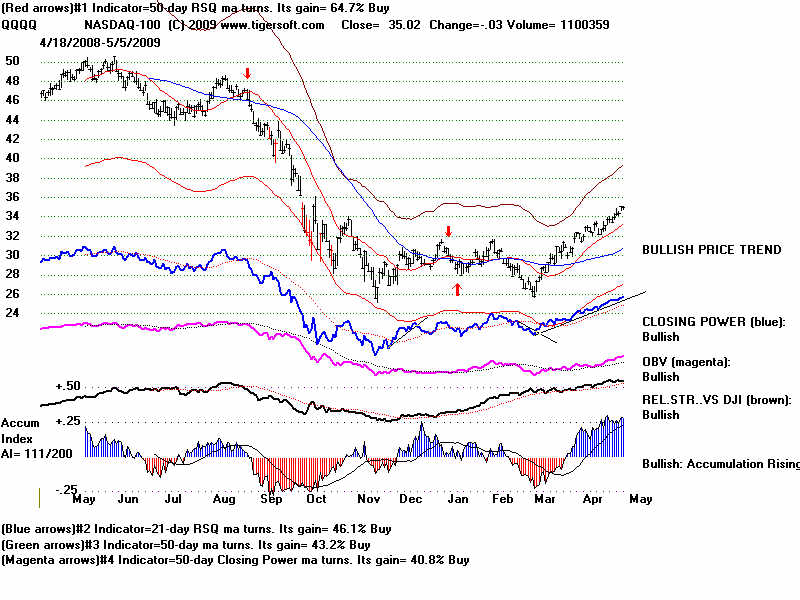
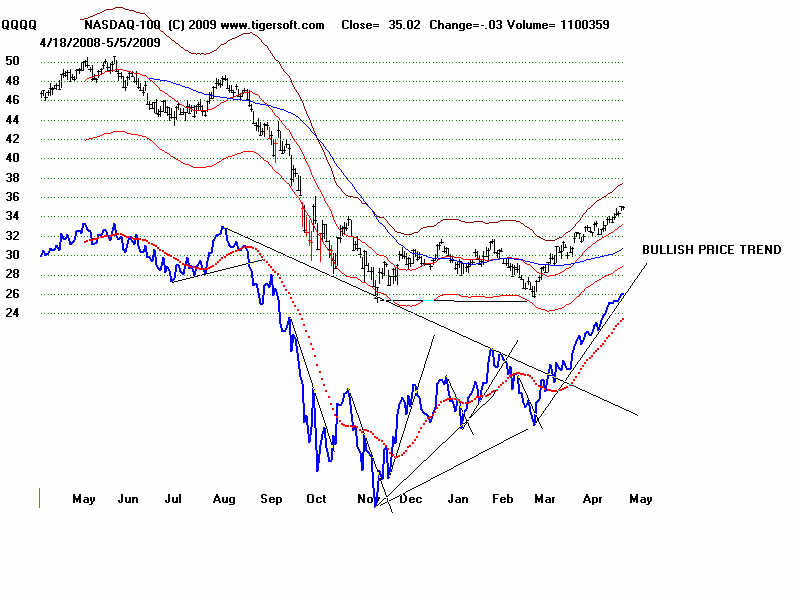
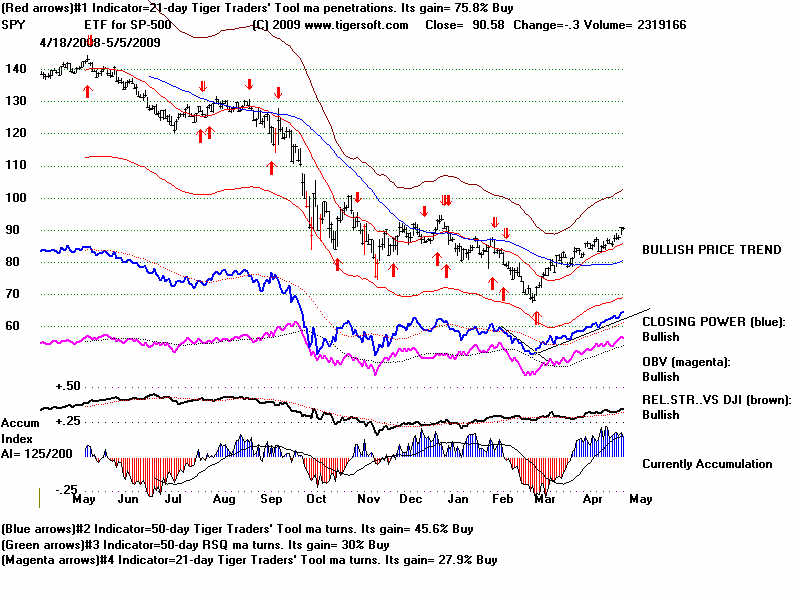
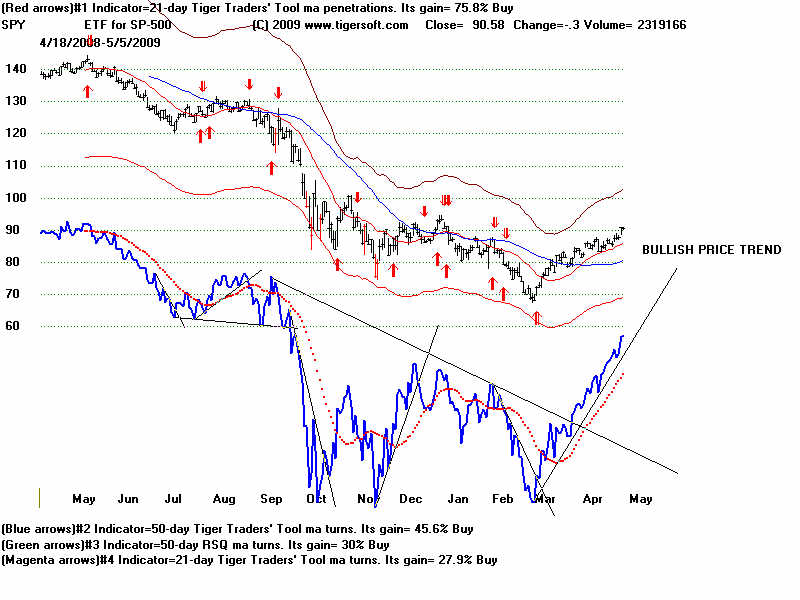
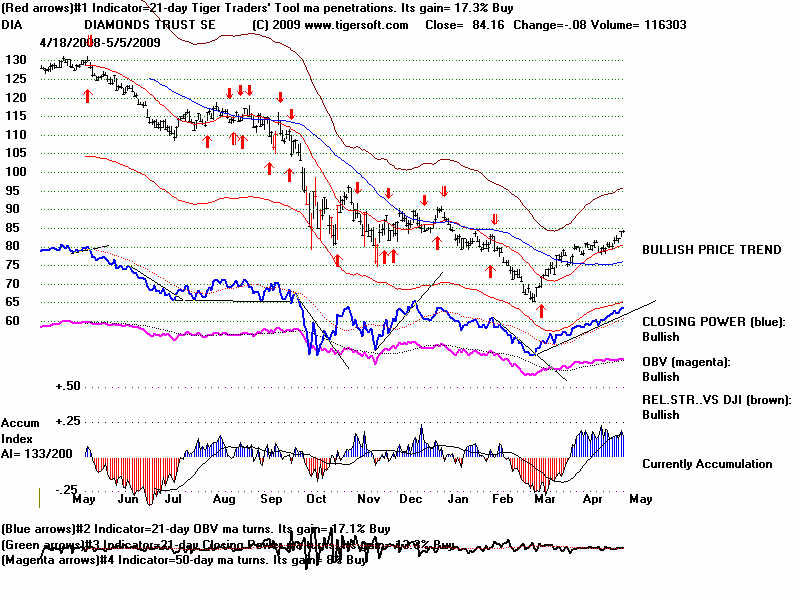
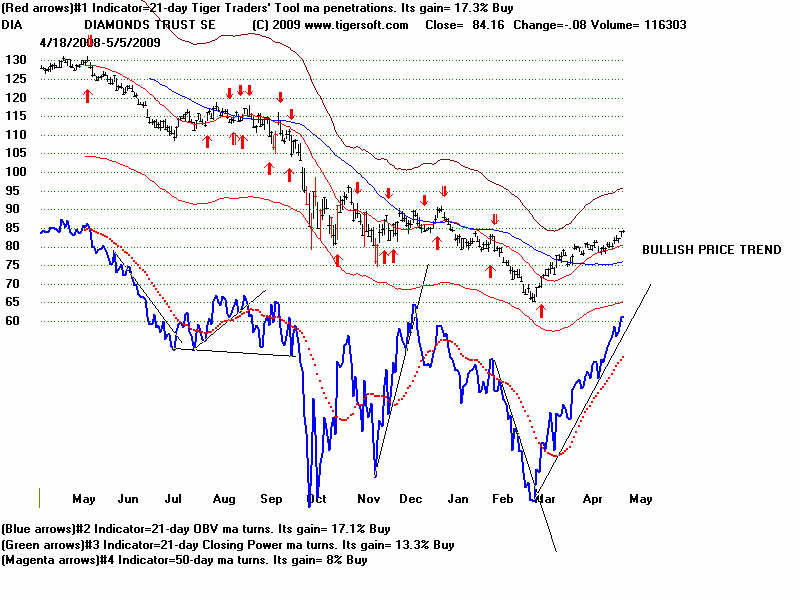
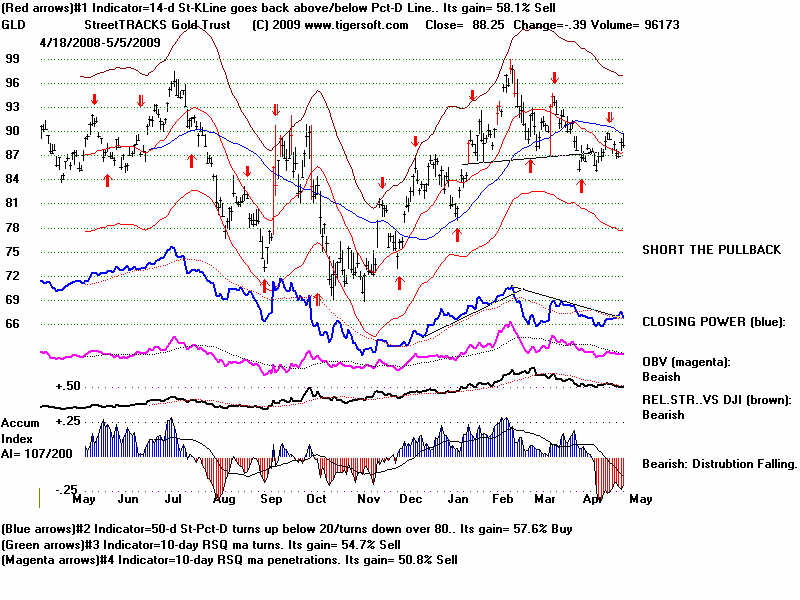
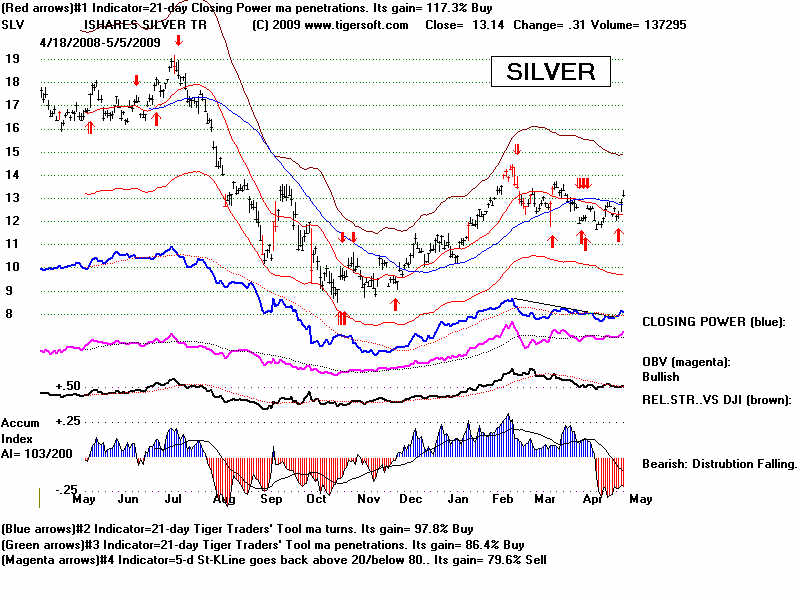
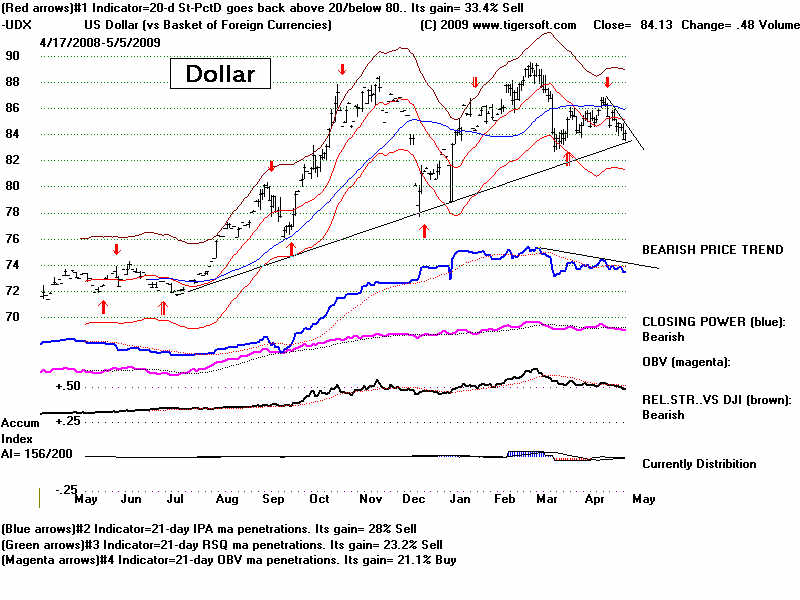
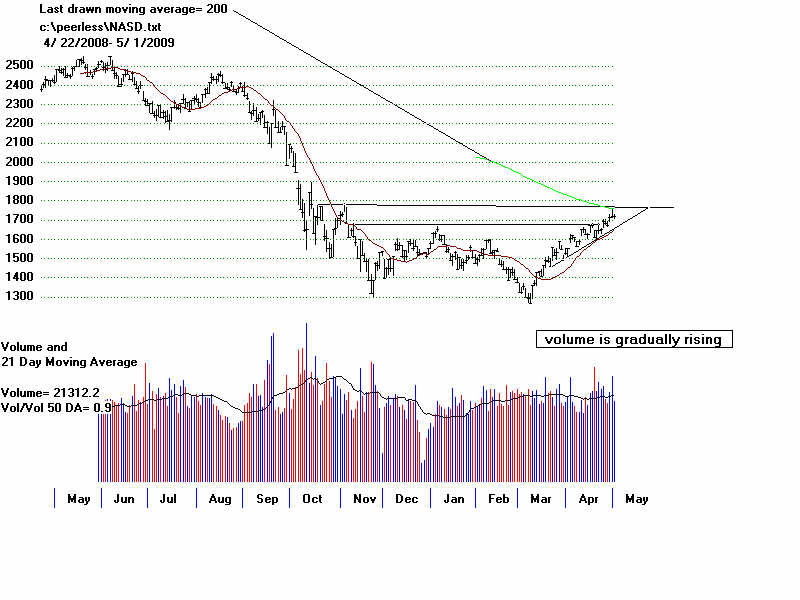
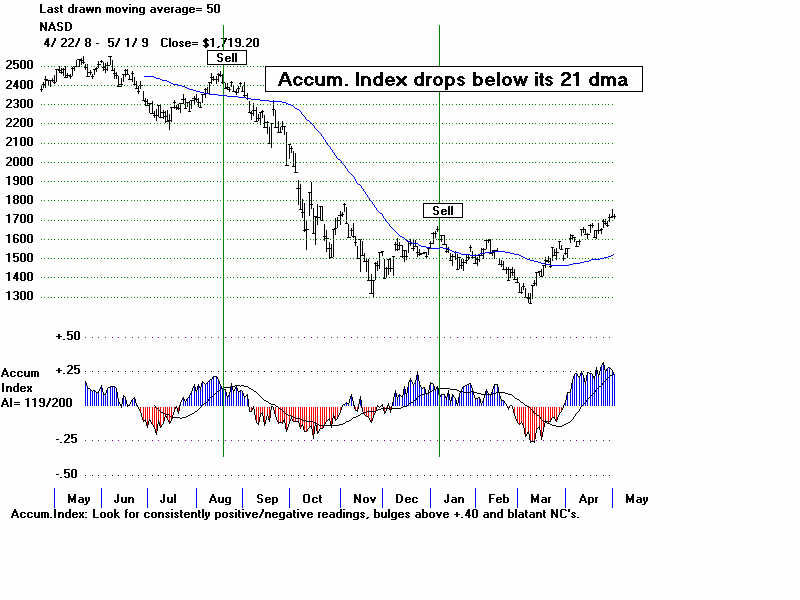
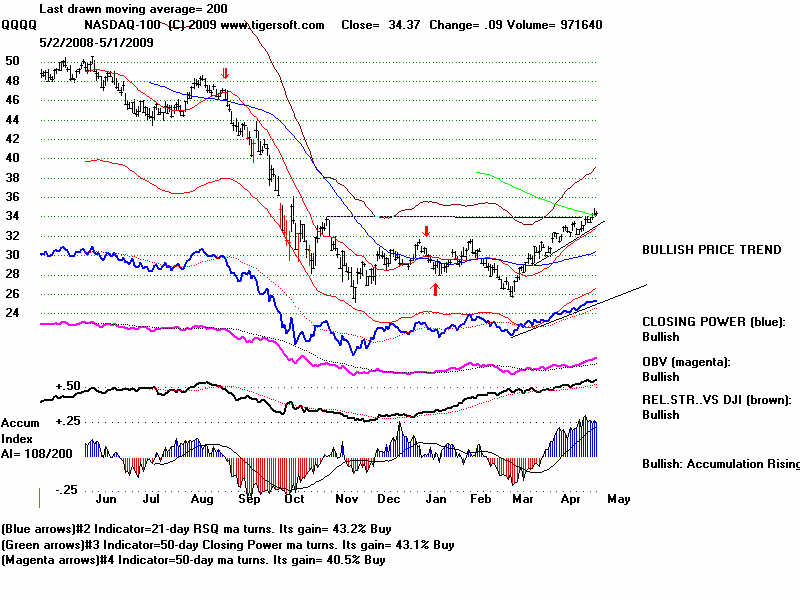
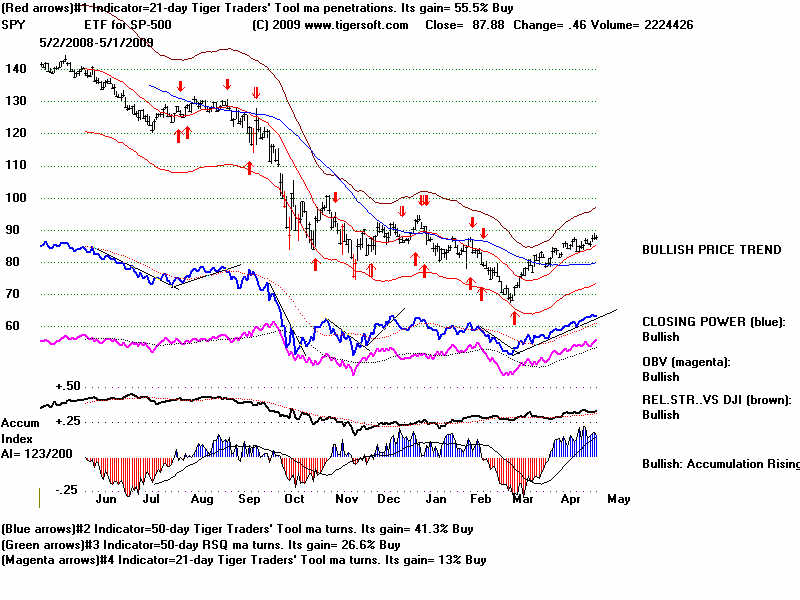
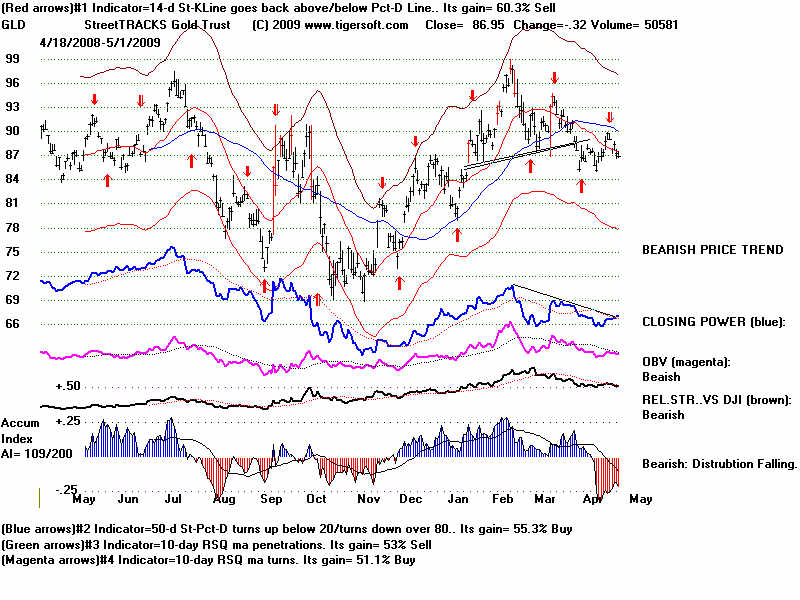
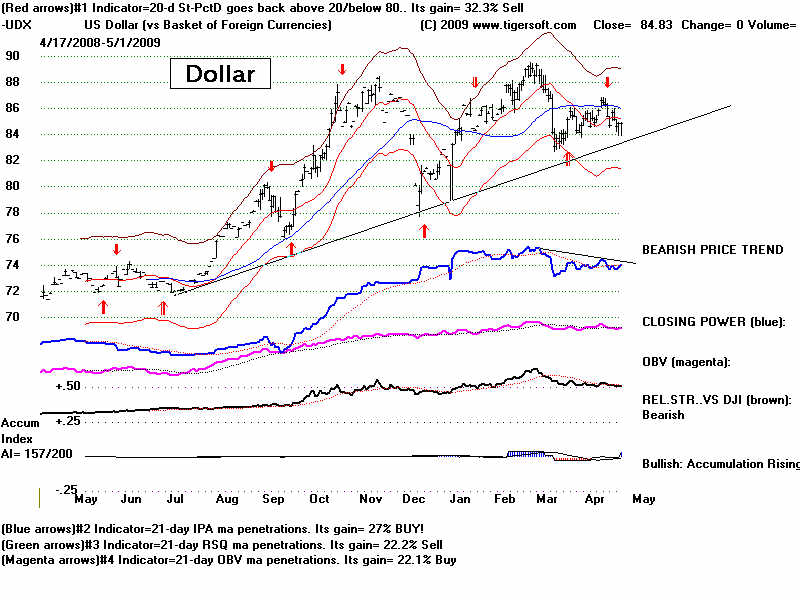
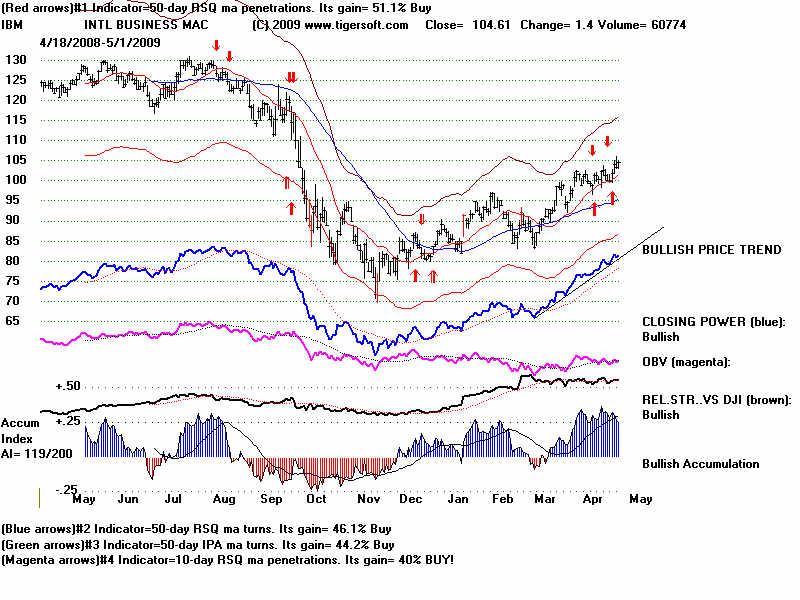
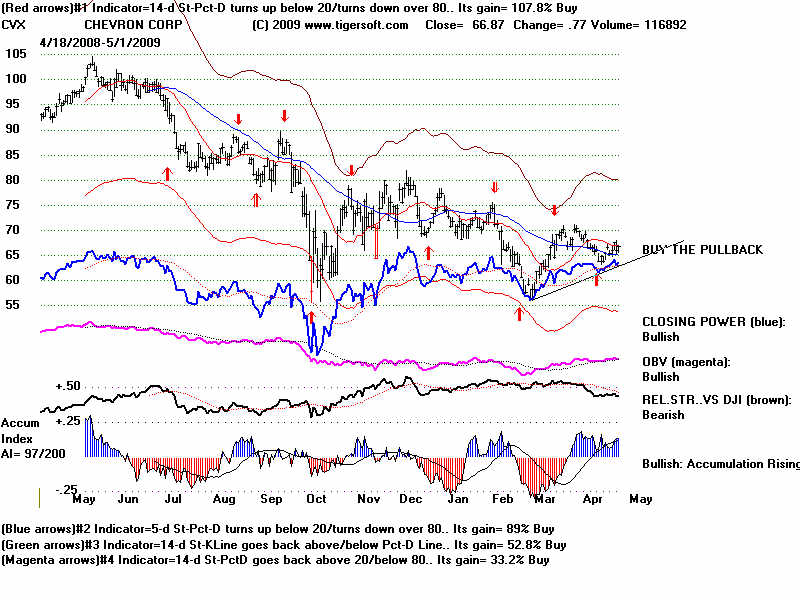
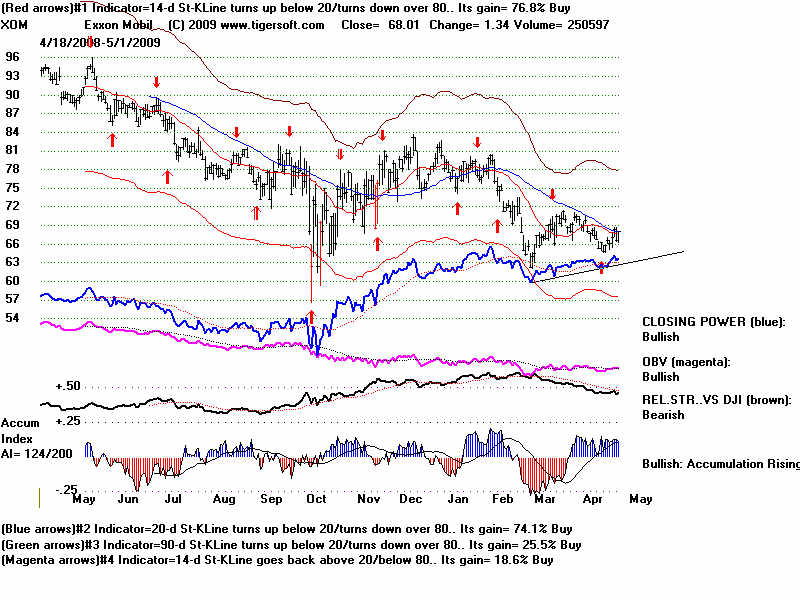
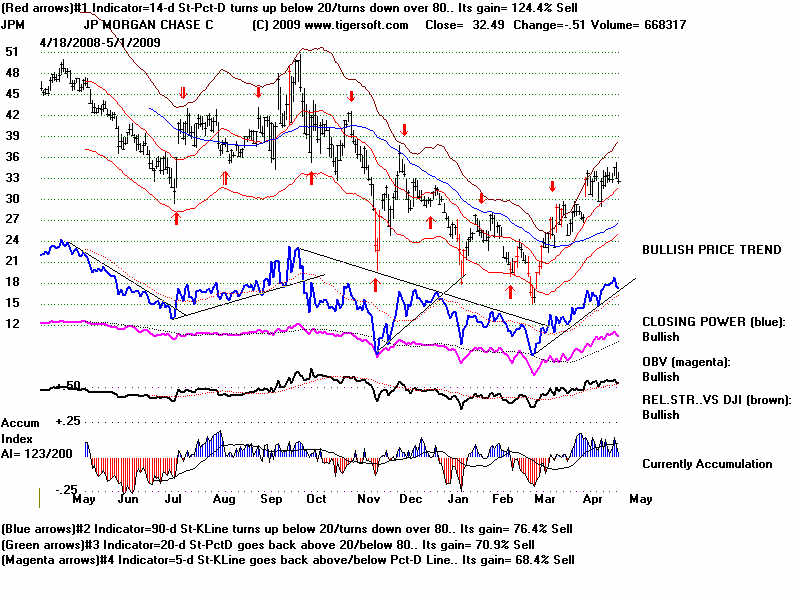
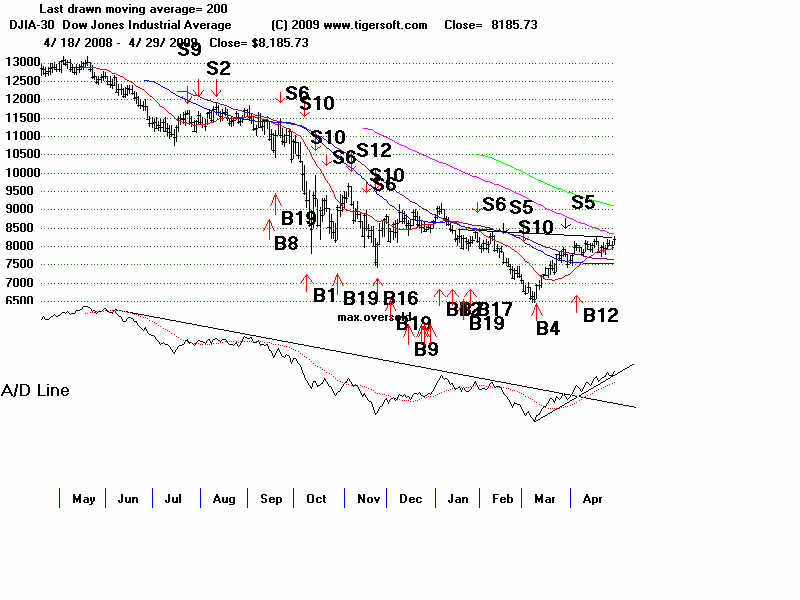
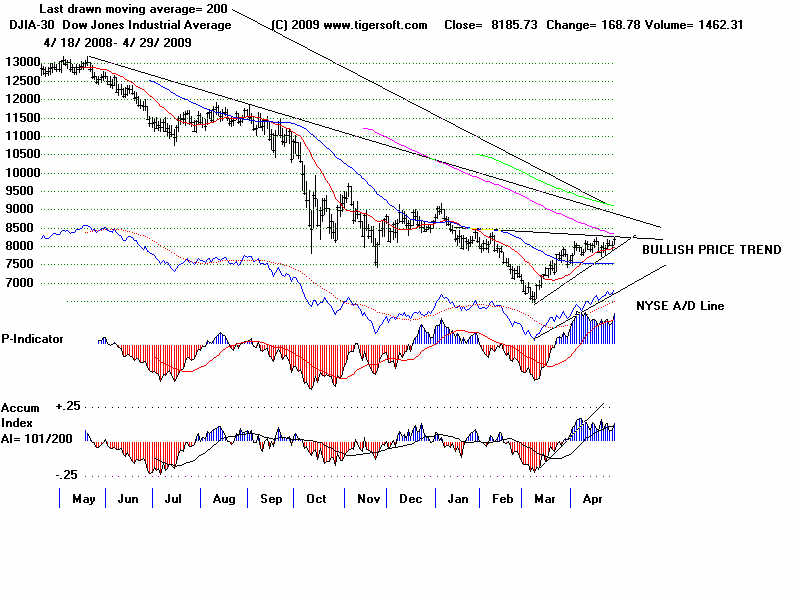
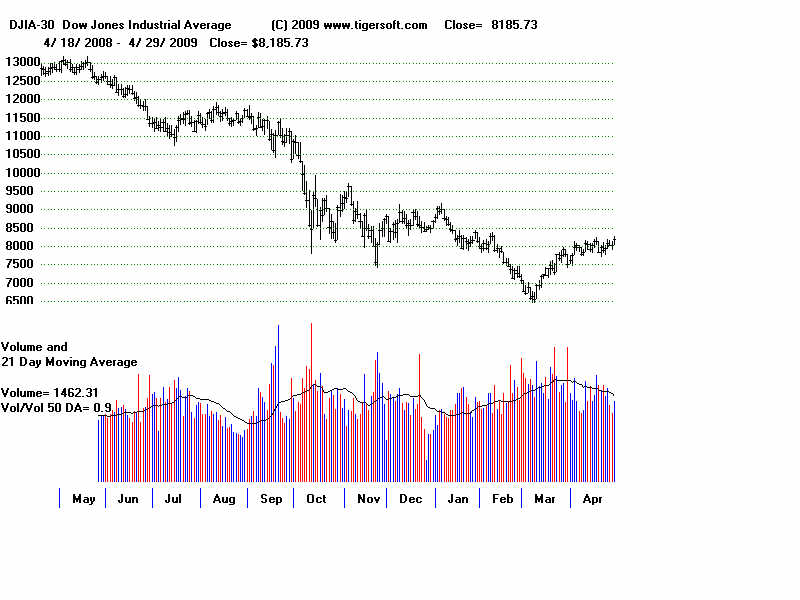
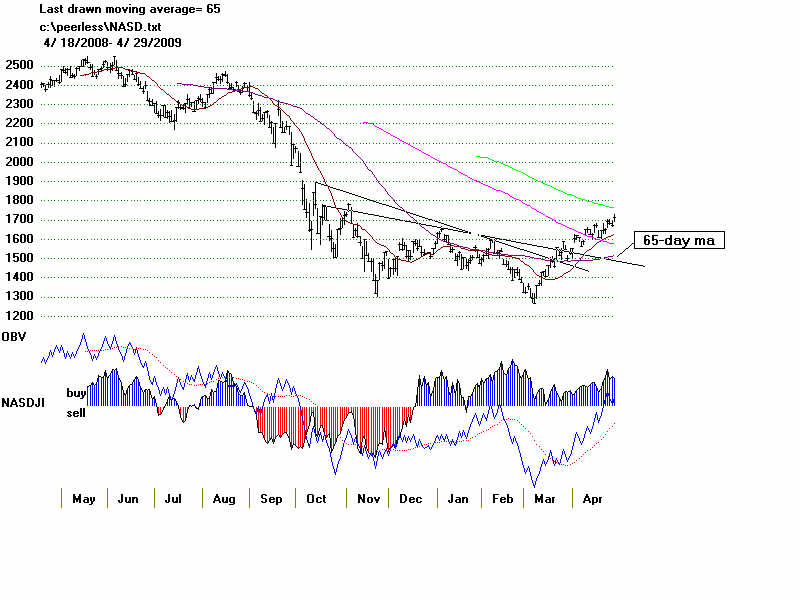
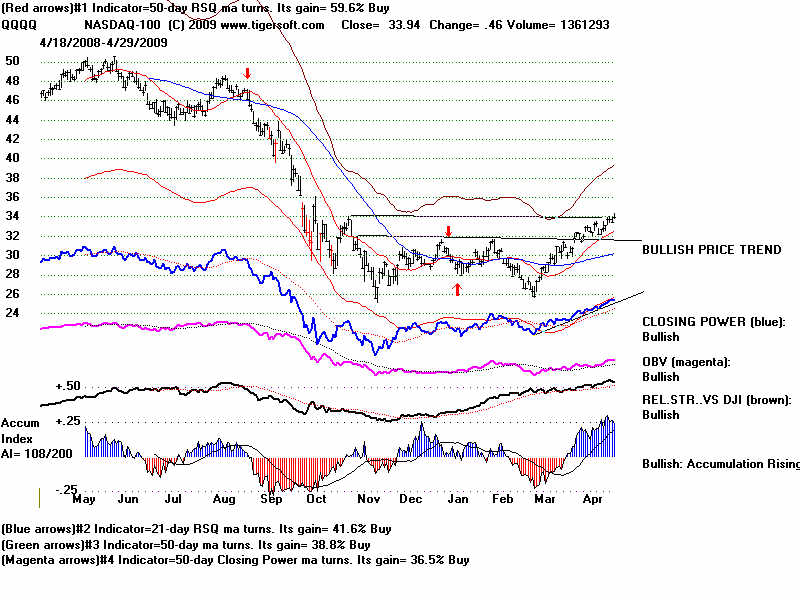
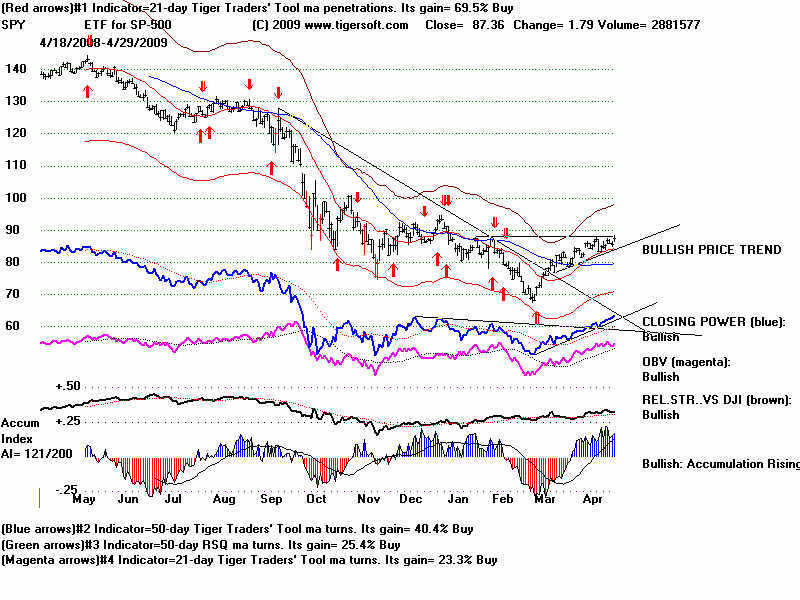
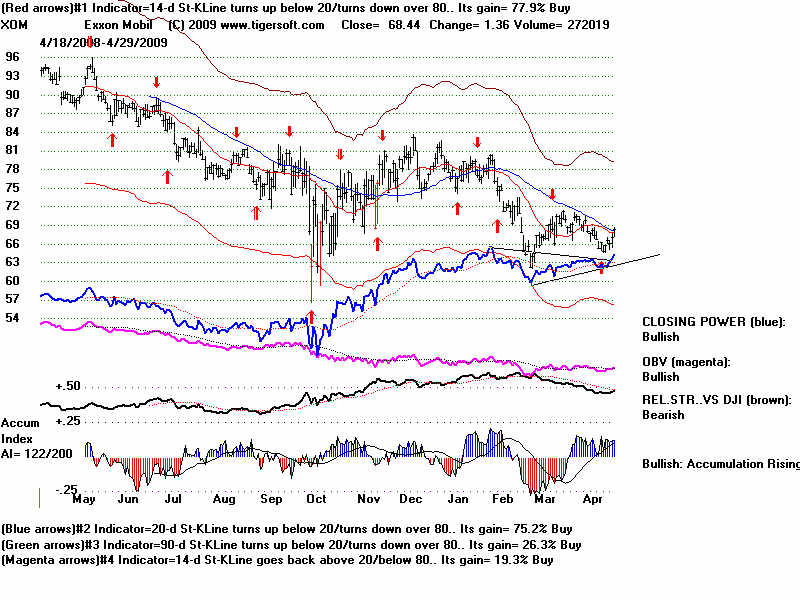
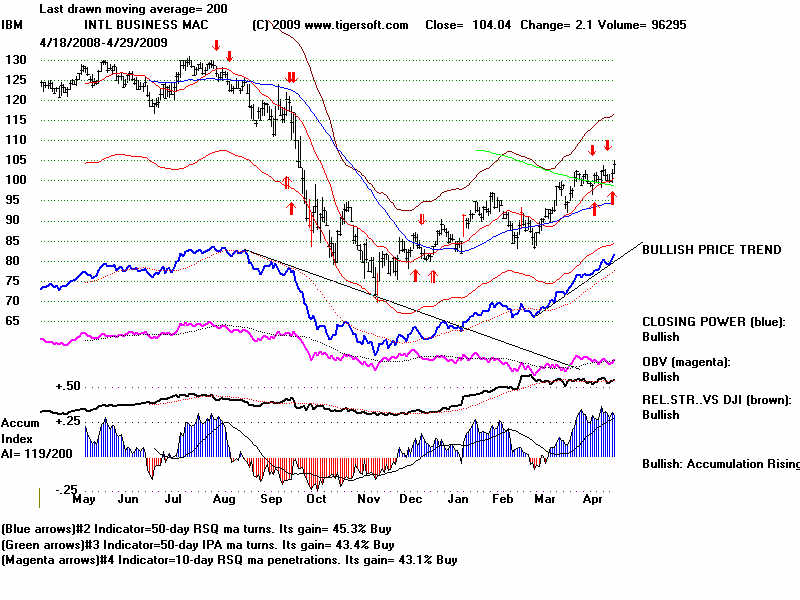
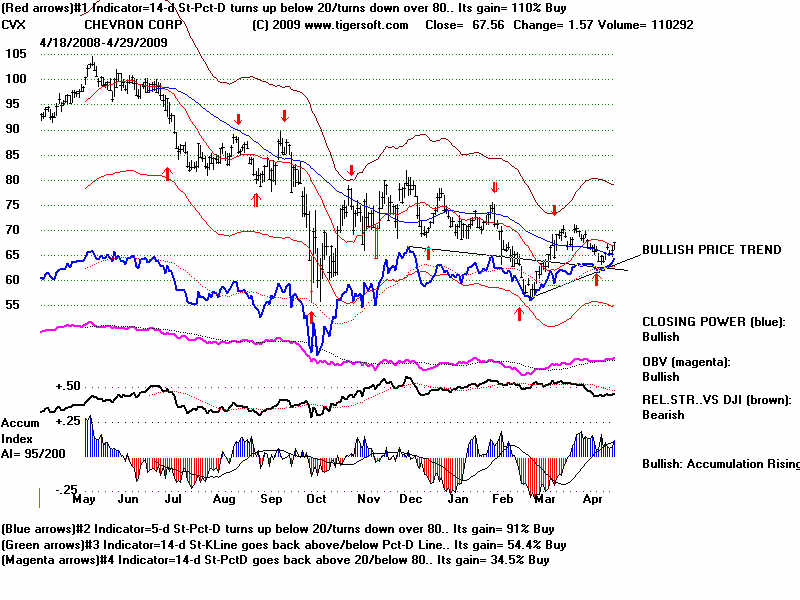
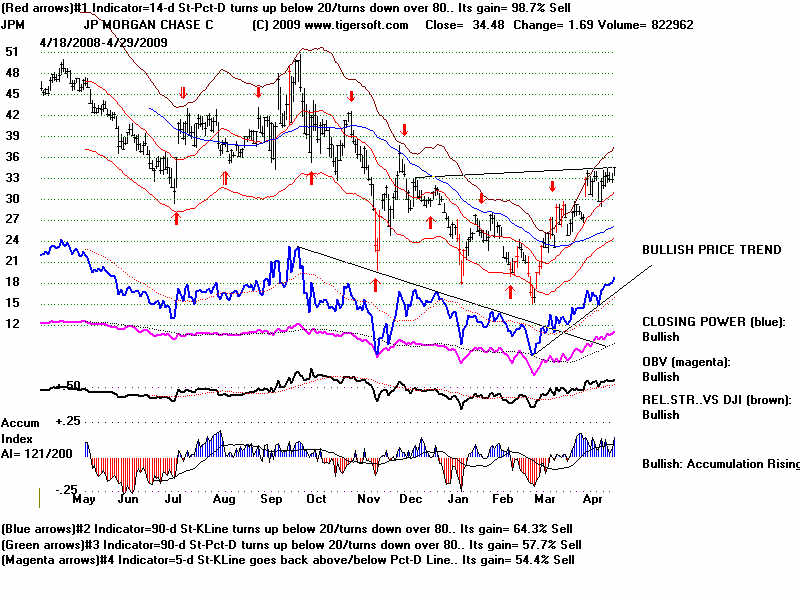
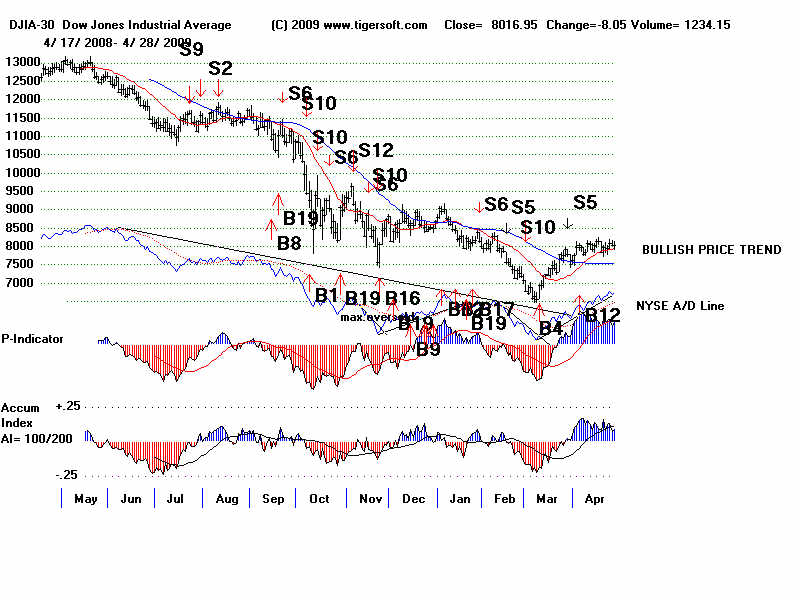
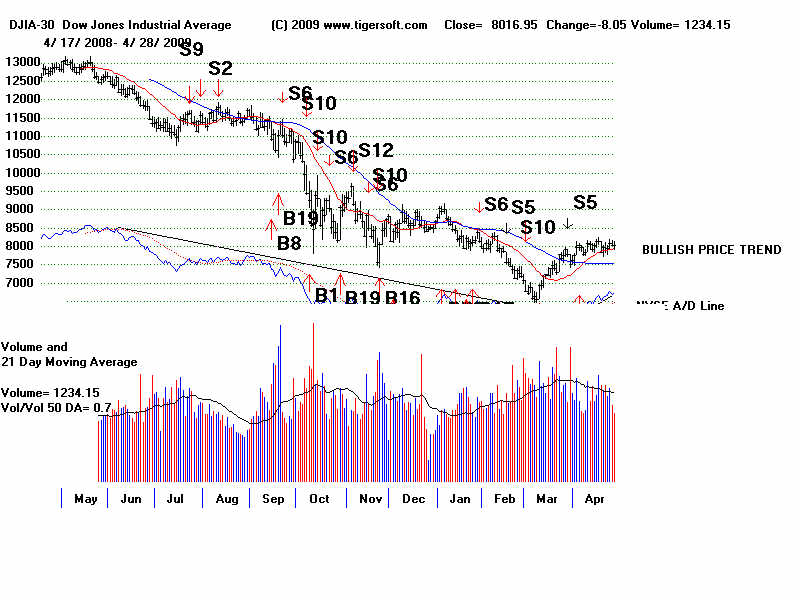
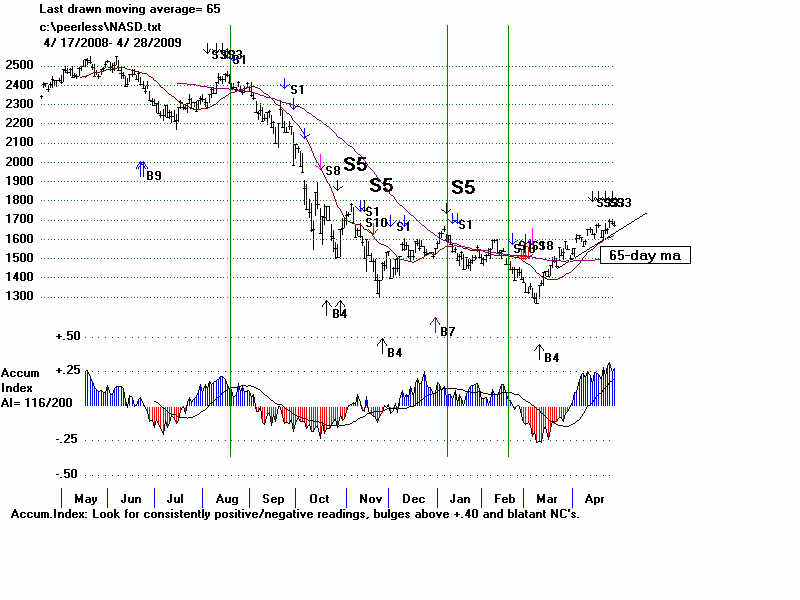
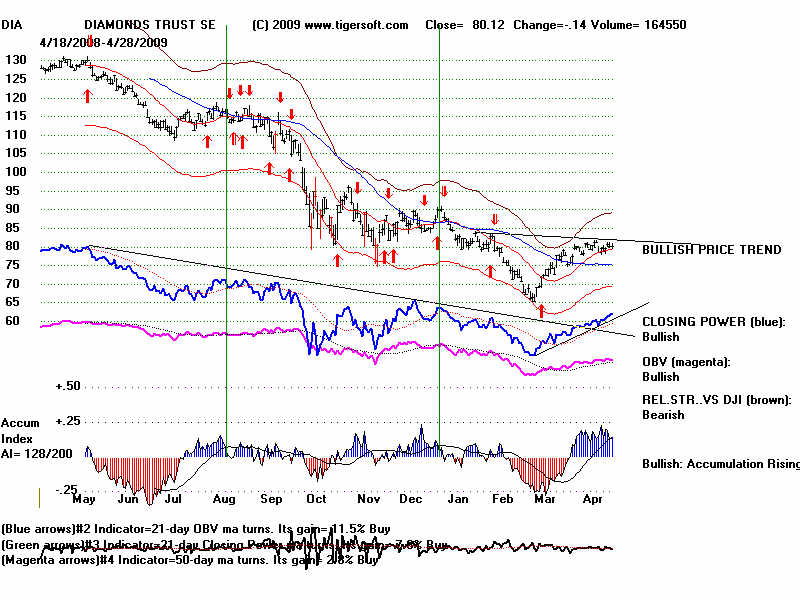
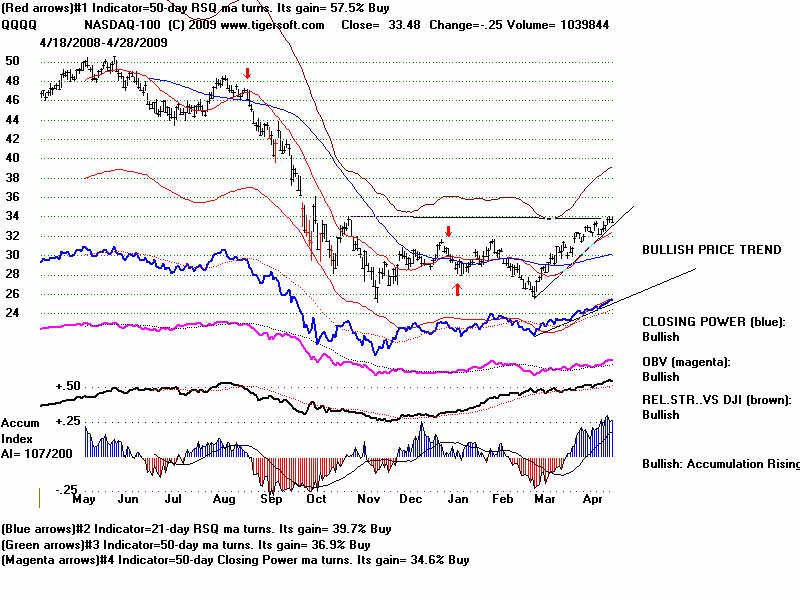
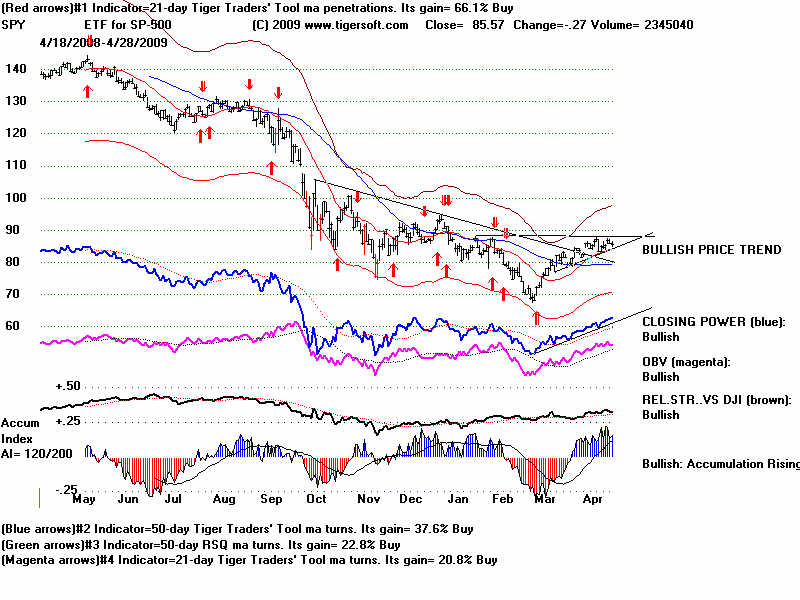
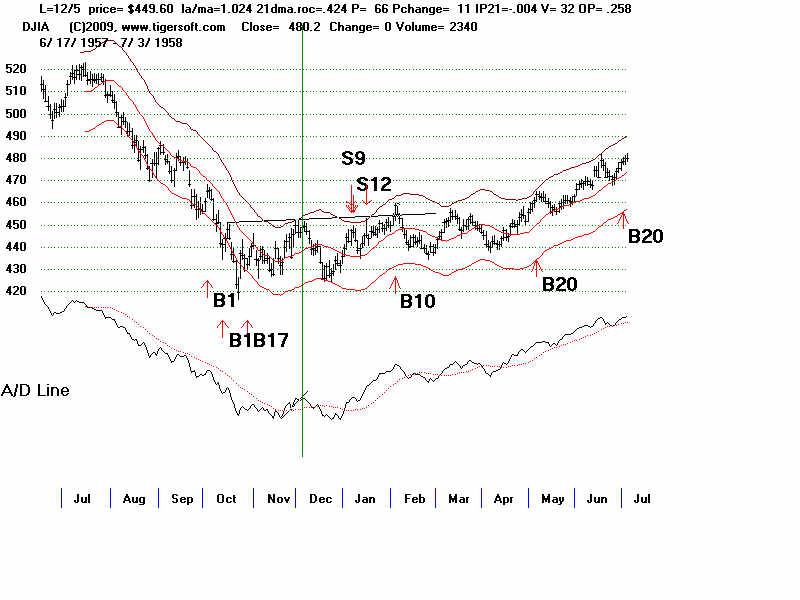
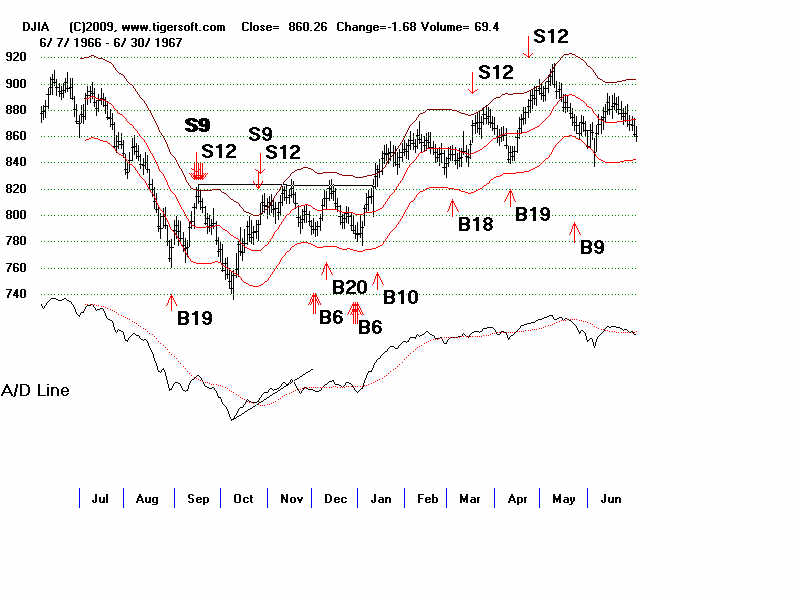
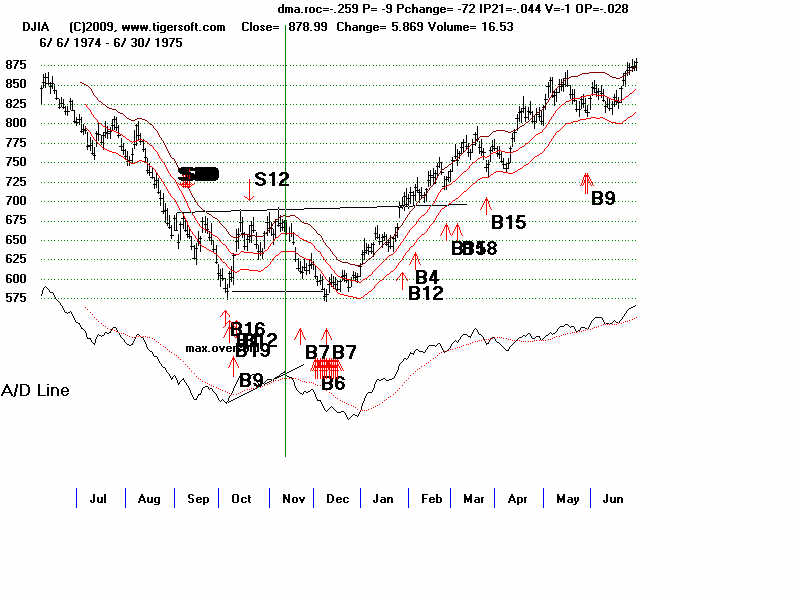
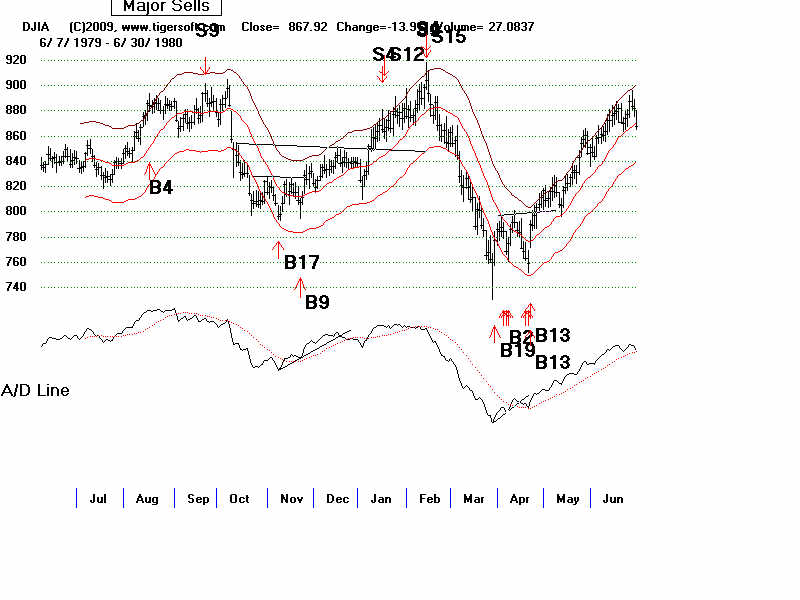
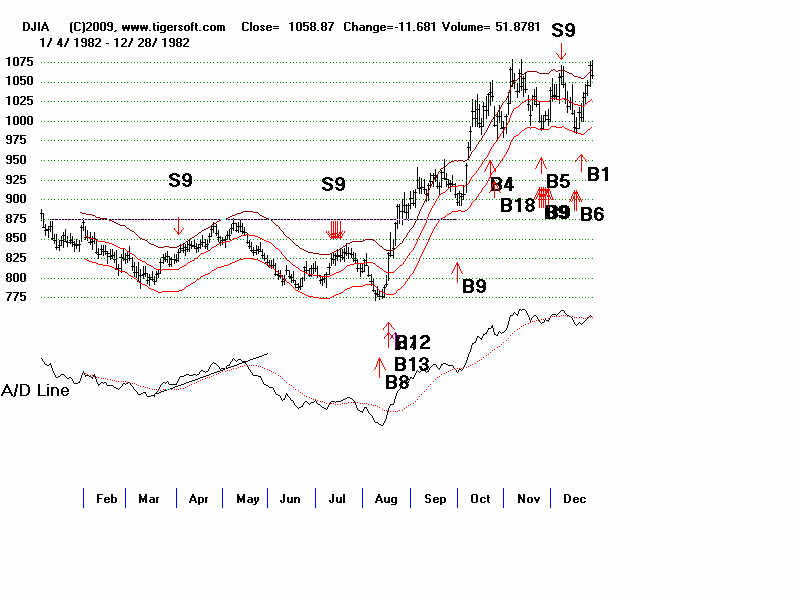
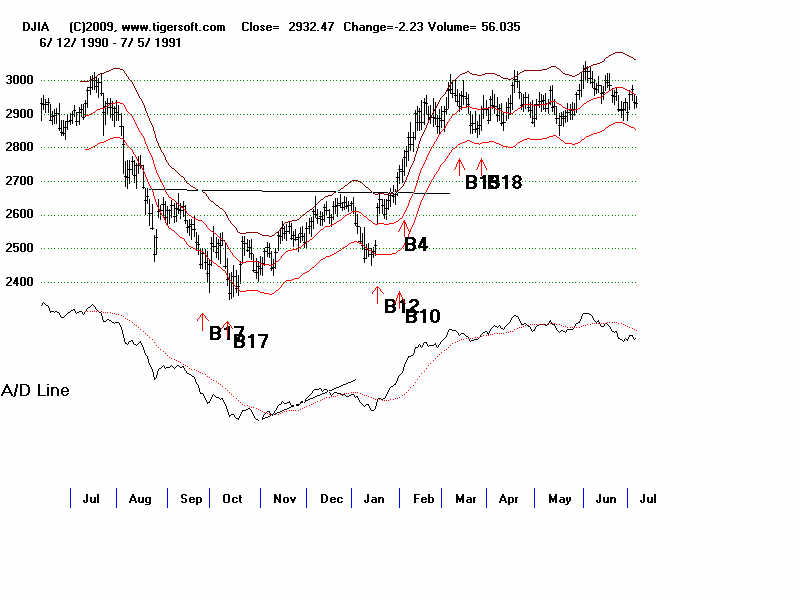
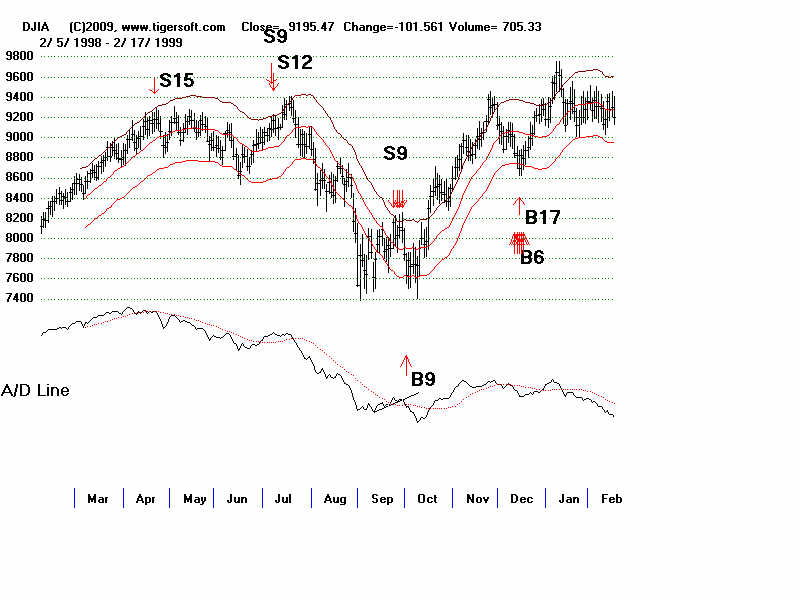
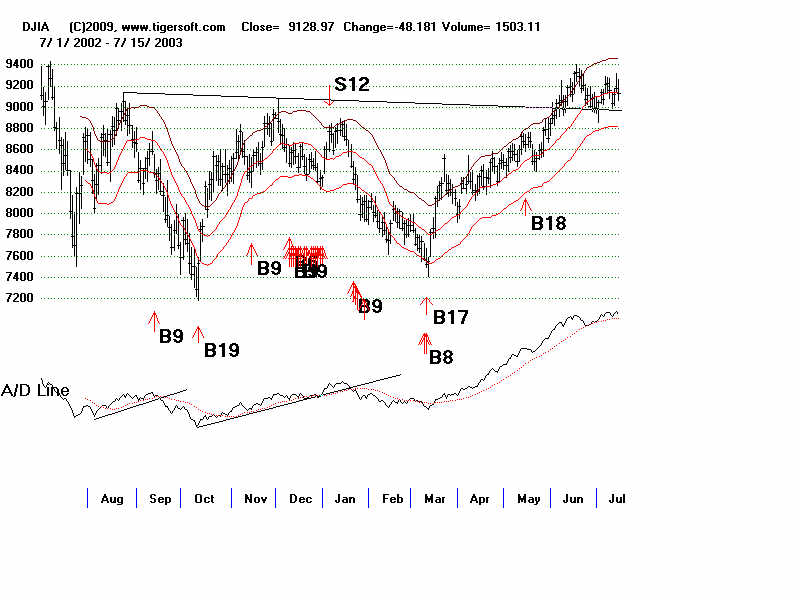
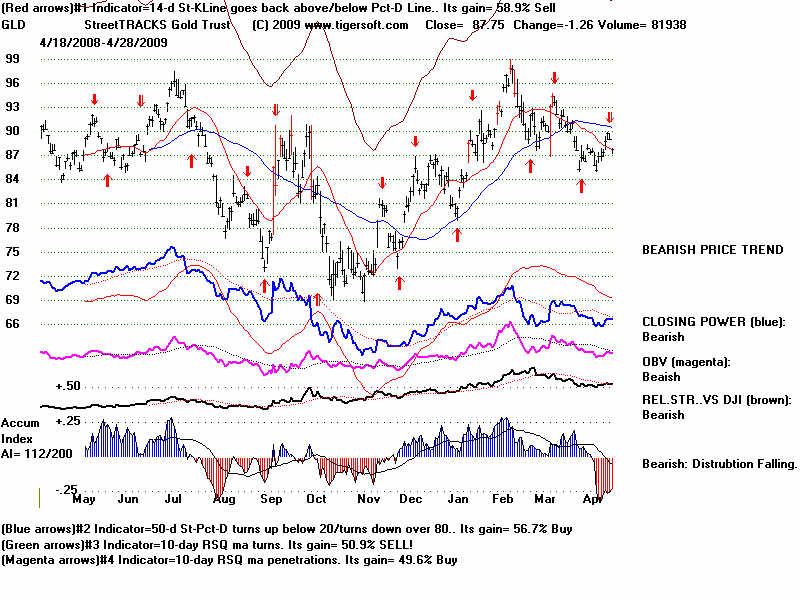
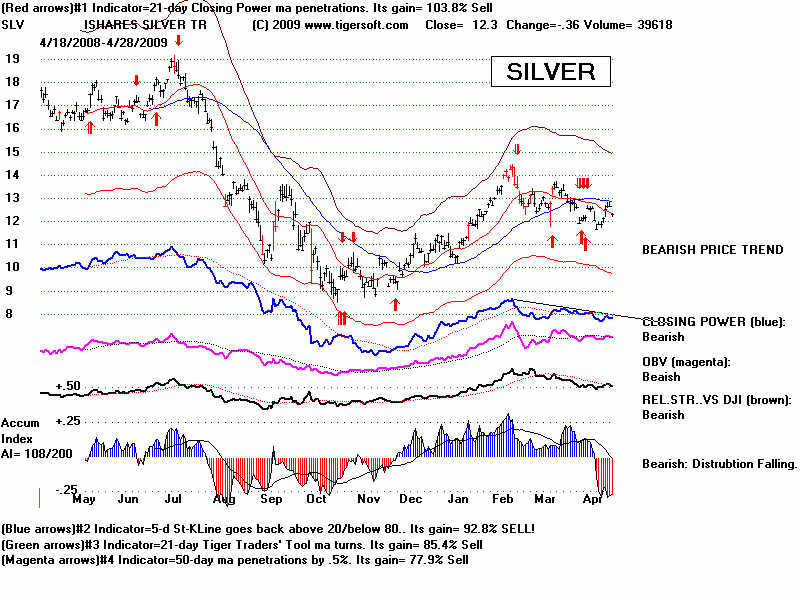
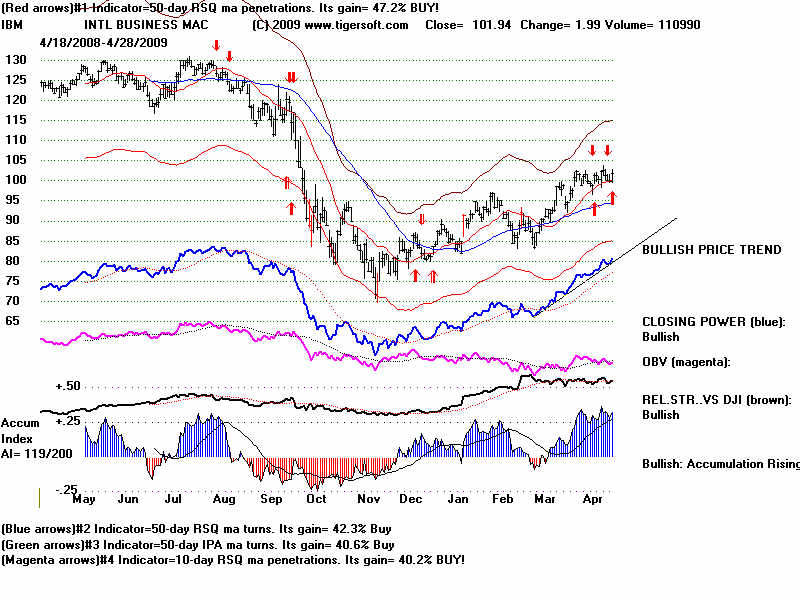
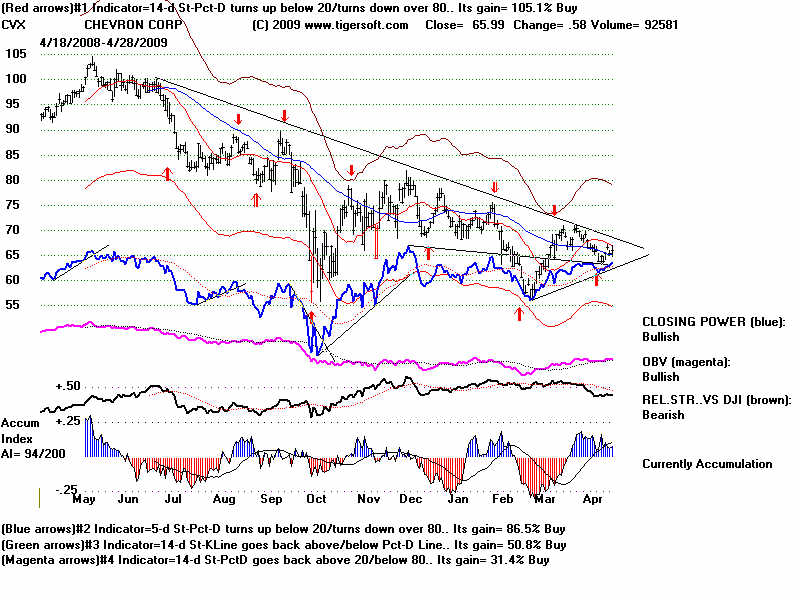
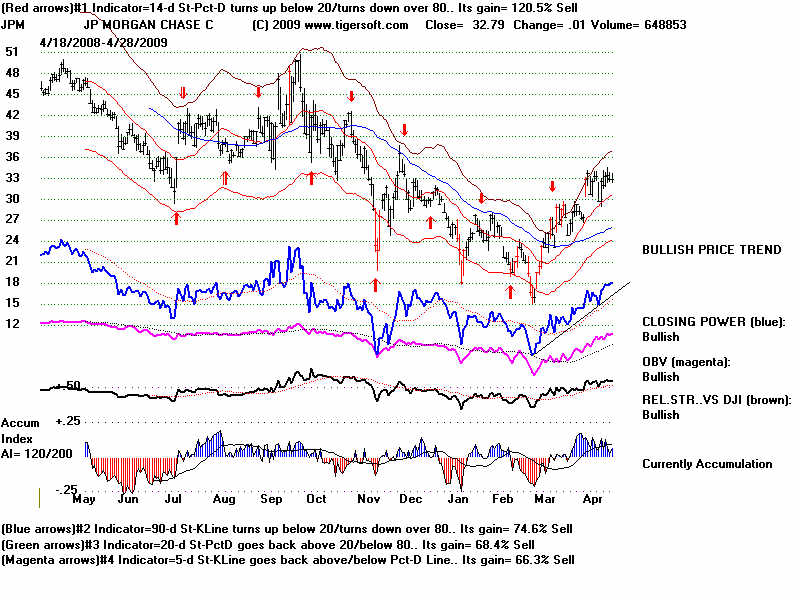
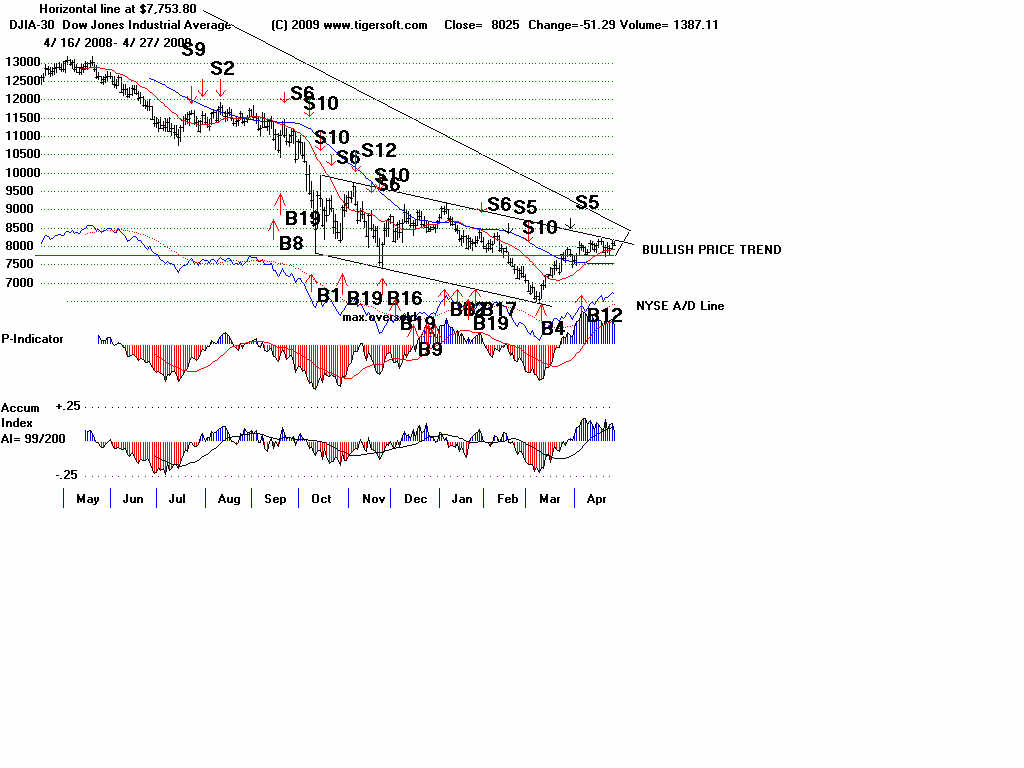