 TigerSoft and Peerless Daily Hotline
(C) 2010 William Schmidt, Ph.D. www.tigersoft.com
All rights strictly reserved.
===> Order form to Renew On-Line,
"Nightly Peerless/TigerSoft Hotline " ($298)
TigerBlogs
for Hotline Subscribers
IMPORTANT -
HOTLINE ADDRESS WILL NOW CHANGE
ON TUESDAY NIGHT FOR WEDNESDAY
LOOK FOR EMAIL MONDAY FROM US GIVING NEW ADDRESS
>>>>>>>>>>>>>>>>>>>>>>>>>>>>>.................................<<<<<<<<<<<<<<<<<<<<<<<<<<<
===========================================================================================================
Overnight
Market Action:
Bloomberg Futures around
the world before the US Markets open.
CNN Futures before the Opening in NY
24-hour Spot Chart - Gold
24-hour Spot
Chart - Silver Dollar and Currencies
Daily
NYSE and NASDAQ New Highs.
TIGER/PEERLESS HOTLINE
7/26/2010
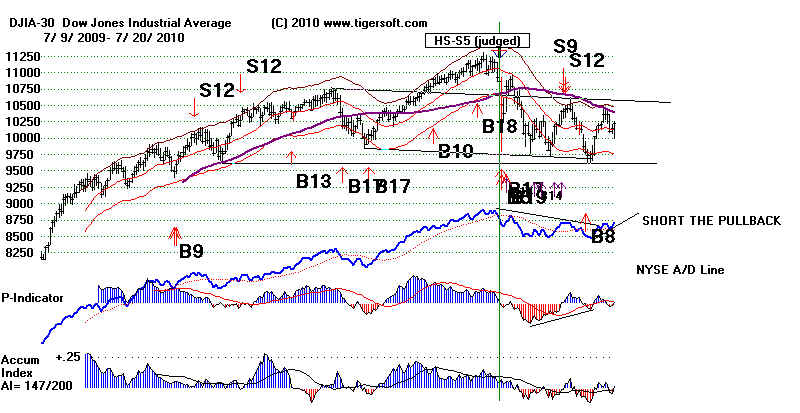
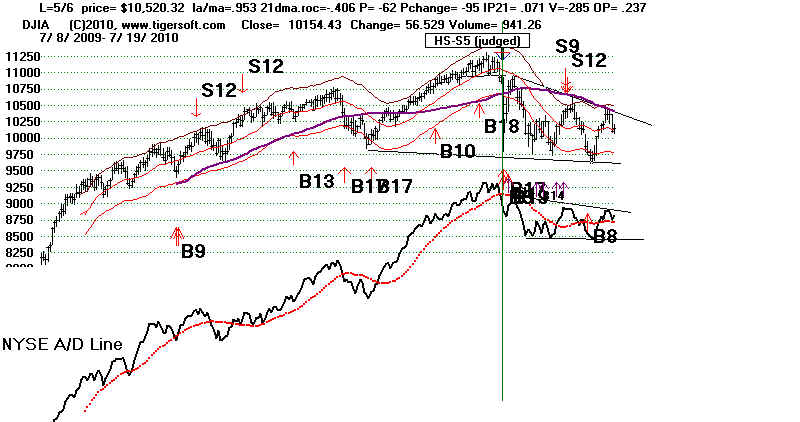
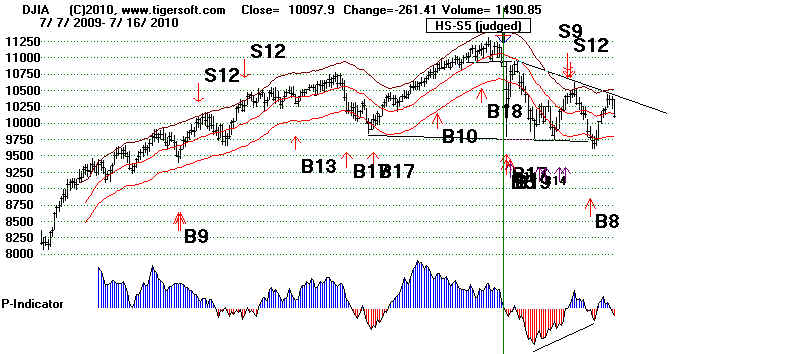
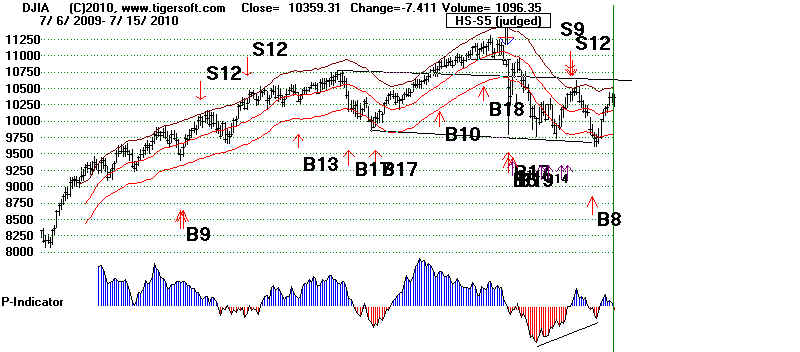
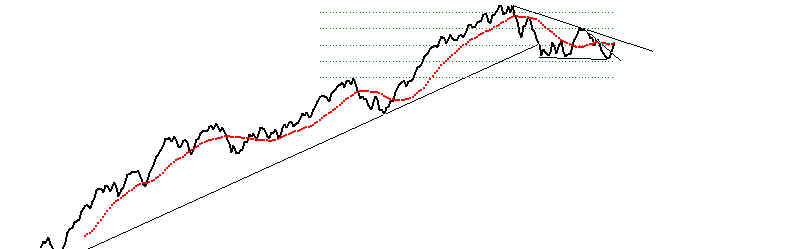
Peerless Buy B8 Still In Effect. The DJI needs a little
more strength to
abort the bearish head and shoulders
pattern. The
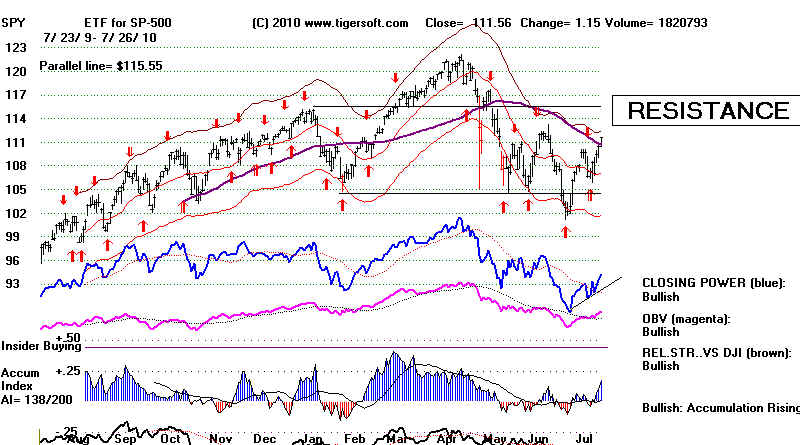
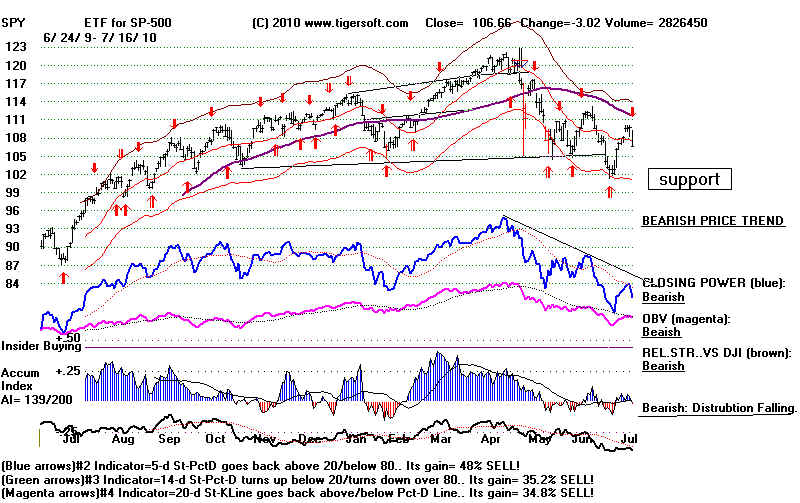
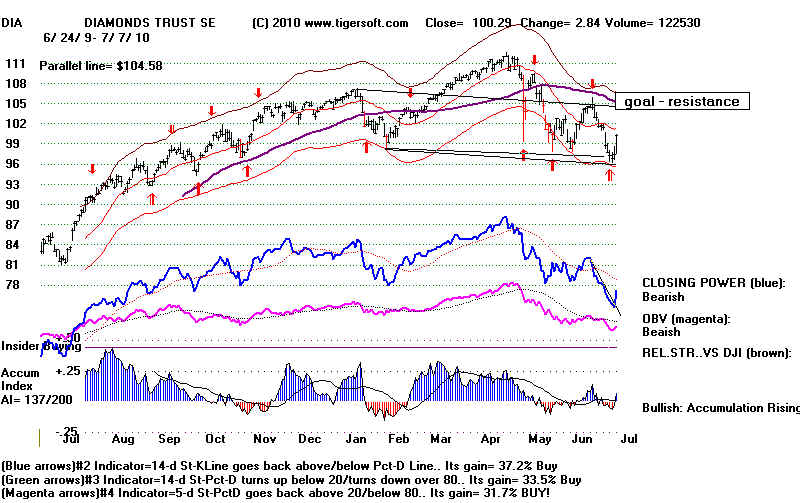
SPY Is at Expected Resistance. So,
just Hold Current Positions.
Do not Short the ETFs.
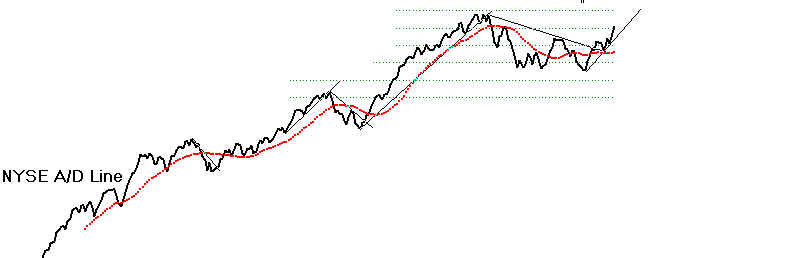
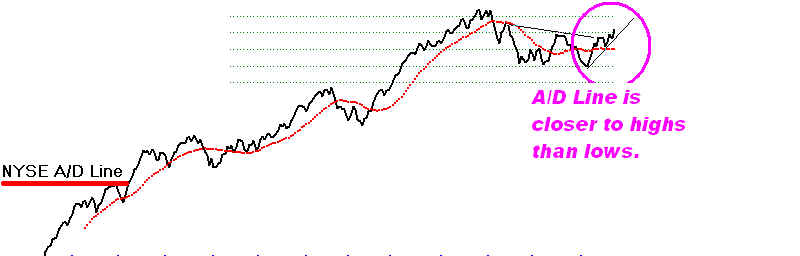
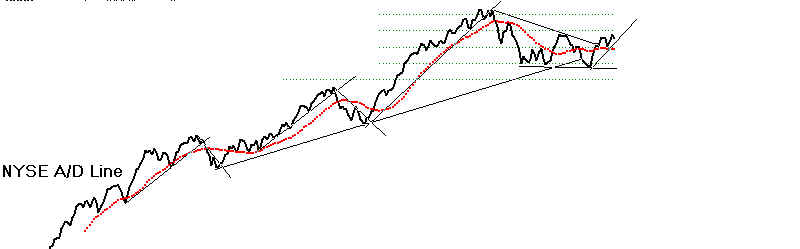
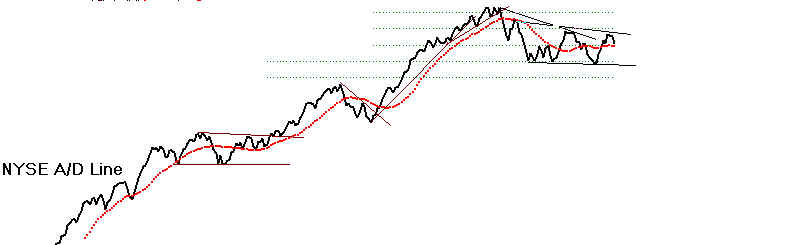
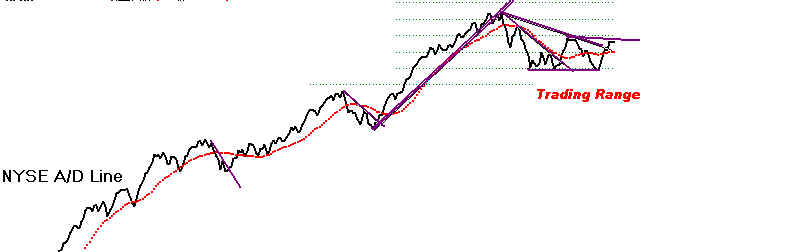
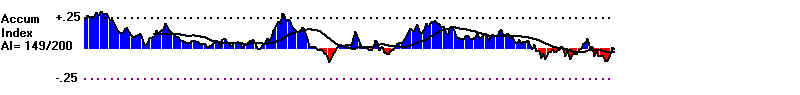
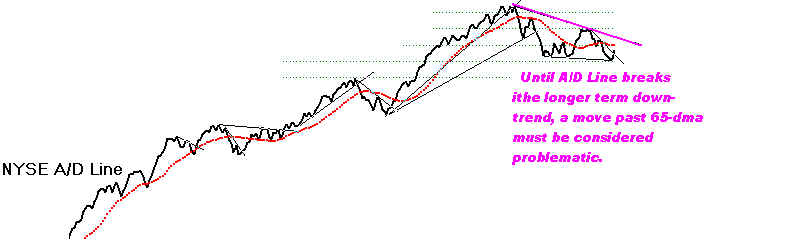
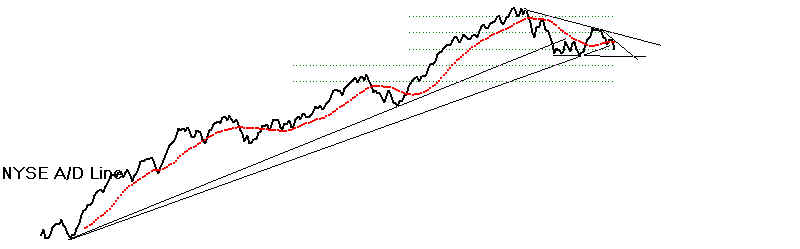
Look at the strength in the NYSE
A/D Line and the
rising CLosing Power Lines.
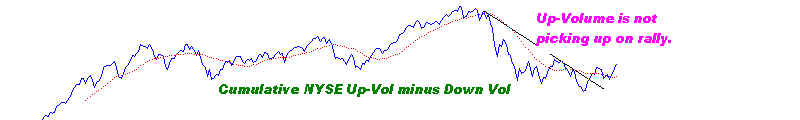
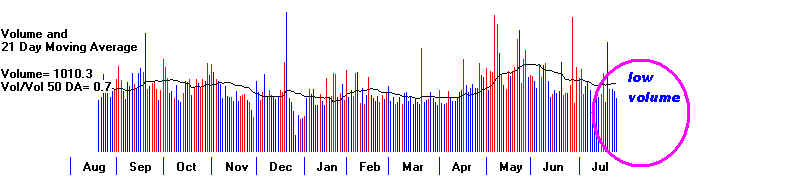
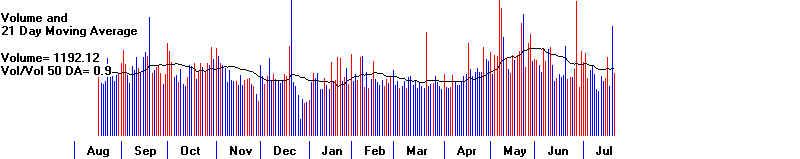
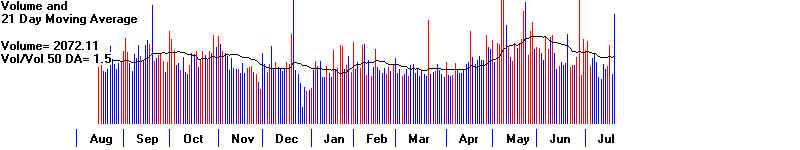
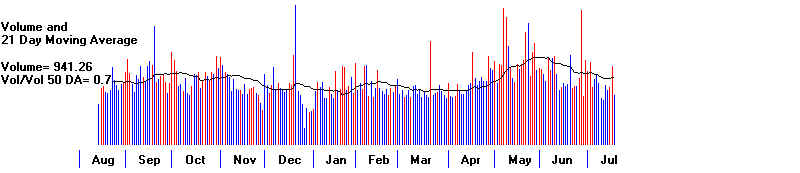
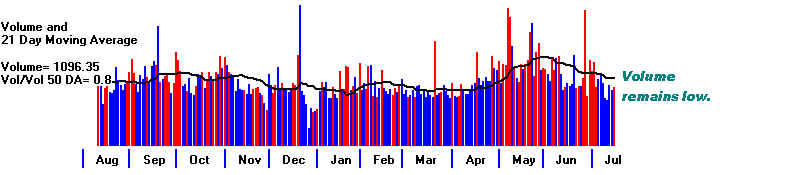
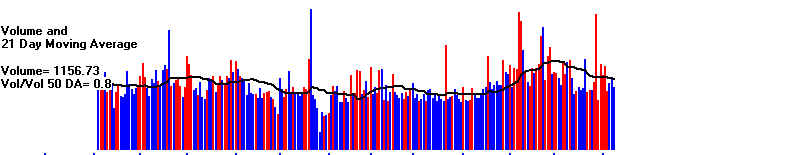
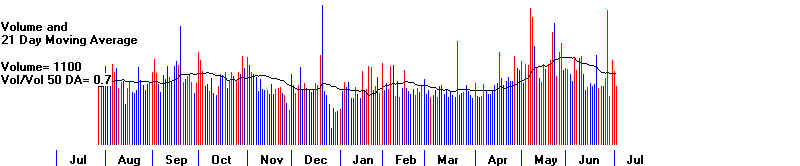
The Low Volume shows that
this Is a Professionals' Rally.
That makes it Imperative
to watch the Tiger Closing Power,
which measures
Net Professional Buying and
Selling.
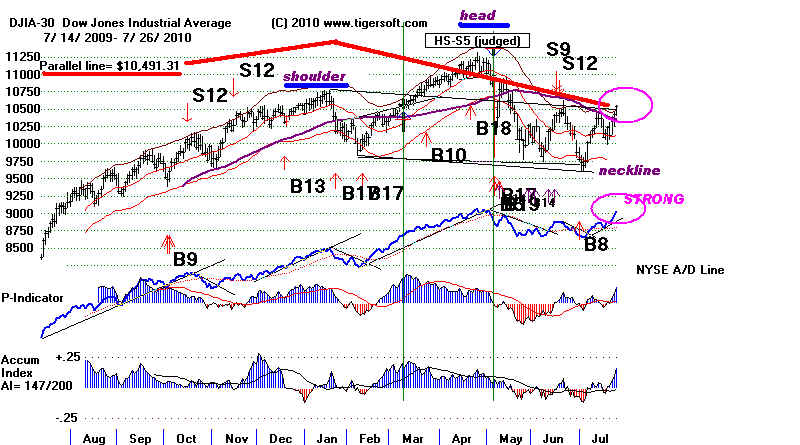
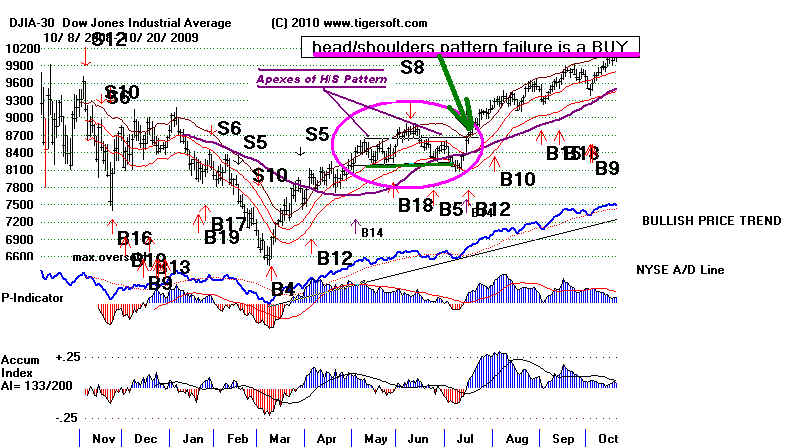
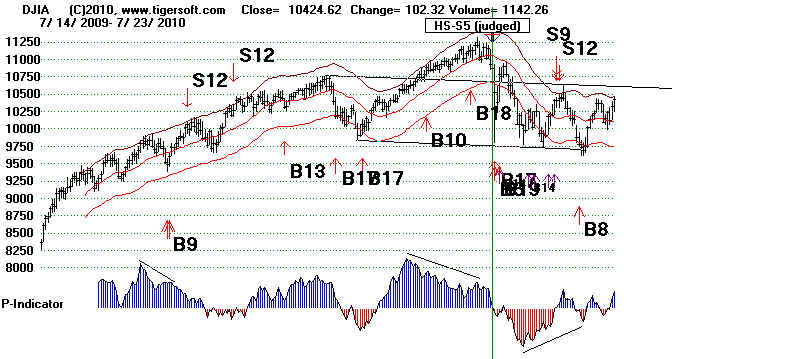
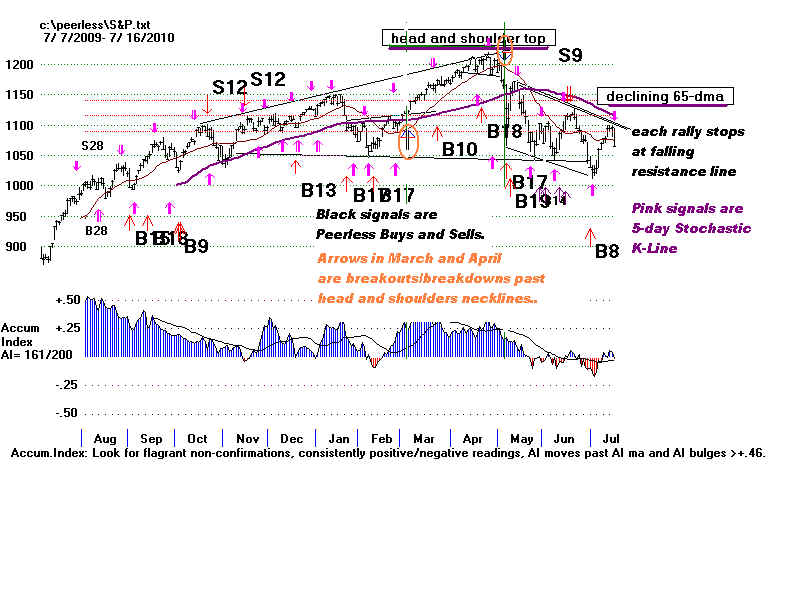
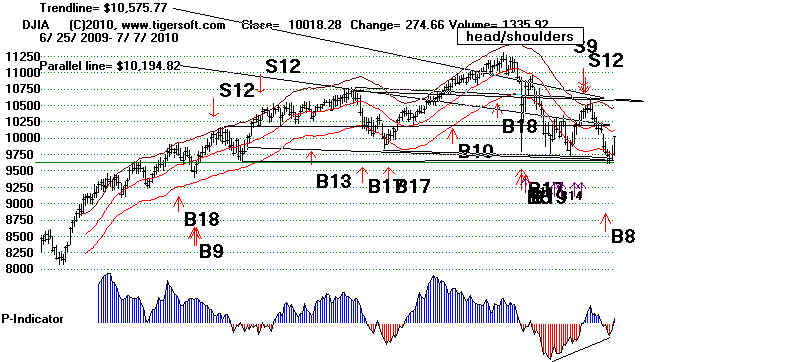
First, see at the point at which the DJI's
head and shoulders
pattern would be
aborted. A DJI closing above 10624 is
needed. Use
this concept with other head and shoulders
patterns and you should
find it useful and profitable. Look
at the earlier cases in
July 1951, July 1983 and July 2009.

.
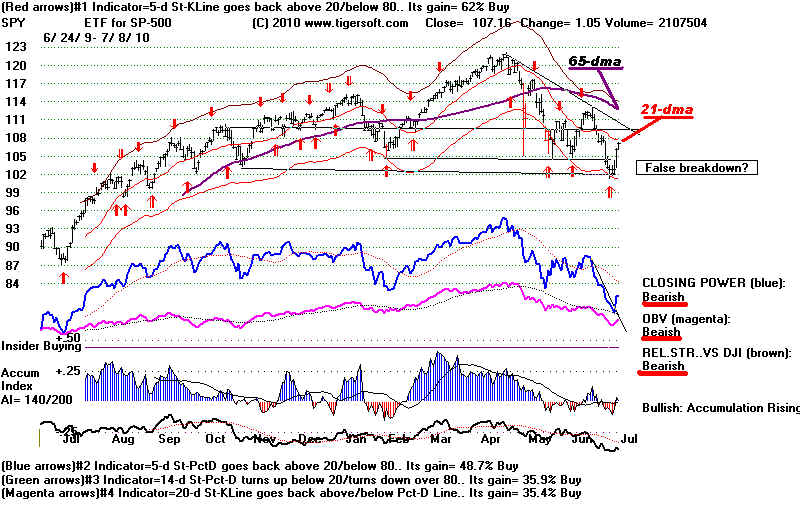
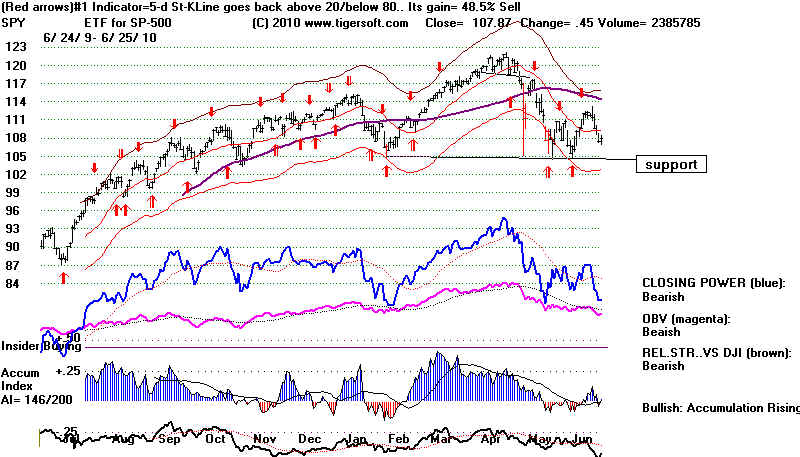
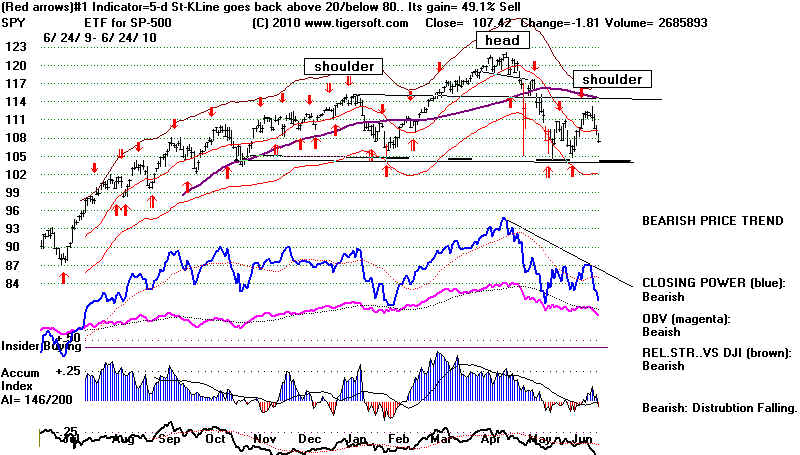
Second, SPY's CLosing Power, like the
other ETFs',
is rising. But it has not risen enough to destroy its
potentially very bearish head and shoulders pattern. It needs
now not to fall back below its falling 65-dma. That would
be bearish.
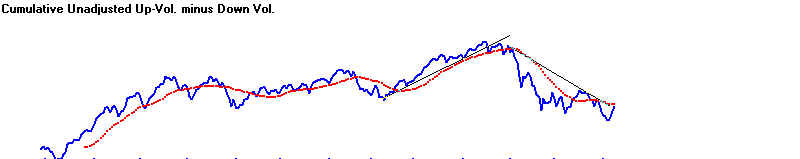
Third, though volume remains low, the
A/ D Lines for
the DJI,
SP-500, NYSE and QQQQ are in sturdy uptrends.
The ETFs' A/D strength more than
matches their price
strength. That means that
rhis is not a rally dependent
on just a few stocks. It is
sturdier than that. Volume,
however, remains low, thus
convincing me that it
is a Fed rigged rally. Will
Bernanke's and Obama's
"wager on the wealthy" be
sustainable if there is not
more job creation? Since no
one is challenging them,
it looks like they will be given
more time for their
experiment. See the other ETFs'
charts....
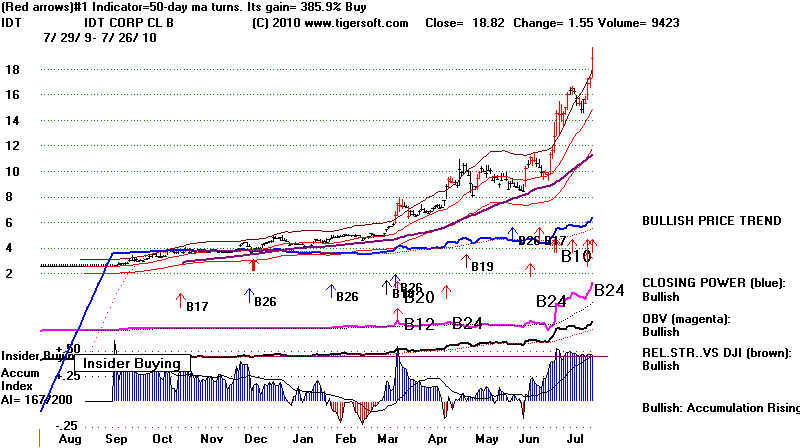
"Bullish" Stocks Whose
Closing
Power Is Making New HIghs (MAXCP)
and which Show Insider Buying
(recent bulges where AI was above +.46)
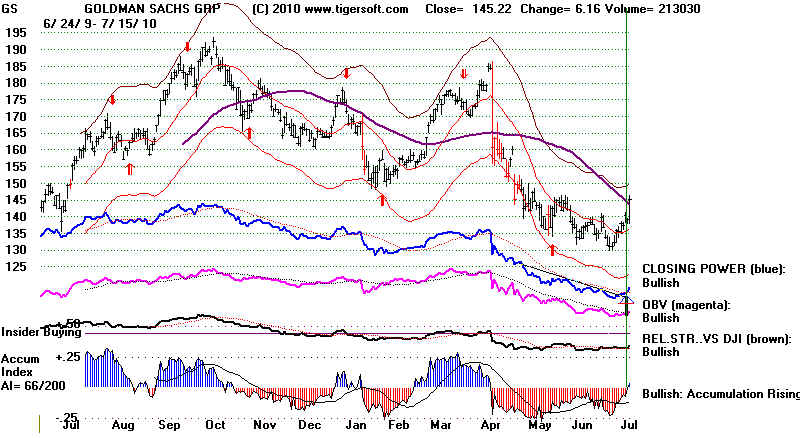
See IDT below and other stocks at
this link...
http://www.tigersoftware.com/TigerBlogs/July-27-2010/index.html
=====================================================================================
TIGER/PEERLESS HOTLINE
7/23/2010
Peerless Buy B8 Still In Effect as DJI reaches
the
resistance zone, made up of upper band, falling
65-day
ma and apex of right shoulder. Breadth
Continues To
Be Strong. Traders should hold long
positions and
not go short yet any ETFs. Closing Powers
are up
trending and we see Stochastic Red Buys from
SPY
and QQQQ, though not for DIA.
Peerless Intermediate-Term traders know that
with the
exception of head and shoulders patterns'
broken necklines,
it is best to just wait for its Automatic Buys
and Sells.
Head and shoulders patterns have to be respected,
even though they
sometimes
fail. They are the way professionals adjust to the unexpected.
The indexes
are testing the resistance at the apex of the massive head and
shoulders'
patterns' right shoulders. A move above these levels nearly always
causes a
rush of shorts to cover. See the case of July 1951, July 1983 and
July 2009.
You can see in the 2009 case, there also was a false breakdown below
the
neckline. Such a scenario could play out in 2010. We just have to wait and
see.
Moving Above Apex of Right Shoulder Is Bullish for DJIA and Market: 2009
The Pros Contol This Market. Trade with Them.
Backed by the Fed's low interest rates and unlimited supply of credit for the big
banks, it is
clear that Market Professionals are pushing prices higher. That explains
(1) the Low Volume,
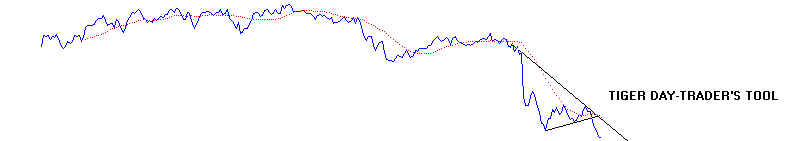
(2) how well Short-Term Stochastics are working with the ETFs and
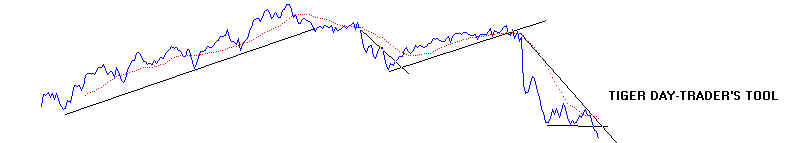
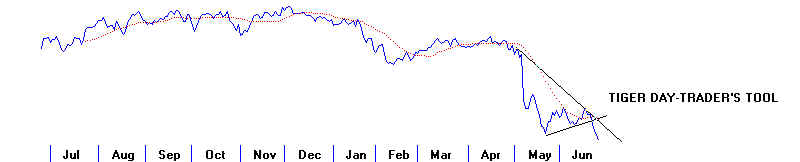
(3) how well the Tiger CLosing Power and Day Traders' Tools are
working, just following their trends.
If volume
was higherer, the general public would be playing a bigger role in the market.
Presumably,
there would be more sustained trends and and also more gaps at the
openings.
As it is, the big banks not only get to borrow vast sums using toxic debt
as
collateral, they do so in secrecy and with no strings or conditions - such as to
make more
and cheaper home, business or consumer loans, or else, And from
the Fed and
this Adminstration, there is an implied guarantee that they will not
be allowed
to fail, even if they lose money trading for their own account. The
Obama
Administration (Summers and Geithner) say big banks are safer than smaller
banks and
they have now quietly approved multimillion dollar bank executive
compensation packages (What do these guys do? What do they make, except
mistakes?).
Big bonuses are OK, too. Obama is Bush with a populist mask on.
See - Professionals Now
Rig Stock Prices with Extra
FED Help and
Approval.
Older People Are Being Forced To
Buy Stocks or Bonds
and Risk Their Life Savings..
The strength in many NYSE stocks
also now owes to the attractiveness of dividends
versus the
interest rates one gets at banks and in money markets. Thus, there are 127
new highs
and 11 new lows on NYSE, compared to 54 and 17 on the NASDAQ.
Speculative
interest would show in a higher ratio on the NASDAQ, where dividends
play little
role. Watch this, however. The NASDAQ is starting to gain strength, but our
NASDJI
indicator, which compares its strength to the DJIA's is still negative, but only
slightly.
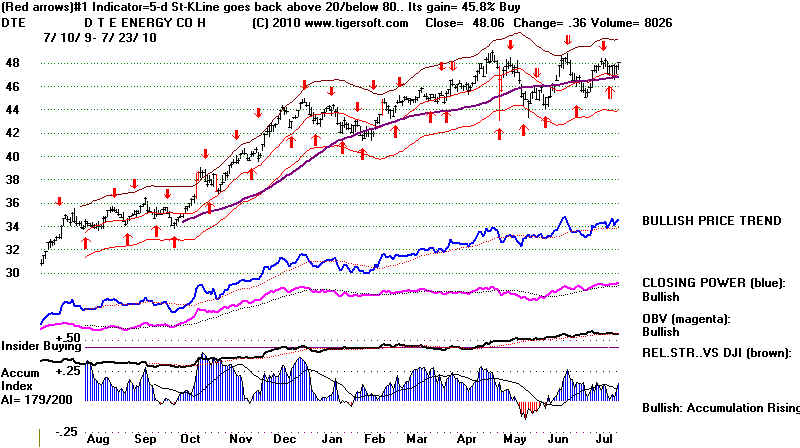
Utility stocks like HE (Hawaiian Electric) do look good, but one might instead
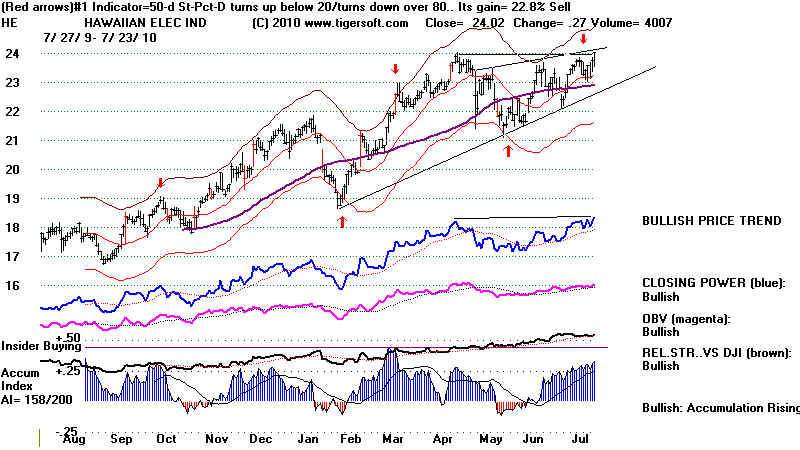
simply
trade DTE using a 5-day Stochastic-K-Line. Entering the trades at the next day's
opening and
using Buys only would have gained someone +47% for the last year.
BUY and SELL DTE on The Day's Opening after a Red Buy or Sell from Tiger.
This would have gained a trader 47%. starting with $10,000
and allowing $20 per trade.
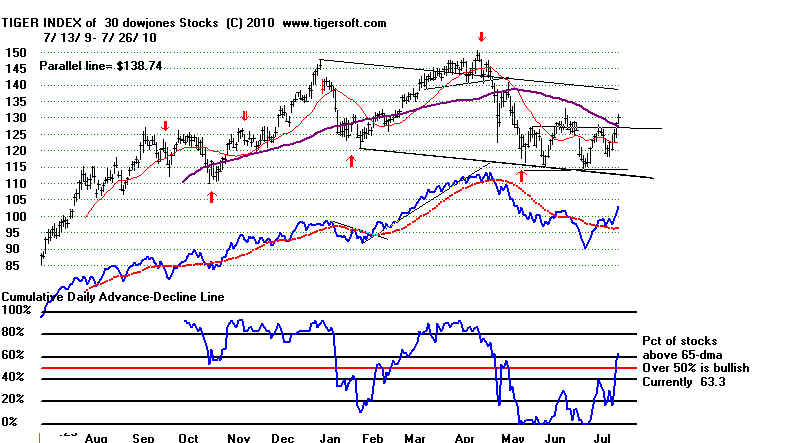
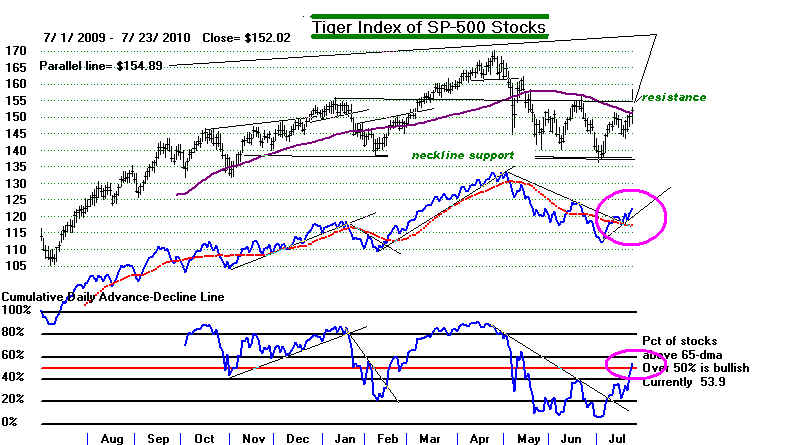
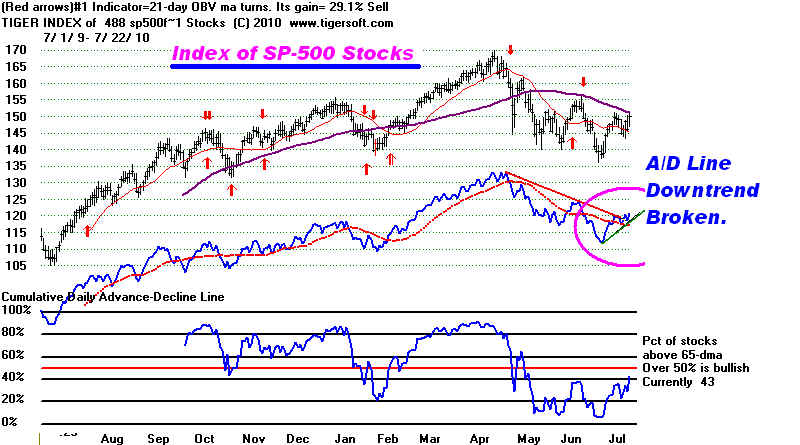
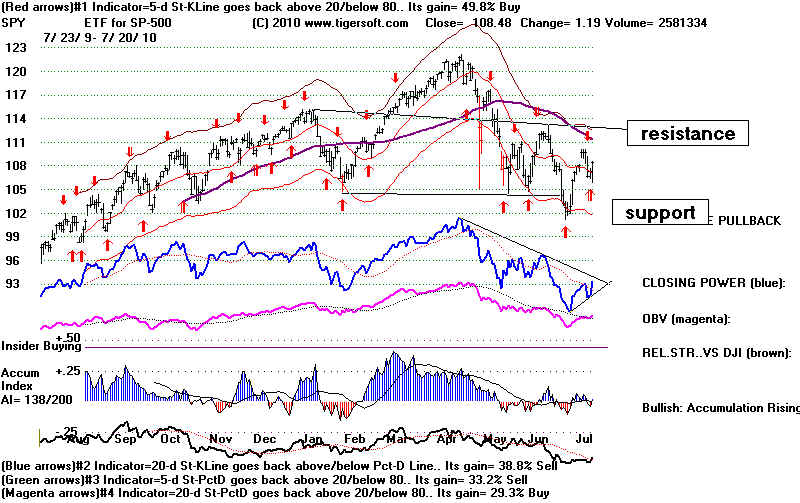
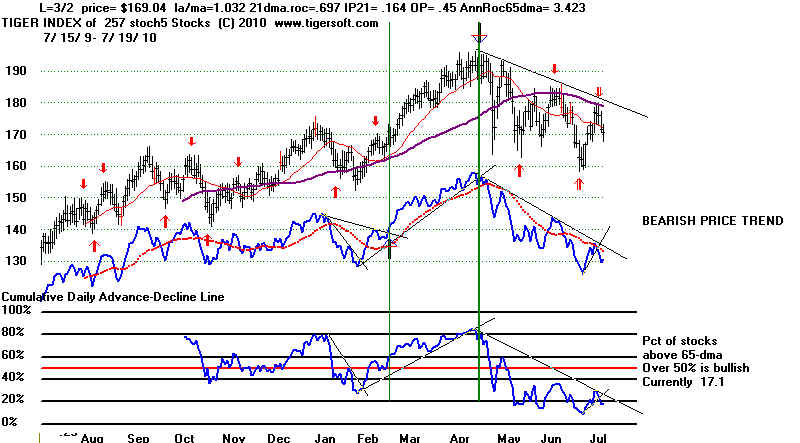
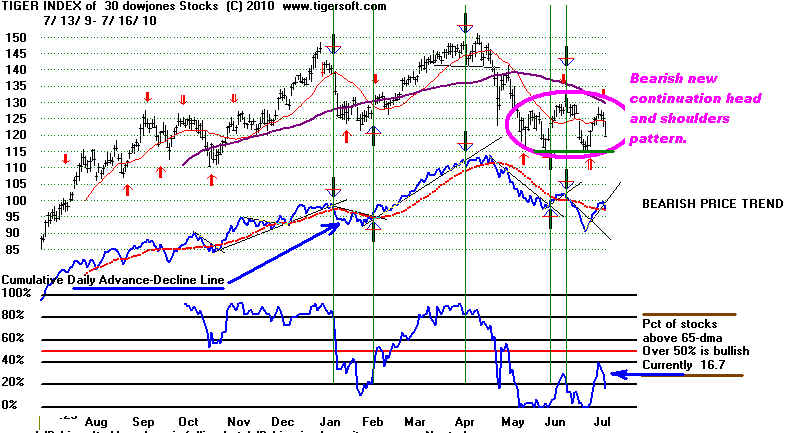
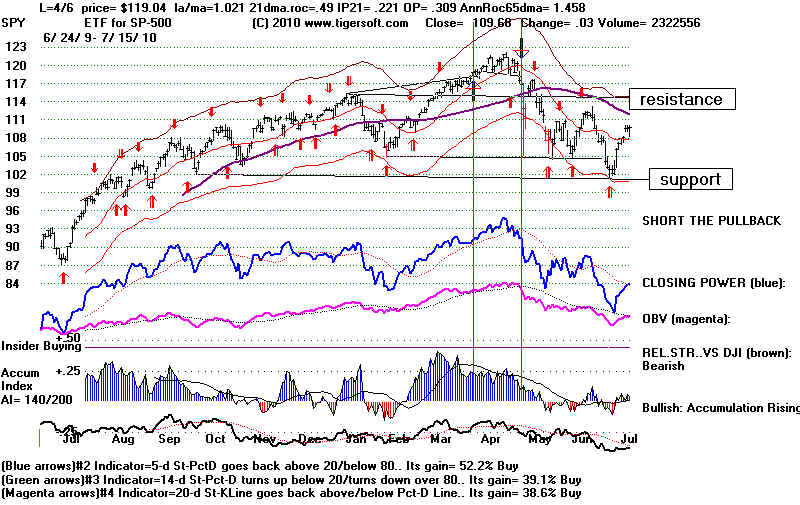
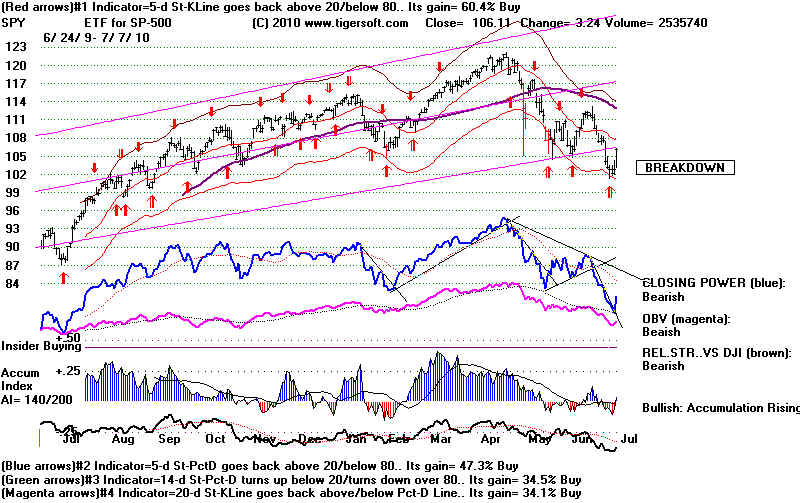
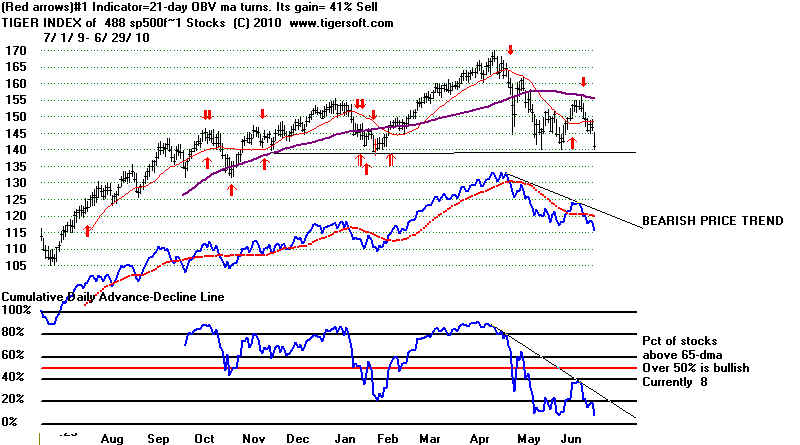
The SP-500 is moving up nicely. Look at its A/D Line below and now
the fact that more of its stocks are above their 65-day ma than below it.
The SPY (see second chart below) is still on a short-term Stochastic Buy
and shows a rising Closing Power Line.

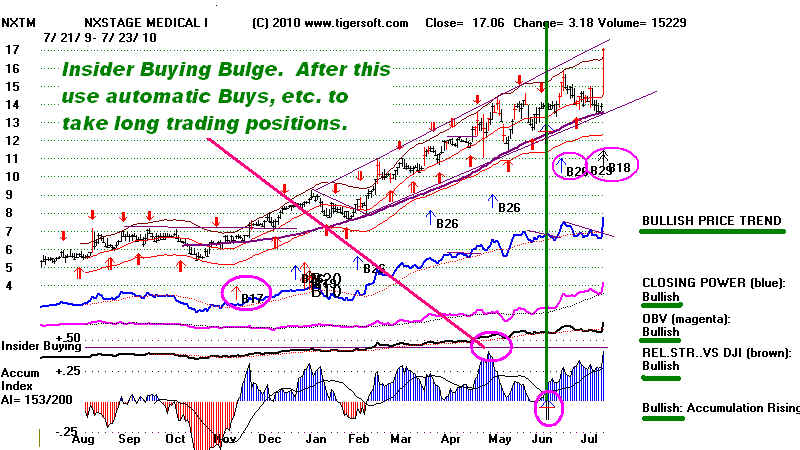
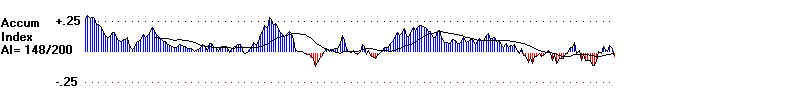
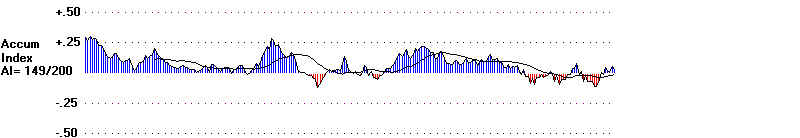
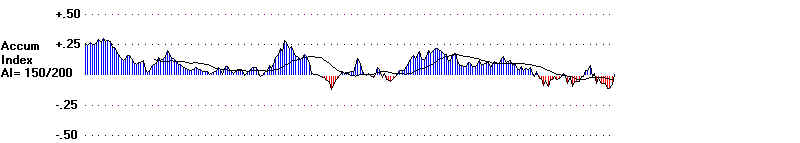
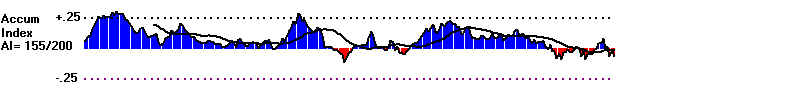
VERTICAL BULGES OF ACCUMULATION
SHOW INSIDER BUYING
For
Tiger users I have updated the ACCUMVER download of data. This shows
all the stocks with spikes of
Accumulation above +.46 in the last two months. We
do not need to have the Accum.
Index above that level that high to buy a stock.
It is enough that there previously
was such a bulge of Insider Buying.
Nearly all
the stocks that are among the very best performers for 2010 show this
size bulge or even more. See
the study I just did: Best
Performing Stocks of 2010
In it, we see how good the
Tiger automatic Buy signals are generally and how well it
works to look for these stocks to
either make confirmed new highs (B24s) or after some
weakness, have their
Accumulation Index come back above its 21-day ma, the "TISI" Line.
Two other
things should also be noted: (1) sudden jumps in IP21 (Current Accumulation)
that bring "B17s" often
mark the very start of the moves of the best performing stocks
and as long as the stock does not
violate its 65-day ma and (2) always give it a chance
to go vertically higher and
show why the insiders were buying. We believe that this
reliably shows that they
expect good news on the stock. See how much NXTM jumped
on Friday. We are long this on our
Stocks' Hotline.
NXTM - NxStage Medical, Inc., a medical
device company, engages in the
development, manufacture, and marketing of products for the treatment of kidney failure,
fluid overload, and related blood treatments and procedures in the United States.
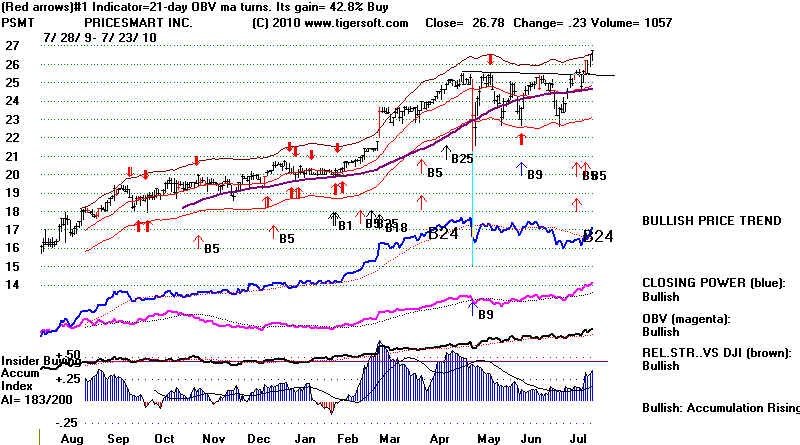
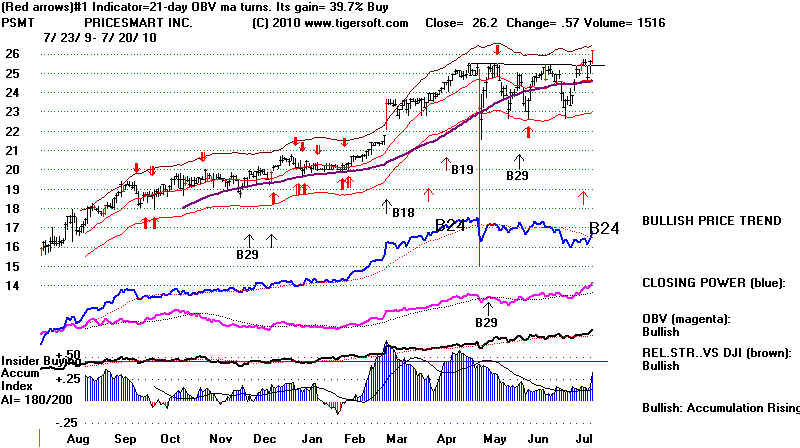
PEERLESS AND DJIA

PSMT - Price Club - Is A Buy.
They now have the best strawberries in the
world.
They are the size of golf balls.
=====================================================
7/22/2010
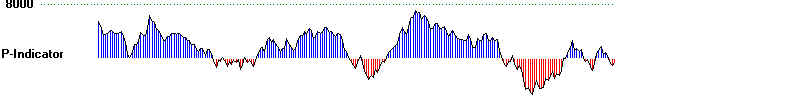
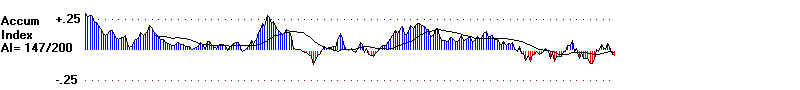
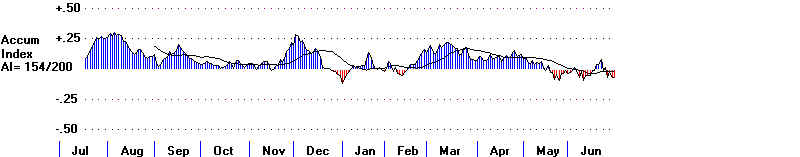
Peerless Buy B8 Still In Effect. The
P-Indicator and
Accumulation Indexes rose enough to take them
out of the ranges that Sell S9s and S12s
require,
unless there is a very wicked reversal
tomorrow.
The
65-Day MA at 10430 Is Expected Resistance.
See how the market handles
this.
Breadth Was Very Good. The
NYSE A/D Line is bullishly
recovering and rising faster
than prices on the DJI.
Volume will have to pick up
to get the indexes past
the resistance at their
potential right shoulder's
apex in their very apparent
head and shoulder patterns.
I
am impressed that the SP-500's A/D Line downtrend
has been broken. But
its A/D Line is lagging the NYSE's.
The ETFs' Closing Powers are coming to the apexes
triangles bounded by
their internediate-term declining
and short-rising
trendlines. Their Closing Powers
are lagging prices.
Professionals are not convinced
that the market will
escape a head and shoulders'
decline.
Quantifying
Divergences between
Closing Power and Prices
A Tiger Program needs to be
written to compare how
far up to its 100-day highs from its 100-day lows are
(1) Prices, (2) the A/D Line and (3) Closing
Power.
Subtracting the second or third from the first would
show whether their is bullish or bearish divergence.
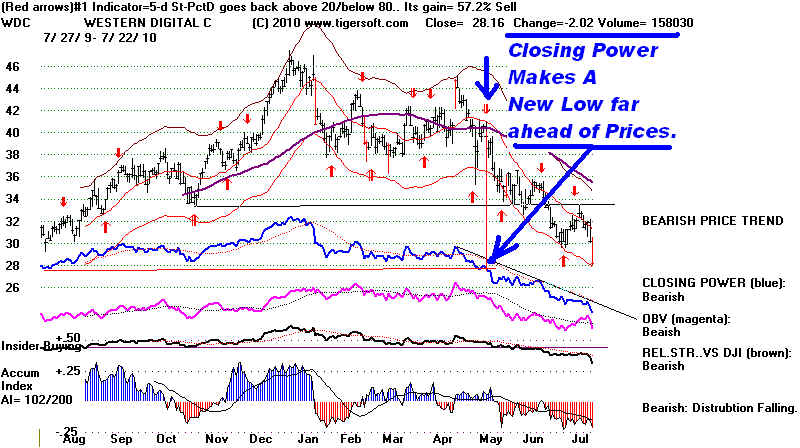
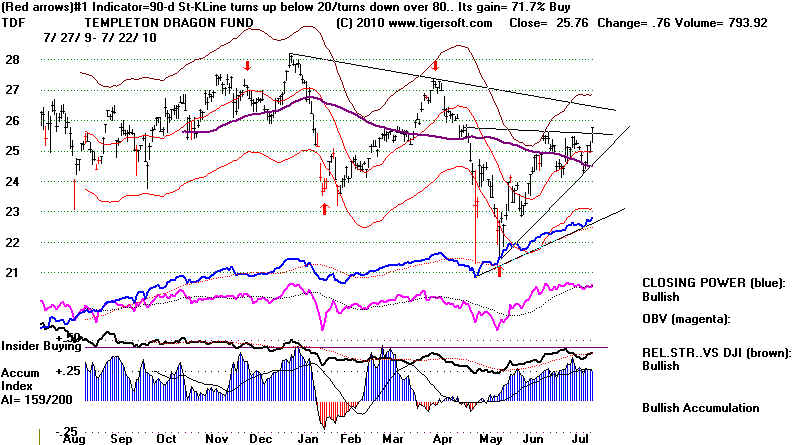
You can see how well losing Power led prices to a
low in the case of WDC (Western DIgital) and is
much stronger than prices in the second case (TDF).
Until these new programs are written I would continue to
with the MAXCP and MINCP sets of data on the TigerSoft
data page. MAXCP shows CLosing Power new highs of
last two days, while MINCP shows the new lows.
Closing Power measures net buying by
professionals.
Because, professionals can turn on a dime, we
watch
Closing Power trends and want to see bullish
accumulation, too. Even so, TDF (below)
is clearly
acting well internally. And using the
CLosing Power
breakout, one would have been a buyer just off
its
recent lows.
Professionals are much more cautious now than a
year ago. Many of the stocks whose
CLosing Power
were leading prices a year ago were tech and
beaten-down
consumer stocks. Now the CLosing Power
leaders
are mostly dividend plays.
prices
|
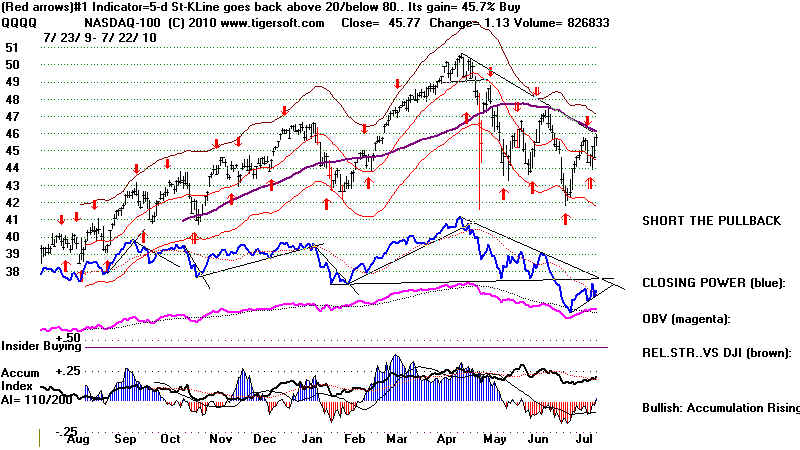
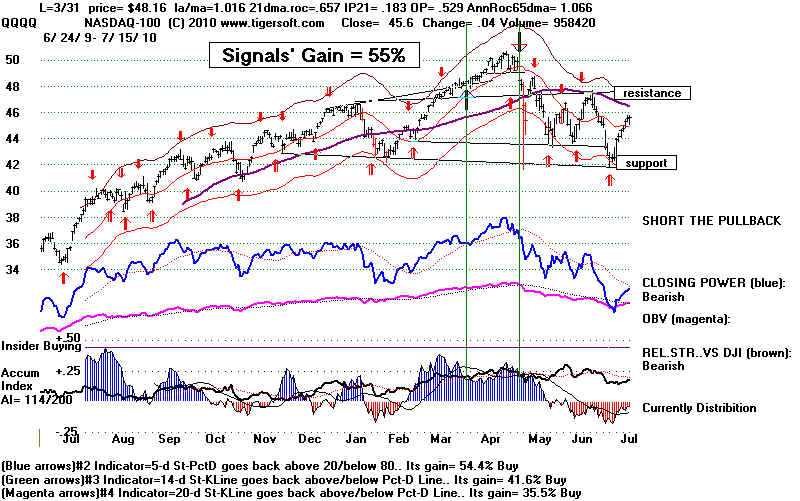
QQQQ Is Still on A Buy.
Its Closing Power Is Coming To Moment of Truth
SPY Is Still on A Buy.
DJIA - Still No Sell.
=========================================================
7/21/2010
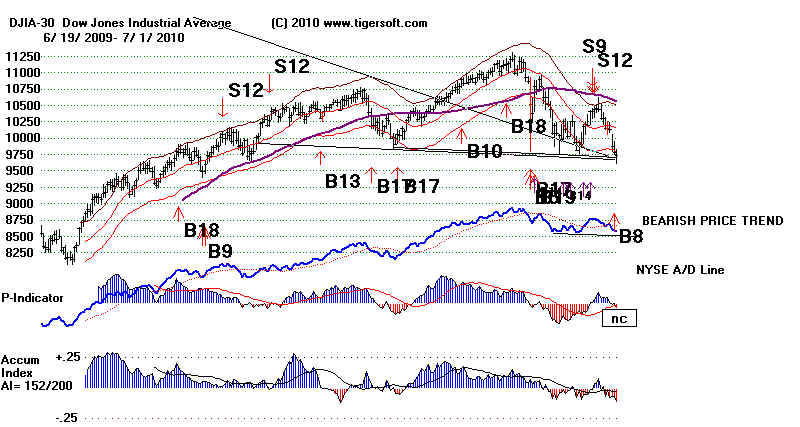
Peerless Buy B8 Still In Effect. But the Pattern
of Declining Tops and Flat Support Suggest There
Is A Higher Chance for A Breakdown than A Breakout...
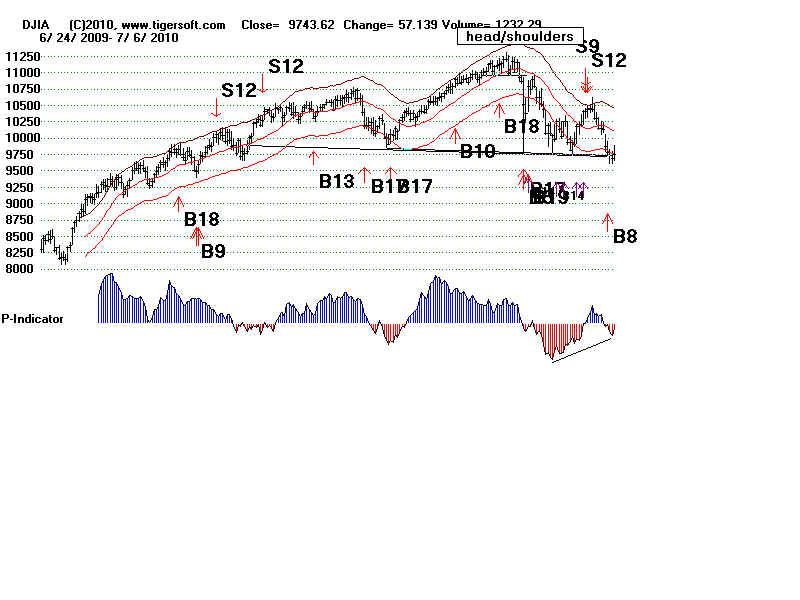
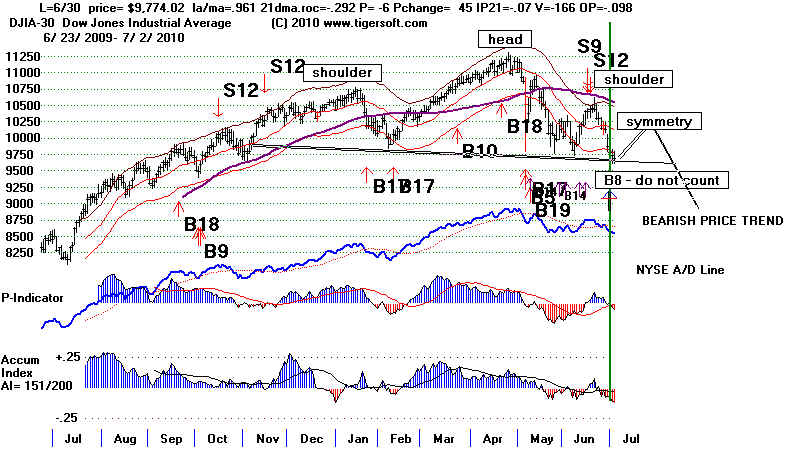
This
sure looks like a Massive Head and Shoulders pattern that the DJI is forming,
as it works out its
business filling out a more symetrical right shoulder, preparatory
to a serious breakdown
in, perhaps, a month.
Was Goldman Given A Slap on The Wrist
As Part of A Deal That The Would Continue To Support The Market?
Head and shoulders patterns can fail
and not bring a plung below their
neckline. I have
mentioned some cases in the past when this was true in the Summer,
most notably 1951, 1983 and
2009 Breadth has been this market's technical elixir
and you can below that the
NYSE A/D Line is stull in an uptrend. Also, we do not have
a new Sell unless we
change the rules for an S9 in Julys just to get a Sell here. Given
the head and shoulders
pattern that might seem like a good idea. If NYSE breadth was
worse, I probably do that.
That it is not, reinforces the notion that the Fed will keep
interest rates so low that
the big banks, especially Goldman, JP MP Morgan and
Bank of America, will have
plenty of money to support the Futures and the ETFs,
thus holding up the averages.
INDEX OF 88 STOCKS WHOSE
CLOSING POWER
IS MAKING NEW LOWS
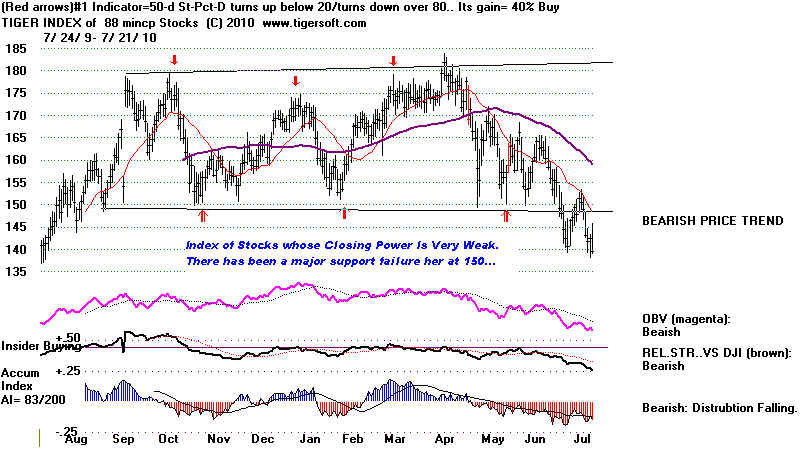
Continue To Sell Short The Stocks Whose Closing Power
Is Making New Lows. These Are Serious Under-Performers.
And, in Some Cases, They Are Plunging, as Though Hitting Serious
Air-Pockets of Zero Professional -Support.
These are the stocks in the "MINCP" Group tonight that
look the weakest. Use
TigerSoft and our
MINCP download tonight to see the, As a group, they
are much weaker
than the general market. Similarly, our MAXCP group is
much
stronger than the overall market. I like these two groups for hedging.
AAPL
AMR
multiple H&S
ATHN - Red buy
but price breakdown
BA
BCR recent rred
Distrib. new red short-term Buy.
BKS SS AI/200=79
CMTL -10 today
CONN AI/200=68 head and shoulders
ECA on red Sell and
just broke 65-dma
HBHC
IBKC head and shoulders
steady red distribution
JNJ
KGC gold
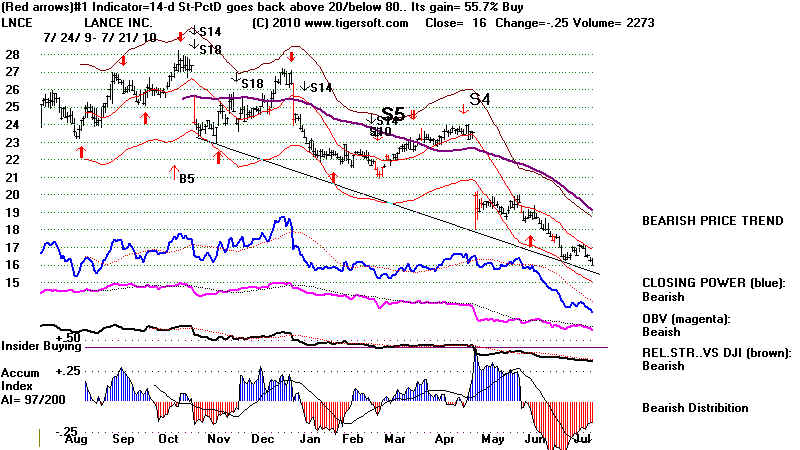
LNCE - Sell this short: "cavin in!"
PJC
PNEP 9.37 -2.84 H&S
RIG - 47.75 Seems ready to breakdown.
Where Were The Expected Bernanke
Bromides
about Economic Recovery?
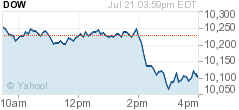
Bernanke's
warning about the economy set off a selling wave at 2:00 PM EST..
But the damage was limited.
Bullishly today, breadth was not so bad as it was
good the day before and volume
declined. The DJI did not break the support
of the 21-day ma.
Down Day Volume is High.
Institutions Are Still Selling
As Professionals Support The Market For Now.
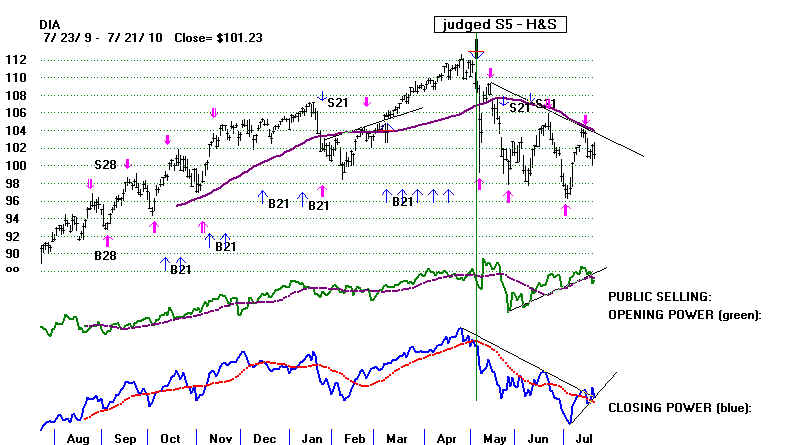
The Public Is Turning More Bearish (DIA Chart)
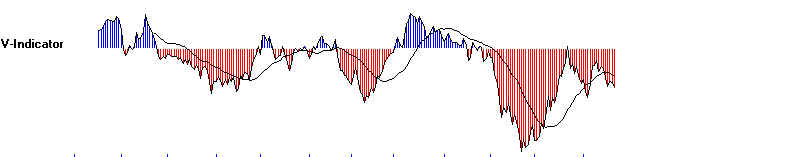
Notice
how negative the V-Indicator was as the DJI's high reached 2.51% over the
over the 21-day ma.
We can backtest the key parameters on that day, 1/15/2010.
la/ma= 1.02 high/ma = 1.0251 P = -53 IP21= .033 V= -51
Going back 20 years, we find
these earlier cases of the key statistics equalling
the parameters seen on
1/15/2010. in 6 of 9 cases, the a Sell S9 with these
conditions would have worked
well for traders. Eech of the 3 June-July cases
worked well for short
sellers. Peerless presently gives signals in each of
the June-July cases.
Adding the condtions above would have meant a Sell S9 on
July 15, 2010. This should
make us nervous now.
Bad - 12/23/1998
Good - December 1999
Good - January 2000
Bad - 1/7/2005
Good - June 2006
Good - July 2007
Good - November 2007
Good - July 2008
Bad - October 2009.
??? - July 2010
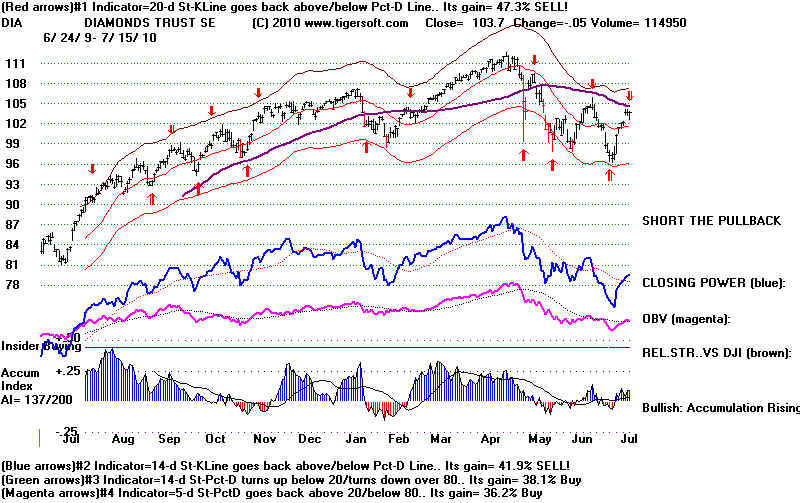
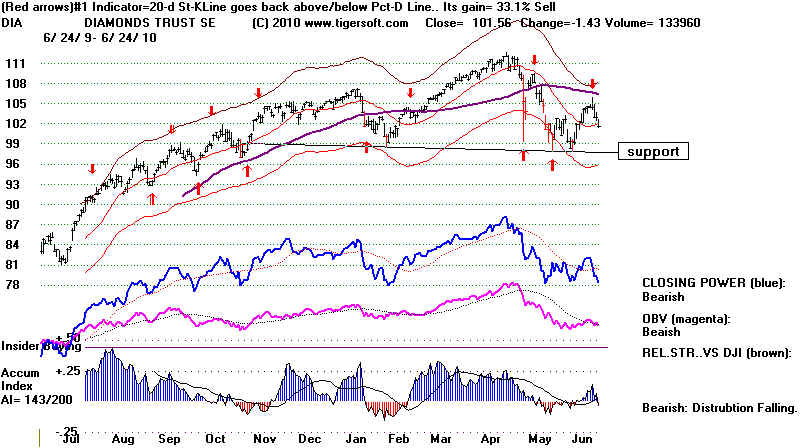
DIA - On Red Sell. CLosing Power's
Status Is Still Bullish.
But it could bearishly break its uptrend.
Professionals
Have Not Switched to New Sellers, Yet.
SPY - On
Red Buy. CLosing Power's Status Is Neutral 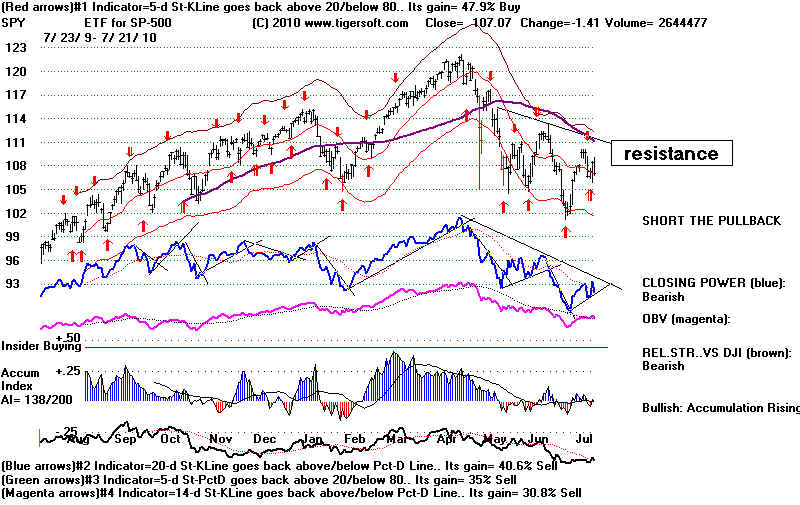
DJIA and Peerless Signals and Indicators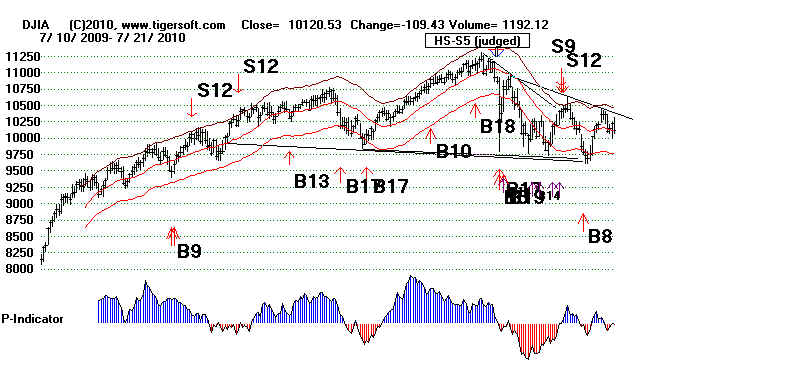
======================================================
7/20/2010
Peerless Buy B8 Still In Effect. Market Tops
Take
What Seems Like A Long Time To Develop. Until t
here is a DJI bullish move past 10500 or a breakdown
below 9600, the market seems stuck in a trading
range,
bounded by the recent support and the recent peaks.
Having tested support, like a ball, the market is
likely to
bounce back up to resistance. Today brought a
high volume intra-day reversal up. Closing
Powers
moved up smartly, as professionals expect Bernanke
to tell Congress Wedbesday that he expects to keep
interest rates low. Because of the steepness of
the
decline of the DJIA's 65-dma and the potential for
another right shoulder in its head and shoulder
pattern,
I would prefer not to recommend buying the SPY.
I put a
lot of stock in A/D Lines of groups. The A/D Line for the SP-500 has just
broken its downtrend.
There are now more stocks on short-term buys than sells,
154-103, in our Stoch-5
group. Bullishly, there were 98 stocks that had their Closing
Power make a new high and
only 22 that presented new lows in the last two days.
Only 15 Nasdaq stocks made
new highs today, while there were 94 on the NYSE.
I take the NYSE's greater
strength to mean investors prefer safety and dividends
at this time.
This is not necessarily
bearish. A clear breakout by the averages above the 65-dma,
might well "set the woods on
fire", as Hank Williams once sang. The 65-dma will have
to turn up, too, and a clear price breakout above support is likely. If you have the
Peerless book, look at 1934
and 2004, both mid-year consolidations after bull market
recoveries, and you will see
the pattern. For now professional traders are betting
short-term on higher prices.
As we have seen, they can turn on a dime.
The A/D
Lines for the stocks that comprise the DJI-30,
NASDAQ-100 and SP-500 have made recovery new highs.
The Closing Powers for the SPY and QQQQ are on Buys
and made recovery highs, as has the DIA. The
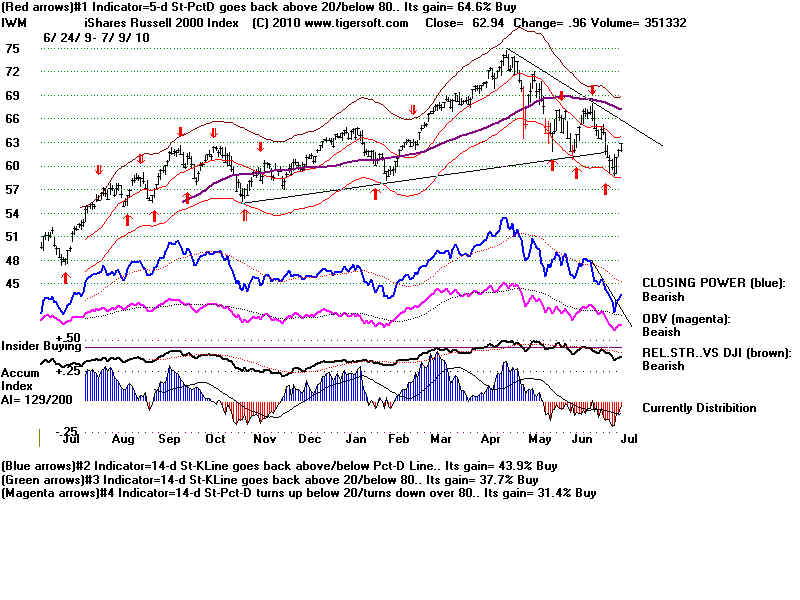
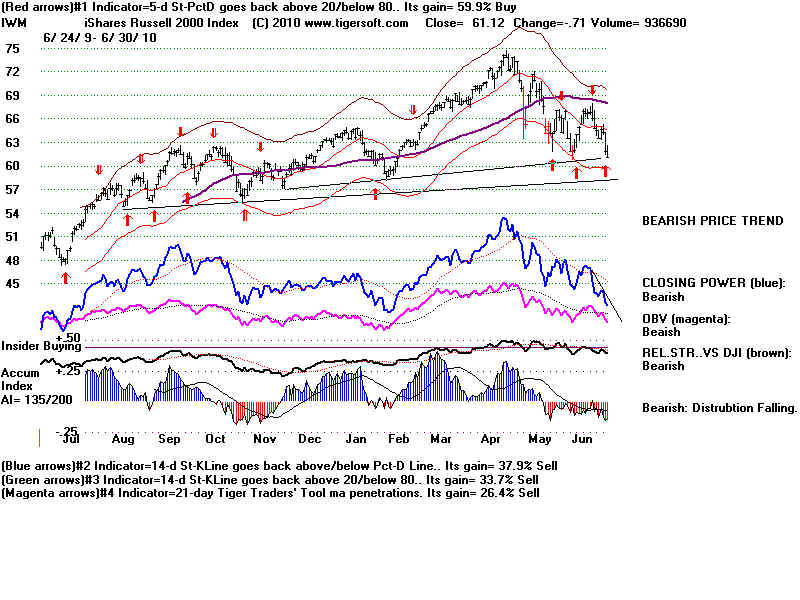
IWM
(Russell-2000) has not made a new recovery high and
is on a Sell. Also showing that the broader
NASDAQ
has not been benefitted as much from the rally the
relative strength "NASDJI" for the NASDAQ
is negative.
See the key charts -
The DJI is now 1.1% over the 21-day ma.
The P-Indicator
has turned slightly positive, a +4, while the
Accum. Index
is now +.019. A rally of 1.5% more with either
poor breadth
or a close near the lows for the day will likely
bring
a Sell S9 or Sell S12. Any such rally would
also face the
resistance of the DJI's declining 65-day ma.
We are long more stocks on the Stocks' Hotline than we
are short. We hold this posture until we either
get
a Peerless Sell or a decisive breakout past the
65-dma.
We have no positions now in the SPY or DIA.
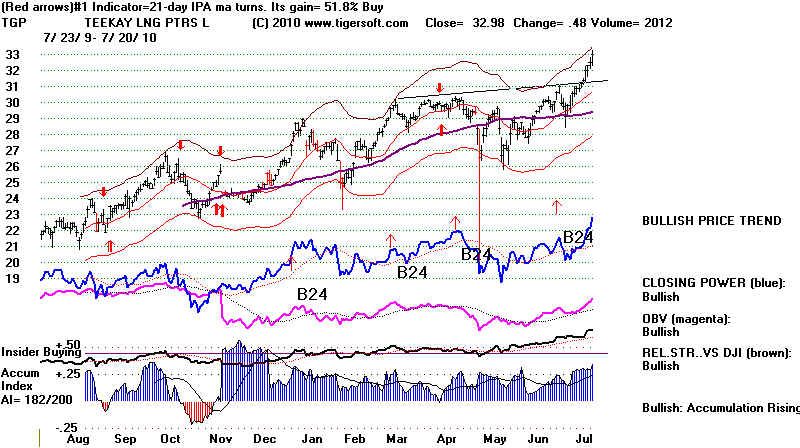
There were some attractive flat topped breakouts.
Look
at the charts of PSMT and TGP below. These
should be
bought by traders.
 |
 |
==================================================================================
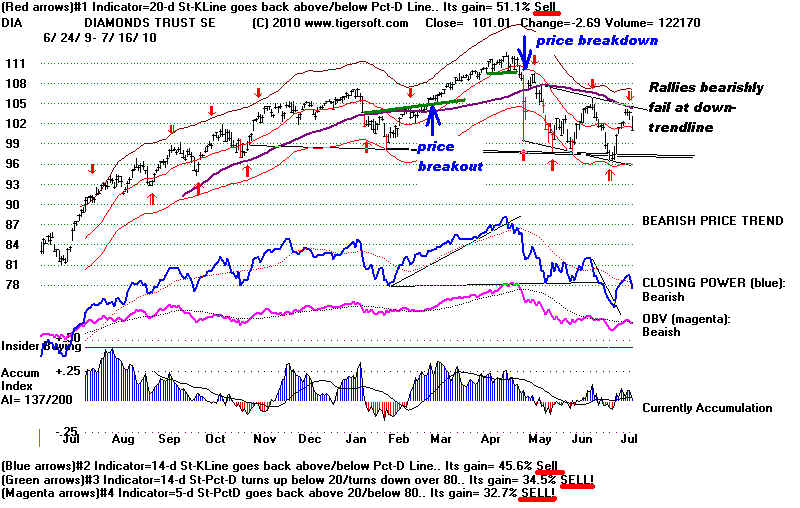
7/19/2010
Peerless Buy B8 Still In Effect. Market Tops
Take
A Long Time To Develop. Until there is a DJI
bullish move past 10500 or a breakdown below 9600
the market seems stuck in a trading range.
The
recovery from 21-dma Support was a 2009-2010 typical rally, Low Volume
but Good Breadth. Professional Traders
seem to be whipping the market
about. The action brought Short-Term Buys
from the QQQQ and SPY, but not DIA or IWM.
The CLosing Power downtrends keep me from
recommending going long short-term.
The advance is apt to be too brief. Better to
plan to to Sell Short SPY or DIA nearer
the 65-dma either on new Red ETF Sells or a Peerless
Sell. See charts Only 6 of the
30 DJIA stocks are above their 65-dma. There
should be a lot of resistance overhead,
especially since the P-Indicator and Accum Index are
both negative, -70 and -.045,
just 0.3% over the 21-day ma. These negative
readings are could bring a new Sell on
any 2% rally from here.
Among our Stoch5 stocks that trade well short term,
there are 117 on Buys and
140 on Sells. The Index of these stocks is
still on a sell. See Below.
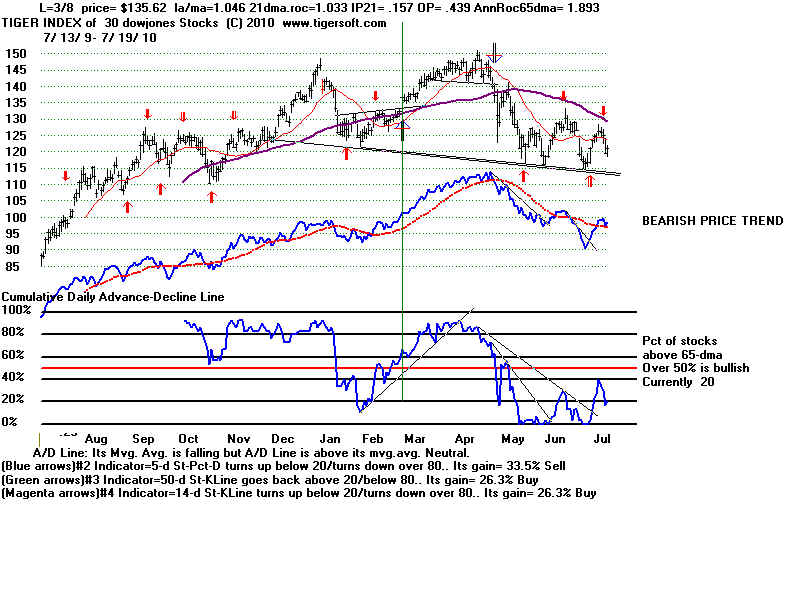
Index of Stocks Best Traded with
Short Term Stochastics
DJIA,
DIA and Tiger Index of DJI-30 Charts
======================================================
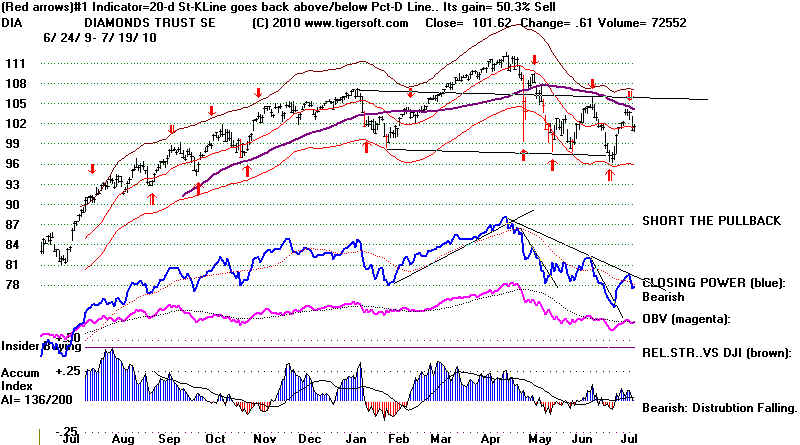
7/16/2010
Despite Buy B8, We Have To Be Short-Term Bearish.
Shorter-Term Long Positions in the QQQQ, SPY and DIA should have been
closed
out Early Friday AM, as
per Thursday's instructions. The market dropped too much
on Friday to recommend
shorting SPY or DIA. Since there was no Peerless sell, I
would suggest waiting,
although since 1965, the DJI rose only 40% of the time in the
week after July 19th.
The market seasonally is most apt to rise at the very end of the
month, after the 27th.
>Another DJIA test of 9700-10000
seems likely. Like a yoyo, the market will go back and
forth between support
and resistance until there is either a Breakout or Breakdown.
Having found resistance
at the falling 65-dma, it must now fall back and find
Support.
>Few markets are so
controlled by professional traders. Our thesis has long been
that these traders can be
spotted in 3 ways, at least, all of which are present now.
1) There is a well tested
downtrendline, each rally failing at the downtrendline;
2) Short-Term Stochastics
dominate the trading of ETFS like DIA, SPY and QQQQ;
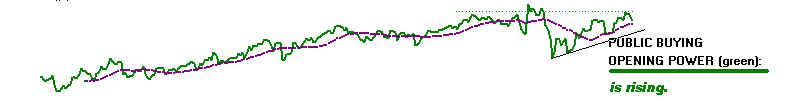
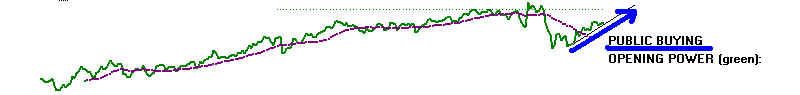
3) The Closing Power is
declining and below its 21-dma, while the Public is
more bullish, judging from
the rising Opening Power.
Each of the best trading system's is
on a Sell for DIA. The faster K-Lines gave a
Sell with Wednesday's Close.
51.1% is a very high yearly rate of return for the DIA.
Professional traders use Stochastics. This is another sign of how much
professionals dominate the stock market.
More Reasons To Be Bearish:
1) The
DJIA Missed A Sell S9 by A "Smidgeon". Should Peerless
be modified so that a Sell S9 would appear if the
conditions
were altered to include those below that occurred on
Thursday?
Since 1929, there would have been 47 gains and 20
losses
using these conditons. 4 of the 5 cases in
Julys would have been
profitable. Seasonality is important.
Note that the one earlier bad case
where this signal occurred in July was also on
Friday, a day when
trading is thinnest and, arguably, the most
representative day of
the week.
. See the evidence
here...
http://www.tigersoft.com/PeerInst/SimpleS9nearS12.htm
The Key Values' Levels
Reached Thursday Show A Distinctly
Bearish Track Record in Julys. The simple
conditions should
probably be added for Julys at least to the regular
system.
See their track record since 1929 for Thursday's
record.
DJIA's LAST/21-DMA = >1.026
P-Indicator <0
Current Accum. Index (IP21) <.03
Results using these parameters:
Friday 1.
7/14/78 -5.6 loss BAD An S12 also occurred
on 7/17/78
Tuesday 2. 7/17/90 10.2%
GOOD
Monday 3. 7/8/98 16.8%
GOOD
Monday 4. 7/3/06 3.8%
GOOD
Tuesday 5. 7/17/07 4.9%
GOOD
Friday 6. 7/15/10 ?
2) The DIA gave a Sell Thursday. The Other ETFS gave
Sell Signals
Friday. (See DIA chart at top of this day's report.)
SPY's chart
is shown below. All its key indicators are rated
"Bearish".
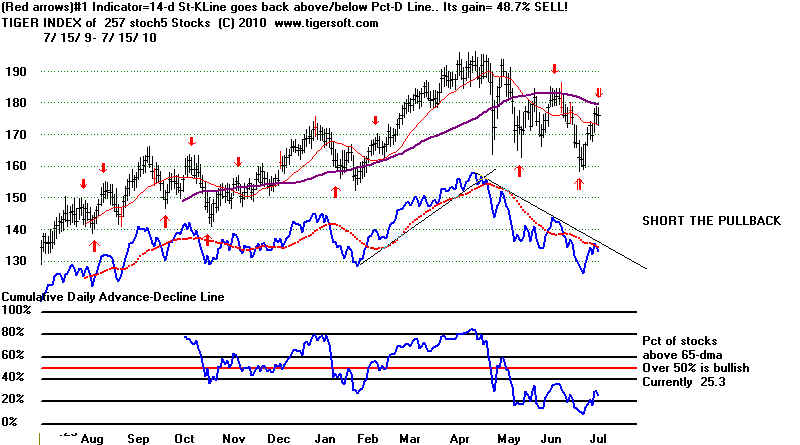
3) The Stocks Best Traded with Short-Term Indicators
have worsened from their negative plurality in mid-week.
63
(-28) are on Buys. 166 (+28) are on Sells. These numbers
should get more lop-sided at a bottom or a top. Their
index
reached and then turned down from their 65-dma giving its
own Red Sell.

4) The DJIA-30 Stocks have worsened technically.
Many have turned back down from their falling 65-day
ma
resistance with new red Sells, negative Accumulation
Index
readings and recent Stock S9s. These are
distinctly bearish
and should be shorted/
See their charts.
AA

BA (new bearish head and shoulders is
developing).
BAC (Bearish reaction to "financial
reform" and IP21<TISI._
CSCP (IP21<TISI)
CVX
DD
DIS
HPQ (already of Sell)
INTC (S9s and very weak CLosing Power)
JNJ (very weak CLosing Power)
KFT
MSFT
TRV
WMT
GE, HD and PFE have very weak
CLosing Powers and show
Distribution.
In sum, all but 6 of the 30 DJIA stocks are on Red
Sells and
17 show the bearish signs mentioned above.
====================================================
7/14/2010 No Sell Yet. But be wary, the DJIA is 2% over
the 21-day ma, the P_Inidcator now stands at -55, the
V-Indicator is -159 and the Current Accumulation is only
+.032. The falling 65-dma has been tagged.
We are just
below June's high. Any 1/2% rally from here tomorrow
will likely bring a Sell S9.
SPY,
QQQQ and IWM remain on Buys.
The stopping
of the oil leak by BP is bullish. Financial stocks, especially
GS, JPM, BAC and C are happier. The fine for Goldman
Sachs is smaller than their bonuses for last year.
The government could have pressed its case for
criminal
charges for fraud. Goldman sold short millions
of
mortgage-securities, at the same time they were
recommending them to customers.
This and staggering failure in the
"Financial Reform"
to break up the biggest banks that are "too big to
fail"
should be most pleasing to Wall Street. Wall Street is
again largely unchecked. Leverage is not checked.
Stock trends are apt to go further than is safe. This
should be very good news for Wall Street. Realistic
cynics
are not surprised. So, this may only lead to an upside
blow-off which takes the DJI to the 10500 resistance.
Watch the Closing Power Trends and Peerless for a new Sell.
SPY - still on A Buy
QQQQ - still on A Buy
A
New short-term Red Sell has appeared with today's close
for the DIA from the best trading system from it for the
last year. The second best system has also given a Sell.
(See the bottom of the price chart below).
The best
system for the Stochastic-5 Stocks has given a trading Sell.
See their composite chart below. 91 of these stocks are on Buys,
but 166
are on Sells, including 18 new Sells.
There
is no Sell signal from the best system for SPY, QQQQ,
or the IWM.
Conclusion:
Short-term traders of SPY and QQQQ may wish to take
long profits. Orthodox intermediate-term Peerless users
will want to wait for a Peerless Sell.
DJIA
======================================================
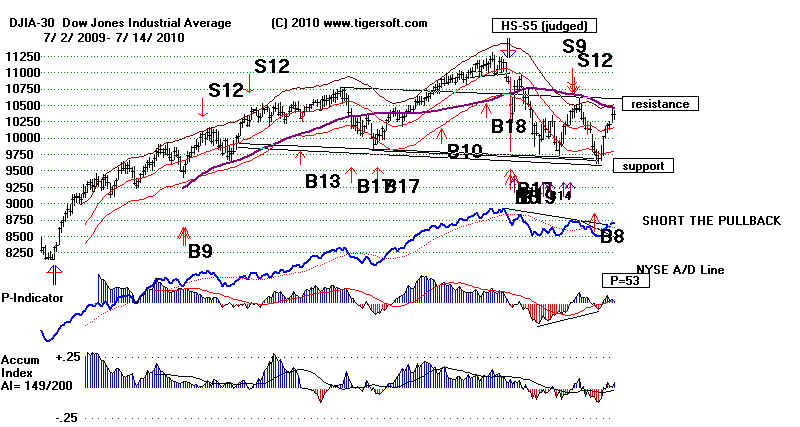
7/14/2010 No Sell Yet. The DJI has
slightly tagged
its falling 65-dma. A little more strength seems
likely
since the technical indicators are all still rising or on
Buys
with the exception that among the stocks traded well
with 5-day Stochastics, there are now 41 more on red Sells
than Red Buys.
Technical Signs Today:
1. Closing Powers for ETFs are still rising.
2. ETFs still show short-term
Buys.
See Graphs.
3. DJI-30 Tiger index is on a
Buy.
4. SP-500 Tiger index is on a
Buy.
5. NASDAQ-100 Tiger index is
on a Buy. Now at falling 65-dma
6. Stochastic-5 Tiger
Stocks' Index is on a Buy.
108 of these stocks were on Buys. 3 of these are new Buys.
149 are on Sells. 37 of these are new Sells.
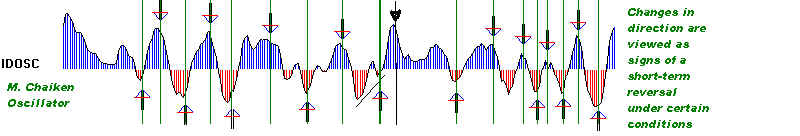
7. Chaiken IDOSC is still
rising. This works well in a market that is not strongly
trending up or down. It does not work after important breakouts or breakdowns.
8. NYSE and NASDAQ new highs ( 36 + 21
=57 ) vs
NYSE
and NASDAQ new lows ( 4 + 8 = 12 )
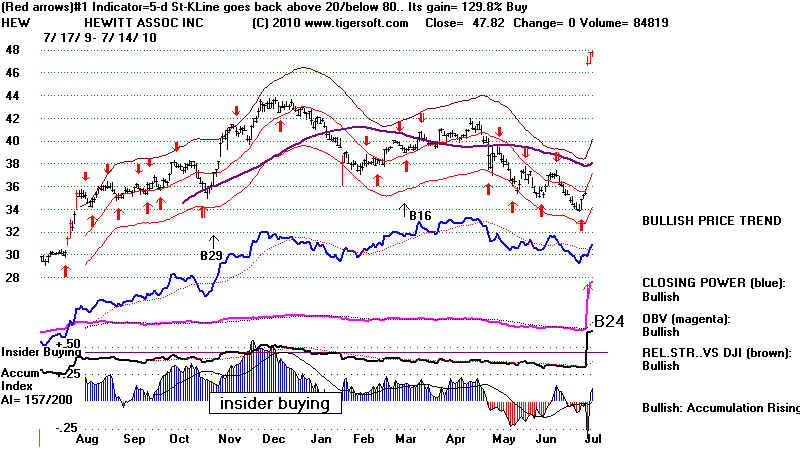
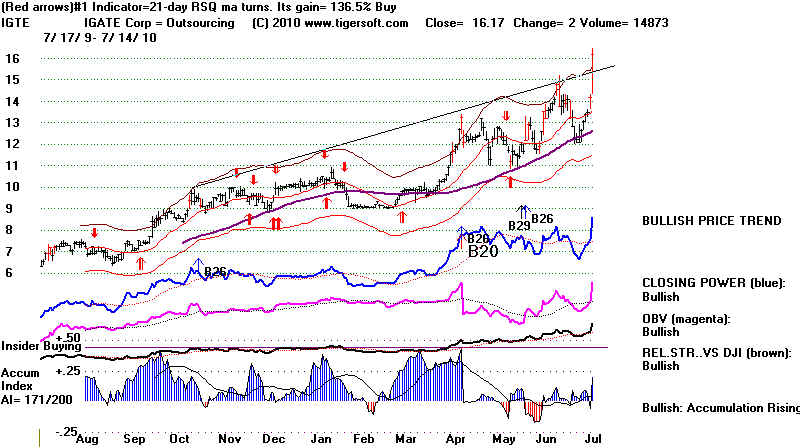
The Job Market and Staffing Stocks.
A look at staffing stocks shows
OutSourcing stocks are doing well. HEW was just bought out
and IGTE made a new high. See
their charts below DJIA chart in this day's section.
Going down are general employment
stocks: ASGN, JOB KELYA, MAN, PAYX, RHI and TW.
3 Tech Staffing stocks are trying
to fight the general downtrend for USA-recruiting stocks:
HHGP, KFRC and RCMT.
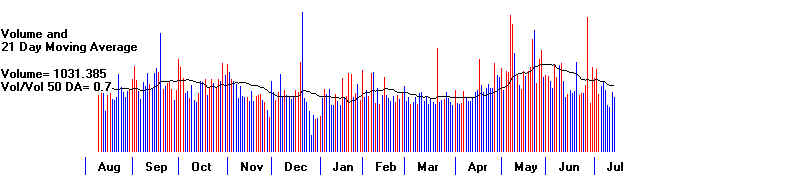
I think that they need to move up to
keep this recovery alive. So
far, they have not moved up as ETFs have since DJIA-9700.
With trading volume low, I think
the evidence is persuasive that this continues to be
a Wall Street, rather than a Main
Street Recovery.

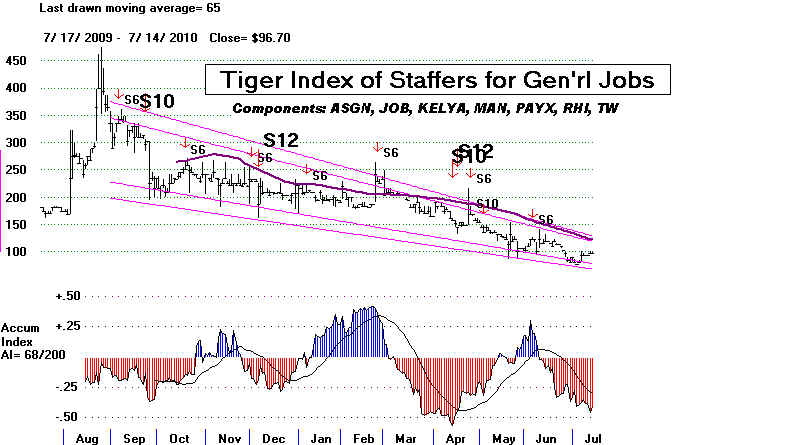
GOING
UP ARE JOB OUTSOURCING STOCKS: HEW and IGTE
====================================================================================
======================================================
TIGER/PEERLESS HOTLINE
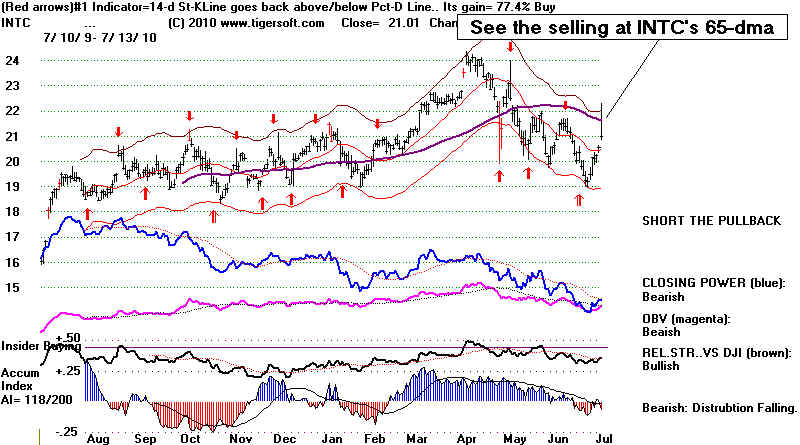
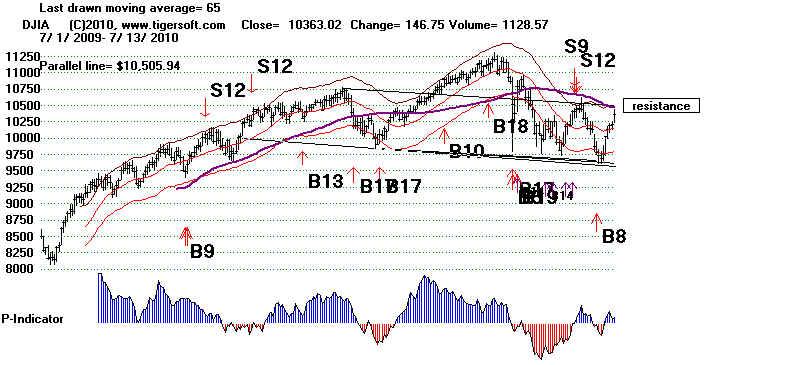
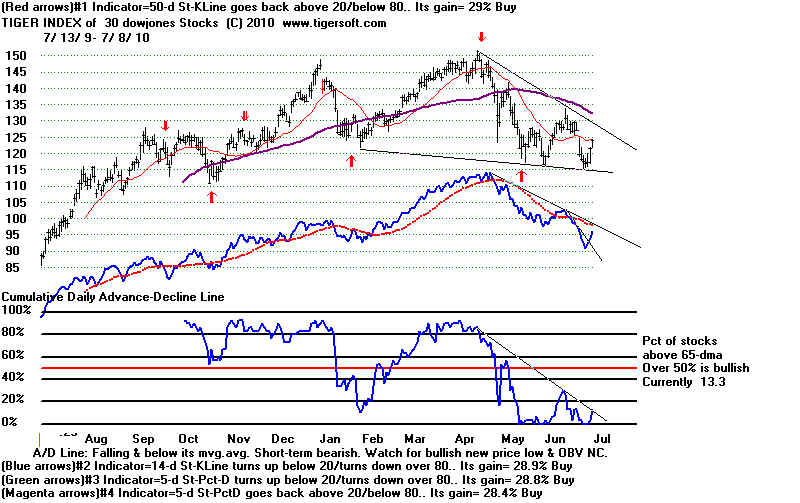
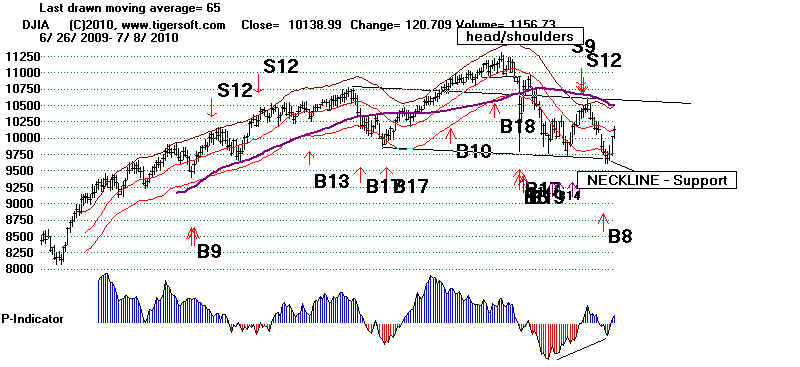
7/13/2010 No Sell Yet. But We Are
Almost up to 10500
Resistance where Upper Band Is, the falling 65-dma is
and where a peak would be symetrical with the right
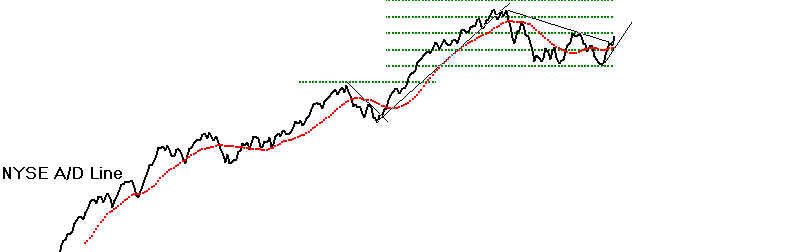
shoulder peak from January. The Accumulation Index
is just barely positive. So, we may get a Sell S12 unless
the DJI can close near its highs on greater volume.
Do not underestimate the importance of the 65-dma.
See INTC's chart below.
Technical Signs:
1. Closing Powers for ETFs are still rising.
2. ETFs still show short-term
Buys.
See Graphs.
3. DJI-30 Tiger index is on a
Buy.
4. SP-500 Tiger index is on a
Buy.
5. NASDAQ-100 Tiger index is
on a Buy. Now at falling 65-dma
6. Stochastic-5 Tiger
Stocks' Index is on a Buy.
140 of these stocks were on Buys.
127 are on Sells. 13 of these are new Sells.
67 stocks on NYSE and NASDAQ made new
highs. 14 made new lows.
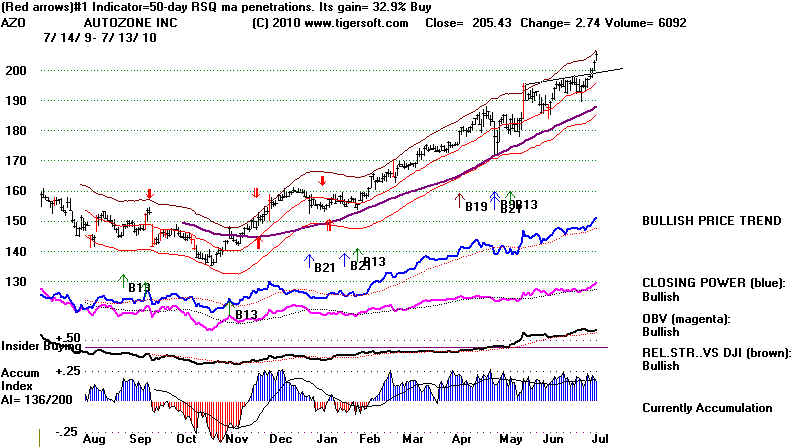
This is not
rubustly bullish. My pick AZO last week rose 2.74 to 205.43.
Along with
the Stochastic-5 Red Buys. I have favored the "Bullish" flagged
stocks
whoseClosing Power has made a new high (MAXCP), hopefully
ahead of
price. Sometimes, you have to chase, as with IDT (16.5) and IF (31.14).
EPD would
be better if it had not shown so much weakness in May. That is
scary.
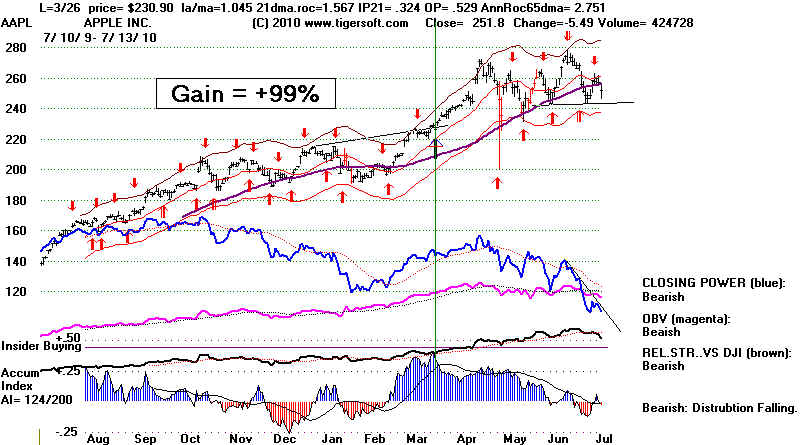
AAPL is a leading tech stock. It is not good that it now shows a
head and
shoulders pattern and its Closing Power today made a 12-month
low with
prices still near the stock's 12 month highs.

======================================================
======================================================
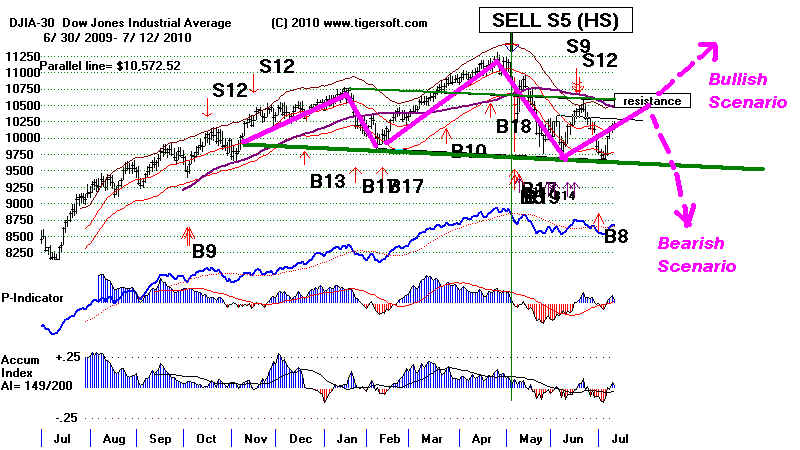
7/12/2010 The Blow-Out Well Seems To Have
Been Plugged.
The Summer Rally up from the Neckline Support Should
Continue up to the DJIA's 65-dma. near 10500. True,
volume is low but no short-term Sells yet on ETFs.
But Interest Rates are likely to stay low. Peerless
remains on the Buy B8 until a new Sell or the neckline
support fails.
The DJI seems to be stuck in the 9700-10500 trading
range for now. By late July or August, we will know
what the market has in store for us and the economy
later this year. An upside breakout, past 10500, will be
bullish, but a turning back down from 10500 is apt to
cause a break in the support of the neckline.
Use Some
Shorter-Term Trading Tactics to judge when this
rally is over. See the charts here.
1. Closing Powers for ETFs
are still rising.
2. ETFs still show short-term
Buys.
See Graphs.
3. DJI-30 Tiger index is on a
Buy.
4. SP-500 Tiger index is on a
Buy.
5. NASDAQ-100 Tiger index is
on a Buy.
6. Stochastic-5 Tiger
Index is on a Buy.
145 of these stocks were on Buys.
112 are on Sells. 59 of these are new Sells.
Hedging with some of the best performing Stochastic-5 stocks
that show new Sells would
normally be considered only when
the general market has given some sells. Still, it
can't hurt to
mention these and watch if they sell off. If they do
not, it will
be a sign of over-all market strength. These stocks
are all
below their 65-day ma.
=====================================================
=====================================================
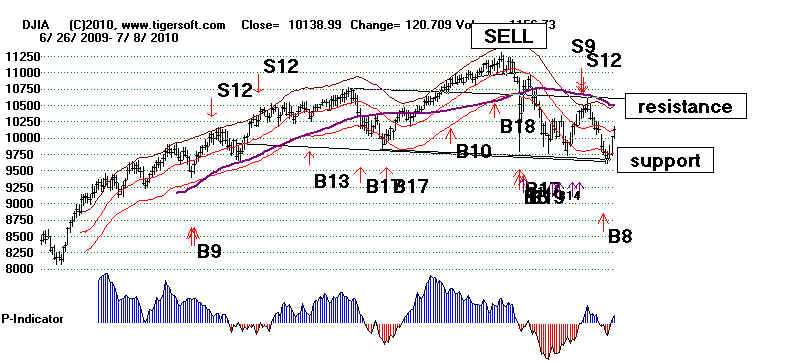
7/9/2010 The Summer Rally up from the
Neckline Support
Should Continue up to DJIA's 65-dma. The volume is low
but breadth is very good. Interest Rates are likely to
stay low. Use Some of the Shorter-Term Trading Tactics
Described Here and elsewhere.
>With
1652 more up then down on Friday, the Summer Rally continues.
>Having tested the neckline-support of the
head and shoulders pattern, the
DJI is rising in search of resistance.
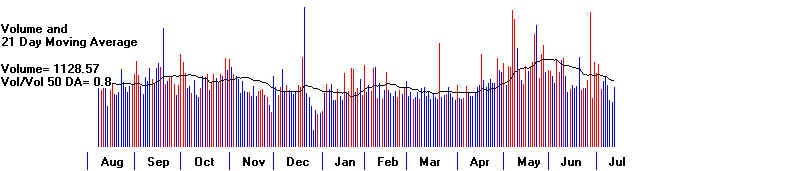
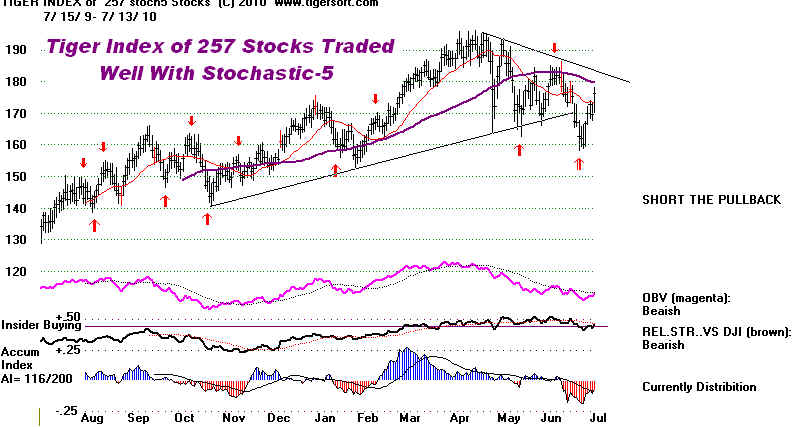
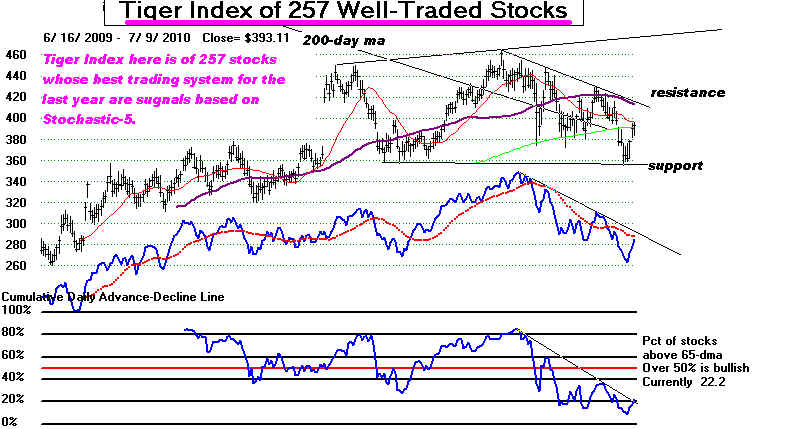
>Trading ranges in the Summer are very
common. Traders should, I think, use
the stocks traded very well with Stochastic-5
Indicators. Eliminating some
very low priced and very volatile stocks in this
group, we have 257 stocks, each
of which could have been traded this past year with
the Stochastic-5 and
gotten gains of more than 55%. 85% of
these stocks are still on Stochastic
Buys. When that number falls below 50% we will
have to assume a tradeable
short-term decline has started.
>My suggestion is to trade a handful of the
most profitably traded of these
on their automatic signals this Summer.
HGSI's trading gain, long and short
is a colossal +3026.8%. Use internals.
Closing Power trends and chart patterns
in picking these stocks.
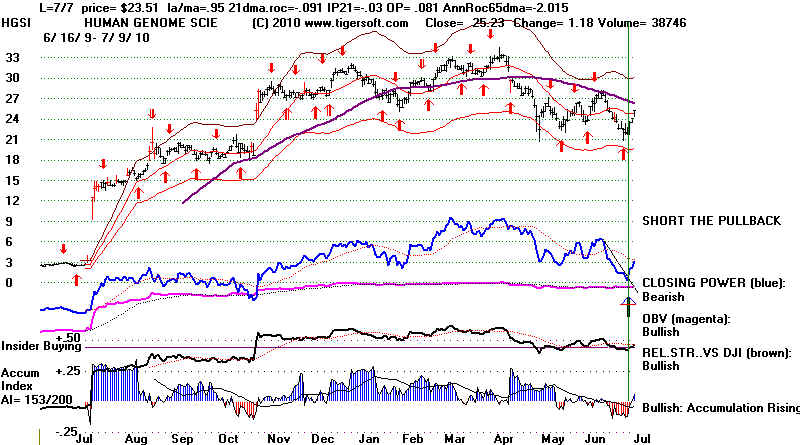
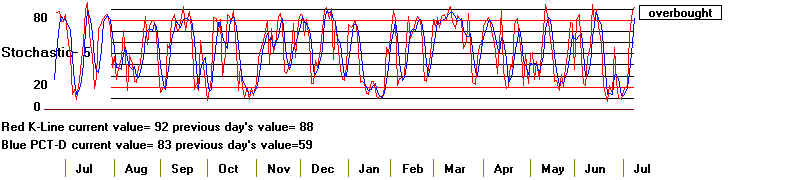
An Index of
these stocks shows that its Stochastic-5 has reached
oversold
position. It may stay there for a while, so, we will watch
for the
Stoch-5's faster Red K-Line to cross its slower BLUE-Pct-D.
>July's market activity was a part of a DJI
trading range in 90% of the years
since 1915. Tiger needs to write a book
on Trading Trading Ranges, especially
suring the Summer. Sustained or steep advances
and steep declines throughout
the Summer are very rare until a trading range
breakout or breakdown.
>July brought 6 breakouts and 6 brought
breakdowns. False moves to new lows
or new highs must be watched. See July 1963's and
July 1984's false breakdowns
before strong advances and July 1969's false breakout
before a bear market.
54 Summer Trading ranges that included July since 1928
Up-Breakouts Breakdowns
Ending in July 6
6
1951, 1961, 1963, 1967,
1956, 1966, 1981,
1990,
1984, 2009
1998, 2007
August
11
6
September
9
6
October
5
5
>The
optimized red Buys on the key ETFs are still in effect. The gains using
the optimized signals for the last 11 months are
tremendous. Until they fail,
because there is a breakout or breakdown, traders
have to pay special attention
to them, especially when the Tiger Closing Power is
confirming, as is now.
See their charts at the bottom of this Day's Report.
Status
Best 1-Yr System K-value Pct-D value
1-Yr System Hain
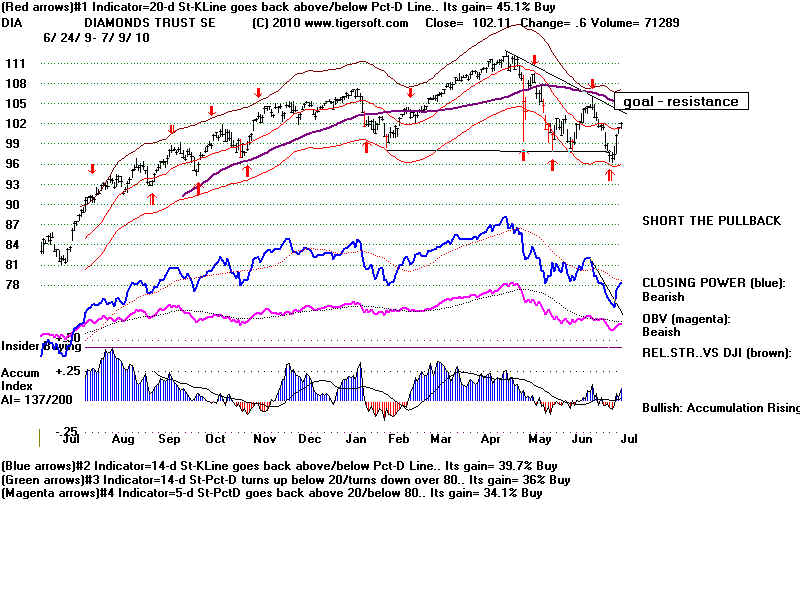
Buy DIA
20-day-K still >20-day-Pct D 61
52
+45.1%
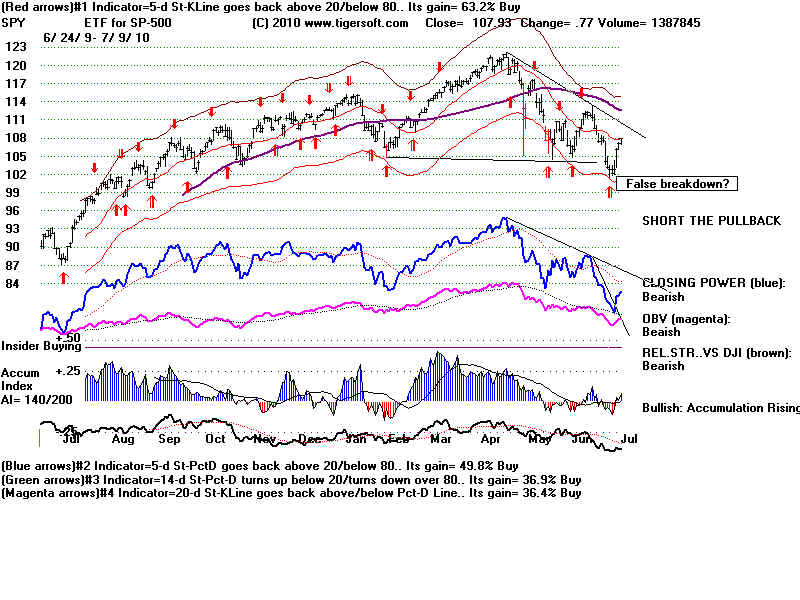
Buy SPY
5-day
Stoch-K>5-day-Pct D 98
72
+63.2%
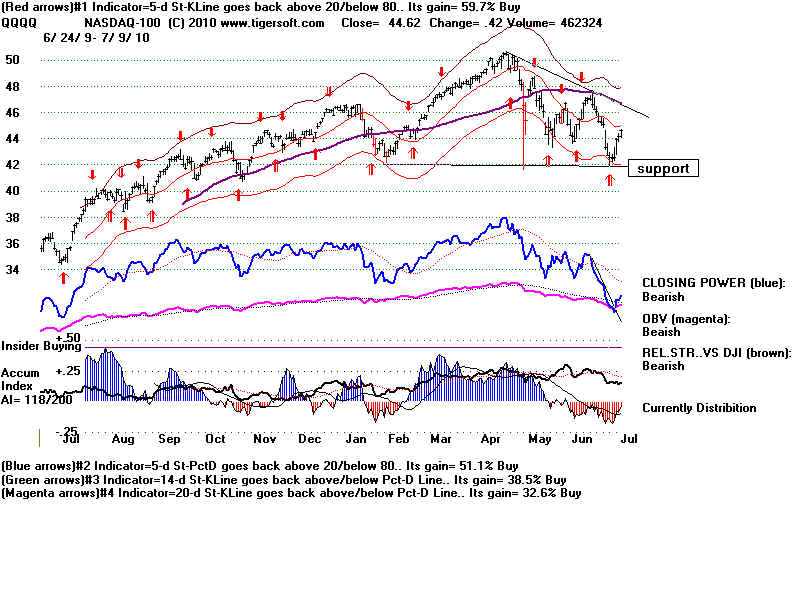
Buy QQQQ
5-day Stoch-K not < 80
98
96
+59.7%
Buy IWM
5-day Pct-D not
< 80
100 86
+64.6%
PEERLESS and DJI
====================================================================================
====================================================================================
TIGER/PEERLESS
HOTLINE
7/8/2010 The Summer Rally up from the
Neckline Support
Should Continue up to DJIA's 65-dma. The Buy B8 Has
Apparently Won Out over The Head and Shoulders' Patterns.
Until the DJI reaches the falling 65-dma, we must trust the Buy B8.
Breadth (NYSE advances
minus declines) was excellent today. The quick
reversal by the DJIA
from its 9700-9800 support after forming a scary
looking head and
shoulders pattern and the presence previously of
so much bad news has
now forced a lot of short-covering. We are
long the SPY and DIA.
But we are vigilant. SPY is up 5% in
2 days and one hour of
trading and is now approaching the
resistance of its
falling 21-dma. A K-Line 5-day Stochastic Sell
is a distinct
possibility, especially if there is more bad news from
the Gulf.
Watch to see if SPY can surpass its red 21-dma tomorrow.
Volume was relatively
low. The recent 13% plus DJIA decline will make
it hard for the market
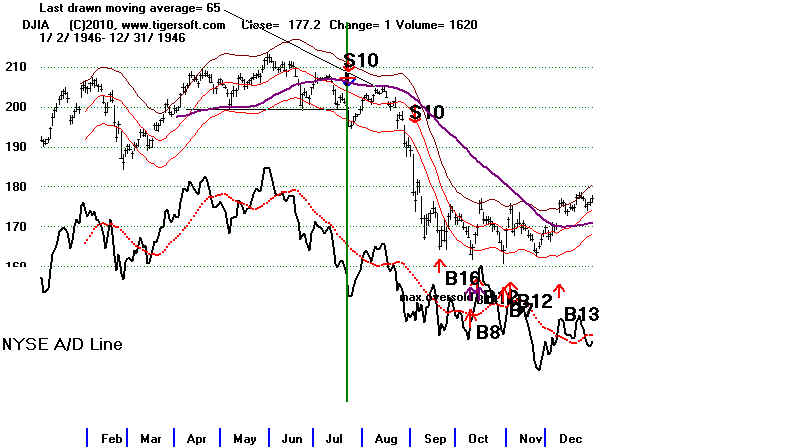
to recover to new highs. If the DJIA stalls out at
the 65-dma, it will be
doing what it did in July 1946, when it fell 20%
after a Summer Head and
Shoulders pattern. There is one big difference,
though, and that is the
NYSE A/D Line was leading the DJIA lower.
That is not true now.
See the current DJIA chart further below.
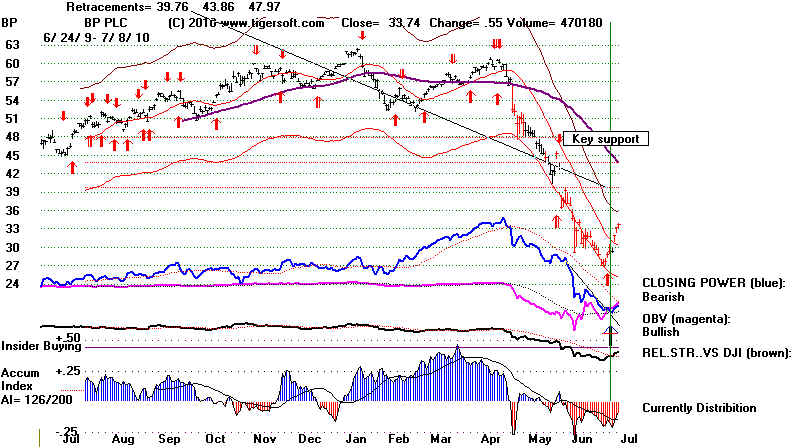
But if British Petroleum's
"relief" well can stop the gushing of 65,000+ bar/day
of crude into the Gulf,
there will be a huge sigh of... well, "relief". Watch
BP to get a sense of
its likely success.
On the NADAQ, there
were 8 more 52-week new lows than new highs today,
but on the NYSE there
were 24 more new highs than lows. Defensive,
fixed income securities
on the NYSE made the difference. That is bullish
for bonds, but much
less so, for stocks. Yesterday, I suggested buying
some bond funds.
That is most unusual.
We will need to see
some better leadership. By this I mean stocks making
new highs or, at least,
getting back above their 65-dma. Presently,
the only DJI-30 stocks
above their key 65-dma are IBM and MCD
(both very slightly)
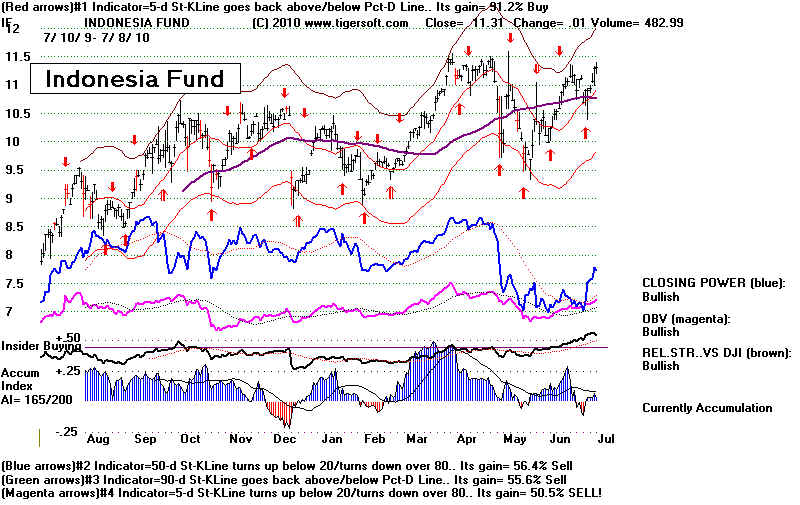
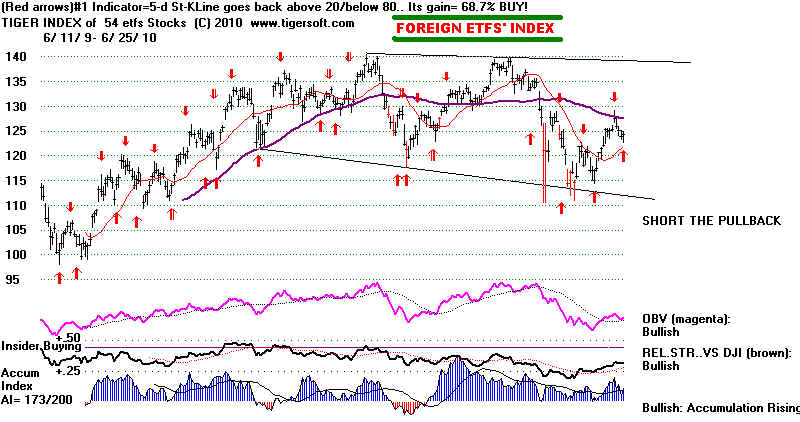
and MRK. Foreign ETFs are in the same predicament.
On a percentage basis,
31.5% are above their 65-dma. Clearly
above their 65-dma are
Chile Fund (CH), Malaysia (EWM), Spain (EWP),
Singapore (EWS),
Indonesia (IF), Thai (TF) and Taiwan (TWN). These
ETFs should be bought
and held by traders until their next red Sell.
Immediately below is
IF. Significantly, these are all smaller countries'
funds. Chile's
includion here after its bad earthquake should give us hope
for the Gulf.
BUY B8 RULES' AMENDMENTS
The Buy B8 is based on a big
improvement in the P-Indicator of a minor
DJIA new low near the
lower band. My warnings that a head and
shoulders pattern in
development stage should make us question the B8
were too strong in this
situation. I should have said, "Buy
but work with
close 3% reversing SELL
stop losses in case the DJIA's neckline fails."
I
will have to amend my
write-up of Buy B8s to say the following:
1) We should wait for the DJIA's
head and shoulders pattern
to be completed.
It was not; its neckline was never violated.
There are cases
when a head and shoulders pattern forms
but the neckline
is not broken.
2) In addition, nearly
all valid, completed head and shoulders'
patterns are
accompanied by a NYSE A/D Line which is
leading prices
downward.
See http://www.tigersoft.com/PeerInst/HS-SellS10/index.html
3) And.. Head and shoulders patterns
can be traps for unwary bears. In
1983 and 2009, we find
precedent for a H&S neckline-breakdown-failure.
4) Significantly, the
false breakdowns took place in the normally bullish
month of July.
So, as discussed here
last night, let's wait for and expect
a rally to the DJIA's
65-dma. Looking at 268 stocks traded best this
past year with a
Stochastic-5, 237 are now on Buys and only 31 are on Sells.
DJIA and Peerless
Signals.

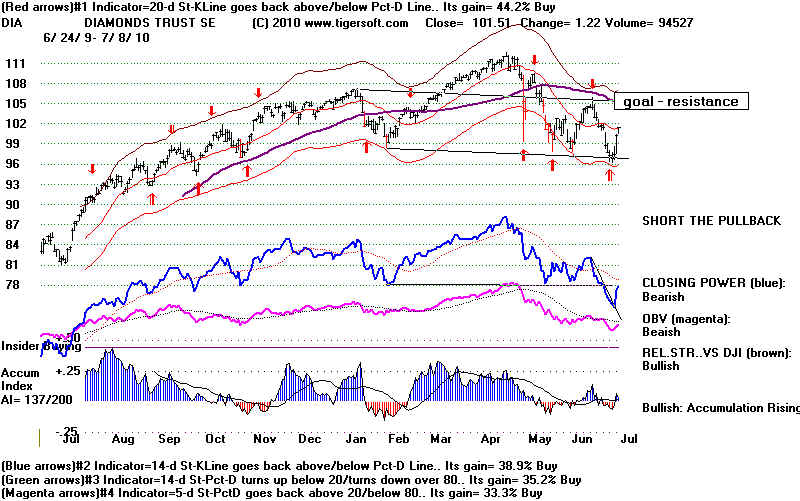
DIA
SPY
QQQQ
IWM
===================================================================================
TIGER/PEERLESS HOTLINE
7/7/2010 BUY B8 Confirmed by Breaks in
ETFs' Steep
CLosing Power and NYSE A/D Line Downtrendlines.
Each of the four best trading systems are on
Buys.
See the bottom of the
chart for the 2nd, 3rd and 4th best.
These are optimized
short-term signals. Unfortunately,
notice that in the stocks where the best system is a 5-day
K-Line, the rally today has brought an over-bought short term
condition. This may mean that there may be a brief
pullback for a day before the rally resumes.
The best trading systems are all on Buys for these ETFs:
DIA - 20-Day Stochastic K - now 42.
SPY - 5-Day Stochastic Pct-D -
now 42.
QQQQ - 5-Day Stochastic Pct-D -
now 42.
IWM - 5-Day Stochastic Pct-D -
now 22.
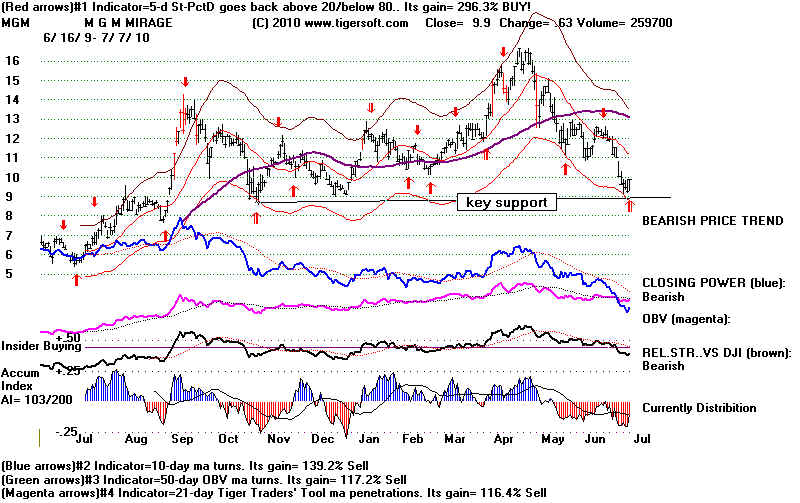
Of the 294 stocks now best traded with a 5-day Stochasitc,
232 are now on Buys. The problem is that most of these
are below their falling 65-day ma. They are not positioned
as we would like for safety. See MGM-Mirage Chart
below.
Still many of these stocks trade marvelously with a 5-day
Stochastic. I wonder how many of the high rollers who
go to the Mirage realize that we have here a much better way
for them to make money off the casino! When the Peerless
book is done, we will schedule a Tiger Users' Meeying at the
Mirage.
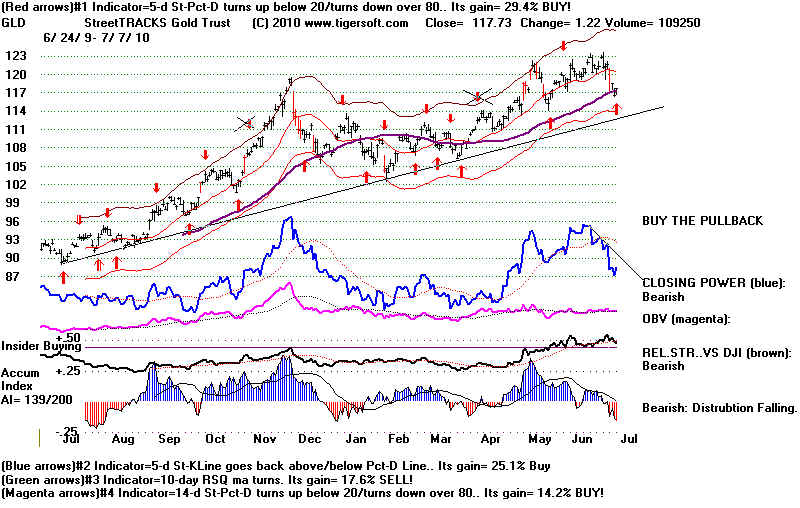
GLD (Gold) has a new red buy at its rising 65-day ma.
However,
its Closing Power is still falling, so we
will just
hold our long position in expectation of
1300/ounce.
SUMMER RALLY and FAILED HEAD/SHOULDERS PATTERNS
The short DIA or SPY positions
should have been reversed on the strength we saw today....
If not do so, on weakness on July 8th an
hour or so after the opening. I have to add in light of
the 1946 and 1962 cases, if the DJI
should turn down and break to new closing lows, it will be very
bearish and a Sell S10. See their charts here.
The Closing Power
downtrendlines of the DIA, SPY, QQQQ and IWM were all broken.
A
rally to the DJIA's 65-day ma is the most likely next scenario, judging from the behavior of
of the 4 Summer cases where a DJI
neckline either held or was only briefly broken below. In 3 of
the 4 cases, the DJI rallied from 5% to
25% more before there was a new Sell signal.
See
their charts here. In the 1946 case, the DJI fell back from the 65-dma, broke below
the
neckline and fell 20% in two months.
FAILED HEAD AND SHOULDERS PATTERN IN SUMMER
1946 bear market followed tagging of the 65-dma.
1952 DJI rallied past 65-dma at 255 and advanced to 277
1983 DJI rallied past 65-dma at 1220 and advanced to 1280
1909 DJI rallied past 65-dma at 7700 and advanced to 10000
As much as anything, the size of the rally
today shows how many other technically minded
traders reversed positions at this high
inflection point. A breakdown would have been
very bearish but a failure to breakdown is
clearly short-term bullish and in the Summer
tends to bring a very good rally.
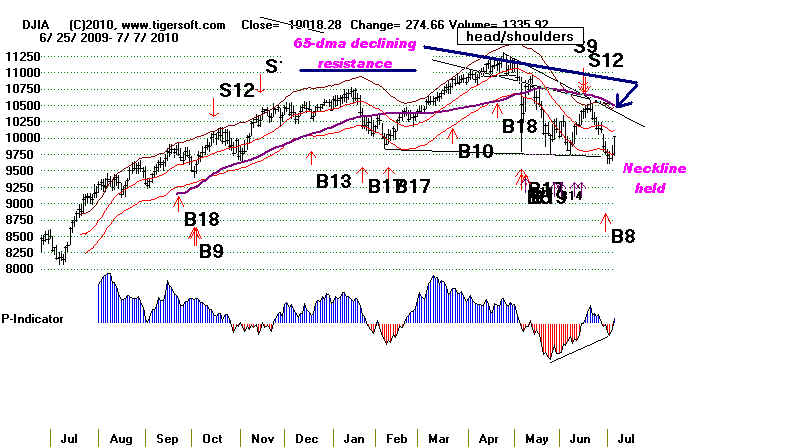
DJIA and Peerless
Buys/Sells
The minimum objective on this rally
is 10194, as fixed by the possibility of a right shoulder
matching in height the rally last
October. A rally back to the next resistance point would
bring the DJIA back to the 65-dma
and the apex of a likely right shoulder which would be
symetrical to the one than peaked in
January. A move past the apex of the right shoulder
would likely launch a move of 5% or more
to new recovery highs.
In this environment, I would suggest
buying the most bullish stocks among those whose
Closing Power is making a new high.
Here are a few.

---------------------------------------------------------------------------------------------------------------------------------------------------
TIGER/PEERLESS
HOTLINE
7/6/2010 BUY B8 Is In Question.
Head and Shoulders Pattern and Recent S9/S12 Warn
that the Support May Not
Hold. Therefore, Wait for
A/D Line downtrend to be
broken or if you are a trader,
wait for the Downtrends of the Closing Powers of the
ETFs to be
broken.
See recent hotlines for research on Sell S9/S12 and Head
and Shoulders versus B8.
A DJI decline more than 12% below its high has often led to
a much larger decline.
(A revised Peerless will soon be released. It
has many small
changes that test best since 1929. I do not plan to allow a B8
so
soon after an S9/S12 when the DJI is within 15% of its high.)
BP has a new Red Buy and its Closing Power broke its downtrend.
Cover
the short sales taken above 40 is my advise. Maybe, there
will
finally be some good news for the Gulf in the form of the
relief well actually working as advertised. Let's hope so! See chart
below.
See key PEERLESS and ETF
charts:
> Red
Optimized Buys on ETFS - but these are bad
when there is a critical support failure.
>NYSE Line is declining and close ro its own breakdown.
>DJI Accum. Index is negative and below its
21-dma
>Cumulative Up-Down Volume is falling.
>Volume was low on rally.
>Openings
(public and over-seas buying/selling) are rising
>Closings (professional/institutional trading) are
falling.
>IWM - Russell-2000 Shows particularly weak
Closing Power.

=======================================================
7/5/2010 Head and
Shoulder Patterns and Sell S9/S12
Over-Ride
Buy B8s. But A Summer Rally
back up to
The 65-Day MA Is
likely. Use our Short-Tools To
Decide When That May
Occur.
We Remain Short DIA and
SPY.
A rally back to 65-dma?
Look for a
rally to the falling 65-day ma either to make the head and shoulders pattern
more symetrical or because of
the bullish effects of Summer. This is likely to occur after the
Closing Powers of the DIA, SPY and QQQQ break their
downtrendlines and the recent NYSE
A/D Line downtrend is broken. For now these
trendlines are pointing down and, I think, we
have to respect the bearishness of completed head and
shoulders patterns. Right now the
21-dma is falling at an annualized rate of -.668.
This shows too much weakness to try to
call the bottom here. Look at the work I have
done on refining Buy B1s, which are Stochastic-20
Buys. The market should prove itself before we
buy. A rise back above the 9800 neckline level
early this week would be constructive and remind me
of the false breakdowns of August 1983
and July 2009. Unfortunately, there are many
more cases where completed head and shoulders
patterns bring a much bigger sell-offs than when a
false breakdown occurs.
Usually the
odds of a Summer rally from July 5th and to Labor Day are good. The next
five trading days after July 5th have shown a
DJI gain 70% of the time since 1965. The average
gain is 1/2%. The odds of the DJI being higher
a month from now are 57.5% and 60% two months
from now, if we take the market's history from 1965
is considered appropriate. Even better,
there is often a turn upwards after June in the
second year after a Presidential Election.
Still
there are instructive cases of Summer declines even in the second year of a Presidential
four year cycle. There were 8 declines in this
period. S9s S12s and head and shoulder patterns
called them all. But in 6 of the 8 cases there was rakky back to the 65-dma. See these charts.
Summer Declines in 2nd Year of A Presidential Cycle.
1934 (-3.7%) - Sell S9
There was a rally back up to the falling 65-dma in August..
1946 (-14.5%) - Clear head and shoulders top.
There was a rally back up to the falling 65-dma.
1966 (-10%) - Earlier S12 and Clear head and shoulders top.
There was a rally back up to the falling 65-dma.
1974 (-18.2%) -Clear head and shoulders top and Sell S9 and S12s.
There was a rally back up to the falling 65-dma.
1986 (-1.0%) - Early S9s and Broad 10% trading range.
There was a rally back up past the falling 65-dma.
1990 (-9.2%) - Sell S9 and Clear head and shoulders top.
There was NO rally back up to the falling 65-dma.
1998 (-15.5%) - Sell S9 and S12, Clear head and shoulders top.
There was NO rally back up to the falling 65-dma.
2002 (-10.2%) - Sell S9 and S12, Clear head and shoulders top.
There was rally back up to the falling 65-dma in August..
========================================================
7/1/2010 PEERLESS BUY B8
- But Head and Shoulder
Patterns Have A History of Over-Riding Buy B8s
and Buy B9s.
If You Buy Here Work with Close Reversing Stops
just below the Necklines. SPY's Neckline Has Already
Been Violated. Trading around the Fourth Is Not as
Bullish as It Used To Be. My Advise is To Stay Short
SPY and DIA. Come back on Monday Night and We'll
See if Things Seem A Little Better.
See
Discussion of Buy B8s
http://www.tigersoft.com/PeerInst/-B8.htm
Also new and important:
Four
Head and Shoulder Pattern Scenarios
and
How To Predict Which One Will Play Out
http://www.tigersoft.com/Tiger-Blogs/7-1-2010-/index.htm
DJI
Chart and Automatic Peerless Signals
The DJI has now fallen 6 straight
days since the Sell S9/S12. Normally, we would be due for
a bounce. The trading day
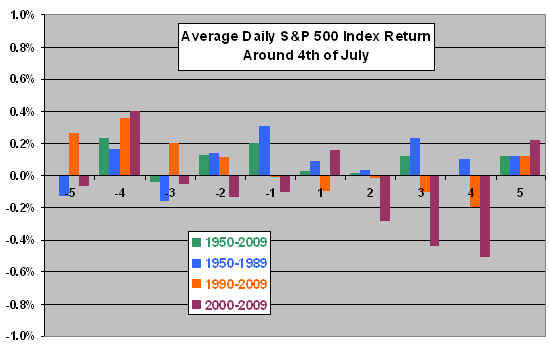
before the July 4th celebration of Independence from
Great Britain used to be reliably
bullish. Arthur Merrill's study of 1886 to 1984 reported
that it rises more then 2/3 of the
time. More recent results since 2000 are are not so
bullish. Here is a
chart I found at
http://www.cxoadvisory.com/calendar-effects/stock-market-behavior-around-the-mid-year-point/
This chart shows since 2000 there
actually were negative returns on the SP-500 from the 2nd day
before the Holiday until the fourth
trading day after the Fourth.
Our own data shows that from 1965 to 2005, the DJI rose 55% of the time in
the
five trading days after July 1st and 62.5% of the time in the 10 days
afterward.
A failure to rally much over the next few trading days will remind us f early
July 2008
before the Crash then.
The most encouraging features we see now are:
1) the bullish seasonality,
2) the NYSE A/D Line's relatively greater strength than the DJIA in the last
month,
3) the Buy B8,
4) the fact that the DJI still has not broken below its necline now at 9700
and
5) the short-term Stochastic Buys on the DIA, SPY, QQQQ and IWM.
Click on this link to see their current charts.
The problem technically with being bullish is a rupture of 9700 on a closing
basis would
set up a minimum downside target 1000 DJIA points lower. The
pattern is usually
reliable. There are plenty of examples showing how dangerous big Head
and Shoulders patterns are.
These bear a striking similarlity to the one we now see in the DJIA.
Why take a chance?
The Closing Powers and Day Traders' Tools are all still streaking lower. Short -term traders
should wait for them, at the very least, to break thier downtrends, I think.
If you do buy,
work with close protective and reversing Sell Stops and Short Sale Stops.
A closing
below 9700 would be very bearish. It would complete the head and
shoulders pattern.
8700 would become the new minimum price objective.
Where Is The Daylight?
What ails America is a growing malaise, a widespread feeling that we
are stuck and
there is nothing we can so about: 1) Obama's hugely expensive and
exhausting stalemate
in Afghanistan, 2) that unemployment will worsen and Obama has no real
solutions, and if he
did, Congress would not approve them and 3) most important, that the
entire Gulf economy has
been put at grave risk but we are entirely dependent in that upon the
actions of British Petroleum,
a firm with an abysmal safety and environment track record. We need
some daylight! Perhaps,
some old fashioned patriotism will brighten the mood. Get out and watch
the fireworks and get
some sunshine. I will, too. Then Monday night, we'll see how we
feel and have a better
idea if there is to be a Summer Rally.
In the ETF charts below, my view is that the Buy signals lose their value if
there has been
a clear breakout or breakdown. Accordingly, I would like to see the
Closing Power down-trendlines
are broken.
=================================================================================
=================================================================================
6/30/2010 PEERLESS BUY B8 - But Head and Shoulders
Patterns Have A History of Over-Riding Buy B8s and Buy B9s.
In addition, B8s in a Bull Market are Very Infrequent and not
nearly so bullish, as they are in a long bear market.
Stick
with the Sell S9/S12 and Wait for Closing Powers to
Show
Some Strength. See - http://www.tigersoft.com/PeerInst/-B8.htm
DJIA and Peerless Signals
9732.53 cl/ma = .96
21-dma.roc.= -.605 P= -135
Pch= -130 IP21= -.11
OPct= -.10
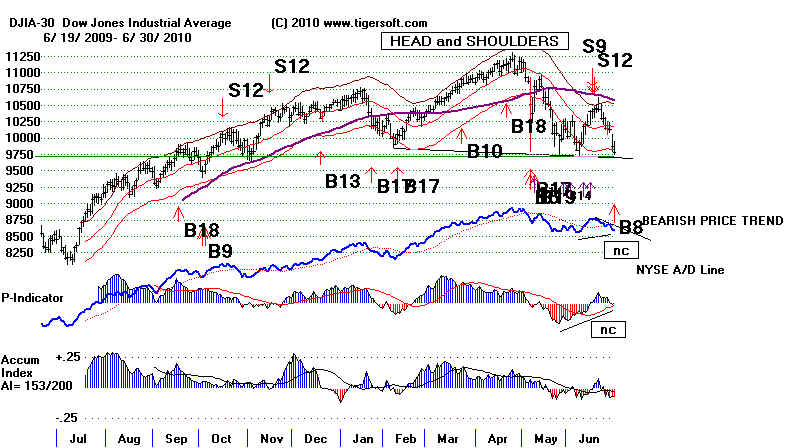
The Buy B8 that occurred today might work
out. This is the fifth test of the support line
in the key DJIA chart
below. But clearly recognizable head and shoulders patterns have
a way of making
Peerless Buys that occur at the neckline or just below into losers. There is
too much potency, too
much distribution and they are so self-fulfillingly bearish, we have
to expect them to win
out over Buy signals based on non-confirmations. While Buy B8s,
B9s and B17s
non-confirmations show a reduction in selling pressure, it may only be
temporary. A
completed head and shoulders pattern brings in new selling, just
for technical reasons.
Bad news confirms the fears and more selling occurs.
Perhaps, the Federal
Reserve has another bullish trick up its' sleeves. I have no idea
what that would be.
We have so many heavy (red) down-day volumes for the past
year, it is hard not to
see the entire rally up from 6500 to 11000 as artificial, the
result of FED efforts
to boost their client big banks in their trading accounts.
Until Obama shows he
has not deserted the camp of those who see benefit from a 1930s-
like Public Works' set
of job-creation programs (CCC, TVA, Boulder Dam and Grand
Coulee Dam) and BP
actually succeeds in stopping their destruction of the Gulf Coast,
why take a chance?
The head and shoulders pattern shows the minimum risk
is that
the DJI will fall 1000
more points. That is the height of the head and shoulders pattern
we have almost
completed.
See the earlier cases
where head and shoulders' patterns won out over Peerless Buys.
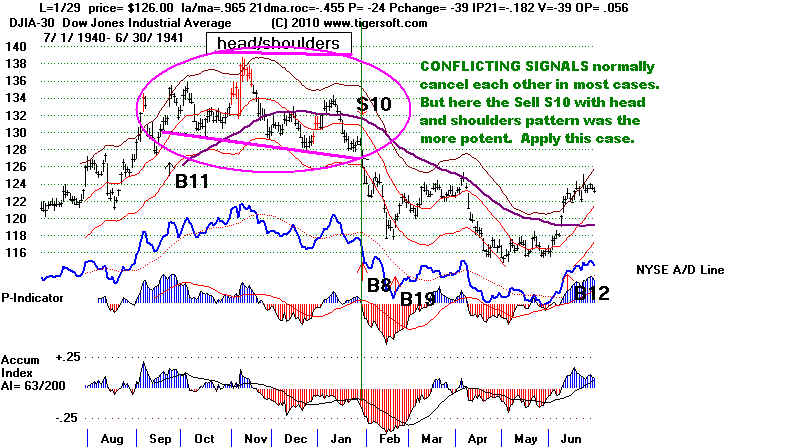
Look at the cases of
1941 and 2002 where B8s, B17s and B9s all failed in their aftermath.
The
clearest case occurred in January 1941, when the completed head and shoulders pattern
was a dire warning,
despite a Buy B8. A year later the DJI was 25% lower.
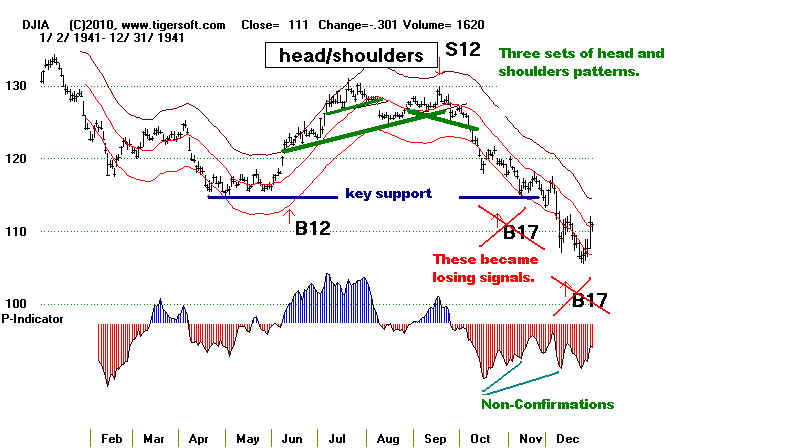
See how the complicated cluster of head and shoulders patterns later in 1941 won out
over the Buy B17s then.
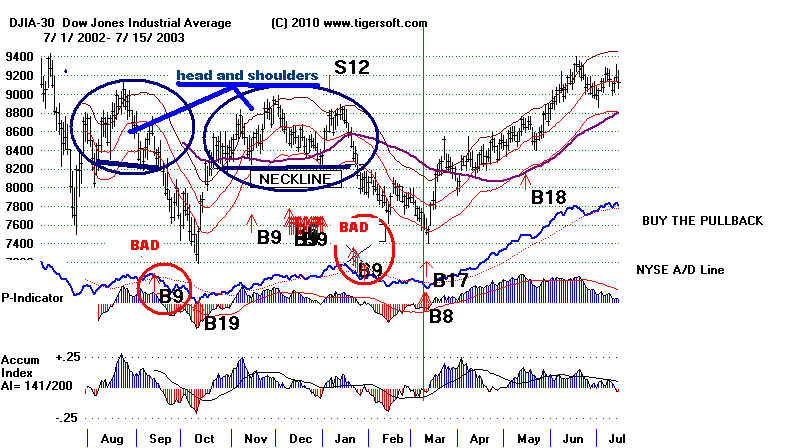
See how the well-formed continuation head and shoulders patterns in Seotember 2002 and
January 2003 won out over the
Buy B9 and B17s then.
DIA, SPY, QQQQ and IWM - Falling Closing Powers Are Bearish.
 |
==================================================================================
6/29/2010 PEERLESS SELL S9/S12 OPERATIVE.
http://www.tigersoft.com/PeerInst/S9S12Combo/index.htm
Tigers' Index of SP-500 Stocks
The plunge today has
taken the DJI to the critical 9760-10000 support. We have no new
Peerless Buy signal. The short-term indicators are all
declining for the key ETFs. Except
for IWM, there are no optimized Red Buys on the key ETFs, most
importantly on SPY, QQQQ
or DIA. You can see from the
charts the predictive power recenltly of the weak Accum. Index
readings, the falling Closing
Powers and falling Day Traders' Tools for SPY, DIA and QQQQ
A
close below the 9760 support will probably bring a selling avalanche that may make today's
decline
look like a polite rehearsal.
The DJIA may hold up here. But we cannot take the chance that
it will not, especially without any Peerless Buy signals and with
momentum now so steeply down.
Stay short the SPY or DIA and a suitable of the Tiger
"bearish" stocks among thpse whose
Closing Power is making new 12-month lows. The most
"bearish" stocks in the TigerSoft MINCP
universe are: PFE (just above 12-mo low), DOM (NL), MON (NL),
ANW (prices far above
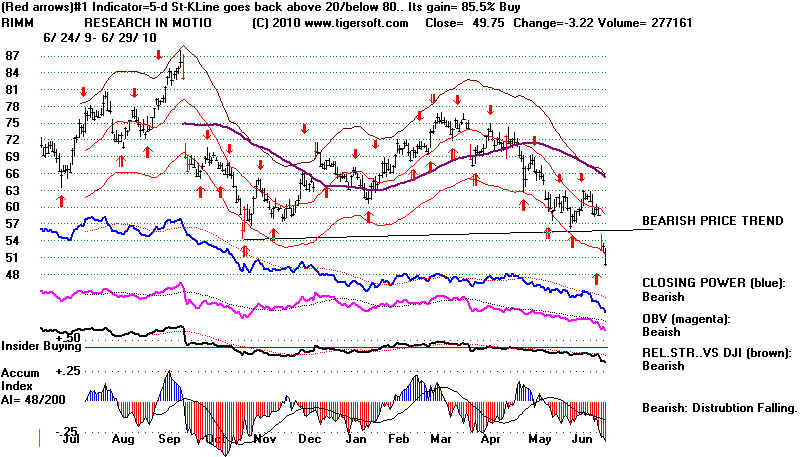
the 12-mo low, TNDM (NL), TVLT (NL), MDS (NL), FUQI (NL), RIMM
(NL)..
 .
.
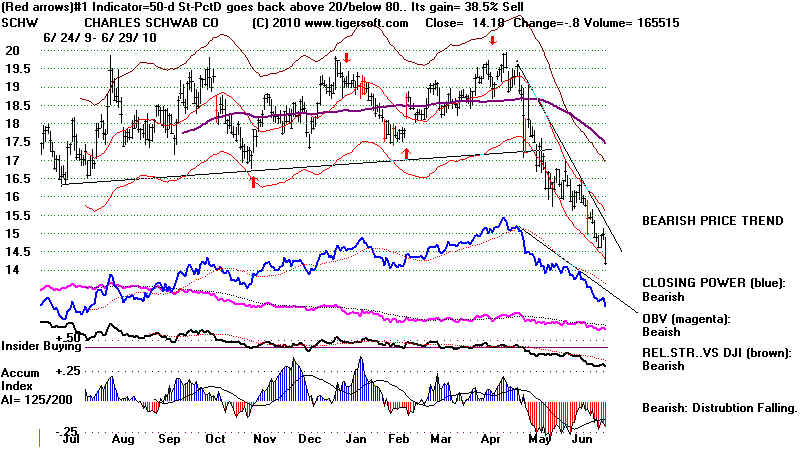
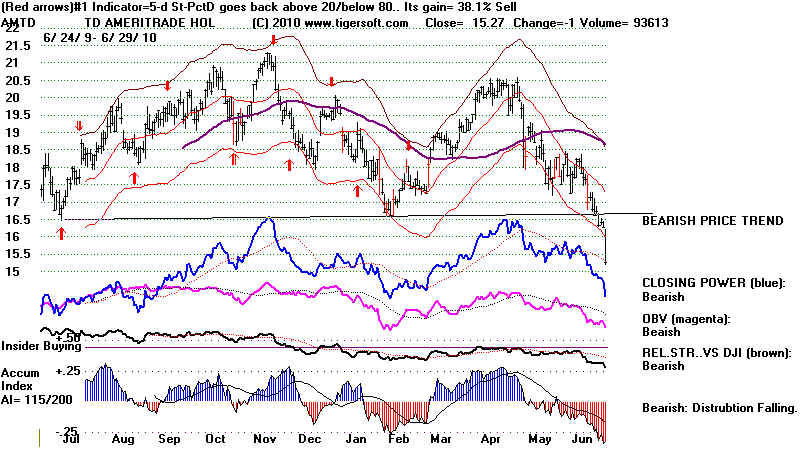
Brokerage stocks
like SCHW (Schwab) and AMTD (Ameritrade) are breaking down
to new 12 month lows. This bodes badly for the
fortunes of those just buying and holding.
SCHW looks particularly vulnerable, given the high number
of price reversals it made
between 16.5 and 20.
STUDY THE WEAKEST STOCKS
It is useful to study what were the warning signs on the
very weakest SP-500 stocks today,
those down 7% to 10%. Head and shoulders patterns,
breaking to confirmed new lows,
breaking recenltly below the 65-day ma, falling Closing
Powers. C;osing Powers at 12-month
lows and negative Accumulation readings are all present in
some assortment for the weakest
stocks today. Red high down day volume and downward
price gaps are also warning signs.
RIMM is worth studying. See also the bearish charts of MS, MU, SLM, TIE
and TXT.
OIL, GOLD and SILVER.
Before the Crash of 2008, the previously strong OIL, GOLD
and SILVER charts had to
start breaking down before a bear market could follow.
That also happened in 1980, a year
before the 1981-1982 bear market and in the Summer of 1987
before the Crash of 1987.
Gold is often one of the last haven for nervous bulls.
Oil and Silver definitely look weak.
Gold is still in an uptrend. See their current charts. Take a look at my Blog, Spot General
Market Tops by Noting
Newmont Mine's Run-ups.
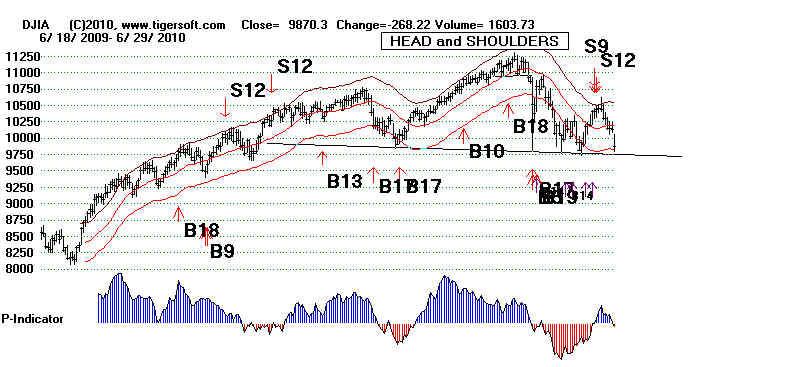
DJIA on PEERLESS SELL S9/S12
DJIA =9870 la/ma=.97 21-dma.roc=
-.311 P= -41 IP21= - .069 V=
-191 OP = -.13

===================================================================================
TIGER/PEERLESS HOTLINE
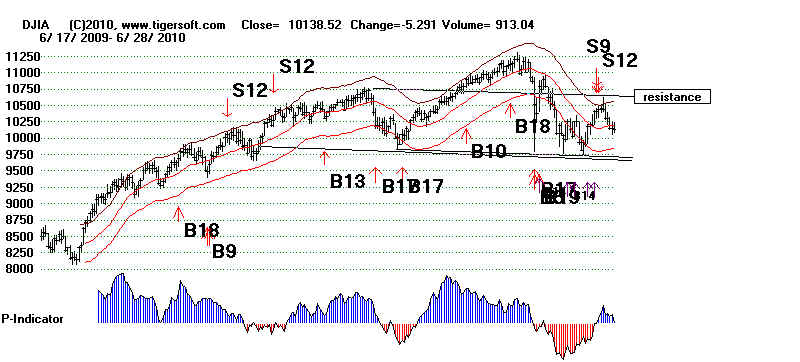
6/28/2010 PEERLESS SELL S9/S12 OPERATIVE.
http://www.tigersoft.com/PeerInst/S9S12Combo/index.html
Stay short the DIA or
SPY... Given the Sell S8/S12, the lower band (9831) and the
horizontal well-tested support are the highest
probability targets. But today the P-Indicator
fell by 139 to only +20. This means that
we may not see a Buy B9 if there is a decline
to the lower band. The P-Indicator being
more than slightly negative would deny it. The other key
indicator, the Accumulation Index, is
-.072. Still, I have noted that historically it is the fifth test of
support that has, everything else being equal,
the best chance of bringing a reversal back upwards.
Tests must each be 5 days apart. At
9800-10000, we will see how things look. Meanwhile we
remain heavily short on our Tiger Stocks'
hotline.
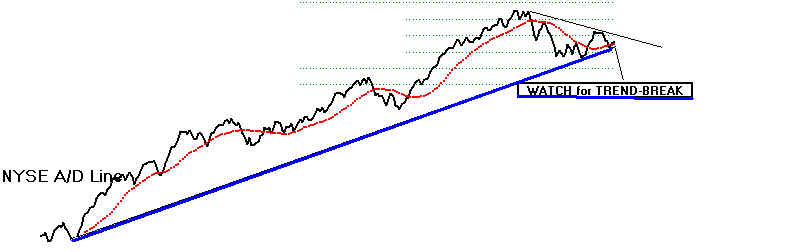
The ETFs
Closing Powers continue to fall, all the while the public keeps buying at the opening.
Professionals are usually right when
divergences like this take place. A/D Line weakness
in groups like the NASDAQ-100 and SP-500
are also bearish.
Big high
caps in SP-500 like MOS, GT, JNJ and MON - which the very weak CLosing Power
has been
predicting would keep declining - bearishly made new lows today and did not hold
above
their support.
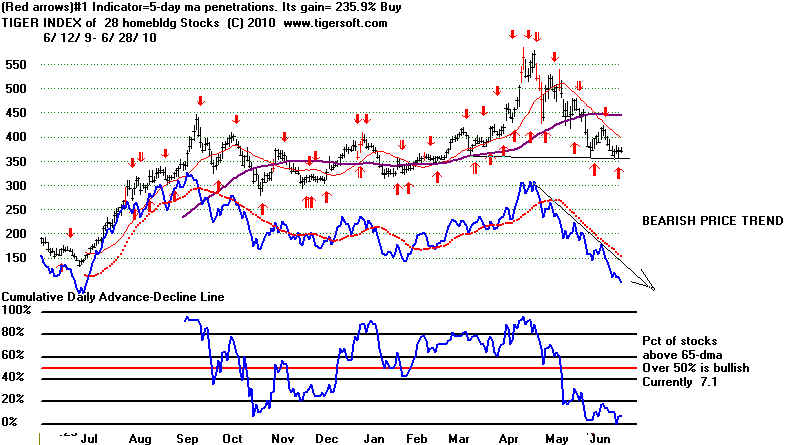
Homebuilding stocks are
weak, if we judge from the way their A/D Line is leading prices
to new lows. That means the FED,
Fannie and Freddie Mae are still sitting on trillions of
dollars nominally valued toxic mortgage debts'
collateral. For two years, I have said that
at some point, there will be a violent backlash
against the FED practice of giving big banks loans
at 1/4 to 3/4% interest for worthless debt,
especially when they charge strapped consumers 20%+
on credit card debt. If the FED ever
opens its books, the jig will be up! The thesis that the
advance of the stock market up from 6500 was
wholly artificial will be sorely tested in the second half
of 2010. Years ending in "0"
are apt to have their bad rap persist. That surely is the meaning of the
massive head and shoulder patterns in the DJI
and so many other indexes.
WHY THE MARKET LOOKS
SO TOPY
Unfortunately, the reaction against massive
government indebtedness on behalf of the biggest
banks has been twisted around to bring a
dangerously deflationary embracing of fiscal conservativism
and budget balancing at exactly the worst time,
when economies are suffering from very high
unemployment. Read again what I wrote
about the Crash of
1937 in the US.
The IMF and the Conservative governments of the
UK and Germany are already pursuing
policies in Europe that would have pleased the
most orthodox central bank officials of the
early 1930s.
Unemployment will surely rise dramatically
without massive public work programs. The spiral
into a Depression is all too real a threat
now. Private sector employment gains are too paltry.
We have no leadership, no one who sees that
Keynes was essentially right, that governments
must create jobs when the private sector
clearly fails. This boosts consumer buying power
and will restore a healthier economy. None of our political leaders, Obama especially, seem to
have learned anything from the failures of
orthodox financial thinking in the early 1930s. Obama
shows NO independent knowledge of economic
history. His embracing of public works last
year was pathetic, timid and paltry compared to
his eagerness to help big banks.
The financial markets seem to understand the
dangers of fiscal conservativism now far
better than the political leadership anywhere!
If I am right, we are close to a dangerous tipping
point down. (Like Bernanke, I
wrote my dissertation about the failures of economic leadership
in the 1930s. The difference was I wrote
about the role of the Chancellor of the Exchequer in
British Cabinet policy-making using previously
secret Cabinet papers.)
Nobel Prize winning
economist Paul Krugman wrote in Sunday;s NY Times:
"We are now, I fear, in the early stages
of a third depression. It will probably look more like
the Long Depression than the much more severe
Great Depression. But the cost — to the
world economy and, above all, to the millions
of lives blighted by the absence of jobs — will
nonetheless be immense. And this third
depression will be primarily a failure of policy. Around
the world — most recently at last weekend’s
deeply discouraging G-20 meeting —
governments are obsessing about inflation when the
real threat is deflation, preaching the
need for belt-tightening when the real problem is
inadequate spending... Both the United States
and Europe are well on their way toward Japan-style
deflationary traps. "
HOME-BUILDING STOCKS' WEAKNESS
Is their
weak A/D Line a warning that prices will break support?
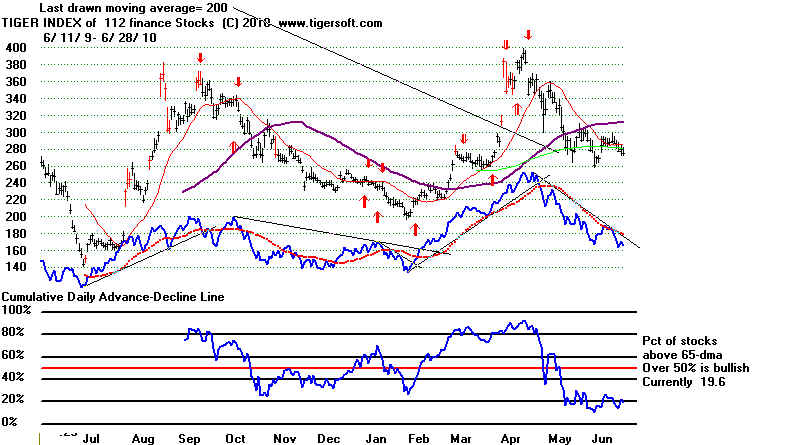
FINANCIAL STOCKS' A/D LINE IS WEAK
Their group A/D Line is leading prices to new lows.
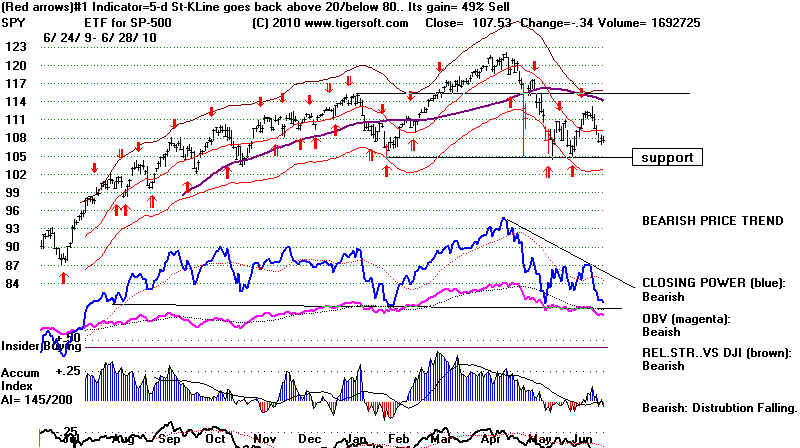
SPY still on Red Sell
The Opening Power is Rising - The Public is Bullish
Closing Power is Falling - Professionals are Bearish.
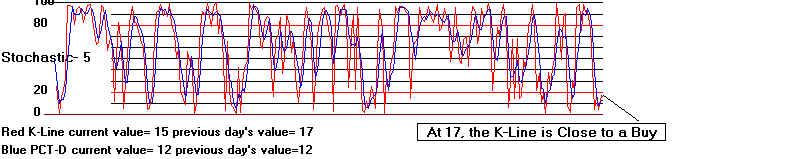
Day Traders are Bearish, too.
K-Line is close to giving a Buy by back above 20.
DJI still on Peerless Sell
See the sprawling head and shoulders pattern.

SHOULDER
HEAD
SHOULDER
===================================================================================
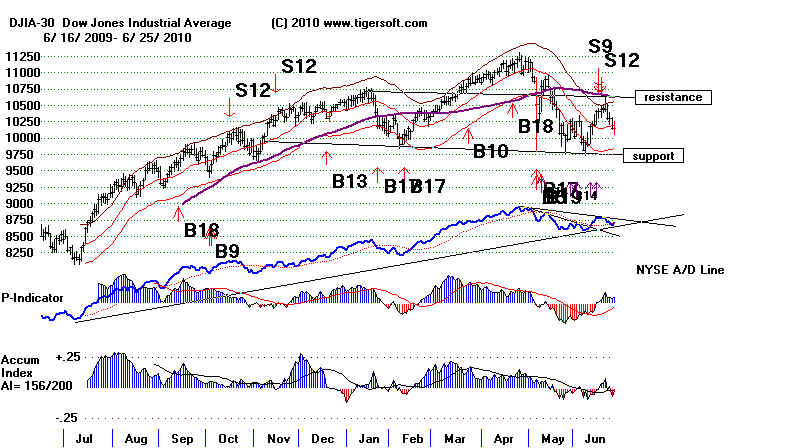
6/25/2010 PEERLESS SELL S9/S12 OPERATIVE.
http://www.tigersoft.com/PeerInst/S9S12Combo/index.html
Stay short the DIA or
SPY... The lower band (9831) and the horizontal well-tested support
are the highest probability targets.
The P-Indicator is still positive. Breadth was very
good
Friday. That increases the prospects of a
Buy B9 if the DJI gets closer to the lower band.
The ETFs still show Red Sells, declining
Closing Powers and Day Traders Tools. A bounce
would not be a surprise. Note that the
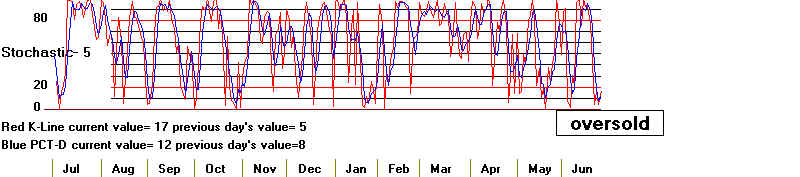
SPY will probably bring a short-term 5-day Stochastic-K-Line
Buy. 3-4 week traders should use that Buy
to cover their shorts in the SPY. Peerless users
should wait. No short-term Buy is
imminent for the QQQQ or DIA. See the 5-day red Stochastic-K-Line
on the SPY, which now stands at 17. A
move by the K-Line above 20 would be a red short-term Buy.
New Lows were greater than New Highs by 8 on
NYSE and 38 on NASDAQ.
Watch the Red-5-Day-Stochastic-K-line
Of the 275 stocks traded best
with 5-day Stochastics, 159 are on Sells and 116 are on Buys. With
only 18.6% of the SP-500 stocks above their
65-day ma, we have to expect lots of resistance
in the high caps if they rally. Even
though the big banks' stocks celebrated the refusal by Congress
to require their being broken up -
rejecting the logic that banks that are too big to fail are
just plain too big - in the new Financial
Reform Act; the DJI still declined. Twelve DJI-30 stocks
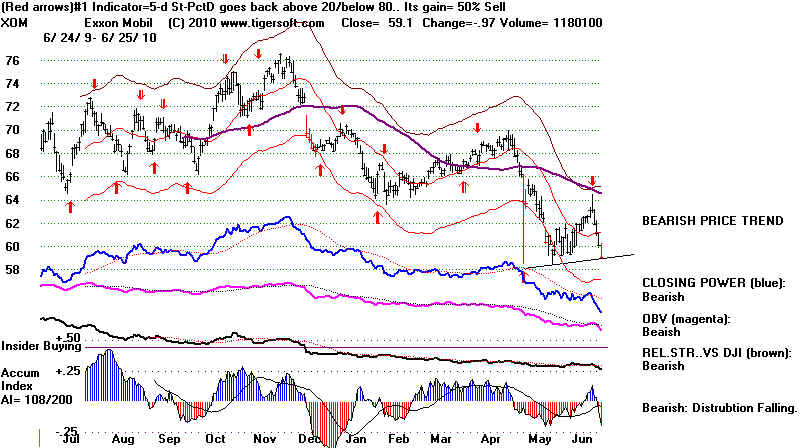
fell more than 2%. Weakness by consumer
stocks like WMT and PG and oil stocks, XOM and CVX,
on a day when a rally is being attempted shows
the economic recovery is faltering.
Obama is now humming the
tune of budget balancing that he heard from British Conservatives
at this weekend's Global Economic meetings.
This
is distinctly deflationary if it leaves the
realm of rhetoric. We will watch for more signs
of this, especially if unemployment numbers
start rising. The refusal by Congress to
continue expired unemployment benefits to those long
out of work in this the deepest recession since
the Depression is also deflationary, not to mention
being dangerously heartless given the lack of
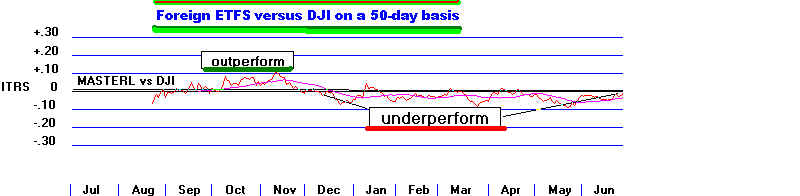
jobs still in many parts of the country. Foreign
markets, as a whole, may seem somewhat stronger
than the US markets with their new short-term
Buy, but when the 50-day ITRS (Relative
Strength) is examined, we see that they have not
out-performed the DJI for more than a few days
since Sept-Nov 2009
Watch Crude Oil and Exxon
We will want to watch the perpetual
contract for Crude Oil this week. It has risen to the apex of
what might become the right shoulder in a
bearish head and shoulders pattern with heavy red
Distribution.
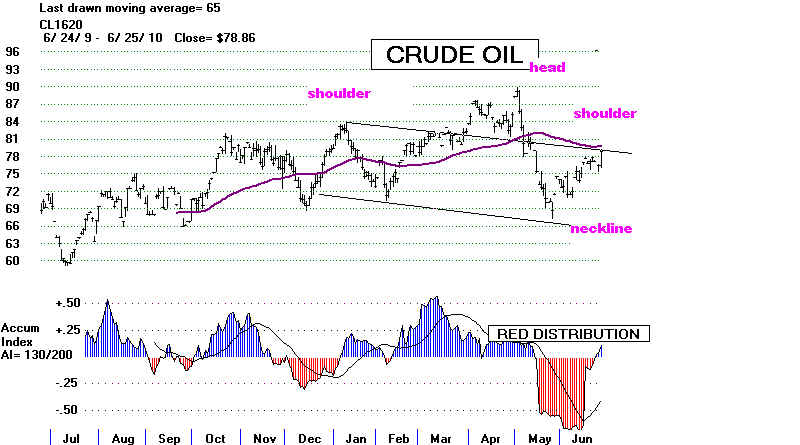
If Crude Oil turns down, and that may be
what the recent decline by XOM and CVX is warning will
happen, will be a sign that the world
economies' oil consumption is expected too weaken
in the months ahead. That would be
a warning that there may be another economic slump ahead.
Alan
Abelson of Barrom's is distinctly bearish. Does anyone know his track record?
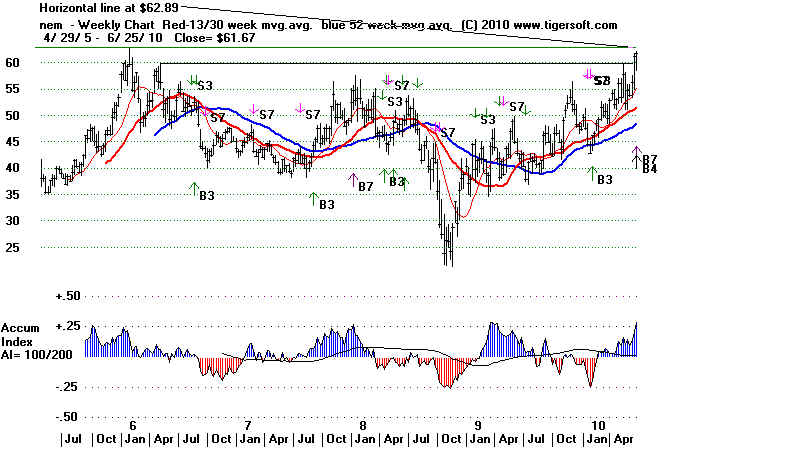
Gold Mining Shares are Verge of Breakouts
Gold stocks resisted the recent
decline and were up smartly when the breadth turned positive on Friday.
ANV and NEM are close to makiing new highs. Strength in gold
shares is another warning for the
general market. They are often among the last stocks to make good
advances before a bear market.
Weekly ANV - Allied
Nevada .
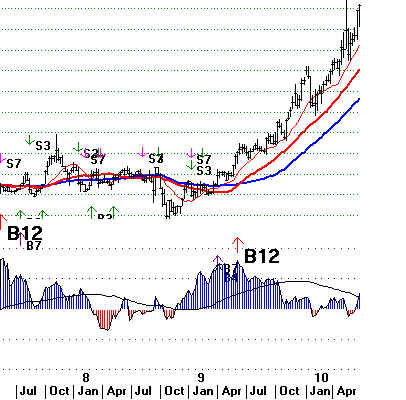
Weekly NEM - Newmont
DJIA on Sell S9/S12
=====================================================================================
TIGER/PEERLESS HOTLINE
6/24/2010 PEERLESS SELL S9/S12 OPERATIVE.
http://www.tigersoft.com/PeerInst/S9S12Combo/index.html
Stay short the DIA or SPY...
The lower band (9831) is the highest probability target.
Of the 15 simultaneous Sell S9/S12s, only 7 fell below the
lower band, but 12 fell to the lower band
within a month of the signal.
See below how weak the
TigerSoft Day Traders' Tool is for the DIA. Not shown is
the rising Opening Power, which I take to be a bearish sign
that the public and overseas
buyers are bullish.
>159 of the 275 stocks best traded with 5-day
Stochastics are on RED SELLS.
> 19
of the 30 DJIA stocks are on Automatic Sells. The A/D Line for these 30 stocks
has bearishly just fallen below its 21-day ma. Only 1
of these stocks is still above its
key 65-dma
Reading The Key Values for A Peerless DJIA Chart
The fact that the P-Indicator
stands at a +126 and the 21-day ma is still rising at an annualized
rate of +.127 (12.7) is evidence that the lower band may be
reached with the P-Indicator positive
and it may bring a new Buy signal. The Accumulation
Index is now -.065. This is not so negative
as to rule out a brief recovery by the DJIA from just below
its 21-day ma. Ordinarily, we want to
see the Accumulation Index above +.07 for that. If
there is a Friday rally, due to short-covering,
the lower band will still be our target unless there is a
new Peerless Buy signal. Volume rose bearishly
on today's decline. A rally tomorrow would probably
be on unconvincing low volume.
For those who want to study closely our signals' indicator
readings, the 2010 Sell S9/S12 did not quite
show negative readings from the P-Indicator when it
occurred. The only other S9/S12 case like this was
on 4/22/1929. That did bring a drop below the lower
band. Note also that the 2010 S9/S12
had only a slightly negative Accumulation Index, -.018.
This is not necessarily bullish. The October
1987 which dropped the DJI 30% in 3 weeks actually had a
higher Accumulation Index reading, -.017
when the S9/S12 occurred. More important, I think,
was the fact that the 21-day ma then was falling
as the DJI fell and the Accumulation Index and P-Indicator
were negative at the lower band. The
21-day ma is rising now at an annualized 12.7% rate. This
is more likely to bring a brief bounce.
More important, Peerless theorizes that big declines likes
in 1929 and 1987 occurred because the
breadth diverged from the DJI for many months before the
final S9/S12 that brought on the bear market.
That is not true here. The S9/S12 this June is
isolated. There were no previous cases in the 8 months
prior to the current one. Still. of the 6 isolated
S9/S12s, 4 brought brief declines below the lower band.
Simultaneous S9/S12s: 1929-2010
Set Year %Decline
P-I IP21
Lower Band Below Lower Band
(no=isolated)
---- ------- ------- --- ----- ------- ---------- ------------ -------------------
-----------------------------
yes 1/20/29 3.6%
-22
-.006 YES
NO
yes 4/22/29 5.0%
17
.038 YES
YES Paper loss of 4%
yes 6/14/29 40.0%
-59
-.035 4 mo later
Paper loss of 18%
yes 9/4/29 47.0%
-16 -.059
YES
YES
===========================================================================
no 4/2/36
7.4%
-27
-.089 YES
YES
no 9/1/59
1.9%
-2
-.062 YES
YES (after 1 mo bounce) Paper loss of 4%
===========================================================================
yes 5/22/72 5.6%
-89
-.031 YES
NO
yes 8/3/72
2.7% -82
-.056 NO
NO
===========================================================================
no 8/29/75
4.8% -139
-.102 YES
NO
no 10/10/78 11.7%
-139 -.136
YES
YES
no 1/2/81
3.5%
-71
-.04 YES
NO
===========================================================================
yes 5/6/87
5.2% -185
-.079 YES
NO
yes 6/8/87
-4.8% -32
-.045 NO -
immediate loss
yes 10/2/87 30.3%
-56 -.017
YES
YES
===========================================================================
no 8/17/99
6.4% -425
-.025 YES
YES
no 6/16/10
????
12 -.018 |
 DJIA and DIA
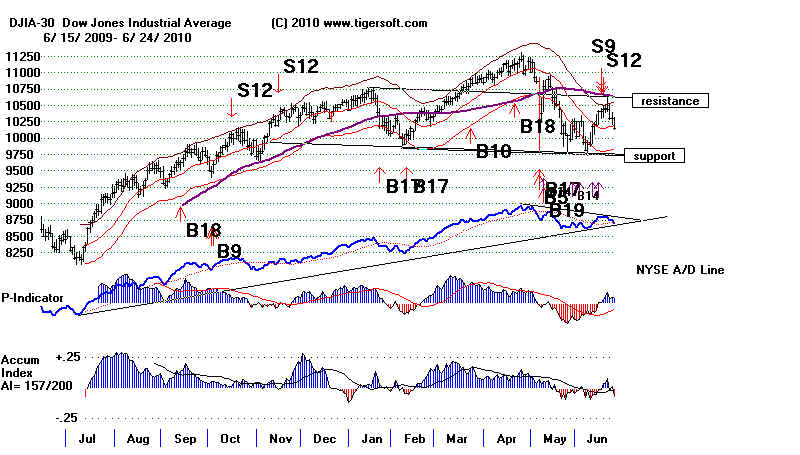
SPY
QQQQ
===============================================================================
===============================================================================
6/23/2010 PEERLESS SELL S9/S12 OPERATIVE.
http://www.tigersoft.com/PeerInst/S9S12Combo/index.html
Stay short the DIA or SPY... A DJIA move
past 10700 would probably destroy the head
and shoulders pattern and get me to recommend covering short
sales to traders.
Expect at a minimum, a further decline by the averages to the
short-term support of their 21-day
mvg.avgs. The failure to make a new high as the DJI and the
other averages turned down this
week from the resistance of the 65-day ma and the apex of a
potentially symmetrical head and shoulders
pattern has to put pressure on the biggest holders of stocks to
sell. They still have profits from a year
ago and they do not want to lose them. At the 21-day ma we will
get a sense of how much support the
market has by looking at the Accumulation Indexes for the various
ETFs.
Gold futures are
down at the moment. Recall the red distribution in NEM last week. NEM failed
to make a new all-time high above 62. A strong Dollar usually means
market weakness. Red
distribution
for NEM after a
rally is not a good sign for the market as a whole. See its chart in 1987.
Among the 228 stocks traded best with 5-day Stochastics, 164 are on
Sells and 64 are on buys. More
weakness is likely. One more thing, since 1965, the DJI has risen
only 40% of the time over the next week.
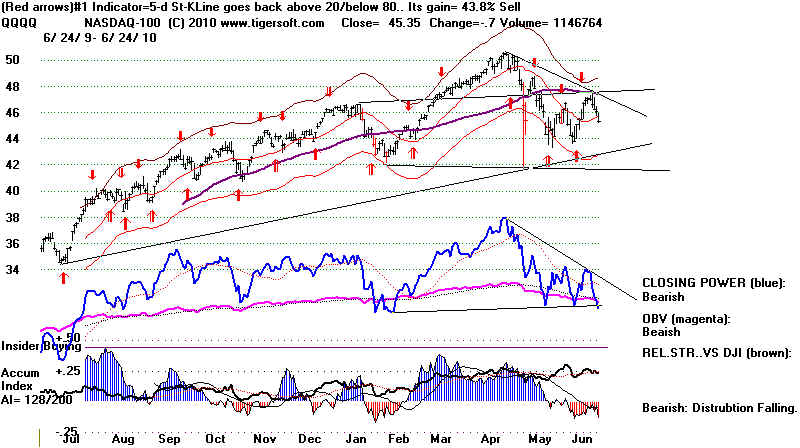
Public Buying and Professional Selling Is Bearish
When we view the rising Opening Powers for the QQQQ, SPY and DIA,
we can see that the
the public and overseas buyers are still optimistic and are busy
buying as a whole. The falling Closing
Powers show that institutions and hedge funds are net sellers
now.
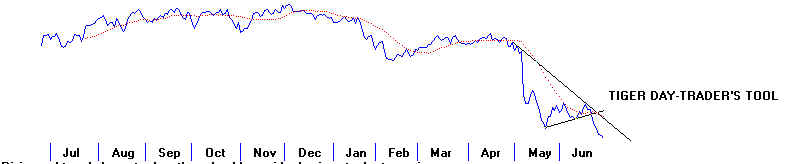
Look also at the TigerSoft Day Traders'
Tool on the QQQQ and SPY
just below. By virtue of the
Day Traders' Tool's downtrending line, we can see that it is now
more advantageous to sell short
at the openings than to buy: there is more downside potential
than upside, day after day. For the QQQQ,
this tool has just made a breakdown below its rising uptrend.
Worse, the SPY's Tiger Day Traders'
Tool is now testing its 12-month low. Professionals
are selling short into up-openings and
institutions are using the full day of trading to sell
their big positions. This pattern can continue
for several months without a breakdown if the public is in
a speculative mood, as they were in
1999-2000. But that is not true now. And, one
imagines that the bankers are not so foolish now.
Instead of stocks like a year ago, the FED's cheap money is
now used by the big banks to buy
Treasury bonds that pay several points more than their
borrowing costs. What a country!
QQQQ - INCREASING WEAKNESS AFTER THE
OPENING
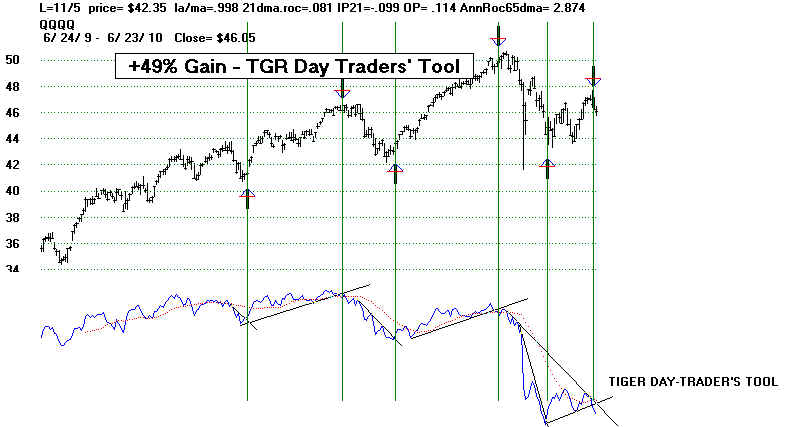
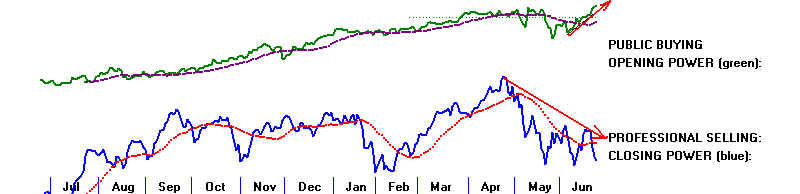
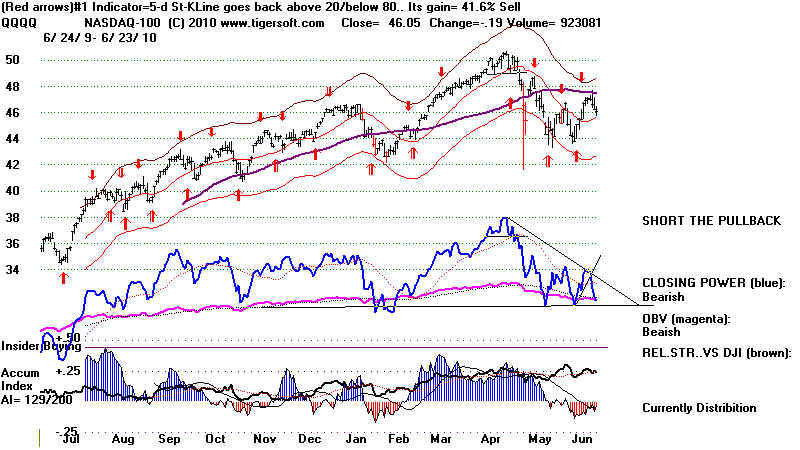
SPY - INCREASING WEAKNESS AFTER THE
OPENING
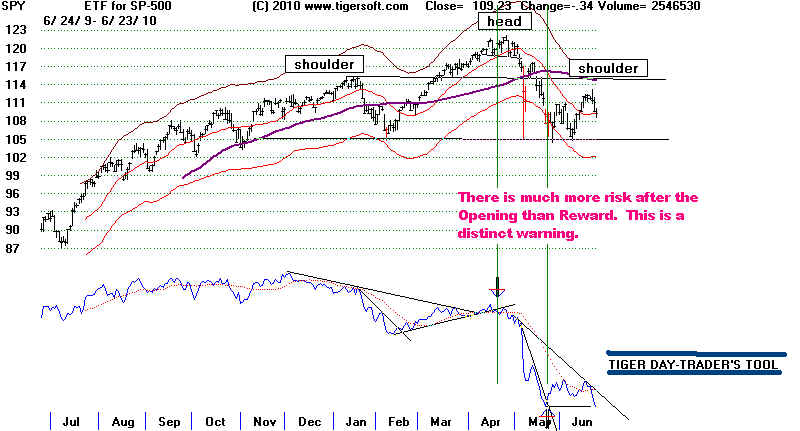
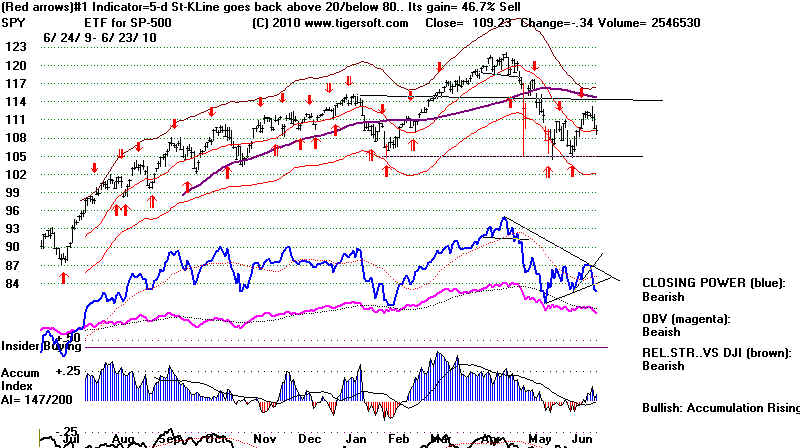
DIA with Optimized Signals
AND DJI with PEERLESS SIGNALS
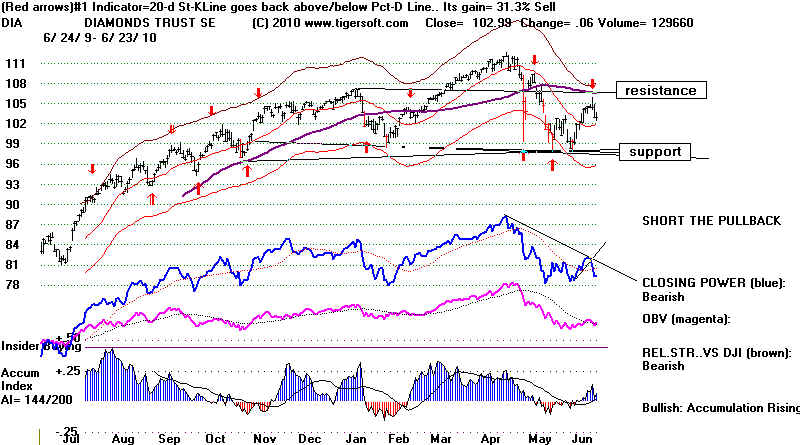
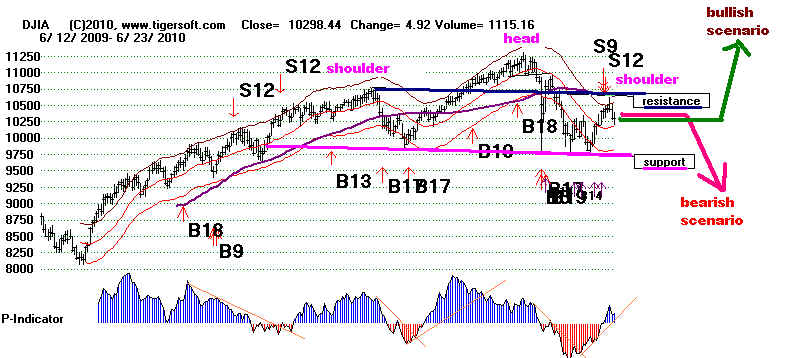
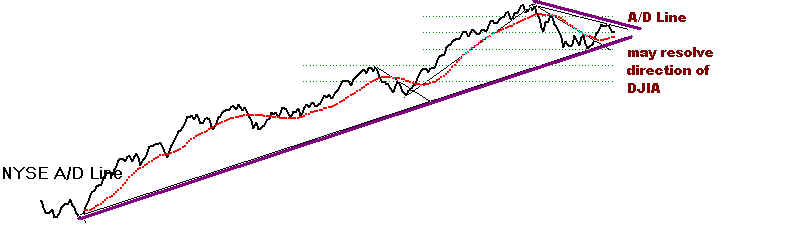
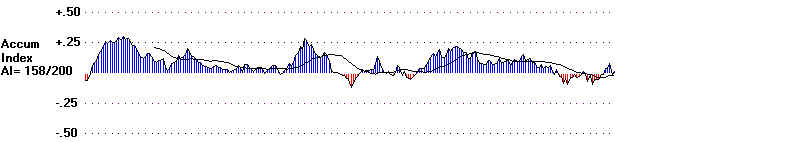
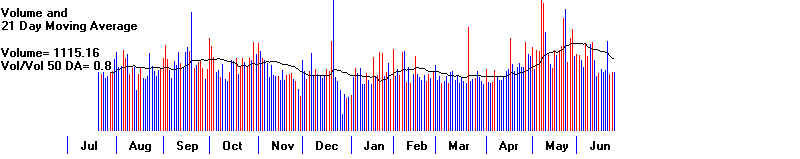
THE NASDAQ IS STARTING TO UNDER-PERFORM DJIA
IWM is already back to the support of its flat 21-day ma.
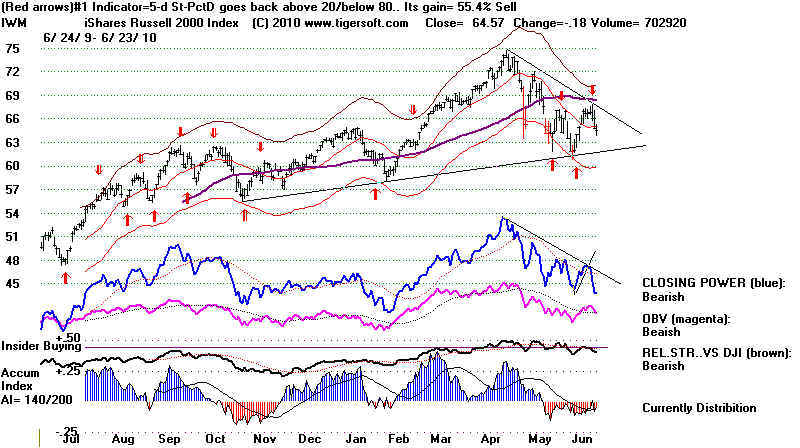
====================================================================================
====================================================================================
6/22/2010 PEERLESS SELL S9/S12 OPERATIVE.
http://www.tigersoft.com/PeerInst/S9S12Combo/index.html
Stay short the DIA or SPY/... A DJIA move
past 10700 would probably destroy the head
and shoulders pattern and get me to recommend covering short
sales to traders.
The decline today shows the resistance at
the 65=day ma is real; all the key ETFs turned
down, along with their Closing Powers. The DJIA is at 10295
and 1.2% over its 21-day ma. We will likely
see tomorrow if that mvg. avg., now at 10171 and rising 5 points
a day. will act as support. We are
watching the 295 stocks that are traded best with the 5-day
stochastic. Only 59 of these stocks
are on buys while 219 are on sells. For short sale ideas, let me suggest looking at the stocks
whose Closing Power is making a 12
month low for the following additionally bearish conditions:
1)
Falling Back from 65-day ma, Negative Accum. Index
2)
Head and Shoulders Pattern. Negative Accumulation
3)
New Price Lows, Negative Accumulation
4) 2
Months' Negative Accumulation. Bearish Relative Strength
5) On
Verge of Flat-Support-Line Breakdown, OBV and Relative Strength Bearish,
Negative (Red) Accumulation Index below its 21-day ma.
Surely, it is bearish that so many stocks
show these normally reliable signs of technical weakness.
DJIA is falling back from apex of potential right shoulder in apex of
head and shoulders pattern. Such patterns usually form right shoulders
that last nearly as long as the left shoulder, which lasted from October to
December. If that, in fact, happens here them then the DJI may be stuck
in between 9800 and 10650 for another two months.
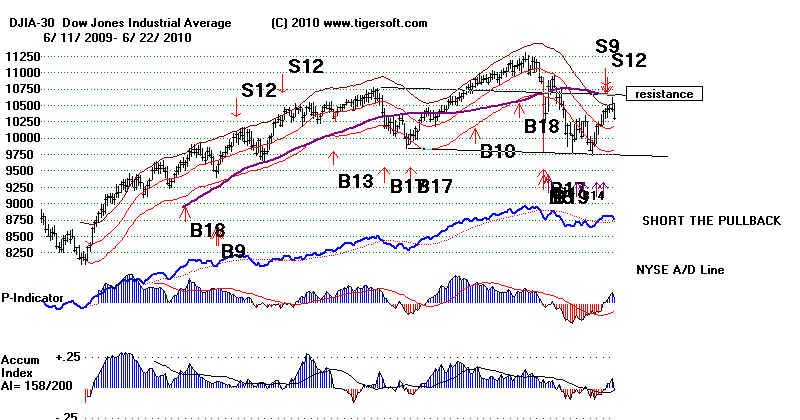
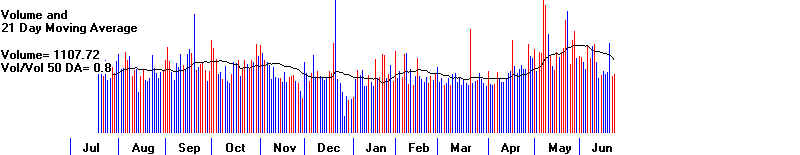
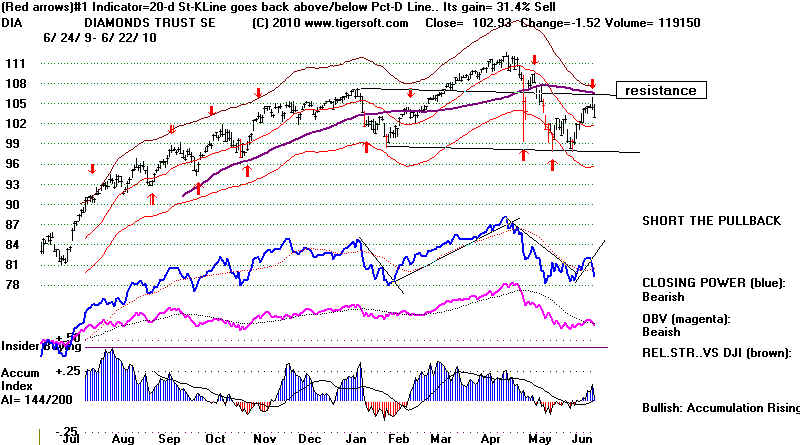

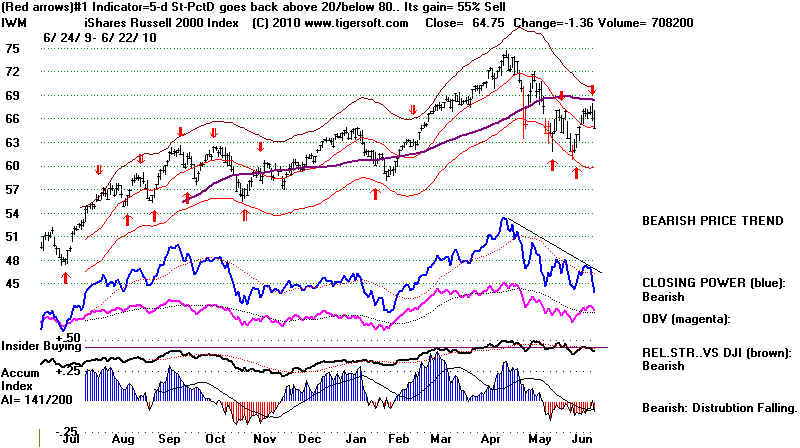
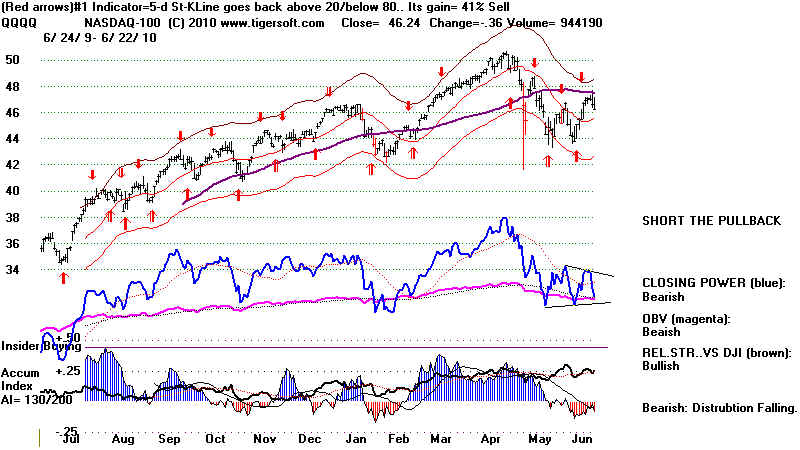
===================================================================================
===================================================================================
6/21/2010 PEERLESS SELL S9/S12 OPERATIVE.
http://www.tigersoft.com/PeerInst/S9S12Combo/index.html
Shorting the DIA or SPY Now Seems
Reasonable... A DJIA move past 10700 would probably
destroy the head and shoulders pattern and get me to recommend
covering short sales.
The DJIA opened up 120, tagged
the resistance of the falling 65-dma and then went into
a steady decline for the rest of the day. Significantly,
this broke the recent uptrend of the
Closing Power for the DIA. SPY, QQQQ, MDY and
IWM. That the DJI has also tagged the 10600
objective set out based by the DJIA's head and shoulder's right
shoulder potential apex
means I can recommend shorting the DIA or SPY. Bearishly,
the optimized Tiger signal
on each of these is now a Sell, except for the DIA. These
technical features suggest a
further retreat, probably to the 21-day ma at 10250 on the DJIA.
However, because the P-
Indicator and Accumulation Index have now been positive for 3
days, the S9/S12 predicted
decline back to the lower band at 9900 may be delayed. See
the study of S9/S12s
we cited in the last few hotlines. With the NYSE A/D Line
stronger now than it was last
November-December, the current S9/S12 is probably not powerful
enough to break
the 9800-10000 support. 208 of the 265 stocks with
Optimized 5-day Stochastics are
now on SELLS. Home-building and Retailing stocks look
especially weak. Is consumer
demand slipping again? Watch the action of V (Visa) and MC
(Master Card). They
rose strongly today. But MA shows what may become a falling
head and shoulders.
Watch Home Building Stocks. Housing numbers come out today.
A break below the
support level shown below would be distinctly bearish.
Stock traders will want each
night to run the Tiger Power Ranker against the stocks whose
Closing Powers are
making new highs ( MAXCP) and new lows (MINICP) to see those
considered "bullish"
and
"Bearish",
respectively. I will start providing these lists updated each night on the Tiger
data
page.
Tiger Index of Home-Building
Stocks
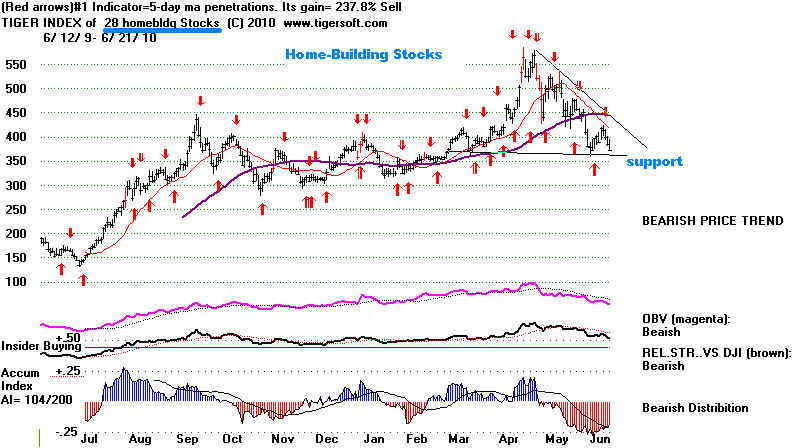
Tiger Index of Retailing Stocks
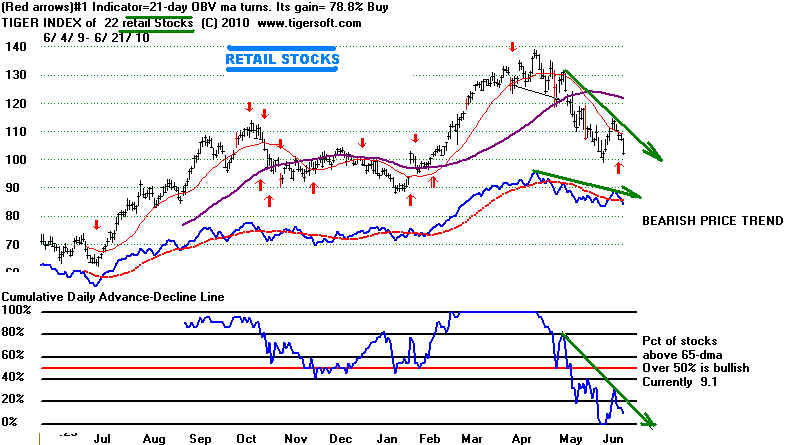
MASTER CARD - Falling Head and Shoulders
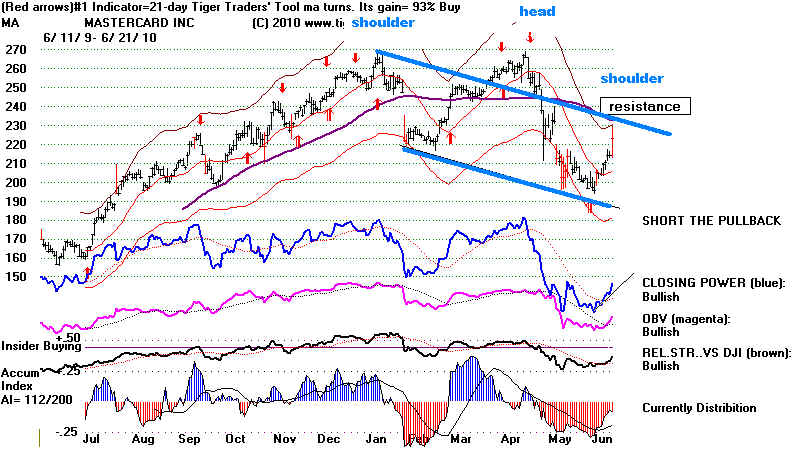
SELL S9/S12 IS NOW OPERATIVE PEERLESS SIGNAL
Resistance should be intense between 10600 and 10700
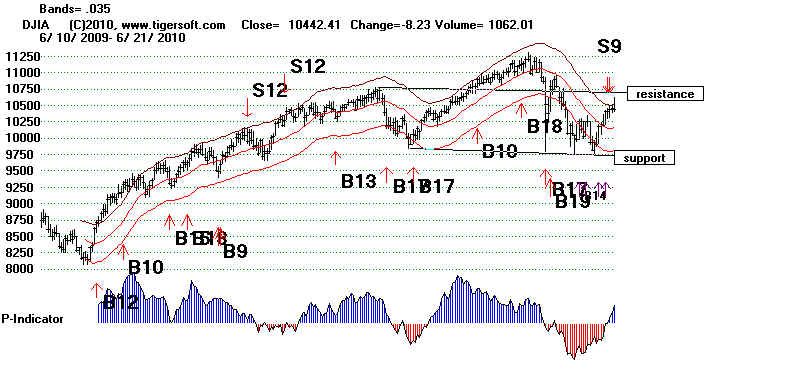
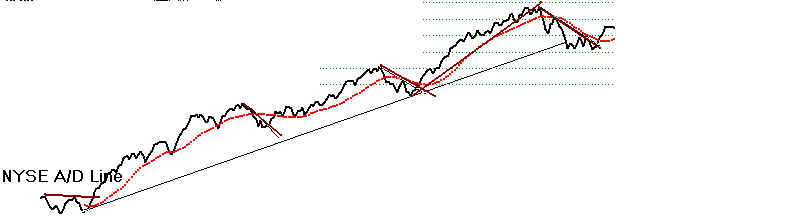
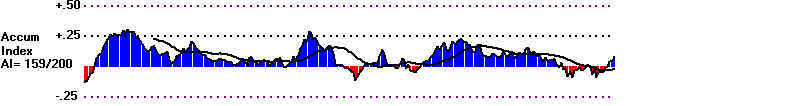
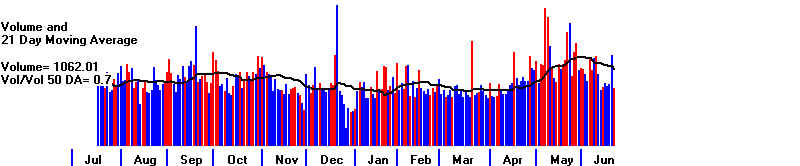
================================================================================
6/18/2010 PEERLESS SELL S9/S12 OPERATIVE, BUT
DJIA's HEAD AND SHOULDER PATTERN SUGGESTS A
RALLY
BACK TO 10600. IF P-Indicator and
V-Indicator turn positive
for 3 days, a rally back to 10600 will become
more likely.
The
DJIA gained 16, rising for third straight day on higher volume each day.
In the process,
the P-Indicator and the Accumulation Index turned positive.
They now stand at
+192 and .033, respectively. Although the DJI is at the resistance
of the upper
band, if the P-Indicator and Accumulation Index can stay positive
for two more
days, a rally 3% higher to 10700 will become likely. This is one of
the
characteristics to look for when a Sell S9 occurs. About half of the bull
market S9/S12s
see the P-Indicator and Accumulation Index turn positive for
3 or more days.
You can see all the cases of bull market S9/S12s at
http://www.tigersoft.com/PeerInst/S9S12Combo/index.html
"S9/S12s in bull markets are more reliably bearish than
S9/S12s in on-going
bear markets. As a
whole, they usually only promise a decline to the lower band
or well-tested support.
Only 3 of the 15 bull market S9/S12s brought a decline
of greater than 6.5%
when reversed by the next Peerless Buy signal."
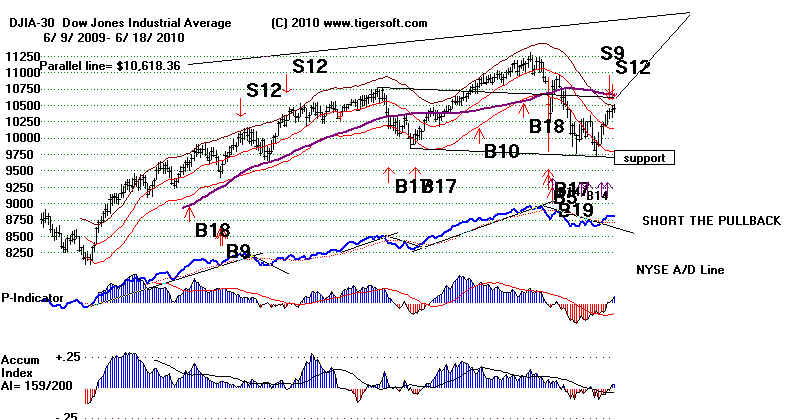
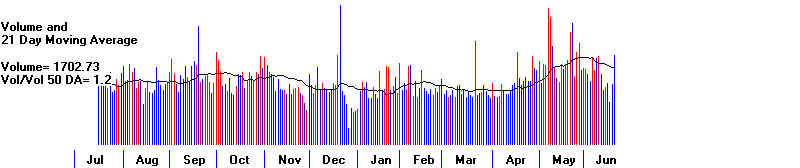
5-Day
Stochastic Stocks
Only
69 of the 270 stocks now traded best with 5-Stichastics are still on BUYs currently,
whereas 201 are on SELLs.
SIPX is a volatile stock going nowhere caught in a web spun
by professional traders.
It illustrates how profitable some stocks are when they are simply
traded for one small gain
after another. Total gains using a simple 5-day Stochastic were
252% in the last year.
20 of the 25 traded were profitable. The biggest paper losses were only
12%. The longs gained
103% and the shorts gained 64% using the next days' openings.
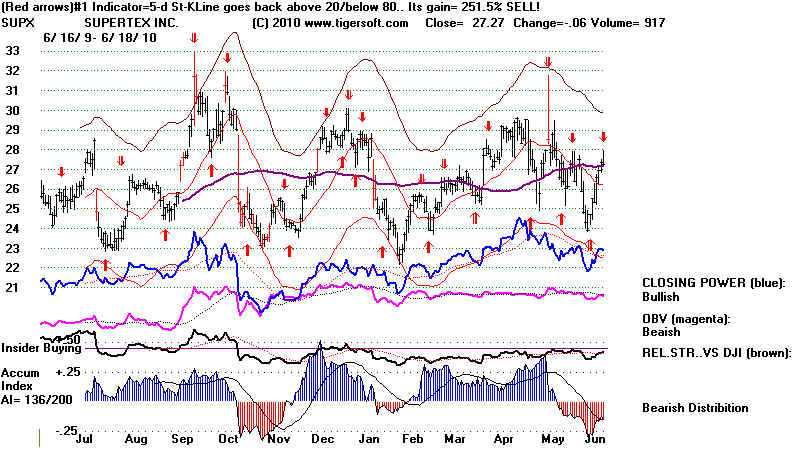
RISING CLOSING POWERS:
DIA, SPY and QQQQ.
These ETFs
show rising Closing Powers. Professionals are still pushing these ETFs higher,
although one must wonders how much
options' expiration might have had to do with the
rise of the market at the end of
the week. The SPY shows a chart with the stiffest resistance
at 115, about 4% higher than
Friday's Close. Charts of DIA and QQQQ are here.
This
is consistent with the DJI reaching
a top between 10500 and 10600. 10517 represents a
50% recovery of what was lost in
the April-May 12% decline.
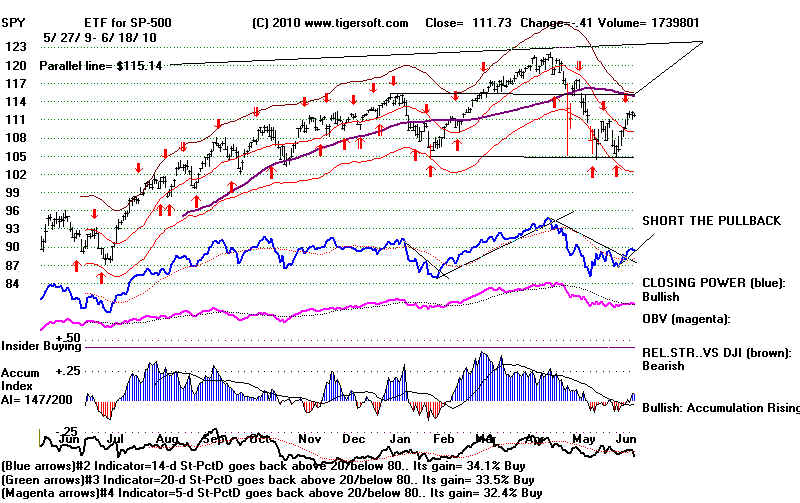
The hope is that
the British Petroleum will soon be capturing most of the leaking oil on
their Gulf rig, even though
there is now talk of the leak being 100,000 bar./day.
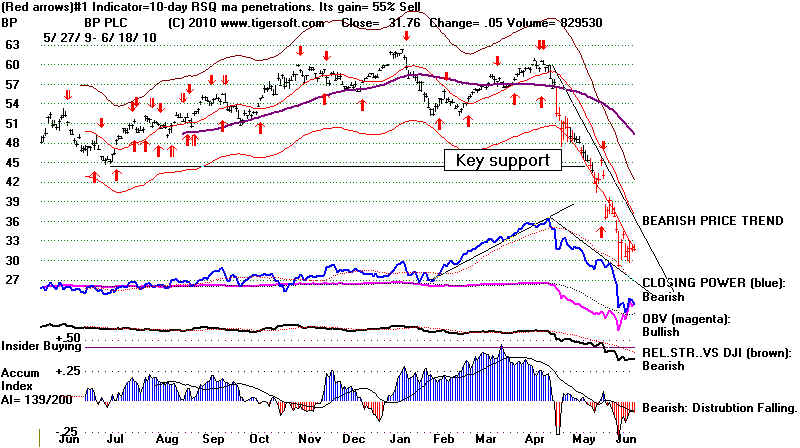
The FED is
clearly accommodating the rally, too. We see this in the weakness of the Dollar.
If they were soon going to be
raising rates, the Dollar might be expected to be rates with Gold falling.
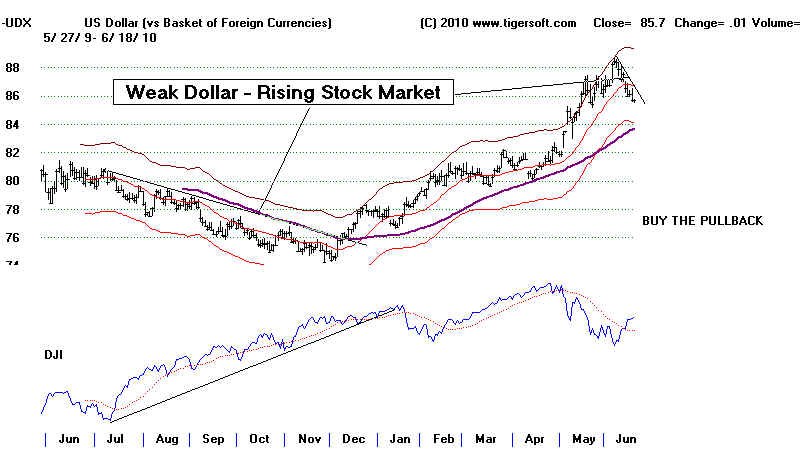
GOLD IS ON VERGE OF BREAKOUT
INTO ALL-TIME HIGH TERRITORY.
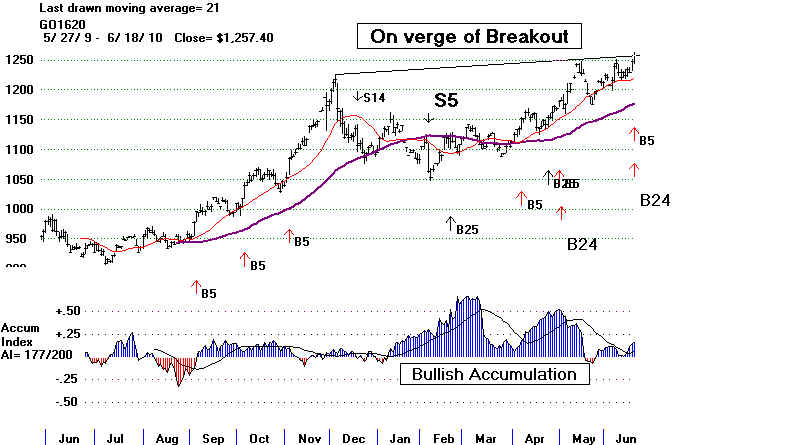
===================================================================================
6/17/2010 NEW PEERLESS SELL S9/S12 TODAY. A DJIA
DECLINE BACK BELOW 10000 SEEMS MOST LIKELY.
BUT,
OFTEN THE HEAD AND SHOULDER PATTERN MUST PLAY
ITSELF OUT.
The
DJIA gained 35 but there were 20 more down than up and NYSE down
volume was 242
million more than up volume. The DJI and other averages
may go a little
higher to reach their apex of right shoulders symmetrical to their
left shoulders.
See DJI and Tiger Index of SP-500 below. But a re-test of 9800
seems indicated
by the S9/S12 from Peerless on the DJIA.
GOLD ABOUT TO BREAKOUT
As often happens
at tops, gold advanced and is challenging its highs. I take it
to bearish that
the leading gold stock NEM shows heavy red distribution. This
is something that
often appears at its tops. GLD, on the other hand, continues
to be a hold on
our Stocks' hotline. I expect it to reach $1300 this year and fulfill
its minimum
upside objective set out by its breakout over 1000. Driving downtown
in San Diego, I
have never seen so many Gold Buyers' signs out.. .
WATCH GLD TO SEE IF IT WILL BREAKOUT PAST 123.
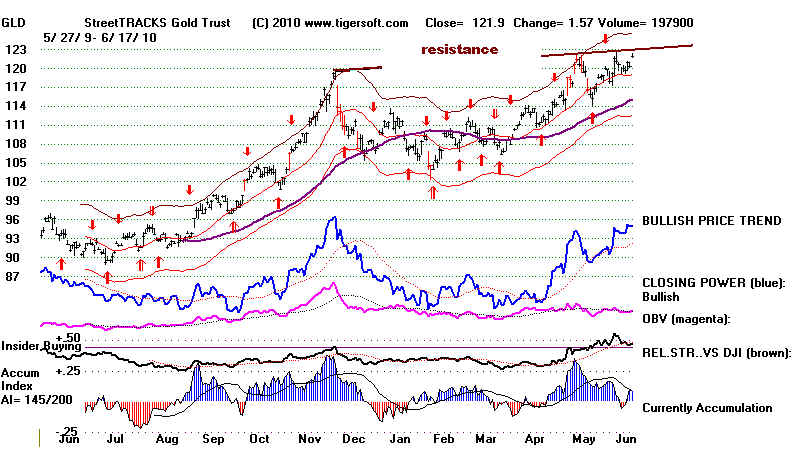
WATCH NEM - THE WORLD's BIGGEST GOLD
MINER.
IT SHOWS HEAVY RED DISTRIBUTION
AS IT
APPROACHES ITS ALL-TIME HIGH NEAR 61.
NEM's CURRENT STOCK "SELL S9" HAS BEEN 85% RELIABLE.
See
the 23 year study of NEM and negative
Accumulation
Index divergences here.
85% of the TigerSoft
"Sell S9" signals since 1987
brought either a 2 month hesitation or a decline
of up to 50%
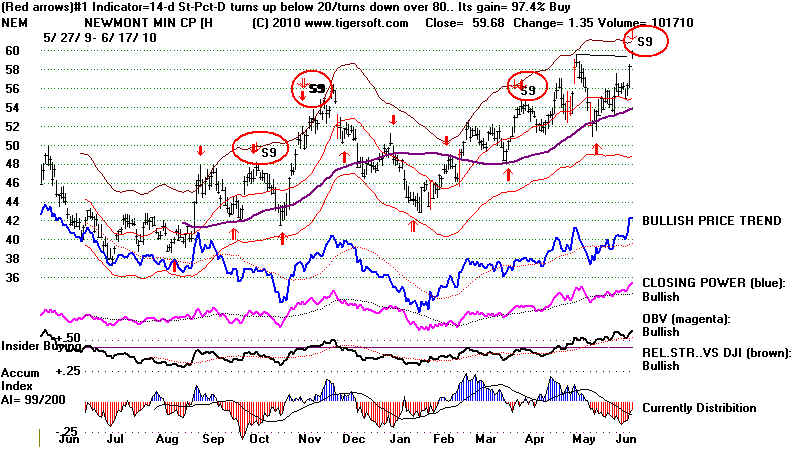
Will the market rally from here short-term? The DJI's price pattern may still prove
to be a
symmetrical head
and shoulders pattern. These have a way of developing to fruition.
But a decline may
come first. I believe the stocks best traded with the 5-day Stochastic
offer help
here. See STOCH5 on our data page.
87 -9 are on 5-day Stochastic Buys
190 are on 5-day Stochastic Sells
More stocks look short-term vulnerable from this
persepctive. On the other hand, the
CLosing Powers of
the DIA, SPY, QQQQ, MDY and IWM are
presently rising. If there is
significant
weakness after the Opening, these ETFs' Closing Power up-trends will be
bearishly broken.
Waiting for this to occur, should increase the odds of successfully
predicting a
decline.
Three stocks on
new red 5-day Stochastic sells with AI/200 under 100 and with
a price below the
65-day ma are GRA, SAH and EPAX below. These look like short-term
short sales,
especially since they have produced yearly gains of more more than
100% apeice simply trading this 5-day stochastic system.
6/17/2010 10434.17
la/21-dma= 1.028
21dma-roc = -.09
P= +92 Pch= 80 - IP21= .035 V = 93
Opct = .13
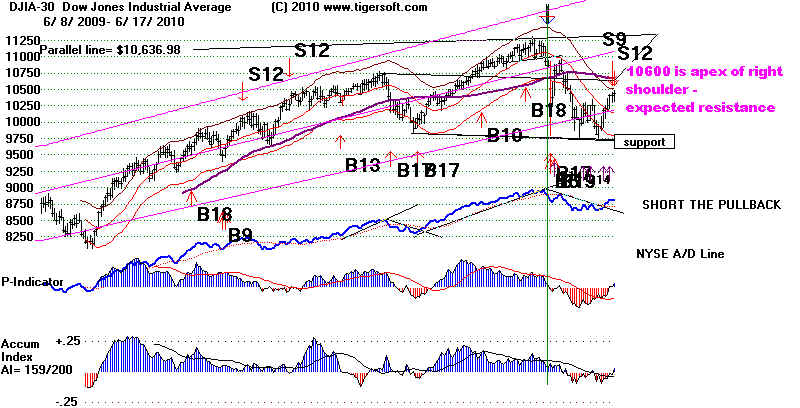
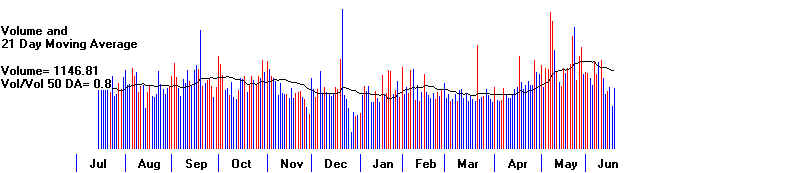
TIGER INDEX OF SP-500 STOCKS
The TigerSoft Index of SP-500
stocks has reached the resistance of its now falling
65-dma which is just below
the apex of what would become a right shoulder. 37.7% of the
stocks in the SP-500 are
still below the resistance of its 65-dma.
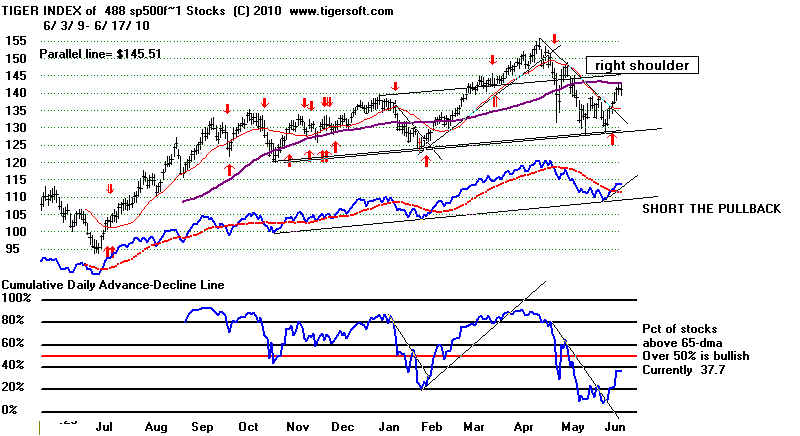
DIA - Closing Power is still rising.
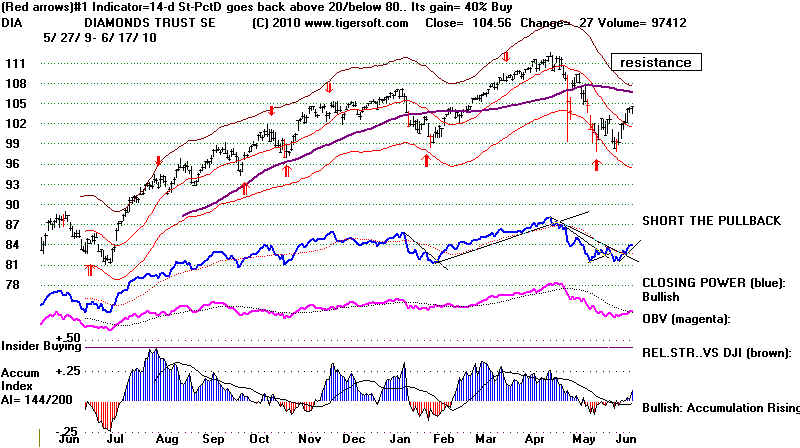
SPY - Closing Power is still rising.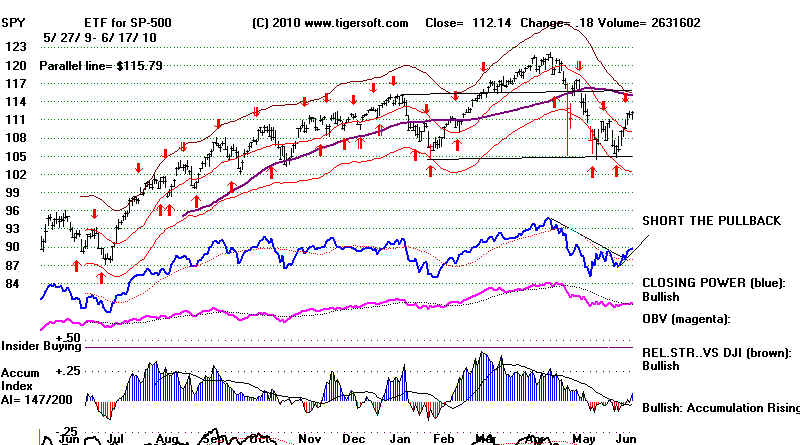
QQQQ - Closing Power is still rising.
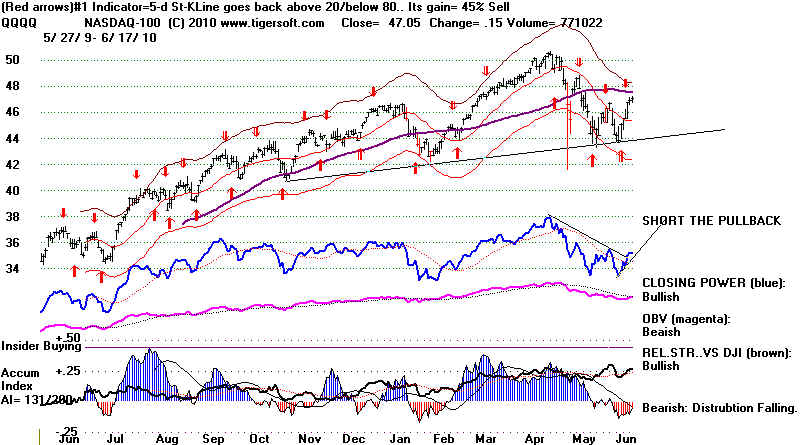
3 Short Sale Recommendations: GRA, SAH and EPAC
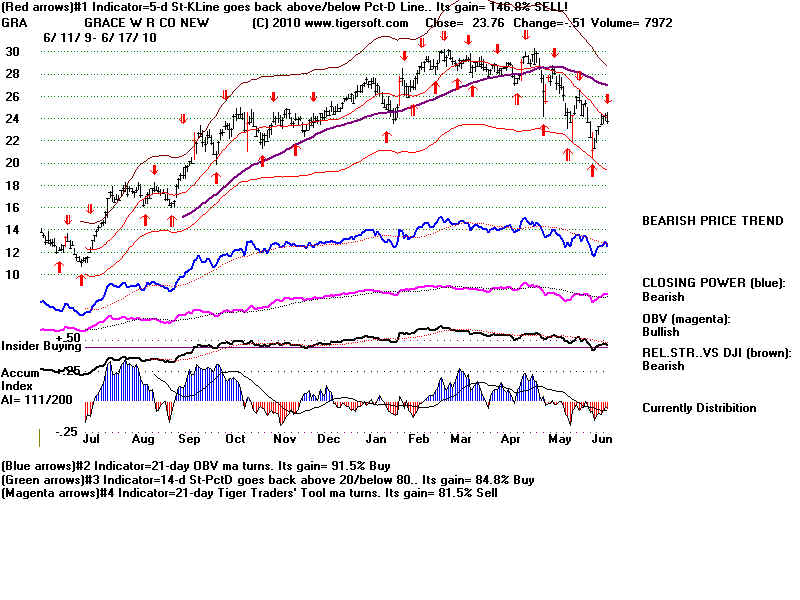

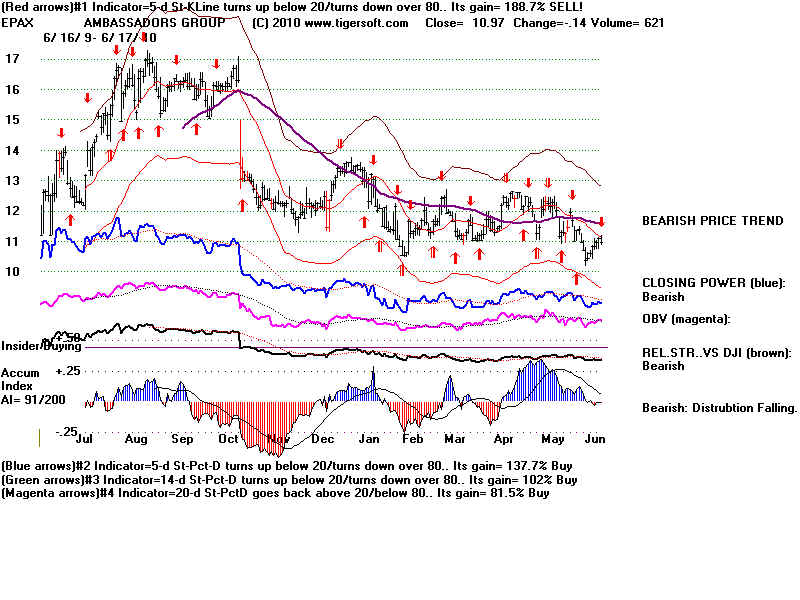
==================================================================================
6/16/2010 NEW PEERLESS SELL S9/S12 TODAY. A DJIA
DECLINE BACK BELOW 10000 SEEMS MOST LIKELY.
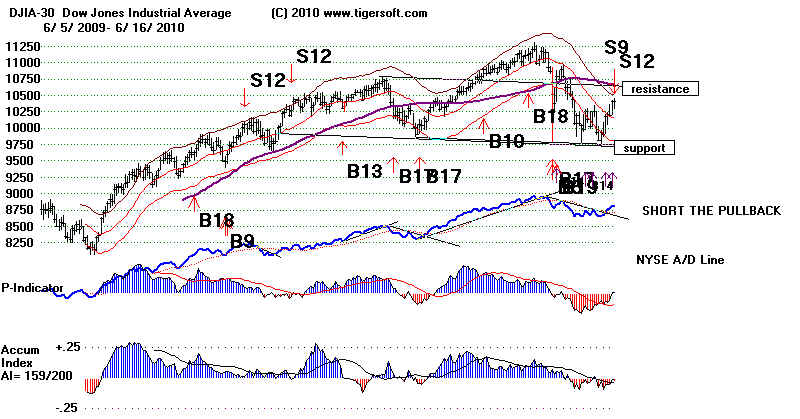
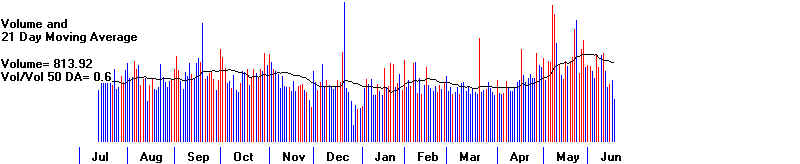
Peerless finally gave a Sell signal, in fact, two of them today. The
S9/S12 signals
in combination can be
very bearish. They occurred right at the top in September 1929 and
October 1987. For
there to be this much bearishness potential, we think that there has to be
a lengthy period of a
comparably weak NYSE A/D Line and multiple earlier
Peerless Sell Signals.
This is not present now. So, a simple retesting of 9800 and
the lower band are
reasonable next objectives.
It is helpful to study
these combined S9/S12 signals when they occurred in bull markets,
before there has been a
12% sell-off. Since 1928, there have been 15 combined Sell S9-S12
signals in such a bull
market environment. Assuming one shorted the DJIA on these
S9/S12s, 14 of the 15
were closed out profitably at the time of the next Buy. Leaving
the three biggest
gainers off, the average drop would still have been +5.1% on short
sales taken with these
signals. In 9 of the 15 cases, there was no paper loss. In one
case, there was a paper
loss of more than 15%. In all the others, the paper loss was less
than 3%.
The present S9/S12 is
marginal. The P-Indicator was not actually negative, as it
now stands at +12. In
all the other cases of bull market S9S12s, it was negative. The
IP21 (current Accum.
Index), V-Indicator and Opct were each negative with the
DJI closing 2.5% over
the 21-day ma. The one loss, in 1987, would have been avoided
if we also required
that the NYSE declines exceed advances at the close either on
the day of the signal
or on a subsequent day before there is a Peerless Buy. Today
there were 555 more
down than up at the close. So, the S9 is now "clinched".
In 40% of these
S9/S12 cases, the market rallied 3% or more before falling to at
least the lower band.
What typically distingushes these cases is that the P-Indicator went
positive for more than
3 consecutive days. In these cases, the decline to the lower
band is usually just
being postponed for 3-6 weeks.
Will the market rally from here short-term? The DJI's price pattern may
still prove to be a
symmetrical head
and shoulders pattern. These have a way of developing to fruition.
But a decline may
come first. I believe the stocks best traded with the 5-day Stochastic
offer help
here. See STOCH5 on our data page.
96 are on 5-day Stochastic Buys
134 are on 5-day Stochastic Sells
More stocks look short-term vulnerable from this
persepctive. On the other hand, the
CLosing Powers of
the DIA, SPY, QQQQ, MDY and IWM are
presently rising. If there is
significant
weakness after the Opening, these ETFs' Closing Power up-trends will be
bearishly broken.
Waiting for this to occur, should increase the odds of successfully
predicting a
decline.
              Bull Market S9/S12s
                     ===================
 Simultaneous Peerless Sell S12s/S9s: 1928-2009
                Date          DJI           Gain
-------------                 -----------   --------
#1
...S9...S12    1/ 30/ 1929    312.6          +3.6%
1.023      .492    P=-22      -22      -.006  -415   .189
(la/ma  ann.roc    P-Ind  P-change    IP21   V-I   Opct)
Bull Market variety.
Fell to lower band after 3% advance and paper loss.
-----------------------------------------------------------------------
#2
...S9...S12    4/ 22/ 1929    315.3          +5.0%
1.036   .027  P=-39    17    .038   -576   -.016
Bull Market variety.
Fell to lower band after 3% advance and paper loss.
-----------------------------------------------------------------------
#3
...S9...S12    6/ 14/ 1929    313.7          +40%
1.021   -.221 P=-59    11    -.035   -542   .162
Bull Market variety.  16% paper loss.
P-Indicator turned positive for 3 days (331.70) and
DJI rallied to 381.20 and then crashed to 198.70 on 11/13/1929.
-----------------------------------------------------------------------
#4
...S9...S12    9/ 4/ 1929     379.6         181/380 or +47%
1.043    .889  P=-16   -2    -.059   -370   .133
Bull Market variety.
P-Indicator stayed negative.  DJI broke support at 320
and then crashed to 198.70 on 11/13/1929.  No paper loss.
--------------------------------------------------------------------
#5
...S9...S12    4/ 2/ 1936     160.4          +7.4%
1.026   .282  P=-27   12    -.089  -231     .201
Bull Market variety. No paper loss.
DJI broke lower band and fell directly to 12% level below peak.
(...S9...S12    4/ 6/ 1936     161.9          +8.2%
1.034   .236   -37   -1    -.152  -249     .085)
-------------------------------------------------------------------
#6
...S9...S12    7/ 1/ 1959     650.2          +1.9%
1.03   .24  P=-2   38  -.062   -177  .166
Bull Market variety.  4% advance and paper loss.
P-Indicator turns positive a few days later, which typically
brings 2%-3% rally and then decline. This is what happened.
----------------------------------------------------------------------
#7
...S9...S12    5/ 22/ 1972    965.31         +5.6%
1.023  .019  P=-89   12  -.031  -2  .127
Bull Market Sell S9/S12 variety. No paper loss.
Declined directly to lower band.
----------------------------------------------------------------------
#8
...S9...S12    8/ 3/ 1972     947.7          +2.7%
1.022  .103  P=-82   -3  -.056   -2  -.131
Bull Market Sell S9/S12 variety.3% advance and paper loss.
Declined half way to lower band frm 21-day ma
----------------------------------------------------------------------
#9
...S9...S12    8/ 29/ 1975    835.34         +4.8%
1.024    .055 P=-139    23   -.102  -3  .008
Bull Market Sell S9/S12 variety. No paper loss.
Fell directly to lower band and well-tested support.
-----------------------------------------------------------------------
#10
...S9...S12    10/ 10/ 1978   891.63        +11.7%
1.02     -.219   P=-139  -19   -.136  -5  -184
Bull Market Sell S9/S12 variety.  No paper loss.
Fell directly below the lower band to well-tested support.
(...S9...S12    10/ 11/ 1978   901.42        +12.6%)
-----------------------------------------------------------------------
#11
...S9...S12    1/ 2/ 1981     972.78         +3.5%
1.029    -.264   P=-71   30   -.04  -5  -.017
Bull Market Sell S9/S12 variety. No paper loss.
Fell directly to the lower band.
-----------------------------------------------------------------------
#12
...S9...S12    5/ 6/ 1987    2342.19         +5.2%
1.021     -.328  P=-185  -9  -.079  -15  -.15
Bull Market Sell S9/S12 variety. No paper loss.
Fell directly to the lower band.
-----------------------------------------------------------------------
#13
...S9...S12    6/ 8/ 1987    2351.64                -4.0% LOSS
1.026     -.088  P=-32   23 -.045  -4   -.18
Bull Market Sell S9/S12 variety.  4% advance and paper loss.
This signal was never clinched as P-Indicator turned positive.
-----------------------------------------------------------------------
#14
...S9...S12    10/ 2/ 1987   2640.99        +30.3%
1.026   .18   P=-56    41  -.017  -7   .068
Bull Market Sell S9/S12 variety.  No paper loss.
This signal produced a decline below support that dropped extraordinarily.
----------------------------------------------------------------------
#15
...S9...S12    8/ 17/ 1999   11117.07        +6.4%
1.025  -.077   P=-425  58  -.025  -119  -.126
Bull Market Sell S9/S12 variety. No paper loss.
This signal produced a direct 12% decline below peak.
----------------------------------------------------------------------
#16
...S9...S12    6/16/2010  OPEN
1.025  -.253  P=12    2   -.018   -136   -.206
Bull Market Sell S9/S12 variety.
P-Indicator turned slightly positive.
A/D Line haa already broke above well-tesed downtrendline.
==========================================================
      Number of closed out trades =  15
         Gains = 14 Losses = 1
         Average Gain per trade = +11.4%
         There were 3 Gains of more than 30%.
         Leaving these trades off, the avg. gain was 5.1%
|
==================================================================================
6/15/2010 Peerless Remains on A Buy. DJIA-10500 Is A Reasonable
Target,
although a retreat with good
breadth would be constructive tomorrow.
Sometimes the market's own chart patterns dictate price action. That
seems
to be true now.
Symmetry is more common than asymmetry in the pattern unfolding.
The DJIA is tracing out a head and shoulders pattern by advancing now upwards towards
a right shoulder apex.
If a symmetrical head and shoulders pattern does unfold, we
should see a peak near 10600
and then some backing and filling until August when
the DJI declines sharply
after breaking the 9750 support level. Another scenario
would be for it to abort this
pattern by moving past the projected right shoulder
apex, as seen in DJIA's chart
below.
There have been 7 longer term and symmetrical head and shoulders patterns since
1929. In one case,
1997, the pattern was briefly aborted as the DJI advanced past
the right shoulder's
apex. In 4 (1929, 1930, 1946 and 1962 of the 7 cases the DJI
quickly fell far below
the minimum price objective when it broke its neckline. In two
cases (1971 and 2000),
the DJI reached "only" its minimum
price objective. The
minimum price objective is calculated by taking value of the head and shoulder
pattern's head and
subtracting the price at the neckline, drawing a line straight
down from the pattern's
high and then subtracting this amount from the neckline's
price where the
breakdown occurs. Currently, the present pattern's high is about
11200 and the neckline
is at 9800. That means a minimum price objective of
1400 points below the
neckline, about 8300-8400, would be set up by a break in
the neckline.
In one case,
1997, the A/D Line stayed strong throughout the pattern. The Accumulation
Index and
P-Indicators were mostly positive throughout the formation of the
right shoulder as
this pattern developed. Significantly, this was the one case when
the DJI closed
above the upper right shoulder's apex and thereby aborted the pattern,
with the result
that the DJI made a new high before falling sharply after multiple
Sell S12s.
The NYSE A/D Line
is clearly rising in our present case. It is much stronger than
it was on
the right shoulder. This suggests the DJI may surprise people on the
upside and
get back to 11000. In support of that, Peerless saw a new Buy B14
again
today. This is the fourth since the decline started. Unfortunately, we may
see a Sell
S9 or S12 if the DJI keeps charging upwards. At 10404.77, the DJI is
2.4% over
its 21-day ma with the Accum. Index still -.009. Bullishly, the P-Indicator
has turned
positive and now stands at +10.
What is happening in the Gulf trumps everything, including the bullish NYSE A/D Line
and the FED's
efforts to keep interest rates low and prolong the stock market rally.
Obama tonight
repeated what BP has said, that 90% of the blow-out Gulf well's new
escaping oil will
be captured in a month. This would be wonderful. But it may
be that Obama is naively accepting
BP's optimistic predictions since the estimated amount
of oil coming
from the well has now been raised to 60,000 bar./day from the 5,000 bar./day
that BP
originally said. Either BP cannot be trusted in what they say or the well is
gushing more and
more each day. That would be very bad. There are reports that
the sea-floor may
be cracking along with the well-hole itself. The 20" diameter pipe
was just too wide
for the pressure their well hit. The history of oil/gushers
shows that
many of them have
gone many, many months without being stopped. The USSR had
to use a nuclear
weapon in 1969 on a violently leaking gas well. Watch what
professionals are
doing.The CLosing Power for BP is still in a steep down-trend.
The worst is not
even in sight. I fear.
Will the market
rally from here short-term? I believe the stocks best traded with the
5-day Stochastic
offer help here. See STOCH5 on our data page.
155 are on 5-day Stochastic Buys
127 are on 5-day Stochastic Sells
The biggest ETFs'
Closing Powers improved a lot today.
DIA's CP is zig-zagging upwards now. The DIA's best
trading system now,
a 14-day
Stochastic is still on a red Buy.
SPY's best trading system now, a 5-day Stochastic is on a red
Sell, but its CP
has to be
considered zig-zagging upwards.
QQQQ's best trading system now, a 5-day Stochastic is on a
red Sell. Its CP
has come to the
apex of its downtrend- and its uptrend lines.
MDY's (Mid-Cap) CP is zig-zagging upwards now. It's
best trading system now,
a 14-day
Stochastic is still on a red Buy.
IWM's
(Russell-2000) CP is zig-zagging upwards now. It's best trading system now,
a 14-day
Stochastic is still on a red Buy/
Tiger's Index of 54 Foreign ETFs is on a red 5-day stochastic
Buy. Weakness
tomorrow will switch it
to a Sell.
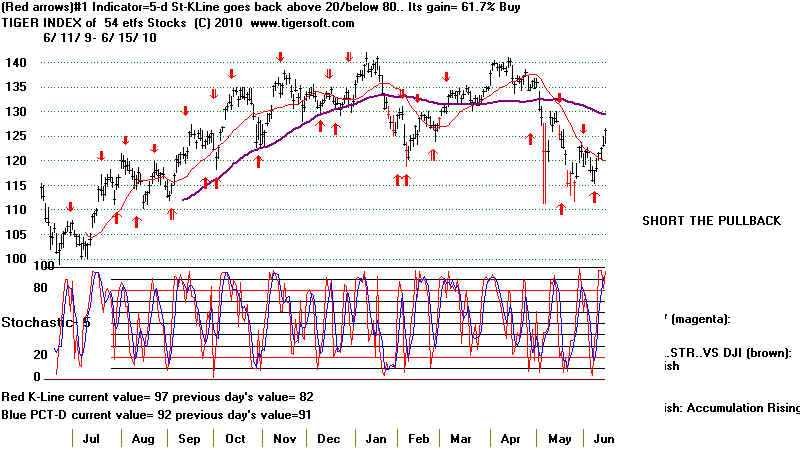
Big Symmetrical DJIA Head and Shoulders:
1929-2010
#1 1929 3.5 months
All internal strength indicators were very weak
Neckline broken at 318. 200 reached in 3 weeks.
DJI dropped well below minimum
price objectives.
-----------------------------------------------------------------------------
#2 1930 4.3 months
Right shoulder internal weakness
A/D Line fails to reach level of left shoulder's A/D high.
P- and V- Indicators were much weaker on right shoulder than left shoulder.
Start of 1930-1932 bear market.
DJI dropped well below minimum
price objectives.
-----------------------------------------------------------------------------
#3 1946 3.5 months
Right shoulder showed much
weaker A/D, P- and AI-Indicators.
After DJI broke neckline, DJI rallied back up to declining 65-dma and then fell. Neckline
was at 200.
DJI fell from 195 (neckline) and
decline reached 165 in 2 months, well below minimum price
objective.
-----------------------------------------------------------------------------
#4 1962 9 months
Right shoulder weakness...including
lower volume than on head.
Neckline was at 680. In 2 months
DJI fell to 537, far below minimum price objective.
-----------------------------------------------------------------------------
#5 1971 3.5 months
See chart just below
Right shoulder weakness...including
lower volume than on head.
Neckline was at 900.
DJI reached minimum downside
objective at 840 in 1.5 months.
DJI rallied back to 920 in a month and then fell to 800 in 2.5 months.
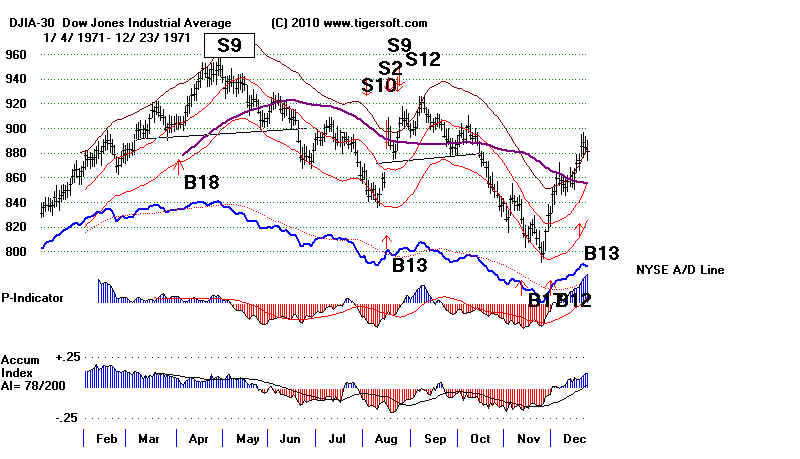
----------------------------------------------------------------------------
1990 2.5 months (asymmetrical)
Weakness internally. Sell S9. 2900 (neckline) to 2375 (low) decline
----------------------------------------------------------------------------
#6 1997 3.5 months PATTERN ABORTED AS DJI RALLIED ABOVE RIGHT SHOULDER APEX
See chart just below.
A/D Line STRONGER on right shoulder
P- and AI mostly positive on right shoulder.
DJI aborted head and shoulders pattern by going past 7900.
Subsequent S12s and quick head/shoulder patterns brought decline
from 8200 to an intra-day low of 7000.
DJI reached minimum downside
objective
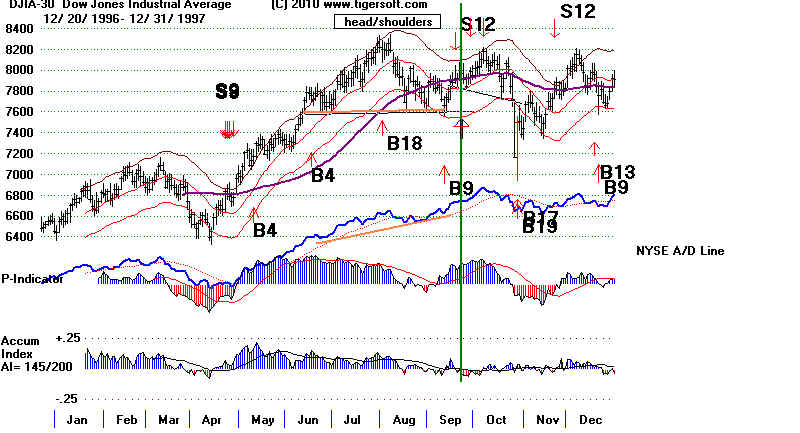
----------------------------------------------------------------------------
#7 1999-2000 2.8 months
very weak internals
DJI quickly fell to 9800 low from neckline at 10600.
DJI reached minimum downside
objective
Although DJI rallied back above falling 65-dma, this was the start of
2000-2003 bear market.
---------------------------------------------------------------------------
2006 2.8 months (asymmetrical)
DJI declined from 10900 (neckline) to 10700 (low)
Right shoulder weakness...including lower volume than on head.
Pattern was aborted when DJI rose above 11400
---------------------------------------------------------------------------
2007-2008 7.5 months (asymmetrical)
DJI declined from 12700 (neckline) to 11700 (low)
Right shoulder weakness...including lower volume than on head.
Minimum objective was not reached for 6 months from neckline break. |
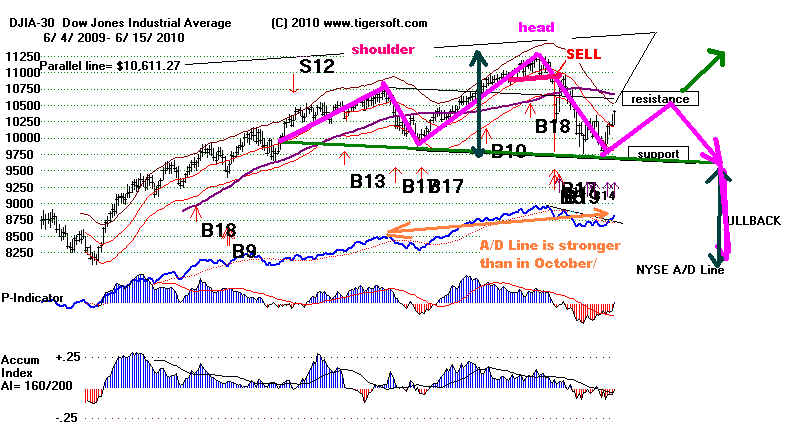
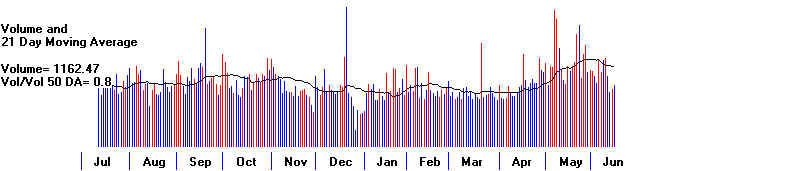
===================================================================================
===================================================================================
6/14/2010 Peerless Remains on A Buy. Short-Term Sell From
TigerSoft's
5-Day
Stochastic on SPY and QQQQ. DIA. IWM and MDY remain on Buys. As long
as DJI stays above 9800 or below 10700, using the TigerSoft Optimized Stochastic
Buys and
Sells Should Work Well for traders. Our Stocks' Hotline remains short
the
drilling stocks, BP, DIG and HAL. We are long only a few stocks. It seems best
to trade
the most bullish and bearish stocks, as Tiger picks them out, using the
automatic
short-term Stochastic red signals.
Here are some charts of stocks showing new
Red Stochastic-5 Sells.
Below are
the charts of the
DJIA ( Intermediate-Term Peerless-Buy),
SPY( Optimized Short-term Sell),
QQQQ (Optimized Short-term Sell),
DIA (Short-term Buy),
IWM (Short-term Buy)
and MDY (Short-term Buy)
TigerSoft offers data subscribers the data for the stocks making up the 10 biggest
positions
for
each of the 40 Fidelity Select funds. These are carefully vetted stocks, for the
most part.
The
Tiger chart of them gives a good representation of quality stocks. Its chart (shown
below)
shows the narrowing trading range the market has been in. It also shows a new red
SELL,
from the 5-day Stochastic, the best trading system for this group of stocks for the last
year.
Index for 10 biggest positions for each of the
40 Fidelity Select funds.
New Red Sell
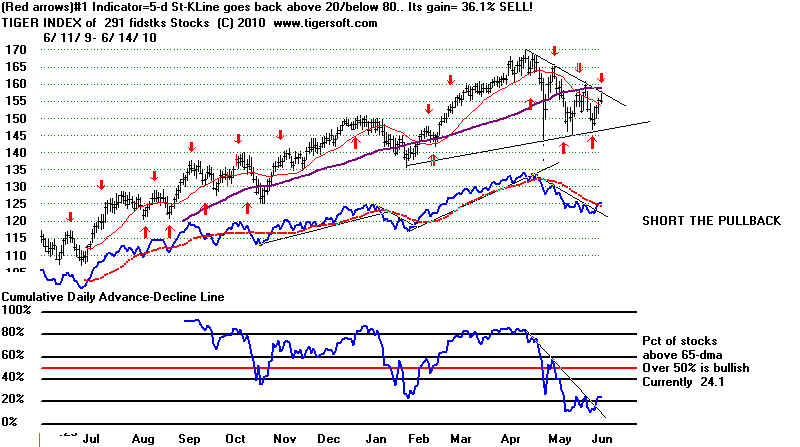
New Red Sell for Gold/Silver Stocks
from Short-Term Stochastic
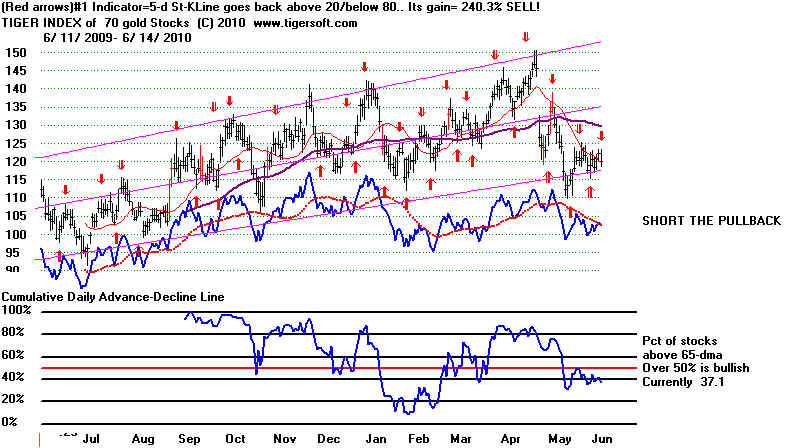
=====================================================================================
=====================================================================================
6/11/2010 Peerless Remains on A Buy.
Until the DJIA breaks out above 10750 (the apex of
its right shoulder) or breaks down below
the 9750 (neckline), we probably should use trading
range tools. The best tools are the trends of the CLosing
Power, the A/D Lines of different groups of stocks
and the 5-day Stochastic. In this hotline, see
that each of these tools now are short-term bullish.
The world's market move together as never before.
Just below are the TigerSOft charts of all foreign
(non-USA) ETFs and the Tiger Index of Chinese
stocks. Note the best trading system now for
the ETFa is a 5-day Stochastic and the second
(Chinese Stock) features highly predictive A/D Line
trendbreaks. We will report on these nightly
until there is a resolution in the battle between Fed
support for the market an all the bearish
news hitting it, especially as the BP oil volcano
destroys the American SE coastline. BP is the
world's 4 largest corporation. Tuesday Obama
will announce he wants BP to set up a special fund
to pay the hundreds of thousands economically hurt by
the spillage. Will it be enough? Probably
not even close to enough! Rolling Stone
has a new article out which excoriates the Obama Administration
for letting BP get away with "murder".
How BP's stock behaves will tell much of the story about
who will pay for this calamity, and long before the
public finds out.
A/D Line Downtrend-Break for Tiger Index of 54 Foreign Stocks
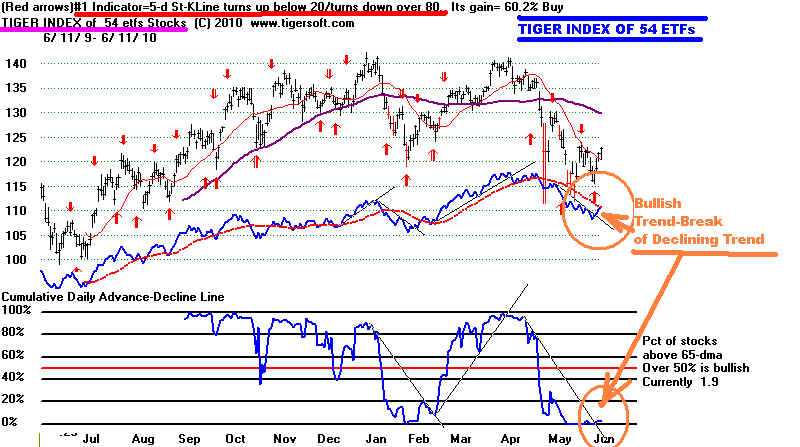
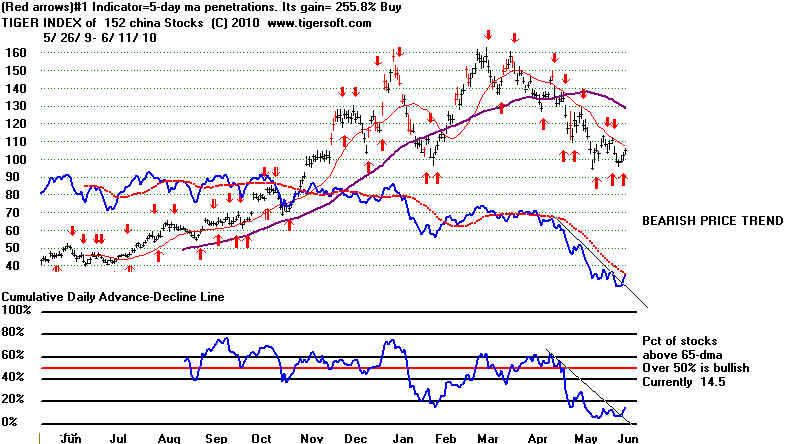
Friday's Bullish Breadth
Though volume was low, the NYSE A/D Line today broke
its downtrend. This usually shows
that the support level will hold, though a fifth
successful test would actually be desirable. A rally
to 10500-10700 now seems probable. The DJI must
now deal with the resistance of its
falling 21-day ma. Notice the number of
reversals downward from 19250, where the DJI
closed today. Barron's says this weekend that
we are in a bear market. So, does Richard
Russell. That seems premature, though a failed
rally to 10500-10700 would be quite bearish,
as would a closing below 9750. Considering that
the US has potentially suffered a trillion
loss if BP oil thouroughly fouls up a thousand miles
of the South East, the DJI decline shows
great resilliance, so far.
In the charts below you see the NYSE A/D Line Downtrend Break. This is bullish.
The DJIA is, however, now at the resistance of its
falling 21-dma and since Friday's volume was
light, buyers are very cautious and the flat
resistance resistance at 10250 may be a barrier
a little longer while non DJIA-30 stocks show if they
have the strength to carry the market
higher. I am made optimistic by the breaks in
the Adv-Decl downtrends of various groups
of stocks. See the A/D Line chart of the SP-500
(three charts down.) Tiger users will want
to produce these Index charts and the A/D Line for
the groups of stocks that they are
trading., 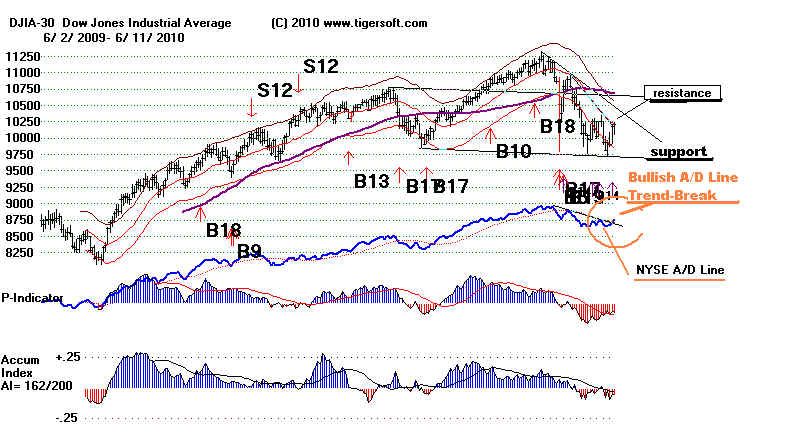
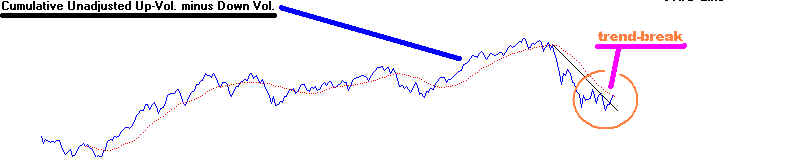
Red down volume is much
higher than up-day volume.
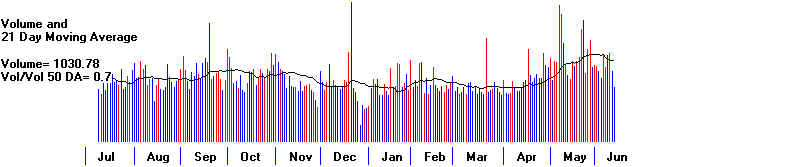
Closing Power Downtrendlines
have been bullishly broken for the DIA and SPY,
but not the QQQQ. DIA's 14-Day Stochastic (its best system for last year) is not
yet over-bought, though the SPY's 5-day is.
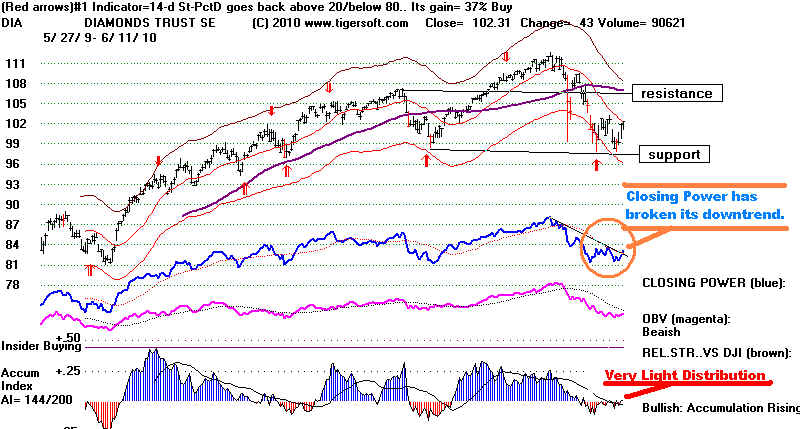
Pct-D is only 61.
It needs to reach 80 and
then drop back below 80.
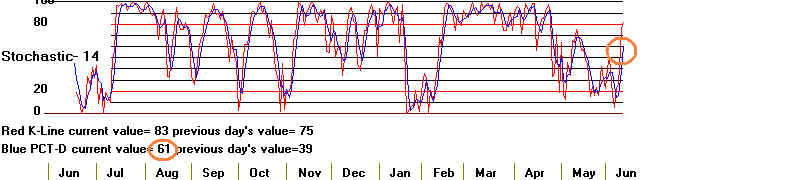
A/D Line chart of the SP-500 has bullishly broken its downternd
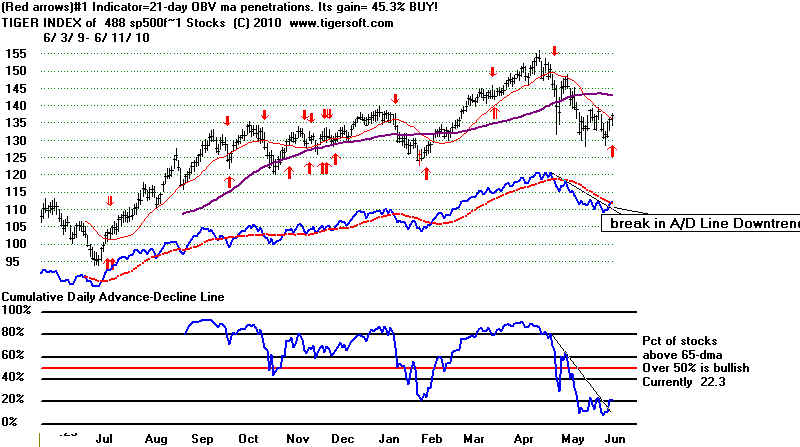
TigerSoft Index of 292 Trading Stocks
These are stocks whose
optimum trading system is a 5-day Stochastic.
(These may be downloaded from our TigerSoft Data page as STOCH5.exe)
Presently 243
are on Buys and 39 are on Sells.
Down-Trend of A/D Line of these
Trading Stocks is broken.
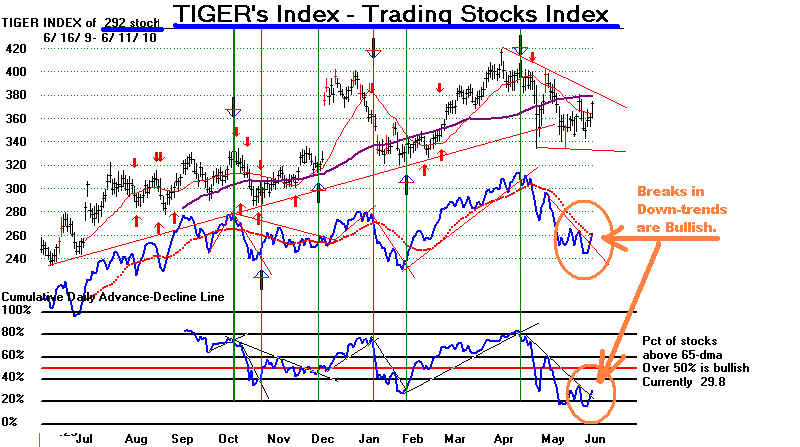
Look at "Bullish" Stocks in STOCH5
from TigerSoft's
Data Page for Trading Ideas on Long Side.
====================================================================================
TIGER/PEERLESS HOTLINE
6/10/2010 Peerless Remains on A Buy. Today brought another
Peerless Buy B14,
the fourth since
May10th. See the history of
past Buy B14s here, So many bunched Buy B14 signals
have never occurred
before. In the two cases where these signals are only three days apart,
August 1982 and January
1987, big rallies followed immediately. Here each of the Buy B14s are
separated by more than
5 days, at the least. In the one earlier case where two bunched Buy B14s
were three weeks apart,
in August 2007, the second B14 was barely profitable and the DJI was at
a major top.
DJIA Support at 9800 and Resistance at 10700
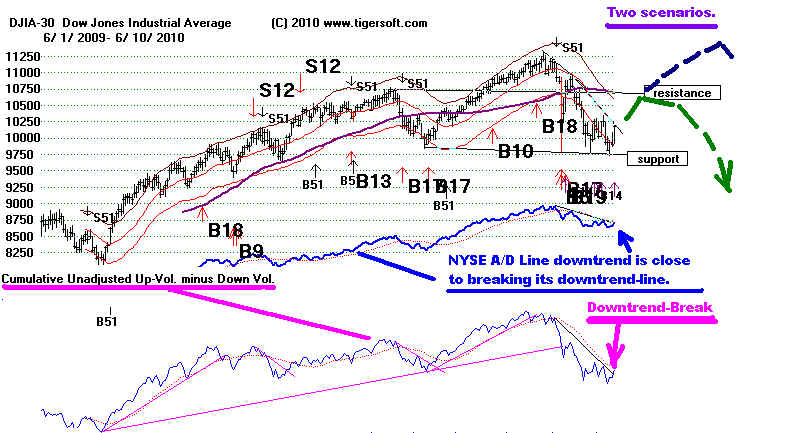
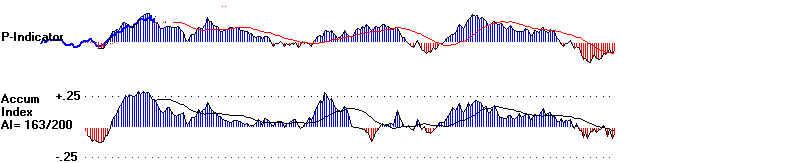
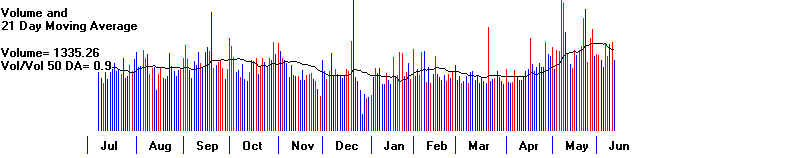
On a
much more positive note, there were no Buy B14s in the beairsh period from 1928 to 1941.
In addition, June -
early September Buy B14s are distinctly bullish. From June to September 6th,
6 of the 8 Buy B14s
gained more than 21% when closed out at the next Peerless Sell.
Buy B14s by Month: 1928-2010
Month
Number of Cases Avg. Gain
----------
-------------------------- ---------------
January
5
7.5%
February
0
March
5
2.9%
April
2
26.9% (49.5, ,043)
May
2
3.6%
June
3
29.0% (30.3, 55.5, 1.2)
July
1
15.5%
August
3
17.4% (27.2, 21.6, 3.5)
September
3
6.6%
October
3
3.0%
November
1
2.5%
December
0
----------------------------------------------------
28
10.6%
I have been saying
that we should see a rally to 10500-10700 if 9800 holds and the
NYSE A/D Line downtrend is
broken above. The A/D Line has reached its downtrendline.
Another good day will break
this line. But Volume declined today. That suggests today's rally
was very short-term and
computer-ontived. The Closing Power downtrendlines for the
key ETFs (DIA, SPY and QQQQ)
are each extant and unviolated. A fifth test
is usually the most reliable
point of reversal from a flat support level. We have only had four.
So, this rally may fizzle out
like the last few have.
5-day Stochastic Buys Operative for SPY and QQQQ
My fear is that the buyers
below 10000 were mainly very short-term traders using ETFs.
And in fact, for the SPY and
QQQQ, as you can see in their TigerSoft charts, the best trading
systems for them now (as long
as the key support holds) are Buy and Sell signals based on 5-day
Stochastics. Each of
the key ETFs are on Buys. They cannot easily give Sell signals tomorrow.
That may help the rally
continue and suggests the short-term buyers want still higher prices, nearer
10500.
SPY: Red Stochastic Buy but
still declining Blue Closing Power
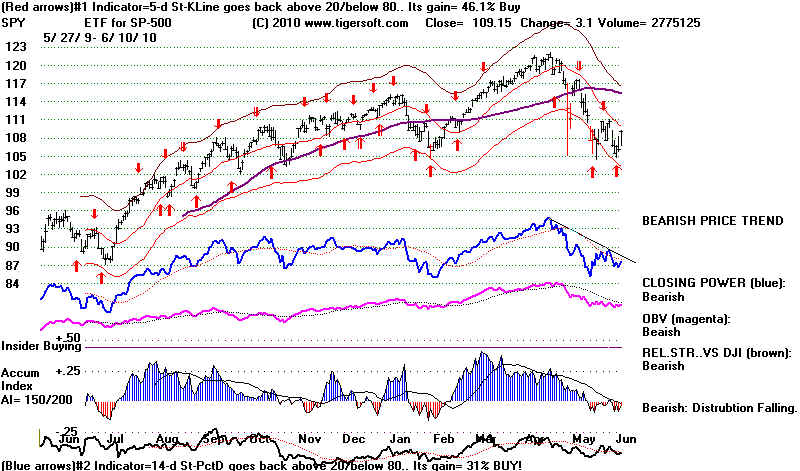
QQQQ: Red Stochastic Buy but
still declining Blue Closing Power
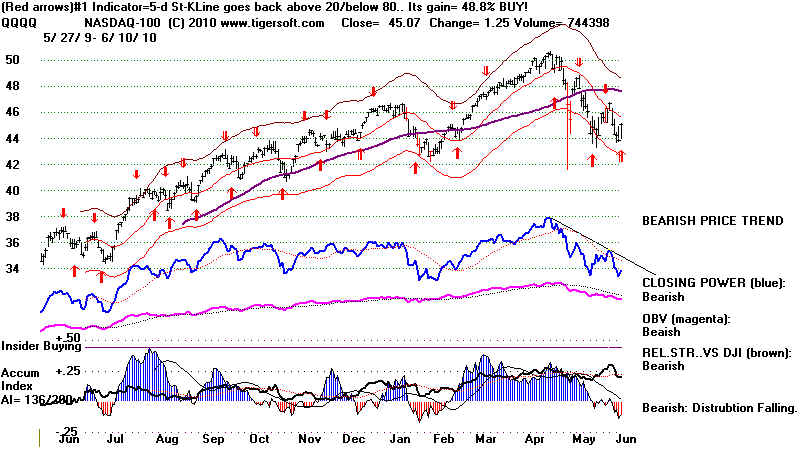
TRADERS, WATCH FOR UNEXPECTED NEWS
AND THEN TRADE IT WITH THE CLOSING POWER TREND
I keep emphasizing the
trading advantages insiders and professionals have because they
have much more timely
access to key information about most stocks. But sometimes that
is clearly not so.
The sudden and disastrous explosion on BP's deep water oil rig was an
exception. This
was totally unexpected. And it was disastrous. When something like this
happens, sell the stock
short, knowing that you can watch Tiger's Closing Power and see
when it is best to
cover the short sales. You can also use the high volume flags to find the
stocks trading with
unusual volume and then trade their breakout or breakdown trends
with CLosing Power.
But be careful of most news stories, like Novertis' MS drug's FDA
approval today, because
much of it has already been anticipated.
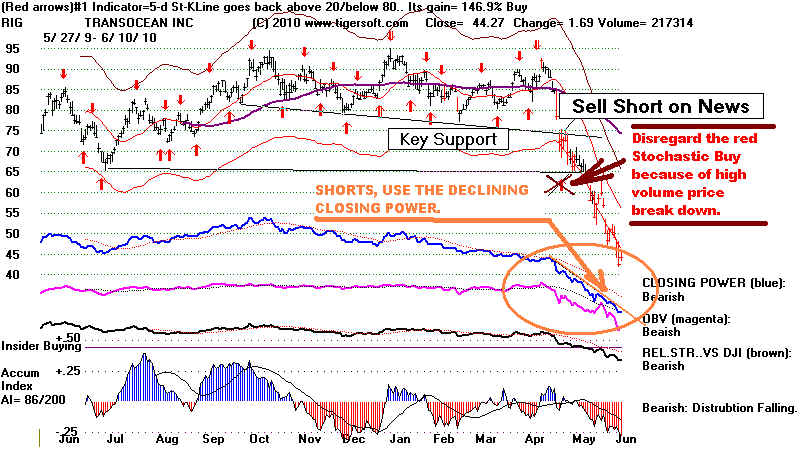
WHAT STOCKS MIGHT BE LEADERS HERE?
When Peerless turns
bullish, it often works out well to look for the highest Accumulation
and most bullish stocks
whose Closing Power has just broken its downtrend. These stocks
will be presented this
week in the Elite Service. If new highs were more numerous, buying
confirmed B12 or B24
breakouts would also be suggested. Another approach is to see which
stocks and stock groups
are leaving the gate first, i.e. which ones are up the most, say in the
this week, for the last
four ( 4 ) days. To do this with the SP-500 stocks, use PEERCOMM +
Older Charting (second
button down on right) + Ranking Results + User Set Ranking + 4 + 1.
This shows the best
performing stocks are:
Rise IP21 Commentrs
TIE Titanium Metals 19.24 +13% .04
new high - see chart
IP21 is too low for me to recommend.
GCI Gannett
15.42
+12% 0 below
65-dma
AVB real estate 102.94 +11% -.04 Closing
Power broke its downtrend.
AIV real estate 21.76
+10% -.12 Closing
Power broke its downtrend.
BHI drilling
42.42 +10% -.08 Closing Power broke its downtrend.
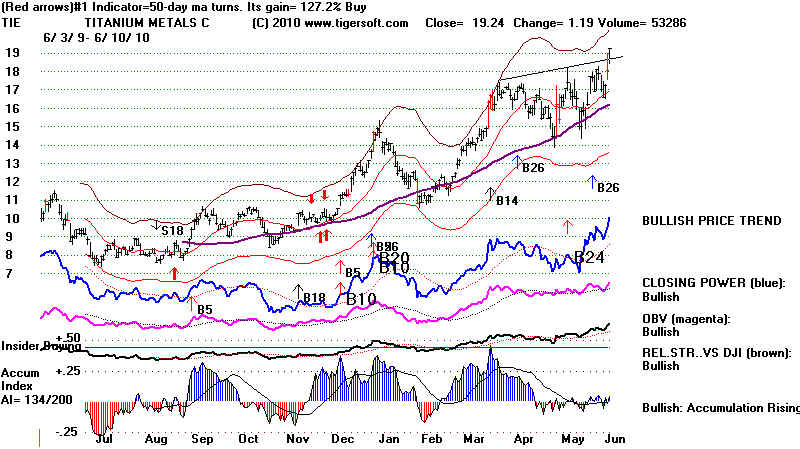
=====================================================================================
6/9/2010 Peerless Remains on A Buy. But A DJIA CLose below 9750
Will Probably
Bring An Automatic Sell S10. It Is Not Clear What Stocks Can Lead A Rally Now.
While the number of
stocks rising was 73 greater than decliners on the NYSE, Down Volume
today was greater than
Up-Stocks' Volume and the DJI fell 40 points closer to the edge
of a "Sell S10
cliff" below 9750. A line drawn through the 4 DJIA
lows since January all line
up now at 9750.
This is the well-tested support line that "must" hold. As long as it
holds,
the Peerless Buys may
still work out.
A bearish combination
of technical factors is now present. (1) The DJI has rallied
from 6500 to 11250
in 12 months and is
ripe for profit-taking. (2) One can construe two head and
shoulders patterns
in the last 6 months.
The first is the compact and symetrical pattern right at the top. The second
is asymetrical in
amplitude and duration, but does have the 9750-9800 neckline we are so worried
about now. (3)
Very bearish, going back to 1915, are DJIA breakdown-declines of
more than 13%
down from the recent
highs after a strong advance with a head and shoulders pattern also
present. See the
8 cases: http://www.tigersoftware.com/052HL/Breakdowns/index.html
In 6 of the 8 cases,
the DJI fell more than 10% more.
Of course, a lot
depends on whether BP can soon block its undersea oil volcano in the Gulf.
But, the way BP, RIG
and the Drilling Stocks generally are falling is not constructive, to say the least.
Bearishly, there are
other real problems facing the financial markets. Europe and Britain seem ready to
start austerity
policies in the middle of a deep recession. In the early 1930s this brought more
high unemployment,
extreme social polarization, fascism and dangerous nationalism. Bernanke's
magnanimous supply of
cheap money to banks will soon be ending, I predict. His growing numbers
of critics quite
properly say that credit is still very tight for Main Street and small businesses
and his policies have
clearly not restarted the economy as a whole or caused a resurgence of new
private jobs.
Stopping a free-fall of the markets is a lot easier for the FED than bringing about an
economic recovery. Only
the government can put young people to work in the millions. Only
the government can
retrain a whole generation who have permanently been displaced by
cheaper overseas
workers. On all fronts, Obama is too cautious to be another FDR. Without
that leadership, a DJI
close below 9750 must be expected to bring a new round of selling
of stocks. I
seriously doubt if Bernanke will be able to stem a wave of selling in stocks
with continued low
interest rates for banks. The downside volume is just too heavy. So, a DJI
drop to 8000 would seem
the most likely result if the DJIA closes below the 9750 well-tested
support.
If you are looking for
a haven in the event of a breakdown, Gold is the best I can find. See
the previous short sale
recommendation for the last two months. And sell all stocks if 9750
is closed below.
Declines of More Than 13% After DJI Has
Made New HIghs
with Completed
Head and Shoulders Patterns
After the dates
appear the DJI levels from the neckline support
to the next DJIA
low.
1.
December 1916, 98-88 after 13% level broken
2.
December 1919, 105-90 immediately after 13% level broken.
3.
October 1929, 320-200
4.
June 1930, 260-160
5. June 1950 (only 14% decline),
6.
October 1997 (only 15% decline),
7.
July 1998, 8700-7700
8.
June 2001, 10800-8100
6/9/2010 Charts of DJIA, DIA, QQQQ, SPY, RIG, BP, Gold DJIA

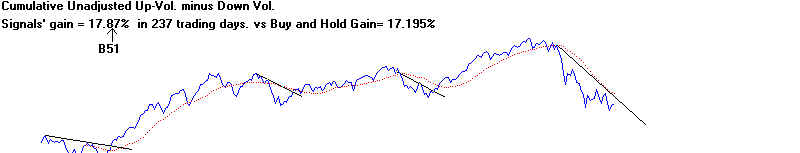
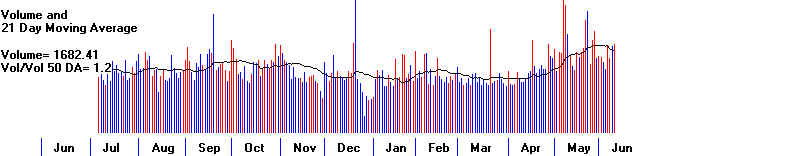
QQQQ
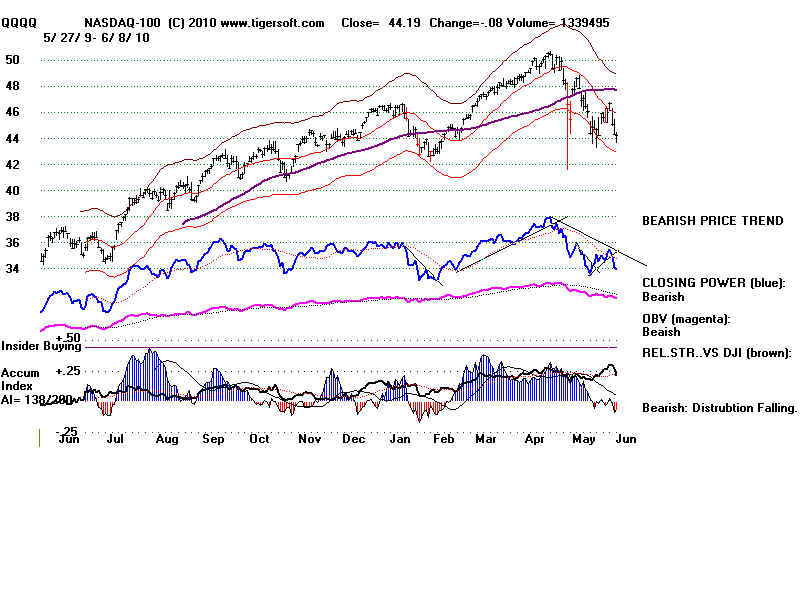
SPY
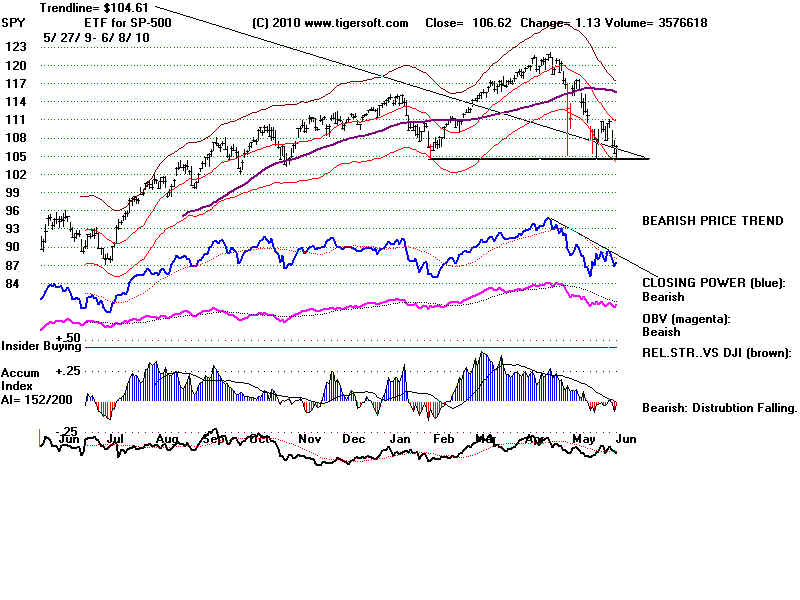
RIG
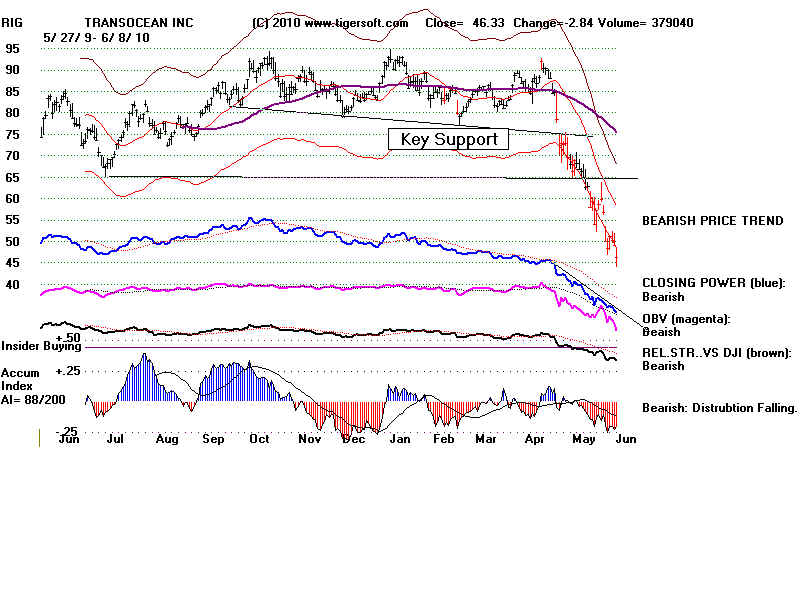
Tiger Index of 12 Oil/Drilling Stocks
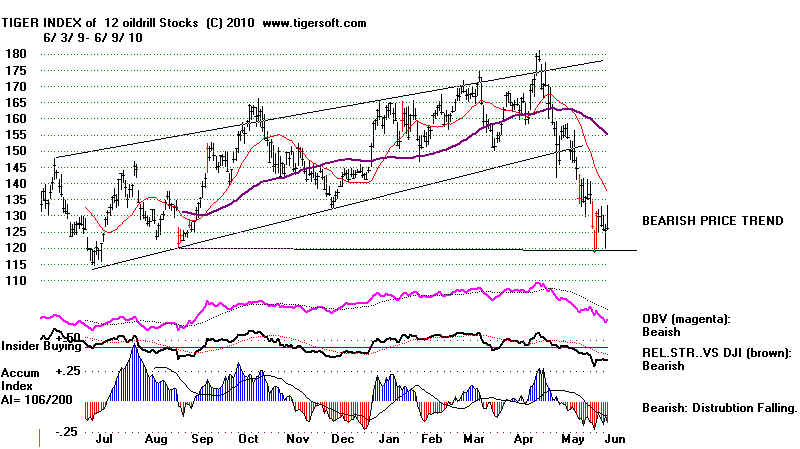
Gold - If Gold gets past 1250, 1300 should quickly
be advanced to.
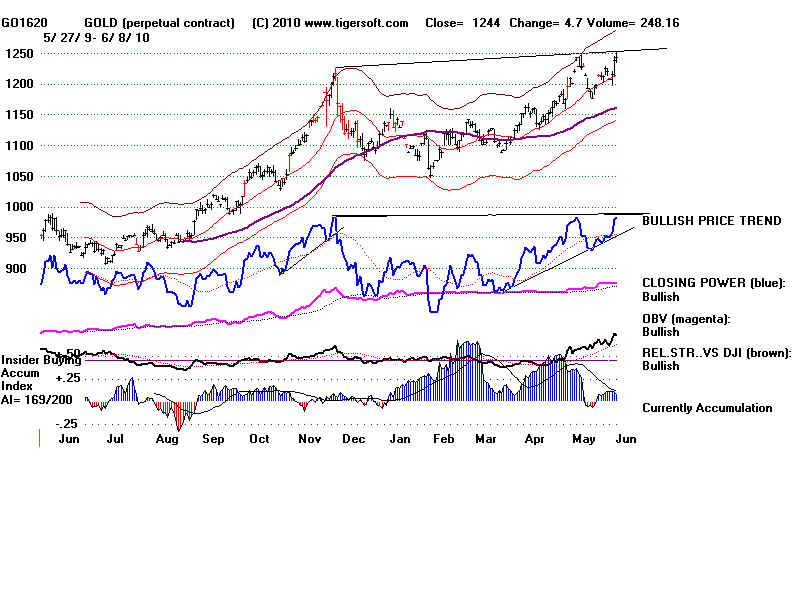
===================================================================================
===================================================================================
6/8/2010 Peerless Remains on A Buy. But A CLose below 9780 Will
Probably Bring
An Automatic Sell S10.
Such A DJIA Support Failure There Would Be Judged A Sell S10.
I am forced to note how
each recent rally has ended much sooner than the previous rally.
And I have to admit
that the specu;ative bubble in lower and lower priced stocks has a
strong historical
tendency to be followed by a big decline (1968, 1976, 1980, 1999-2000). But
we certainly can hope
BP will succeed in blocking the underwater volcamo of oil they have
unleashed on the
Gulf. And we can speculate that the FED will not soon change their game-plan
of low interest rates
until there are more signs of an economuc recovery.
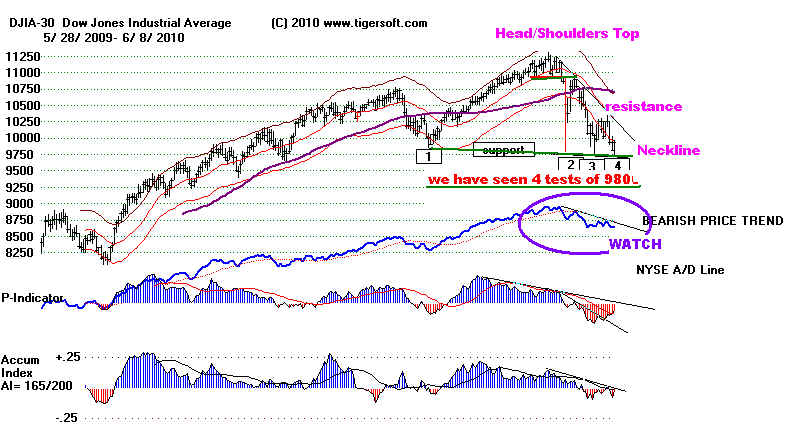
Cum. Up-Down Vol is falling.
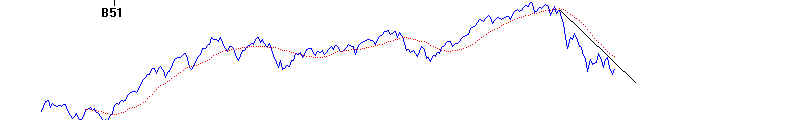
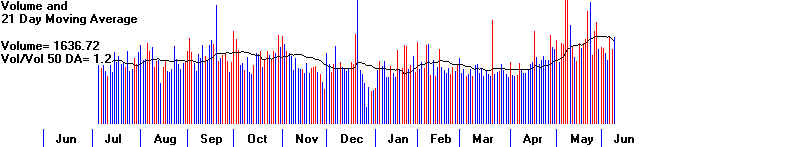
Well-tested
horizontal support lines, such as we now see at 9800, are very important in predcting
market moves.
Prices typically move back and forth between support and resistance levels
until there is a
decisive brekout. To be "well-tested" the support levels need to be tested at
least
3 times, each
test separated by a week (5 days). Zones of support (and resistance) are also
important,
as long as the
difference between the highs and lows of the zupport zone are not more
than 2% apart.
There is something about the fifth test that seems to give it a special
power to produce
a rally. Fifth tests of horizontal support were considered
judged Buy B1s
in the original
(1981) version of Peerless. The NYSE A/D Line need not be congruent or
as strong as the
flat price line. Flat support levels are more likely to hold if there has previously
been a strong
uptrend and there is also a flat and parallel resistance line. A
head and shoulders
pattern is more
likely to bring a breakdown, as is an irregular top. See many of the past cases
where the DJI had a flat and well-tested support
line after a strong advance. A rally from
well-tested
horizintal support often was seen after a decline of 8.5% to 12%. It also
often
occurred late in
a Presidential Election year, in October or November. A close
clearly below the
well-tested
support was considered a Sell S10 in the original Peerless. We have tried to
automate this
Sell S10 Signal, but would not hesitate to judge it if necessary.
Traders
should now be watching the Closing Power (CP) for the DIA, SPY and QQQQ. They are
still
downtrending. Until that condition changes we have to be concerned about a violent
price
breakdown below
9800. When the CP downtrend ends, especially if there is also an end of the
NYSE A/D Line and
Cum. Up-Down Volume Downtrend-Lines, we "should" see a rally to
10500-10800. But because each rally has revently ended at a lower level for the last
month, we
have to be
concerned that we are seeing the unfolding of a bearish descending and flat bottomed
price
pattern. In these circumstances, let's wait also for the NYSE A/D Line downtrend to
be
violated to
Buy. This tests well. Even a very good rally tomorrow would
probably not break the
A/D Line
downtrend.
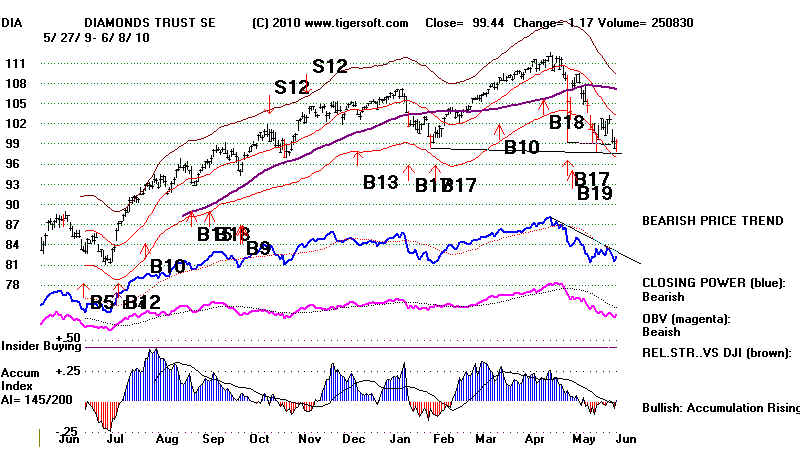
===================================================================================
===================================================================================
6/7/2010 Peerless Remains on A Buy. But A CLose below 9780 Will
Probably Bring
An Automatic Sell S10.
Such A DJIA Support Failure There Would Be Judged A Sell S10.
We do not want the DJIA to
drop below 9780, thereby simultaneously breaking a major well-tested
support, a neckline in a head
and shoulders pattern and its 12%-down-from-highs level. This
happened in 1946 when there
was no obvious explanation in the news. (Congress actually
investigated the
decline because it seemed to signify stock market manipulation.) Unlike in 1946,
our current market
environment has lots of bearish news to scare and panic investors. Unlike
in 1946, we have just had a
speculative low-priced stock bubble in 2009-2010 caused by very low
interest rates amd the
governmenmt guarantee of big banks, no matter how badly they invest
their customers' money.
And unlike in 1946, the current DJI is still 11x higher than it was in 1982.
The current market has a long
ways to fall before it somes to major support if 9800 fails. The
next closet support below
9800 is at 7000!
See below also how
dramtically the DJI fell after horizontal support failures in 1940, 1962 and 1971.
The latter two also featured
head and shoulders patterns.
1946
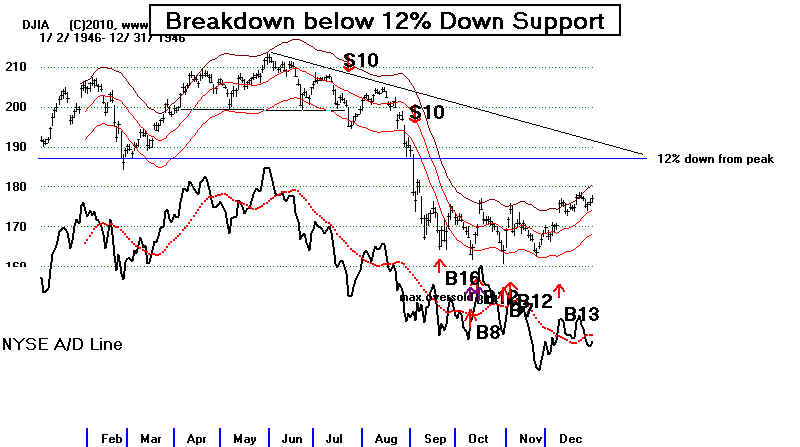
1940
The 12%
Down-Line-from-Peak also played a role in the Sell S10 of 1940.
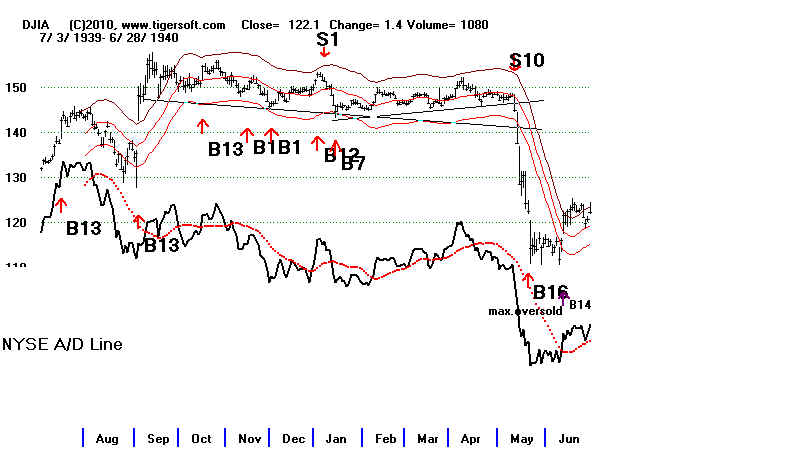
1962
To see the importance of
broken support where a head and shoulders pattern has appeared, look
also at the Peerless charts
of 1962 and 1971.
1971
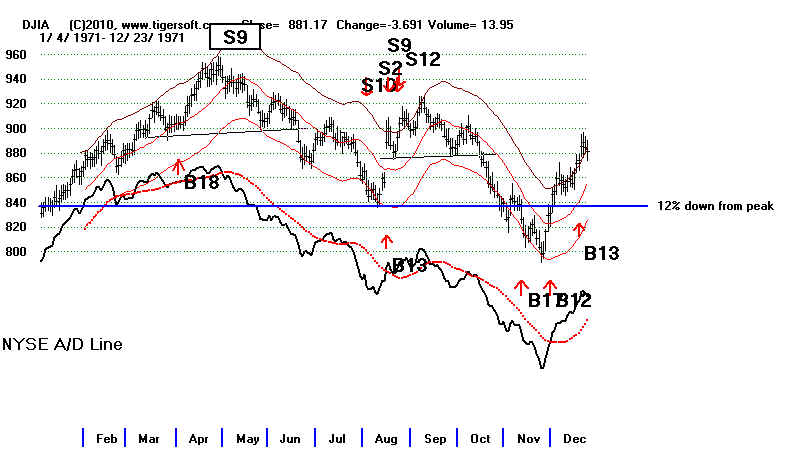
Market Conditions in June 2010
The DJIA needs to test
successfully the 9800 level more thoroughly to rally. Historically as many as 9
separate tests are
sometimes needed before than can be a rally. The A/D Lines, CLosing Powers and
the Cumulative NYSE
Up-Volume minus Down Volume are all bearishly falling. A brief rally
seems likely.
Spot Silver is up .22. I don't think it would be up so strongly if the general
market
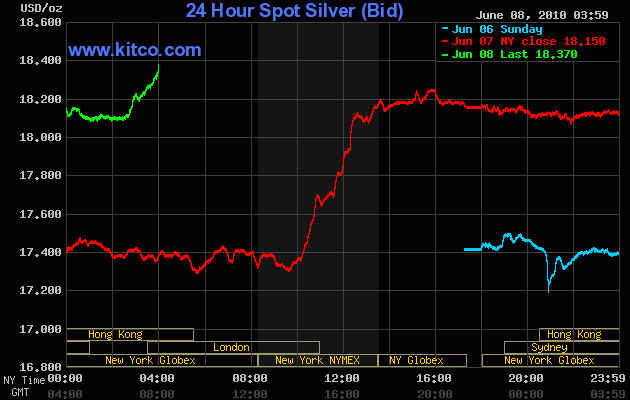
( http://www.kitco.com/charts/livesilver.html
)
were about to fall
below major support and also fall below the key 12%-down-from-DJIA-peak level.
The same thing is true
of Crude Oil,
whose futures are up +.56.
Today, the DJI broke
below 10000. Selling pressure was not as overwhelming as Friday.
Bernanke spoke of the
revovery gaining traction. I have no idea what he is referring to.
Unemployment is not
coming down, except for public jobs, which are generally considered
illegitimate by 40% of
the electorate. The stock market's weakness has been pronounced
and unrelenting since
the BP-Oil Disaster in April: all rallies have quickly failed and trading
volume has only risen
on the down-days. True, Crude Oil is still above its December lows,
but its decline could
easily continue. Its chart shows heavt red Distributioin. True, Gold and
Silver are challenging
their 12-month highs and are out-performing the DJIA by more than 20%
over the last 50
trading days. But this often happens at major market tops. The EURO has
shown almost no ability
to rally and could easily breakdown and drop further. At 1.195, I reckon it
has .02 to .03 further
downside potential before it finds November 2005 support at 1.168.
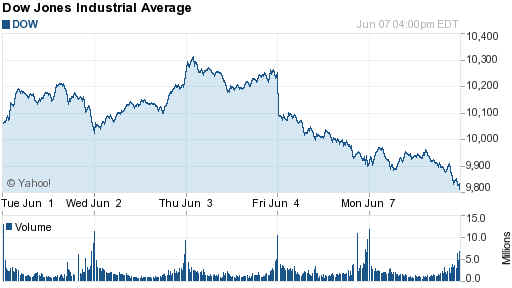
See the ket short-term
downtrends in the DJIA and DJIA below. These I have circled in
BLUE. These downtrends
must, by definition, end before a rally can begin.
Current DJIA and A/D Line and Cumulative
Up-Down Volume
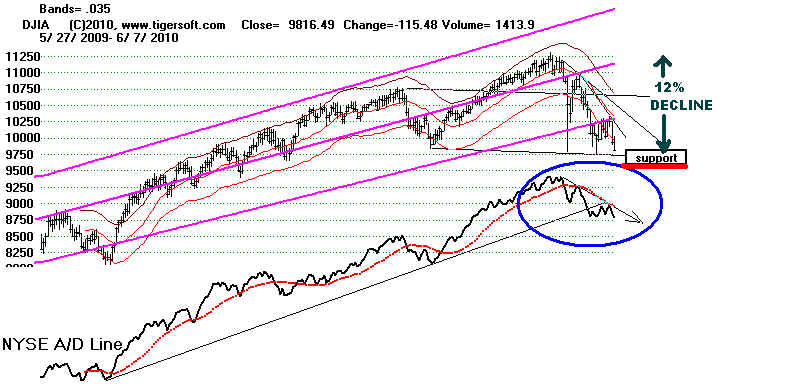
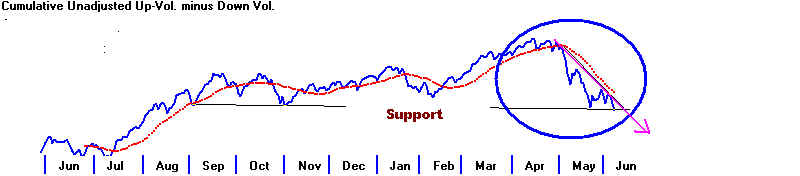
DIA and Its Falling Opening and Closing
Power
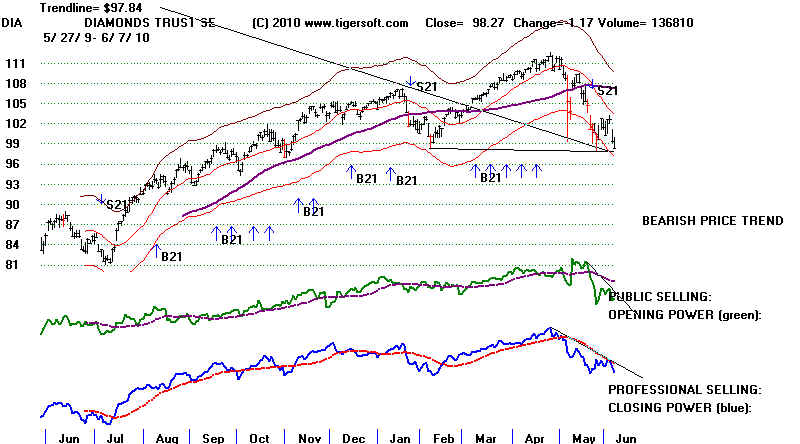
1986 DJIA and A/D Line and Cumulative Up-Down
Volume
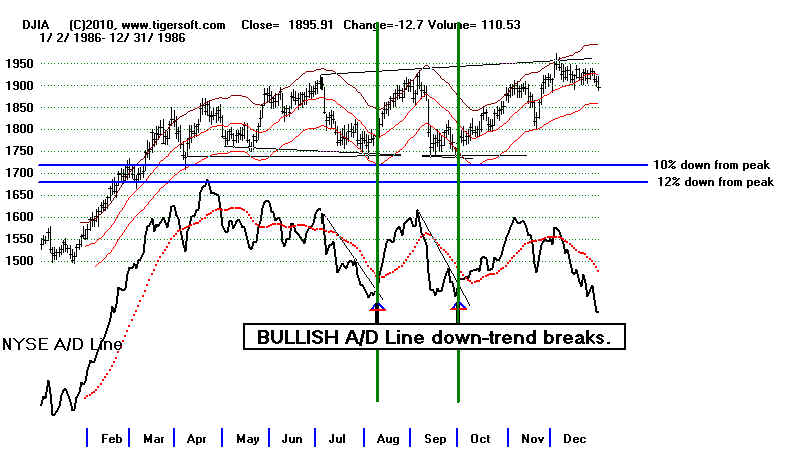
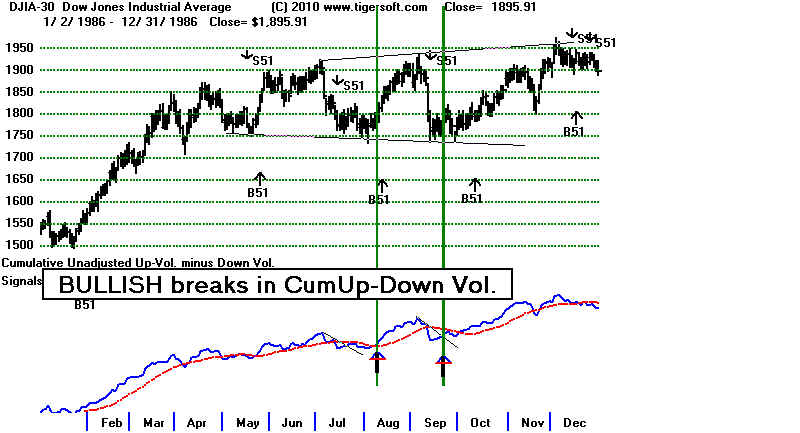
===================================================================================
===================================================================================
6/4/2010 Peerless
Remains on A Buy. 9800 Probably Needs More Testing.
When The NYSE A/D Line
Downtrend Is Broken, 10500-10700 Should Be Reachable.
A Close below 9750 Would Be
Distinctly Bearish. See Some of the Key SP-500 Stocks' Charts
below.
For now see "Review Charts" - Materials from
presentation to San Diego User Group
Saturday, June 5, 2010
The DJIA needs to test the
9800 level more thoroughly to rally. Historically as many as 9
separate tests are
sometimes needed before than can be a rally. With the FED being so
accomodating in keep
interest rates low and with the Dollar still so strong despite that, it
is not clear that the
FED will let the market break down. Bit will thye be anle to prop it up
much longer?
That there are so many
heavy (red) down-day volume days (See DJI volume) shows that
institutions are
dumping a lot of shares thye have profits in. Bearishly, much of the buying
may just be
short-covering by those that have not had much chance to buy on weakness since
the rally began in
March 2009. The professional computerized trading crowd us whipping prices
up one day and down the
next, hoping to spark an emotional reaction that they can profit
from. These
gunslingers trading is usually best measured by the blue Closing Power. The
Blue Closing Power did
break its 5-month downtrend. But it's not clear the gunslingers have
enough fire power to
over-come the 9800 support.
More than
anything else we presently can guess to be on the market's plate is how well and how
quickly the BP-created
oil gusher-volanco can be tapped or stopped. America appears powerless
as its SE coastal
waters are destroyed, as surely as if they we were under military assault.
Meanwhile, Obama is
unwilling to takeover even the command of the coastal cleaning operations
and collect data on the
spillage and spumes independently. Without leadership in a national
emergency, America
seems weak and very vulnerable. We all hope that there will be a technical
breakthrough and the
well will be topped. But I see no evidence that will happen soon. So,
our Hotline has
suggested shorting BP, RIG and HAL.
The DJI seems destined
to test 9800 more thoroughly. The two weeks following June 6th (Sunday)
show DJI gains only
37.5% of the time. The next two weeks are up only 42.5% of the time
since 1965 and show an
average 0.8% decline by the DJI.
It seems best wait for
more evidence that the Peerless Buy signals will be proven right and that we
should do any
additional buying. Below are three ways to be surer that the
9800 support
level has been
adequately tested and a tradeable rally back to at least 10500 has begun.
1) The Closing Power for the DIA. QQQQ and SPY must make a new recovery highs
and confirm
last week's breakout
past their CP downtrend-lines.
2) The A/D Line for the NYSE, DJIA, SP-500 and NASDAQ-100 must break their
downtrends
decisively.
3) The downtrend of the Cumulative NYSE Up-Volume minus NYSE Down-Volume must
be broken.
1) The Closing Powers
for the DIA. QQQQ and SPY must make a new recovery highs and confirm
last week's breakout
past their CP downtrend-lines.
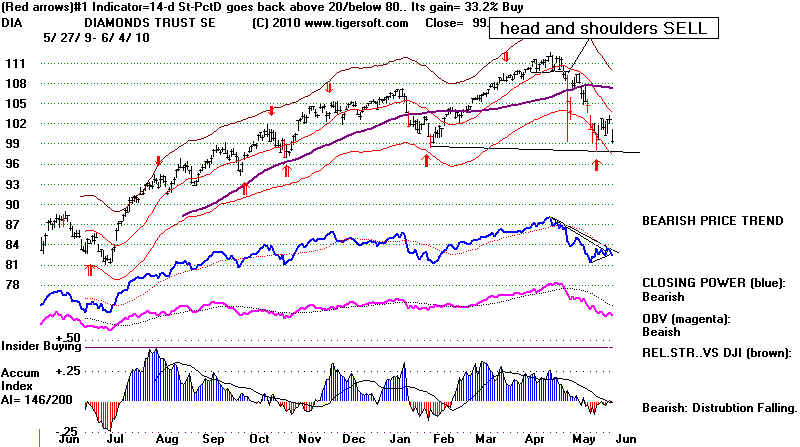 |
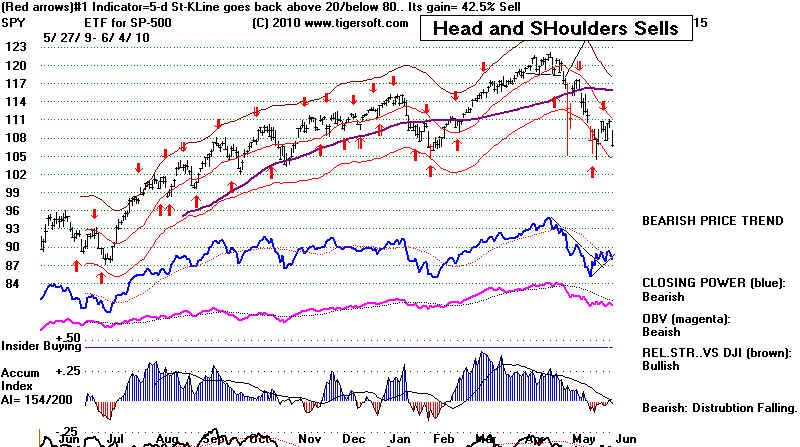 |
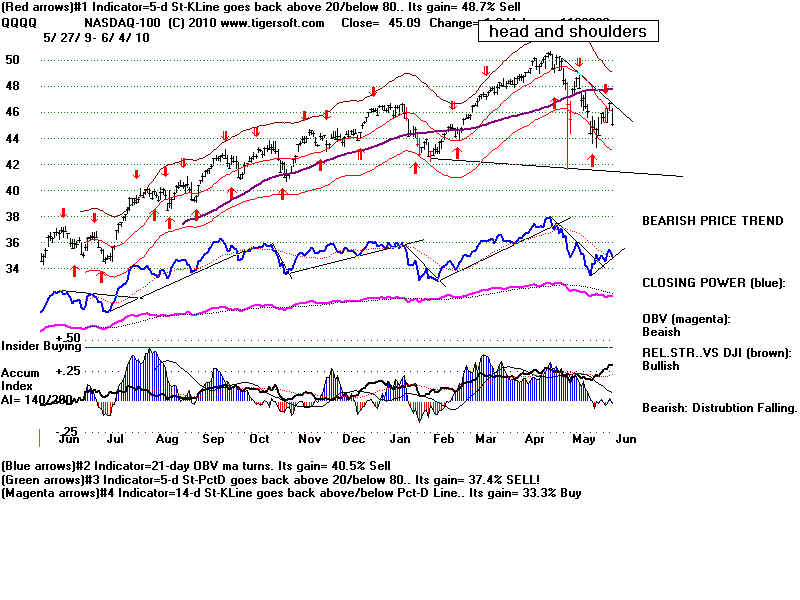 |
2) The A/D Lines
for the NYSE, DJIA, SP-500 and NASDAQ-100 must break their downtrends
decisively.
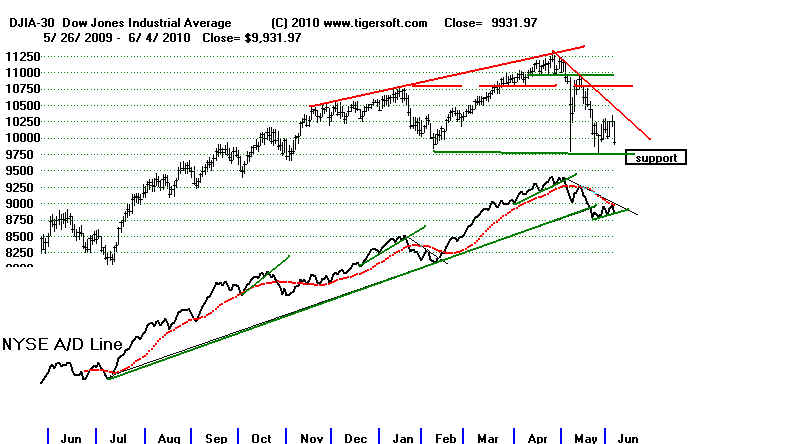
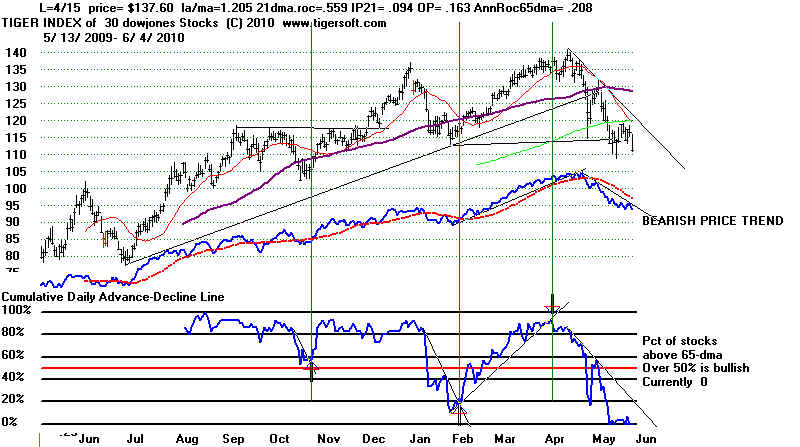
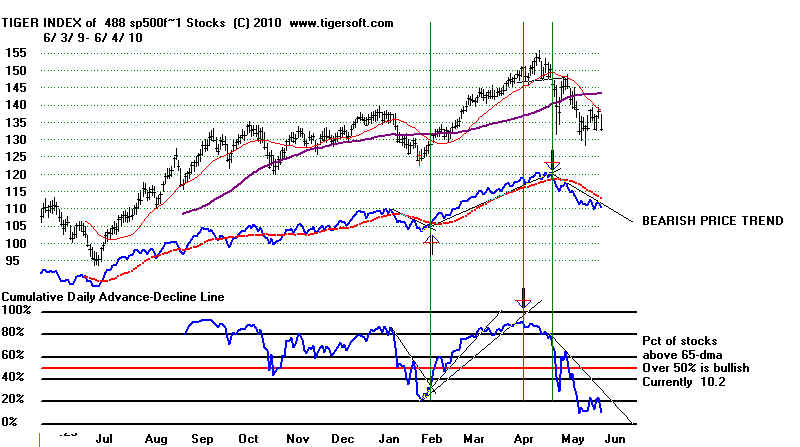
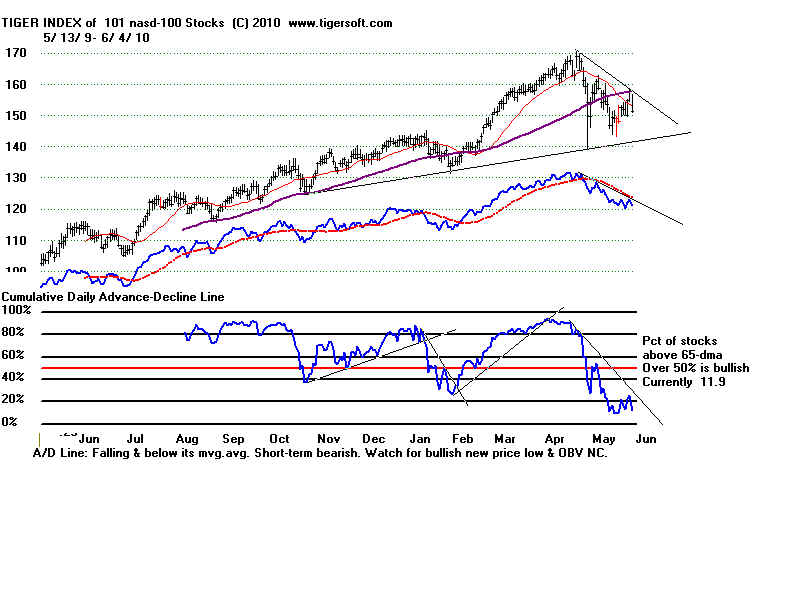 |
3) The downtrend of the Cumulative
NYSE Up-Volume minus NYSE Down-Volume must be broken.
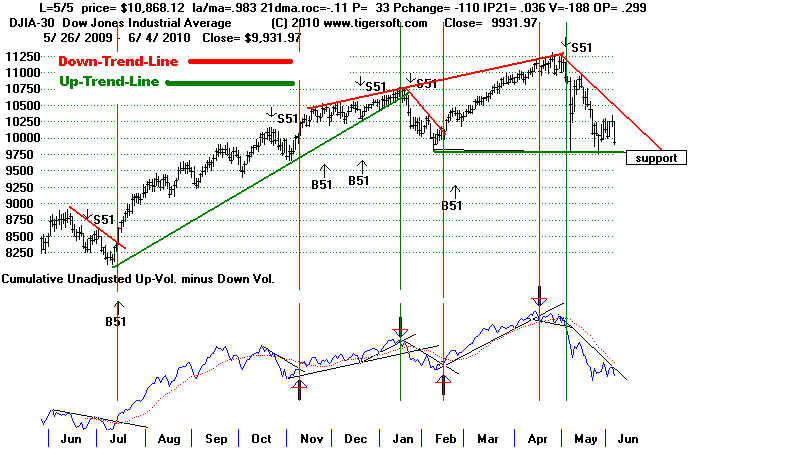 |
Interesting Stocks in SP-500
CTXS 43.3 - Highest AI/200 (187)
Stock in SP-500 is 2% above its rising 200-day ma at 42.12
Watch for break in declining Closing Power.
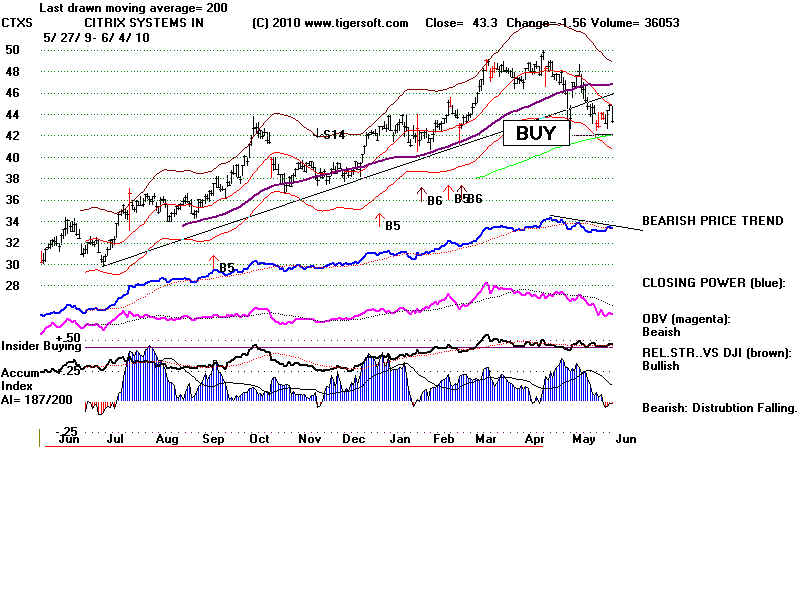
EQR 41.23 is at key support. All internal strenght indicators are rated as
bearish.
Still far above 200-day ma.
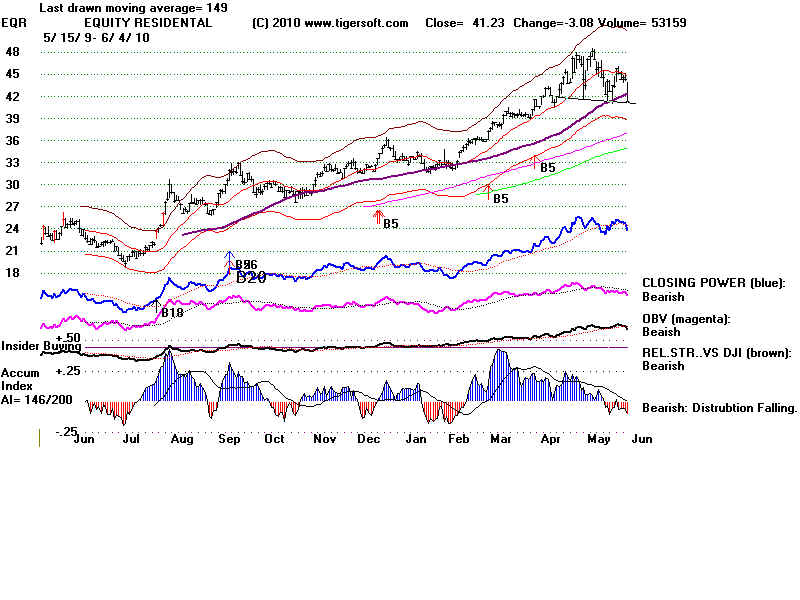
HD 32.15 is slightly below key support. Further weakness in it will spread to all
housing stocks.
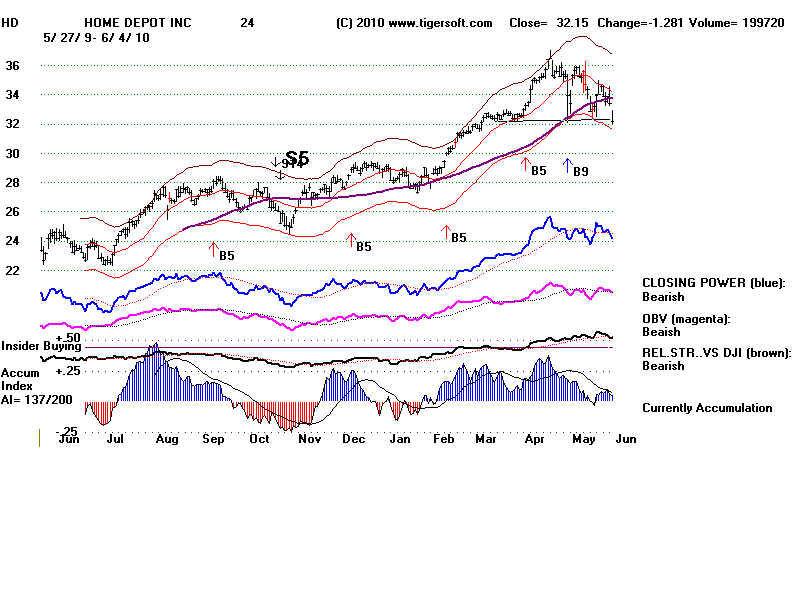
HSY 48.29's rise has been helped a lot by dramatic decline in world sugar
prices.
Watch to see if they
breakout.
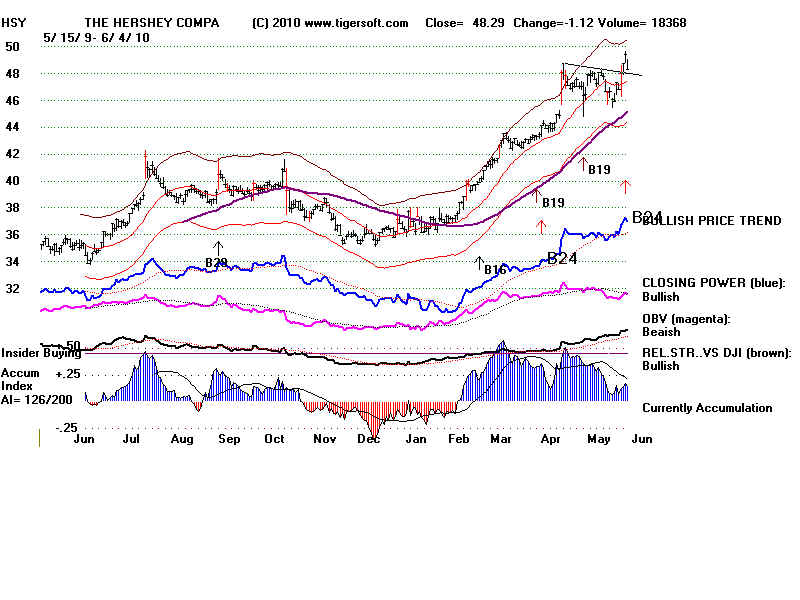
LEN 15.47 -.81 Breakdown below support. Now at rising 200-day ma
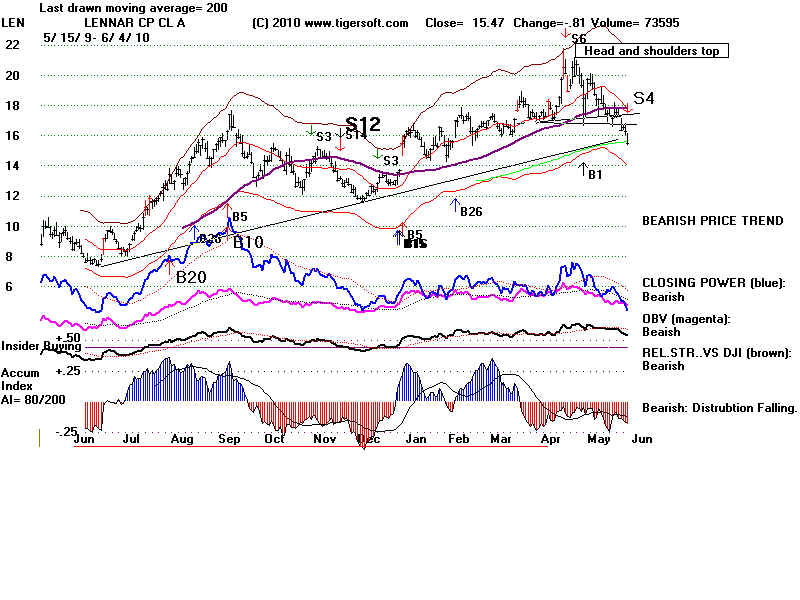
MA 196.67 - 5.33 CLosing Power Dagger Down, new lows far ahead of prices.
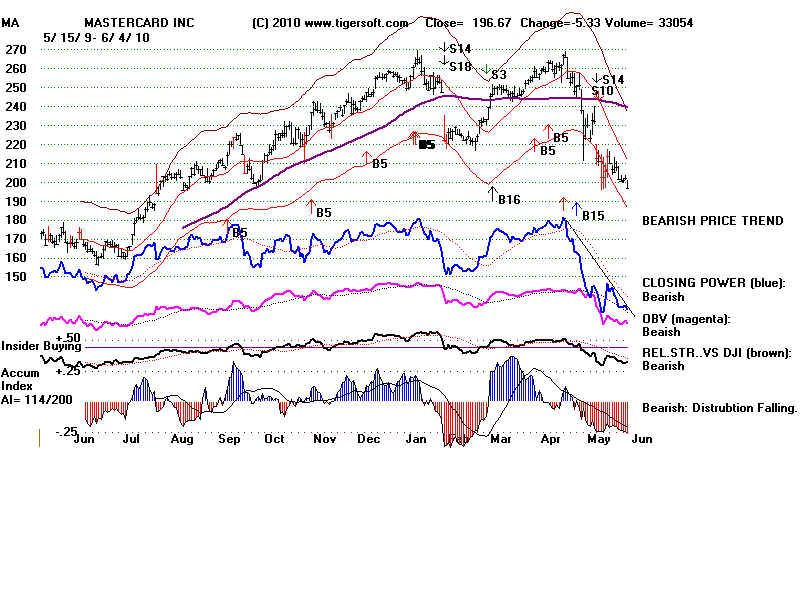
MON 49.02 -1.49 CLosing Power Dagger Down
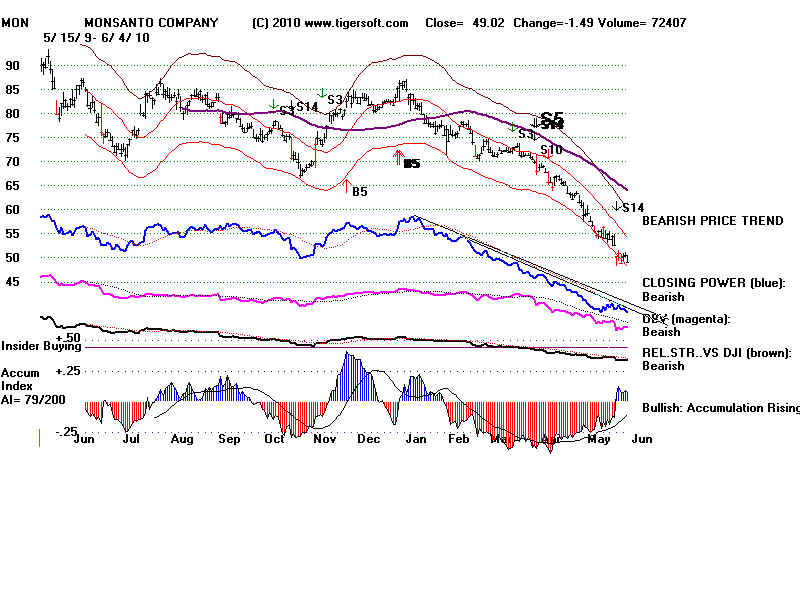
NEM 53.72 -.60 Head and Shoulders. Even gold stocks top out at major
market tops.
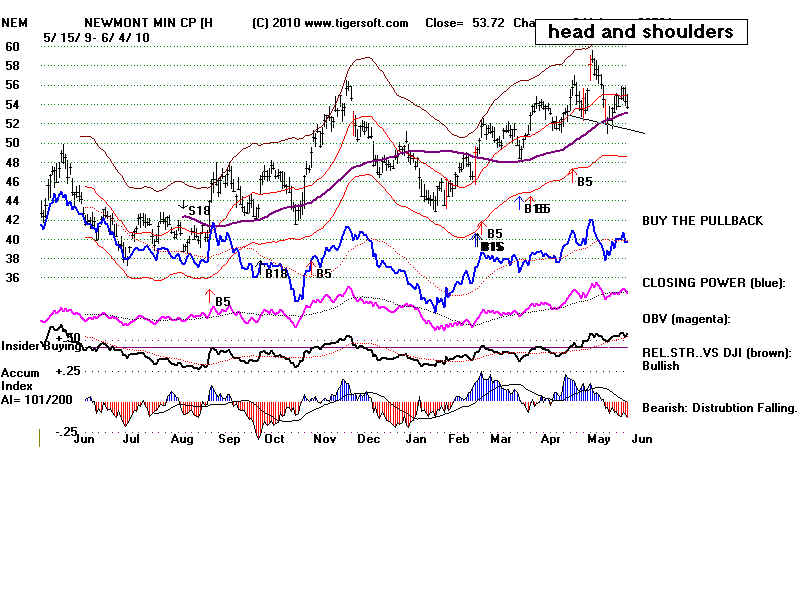 |
==================================================================================
==================================================================================
6/3/2010 Peerless Buys Give Us Hope That The
Key Support at 9800 Will Hold. A Rally to 10500-10700
on the DJIA Is As Much As Seems Likely Now.
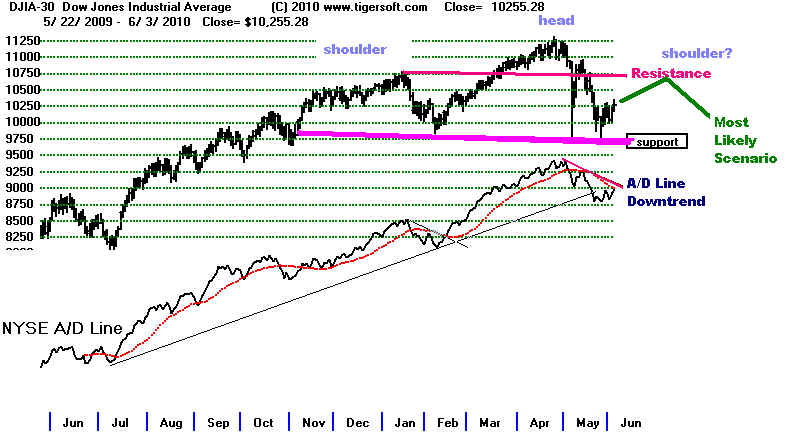
Breadth was very
good today in that there were 804 more advancing stocks
than declining
stocks and .on the NYSE 24 stocks made new highs and ony 3 made new lows.
Oo nte NASDAQ
there were 30 new highs and 9 new lows. Good breadth has made
up for weak
volume on rising days, like today, since March last year. The NYSE A/D
Line down-trend
line has not been broken above yet. That would be a bullish sign
amd suggest the
DJI will advance past the resistance of its 200-day ma and run up to
the expected
resistance between 10500-10700. The most likely scenario would be for
a right shoulder
to form at that point with a peak at the approximate level of the November
peak. Such
a pattern would be bearish. A decline to down to the neckline would then
follow in most
cases.
For now Peerless Peerless remains
on a Buy.
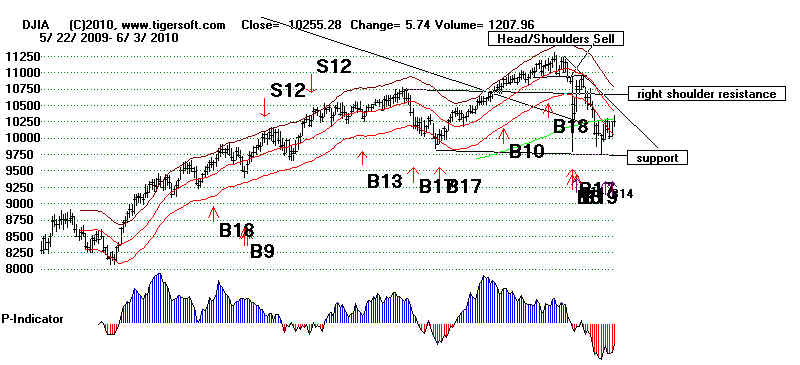
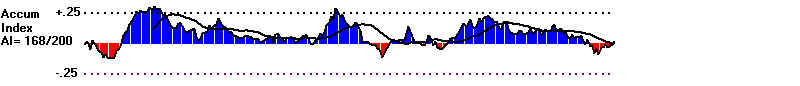
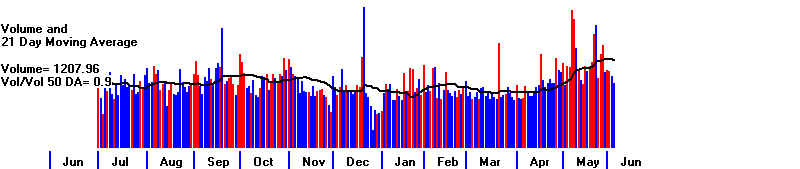
The CLosing Power downtrend-lines were violated on
the turn-around earlier this week.
The chart below shows you this for the DIA, but you
can also see this in the charts of
QQQQ and SPY.
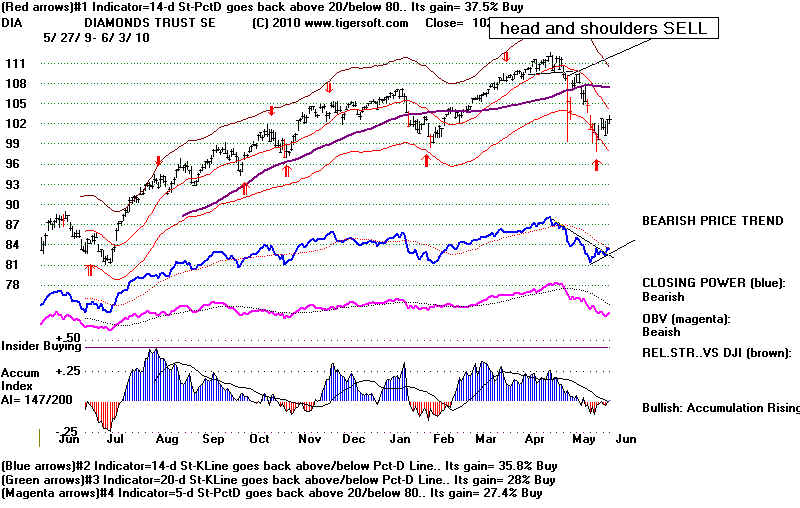
Notice that the TigerSoft chart also gives optimized
Buy and Sell Red Signals. The best
system for the last year is shown. With the
DIA, a 14-day Stochastic is the best system.
It is still on a buy. Watch for a
new red Sell on this chart. At the bottom of the DIA chart,
you can see that the 2nd, 3rd and fourth best systems
are also on Buys.
There is another way to recognize when the rally is
running out of gas. That is to watch stocks
breaking out from what look like bullish patterns and
consider a bear notice to be renddered
if the stock falls back below the point of breakout.
This would be a "bearish breakout failure."
Here are several such stocks to watch.
CMG has wonderful, gourmet spicy chicken. More
and more people are discovering just how
good it is. This stock was given a strong buy
recommendaion by me below 50 in
the Fall of 2008. A decline by it back below
145 would be a false breakout. In the meantime,
breakouts like the three shown below usually offer
traders good ways to play whatever
rally the market is able produce in here. You
can see how good the internals were below
the breakouts: high Accumulation, Closing Power at or
close to a 12 month high and surging relative
strength.
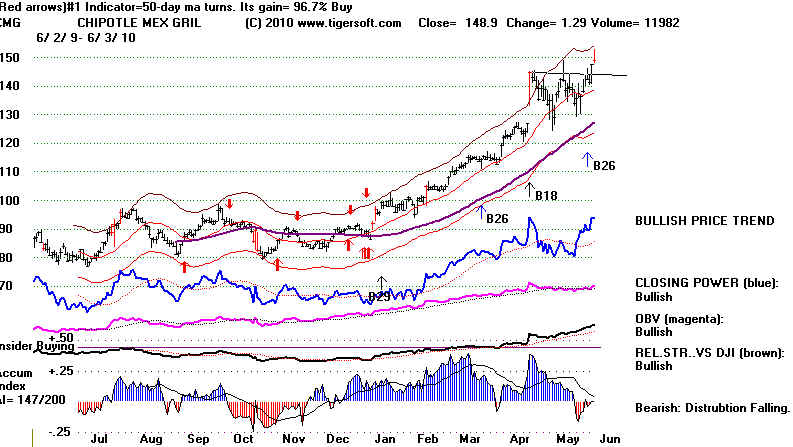
VMW needs to stay above it breakout point, 65.
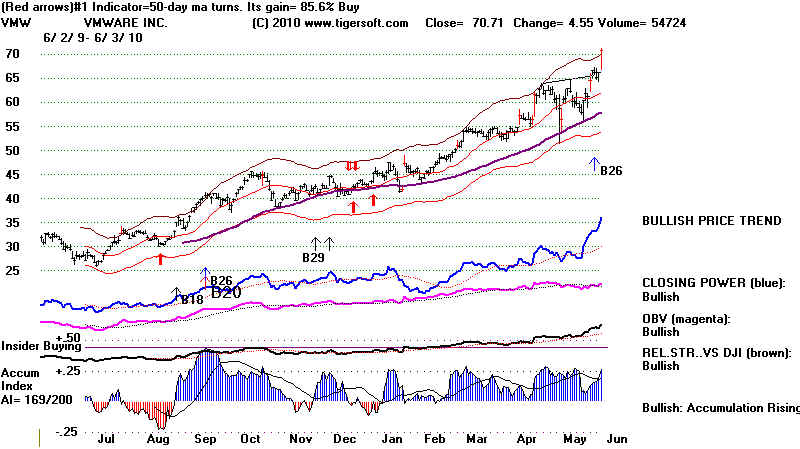
CRM needs to stay above it breakout point, 90.
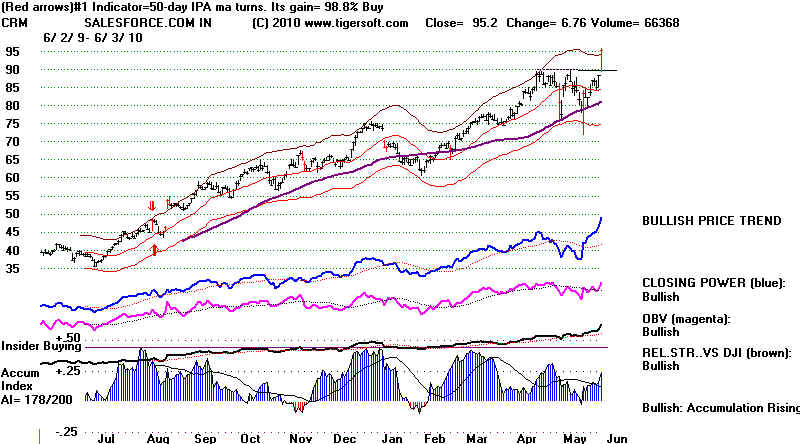
===============================================================================
6/2/2010 Peerless Buys Give Us Hope That The
Key Support at 9800 Will Hold. A Rally to 10500-10700
on the DJIA Is As Much As Seems Likely Now.
Hedging
by Shorting Stocks under Steady Red Distribution Seems
Reasonable.
What's with the sudden advance of
more than 200 on DJIA today? Tuesday NYSE Down volume was
12X Up stocks' volume? Has
the outlook for the end of the oil spill changed? Has Obama assumed
a new leadership role? Was
this just computerized program trading? Did the Fed tell key bankers
that it will not let the market
break down? There were 3 last hour sell-offs in the last five trading
days. None saw any
follow-through.
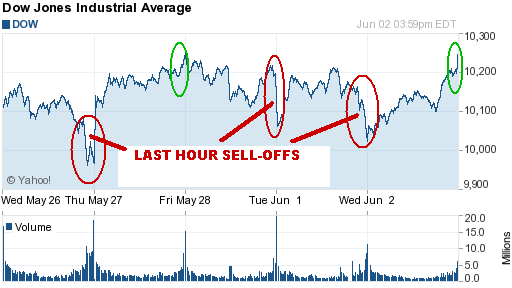
For now trust the Peerless view that a bounce
off the DJIA-12%-down horizontal support has ample
historical precedent and and must be considered
a reasonable scenario, even if later there is an
eventual breakdown below 9800. Looking at
the market's technicals is probably more productive
than guessing why the sellers disappeared
today.
Today, the NYSE Up Volume was 20 times Down
stocks' volume. But volume was lower today.
On the positive side, the Closing Power turned
smartly back up and broke its 5-week downtrendline.
See the blue CLosing Power on the DIA below.
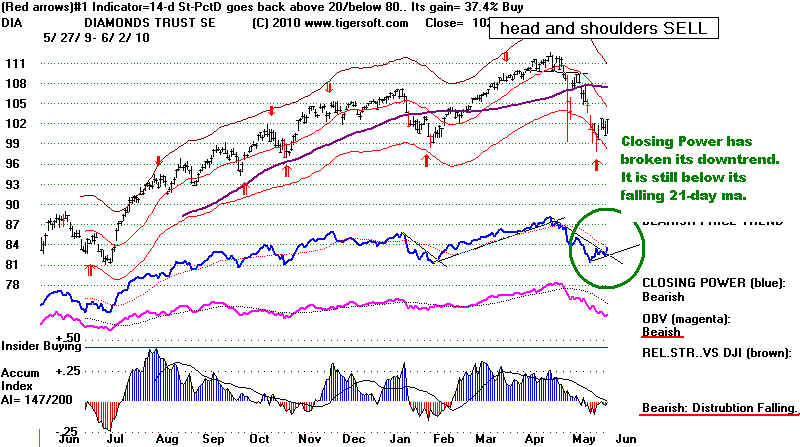
The NYSE A/D Line downtrend is now
being challenged and the DJI is back up to its
flat 200-day ma. This is an
important resistance level to watch. If the DJIA is able to
penetrate it,
I would expect a rally to
10500-10700 on the DJI. This would set up a potential head and shoulders
pattern, in which 10750 would be
the new right shoulder peak if this pattern evolves symetrically.
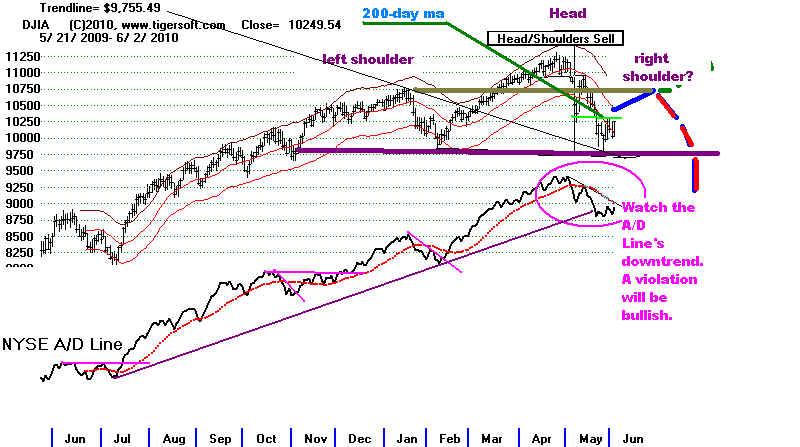
Peerless suggests a rally still
higher. But how much? The Up-Day volume is not high. The OBV
Line on the DIA is falling.
So is the cumulative NYSE Up-Volume minus Down-Volume. Seasonally,
the next few tradings have seen a
DJI rise 62.5% of the time since 1965. But in two weeks, the
odds of the DJI being up are only
47.5% of the time.
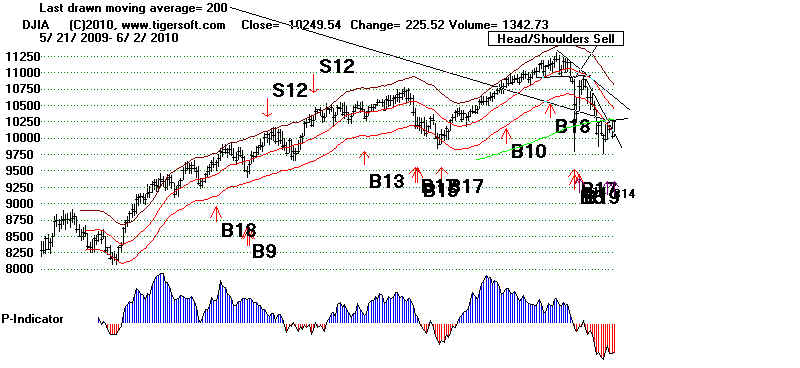
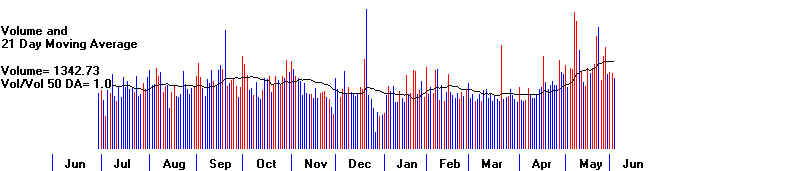
Stocks
If you are as
nervous as I am about what the BP fiasco means for the Gulf and what
that means for
American confidence, consider owning the highest Accumulation stocks
and selling short
those showing the most red distribution. Compare QPSA's high levels
of Accumulatin
with the steady insider selling seen in TNDM and ENER. Their charts
are shown below.
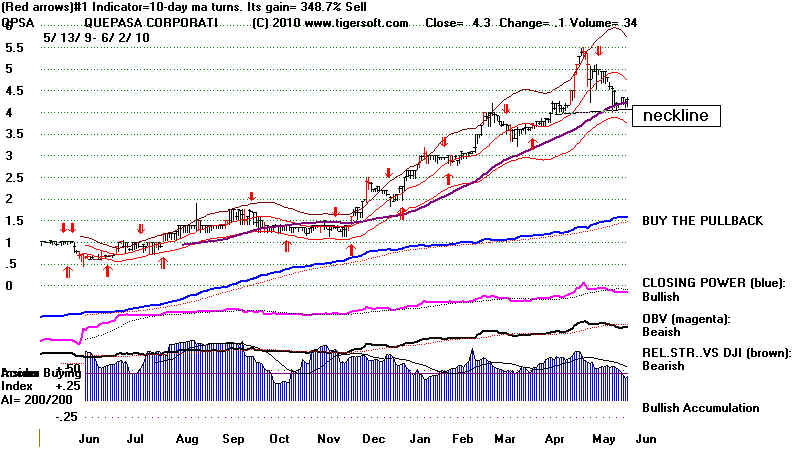
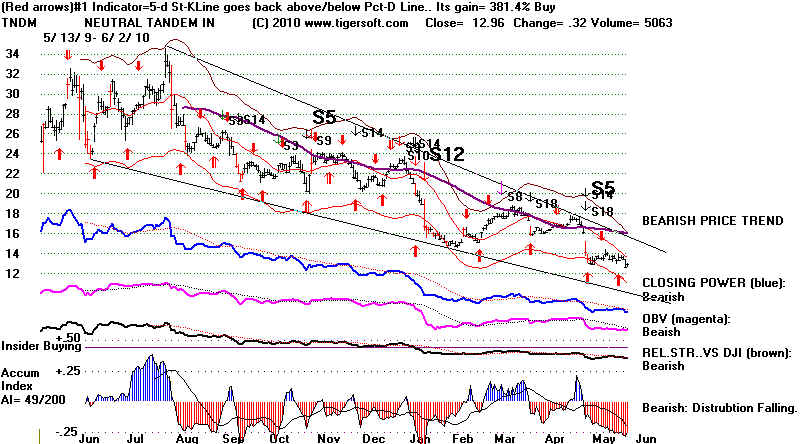
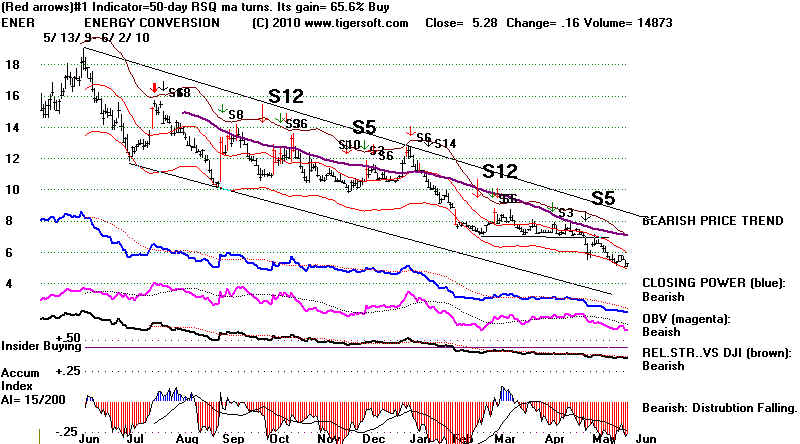
================================================================================
6/2/2010
Only The Peerless Buys Give Us Some Hope That The
Key Support at 9800 Will Hold. Pros are
Selling. So
Is The Public. This is Reminiscent of September
2008!
I think we should greatly reduce our long positions
and short drilling stocks. Hold them short
while their
Closing Powers Are Declining.
Please Understand How Much The BP Oil Leak Has
Caused Widespread Despair, Resignation and A
Sense of Corporate and Political Betrayal.
Obama
Has Utterly Failed To Understand British Petroleum's
Interests Are Wildly at Odds with Those of Americans.
The Tiger Closing Powers and NYSE A/ D Lines
are beaishly falling. These contradict
the Peerless buys
and should make us extremely cautious.
Tiger Closing Power Is Falling for SPY
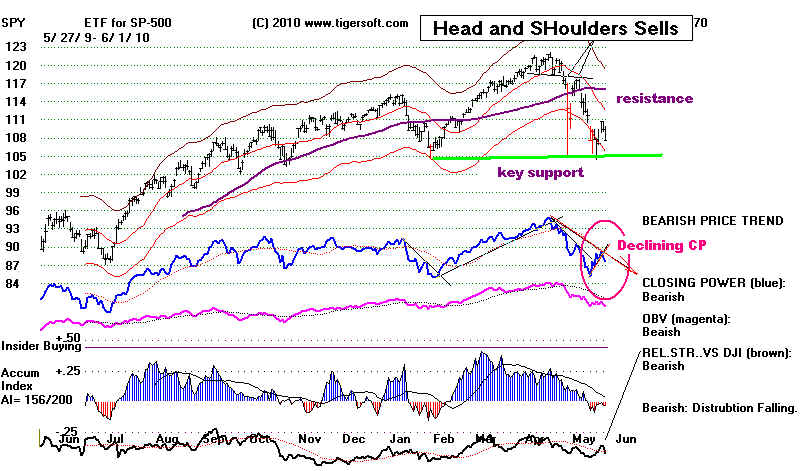
DJIA shows a falling A/ D Line Trend
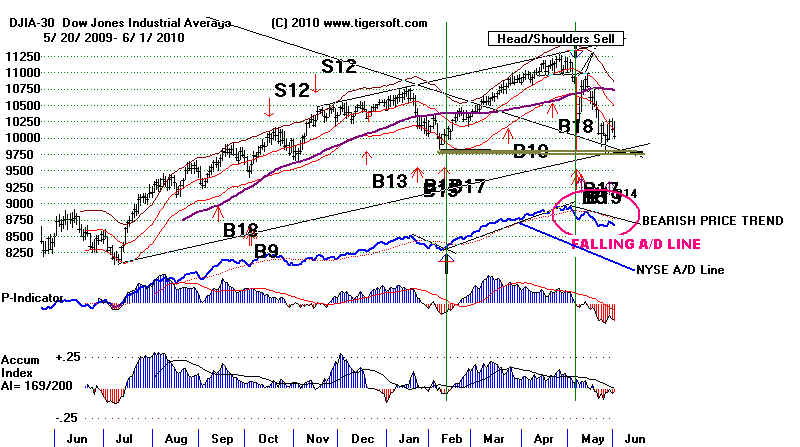
Institutions are
selling in the last hour (See below.) because they have large unfilled day sell orders and
cannot trust that
there will be another rally. Professionals are selling in the last hour because
they think they
may be able to break the market below 9800 and thus cause a new cascade of
prices and sell
orders.
The ETFs' Opening
Powers are also declining. This sets up the dangerous
"BOTH-DOWN"
condition where
both Opening and Closing Power are falling. This condition allowed the DJI
to drop 3500
point in 3 weeks when the 11000 support was violated on September 15, 2009.
If 9800 is
violated, no one will want to support the market. Right now the main support
seems to be short
covering?
All oil drilling
stocks got clobbered today. 11% declines hit the 3 culprits in the current oil
disaster, BP. RIG
and HAL. The drilling industry will not be the same for many years.
Shorting oil
drilling stocks is clearly popular now among professionals and the public.
I do not see how
these stocks can recover. A convenient way to trade this
downtrend is
to buy DUG, the
Ultra Short on Oil Stocks
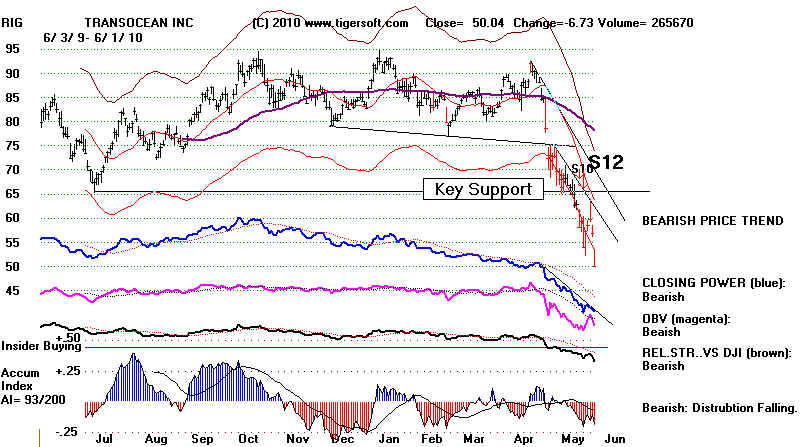
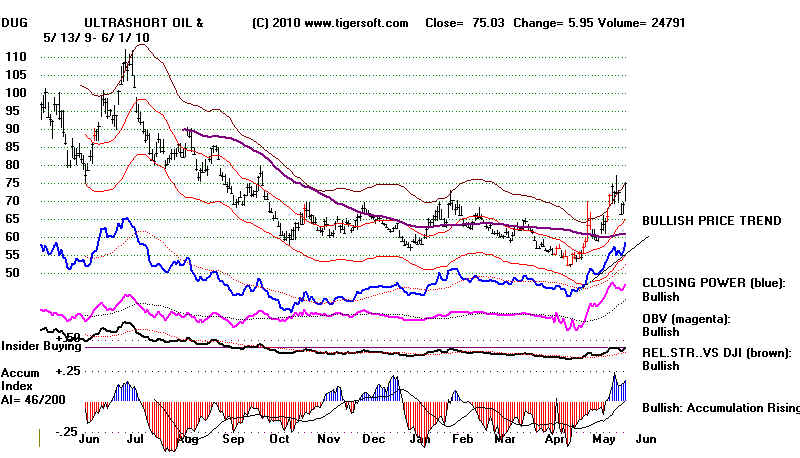
Even the bastions
of safety, gold and silver stocks are forming head and shoulders tops. They
often advance
before a significant top. When they themselves top out, it means the market
has become very
dangerous. See the current head and shoulders patterns that are emerging
in NEM and PAAS.
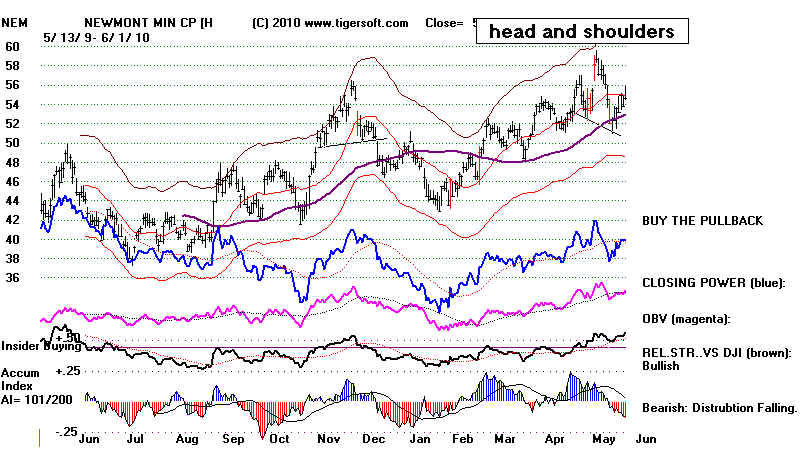

The Gulf Oil Spill is the key here. We are told now
we must wait until August for a second
well to stop the
leakage. The success of this second well is by no means certain. The relief
wells must hit a pipe
20" in diameter 2 miles down. Meanwhile, will BP really be held accountable?
I fear many would agree
that nothing that the President has done in this inspires any real hope,
or gives a sense of his
leadership. His Attorney General says he is "investigating" corporate criminal
culpability.
What's to investigate? If Obama wished, a federal Grand Jury could indict BP's CEO
in a less than 24
hours. Thinking people have to
wonder what is wrong with Obama mentally and
emotionally. What
if there was another terrorist strike? Can he ever act decisively enough?
Why does Obama trust
BP? Is his judgement marred and dangerously flawed? This, too, is
very
worrisome, The
stock market expects confident action from a President not paralysis. It expects
a reasonable measure of
shrewdness and realism, too, not blind faith in those who created the
very problems that need
repair.
Can there be any doubt
that BP will do all it can to weasel out of paying for the catastrophic
mess it has caused.
Many believe any prosecution of BP will takes years and years, just as it did
in the case of the
Exxon Valdez. In the end, many of the Alaskan people who should have been
compensated, died while
waiting in vain. BP should and will eventually have to be put in receivership
to make sure every
American who has been harmed by them gets justice. This is like a war.
Emergency measures are
needed. This threat will hang over the head of Wall Street for a long time.
We see failures in
every aspect of this disaster. More oil is coming out now than a few days ago.
BP is not doing more
than a cosmetic minimum to protect the shoreline from their oil mess. They
are still controlling
all the cleanup efforts! They determine how many clean-up workers are sent out,
how much or how little
they are protected from the oil's benzene dangers, what they do, who works at
cleanup, what they are
paid and even if they can talk to in the media. How on earth can Obama think
this is tolerable?
Very dangerously BP has
rejected the FDA's demand that they stop using a toxic oil dispersal agent.
They do this so that
oil will never reach shore. Unfortunately, the plumes of altered oil that
their dispersant
creates have a very dangerous potential not only to the marine life, people eating
Gulf seafood, the
people who depend on that eco-system for a living AND potentially to everyone
in the East if the
toxic dispersant gets absorbed into the rain that falls there. There are very
good reasons that
scientists have pressured the British to ban this dispersant. The Russians claim
its effects as rainfall
on the Eastern USA may be very deadly. Obama could have demanded BP
to stop using the
banned dispersant. He has not? That itself weakens a future court case.
What is
wrong with him that he
did not?
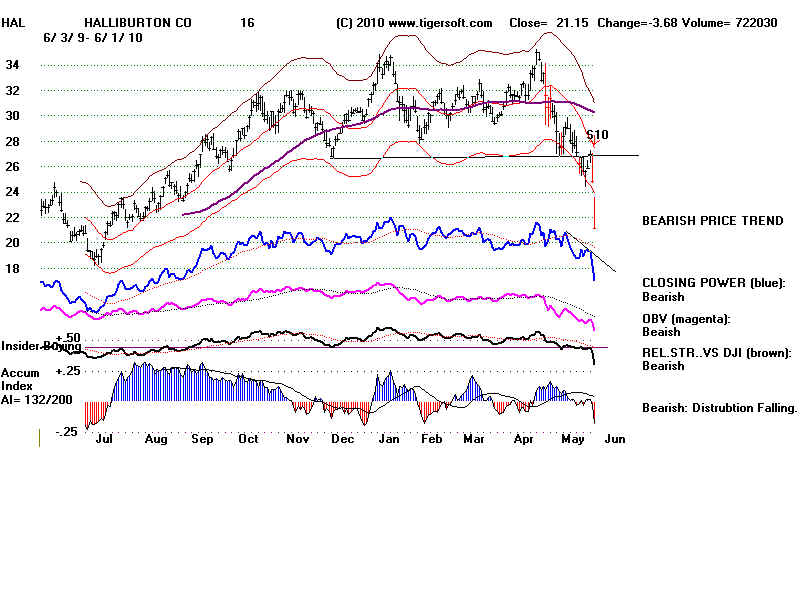
==================================================================================
==================================================================================
5/28/2010
Short-Term Sells but Intermediate-Term Buys
BP's Failure Will Have Repercussions for Years.
9800 Is Still Likely Support.
Considering the costs, human, environmental and socio-economic, that will stem inevitably
from the failure
of BP to shut off its hushing Gulf Oil well, it is surprising the market
did not sell off
more on Friday. The action in the drilling stocks showed that traders
and professionals
knew "Top-Down" would fail on Friday. While America will need oil
for a long time,
the costs of getting it will probably rise sharply as new regulations on
drilling are
imposed. A 6 months' delay on deep water drilling was announced by Obama on
Friday.
Sales of leases off the coast of Virginia have been cancelled. These developments
will greatly
squeeze the companies that provide drilling services. It is doubtful if the decline
to date in the
group has adequately discounted the changed prospects. There are few
companies that
will not be adversely affected eventually by the destruction of the way of life
for millions
along hundreds of miles of Gulf Coastline. By the time, the relief well is
in a position to
divert the gusher a mile down that BP recklessness has caused, a climate
of great public
anger will likely have developed. This cannot be good for the market.
Still, the
technical conditions for a rally up from 9800 exist.
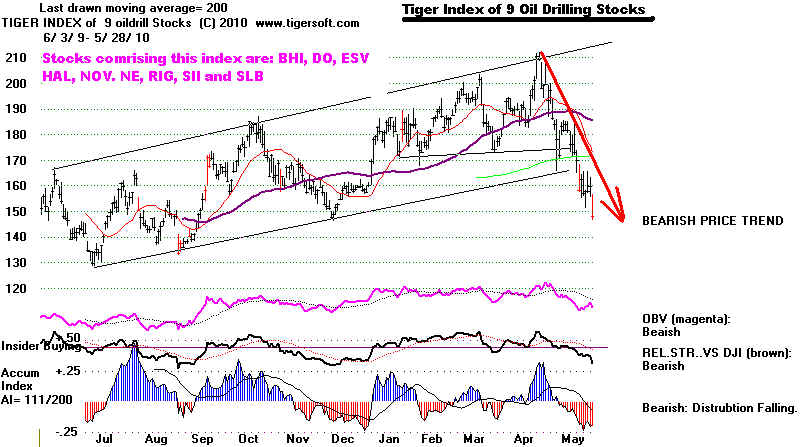
9800 is support in the DJI. That may have to be tested again. A fifth point
of reveral is th emost reliable
historically. The TigerSoft Closing Power could not break its
downtrend on the key ETFs for the
DIA (see below), SPY and QQQQ. Instead, they broke
down below their brief Closing
Power uptrendlines. A retest of 9800 would seem likely.
Such a decline next is still
consistent with current Buy signals. And if you look at the SPY
and QQQQ,
you can see the 5--day Stochastic K-Line system which has been their
best trading system for last year has
dropped back below 80 and given a Sell. Assuming
there is a successful retest of
9800 or the market starts another recovery, the DJIA's and DIA's
chart patterns suggest the
likelihood of a rally to 10500-10700 on the DJIA, so that a right shoulder
develops which is symetrical to the
left shoulder which was formed in November and December.
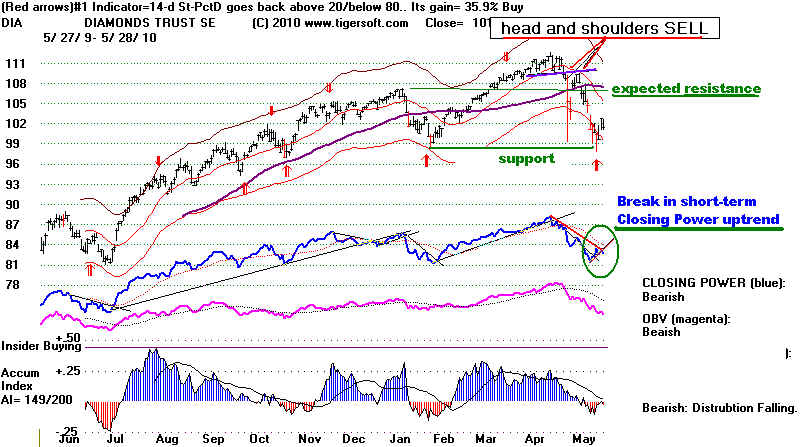 .
.
The A/D Line is still declining for
NYSE stocks. 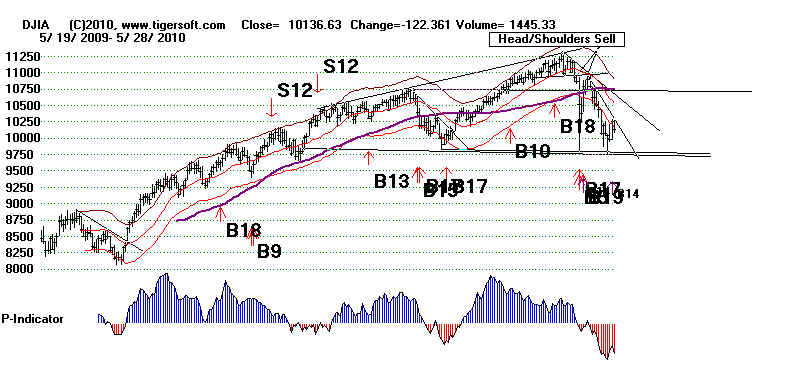
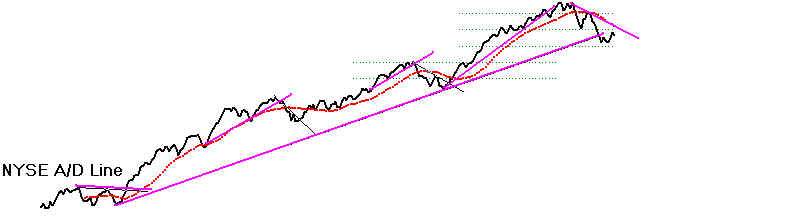
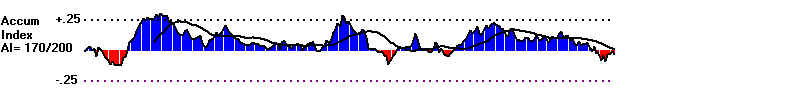
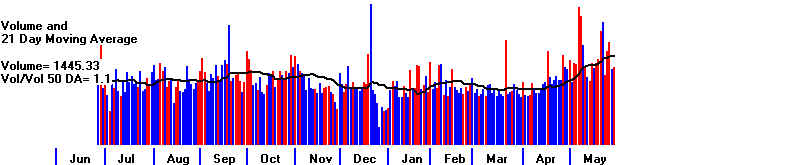
=================================================================================
=================================================================================
5/27/2010 Relief Rally Under Way. New B14
Closing Power Is Now Uptrending. Superb
Breadth.
Having successfully tested 9800, the DJI and the market must
now rally to
resistance. The DJI's steep price-downtrend is one
barrier. A
second would be the apex of a right shoulder between
10500 and 10750.
With volume so low on today's rally compared
to recent down
(red) days' volumes, 10500 will be tough resistance
on the current
rally.
Today brought a Peerless Buy B14.
This occurs when NYSE up
volume
exceeds down volume by a very wide margin. Only 2 of the past
27 B14s would
have been sold at a loss using Peerless. Since there
were no B14s in
the 1930s, we should take some hope here. But
because the
Accumulation Index is not deeply negative, thereby
registering a
truly oversold, bear market conditon, the gain from the
B14 is apt to be
modest.
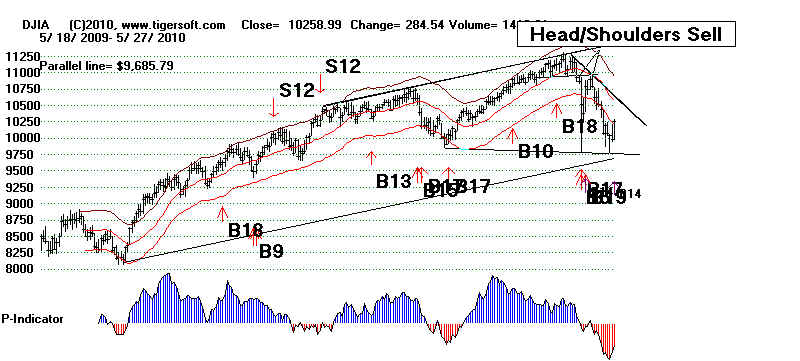


Low (Blue) Up-Day
Volume
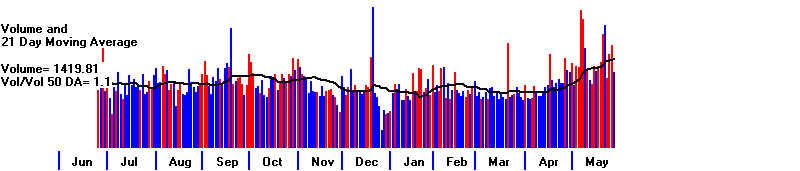
The
DIA (DJIA-ETF) chart shows that we are also on a rally
which is blessed by a 14-day
Stochastic Pct-D. This trading
system has been the best for
the last year among the 60 trading
systems that TigerSoft
automatically studies before placing the
red buy and sell signals on
the initial screen. The actual Stochastic-14
is shown on the chart below.
To give its Sell signal, the blue Pct-D
Stochastic Line will have to
rise a long ways. It now stands at only 27.
To give a Sell, it will have
to rise over 80 and then fall back below that level.
This is encouraging. It
helps us believe that the DIA will rally to 105-107,
the area where a top would
become the apex in an 8 months' long head
and shoulders pattern.
See the prospective prices in RED that show
this possibility playing out
in the chart below.
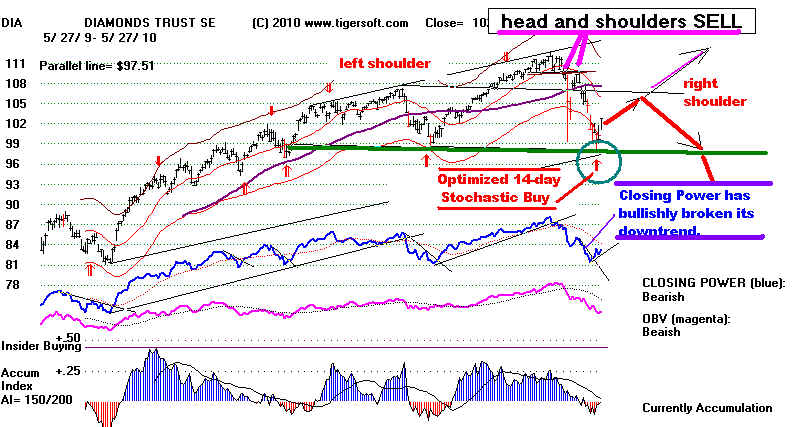
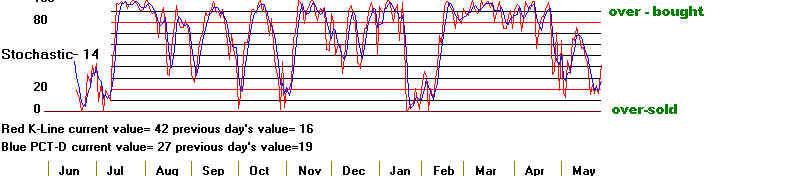
Understand that the SPY
and QQQQ are on only short-term 5-day
Stochastic Buys. See their charts here. Bullishly, all the
ETF's
Closing Powers are in
short-term uptrends. Another re-test of
9800 cannot be ruled
out in two weeks or so.
Here are some stocks
that look bullish now. The two primary
attributes of these
are: 1) high accumulation and 2) a CLosing Power
that is making a
2-month high. After a 10% decline, the fact that
a CLosing Power is this
strong is quite special. See
the stocks
here. I will be posting
downloads on our Data Page of stocks
making CPHIGHS and
CPLOWS this weekend.
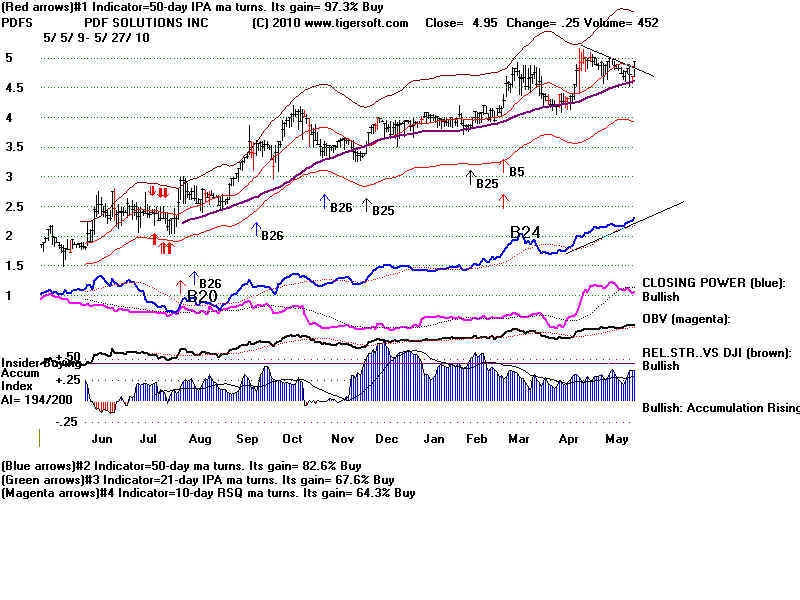

Services at Normandy Memorial
Have a
Happy and Safe Memorial day. I think back about the VETS
that have sacrificed so
much. I am grateful and very sad. It is our
job in peace-time to
help them and honor them by keeping up the
good fight for freedom,
justice and democracy. Whatever your
views, take nothing for
granted from Democrats or Republicans.
Always keep the
pressure on them and watch them like an
American eagle would.
In Flanders
Fields by John McCrae
                                      In Flanders fields the poppies grow
                                      Between the crosses, row on row,
                                     That mark our place, and in the sky,
                                     The larks, still bravely singing, fly,
                                     Scarce heard amid the guns below.

                                    We are the dead; short days ago
                                    We lived, felt dawn, saw sunset glow,
                                    Loved and were loved, and now we lie
                                    In Flanders fields.

                                   Take up our quarrel with the foe!
                                   To you from failing hands we throw
                                   The torch; be yours to hold it high!
                                   If ye break faith with us who die
                                   We shall not sleep, though poppies grow
                                   In Flanders fields.
=====================================================================================
=====================================================================================
5/26/2010 9800-10000 Is Key Support.
ETF's CLosing Powers Are Bullishly Rising.
That Suggests A Rally of 3%-5%.
Though the last two hours saw the computerized
gunslingers
drive the DJI down more
100 points, the number of stocks rising on the
NYSE easily eclipsed
the number falling by 535. If the breadth had
been negative, the
selling would more easily be attributable
to mutual funds.
That would have been more bearish. The quick-trade
computerized traders
apparently were fearful that the British Petroleum's
"Top-Down"
technique for stopping their Gulf rig's wild oil leak may fail
overnight, even making
the situation even worse, I see no real
evidence yet that
"Top-Down" has either worked or failed. But BP's
well-stopping success
or failure in the next few days will have a lot to say
whether 9800 will hold.
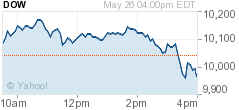
The DJI's chart below
shows 3 tests of 9800. We need some more
evidence that the test
will ultimately be successful. Watching individual
DJI stocks that are
near key support will help you see how close
we are to having the
general market give way. These DJIA stocks
are just above key
support:
MRK last= 32.42 support = 30 and 31.
PG last = 60.44 support = 60
TRV last =
48.00 support = 47.5
See the most vulnerable DJI charts here.
Below 9800 is
apt to bring much more
weakness. Stay very vigilant, but enjoy
the relief rally with
some of the long positions, especially in gold
and silver stocks,
mentioned yesterday.
There is hope.
Seasonality is bullish over the next two
weeks. (Since
1966, the DJI rises 65% of the time in the two weeks
following May 26th.)
Unfortunately, the DJIA is up only 45% of the
time when the DJIA in
two months is compared with it's level on
May 26th. A rally
by the DJI back up to 10500-10750 over the next
month might well lead
to a massive and classic head and shoulders
pattern. So,
while we may want a rally, we might not like its end-result
if the rally fails near
the upper band and forms a right shoulder peak
about the same level as
it did in early January.
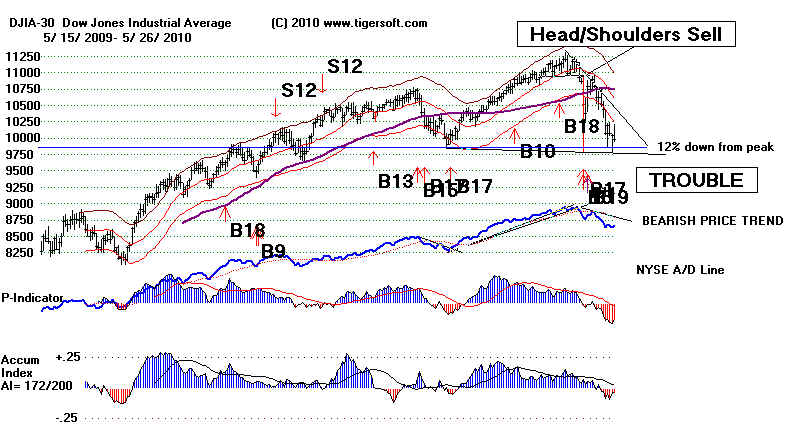
(RED) HIGH DOWN DAY
VOLUME DOMINATES
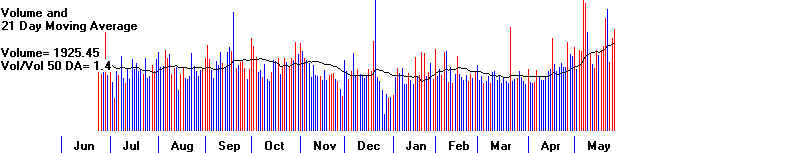
Why A Short-Term Rally Is Expected
The major ETFs' Closing
Power steep downtrends have been
violated to the upside.
See the DIA, SPY and QQQQ charts today
here.
This is usually bullish
short-term, at least. But (red)
down-day volume
in the DJIA chart above
shows that the selling pressure has not
yet abated. Stay vigilant.
Foreign and public
selling at the opening has become very aggressive.
Notice in the DIA chart
below how steeply the Tiger Opening Power is
falling. A
contrarian might want to conclude that this is bullish, except
that Professional
selling, as measured by Tiger's CLosing Power is
generally falling just
as fast and yesterday's breakout showed no
lasting follow-through
today. Tiger B21's show the
bullish "BOTH UP"
condition when both
Opening and CLosing Power are rising. S21's
signal the BOTH DOWN
condition when the opposite is true. The
S21's register heavy,
panic selling. Its presence now adds to the
importance of the 9800
support. A decline below that will probably
just reinforce the
sense of panic. So, we have to be wary. If you
buy in here, work with
close stops. A close below 9800
will have
be treated as a very
dangerous development and judged a "fail-safe"
Sell S10.
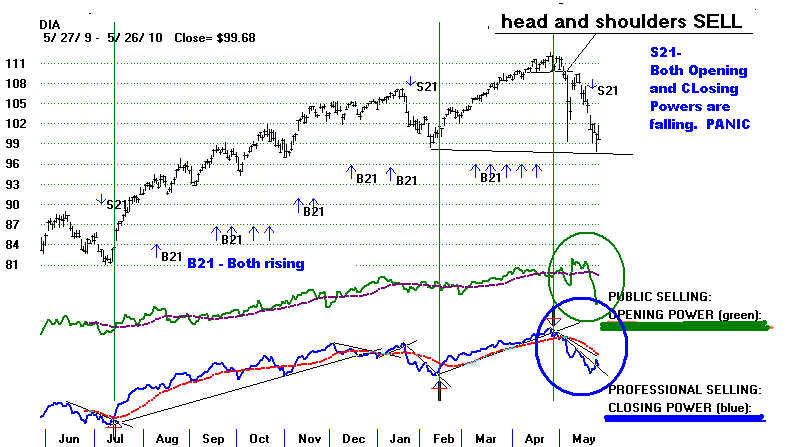
I have said that where the market goes next depends heavily on
whether BP's fix works for its oil leak. But even if the well's leakage
is
stopped, the usage by BP of so much of a toxic oil dispersant
has
endangered a very large area of the Gulf and the coastline there
for
many years to come. Food from the Gulf will not be safe to eat
if it
has been exposed to either the oil or the highly toxic dispersant
which
Britain has banned but BP is using in the Gulf, despite being
ordered by the EPA to desist. Obama, true to form, has not backed
the
EPA or ecologists against British Petroleum, who made him
their
biggest recipient of campaign contributions since 2006.
.
We Should Want A Stronger
EURO
To
make matters worse, a lot depends on the EURO, In the chart
below
you can see how a strong EURO that breaks its downtrend
has
led to DJIA rallies. Weakness by
the EURO is bearish for the
DJIA.
The EURO's weakness suggests financial
problems there
will
not be helped by its austerity programs. The UK's new PM
has
announced severe cut-backs in spending programs. If history
repeats, what happened in the UK and Europe in the late 1920s and
1930s
will repeat. That means the EURO will stay weak. European
economies will stagnate. Unemployment will rise dangerously. All
this
will have a very negative effect on world stock markets. This
was
the subject of my dissertation, where I had access to
previously secret internal British Cabinet debates. American bankers
want
balanced budgets, too, except when they are the direct beneficiaries
of
the government's largesse. We tend to forget their perspective.
They
are most powerful vis-a-vis their clientele when their regular
customers are financially desperate and clamor for credit.
Bulls
will also want to see over-night Gold, Silver and Oil rise. Such
rises
suggest inflationary pressures out way deflationary and
tell
us hedge funds are not rush to sell everything to raise money,
as in
the fall of 2008.
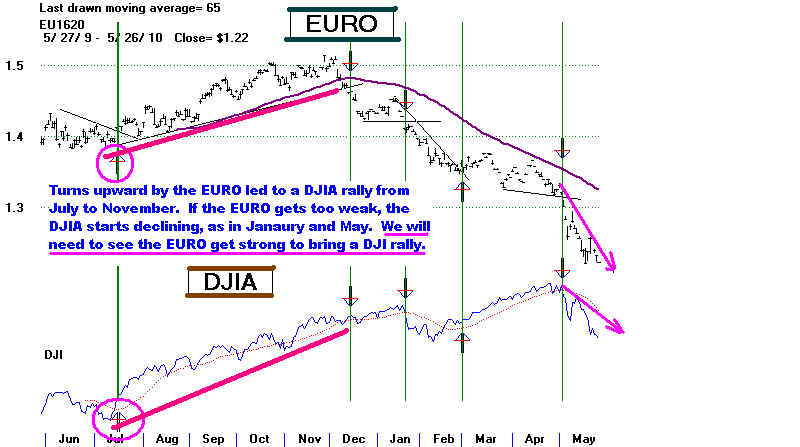
IINSIDER SELLING's BREAKDOWN-STOCKS
MAKE GOOD SHORTS
When the general market turns very weak, it becomes difficult to
prop up a stock that insiders
want out of. A stock showing
heavy and steadily negative
(red) Distribution that breaks key,
well-tested and flat support
often starts to cave in badly. We also
want the stock's CLosing
Power to be in a down-trend in our short
sales. The stocks
below illustrate this type of weakness.
And bearishly, they could not
even rally in the last few days. These
can be found using the Power
Rankings' NEWLOWS and BEARISH
screening for any group
of stocks you wish. I have tried to make
this easier by offering a
download of recent NEWLOWS and
LOWACCUM.
GILD, AMRI and PFE: BEARISH RECENT BREAKDOWNS
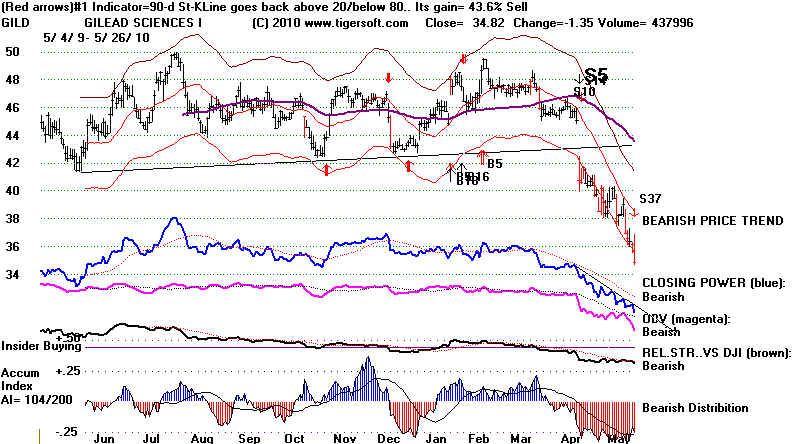
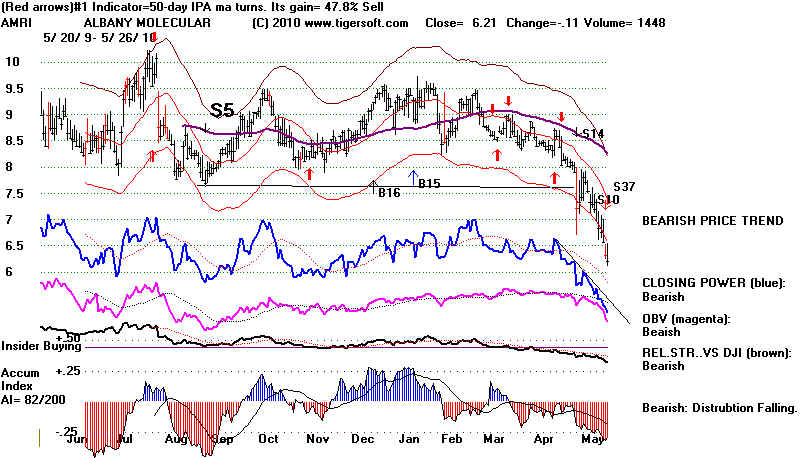
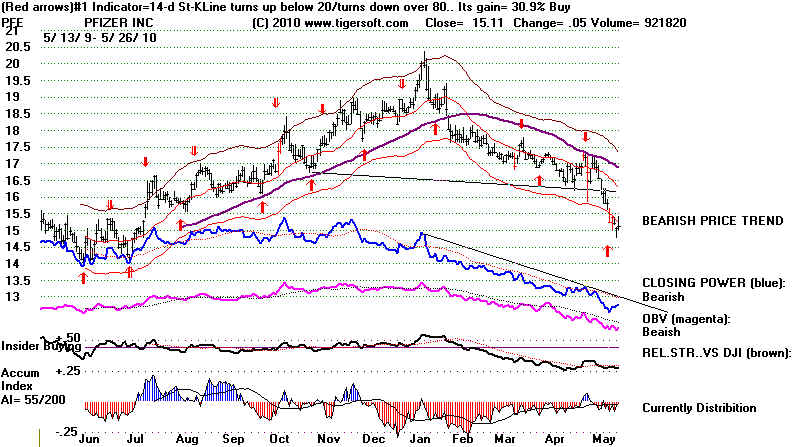
=====================================================
=====================================================
TIGER/PEERLESS HOTLINE
5/25/2010
9800-10000 Is Key Support.
We got short-term Buys today as the Closing Power
downtrend-lines were violated for
the DII. SPY and QQQQ.
See their charts here. This is a
short-term Buy. A 3%-4%
rally would be typical here.
Peerless' automatic system is
still on a Buy.
As you can see in the DJIA chart
below, the 9800
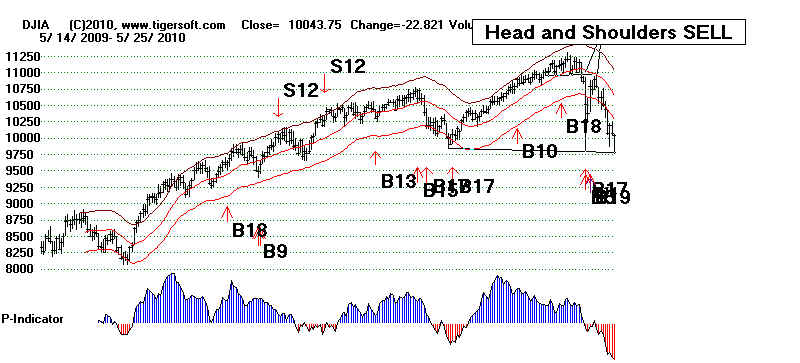
support
level held again today as the DJI moved steadily
higher after opening at 9800.
Breadth (NYSE Adv-Declines) remained
negative and the DJI could not turn
positive at the close. The NYSE
A/D Line downtrend is still in
place, so even though
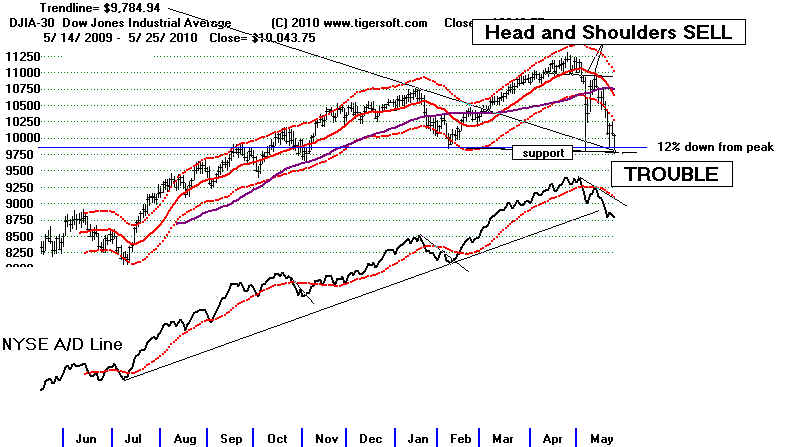
Peerless
remains on a Buy, we should still respect the
dangers shown by the recent
weakness. Above all,
a close below 9800 would have to be
treated as a
judged Sell S10. (See the
discussion last night).
There are lots of fears and
concerns confronting
the market. All things
considered, it has actually held up
remarkably well.
Tomorrow we will see if British
Petroleum's "Top Down"
scheme for stopping up their
drilling rig's huge oil leak works.
If it is successful, I would think
it will give a very good
boost to the market, because the
next good alternative will
not be ready for two months.
The damage this would cause
the Gulf would be unspeakably
tragic. The next scheme
involves a side-drilling down to
the leaking pipe to either
block the flow or allow the oil to
be safely diverted. In 5000'
of water, who really knows what
will happen tomorrow.
If "top-down" is
successful in stopping or even in greatly
slowing down the spillage, it will
be a big, wonderful relief
for all Americans. If it is
not successful, then I fear that the
DJIA-9800 level will not hold.
Right now, we just have to hope,
wait and wish them success. I
think the bounce in the market
day owed to the 60% probability of
success given by BP's CEO
for "Top Down".
WHAT TO DO?
Where the CLosing Power
downtrend-lines have been
exceeded we will cover our short
sales. In addition,
consider buying those stocks giving today optimized
red Buys based on short-term
Stochastics provided the
track record of these signals is
very good and they
show CLosing Power Downtrends that
have just been
violated. In GDX below you see that a 5-day stochastic
system would have garnered 172.6%
for the last year
and the recent Blue Closing Power
is downtrend has
been broken. See
similar charts of AEM, CRMT, DHI,
PAAS, SBGI and SKYW. CLearly
these stocks have
enjoyed more than a normal amount
of professional
buying and selling to permit such
reliable gains.
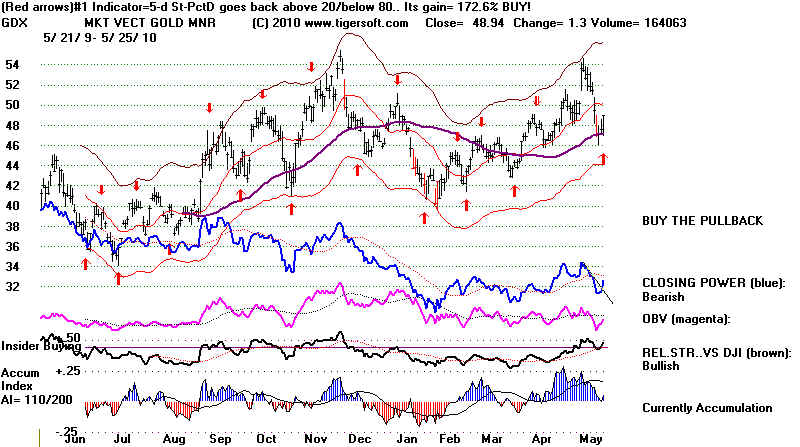
The Tiger Power-Ranker lists these
stocks if you use the
following steps:
1. From the Peercomm Screen, choose the second button down on the
right.
This is the older Tiger program.
2. Next under Runs/Setups at
top left pick the first choice, "Run Nightly Analysis"
and click "OK".
This is a different program than is run by clicking ANALYSIS from
Peercomm.
3. When finished go back to
Peercomm 8 button screen.
4. Click top button on upper right.
5. Click Tiger's Selections.
6. #1 Indicators' Results
7. Pick Sorts at upper left.
8. Pick New Buys sorted by Pct
Gain.
If you do this Analysis for the
stocks and ETFs in DJI-30, three items show up as
having new Stochastic Buys:
INTC, IWM and DIA. INTC is an attractive buy because
it has clear support at 20 (a stop
loss could be used just beneath that) and its
Closing Power broke it downtrend.
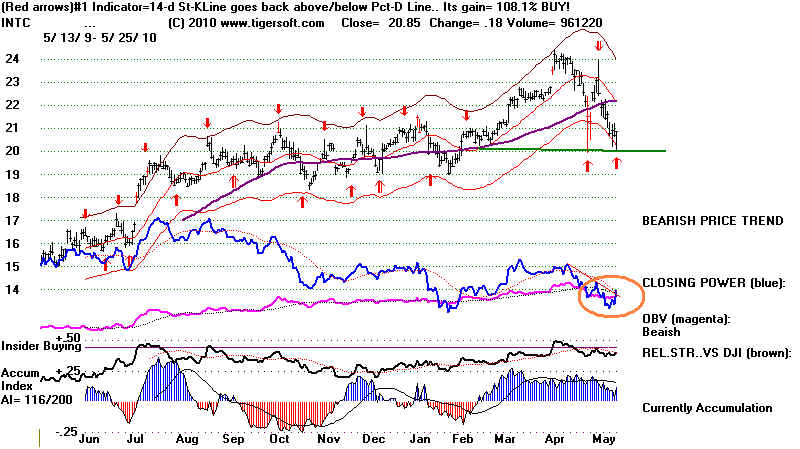
=======================================================
5/24/2010
9800-10000 Is Key Support.
1) Tiger's Closing Power and The NYSE A/D
Line Are
Still in Downtrends. Wait until these downtrendlines
are broken to Buy. Shorter Term
traders should use
Closing Power downtrend breaks.
DIA
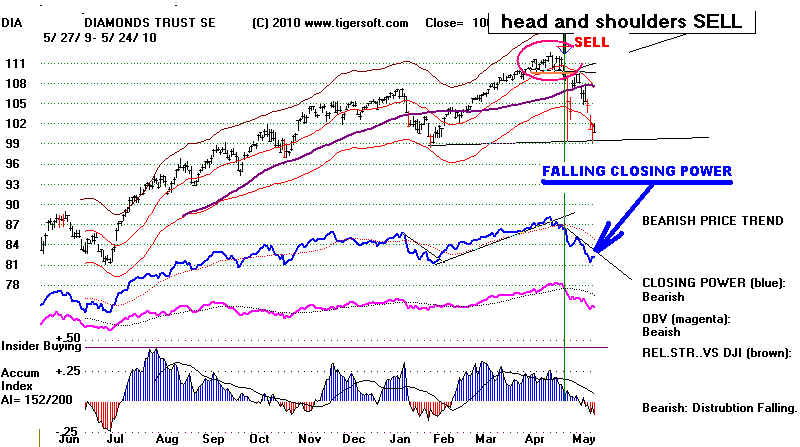
SPY
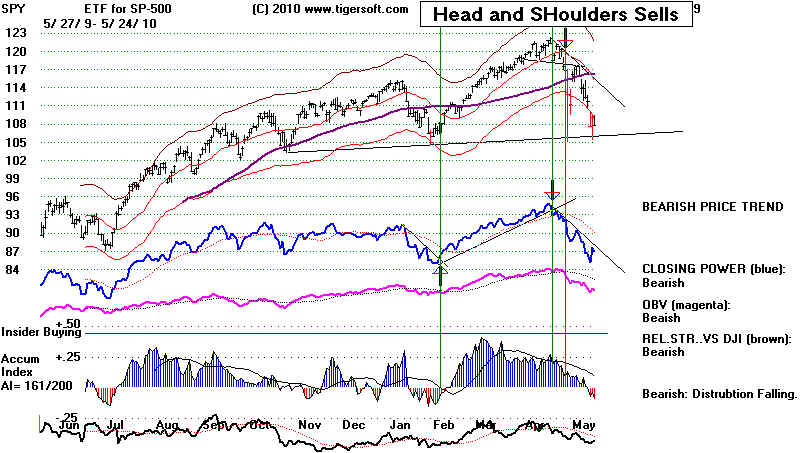
QQQQ
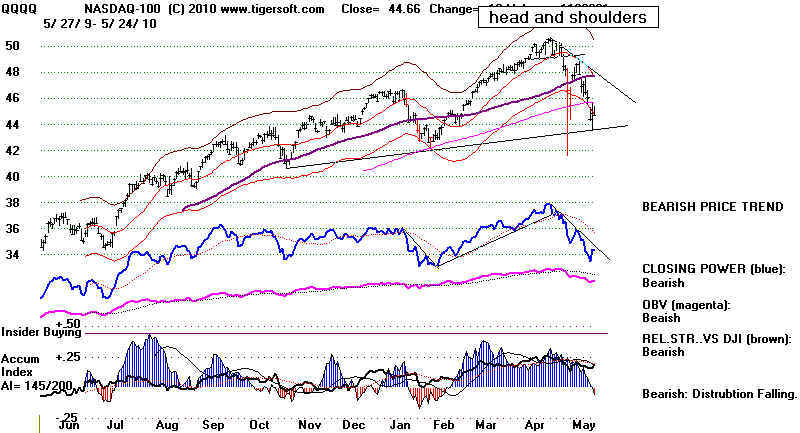
2) A DJIA CLose below 9800 would mean a
drop of
more than 12% from The DJI's High. I
would treat
such a decline as a "FAILSAFE SELL
S10".
The automatic Peerless signals still
have not given a Sell. They have their limits.
They do not
recognize head and shoulders patterns, for example. Yet we know
head and
shoulders patterns in the DJI should be respected. A close below the
pattern's
neckline should be treated as a judged Sell S5 or Sell S10 depending on
whether the
head and shoulders pattern took under 40 days to form or more.
The DJIA's
pattern formed quickly in late April 2010.
Head and
shoulders patterns are the market's way of quickly factoring in new
information. History offers a number of cases of this: Japanese attack on
Pearl
Harbor, Norht Korean attack on South Korea, Eisenhower's heart attack,
Cuban
Missile Crisis, JFK assassination, Nixon's New Economic Policy,
Attack on
World Trade Center. I did a hotline this recently. See May 5th.
Besides a
head and shoulders SELL, we need another rule when the stock
market
turns down and the automatic Peerless system fails to give an automatic Sell.
For years,
we used to say that traders should use a stop loss of 10% below the
DJI's
highest close after a big advance and point to the 1976 top as a primary example
when the
market did not show an ordinary major Peerless Sell, based on the usual
ways we
call market tops, by extreme Breadth (NYSE A/D Line) and/or Tiger
Accumulation divergences. Back-testing now suggests that a closing more than
12% below
the highest point in a strong advance should be treated as a judged
Sell, if Peerless has not produced its own sell. This is especially true when there
is a head
and shoulders top as now. The
cases of 1941 (impending attack on
Pearl
Harbor) and 2001 (impending 9/11) demonstrate this.
1941
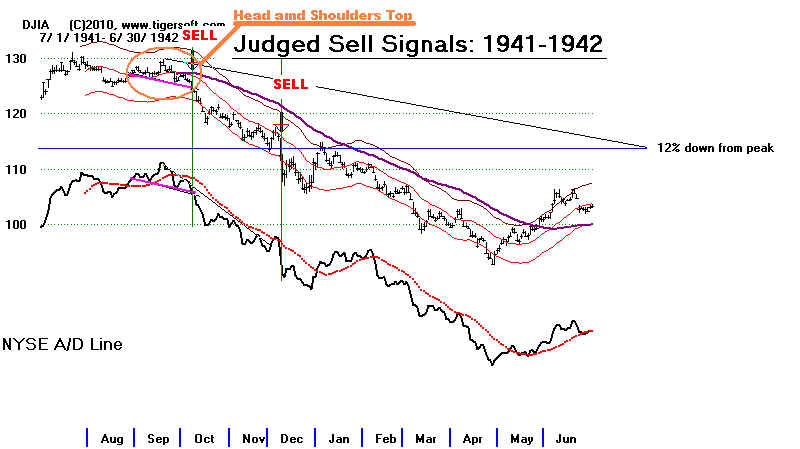
2001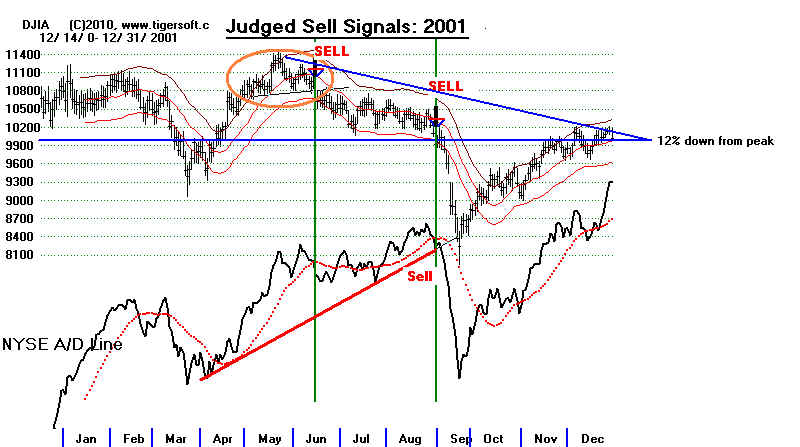
2009-2010
You can also see that
the year-long NYSE A/D Line uptrend has just been broken
This is bearish.
It does not always prevent a rally. But it shows that secondary
stocks and dividend
stocks are under pressure. 9800 has been tested now three
times. I have
found that the best chance for a reversal comes on the fifth test
of such support.
For now, we must just wait and see.
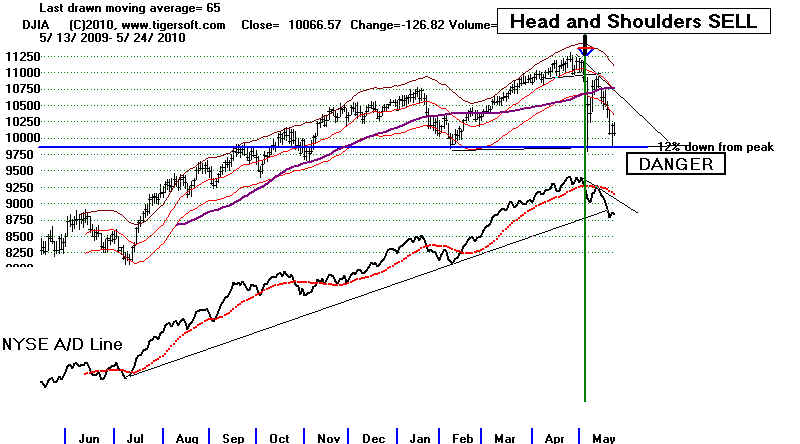
3) SHORT ETF RECOMMENDATIONS
Instead of going short by going long such ETFs
as DOG or QID, consider using the ETFs
representing
financials (SKF), semi-consuctors (SSG) or oils
(DUG).
Their CLosing Powers are in more pronounced
uptrends.
As long as their Closing Powers are rising, I would give
them a chance to advance as their underlying
groups
show weakness.
I fear that BP's eforts to stop the flow of oil
will fail.
This is very demoralizing. Our Hotline is
short considerably
more than we are long. These short ETFs
should be
bought to protect long positions or
aggressively.
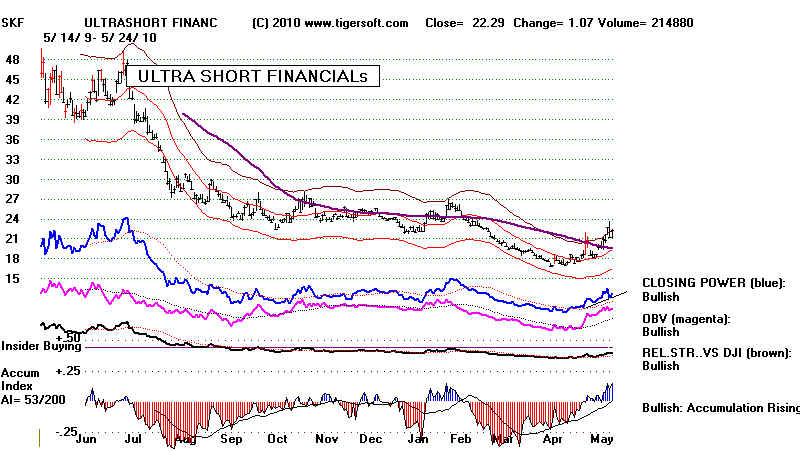
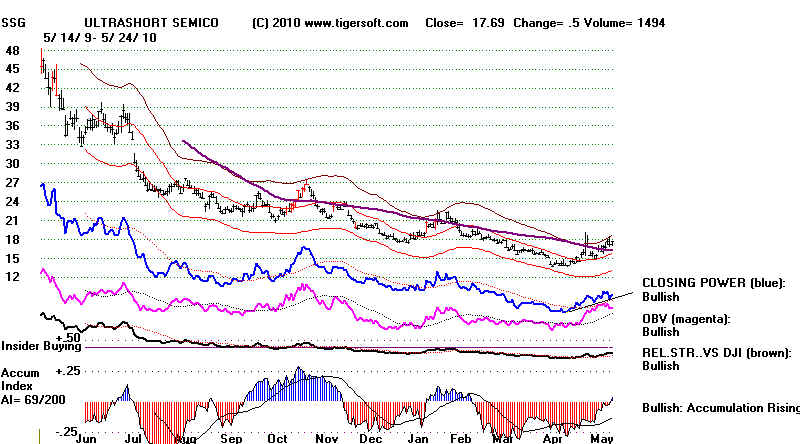
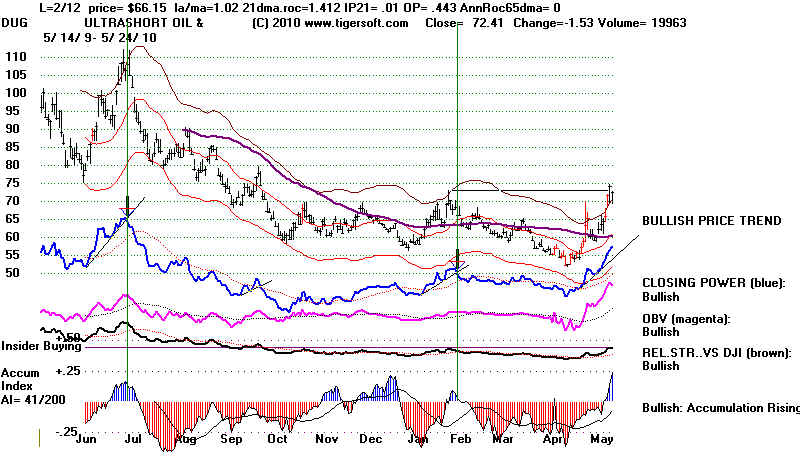
New Highs: NYSE = 3 New Lows= 16
bearish
New Highs: NASDAQ= 5 New Lows =36
bearish
Ratios greater than 10:1 are very bullish and 1:10 are very bearish.
-----------------------------------DJIA ---------------------------------
5/24/2010 10067
la/21-dma= .94
21dma-roc = -1.258 P= -581 Pch= -98
IP21= -.089 V = -540 Opct = -.291
21dma-roc >.70 shows
unusual momentum. A reversal down is more unusual.
More information on back-testing this soon.
IP21 (Current Accum.) >.25 make it harder for a downwards reversal.
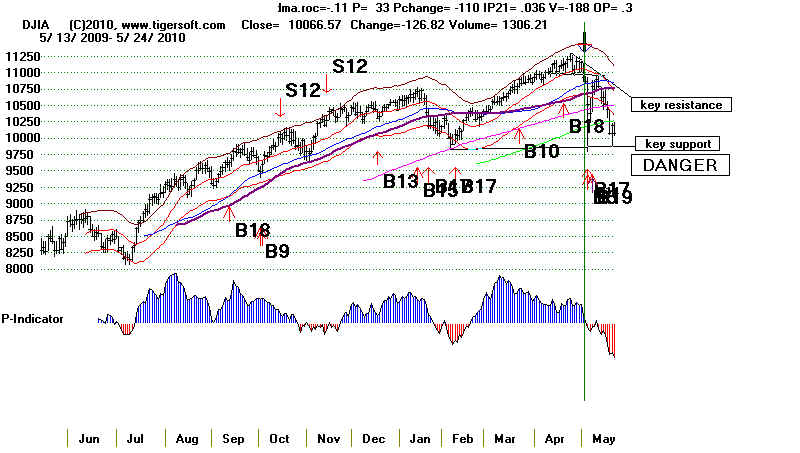
======================================================
======================================================
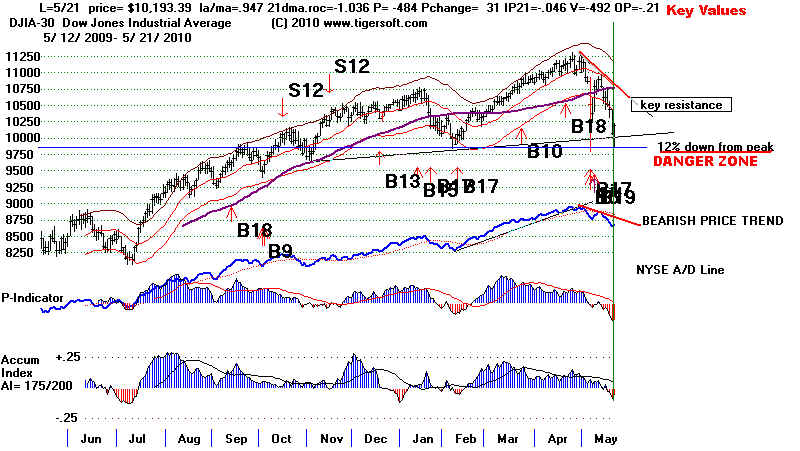
5/21/2010
- The DJI Bounced Back Friday after Falling
The Typical 9%-12% First Correction Percentage
Following
A Big (>+20%) Advance.
The Steep TigerSoft Closing Power's Have Not Been
Clearly Violated.
Traders Need To Wait A Little Longer before Using
The Operative Peerless Buys in This Context.
Safer, Still Is To Wait for The NYSE A/D Line
Downtrend
To Be Violated on The Upside.
If
9800-10000 holds again, we are apt to see a recovery back to 10,500. I think
such a rally will
require either success from British Petroleum's efforts to plug
their leaking Gulf oil
rig or the government's settlement of the Goldman Sachs
fraud case, The
market desperately needs some good news from somewhere.
Right now it is
digesting the very real possibility that the Gulf may be severely
damaged for fishing and
recreation for years to come. It is also discovering that
we have a President who
seems unable to make quick decisions even when they are
badly needed. Let
us hope BP can stop the spillage. What I read, does not make
me optimistic.
See my Blog about Obama, BP and The
Growing Risk of A Gulf 'Dead Zone'.
It has been revised a
little and I will add to it, as news develops.
If there is an
advance, I fear that it is apt to stall out quickly. To predict a rally past the
resistance of the
DJIA's declining price trend and then the falling 21-day ma, we will
need to see three
things in addition to there being a clear break in the CLosing
Power
down-trends:
1) The 65-day ma must not turn decisively down. It is still rising, but with
prices now so far below it, I would think it will turn down and that would set
it up as resistance to any advance.
2) The P-Indicator will have to turn positive. It now stands at a very low -484.
Breadth will have to be watched carefully. Friday did see advances outnumber
declines by 3:1. But Friday's can be very unreliable to use to call a reversal.
A weekend panic brings a more thorough selling climax.
3) The 9800 support must not be closed below by the DJIA. 9800 is important
support. It is not clear where the next suppor tis below that. See how the
DJIA
may be forming a right shoulder in a very long term chart.
Despite The Peerless Buys, Exercise Patience -
Wait for More Signs of A Bottom.
Our close study of the first 9%-12%
declines just after a very good DJIA advance of
20% or more since 1933 shows that as
long as the decline does not surpass 12%
from the last peak on a closing
basis, there is almost always a playable rally. The trick
is not to buy too soon. As long as the DIA's,
SPY's and QQQQ's Closing Powers
downtrends have not been broken, the history of
markets since 1993 shows that
we should be guarded and wait. Friday, the
steep downtrendlines of these CLosing
Powers were not clearly violated to the upside.
DIA
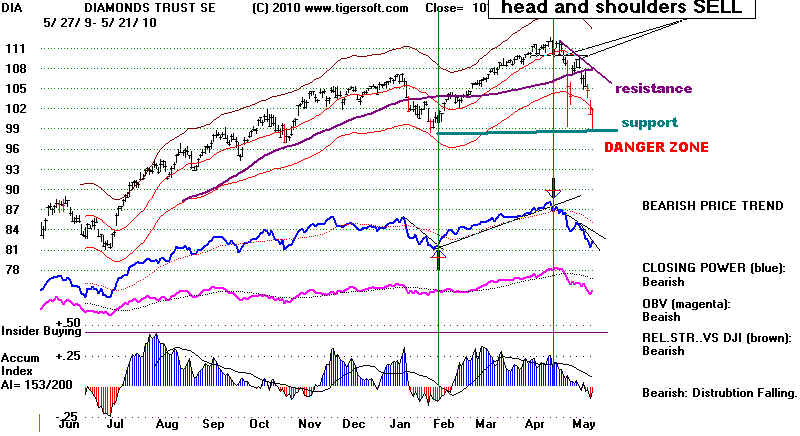
SPY

QQQQ
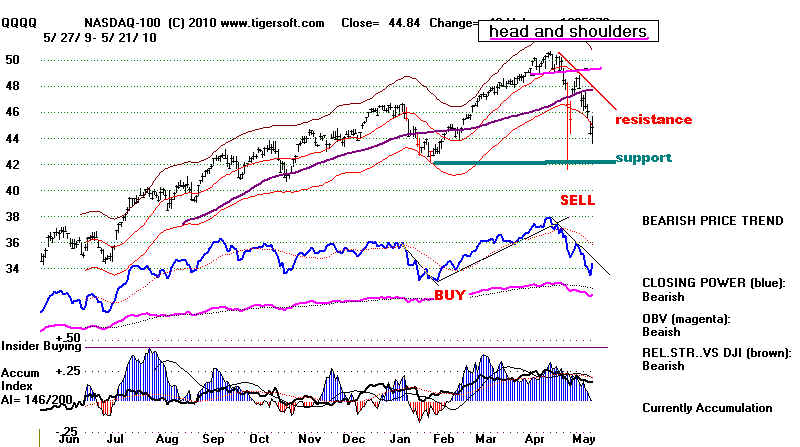
Watch The NYSE A/D Line Downtrend
We only have the data
to produce the CLosing Power back to 1993 for the DIA
or the SPY. To gain more confidence, use the
NYSE A/D Line, which we have data
back to 1928. Our close study of this data
shows the following:
Breaks
in its down-trendline after the DJI is down 9% offer an extremely reliable way
to call a bottom. See each of the 20 historical charts with the DJI in these circumstances.
See "The First 9%-12% Decline
Following A Big DJI Advance."
http://www.tigersoftware.com/Correction/
These charts will make you a believer, I think, in
using the NYSE A/D Line at present.
Once the A/D Line downtrend has been broken after the
first 9%-12% correction,
you can almost always expect a DJI rally to at least
the upper band and usually a
new high. Unfortunately, the NYSE A/D Line
downtrend now cannot be easily
violated. So, we just have to be patient.
DJIA.
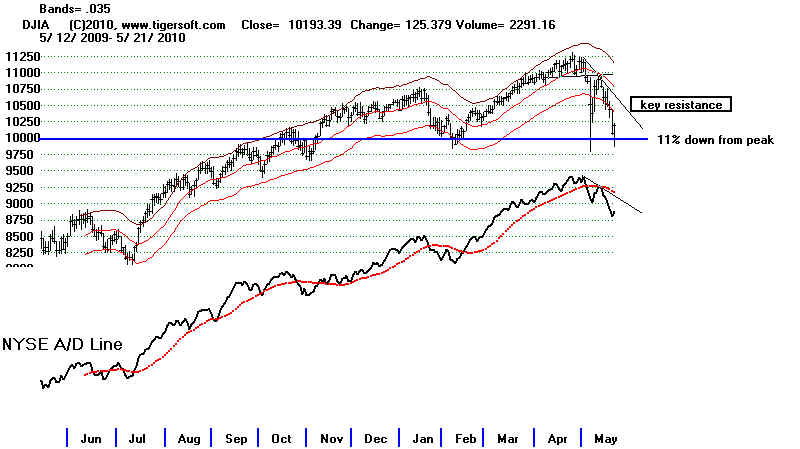
The A Rally To New Highs Are
To End before Playing A Bounce on the Long Side
in Accord with the Last Peerless Buys.
9800-1000
is the most likely support area.
=================================================================================
5/20/2010
- The DJI is now down 10% from its highs.
Wait for Downtrends of The TigerSoft CLosing Power
To End before Playing A Bounce on the Long Side
in Accord with the Last Peerless Buys.
9800-1000
is the most likely support area.
Declines down to a closing between 9% and 12% from the recent high
commonly bring
recoveries to new highs for DJI and
SP-500. However a close down 13% or more would
must be considered very bearish.
With down-side volume so high, the 9800-10000 support levels
on the DJI may not hold. They may
be sliced right through, just as the 200-day ma and NYSE
A/D Line were today. As we have
repeatedly said, the falling Closing Power must be abided by
before we try to play a recovery rally,
in keeping with operative Peerless Buys.
We have a perfect storm of
causes for Wall Street high anxiety:
1) Big profits are just begging to be taken,
2) Goldman's fraud charges,
3) The uncertainties of Wall Street reform,
4) New European deflationary policies in the middle of a recession,
5) Uncontrolled bear raids on whole countries by shorting credit default swaps nakedly,
6) Unregulated computerized trading that greatly exaggerates any trend using Fed
free money,
7) the British Petroleum oil volcano is spewing oil at an extremely high rate of
pressure, four times higher than any other oil well in the Gulf. This makes stopping
the flow with half-measures very doubtful. British Petroleum wants to avoid
destroying its hundred million dollar well, but that may be the only hope.
8) As the Mississippi Gulf moves closer to becoming a vast dead zone, from lack of oxygen
and oil dispersal toxicities and contamination, Obama remains tragically frozen
with an inability to be decisive and show a backbone. I think the
market is taking
the measure of Obama's lack of leadership and is wondering what next?!
9) Technically,
A.) The long NYSE A/D Line has been broken. This is bearish.
B.) The DJI and SP-500 have broken their 200-day mvg.avgs.
C.) If the January lows are violated, a big new round of selling will
be unleashed.
D.) The DJI shows the outlines of a massive head and shoulders top,
when one plots its graph from 1998 to the present. The recent move
to 11000 represents the apex of the head and shoulders pattern.
The neckline support for this massive pattern is way
below 8000.
That means there is now a 25% downside potential just to that support
level if the support at 9800-10000 does not hold.
Our stocks hotline will remain short more heavy distrubution stocks than we are long
among high Accumulation stocks... And tonight, I will suggest getting out of all stocks
whose AI/200 score is less than 190 if the DJI breaks 9800 on a closing basis.
Presently,
the futures show a Friday short-covering bounce may be deceloping. See
http://money.cnn.com/data/premarket/
DJIA CHART: 1998-2010
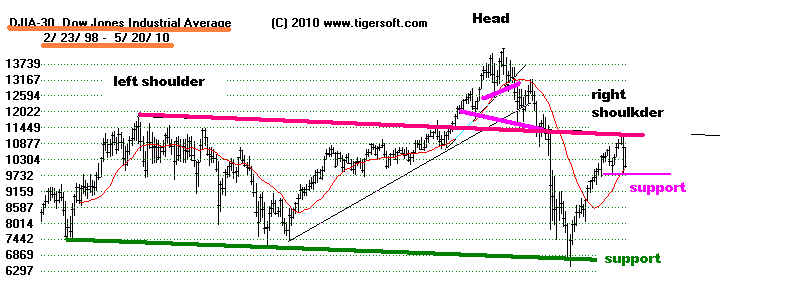
1198 1999
2000 2001 2002
2003 2004 2005
2006 2007 2008 2009 2010
Charts for 5/20/2010
New Highs: NYSE = 5 New Lows= 20
bearish
New Highs: NASDAQ= 8 New Lows = 52
bearish
Ratios greater than 10:1 are very bullish.
-----------------------------------DJIA ---------------------------------
5/20/2010 10068
la/21-dma= .931
21dma-roc = -1.158 P= -516 Pch= -156
IP21= -.082 V = -560 Opct = -.256
21dma-roc >.70 shows
unusual momentum. A reversal down is more unusual.
More information on back-testing this soon.
IP21 (Current Accum.) >.25 make it harder for a downwards reversal.
Completed head and shoulders
must be judged a Peerless Sell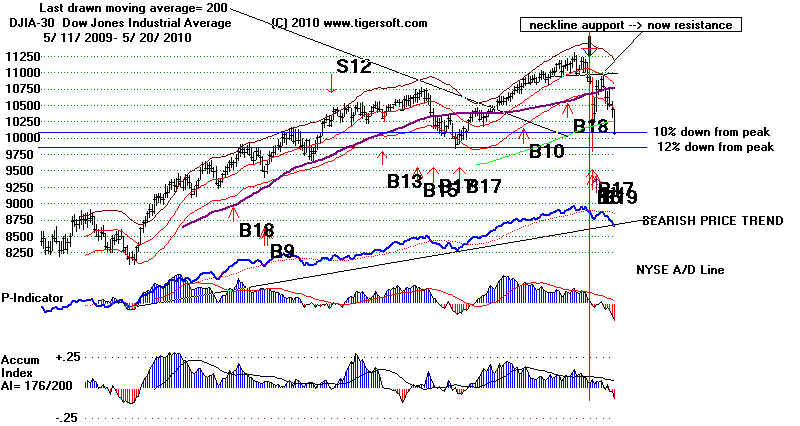

DIA - Bearish Head/Shoulders and
still Falling Closing Power
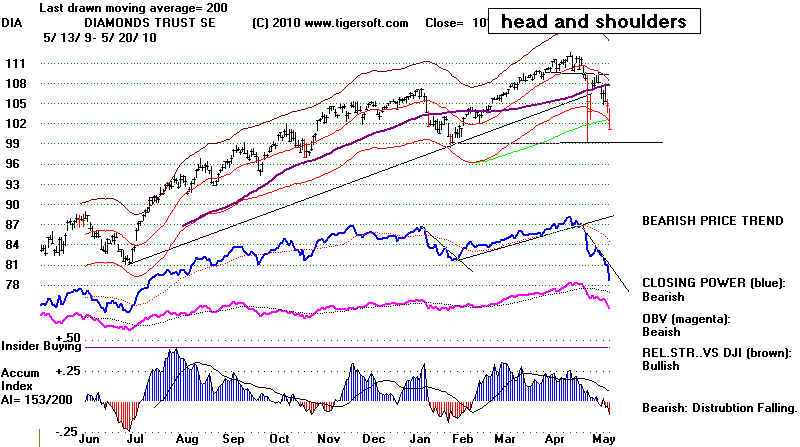
SPY - Bearish Head/Shoulders and
still Falling Closing Power
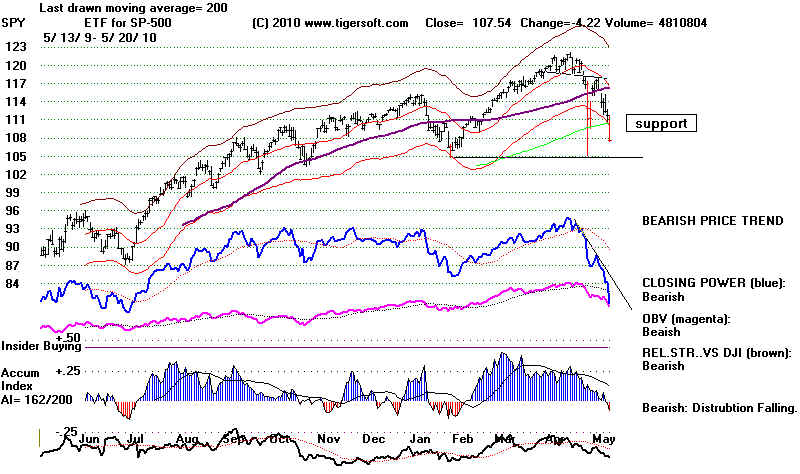
QQQQ - Bearish Head/Shoulders and
still Falling Closing Power
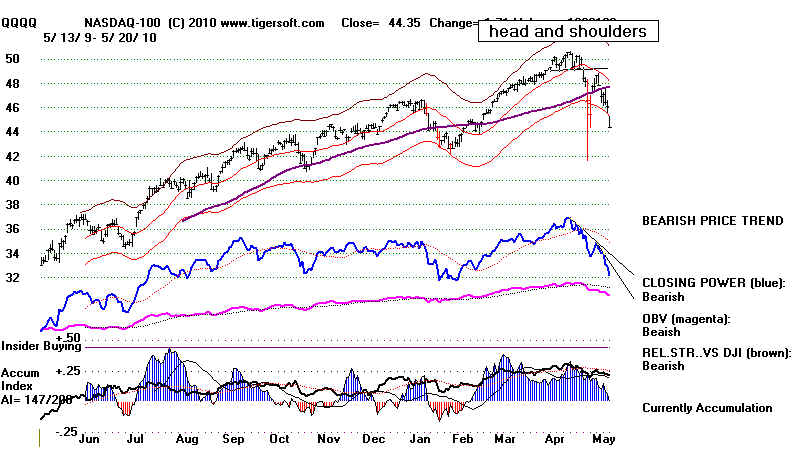
======================================================
======================================================
5/19/2010 - Peerless remains on Buys.
But Lots of Bearish SIgns. And Fewer Places To Hide.
It is
not good that the DJI today closed below the 3.5% band and breadth deteriorated
compared to Tuesday. The DJI most likely needs to
test its best support near 10000. There
are lots of cases of broad 10% trading ranges after a big
advance. Wait for the TigerSoft
Closing Power's current downtrend to end and be broken to
buy. Our stocks' hotline is
hedged, owning the very highest AI/200 stocks and holding
short the very weakest, those
rated most "bearish" by the Power Ranker.
Professionals Are Still Selling To The
Public. A 10%-12% decline from the highest closing
is common after a very long advance. That means we
should look for a bottom between
10071 and 9873 on the DJI, although it may come sooner or
not at all. Be careful, because
a DJI decline and closing down more than 12% from the peak
on 4/26/2010 at 11205
would have very bearish precedents. This is what
happened, also following a head
and shoulders pattern, just before the attacks on the
US at Pearl Harbor in 1941
and on 9/11/2001.
The odds do favor a
rebound. Since 1933, There were 20 earlier cases of rebounds
after mean-looking 8.5% to 12% declines following big
advances in the market. This is
a normal corrective process. In 14 cases the declines
were 10% to 12% deep.
Profits are being taken
quickly and clumsily after the big advance. The NYSE Advance
Decline Line has now retreated back to its uptrendline
going back to last July. A break
would be additionally bearish. This used to be
considered a judged Sell S6 in the
original Peerless of the 1980s. Such breaks do not
prevent a subsequent rally, though.
And, without an automatic Peerless Sell, the odds still
favor a bottom in here and another rally,
with the DJI and SP-500 making a nominal new high.
This was true in 19 of the 20 cases.
Air is still coming out of the
speculative balloon. Since the peak of April 23,
there have been 7 up days and 11 down days. The up-days'
volumes were in each case
below the down-day's volume the day before.
Institutions want out of the market. And
so do professionals, judging from the declining Closing
Power.
Lack of Leadership Is Making Things Worse.
The news seems overwhelmingly
bad. I think one of the problems is that the
national leadership is seen only responding to
worsening events and not offering
hope through leadership. Obama is great with
words, a crowd and a teleprompter.
But he is excruciatingly cautious. He is good
at restating problems. But he delays
a solution by getting others to study the problem for
months. With oil streaming out
of the man-made volcano every minute in the Gulf, the
weakness in his dilatory approach
could not be clearer.
What is worse, Obama is turning the
job of finding solutions over to the same people that
created the problem or have shown no ability to solve
it when Bush was President.
This has been true with his handling of Wall Street's
big banks, Iraq-Afghanistan,
health insurance and now the Gulf.
Obama too often is unwilling to
offend and challenge the biggest corporations. It seems
clear that British Pete put their profits ahead of
protecting workers and the environment.
This is not the first time that they have done this.
Now they only want to use as methods
to stop the vast oil flow they have created into the
Gulf, those which will save their well.
They prefer to use golf balls and mud, instead of
getting the US Navy's help in just
blowing up the pipeline. The more dramatic
approach would probably work quickly and
effectively. It would save the Gulf from
slow death by oil strangulation. Left to BP's experts,
the leakage may continue for months and months.
Is such an approach feasible?
The pipeline that is spewing unmeasured amounts
of raw crude actually goes down 15000 feet below the
bottom of the ocean to the oil field.
Exploding the pipeline would not mean opening up the
whole oil field to sudden release.
The pressure of the seawater 1 mile down is
tremendous. This pressure would hold the
displaced sea bottom in place if explosions were
planted to push in and cave in the
pipeline from all sides. This would certainly
block the hole better than mud and golf balls.
But Obama wants to study the cause of the
whole mess and he has given British Pete
complete operational control of fixing the
problem. Is it too harsh to say that he is
afraid to make a decision and is with just passing
the buck. Worse, he is again turning it
back over to very "experts" who caused the
problem. I have said before Obama has
the backbone of a jellyfish. One might have
hoped he would relate better to the death
of millions of sea creatures. While I hope I am
totally wrong, Obama's mode of avoiding
making big decisions is now all too clear. I
think we are in big trouble with him as
President. .
.
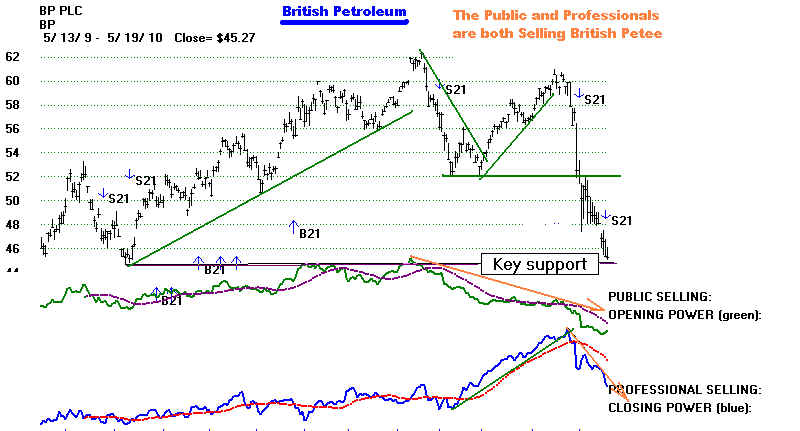
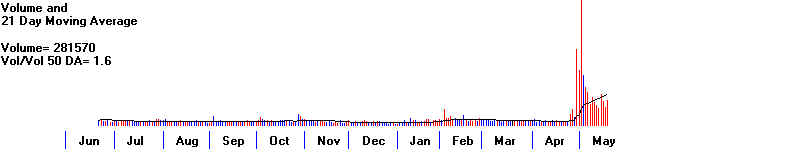
DJIA
Head and Shoulders' Pattern
Judged Sell
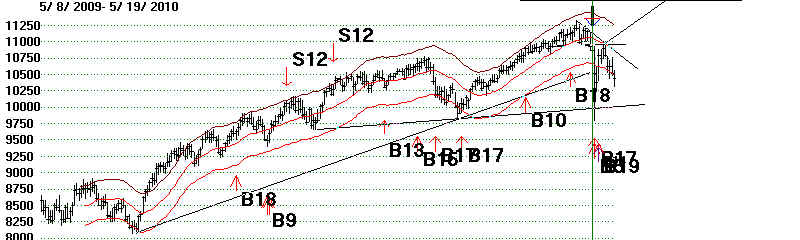
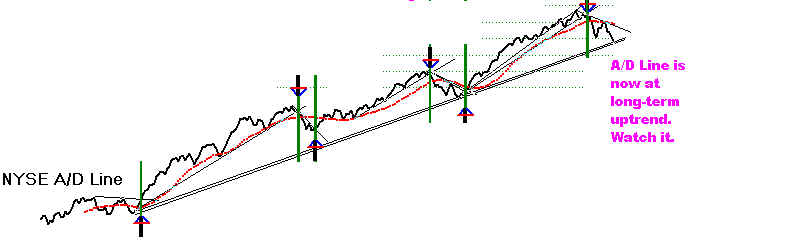

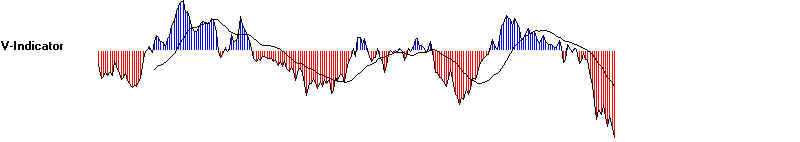
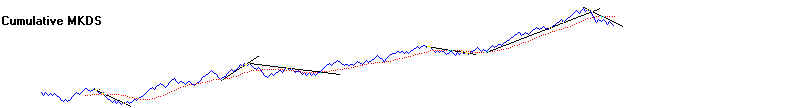
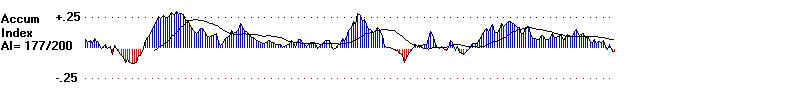
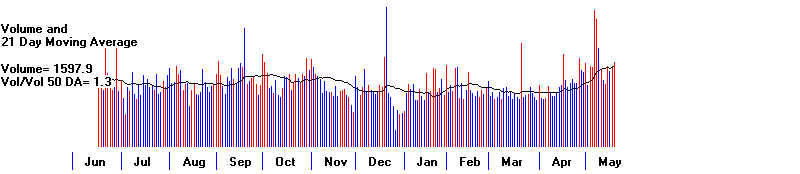
DIA - Bearish Head and Shoulders
Declining CLosing Power Trend is bearish.
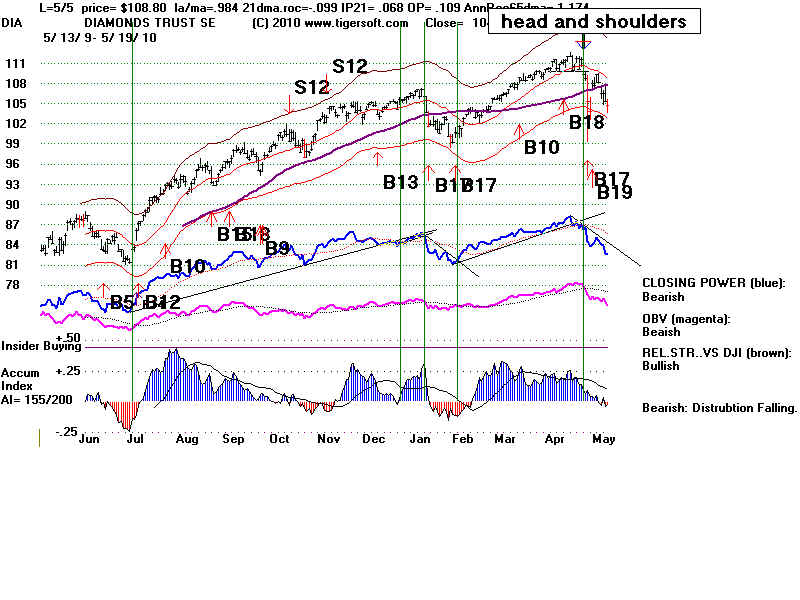
QQQQ - Bearish Head and Shoulders
Declining CLosing Power Trend is bearish.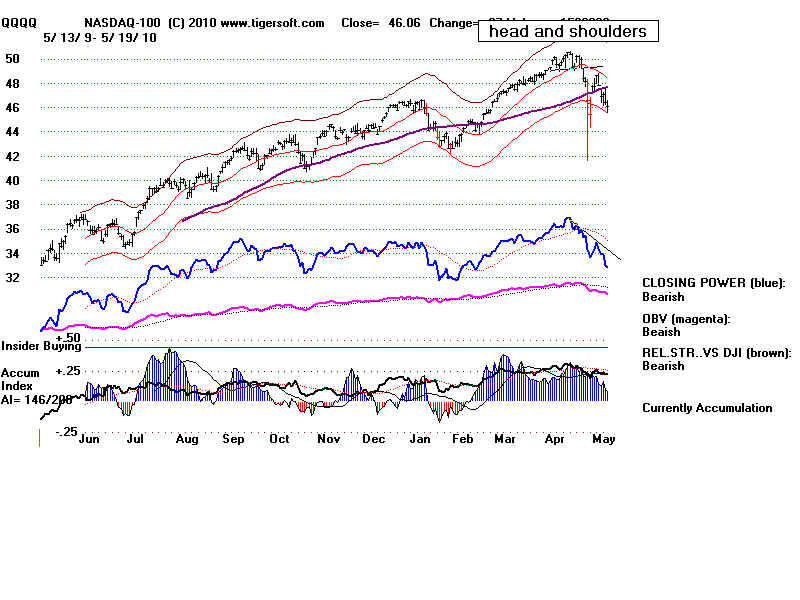
=====================================================================================
=====================================================================================
5/18/2010 - Peerless
remains on Buys.
But Lots of Bearish SIgns. And Fewer Places To Hide.
Wait for the
TigerSoft Closing Power's current downtrend to end and be broken to buy.
Professionals Are Still Selling To The Public.
The market seems bound to test the 10000 support.
That would set up a 10% trading
range, 10000-11000. These are common after a
substantial advance. The market is beset
with the same bearish jinx that targets all marlets for
years ending in "0" since 1900.
Nothing seems to be going well.
1) a volcano closes the skies in Northern Europe,
2) Short Sellers like Soros and Goldman Sachs do a bear raid on an entire
country (Greece) with the Fed's money,
3) a man-made volcano of oil a mile down in the ocean suddenly spews vast
amounts of toxic oil tars on the entire Gulf of Mexico,
4) the pillar of Wall Street, Goldman Sachs, is charged with criminal fraud
and so stops pumping the over-bought stock market higher.
5) European conservatives turn into champions of austerity in the middle
of a recession, thereby making the same mistakes that their counterparts
did in the late 1920s and 1930s.
With austerity programs in Europe taking over,
deflation becomes a bigger risk now.
Oil, Gold and Silver are each pulling back. So,
there are few havens right now, except
very high Accumulation stocks, and these should be
hedged against by shorting the lowest
Accumulation stocks. I do think Gold will reach
1300 this year. That is the minimum price
objective set up when it broke out past 1000 from an
inverted head and shoulders
pattern. October 6, 2009 Blog GOLD's Breakout Past 1000/ounce into
All-Time High Territory Invites
Comparisons with 1970s.
I should also mention Hewlett Packard. This is
now the second highest Accumulation
Stock in the DJI now, after UTX. Today HPQ
reported good earnings and a better outlook -
http://finance.yahoo.com/q?s=hpq
But watch it tomorrow to see if
can hold above the
horizontal support level it has fallen to. Both
HPQ and UTX have falling CLosing Powers.
Traders should buy then when they break their
downtrends.
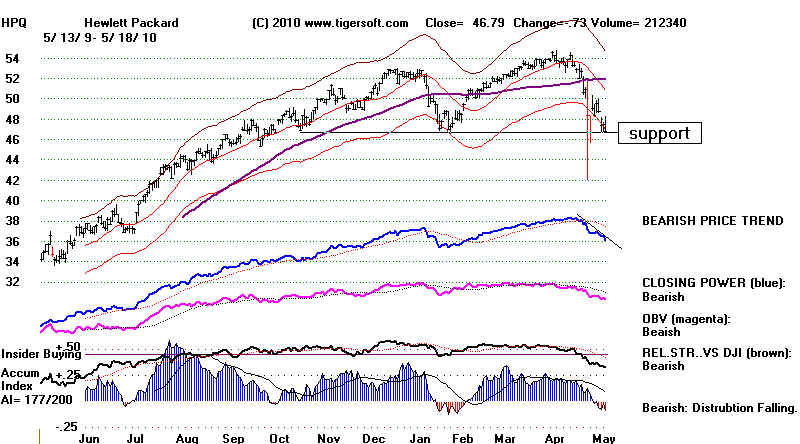
Oil
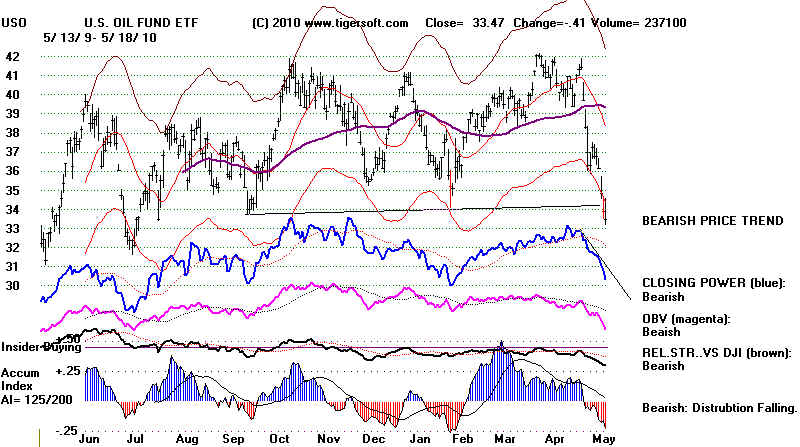
Gold
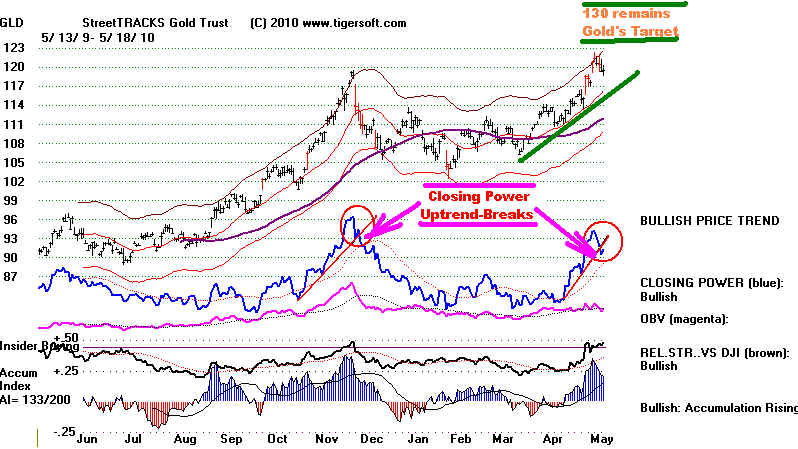 Silver
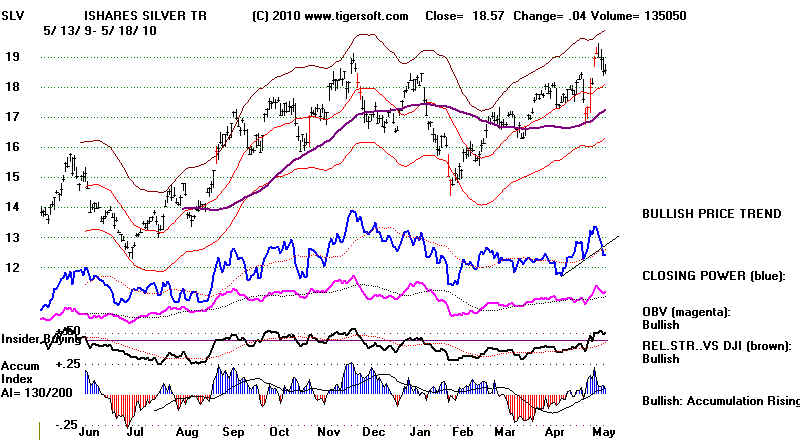
3 of The Highest Accumulation Stocks: LCUT, QPSA, BITS
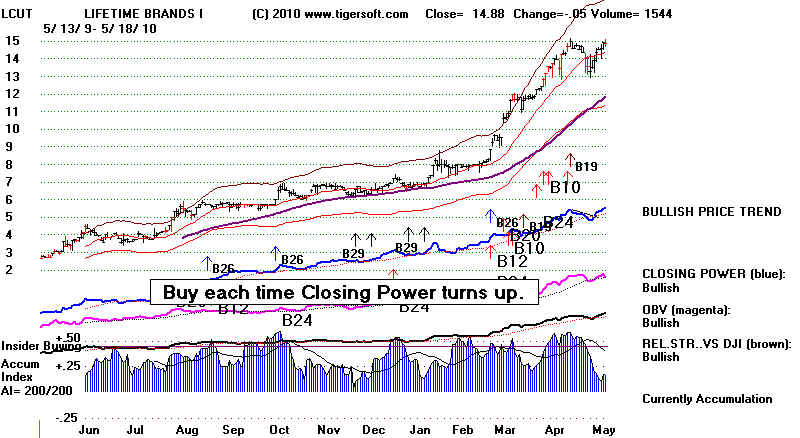
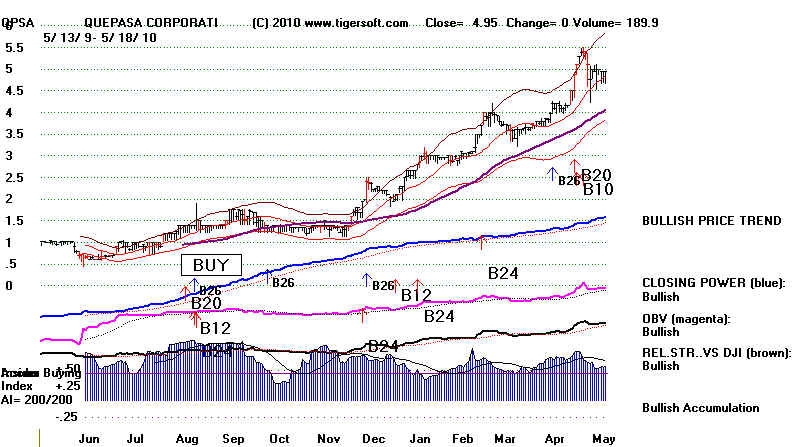
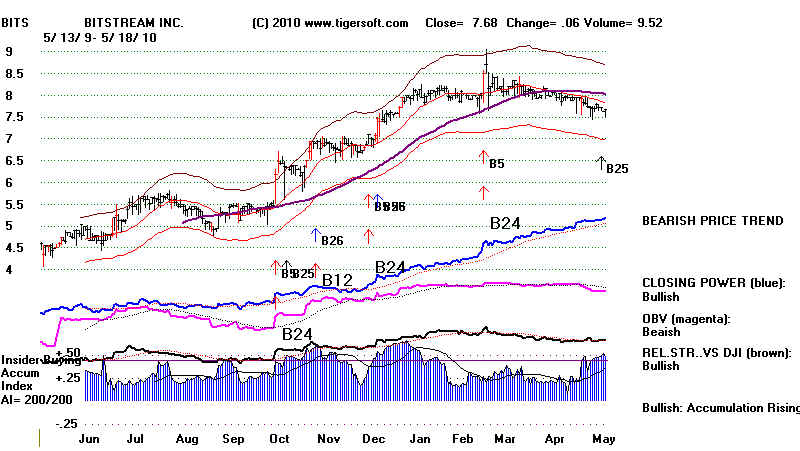
3 of The Lowest Accumulation Stocks: ENER, AONE SPWRB
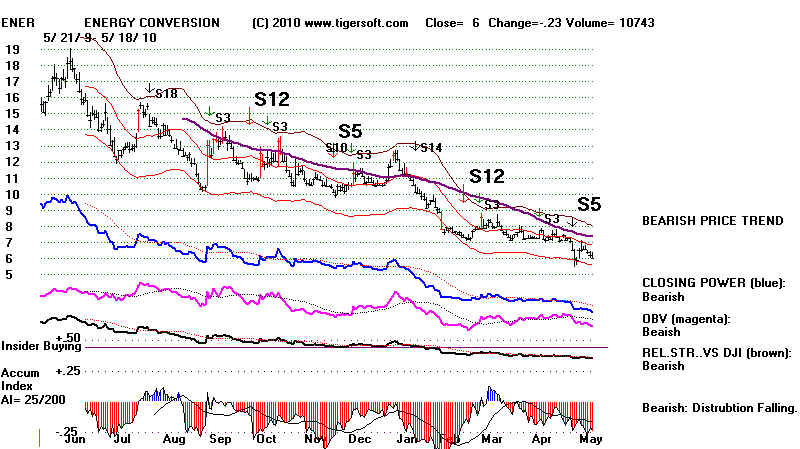
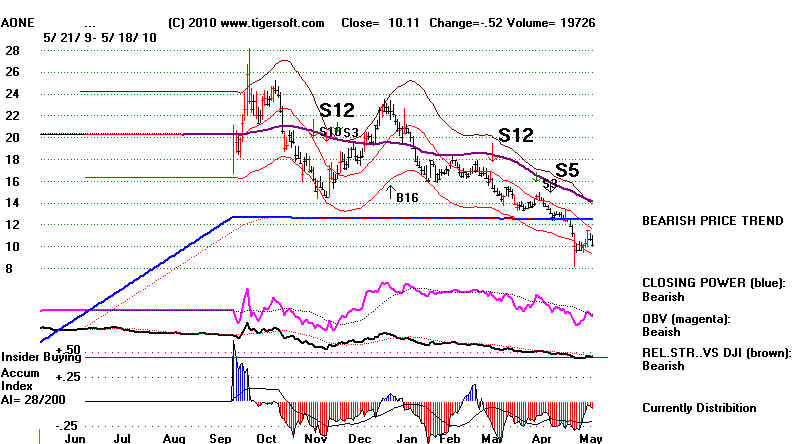
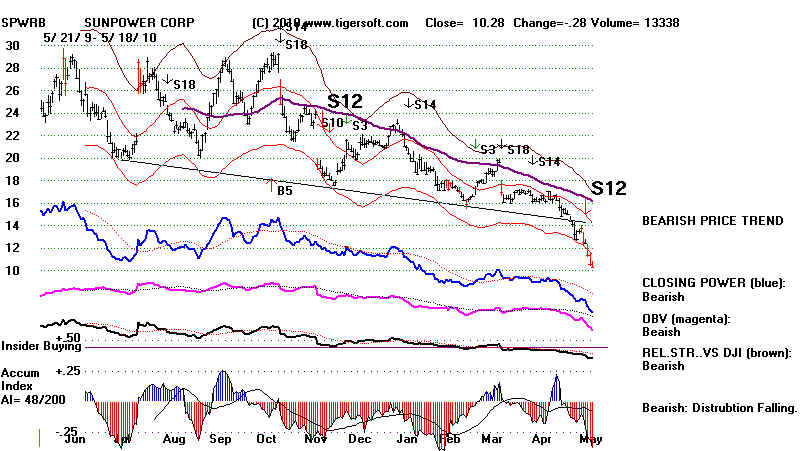
================================================================================
================================================================================
================================================================================
----------------------------------------------
DJIA ------------------------------------------------------
5/17/2010 10625.83
la/21-dma= .973
21dma-roc = -.427 P= -121
Pch= +61 IP21= +.032 V = -357 Opct = +.013
21dma-roc >.70 shows
unusual momentum. A reversal down is more unusual.
More information on back-testing this soon.
IP21 (Current Accum.) >.25 make it harder for a downwards reversal.
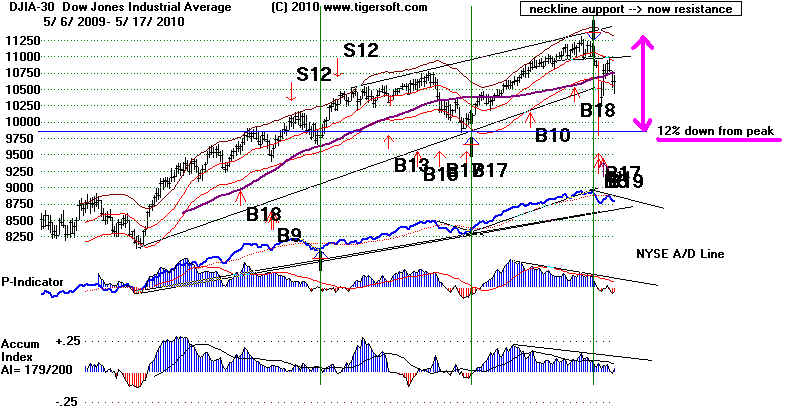
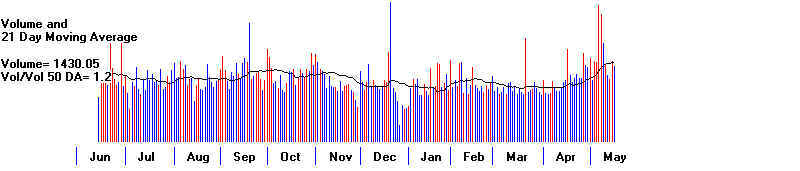
5/17/2010 - Peerless remains on Buys.
Wait for the TigerSoft Closing Power's current downtrend to end and be broken to
buy.
Professionals Are Still Selling To The
Public.
The DJI recovered from a 150 point decline and
closed up 5. Down volume was
still 33% greater than up volume and there were
600 more down than up on the NYSE.
Opening Power is rising and Closing Power is
falling. This shows professionals
are selling to investors overseas and the
general public. A higher opening is likely
in this environment, but we have to be careful
of a late sell-off. Only 45% of the time
is the DJI up from May 17th over the next week.
A fuller test of the lowest closing
on this decline, about 10400, is quite
possible. But, so long as the DJI does not break
9800, in the absence of an automatic Peerless
Sell, I think we can assume that there
will be another rally to 11000 and the upper
band.
It is common (21 cases since 1932) for
there to be a 9%-12% pullback after a long or big advance.
Such an intermediate-term decline is much more
likely than a bear market, i.e. decline of more than
20%. With one
exception, November 2007, such a 9%-12% decline has always then been followed
by a Peerless buy and more new highs.
As you can see in the second table below, DJI
declines deeper than 12% (using the hypothetical
DJIA lows) are rare. But, they should be
taken, in themselves, as precautionary Sells. This rule is used
to prevent a big decline from overtaking us if
we have no Sell signal. Peerless shows no cases of that
now, but we need to use some kind of STOP LOSS,
to be safe.
Big head and shoulders patterns can bring
declines deeper than 12%: 1946, 1962, 1971. So can multiple
sets of major Peerless Sell at a series of tops
over six months to a year: 1959, 1969, 1972-1973,1976,
1980-1981, 1987, 1999-2000, 2007, 2008.
5/18/2010: NEW PEERLESS RULE:
We should also consider a 12% decline below the top of a minor head and shoulders top
to be a MAJOR SELL based on the 1951 and 2001
experiences See just
below.
In addition, the 1946, 1961-1962 and 1971
larger head and shoulders patterns' experiences also
reinforce this rule.
US 12% Stop Loss below Head and Shoulders Pattern
Peaks.
Smaller head and shoulders patterns, like we
see now usually do not have so much bearish power,
but they should not be dismissed. Coupled
with more than a 12% decline they are very bearish.
Such head and shoulders patterns appeared 3
months before the attack on Pearl Harbor and
before 9/11. The attack on Pearl
Harbor caused the DJI to fall more than 12% from its
September peak. The bear market then
lasted for four more months. In 2001, a decline by the
DJI of more than 12% from its peak in its head
and shoulders pattern preceded by just a few days
the actual attack on the World Trade Center.
Accordingly, we would sell out completely on a
close down more than 12% from the April peak.
That would mean a close below 9873.
Pearl Harbor - 1941
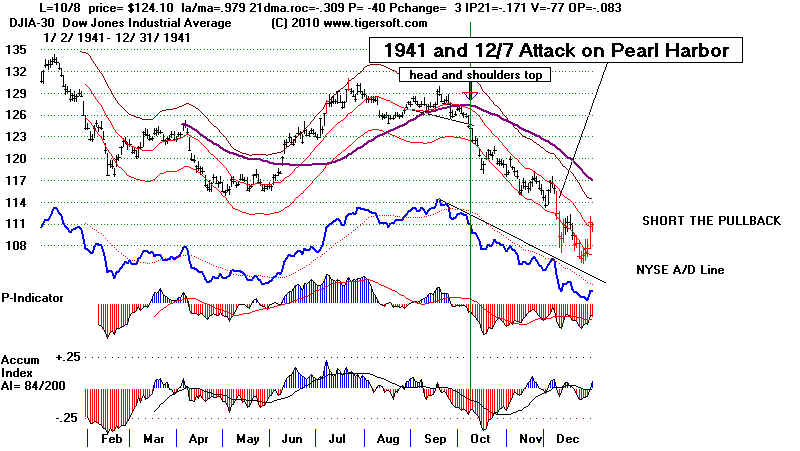
2001 and Attack on World Trade
Center
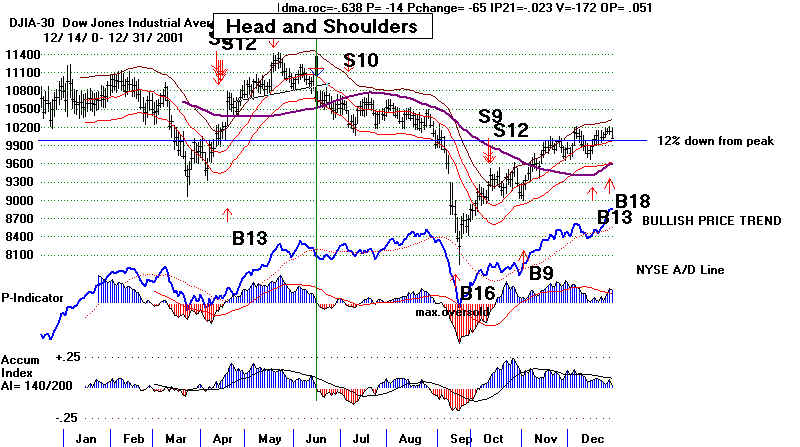 |
9%-12% Declines
from Peaks after a Big Advance Are Common
20 Cases - 1933-2010
This does not include declines after rallies of less than 20%.
Most of rallies are much more substantial.
(ES = earlier Sell... LB = later Buy)
Decline after Advance Percentage Down
Sell
Buy
Previous DJI Rally
with 8% decline until this.
---------------------------------
--------------------------- -------------
------------- ----------------------------------
July 1933
20%
Sell S12 Buy B19 52 to 108
March-April 1936
12%
Sell S12 Buy B2 98 to
148
March-June 1937
15%
Sell S9 Buy B8
143 to 193
July 1938
10%
Sell S12 Buy B19 100 to 145
July - Nov 1943
11%
none Buy B1
93 to 145
Jan -Feb 1946
10%
Sell S8 Buy B19
130 to 205
June - July 1950
15%
ES9 LB4
162 to 228
Sept - Oct 1955
10%
none Buy B5
255 to 488
July - Sept 1959
9%
Sell S4 Buy B17
440 to 678
April - June 1965
11%
Sell S8 LB10
560
to 940
Sept - Nov 1967
10%
Sell S12 Buy B17 740 to
940
June - Sept 1975
11%
Sell S8 Buy B17
577 to 876
Sept - Nov. 1976
9%
Sell S2 Buy B2
777 to 1018
Nov - Dec 1980
9%
Sell S9 Buy B17
775 to 1000
Aug - Sept 1986
9%
ES9 Buy B17
1090 to 1900
Oct - Oct 1989
10%
Sell S9 Buy B17
1740 to 2800
Jan - Mar 1994
11%
Sell S4 Buy B19
2490 to 3990
May - July 1996
10%
Sell S1 Buy B17
3700 to 5800
July - Oct 1997
15%
LS S12 Buy B17/B19 6400 to 8299
July - Oct 1998
20%
ESell S9/S12 Buy B9 7200 to 9300
Aug - Oct 1999
12%
Sell S12 Buy B17
7200 to 11250
Feb - Oct 2004
9%
Sell S9 Buy B2/B9 7500
to 10750
Feb - April 2005
8.5%
Sell S15 Buy B19
9800 to 11000
July - Aug 2007
10%
Sell S9 EBuy B14
12000 to 14000
Sept - Nov 2007
10%
Sell S4 Buy B19
cycle 2 of previous
drop.
April - April 2010
12%
H&S Buy B17/B19
6450 to 11000
|
SPY
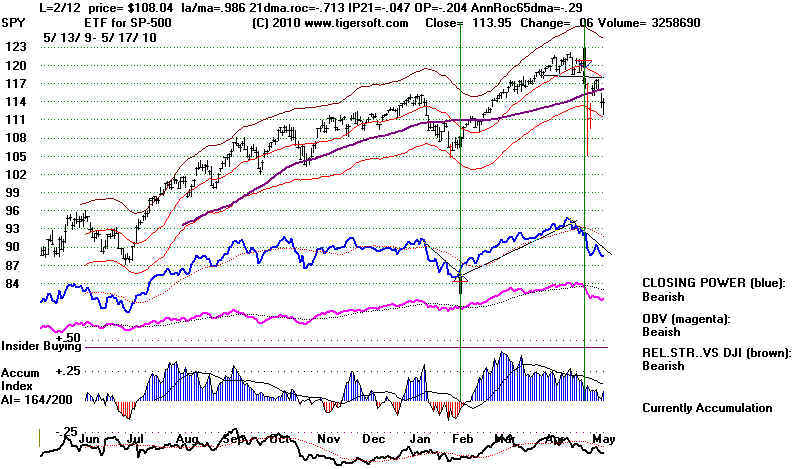
QQQQ
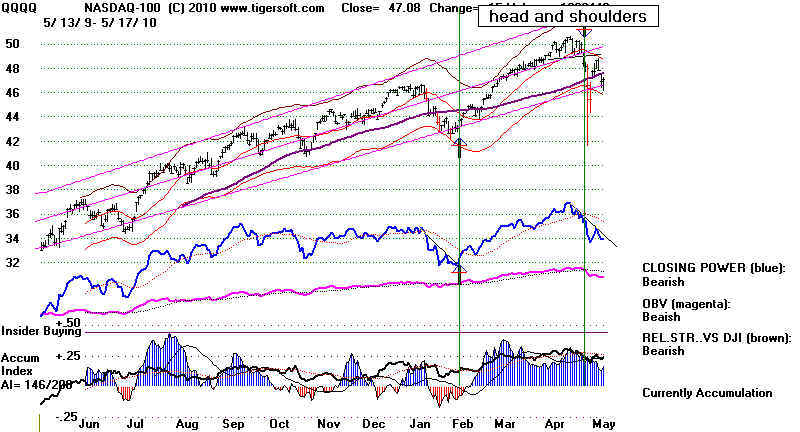
=============================================================================
=============================================================================
5/14/2010 - Peerless remains on
Buys.
But watch the TigerSoft Closing Power's current downtrend.
Professionals Are Still Selling To
The Public.
Buy when that Tiger CLosing Power
downtrend ends.
A 10% Wide Trading Range Is Probably
Setting up. There are many
precedents for that.
We are suggesting reducing long stock
positions to those with
an Ai/200 score over 170 and doing some
hedging with short sales..
.
Head and Shoulder.
Closing below its neckline in judged Sell
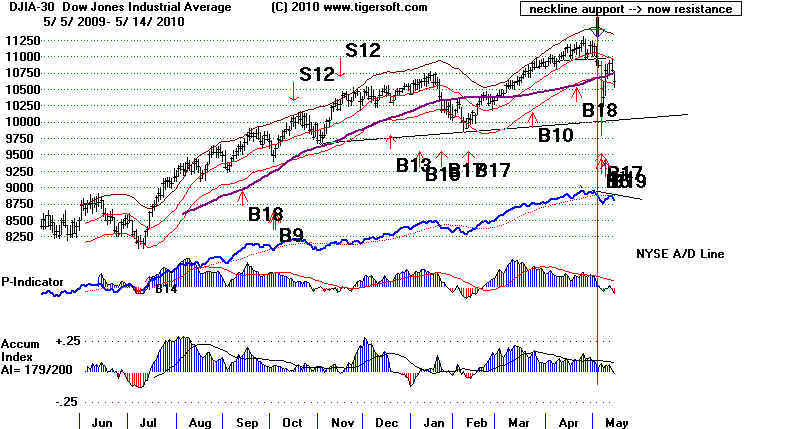
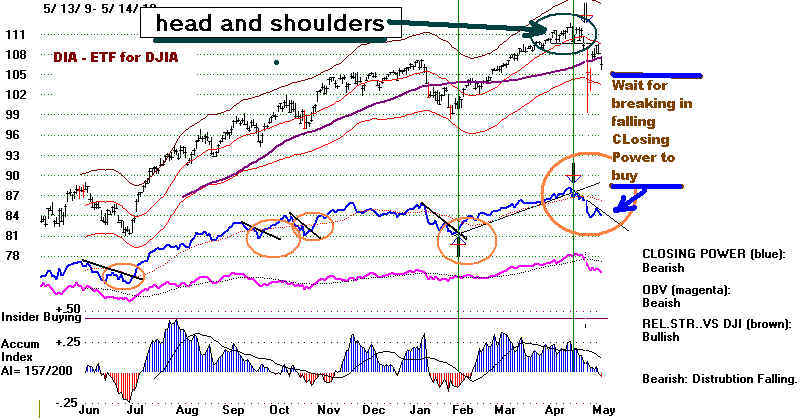
Note bearish head and shoulders,
bearish downward zig-zagging of
Closing Power.
Wait for its downtrend to break.
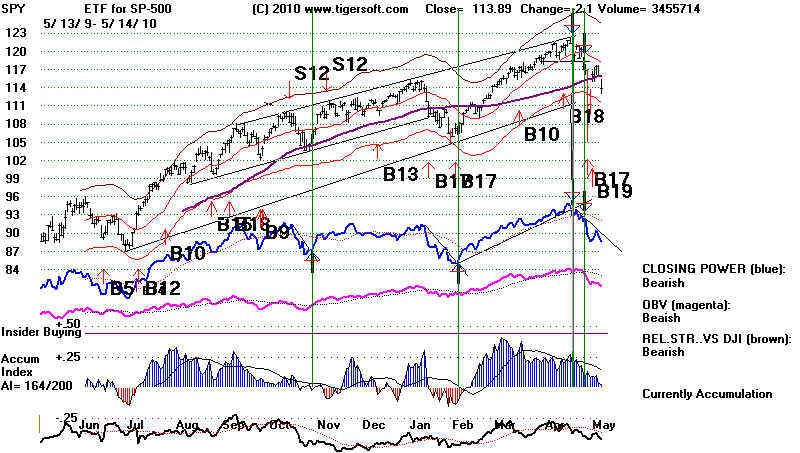
5/14/2010 -
Peerless remains on Buys.
But watch the TigerSoft Closing Power's
current downtrend.
Professionals Are Still
Selling To The Public.
Buy when that Tiger CLosing Power
downtrend ends.
A 10% Wide Trading Range Is
Probably Seting up. There are many
precedents for that.
We are suggesting reducing
long stock positions to those with
an Ai/200 score over 170 and
doing some hedging with short sales..
The DJIA has now fallen back
to the lower 3.5% band without a new Peerless Buy.
Wait for the TigerSoft Closing Power to break its
downtrend for the QQQQ, SPY and
DIA before adding to long
positions. The NYSE
A/D Line is also in a clear downtrend, too.
In the best historical parallel we
can find, late 1989, waiting for the A/D Line downtrend to be
broken to the upside cost little in
terms of buying at a higher level and provided more
security. In 1989, the DJI
did not fall below the 3.5% lower band on its re-test of its
lows on the initial 10% decline.
We are hoping we will see the same limited downside
action here, namely that the DJI
will next turn up from the lower band. But caution and
waiting the the CLosing Power
down-trends to end seem justified. Following the trends
of the CLosing Power is a winning
strategy for anyone trading the QQQQ, SPY or DIA.
The DJI has rose only 40% of the
time in the 5 trading days after May 16th from 1965 to
to 2007.
Investors are now wondering if the FED has used up most of
its ammunition in the
matter of the indicated its support
for the EURO. It is clear that more and more European
governments are being forced by
bankers and their orthodoxy interests and ideology
to cut back spending in an effort
to balance budgets. The 1930s should have taught them that such
cut-backs raise unemployment which
reduces government revenue causing still more
fiscal austerity. This
self-reinforcing downware spiral led in the 1930s to a Depression
and fascist nationalisms. See
the Economics of
fascism and The
1920s' road to depression
and fascism.
The
US Dollar is a clear beneficiary of the current financial pressures on Europe.
The strength of the Dollar will
tend to bring foreign money into US equities, as well
as Gold and Silver. As long,
as the EURO does not fall too precipitously, thus shattering
the ability of businesses to buy
and sell altogether, US stocks should not fall more than 12%
from their highs and drop below
9880. In the end, the solution may well be ending the EURO's
universality in the Common Market
in favor of a return to local currencies. 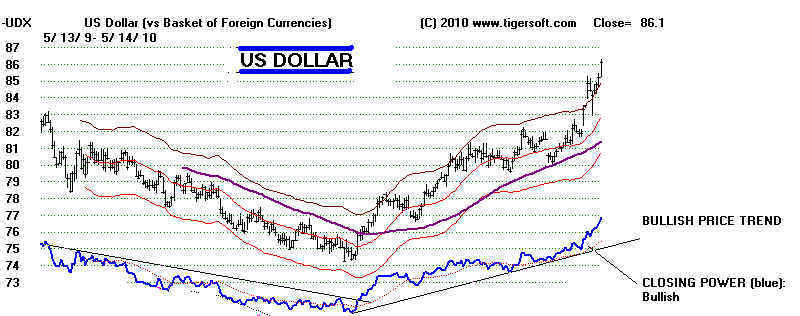
Although Peerless remains on a Buy and the 10-month NYSE
A/D Line is still in an uptrend, we still
have to be cautious. The biggest danger is that
the longer-term DJI has topped out here at 11000 and is
forming a right shoulder in a massive head and
shoulders pattern that started with a left shoulder
peak in 1997. Head and shoulders patterns on
this scale are not perfect. In 1925, the DJI moved
up past the apex of the right shoulder and ran to a
new high.
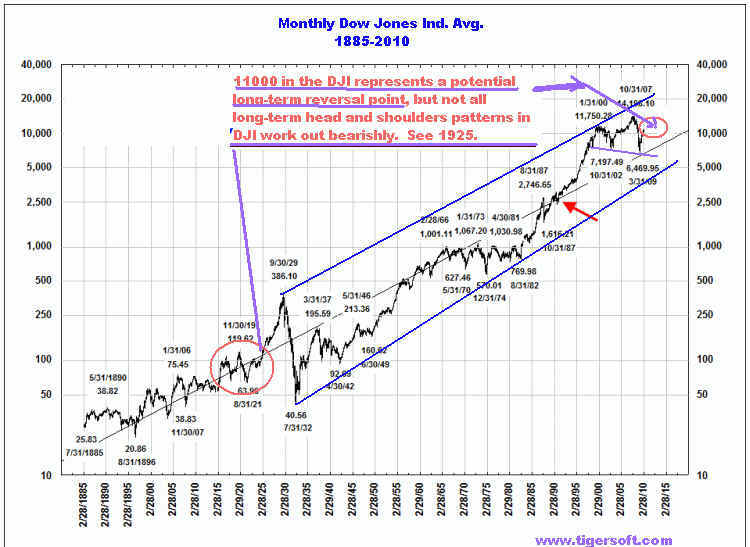

The San
Francisco Earthquake of 1906 led to the Stock market Crash of 1907.
Another concern is
fundamentals. The size of the Gulf underwater oil volcano that British
Petroleum and friends have unleashed has
almost certainly been under-estimated. The economic hardship
this will cause is astronomical.
Insurance companies will have to sell a lot of stock to pay
all the claims, just as they did after
the Great San Francisco earth quake in April 2006. The role
of the Earth Quake in bringing on the
1907 Bankers' Panic is a lesson for us to considerfor today.
Here is the research I have collected on
this.
See Tiger Blog for 4/20/2010 http://www.tigersoftware.com/TigerBlogs/May-20-2010-/index.html
Finally, we need to watch the A/D
Line for Nasdaq and low priced stocks. This is the area
that has the biggest 2009-2010
advance. There are a lot of profits that could be taken in these stocks
in a most clumsy, quick and
alarming way. Recently, I have mentioned that 1989 was a good
parallel to learn. A new
closing high in the DJI and SP-500 did follow the sharp 10% sell-off
in late 1989. However, in
that case the NASDAQ turned weak and acted poorly after the first
rebound from the 10% decline.
You can see in the 1989 chart below how weak was the upturn
in the A/D Line as the DJI rallied
to a nominal new high. This is what we have to be concerned
about now. The TigerSoft
chart shows a declining A/D Line for low-priced stocks. It also tells
us that more than half of these
stocks are now below their 65-dma. This needs to improve. If it does
not, fewer and fewer of our high
accumulation new highs will achieve long runs after making
breakouts.
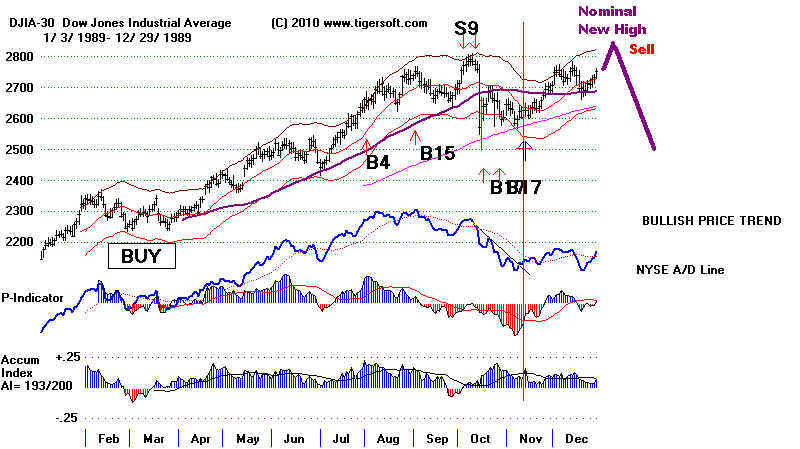
=====================================================================================
=====================================================================================
5/13/2010 - Peerless remains on
Buys.
Head and Shoulder.
Closing below its neckline in judged Sell

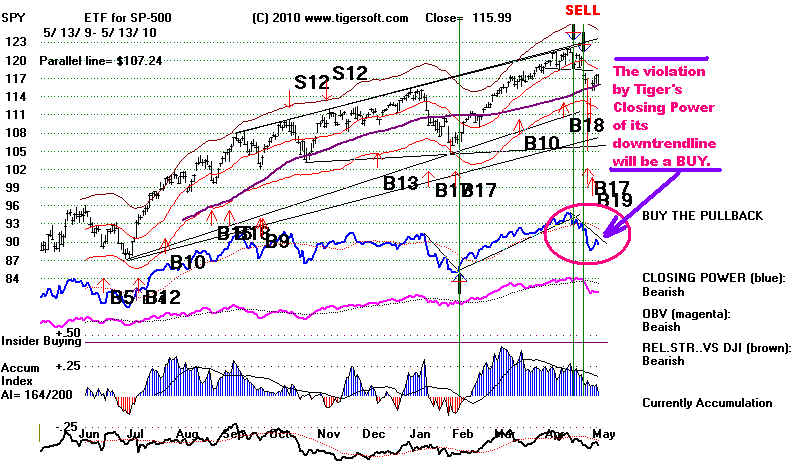
5/13/2010 - Peerless remains on Buys.
Having reached price
resistance, a retreat by the DJIA, NASDAQ, QQQQ and SPY has now
started. Stocks, commodities and indexes bounce
back and forth between support and
resistance. Learning where likely support and
resistance will occur will help you. The broken
neckline in a head and shoukders pattern and a
falling 21-day ma both act as resistance
levels. When they overlap, they reinforce
each other and resistance is more likely to
cause a reversal. Now that we have tested such
resistance, a decline has started.
Where will support come
in for a reversal back upwards? Of course, news has an effect.
Criminal indictments of the biggest Wall Street brokerages
for fraud, insider trading,
front-running and duping, secretly bribing or the Mob-like
threatening bond rating agencies
are coming. I don't see how they can be avoided.
This will hurt the stock market. A certain measure
of trust and confidence are required among investors.
In their hurry for quick profits and bonuses,
the CEOs of Wall Street's biggest firms clearly took
the short view and paid little attention
to their fiduciary responsibilities.
(Prosecutors Ask if 8
Banks Duped Rating ... )
Technically, prices may find support at several levels.
1) The first is at or near the rising
65-day ma. This is most likely when the Accumulation Index
is clearly positive. That is not true
presently for the DJI, where the Accumulation Index stands
at only +.012. Peerless pays special
attention to the DJI. (The other indices do look better. For the
SP-500, the current Accum. Index (IP21) is
higher, at a +.08, while the SPY is only +.037. In the case of the
NASDAQ, the IP21 is +.128 and the QQQQ is .147.
2) Prices will often fall to the bottom of a price
gap. On the DIA this would be 105.91 (2.19 below
today's close.)
3) The lower band on the DJI acts as reliable
support. This is 3.5% below the 21-day ma.
See how the January bottom stopped at this level.
This is where I would bet any 3%-4% decline
stops..
4) Support also come sin at a key rising moving
average, either the 39-week (149) or 200-day ma.
The 30-wk ma for the DJI is now at 10500 and the 200-day ma
is now at 10250.
5) And support is usually found at previous low
closings: 10361 and .9920.
Which of these points of support should we use now use?
If the 65-dma is penetrated, the safest
bet is the lower 3.5% band on the DJI coupled with a new
Peerless buy and then, for reinforcement. the|
breaking of the downtrend in the Closing Power for the DIA,
SPY and QQQQ ETFs.
Of course, many Peerless users often find the simplest
approach is just to wait for the next
Peerless Sell and buy attractive stocks until then as the
Tiger Power Ranker finds then or
just hold their positions in SPY or QQQQ.
STOCKS
We can always make things more complicated though. by
considering which industries and
groups of stocks to focus on when buying. The Hotline
has recently emphasized low priced
stocks, very high accumulation and gold stocks. I
think we should keep watching low priced
stocks. They can make each of these area because they
can spectacular moves even as the
market as a whole comes nearer a major top. In
particular, we take as a good guage of
speculative interest our Tiger chart of 410 or so low
priced stocks. Watch the A/D Line
and the Percentage of Stocks above their 65-dma on this
chart. We would like to see the
downtrends that exist there end. That would give us
new confidence to buy low priced stocks.
This seems important because we cannot assume that low
priced and speculative stocks will
always advance just because the DJI and SP-500 do.
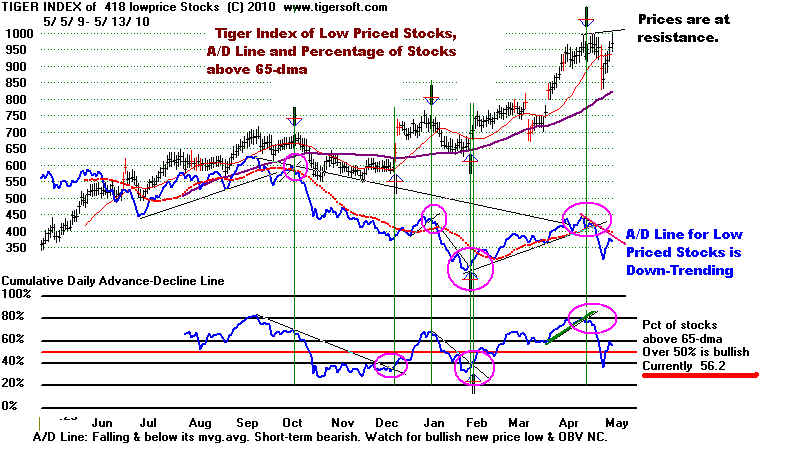
Hedge with Some Short Sales
Another
approach we recommend is buying the strongest, highest Power-Ranked stocks
and depending on your view of the market, as weighted also
by Peerless, selling short the weakest
stocks in steady down-trends that are confirmed by most
negative red Distribution and a falling
TigerSoft Closing Power trend. Here are a few
of the lowest Power Ranked stocks:
ENER, GMXR, SPWRB, MON, STP. Certainly. as long as
their Closing Powers are in downtrends,
they are reasonable short sale hedges.
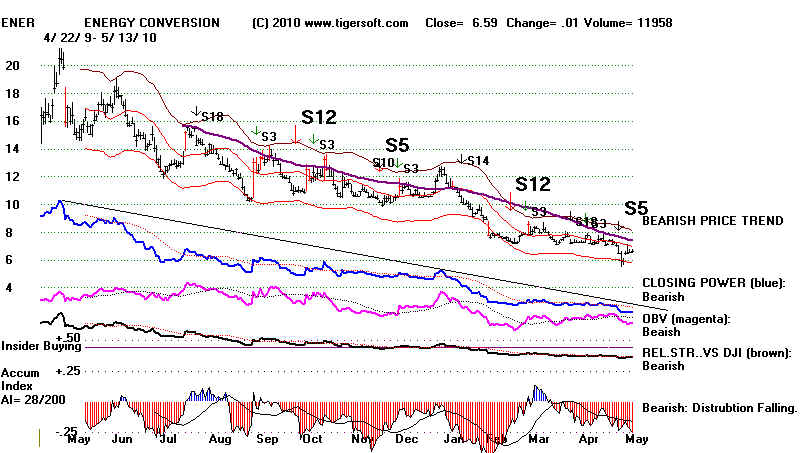
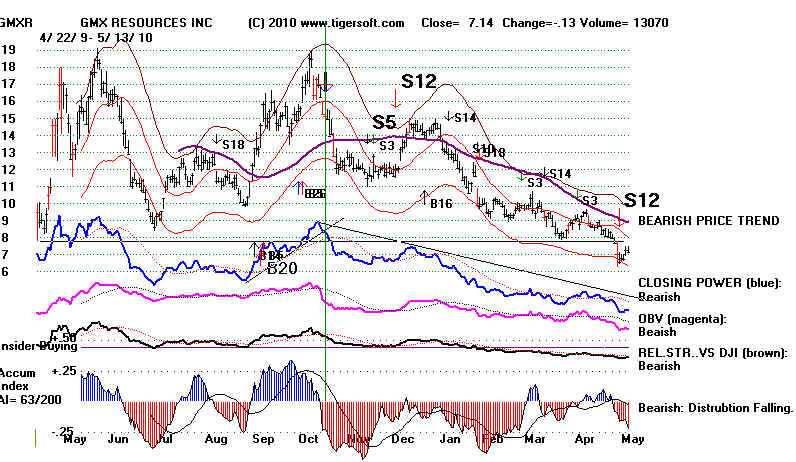


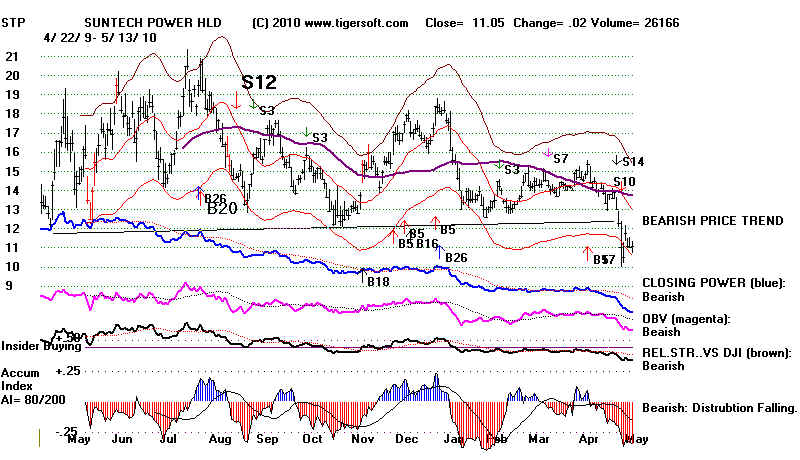
==================================================
5/12/2010 - Peerless remains on Buys.
The keenest resistance point for this rally is now being approached.
It is the combination
of the declining 21-day ma of the DJIA and the
neckline support that has failed, near 10950.
The QQQQ and SPY are also approaching their levels of
concentrated resistance.
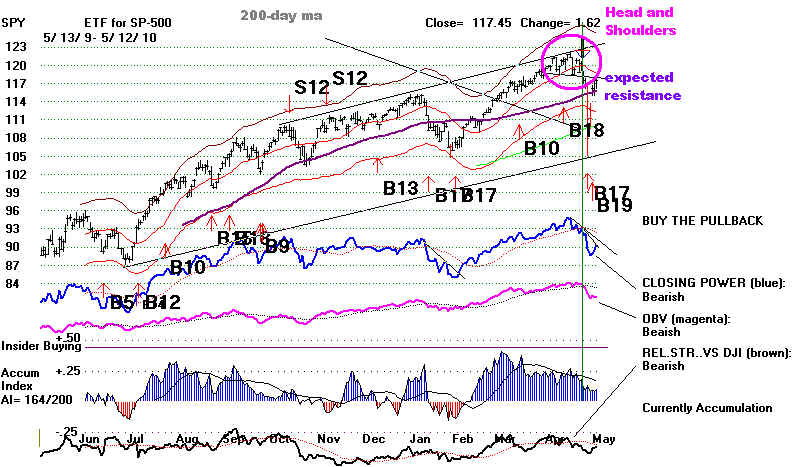
A pullback would nicely accommodate all the folks
who did not expect this recovery.
But the market may not be so obliging. Notice that all the indexes are back above their rising 65-day
ma with their Accumulation Indexes quite positve.
The 65-dma will now act as support if there
is a minor decline. A retreat back to the lower
band will probably require clearer evidence that
the 10900 cannot be overcome and so is not
immediately likely.
Watch Gold and Silver. They are the market leaders now. Gold is at an all-time
high.
Silver is knock on 20-21, its high from 2008.
In 1980 it peaked at 50.
Bullish High Accum. Stocks: LCUT, MSPD, VIMC and FFIV
As long as we can find
stocks new highs, with the breakouts showing high Accumulation and a
CLosing Power making new highs, we want to keep on
buying stocks. Some of our favorites
that are showing massive accumulation moved up nicely
today. I would buy more of them...
They should make more new highs. The number of
NYSE and NASDAQ new highs expanded
nicely today. New highs are running again.
And now the weaker holders have been shaken out
leaving the shorts at a big disadvantage. FFIV
made a particularly strong looking breakout today.
Look also at VCI, STEL, SBUX. (These last 3 are
not posted here.)
The head and shoulders pattern in LCUT may be bullishly aborting.
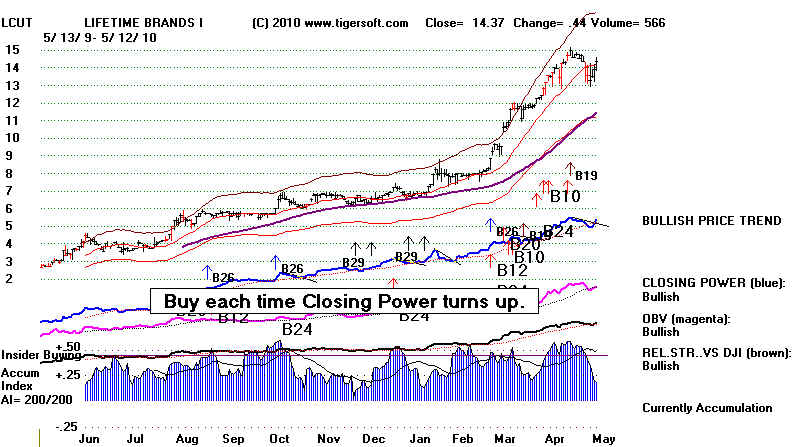
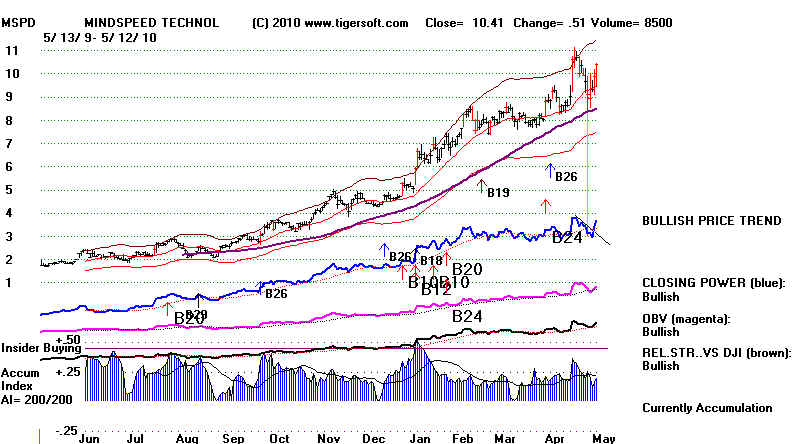
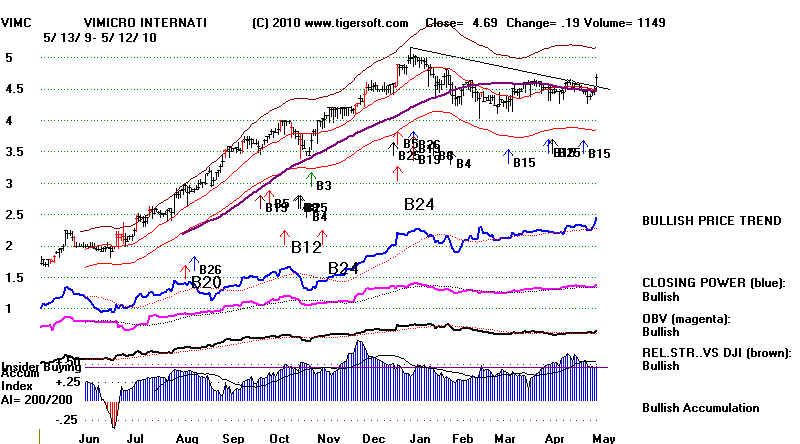
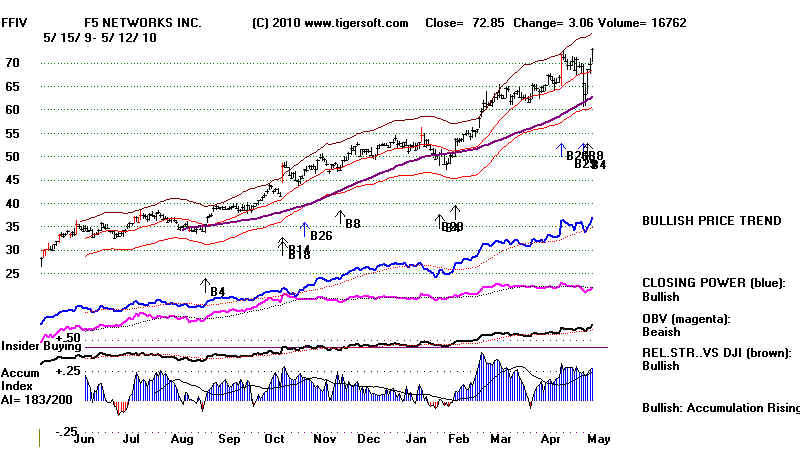
====================================================
====================================================
5/11/2010 - Peerless
remains on Buys.
Gold Steals The Show.
A pullback from 10800-10900 for a few days, even a week, down to the lower band, would
be perfectly normal.
After the pullback, the DJI should make a nominal new high, at least.
A new high probably
reaching 12000 is the expectation gained from studying the power of the
recent Peerless buy
signals (see last 3 hotlines) and the good breadth, which continued today.
In the closest
historical parallel, the fourth quarter of 1989, the DJI did have to re-test the
lower band before
rising to a new high. In our case now, breadth is much better. So a
retreat
is not guaranteed.
That is why we recommended buying high Accumulation stocks
immediately. But
if there is a retreat, we will be pleased, because it would give us a better
place to buy using the
TigerSoft Closing Power when that indicators' downtrend is broken.
Gold - All Time High
Gold is likely to steal
the show for the next few weeks. GLD made a new all-time high. Its internals
are confirming it.
Gold bugs (enthusiasts for gold who usually express contempt for "fiat"
money) are bound to
come out from all the nooks and crannies everywhere and drive it up.
Gold and silver, like
many commodities,always seem destined to go hyperbolic or, at least, vertical
before they decline.
Remember that the minimum price objective for GLD was 1300 based
on the pattern it
showed when it broke out past 1000.
It is said that JP
Morgan has been
acting for many months as the agent of the US Treasury
to
try to hold back gold and silver by
selling it short at pivotal moments.
See also - http://www.dailypaul.com/node/130418
But now Goldman and JP Morgan have turned
bullish on precious metals. The weakness in
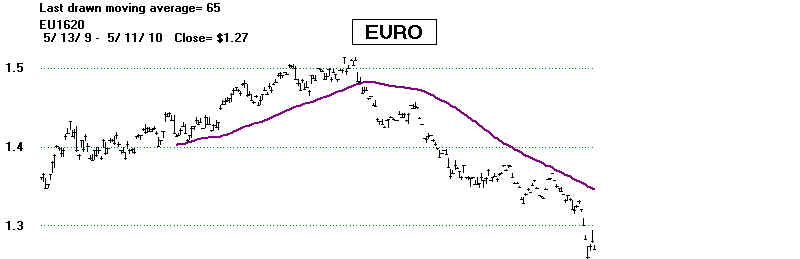

The EURO is a big part
of the story, but a bigger part of it is that the massive US federal deficit.
Realistically, it seems
only a matter of time before speculators rush into gold in a way that
resembles the 1979
experience.
GOLD - 1979-1980
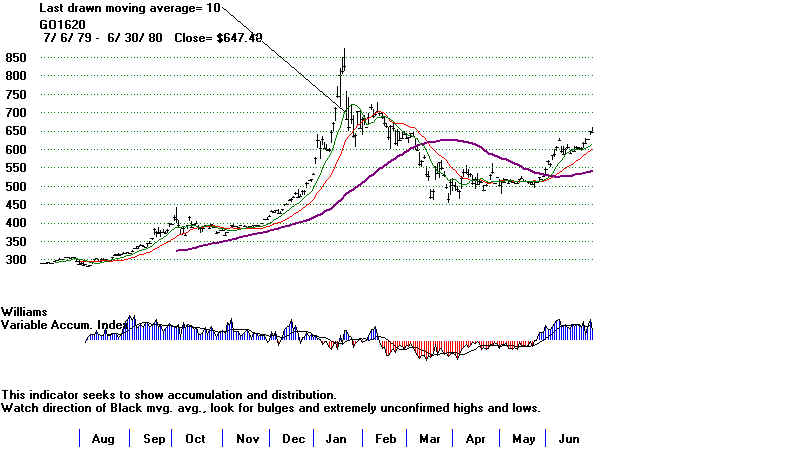
.
That sprint into it may
be starting in earnest now. Given the volatility of gold, it's usually a good idea
to
trust that its rise
will continue when it makes a new high and its internals are also
rising. The gold
stocks making new highs and showing the most accumulation are
ANV, NEM, BULM and KRY.
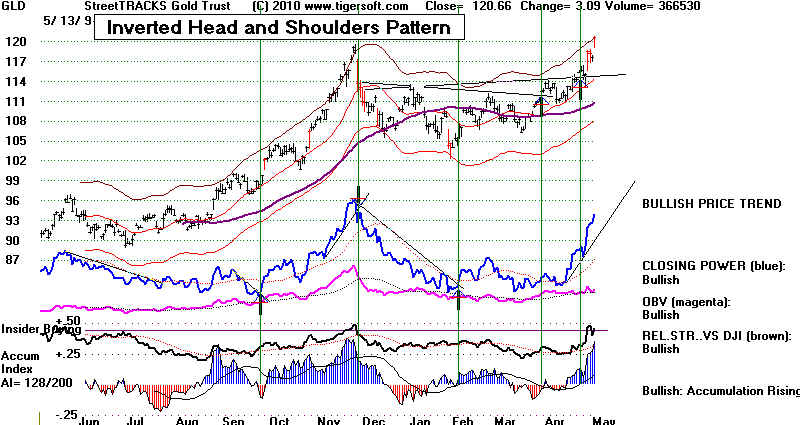
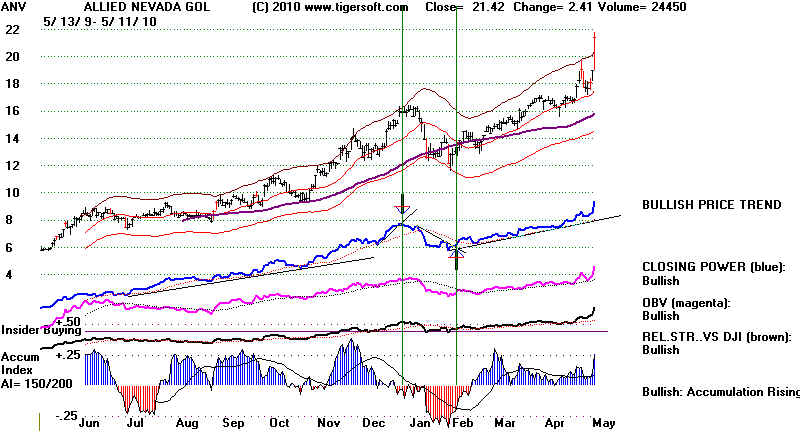
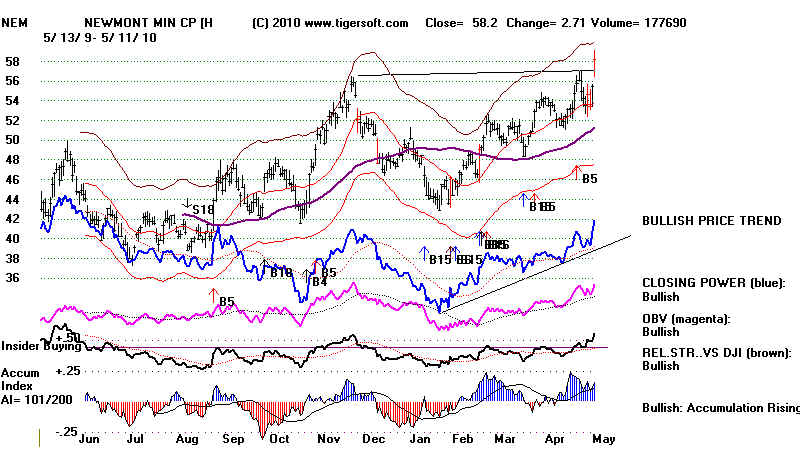
Bullion Monarch Mining, Inc
Bullion Monarch Mining, Inc. engages in acquiring, exploring, leasing, joint venturing,
and selling mining properties in the western United States and Brazil. The company has
interests in properties in Utah, Oregon, and Nevada; and two mines producing royalties in
the Carlin Trend, Nevada
http://www.bullionmm.com
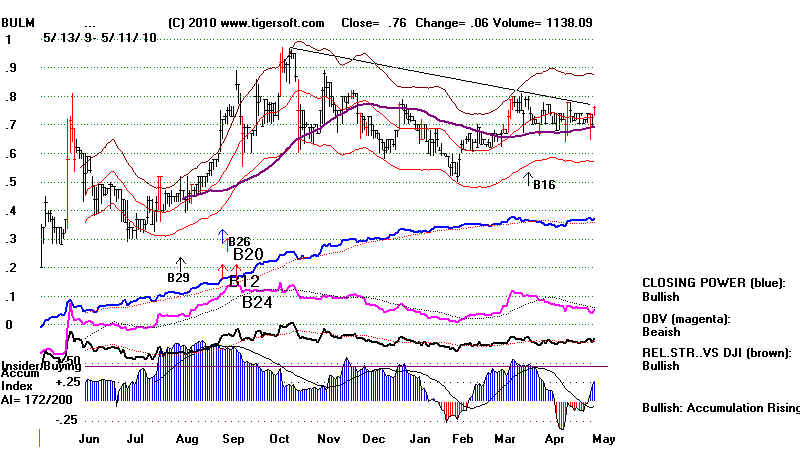
Crystallex International Corporation engages in the
development of gold properties in Venezuela. It principally owns interest in the Las
Cristinas Gold project located in Sifontes Municipality in Bolivar State, Venezuela. http://www.crystallex.com
- KRY -
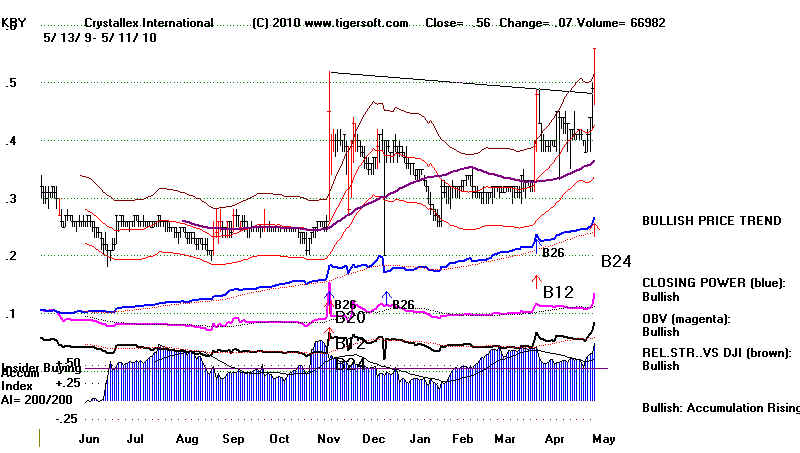
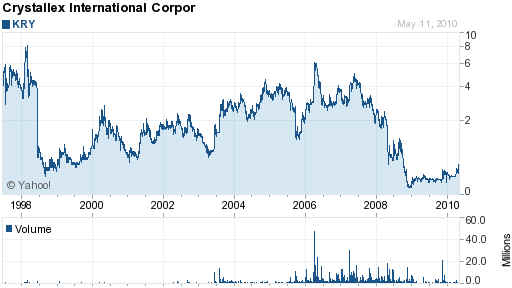
==============================================================================
==============================================================================
5/10/2010 - The FED weekend decision to back the Euro has
caused the
shorts to scurry for cover.
Some kind of a recovery was expected because of
Thursday's Buy B5/Buy B17.
The size of the bounce is eye-opening, especially
for the shorts. The Fed
is commited to keep the rally alive. In particular, that
is a big boost to more
speculative NASDAQ stocks, the types we like when they
show intense
accumulation.
How far will the rally carry?
An immediate recovery which lets the DJI
tag the falling 21-day ma at
11000 would be typical in this environment.
That is what happened in 1989
after a similar sell-off occasioned by unregulated
computerized trading gone
wild. See the chart in the 5/7/2010 hotline.
Significantly, today's rally was so
good it brought a reinforcing Buy
B14 and a Buy B19.
I
These signals typically bring new highs, as
happened in the 1989 case.
Here are the new Peerless signals' track
records.
B14 - There have been 27 B14s since 1942.
The average gain was 12% when reversed
by the next
Peerless signal. In 12 cases the gain was less than 5%. The average gain
so high,
12%, because of the 8 cases in which the B14s gained more than 18% at the time
of the
next Peerless Sell. Only 3 of the 27 would have been sold at a loss.
In 9 cases,
the DJI
fell back more than 1% before rallying. In 4 cases it fell back more than 5%.
B19 - There have been 28 B14s since 1942. The average gain
was 6% when reversed
by the next
Peerless signal. In 21 cases, the
B19 called a bottom and there was no
paper loss.
The paper losses mostly ranged from 4% to 8%. The gains were usually larger
the proportion of
what was lost was greater than 2/3. These Buys occur when there is a
sharply down day
followed by an equally sharp up day. It is a 2-day reversal upwards Buy.
It stems from the
unexpected way the DJI and NYSE breadth reverse upwards. Usually,
after a steep
decline, the market is doing well simply to stabalize. A reversal upwards is
unusual.
It often portends a rally beyond the upper band. "These occur often when
politics
intrudes, i.e. when government shifts the playing field."
The highest A/I 200 stocks should not only
hold up well but move to new highs with so many
Peerless Buy signals
active. Two exceptions might be noted. A stock that develops a head
and shoudlers pattern
may take a while to work past the distribution and selling this occasions.
Secondly, avoid any
stock that fails to rally on a day like today when nearly everything
rose.
The highest AI/200
stocks HPQ, CTXS and INTU should make new highs in the next month
or two. If
they do decline, buy them when their TGR Closing Power downtrend is violated.
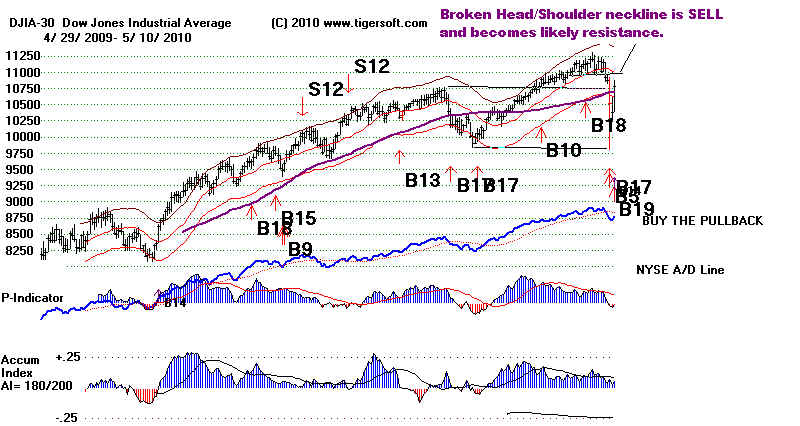
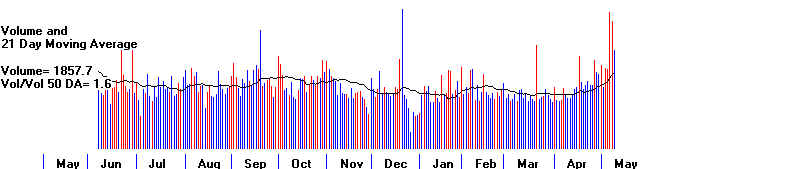
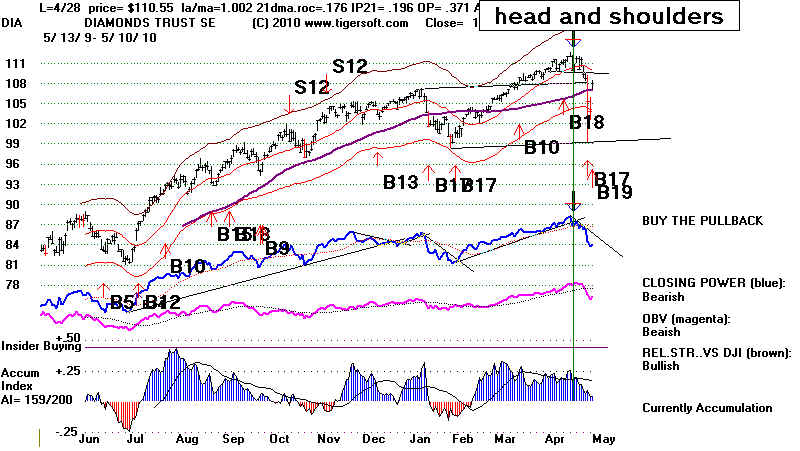
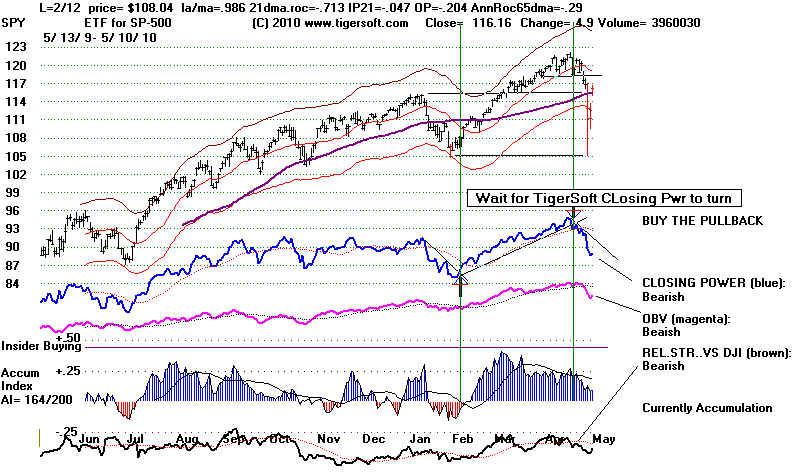
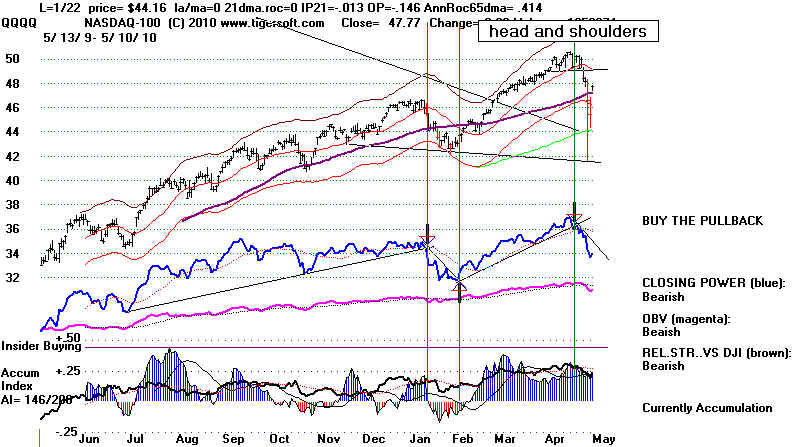
Highest AI/200 STOCKS
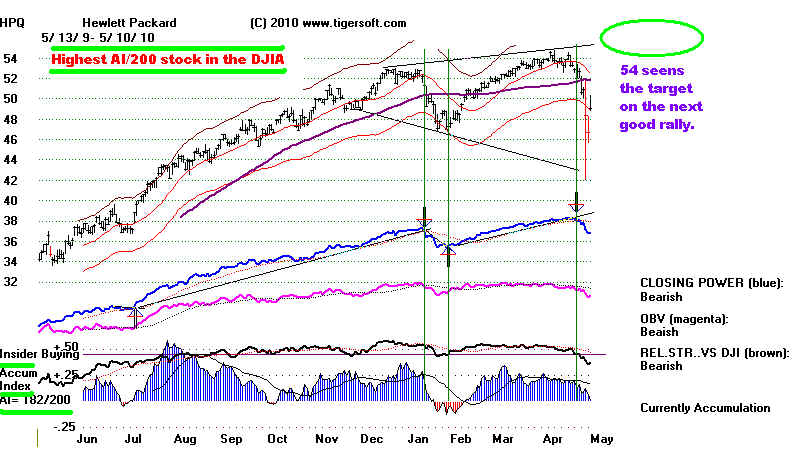
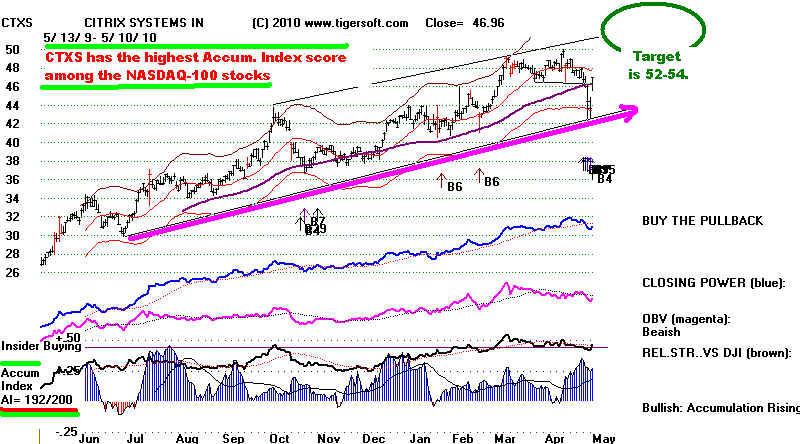
When in doubt, look at the highest Accumulation stocks in the DJI and the NASDAQ.
HPQ rebounded from a very oversold
condition today. A wild price pattern like this would normally
be a deterrent, but if you look
back at the aftermath of the 1987 Crash, you see that though
nothing was spared, the highest
Accumulation stocks made good come backs. In 1987, there
Tiger Inernational (the old Flying
Tigers company) had a perfect AI/200 score of 200. With
the crash it fell from 18 to 12.
But three weeks after the crash, it was bought out at 20.
So, I would say these very high AI/200 stocks should be favored now. Generally, buy
them also
when they test support or soon after,
especially if their Closing Power has just broken its downtrend.
See MWE and INTU just below.
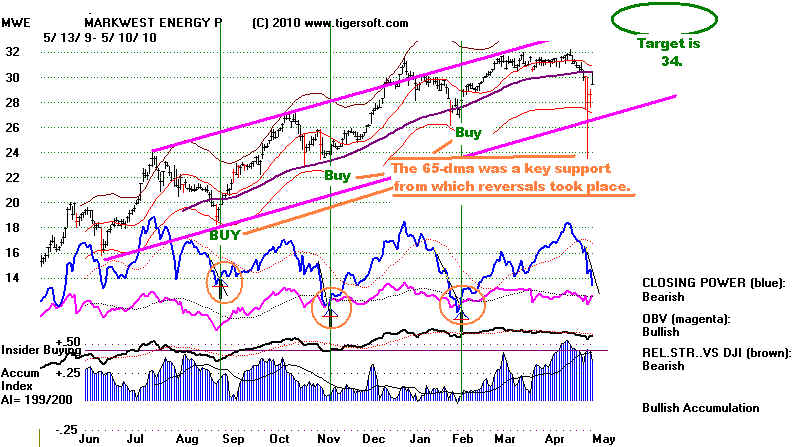
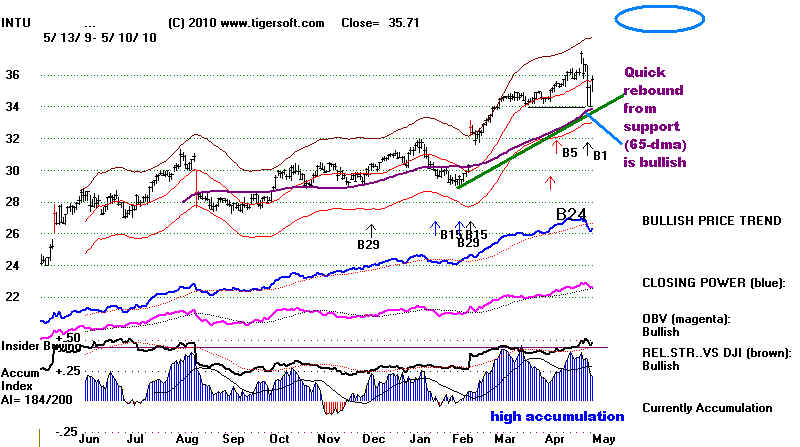
===================================================================================
===================================================================================
5/7/2010 - Thursday's Buy B5/Buy B17 Should Bring A Very
Good Bounce.
But Waiting for either the A/D Line
or CLosing Power Lines to Break Their
Down-Trends Is Probably Best unless
You are Very Quick. 10800-10850 is expected
to be resistance. That is the
support level that did not hold. Breadth and
Accumulation are better now than
they were in October 1989 after a similar
decline caused by reckless
computerized trading.
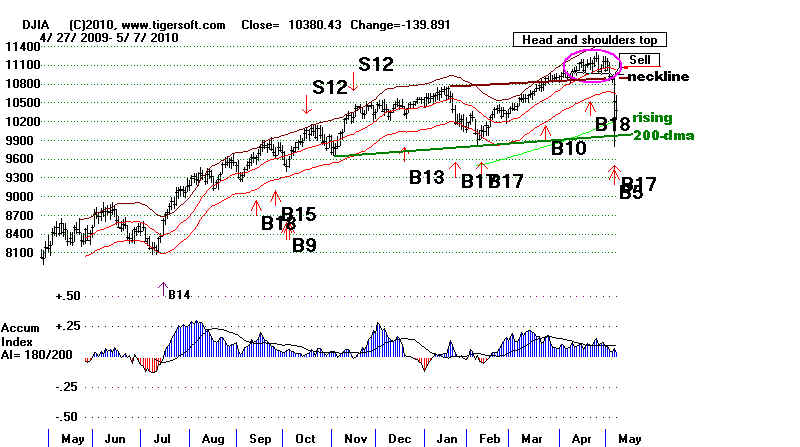
Note the Buy B17, Buy B5 on the Thursday's big
decline. Waiting for the Closing Power
or A/D Line Downtrends to be broken above should make the market safer.
The Accumulation
Index is bullishly still positive and the DJI is now testing good support at
its rising 200-day ma.
Once the market turns upwards, shorts will be forced to cover. There
are a lot of high
Accumulation stocks, like HPQ and CTRX, that have been beaten down by
computerized
program trading that should recover quickly in a rally.
Head and Shoulders Tops
The Automatic Peerless never got a Sell on this decline. Hotline readers know
that we have repeatedly urged you undertand the limits of using just
automatic signals,
especially since the software cannot recognize bearish head and shoulders
pattern
formations and the market has been blind-sided by the biggest environmental
catastrophe-in-the-making in US History. Every day for the last twe
weeks we have
warned of the bearish head and shoulders patterns and the zig-zagging lower
of the Tiger
Closing Power in over-extended stocks.
We show below exactly why we must use judged Sell
signals when the DJI completes
a head and shoudlers pattern. What people do not appreciate and
we demonstrate is
how very often head and shoulders patterns
predict the unpredictably bearish. We show
how often head and shoulders patterns are the way the stock market quickly
responds to
new bearish conditions that it had not factored in prevoiusly. We must
acknowledge and
use these bearish patterns.
Please read
Head and Shoulders Patterns Predict
The Unpredictably Bearish:
1941, 1950, 1957, 1962, 1963, 2001, 2010
High
Frequency Trading
The use of high
frequency trading completely disrupts normal market behvior. We saw this in 1987
and again in 1989. The 1989 case is not so well known. What
is interesting is that the market's
internals NOW are much better than they were in October 1989, when the
market also swooned down
badly-madly 10% and then recovered as though nothing had happened.
In the chart below you can see that
positive TigerSoft Accumulation overcame weak breadth. We do not
see weak breadth now.
That suggests an even better recovery, especially if British Petroleum
can achieve some kind
of a stoppage of its oil geyser in the Gulf..
1989 Sell Off Ended Quickly
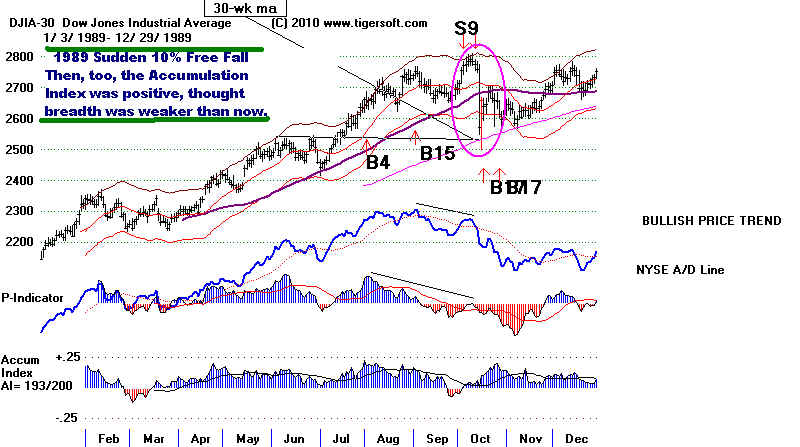
Computerized
Program Trading CAUSES Dangerous Declines and
Demonstrates the
Reckless Monopoly Power of the Wall Street Giants.
Has the sudden determination by the SEC to sue Goldman Sachs for fraud
caused the reversal dowwards? The Federal reserve under Bernanle
went a long way
in financing and sponsoring last year's rally. Volume was generally low
on the rally
and where it has been high, it has been high on down-days. This
suggests market manipulation.
Goldman was the biggest high frequency computer trader, by a wide margin,
manipulating higher and higher prices. But now with the SEC and
the Attorney General
bringing civil and criminal charges against Goldman, the pumping may have
turned
into dumping. Goldman may inclined to want to show who it thinks is
boss and
play hard ball. Only, if the government backs off criminal fraud
charges, it is saying,
will Goldman relent and stopits sell programs! Too cynical?
Hardly. This is exactly the type
of government and stock market you get when a handful of banks control the
entire financial
system!
Accordingly...
Traders must study more than just the
automatic Buys and Sells of Peerless.
We urge and urged you to understand these four concepts to trade
properly now.
1 >Miniature Completed Head and Shoulders in the DJIA and ETFs should be
considered judged Sell S5s
or S10s. (Such patterns that last 40 days or more should\
be considered judged Sell S10s.
We asked you to study the earlier cases of these patterns because
they are reliably potent.:
May 5,
2010 - SPY
Head and Shoulders Patterns: 1993-2010:
2>Closing Power Is Falling. This is always important, but more so after a
bearish chart pattern.
3>Friday we saw a 10-Month DJIA Price Trend-Break but bullishly, at least, the
NYSE A/D Line
Is Still Up-Trending and the Accumulation Index is posiitve.
4>Extreme downside volatility is a characteristic most often found in 1930s Bear
Markets.
See study in HOTLINE - 5/7/2010 below....
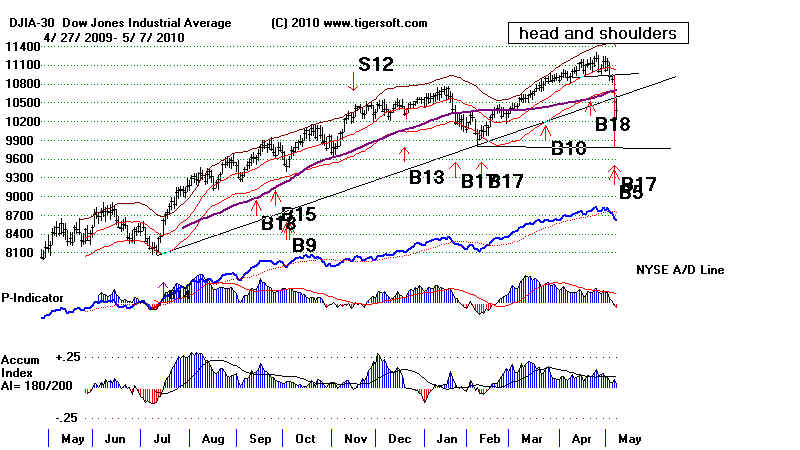
--- DIA ---
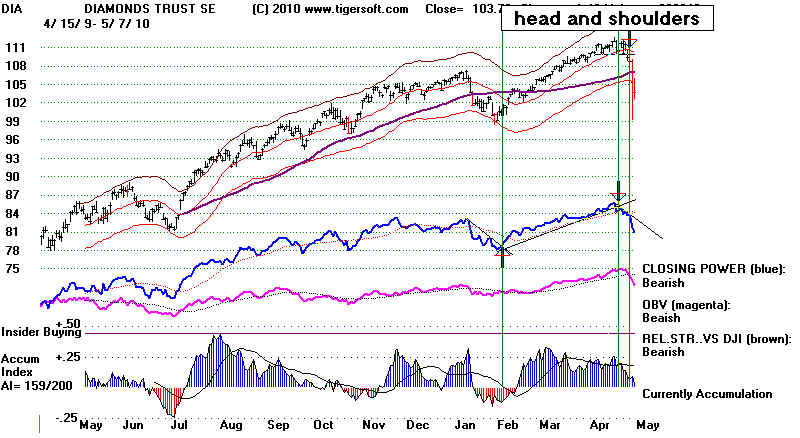
--- SPY ---
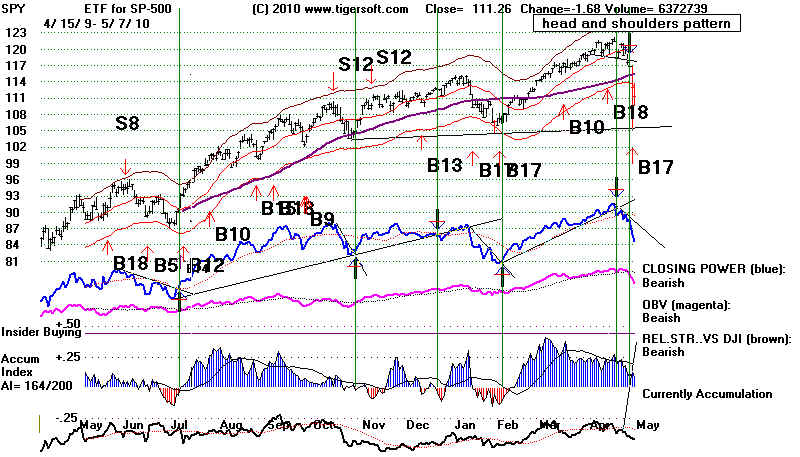
--- QQQQ ---
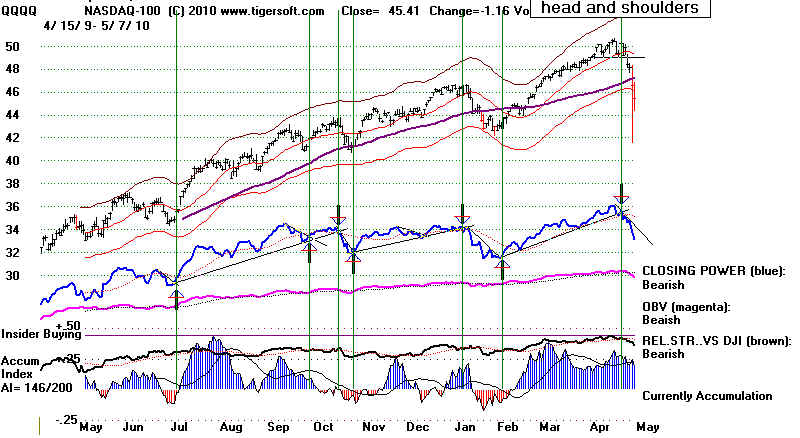
=========================================================================================================== -
HOTLINE - 5/6/2010
PEERLESS HAS NEW BUYS BUY B5 and BUY B17. The Year-long
price uptrendline
in the DJIA is being tested.
A CLosing Below This Will Usher in More Selling.
Waiting for the Tiger CLosing Power
Down-Trend to End Will Help Add Safety
To New Purchases. Internals
are constructive, apart from the dangerous downside
volatility.
BUY B5 - 10 trades. Average
Gain = 7%
BUY B17s in a rising market.
- Average Gain = 9.6%
Computerized trading is blamed for today's severe volatility. But the market was
ready to take profits. The Head and Shoulders
Pattern was our most important
warning. These patterns are
clearly used by lots of people, especially when
folks are made nervous by the bad
news. A big rally that has not been
"corrected" adds to
vulnerability, beacuse some traders panic and take profits
clumsily when prices go into a
free-fall. They often use stop losses that market
makers can easily "gun
for". That is probbaly what happened today. I would not
put it past market makers to
artificially produce head and shoulders tops
from time to time for this purpose!
To spot these patterns, you must do
your homework and learn to recognize
them. Our software is unable
to spot the important head and shoulders pattern itself,
only Sell S10 breakdowns, some
of whixh follow head and shoulders tops.
We have two write-ups on head and
shoulders patterns applicable here:
SP-500 Head and
Shoulders Patterns
DJI Head and Shoulders
S10
Look at the patterns. Ours this year were classic and easily spotted.
In addition, we highly recommend
using breaks in CLosing Power uptrends
as SELL, especially when other
curcumstances, like head and shoulders patterns,
make the situation more bearish.
Last week's zig-zagging downward of the
Tiger Closing Power in
over-extended stocks and key ETFs was another key to
seeing the market had become
vulnerable and guarding your profits. In my opinion,
traders of general market ETFs
should should Peerless plus key chart recognition
(tops, trendlines, support and
resistance) AND also the trends of the Tiger CLosing Power.
While the market's breadth
and Accumulation Index internals are
positive enough to now give
Peerless Buy signals, the market's volatility
is very scary and
preservation of capital is the key to long-term investment
survival. Our market is
much stronger technically than in 1929, 1987 or 2008.
But we are on the verge of
breaking a year-long price uptrend on very high
volatility. That is
dangerous. News can be NEW and catch markets by surprise.
The Gulf catastrophe is such
an event.
-------------- 1929 --------------
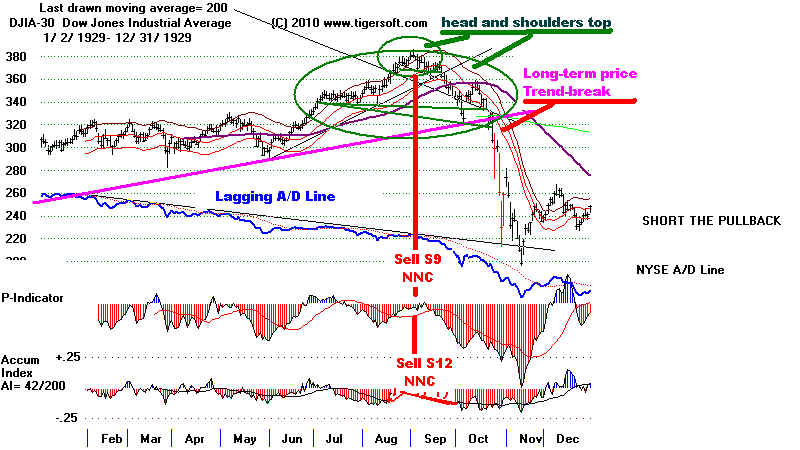
-------------- 1987 --------------
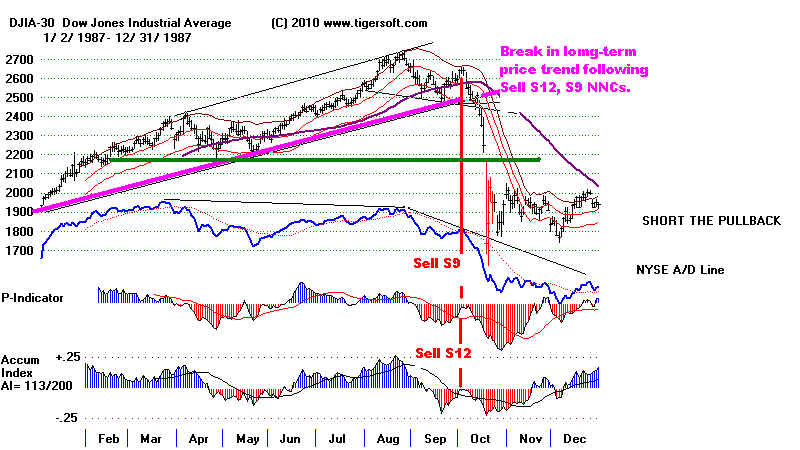
So the extreme downside volatility
we saw today alone should make us nervous.
With the DJIA now at a year-long
price uptrend, we should be careful.. A closing
violation of this much-watched
uptrend is apt to bring an additional bout of
selling. That may occur
tomorrow. That could also lead to a breaking of the
9900 December support.
So, I would prefer to see the
TigerSoft Closing Power to break its downtrend,
before going 100% long. That
would suggest support is holding.
Instead, for now, either stay
under-exposed or stay hedged (long and short).
To help you, we have been posting
completed head and head and shoulders patterns
here for your consideration.
Another approach now is to inspect with the Tiger
Power ranker all the stocks making
new 12 month lows and short those breaking
below support that are considered
"BEARISH" by the Tiger Power Ranker.
Our studies of such stocks in the
2008 crash showed that these stocks were best
then covered when the Tiger CLosing
Power for them broke their downtrend-lines.
See the Power Ranker's flags for
Bulish and Bearish tonight among new highs
and new lows, respectively.
New Highs: NYSE = 5 New Lows= 68 Bearish
New Highs: NASDAQ= 19 New Lows = 81 Bearish
It is bearish when new lows exceed new
highs so close to the
underlying index making a new high..
Ratios greater than 10:1 are bullish.
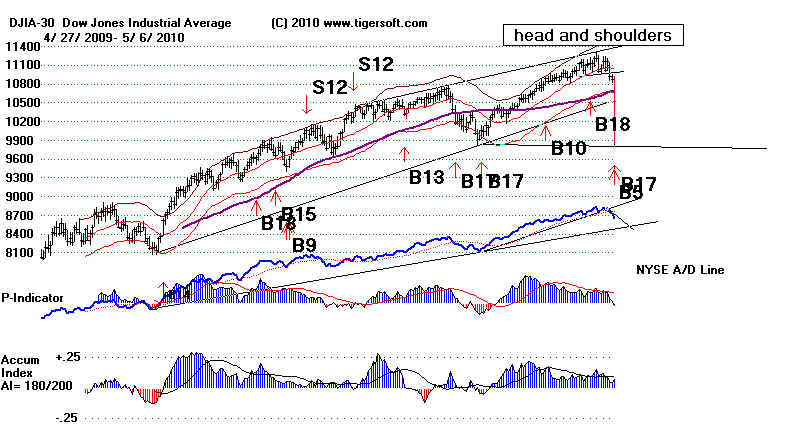
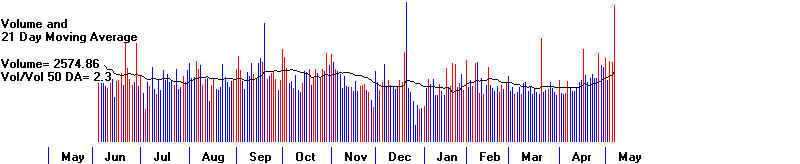
Watch the SPY's and QQQQ's Closing Powers.
A break in its down-trend will be a Buy after a test of support.
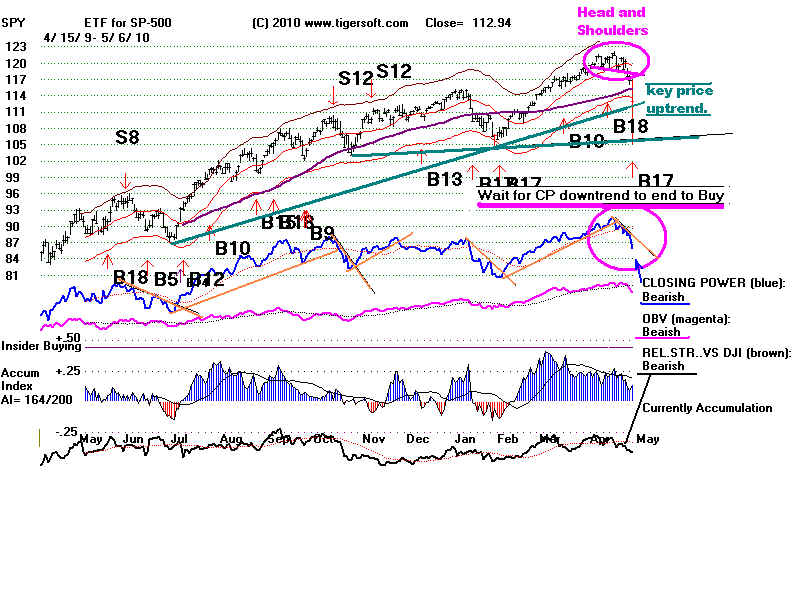
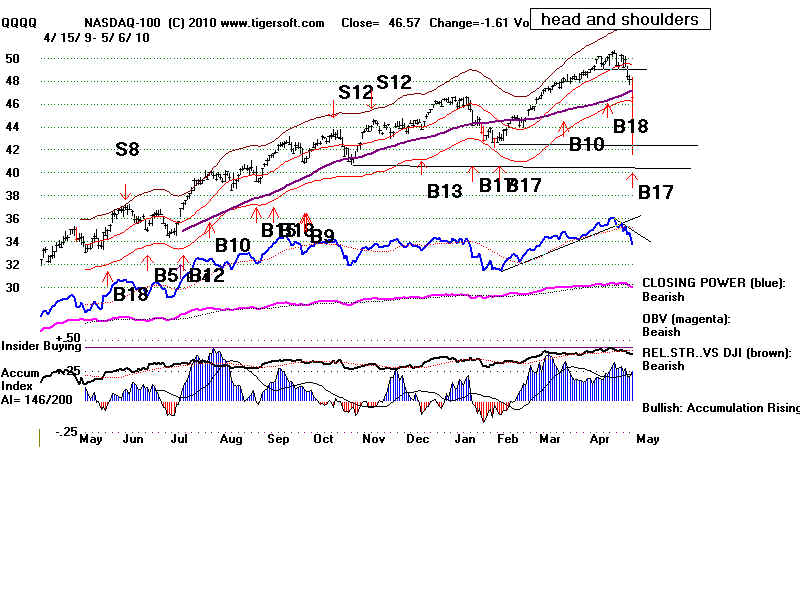
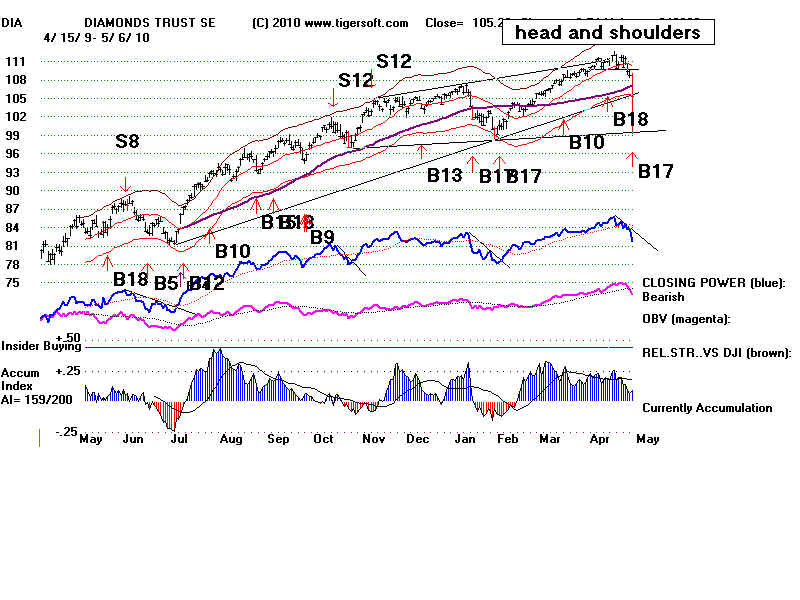
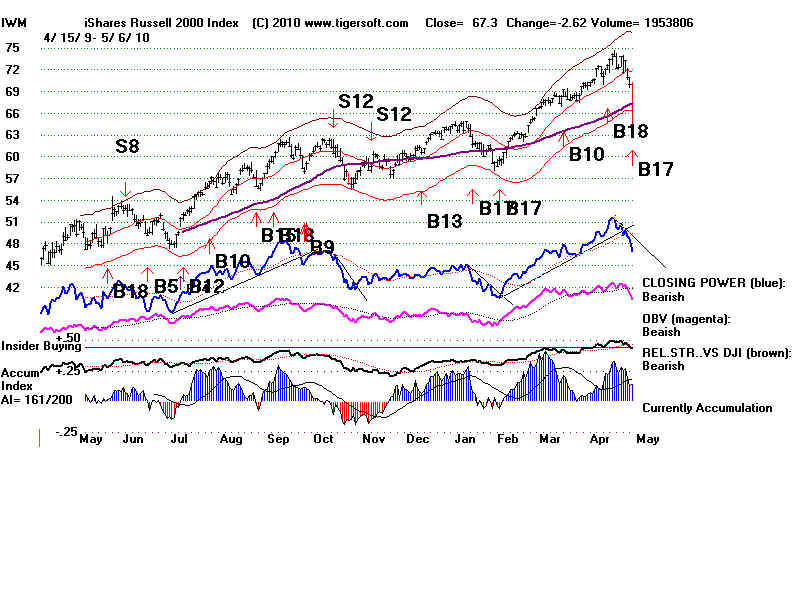
====================================================================================
====================================================================================
HOTLINE - 5/5/2010 PEERLESS REMAINS ON A BUY.
But the completed head and
shoulders patterns and Falling Closing Powers
are bearish and must be
factored in...
See - SPY Head and Shoulders
Patterns: 1983-2010:
The good news is that the key
ETFs are approaching the expected support of their
rising 65-day ma. If
the CLosing Powers break their downtrends after this test, we
should be getting a reliable
BUY. In addition, Peerless will give a Buy signal on weakness
if the P-Indicator and
Accumulation Indicator remain positive on a test of the lower 3.5%
band. But I would not
jump the gun here. Wait for the Closing Power to break their
downtrends with a new
Peerless Buy signal. There's plenty of potentially more bearish news.
Adding to our concerns are
new fears:
1) that the Fed may be
finding a secret, undeclared and unlimited financial war
on the EURO through Goldman,
hedge funds and the zombie banks). (There is a near-blackout
on this in the US press.)
2) the unexpected Gulf
catastrophe may just keeping getting worse. Centering hopes on
doming an erupting volcano of
oil one mile down seems a very long shot!
The Dollar's strenngth is not
accidental. I argue in my Blogs it is happening because
the Fed has given a
corsortium of the biggest banks, especially Goldman Sachs and hedge funds
money to raid Greek
Government bonds, which are considered the weakest link in
EURO. The Dollar
is rising steeply now against all the world's floating currencies.
This helps imports, but hurts
American exports. Big US banks and the Fed love a
strong dollar. The
banks want the US to be the unchallenged center of world finance
and the Fed wants the
financing of the trillion dollar deficits to run more smoothly.
There remains a fear that the
bear raid on Greece will go too far. Or that Europe
may reciprocate. In
these cases, a world financial panic may follow. Goldman, Soros
and the other hedge funds and
zombie banks may go too far on the downside, just as
when they create a bubble and
prices go too far on the upside. Another fear, we hope
paranoid, is that this
consortium will become a Frankenstein-like monster that the Fed
cannot control and it will
turn on California, Georgia or Massachusetts bonds and then
US Treasury bonds.
Of course, one hopes to be
wrong in laying scenarios like this out. The best way to
ensure that credit default
swaps are not misused by monopoly-banks turned into
dangerously out-of-control,
mamouth bear-raiding hedge funds would be for Congress
to ban CDS altogether, or at
leastm make buying credit default swaps legal only if one
is already long the bond and
if all CDS trades reported and traded openly/ Anything
short of this will be proof
that these scenarios are all too real. Allowing downside speculation
on entire countries or US
governmental entities is insanely dangerous. Why is no one
talking openly about this in
the US media?
The US stock market's rally
this past year, especially in low priced stocks, has certainly
had many of the
characteristics of a bubble. Usually we see tops in this environment when the
NYSE A/D Line starts lagging.
That has not happened yet. So, we have to expect more
new highs for the DJIA when
this decline is over. The next rally may then bring a
new major Sell.
Here are the charts of the US Dollar and other currencies.
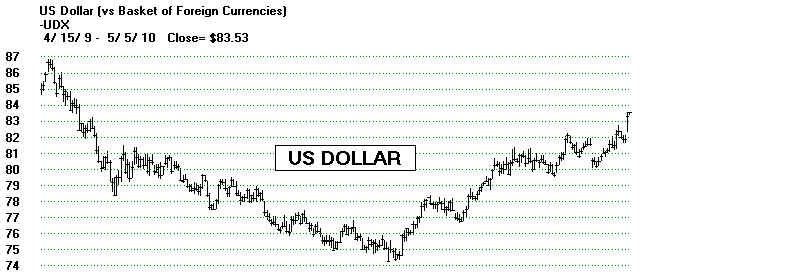
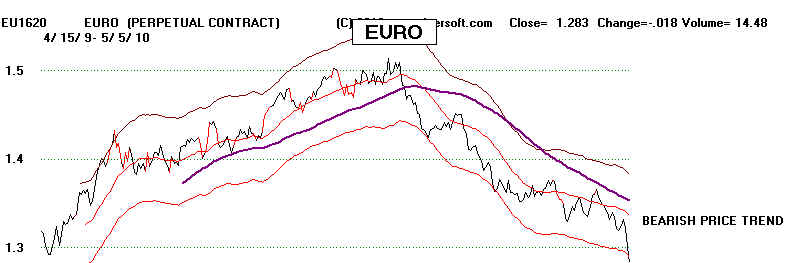
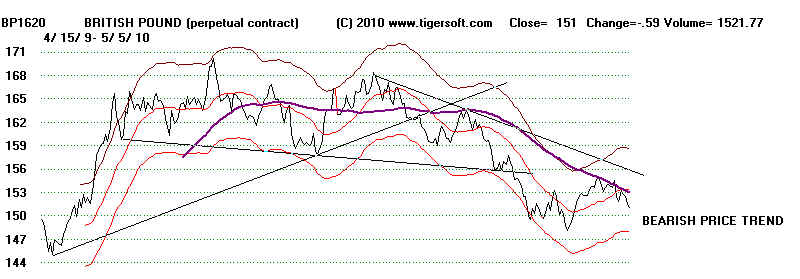 Swiss Franc
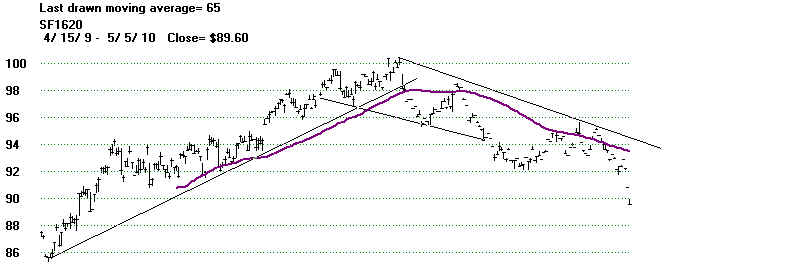
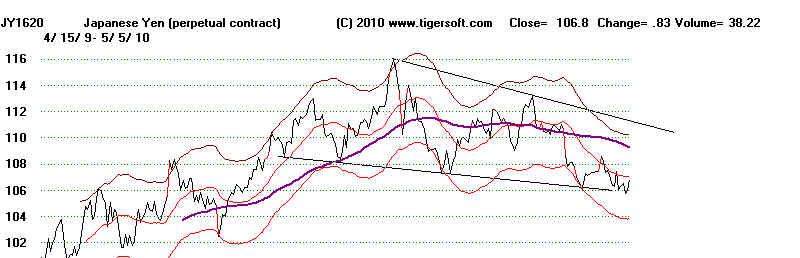

==================================================================================
HOTLINE - 5/4/2010 PEERLESS REMAINS ON A BUY.
But the completed head and
shoulders patterns and Falling Closing Powers
are distinctly Bearish.
head and shoulders
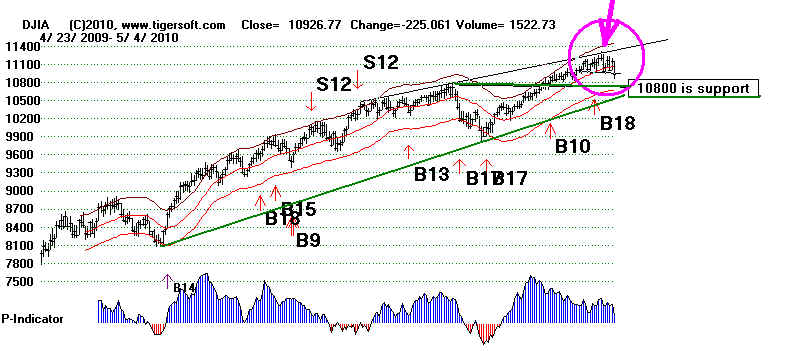
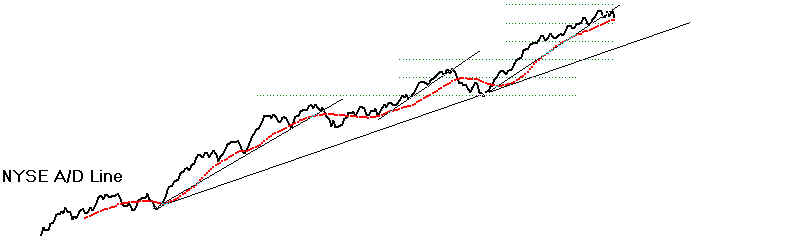


We
now see completed bearish head and shoulders' patterns in the SPY,
QQQQ, DIA and NASDAQ. In addition, the
ETFs' Closing Powers are falling and
zig-zagging lower. The completed head and
shoulders pattern must be expected to
cause a wave of strictly chart-based selling,
especially with the market up so
much without even an 8% decline since March
last year.
The convenient aspect of the declining CLosing
Power is that we can just wait
for its downtrendline to be broken to know when
to buy again. This is a wonderfully
reliable technique to decide when to buy after
a support level, like the 65-dma has
been tested.
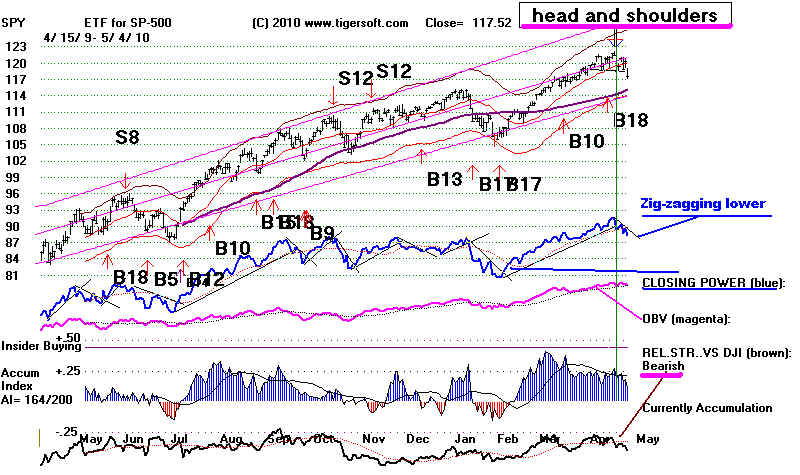
Once again, volume rose again today on
the decline. We will see if the
"Power Elite" can manipulate and hold
up prices here. That the triumvirate,
the Fed, the Obama Administration and Goldman
are still working together on the same
page to keep prices rising might be judged
today by the miniscule
$450,000 fine
handed out by the SEC to
Goldman Sachs for hundreds of illegal "naked" short sale
transactions.
This sure look like a decline that will cause
the DJIA to tag the lower band at 10700. But look
closely and see how the NYSE A/D Line did not
make a minor low which matched the breaking of the
necklines. Back in July last year, when
the DJI formed a bigger head and shoulders pattern,
I did a study of such patterns. They are
certainly bearish, but I discovered that they are
only significantly bearish if the NYSE A/D Line
also makes a corresponding new low.
Bullishly, the NASDAQ's Accumulation Index
remains quite high. This means that there
ought to be lots of buyers on any weakness.
Support is expected near 2300-2340.

INDIVIDUAL STOCKS
Hold the highest A/I 200 stocks. QPSA
actually rose today. But I would not quibble if you
want to sell an over-extended stock like
Agilent (A) that shows a downwardly zig-zagging
Closing Power. I would suggest hedging
with some short sales. Alcoa (A) and Travelers (TRV) look
weak. They have bearish head and
shoulders patterns. I offered this list of short sale
candidates for hedging a couple of days ago:
BUCY, IGLD, HUSA, MA, MSTR, MTA, RAX,
RIG, RTP, TEVA, WLT, WNI, WLT, X
See their graphs on www.tigersoftware.com/TigerBlogs/May-1-2010/index.html

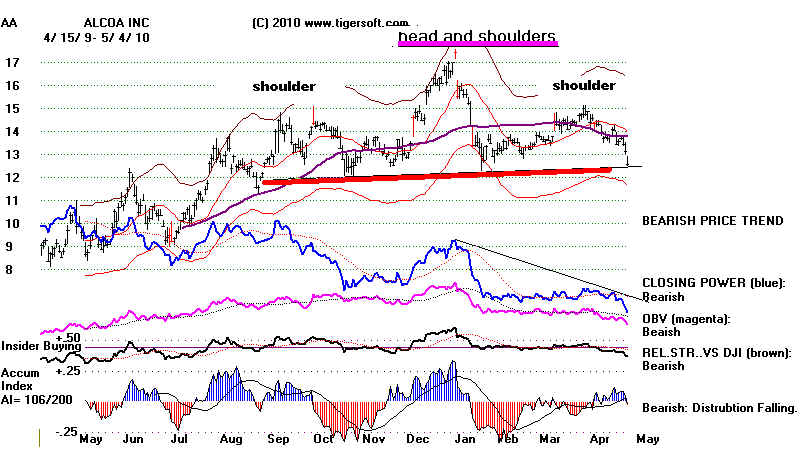 .
.
==================================================================================
==================================================================================
HOTLINE - 5/3/2010 PEERLESS REMAINS ON A BUY.
BOOMING LOW PRICED STOCKS ARE BEING BOUGHT BY
PROFESSIONALS
MAJOR MARKET ETFS NEED TO BREAKOUT ON THE
UPSIDE. IF THEY
DON'T, THE DECLINE WILL GIVE US A GOOD SPOT TO
BUY AGAIN.
Note the DJI's compressed potential head and
shoulders pattern. The A/D Line's
strength reduces this pattern's bearish
significance. We have found that the A/D Line
needs to confirm any break by prices below the
neckline to make the move bearish
on more than a short-term basis.
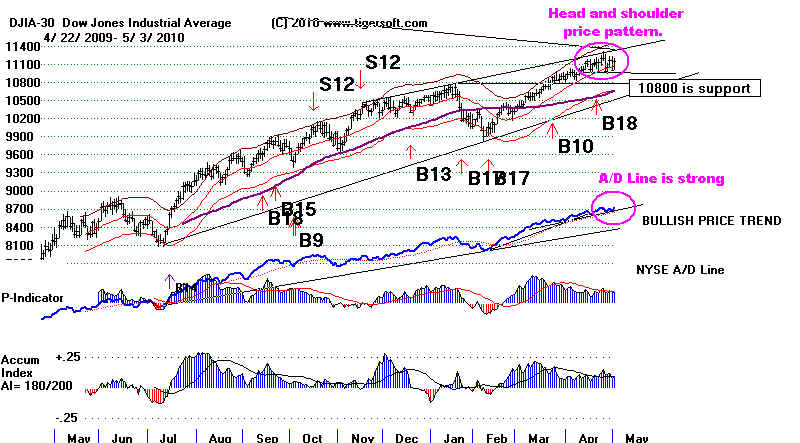
The QQQQ's Closing Power is in a minor
down-trend. It
and the other ETFs'
Closing Powers need to break
above their minor downtrendlines to release the market for a run
to the rising price
resistance lines. We want to watch to see if the miniature head and shoulders
patterns are aborted or play out
bearishly and finally produce the 3%-5% decline we keep
looking for to buy into when the
Closing Power downtrend-lines are broken above.

|
LOW PRICED STOCKS ARE STILL BOOMING
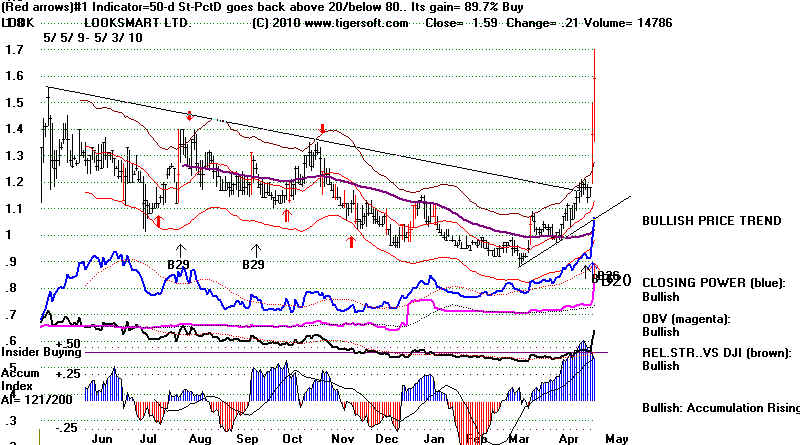
High Accumulation low priced stocks
are still doing very well. They been the stellar
performers of the whole advance
since March 2009. Wall Street continues NOT to
tout them to the public. See
Blog of June 6, 2009 -
"Why Is Wall
Street Concealing The Huge Surges in Low Priced Stocks?"
That tells me the public is still
not in them and they have more to go. Watch the Closing Powers.
Professional buying is still
lifting these stocks. If we were at a market top, these stocks would
be rising based on jumping opening
prices.
See the low priced stocks up more than 10%
today. It is true that the Tiger Index of Low Priced
stocks shows an uptrend which is
not confirmed by corresponding new highs from the A/D Line
for Low Priced stocks generally.
That means we have to be selective. Use Tiger's Accumulation
Index, Buy B12, B24s and CLosing
Power. In additon, we have to watch for
the uptrend in price and A/D Line
to end, so that we can do some quick profit-taking
and await further developments.
For the time being, though, confirmed news highs,
Buy B12s and B24s are all well
worth playing. Maybe once a generation (17 years)
we see low priced stocks run wild,
like many are doing now. These booms occurred
in 1959 (See Nicholas Darvas's
first book - How I made A Million...), 1967-1968,
1977 (Prudhoe bay oil stocks),
1997, 2007-2008 (penny oil stocks) and 2009-2010.
LOW PRICED STOCKS' INDEX
Take advantage of it.

====================================================================================
5/2/2010 HOTLINE Peerless Remains on a Buy.
Do not underestimate the value of having a Democrat in the White House
who is
secretly very friendly to big business and the stock market. Republicans
keep
decrying Obama for being anti-Big-business. But Obama's silent indifference
to the
anti-trust implications of the giagantic merger between United and Continental
speaks
volumes, as they say. It is one more friendship signal the White House
is giving
big corporations and Wall Street. The market will rally as a "Thank you",
I would
guess, tomorrow. Airlines
Make Final Approach to Monopoly of the Skies
(Let's see
if any Teddy Roosevelt Republicans out there will take up the banner for all the small
businessmen
and families who will pay much higher air fares because of Obama's pro-trust policies.
I wonder
how much they paid him. Anyone know?)
In
addition, it has just been announced that Greece will receive a $146 billion
bailout.
This should
also boost to the market on Monday, but after that, there is still
expected to
be stiff resistance again.
(Bearishly ) The steep A/D Line has had it uptrend slightly broken.
(Bearishly ) Down Day Volume Spikes are frequent and pronounced.
(Bearishly) Closing Powers are starting to Zig-Zag down.
The Buy B18
signal normally sets up a higher target at the time of the next Peerless
Sell.
Positive Accumulation readings like we now see in the NASDAQ are
associated
with the sustained bull market of the early and mid 1990s. The highest
Accumulation stocks will likely disregard a DJI decline. Look again at QPSA.
Stocks with
this much Accumulation in strong uptrends are very rare. They
usually get
bought out at much higher prices. Of course, stock trade like
QPSA trade
very thinly. They are below Wall Street's radar screen. When we spotted
it below
$2, our first reaction was dismissive. Fortunately, our experience taught us
to
BUY.
MASSIVE ACCUMULATION - QPSA
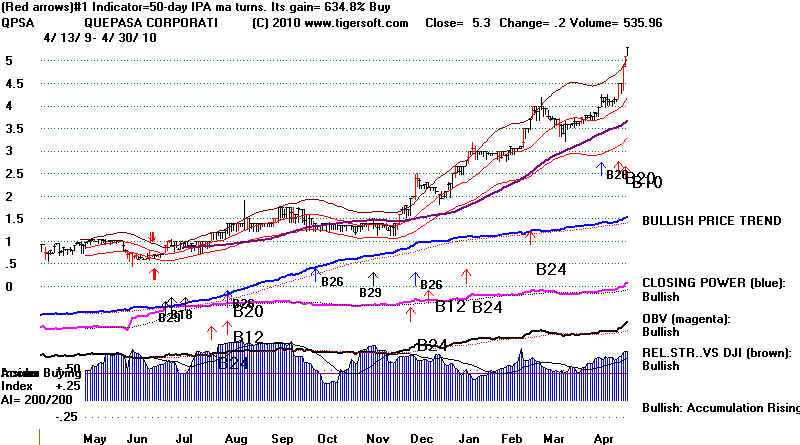
Pull-Back, Anyone?
It sure seems a pullback ought to be under way. The market needs to digest
the size of
the environmental tragedy in the Gulf as well as the gathering storm
around
Goldman Sachs. Stiffer regulations/taxation on energy and minerals' extraction
would seem
a very good bet now. But how big will the cost be to the US economy
from the
massive oil degradation of the coasts of Lousiana, Mississippi, Alabama
and Western
Florida? No one can say yet. I don't see how the stock market can
just shrug
this off; it was so completely unexpected.
I have expressed worries that Goldman may sell aggressively if it feels that the Obama
Adminstration is turning on it. But, upon more reflection, I believe at this stage
Goldman
does not want to create high placed enemies. They will not dump
shares or
turn to massive short selling. Many on Wall Street will be happy if Goldman
is brought
down to size. In any case, the
Fed and Obama have bet very big on a
rising
stock market. They MUST keep the rally going. Greek and Spanish indebtedness
do spell
trouble for the Euro. This will help Gold and the US Stocks, as an alternative.
Bearishly,
the major market ETFs' CLosing Powers' steep uptrend-lines are being broken.
They show
developing head and shoulders patterns. But the necklines have
not been
violated. If that happens, "duck and cover"
Where a
stock's advance has left it very overextended, it is apt now to be hit with
profit-taking that drives it back closer to its rising 65-day ma. Besides
internal
weakness and bearish divergences on such an advance, watch
for the
TigerSoft Closing Power to start zig-zagging lower. Our hotline
has
suggested some profit-taking in stocks showing this pattern if the
market is
weak on Monday. A decline next
weak will more likley be due
to
profit-taking and the grim nature of the environemntal catastrophe in the
Gulf more
than what happens to Goldman Sachs.
As a hedge
against a decline by the DJI back 10800, if you are nervous, I suggest
shorting
some stocks that have broken their 65 day ma with confirming weakness
from the
Accumulation index, show down-trending Closing Powers,
a price
trend-break AND a head and shoulders pattern. A head/shoulders pattern will
help scare
more of the technically minded traders into selling beyond
what a
simpler break in the the 65-day ma would tend to produce.
Screening
of 5000 stocks turned up 14 with these characteristics plus
a head and
shoulders pattern. They are:
HEAD AND SHOULDERS (14)
BUCY, IGLD, HUSA, MA, MSTR, MTA, RAX,
RIG, RTP, TEVA, WLT, WNI, WLT, X
See their graphs on www.tigersoftware.com/TigerBlogs/May-1-2010/index.html
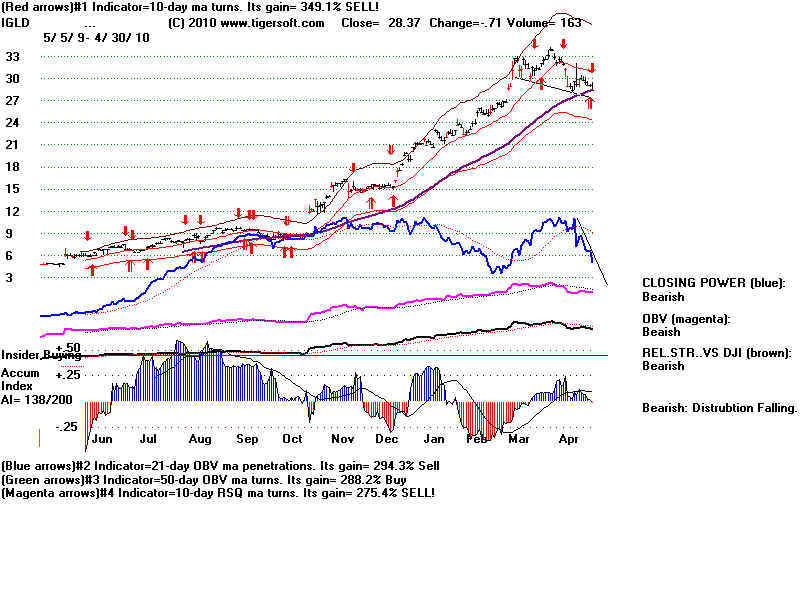
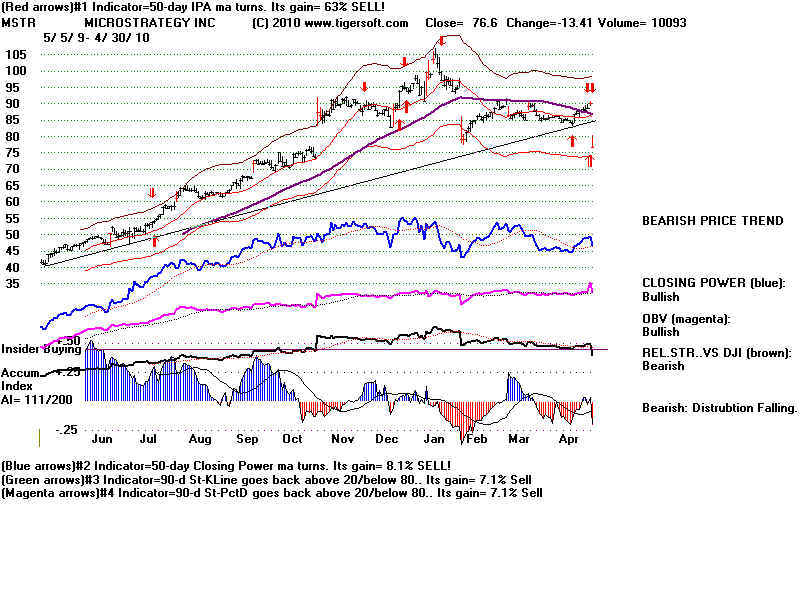
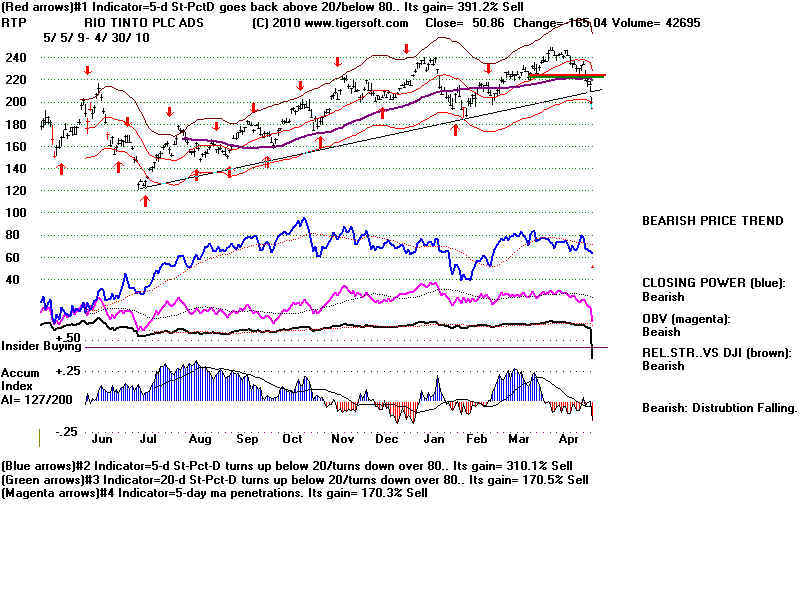
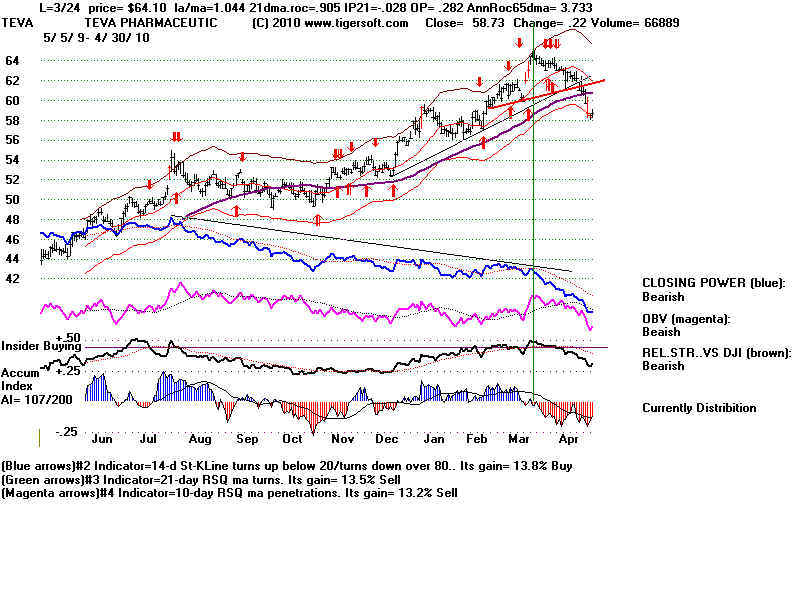
IWM is the strongest of the ETFs. Now its Closing Power is zig-zagging
down.
This is bearish short-term. It has led to pullbacks each time it has occurred
in the past
year. If the market does open lower
Monday, I would sell it.
Otherwise,
hold for a rally up off the rising 21-day ma..
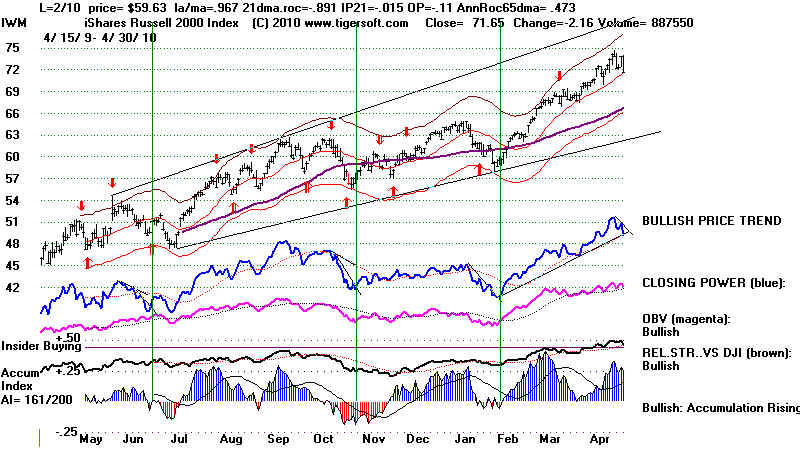
DIA, SPY, QQQQ: Over-extended with Falling
CLosing Powers . Watch
the horizontal support shown on the
chart.
DIA
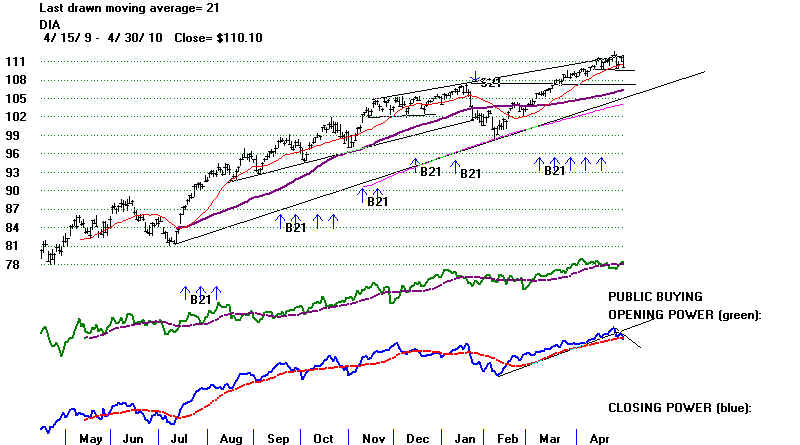
SPY - head and shoulders.
But still above the neckline.
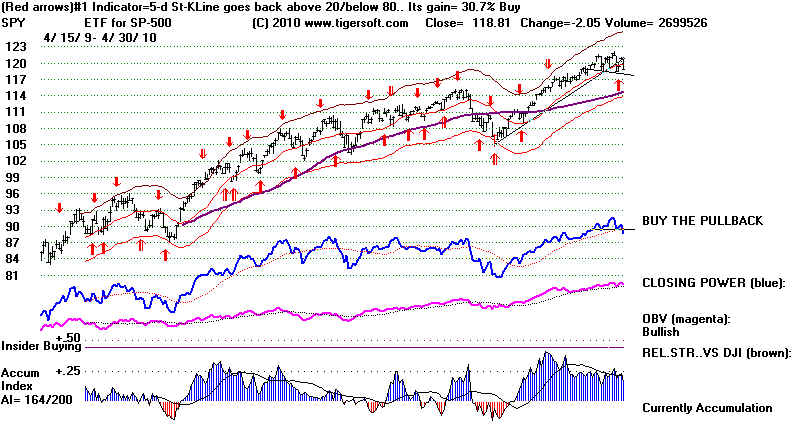
QQQQ - head and shoulders pattern.
Prices need to stay above the neckline support shown on chart.
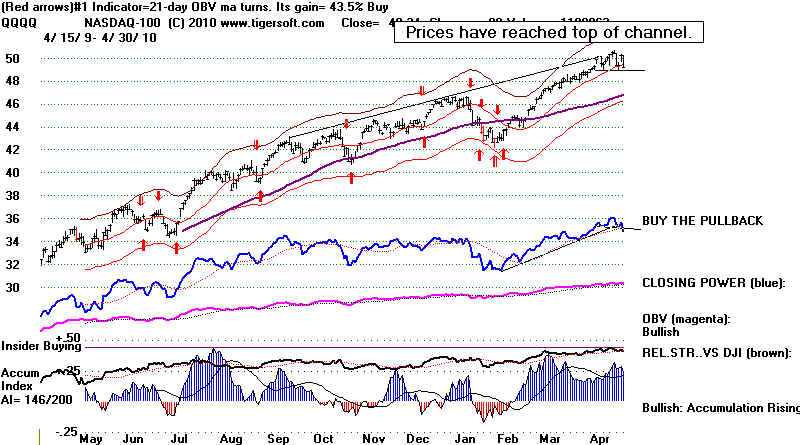
|
===================================================================================
===================================================================================
4/29/2010 HOTLINE Peerless is still on a Buy. Buy IWM.
The market keeps punishing
those who wait for a pullback lower than the support of
the rising
21-day ma. The upside from the last Peerless Buy signal, a Buy B18, is
typically
9% in its 51 cases. The biggest downside is normally about 4% in the
handful of
cases where there is a decline of more than 2%. The major exception was
in early
1997, as the DJI fell from nearly 7001 (B18 -3/7/1997) down to the rising 30
week ma at
6392 on 4/11/1997. See all the cases of B19s here -
http://www.tigersoft.com/PeerInst/-Buy-B18.htm
Consider
the bad B18 in 1997. Compare the key values of the March B18 in 1997
with those
of the recent Buy B18. The big difference is that the P-Indicator was
lagging
much more in 1997 than now. This is based on the NYSE A/D data. If excellent
breadth
remains the secret to success in this market, we will NOT see a decline like
was seen in
1997.
Since we
are bullish, we would be buyers of the major market ETFs. I would prefer the
QQQQ or
IWM. The reason is that the QQQQ has outperformed the DJI by 5% over
the last 50
trading days. (Tiger users can see this data plotted by asking for the
"ITRS"
to be
plotted under Indicators 1 with these ETFs on your screen). The SPY has out
performed
the DJI by
less than 2% over this time period. I might add that the IWM (Russell-2000)
has
outperformed the DJI by almost 10%. The IWM chart is shown beneath the 1997
DJIA chart
just below.
3/7/1997 4/22/2010
Comparison
DJI
7001 11125
la/ma =
1.009 1.014
21-dma roc =
.437 .368
P =
137
317 better breadth in 2010
Accum. Index IP21 = .114
.095
slightly lower Accumulation in 2010
V =
11 4
lower
Advancing Stocks' volume in 2010
OP =
.137 .439
higher aggressive buying in 2010
DJIA 1997 with Bad March B18 - The Worst Case Scenario
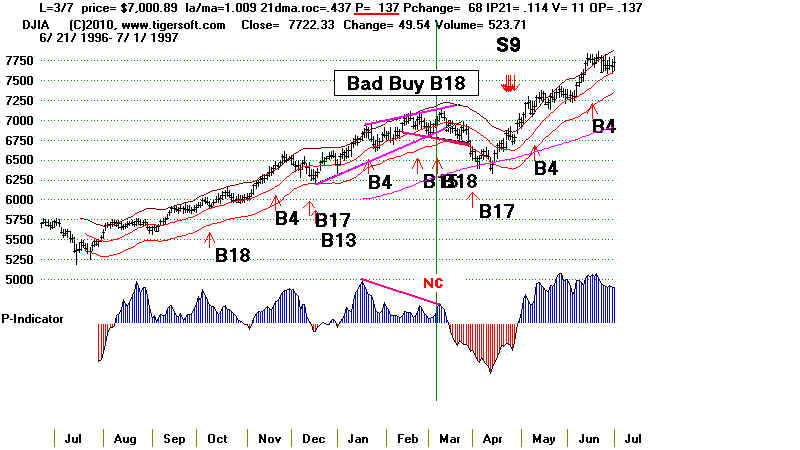
IWM - Strongest of Major Market ETFS
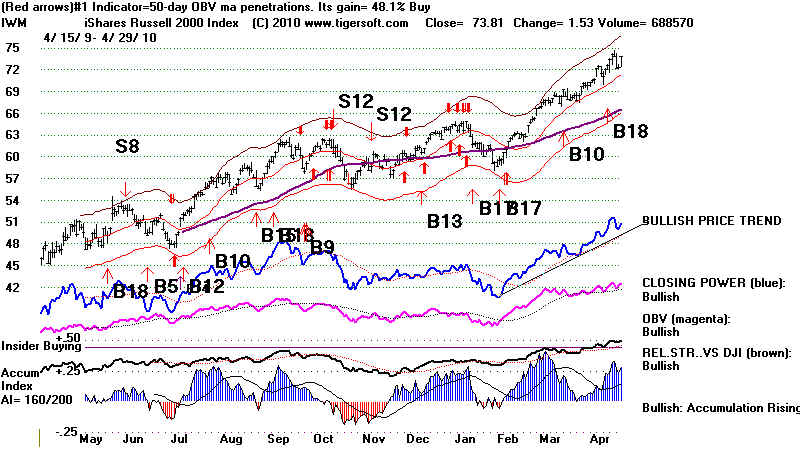
Bullish Action Today despite Protestors' March on Wall Street
With 3x
more rising than falling on the NYSE and an abundant number of daily new
12 month
highs, the DJI rose 122 today. The NASDAQ and QQQQ have reached the
apex of
what could become the right shoulder apex of minor head and shoulder patterns. A
move
higher
Friday would probably be bullish enough to send these indexes up for another few days,
at least.
11300 still seems resistance for the DJI. That's 133 points higher. But that
may be
taken out
by much higher prices. The B18 suggests that. So do the very high levels of
Accumulation among so many of the DJI-30's stocks.
DJIA Stock AI/200
HPQ
182
UTX
179
AXP
176
DIS
174
CAT
174
IBM
172
BA
168
MMM 162
I have kept
thinking there ought to be a retreat back to test the support at 10800. The market
has not
accomodated such a view. It may still. But high accumulation New Highs are
plentiful.
(Data
downloaders can see these in "NHCONF".) Tiger users have to be impressed
right now
with how
easy it has been to find classic Buy B24s, i.e. new highs where that previously have had
a bulge of
"insider buying", as measured by the Accumulation Index surpassing .45.
This is
normally a
reliable sign of market health until NYSE or NASDAQ new highs reach an extreme,
perhaps
numbering 500 or 600, or the longer-term A/D Line uptrend is broken. The degree to
which the
P-Indicator and the Accumulation Index are failing to confirm the new highs is just
not
sufficient to bring a sell-off to the lower band. And, of course, there is no
Peerless Sell.
So, there
continues a buying spree by well-heeled instutional investors gobbling up secondary
stocks.
Clearly they have decided not to wait for any further pullback. They are not
afraid
to buy
smaller, thinner companies. Here is little know QPSA - Que Pasa - a Spanish social
net.
The levels of Accumulation are so high, there are few earlier examples that match it.
I will post
on the next few days links to a great many of the past very high AI B12s and B24s
going back
to 1987, so that readers can compare and contrast them.
QPSA - Que Pasa
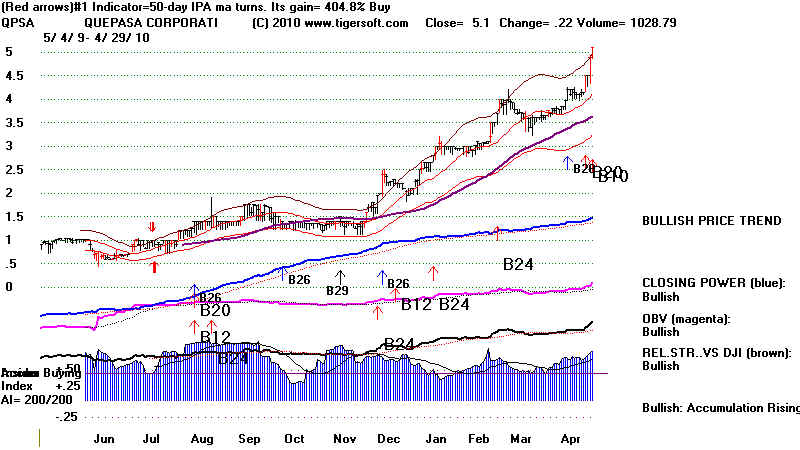
God's Work?
Tonight it
was announced that Goldman Sachs will be prosecuted criminally for fraud
in
connection with its selling of mortgage CDOs and at the same time selling them short.
A criminal
prosecution is much more serious, more defaming and more likely to
widen into
new areas of culpability. I must say that I feel vindicated. This is
somethng
I have been
writing about on my Blog for more than a year. If GS does come under
criminal
investigation, it seems certain that much more will be learned of its massive
fraud,
insider trading, front running and market manipulation. Wall Street may not
like the
findings, but investors will be big gainers. The palying field needs leveling.
I would
think the selling pressures on the stock will not end soon. For background
see - April 9, 2009
Goldman Sachs Is
"The GREED CONNECTION" between Wall Street and Washington
The weekly
chart below shows there is little support if 140 is losed below until the stock falls
to 60-80.
Our Stocks' Hotline is short it.
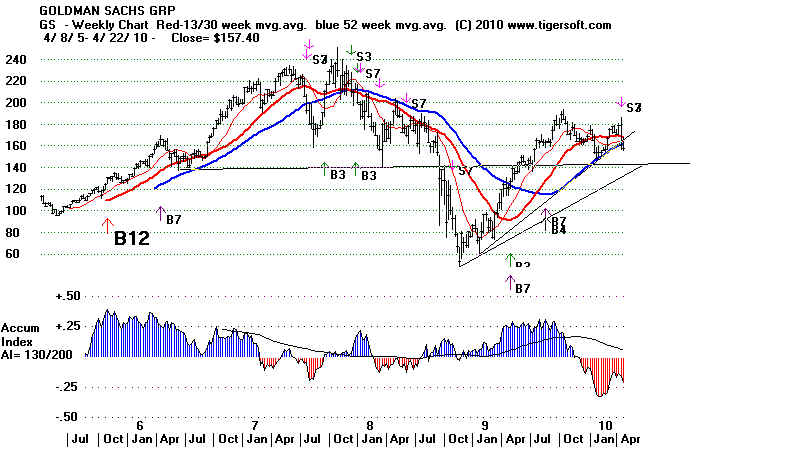
OIL'S ENVIRONMENTAL COST - NOW HARDER TO DENY
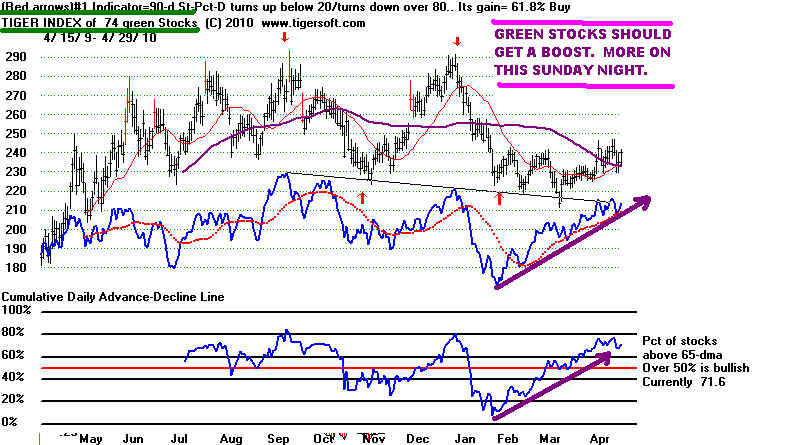
Green stocks should get
a boost from oil spill
in Gulf. Would Buy PUW - 25.53
PUW (bwlow) seeks results
that correspond to the price and yield performance, before fees and expenses, of the
WilderHill Progressive Energy index. The fund invest at least 80% of total assets in
common stocks of companies principally engaged in the progressive energy business. It
normally invest at least 90% of total assets in common stocks that comprise the
Progressive Energy index .
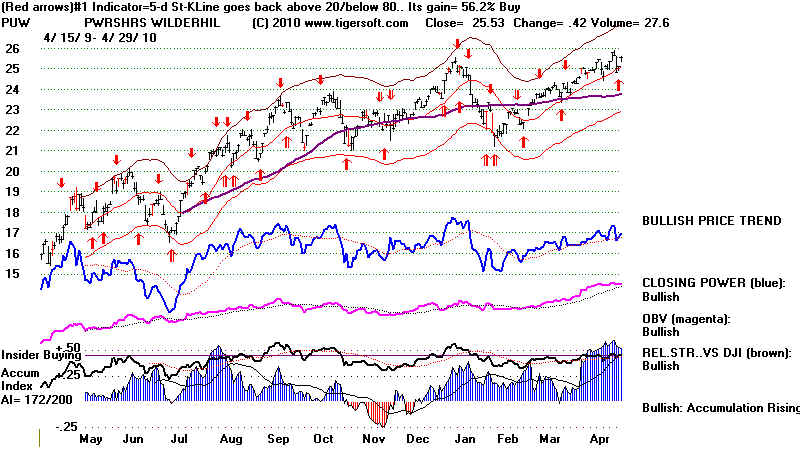

Exxon Valdez spill in Alaska...
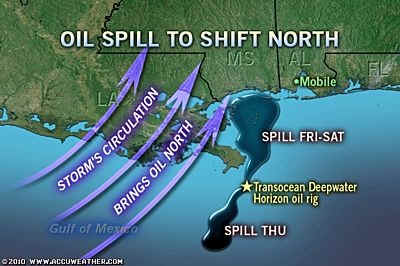
http://www.nationalparkstraveler.com/files/storyphotos/Oil%20Spill-GUIS%20AccuWeather.com_.jpg?1271971177
"Spill Baby Spill": BP and RIG will have to pay for an oil spill that "eclipses"
the Exxon
Valdez spill in Alaska... First, look at the chart of Exxon back in
1989. The spill occurred in a strong bull market.
Litigation lasted more than 20 years.
XOM has paid only a fraction of the damages its drunken captain
caused. BP will
probably escape in the same way. RIG's reputation as a
drilling contractor has
been badly shaken. I would think its stock is a better
short. Note the weakness it
showed internally in the months before this disaster.
Sadly, although remote shut-off
valves are required in Europe, Congress has not got around to
requiring them in the
US. Watch to see if a movement for this occurs.
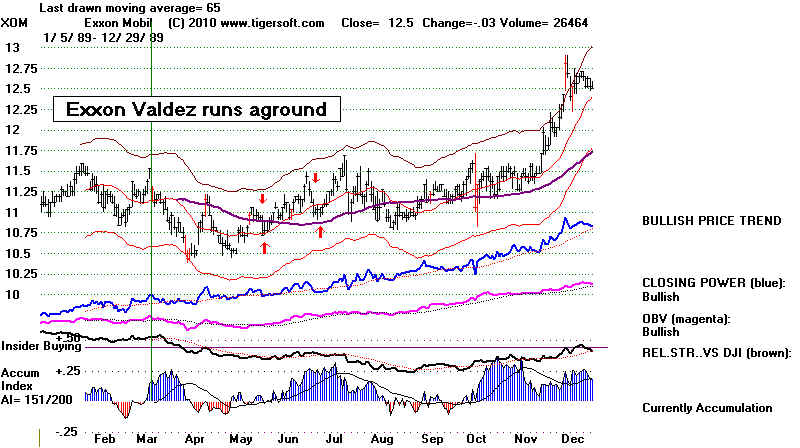
And watch Obama. He has backed Goldman Sachs and its CEO in
the past, calling him
a fine fellow and good businessman while taking $1 million from
them early in the 2008
Presidential campaign. Also of interest, Obama caved in to
pressures from Congressmen
beholden to oil interests and recently has taken the position
that offshore drilling is safe
enough to be expanded. March 31, 2010 Obama: To
Expand Offshore Oil Drilling
Will he back-peddle? I predict you will see him make a speech soon about the oil
spill,
whihc he will start by saying, "I have always stood for
protecting the ocean beach
environment, that is why I am today...." More
interesting, will be whether any of his
liberal supporters dare to criticize him for having too little
backbone to stand up to the
country's three most powerful lobbyists, the Health Insurance,
Wall Street and
Big Oil lobbies...
British Petroleum
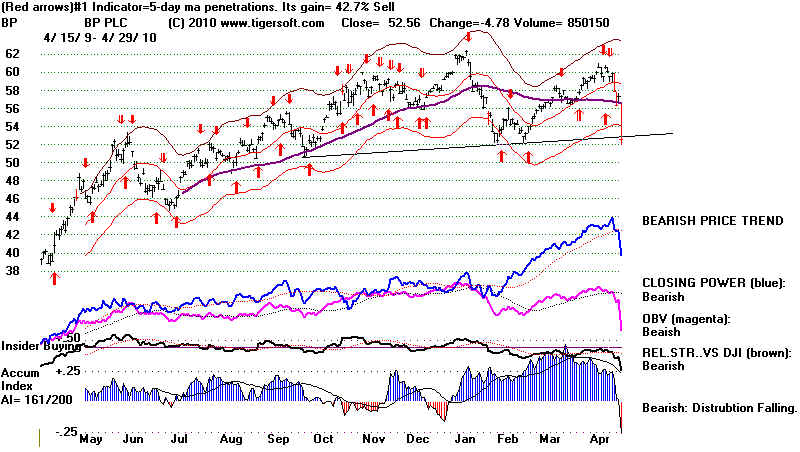
TransOcean - RIG
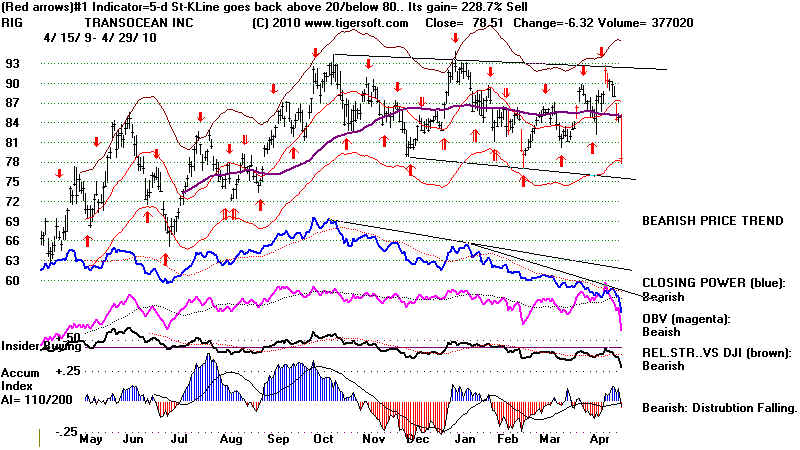
====================================================================================
4/28/2010 HOTLINE - No Peerless Sell.
Same Technical Comments as Tuesday Night.
A DJIA decline to 10800 seems likely. European Debt problems will
worsen
because of the
ballooning use of unregulated credit default swaps, the absence
of any local currencies
and the presence of so many angry, demonstrating citizens
who do not find 20%
unemployment acceptable.
Amazingly, there is
nothing to stop sinister short-selling speculators from driving
Greece and Spain into
national bankruptcy, just so they can make a bundle. How? Example:
for
$754,280 a year a big trader can presently buy default "protection" on
$10 million in
Greek
soverign debt. Previously, speculators would sell short the currency of
the weak
country. As these
countries' currencies declined, their economies were boosted by
expanded tourism and
exports. Companies would be attracted by the lower costs of
labor and land.
So, there used to be a natural cushion against utter disaster.
But Greece and Spain
now no longer have their own currency. The EURO ended
this. This has
set the stage, as never before - except in war - for a total country
financial collapse. Of
course, the the heads of the Economic Union and the Greek
Premier call
"absurd" any talk of national (sovereign) bankruptcy or the breakup
of the European
Economic Untion. Others like the prescient economist from NYU,
Nouriel Roubini,
disagree..
Jan 27, 2010 - Roubini:
Greece Bankrupt, Spain Next
Apr 27, 2010 - Roubini:
Saving Greece Won't Work, Debt Crisis to Spread
The problem, as I see
it, is that the situation now can be turned into a tragic death spiral
for an entire nation of
millions and millions of people because of the utterly selfish actions
of unregulated big-bank
speculators, now, using in many cases, free US Fed money.
What are the dynamics?
Now when investors see a country in decline and being attacked
by credit default swap
predators, they back away because there is no protection against
bankruptcy, except
bailouts. In Greece and Spain unemployment is close to 20%. IMF
or banker imposed
austerity means even fewer jobs and less of a social safety net. High
levels of civil unrest
are a certainty whenever the Greek government seems to be
kowtowing to the these
pressures to balance their budget immediately. The media in
the US blame the Greeks
and Spaniards for living beyond their means. But are the poor
unemployed people there
expected to starve, just so rich bankers can get still richer?
Were it not for these
credit default swaps and the absence of an independent Greek
or Spanish currency, a
financial collaspe might be avoided and a bottom might otherwise
be reached. Of
course, Wall Street's Standard and Poor's gets into the self-reinforcing
free-fall when it
issues all-too obvious, but very public warnings that the Greek budget
deficit is at unsafe
levels.
Because credit default
swaps have ballooned so much, yet are so completely unregulated,
we have to depend
solely on big banking firms to tell us what their role was in bringing
about the Financial
Crash of 2008. Absurd! Of course, Wall Street banks won't admit
just how pivotal and
decisive their bearish role was in destroying millions of jobs and
retirement dreams.
Just allowing credit
default swaps seems like a costly and criminal fraud, to me. AIG
sold them with impunity
in quantities it knew full well it could not possibly redeem if
there was a housing
collapse. That is criminal fraud! Speculators bought them, just like
""
they are buying them on
Greek and Spanish debt, making the declines in these countries'
economies much worse.
In America, the taxpayer bailed out AIG and the big banks.
Bear raids were made
illegal in FDR's time. Not now. In Europe, an organized international
"run on"
Greek debt by these speculators will likely bring a chain reaction of short selling
of the debts of Spain,
Portugal, Italy, Ireland... and eventually the US! This is intolerable.
(More about this on the
Tiger Blog)...
GOLD
Gold is rallying
because of the dangers of sovereign European bankruptcies.
GLD- Target 117-120 Note inverted
continuation head and shoulders pattern.
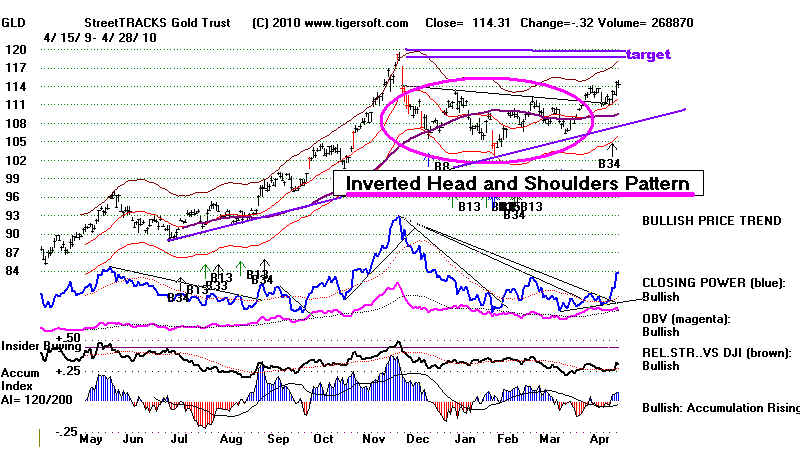
World's Biggest Gold Stock NEM - Newmont Mining - 5 Year
Many reversals (9x) back down from resistance between 55-61
in the last 5 years. That suggests a breakout even above
the weekly trendline at 56 should be quite bullish, although
Accumulation Index readings are not very high. The latest
Quarterly
earnings (.88/share) have more than doubled
since
the start of 2006 (.35/share) when the reached 61.
One
would think that would boost the stock. IBM (not shown)
has done the same thing - play catch up with its earnings.
It made a breakout past 130 but quickly stalled out. My
guess is NEM will reach 61 if it can get past 56, but will
not be able to make a much bigger advance. There are just
too many investors who have been conditioned by all the backing
and filling to sell on strength. When the stock shows more
Accumulation from Tiger's Index, I would project a move
into 70s. That may occur after mid-year when gold stocks
typically start to enjoy much more seasonal strength.
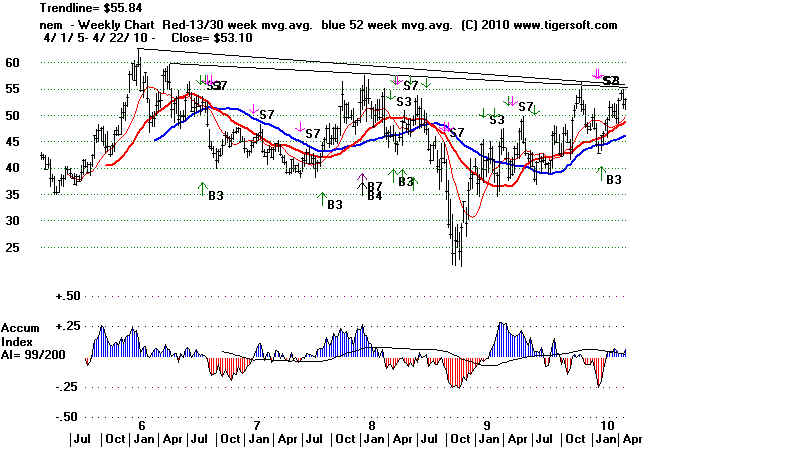
CHINA
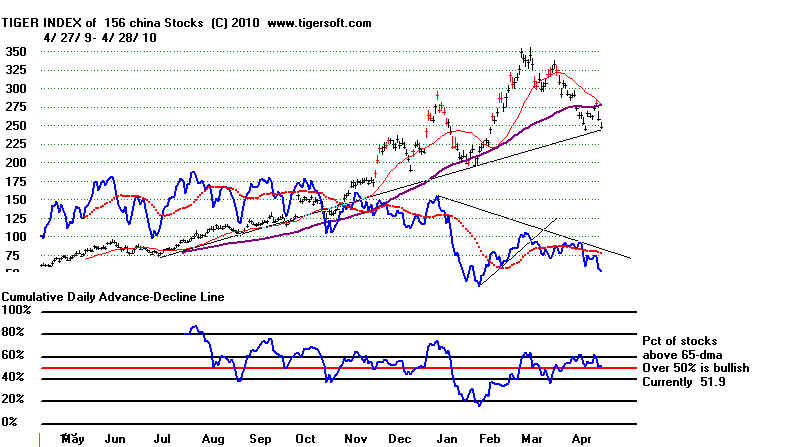
ITALY
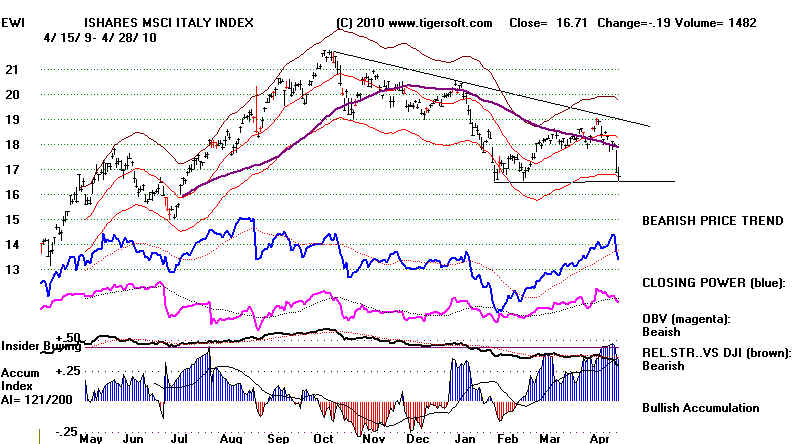
SPAIN
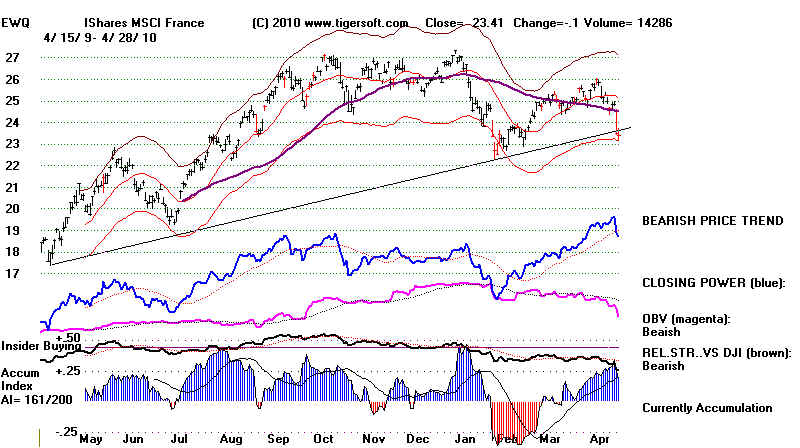
=====================================================================================
4/272010 HOTLINE - No Peerless Sell. But A Decline To 10800 Seems Likely.
It's true, we will get an up opening from the rising
21-day ma. The internals of the market
and the 21-dma's annualized momentum (AROC=.153) are
sufficienyly positive to allow
a bounce. But my guess is the march on Wall
Street Thursday will provide a better
bottom, especially since traders are apt to want more
head-room to buy. The recent highs
at 11000 would seem to be the likely barrier to any
rally. 10800 would be a better place
to buy.
Profit-taking has forced
the DJI back below 11000 and slightly broken the DJI's uptrend.
The NYSE A/D Line uptrend will be broken on another day of
weakness, as will the
major ETFs's Closing Power uptrend-lines. This
seems similar to what happened
in January. This decline will be a test of how much
support is still being orchestrated by
the Power Elite - the Administration, the Fed and the big
Wall Street bankers. Today's
Senate attacks on Goldman Sachs may or may not escalate.
Obama has been quiet and there is
no evidence that Dodd's financial reform bill will
amount to much, even if it passes. Apparently,
Goldman's computerized trading is needed to rig the rally
higher. This Thursday's anti-Wall
Street demonstration on Wall Street may very well drive the
DJI back to 10800.
That was the peak in Janaury. Broken resistance
should be support on the first test.
It's true volume keeps
rising on down days. This suggests there are some cracks in
the Power Elite's rigging of higher prices. But the
consistenly very high levels of Accumulation in
so many stocks and the NASDAQ are usually signs that there
will be plenty of buyers
in the wings to support prices on any decline 3%-5% lower.
Look at the how bullish today's
"bullish" "confirmed new highs" look:
See SPEC, LGCY, MRVC, LYV, A, HYT and MSPD.
Clearly, the buyers in these stocks paid little attention
to the DJI's 200+ point decline.
See TigerSoft's Big Up-Stocks on A Big
Down-Day.
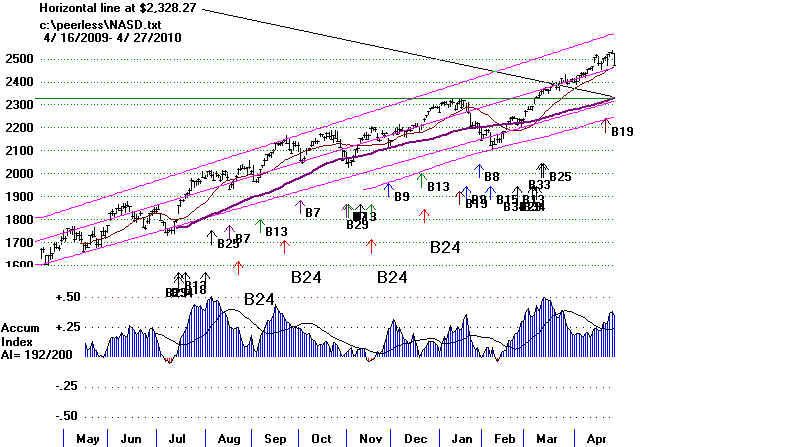
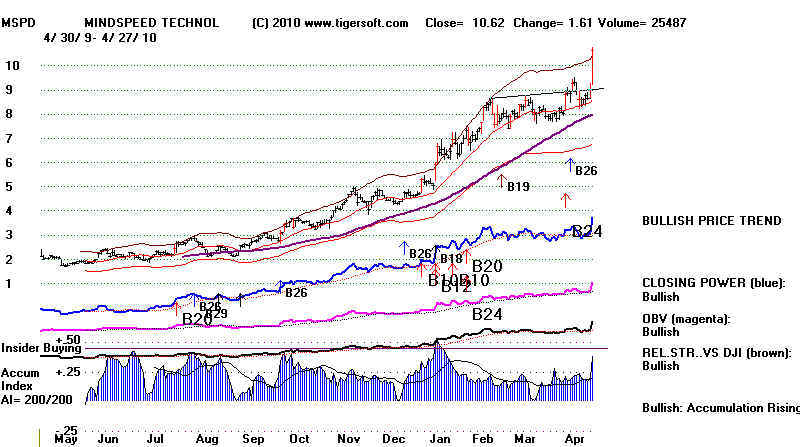
QQQQ is pulling back from top of channel

BEARISH WEDGE PATTERN BRINGS DOWNSIDE BREAK..
WEAK CLOSING - PROS HAVE STOPPED BUYING FOR NOW.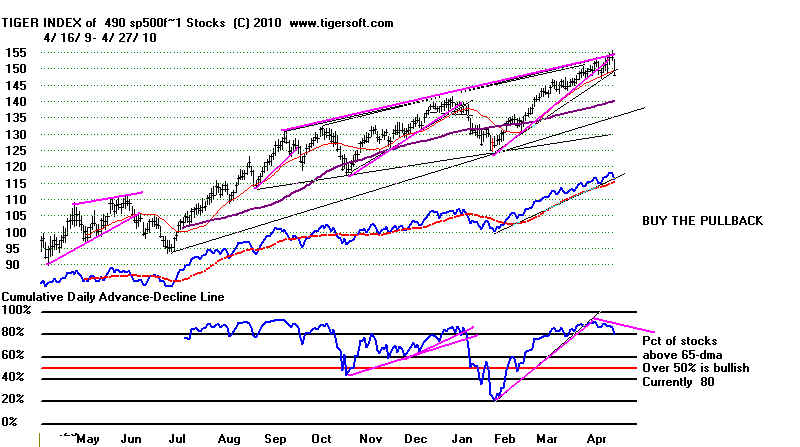
-------------------------------------------------------------------------------------------------------------------------------------------------------
4/26/2010
HOTLINE
PEERLESS REMAINS ON A BUY... I WOULD BE SURPRISED NOT TO SEE
MARKET WEAKNESS THIS WEEK, POSSIBLY CLIMAXING ON FRIDAY.
The DJI, SPY, QQQQ and DIA could not breakout above their diagonal resistance
lines, shown above and further below. That establishes the existence of
"bearish rising
wedge" patterns. The public has started selling on balance. Professionals
have been
pushing prices up after weak openings. The support of professionals will be tested
tomorrow when Wall Street CEOs appear before Congress. Goldman Sachs, in particular,
will be in the spotlight because of the SEC's fraud charges. Democrats will be
pretending
to be populists on this occasion. They sense they have an opening on Republicans who
are against heavy-handed regulations and future subsidies of the big banks. So,
there
should be a lot of rhetoric challenging these CEOs honor, given the taxpayers'
bailouts and the $13 billion Obama's Geithner let Goldman get from taxpayers as the
US stood 100% behind all AIG debts, including credit default swaps, which would in
earlier days have been considered illegal and thus unenforceable. In my opinion,
the Democrats, as a whole and certainly the Obama Administration, have taken
far too much money from Wall Street to be any serious threat to Wall Street. The 60
vote requirement in the Senate guarantees little of legislate consequence will be
produced,
especially with Dodd as Chairman of the Senate Finance Committee. His cozy - I would
say
"sleazy" relationship with Countrywide Financial, now Bank of America
is seldom
mentioned by the mainstream media. It
was Dodd, with secret encouragement from Obama,
who
added a provision to the TARP bailout bill that allowed executives at AIG, BAC, GS
and
others to pay out large bonuses with taxpayer money!
Wall Street Demonstration on Thursday
On Thursday, the AFL-CIO
and others will stage a demonstration on Wall Street.
Marches on Wall Street have brought drops in the market in the past when the market
was already declining. The uptrending prices should moderate the impact of
this.
Foreign and Public Selling will likely take place.
The "No Bailout
for Wall Street"
March on September 26, 2008 occurred with the DJI at 11143.
Two weeks later it stood at 8500.
In May 1970, such a march sped up the final decline
in the 1969-1970 bear market. The
march occurred on May 7th with the DJI at 723 in the aftermath of the escalation of the
war on Viet Nam to Laos and Cambodia and the Kent State massacre. The DJI dropped
like a rock and bottomed out on May 26 at 631.
Violence, on the other hand, would be a much worse development. In September 1920, a
very big
bomb went off on Wall Street
that killed 38 and seriously
injured 143. At the time
Communists and the IWWW were blamed, but later the FBI concluded that it was
most likely the work of Italian
anarchists who wished to
avenge the conviction of immigrants
Sacco and Venzetti. (Sacco
and Vanzetti. The DJI fell from 84 when the bomb went off to a
final bottom of 64 in th middle of 1921.
OIL STOCKS
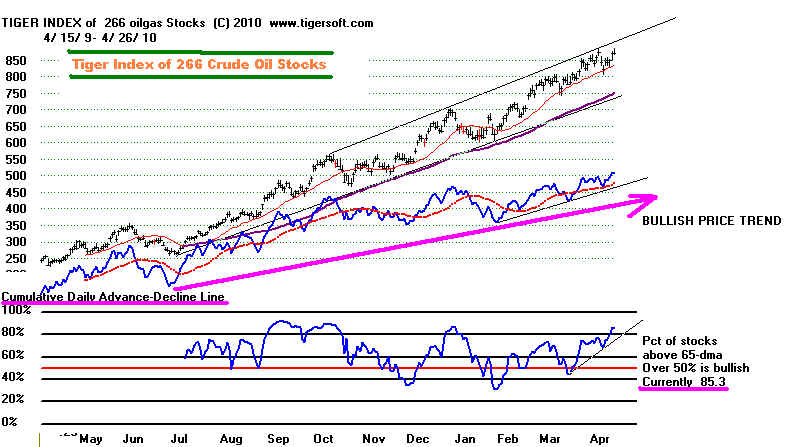
Oil stocks are generally very strong as oil is working on overcoming the $80/bar
resistance.
I wrote a Blog tonight for Hotline
subscribers tonight showing some high Accumulation
breakout and impending breakout oil stocks.
Here you will also see some rules for
selling them when extended before they break their 65-day
ma.
LOW PRICED STOCKS REMAIN IN UPTRENDS
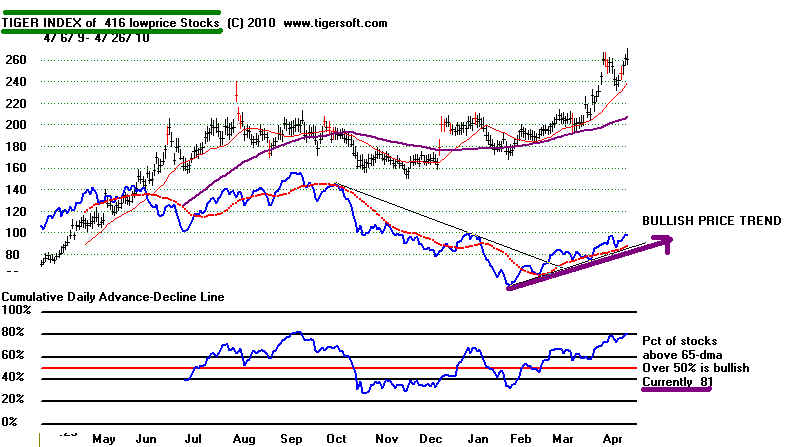
===================================================================================
4/23/2010
HOTLINE -
Peerless Remains on A Buy. DJI and other Indexes are at well-tested diagonal
Resistance. There is lots of momentum upwards in the market. Internals are
rising
and the Closing Powers have made new highs. For now, I would think the market will
keep
rising, much to the dismay of shorts.
My view is that this will be an important week. The CEO of Goldman Sachs will defend
his company from fraud charges, among other things, before Congress. But Obama badly
needs Goldman's computerized trading system at work to keep lifting stock prices. His
only chance of getting re-elected is if stock prices magically rise so much that employers
start hiring.
Obama also needs the FED to be able to keep giving its subsidies to Goldman and
other
Wall Street banks so that they keep buying stocks and don't start selling. That
would be
disastrous. To do that, the FED wants to keep secret the details of its cheap
"loans" to
Wall Street. These now approach two or even theee trillion, according to some
sources,
If the details were ever disclosed, there would be a populist revolt. Senate
Democrat Dodd
know this. He has inserted in his "Wall Street reform" bill provision for
more secrecy
for the Fed, not less. Google "Alan Grayson". "Ron Paul"
and "Fed secrecy" to see
and track this. Obama and the Democratic leadership won't be talking much. Nor
will the
mainstream media.
I believe that while the rally has nearly gained self-sustaining momentum, to be surer
of the DJI reaching 12000, the rally will need more Goldman's manipulations and Fed's
money to stop incipient declines from getting too sttep. We will know this is
the way things
are playing out, by watching Obama. Expect him to use more of his patented populist
rhetoric in the matter of Wall Street reform. But most especially, watch the Senate
bill,
in the matters of:
1) the breaking up big banks,
2) imposing a wind-fall profits tax on them,
3) limiting executive pay and bonuses on Wall Street,
4) limiting their use of excessive leverage,
5) curbing high frequency program trading and
6) openness and accountability at the FED
Any action along these six lines, rather than on derivatives, a typical red herring,
would ACTUALLY hurt Wall Street's power and profits. Without commensurate advantages
for Main Street such actions would hurt the rally.
So, if Obama speaks out at all, I seriously doubt he will do much to weaken Goldman.
We'll be watching how it all plays out. The way the market is advancing, it looks
like
Wall Street expects to have everyhing under control. Probably, Goldman will get a
big slap
on the wrist for fraud, but there will be no serious reform of Wall Street. One
thing, for
sure, whatever the Democratic Congress does, Obama will praise it as
"reform".
Stocks and ETFs:
Emphasize The Last Three Months' Level of Accumulation
and Stocks Moving Past Their Own Rising Resistance Lines.
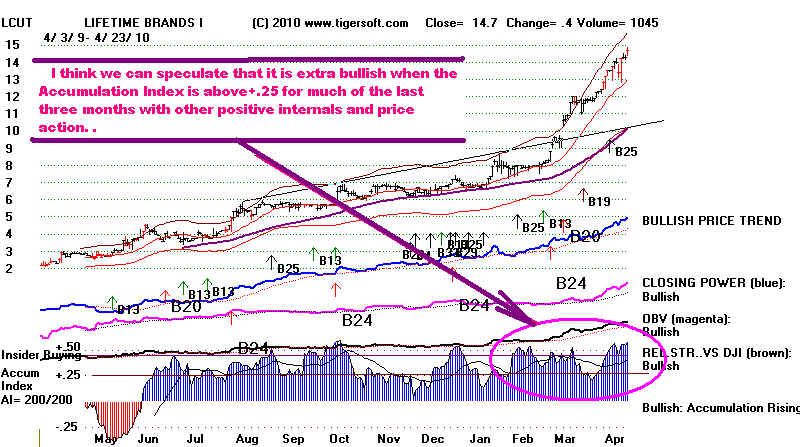
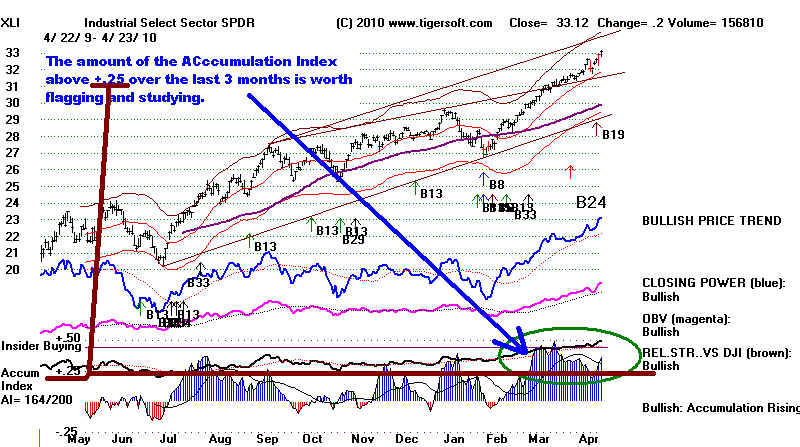
CLOSING POWERS ARE NOW BULLISHLY MAKING NEW HIGHS
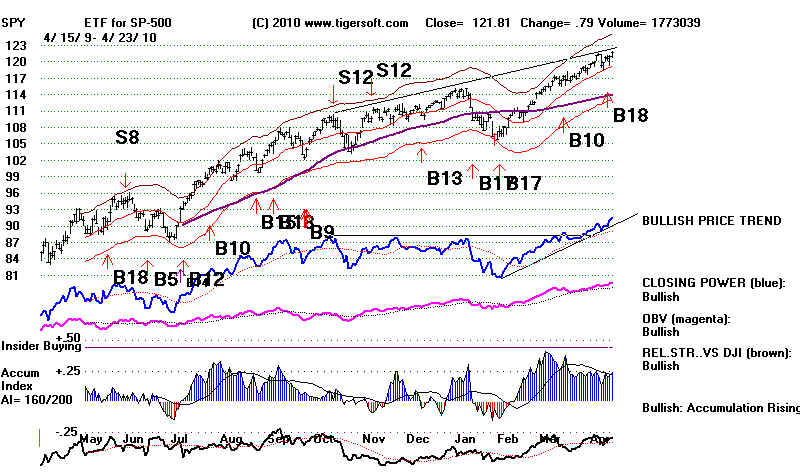
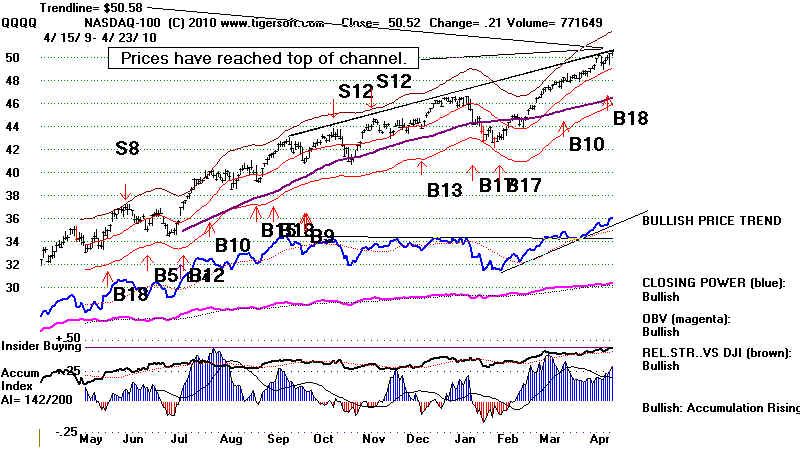
====================================================================================
4/22/2010 HOTLINE
-
Peerless Remains on A Buy. DJI Support is at 11000 and Resistance is at
11150-11250.
The DJIA has backed off from 11500 many times in the last five days.
This is clearly important resistance. The DJI will need to surpass this or
a 3% to 5% decline is likely, as it regroups for another assault with more
momentum. Meanwhile the excellent breadth, strong Closing Powers and
increasing speculative fervent are all powerful bullish forces. Looking at
the ETFs for Spain, Italy and Ireland, it is not evident from their highs
levels of Accumulation that Greece's financial problems will quickly spread
elsewhere in Europe. What is clear, is that entrance into the EEC has denied
Greece a way to depreciate its own currency, thereby making its products easier
to export and its workers less expensive for foreign investors to employ.
In this sense, Greece is a critical test of the viability of the EEC's economic
founding principles.
STOCKS SHOWING HIGH ACCUMULATION BREAKOUTS
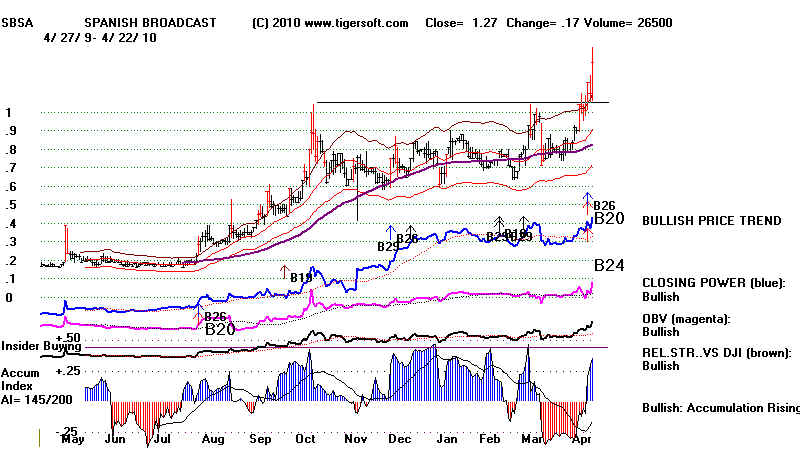
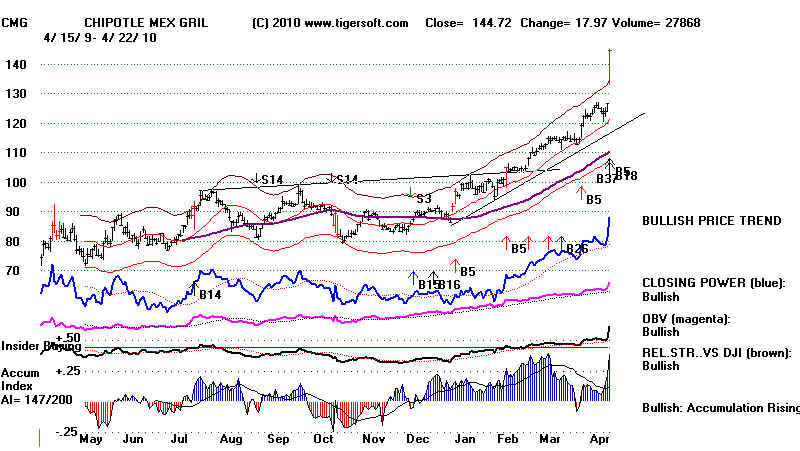
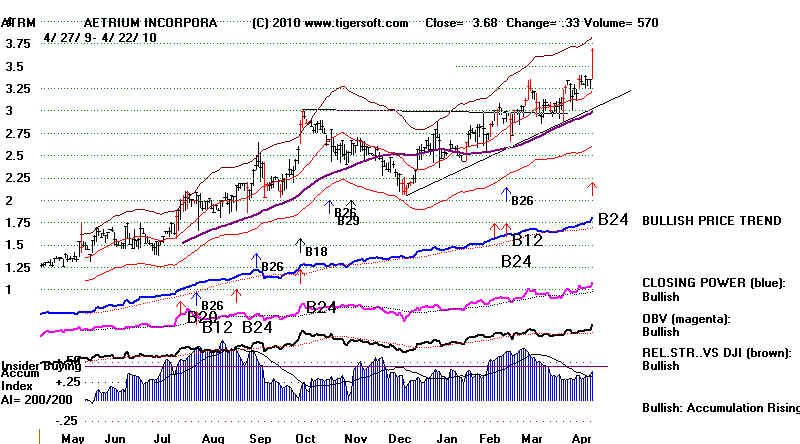
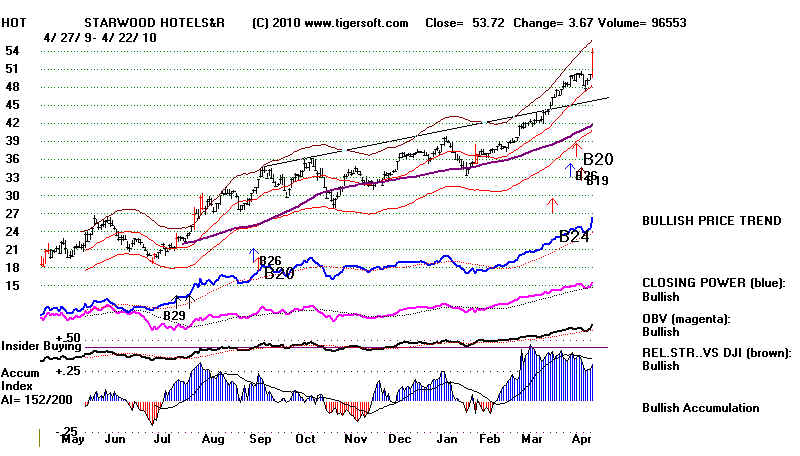
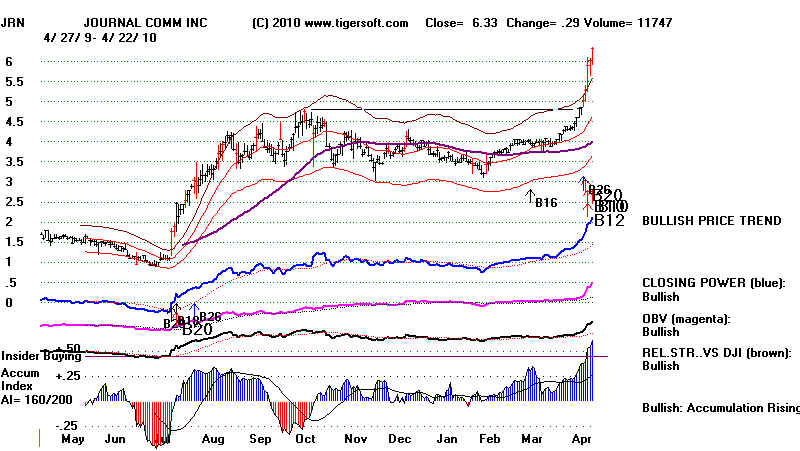
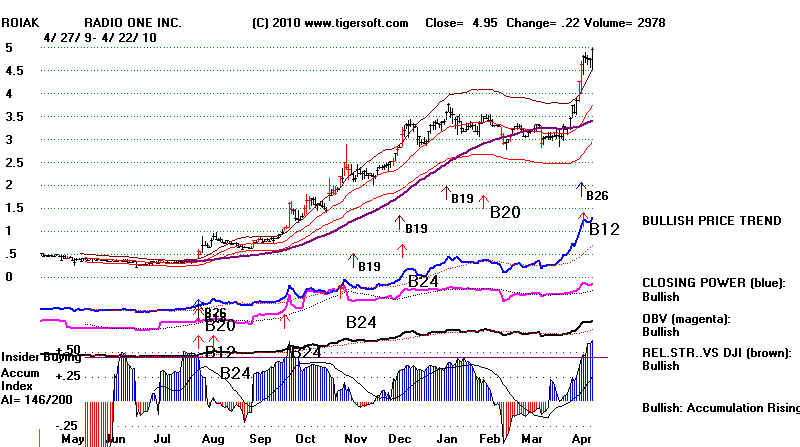
=============================================================================
4/21/2010 Today the Peerless Buy was Reinforced by an Augmenting Buy B18.
This cannot be said to be an immediate Buy signal.
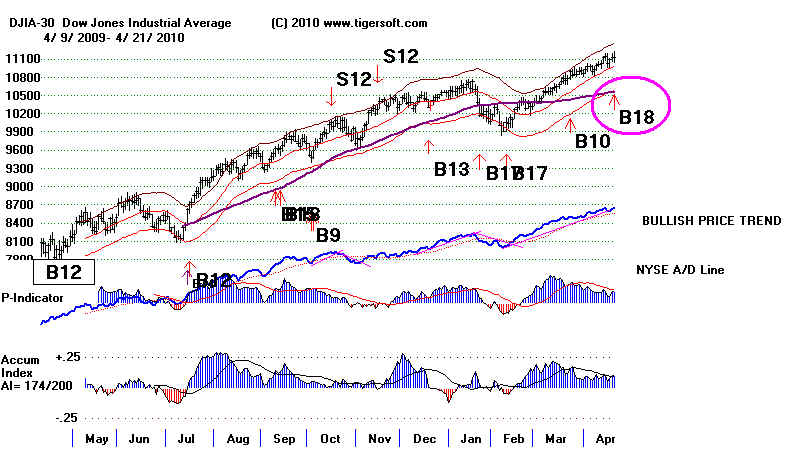
A pullback of 3%-5% is
still a possibility. The weakness in the bigger bank stocks today
could spill over to the
general market. 11200 is resistance. Support is at 10800.
I don't think that we
should be concerned about the financial stocks doing a free-fall
because Obama speaks to
Wall Street tomorrow. Look at how bullish the A/D Line
is for 113 financial
stocks (which includes not just the biggest Wall Street banks).
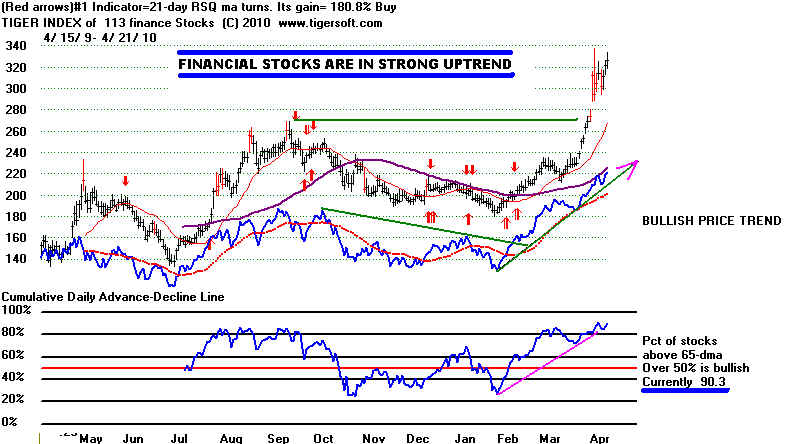
A weak closing or two
would produce a minor falling Closing Power trend. Openings are
definitely getting
weaker, too.
TigerSoft' Day Traders'
Tool for the ETFs shows we are approaching a tipping point,
where there is more
weakness (day's low) relative to strength (day's high) after the opening.
Since the new highs
have not been confirmed by this indicator, a break in its uptrend
would be bearish
short-term (two weeks).
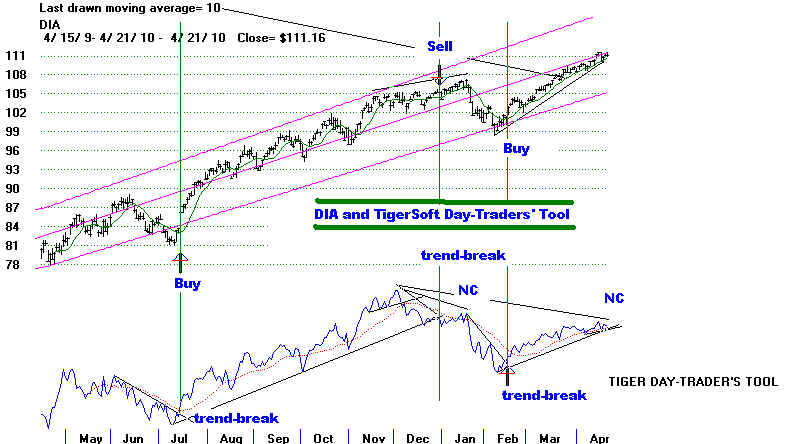
The Buy B18 tells to us
we have more reason to buy if there is such weakness.
Buy B18s, even though
they are seldom reversing Buys, still average a DJI gain of
more than 9%. 52
of 61 were profitable. The losses were:
-4.5% (1950),
0.0%(1951), -0.2%(1978), -1.1%(1988), -1.7%(1996), -2.4% (1997),
-0.2%(1997),
-0.2% ( 2001) and -3.2% (2005).
,
When a Buy B18 signal has occurred
12-14 months after a major market bottom, since 1928
the Peerless Buy B15
has brought 5 gains (+6.5%, +7.3%, +10.9%, +10.2% and +23.7%) plus
one null trade on the
DJIA at the time of the next Peerless Sell.
4 / 20 / 1943 133.1 Gain= +.065
.993 .329 174 -18 .081 v=246 .247
Fell back to 131 before rallying for 3
more months.
12 months from bottom (4/28/42)
10 / 11 / 1945 185.7 Gain=
+.073
1.025 .441 138 -11 .237 v=148 -.001
Rallied immediately
13 months from bottom (9/14/44)
9/ 20/ 1951 274.1 Gain= 0 (S1 - 274.20)52
1.01 .387 98 11 .141 v=65 .096
Paper loss. DJI fell to 256 in November and then rallied back.
14 months from bottom (7/17/50)
11 / 28 / 1958 557.50 Gain= +.109
1.004 .443 104 18 .091 v=79 .342
Up strongly.
13 months from bottom (10/22/57)
2 / 1 / 1961 649.3 Gain= +.102
1.024 .736 197 13 .13 v=377 .324
10 day decline to 637 and then rally to
705 in 3 months.
13 months from bottom (10/25/60)
5 / 25 / 1995 4412.23 Gain= .237
1.007 .306 133 -10 .127 V=10 .299
Immediately rallied
13.5 months from bottom (3/31/94)
Tiger Index of SP-500 Stocks
Uptrending - 90% are over 65-dma
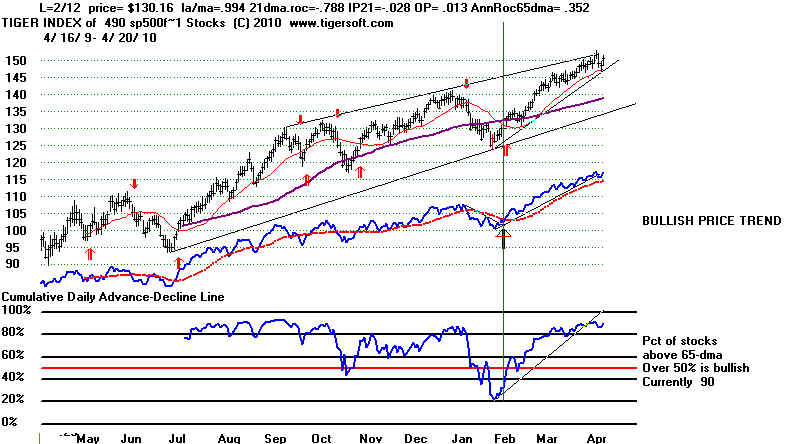
==================================================================================
4/20/2010 The DJI may still retreat 3%-5% from 11500. But today's
very good breadth shows the rally is still very much alive for our High
Accumulation favorites.
NO Peerless Sell. Peerless Remains on A Buy. Breadth improved
tToday.
The
CLosing Powers for the ETFs have recovered, too. 11500 may be the resistance
for
the DJI shorter term, but the 13 month bull market has logically gravitated down
to
stocks under $10 share. A surprising number of low-priced stocks with bulges of
Accumulation are making new highs. Carried to an extreme, thiswill eventually create
a
bigger and more dangerous bubble and higher diving board fro the market ro fall from..
But
this is the market's way of getting the broader public's attention. A suspicious
and
cynical public is being invited back into the market by such action.
The breakout today do not show a year of positive blue accumulation. So, these
stocks are not as tightly held. But the ones breaking out have sponsors and stories
and
will probably make good intermediate-term moves up from here. I think we should
buy
these high current Accumulation lower priced stock breakouts provided that the Closing
Power
is
making also new highs. As long as this Tiger indicator is uptrending, there is
usually little
risk
and much more upside potential.
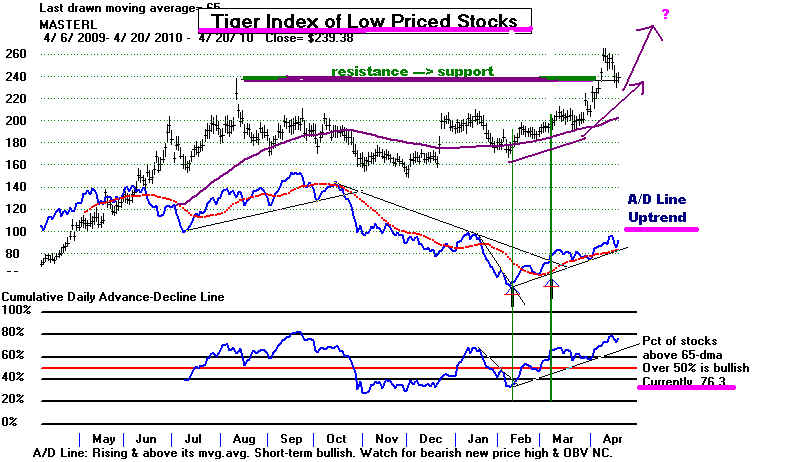
High Accumulation Low Priced Breakouts
IGTE below shows lengthy positive (blue) Accumulation.
These are closer to
our ideal stocks. They can
usually be profitably bought on confirmed breakouts, successful
tests of their rising day ma, where the
Closing Power downtrend has ended. In some
cases, there are no tests of the 65-day
ma for a year. This drives the shorts and sellers
crazy and makes each new minor high a Buy
where there are high levels of Accumulation
and the CLosing Power is rising. LBY
below shows this.
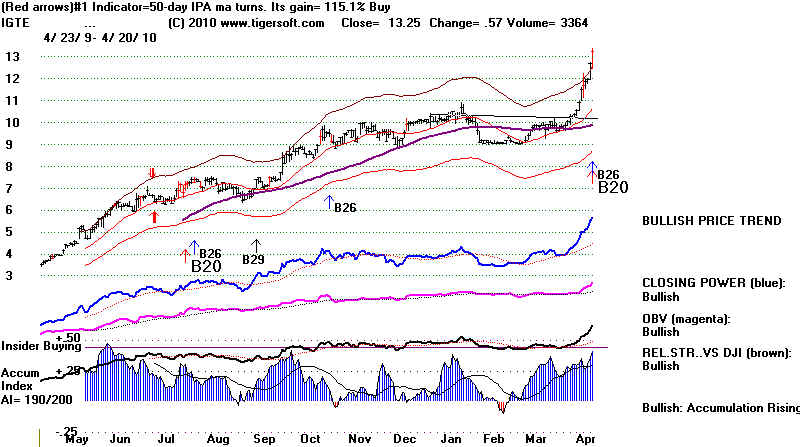
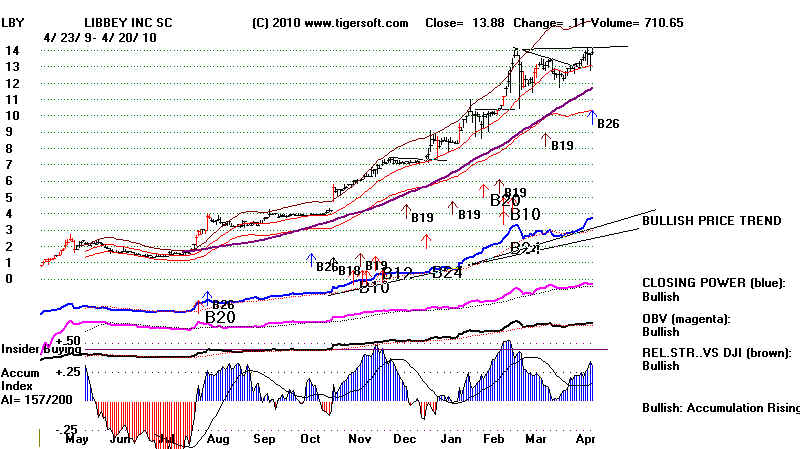
NEW BREAKOUTS
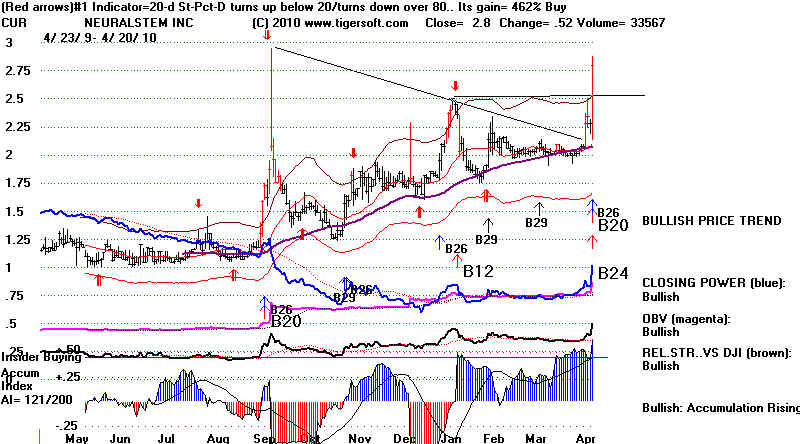
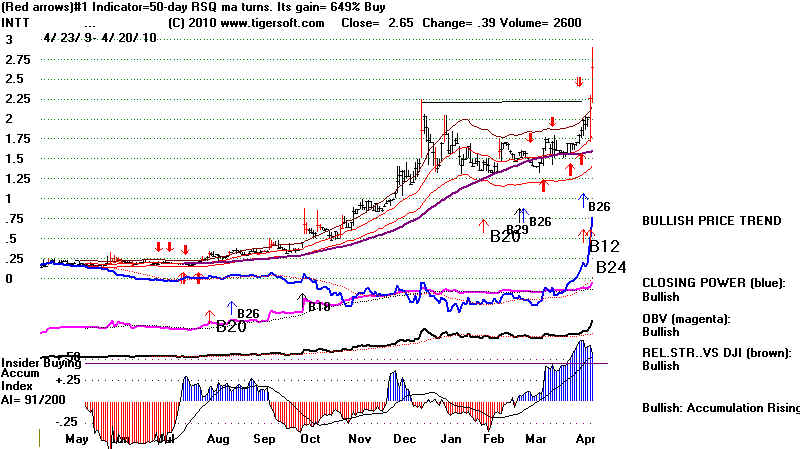
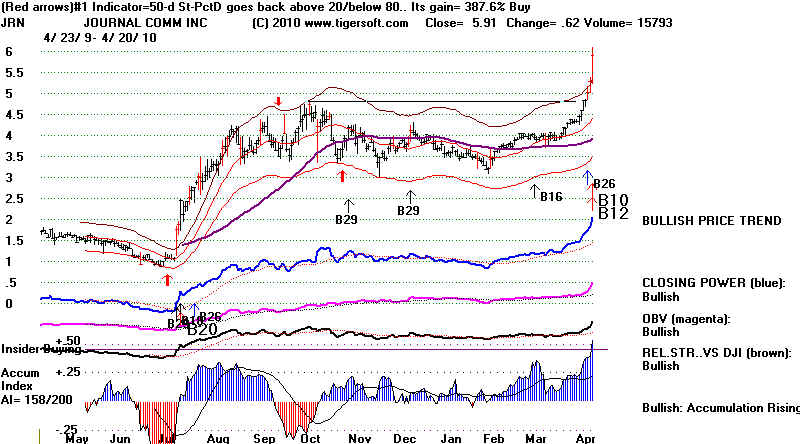
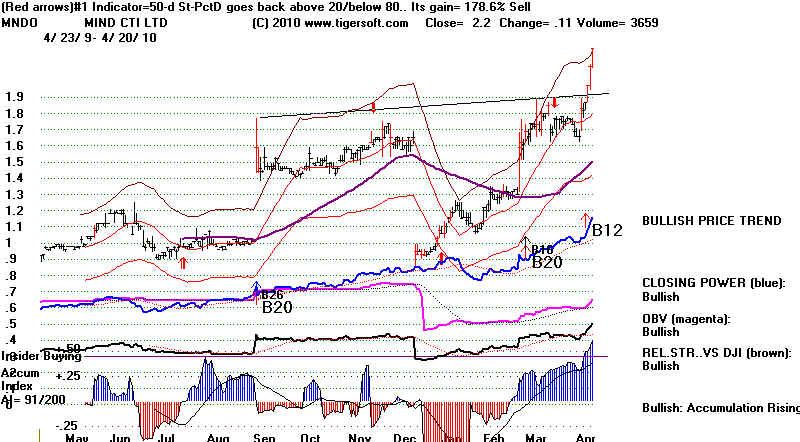
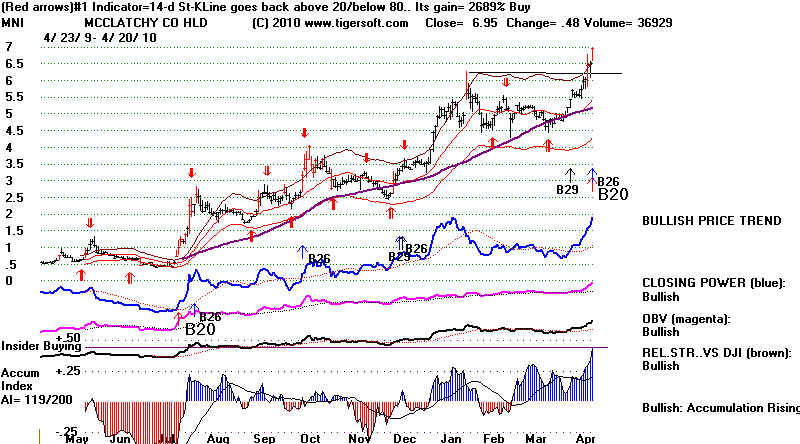

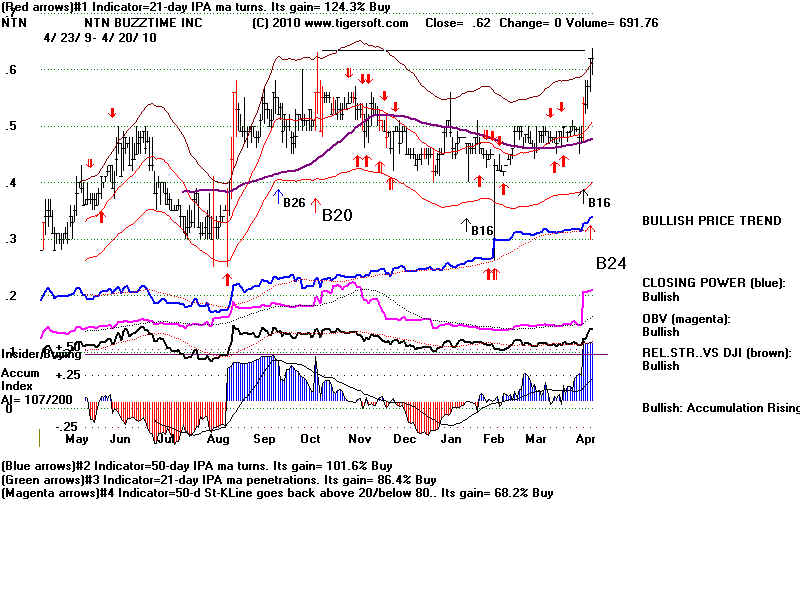
===================================================================================
===================================================================================
4/19/2010
NO Peerless Sell. Peerless Remains on A Buy. DJIA Reversal
Upwards.
Opening Powers have weakened appreciably. The 21-day-roc (momentum) is not
sufficiently high to suggest chasing. Last week's highs and just above them will
probably act as resistance. If not, and the DJI were to get too far ahead of the
other
indices, a more bearish situation might emerge.
While
the ETFs' Closing Powers rebounded, there were more down than up on NYSE.
the
Peerless V-Indicator is now negative, showing volume is starting to flow into declining
stocks and the QQQQ and NASDAQ were down for the day. Speculators are taking
profits, it seems. Markets with this much momentum can keep rallying narrowly
for a
while even when there are divergences as now. But without better breadth too few
stocks are
apt
to advance and there will not be enough new highs to be confident that breakouts
will
follow-through. So, I would wait for a pullback to buy more, but hold what we
own.
See in the
NASDAQ chart the resistance line that is not far over-head and the price
uptrendline
that may be violated on a further decline. Such a breakdown should be
a buying
opportunity given all the blue intra-day Accumulation in this chart. These readings
suggets big
buyers are waiting in te wings to buy on weakness.
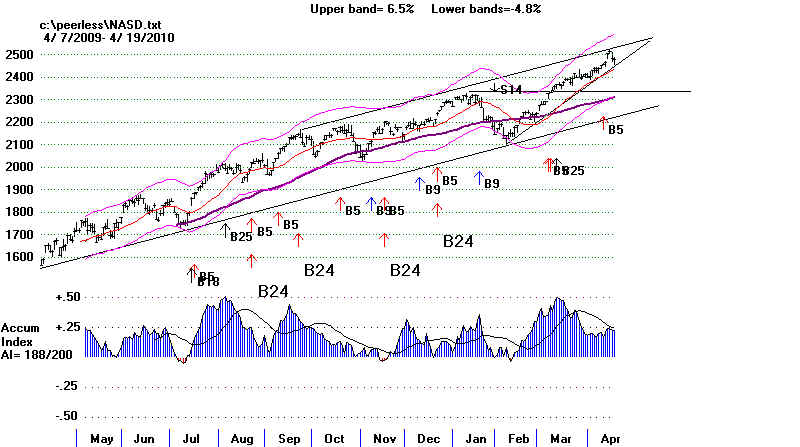
====================================================================================
4/17/2010
NO Peerless Sell. Peerless Remains on A Buy
But the market did reach resistance Thursday. The Goldman fraud "News" and
Volcanic Eruptions may bring some profit-taking and so a 3%-5% decline is
possible and even probable. Expect some Public Selling and a weaker opening.
It is unclear how professionals will react to this. But traders have lots
of profits.
This news is a catalyst to take them quickly. Doing so, especially in stocks
not showing high levels of Accumulation is only prudent. Traders may want to
consider some of the weaker SP-500 stocks for shorting that are breaking their falling
65-da ma with negative Accumulation and falling Closing Power readings.
Many professionals may be quite happy if Goldman is brought down a few pegs.
Most are very dismayed by Goldman's abuses and want them sharply curbed. They
realize Goldman has done every bit as much to hurt Wall Street's reputation as Madoff
has done. Many
insiders wonder out loud why it is that "nobody at Goldman seems to
be
able to make money in any of their public hedge funds, while Goldman's proprietary
trading
desk seemingly never has any losing trades." or, a least, very few losing days.
Specifically, they are are dismayed by Goldman's
1) flagrant and unbridled greed (paying its employees in 2009 an average of $700,000
apiece
in bonuses just a year after receiving a taxpayer bailout of $15 billion in 2008 plus
the $12.9 billion taxpayer paid counter-party handout from AIG.)
2) its flagrant use of insider knowledge, a benefit of having so many of its own people
placed in government (Goldman people in government: CTRFB head, Treasury Secretary's
Chief Assistant)
3) its manipulation of policy makers for its own special advantage (Example: getting
Geithner to agree to give it $12.9 billion of AIG money and also commercial bank status
so that it could use the Fed's Discount window),
4) its special and unseemly access to President Obama, after giving him a million
(more than any other contributor) early in his 2008 Presidential Campaign.
5) its domination of computerized trading to manipulate the market (50%-74%% of all
NYSE-NASDAQ trading in July 2009, the last month the exchange reported such data.)
6) and its common practice of playing both sides of every deal (Example: starting a hedge
fund in 2007 with $10 billion to sell short the very mortgage instruments it was selling
as AAA
rated to retirement funds. Not disclosing that it would benefit from a decline
surely is
another charge that should be brought on GS, and at the men in charge, not underlings
as now)
Goldman fraud is
not news, as readers of my blog understand. What is new is the
government prosecution of Goldman. I suspect that the SEC lawsuit is
window-dressing.
It is a charade to satisfy the public detestation of Goldman. Read the Yahoo GS
message
board, if you doubt this. More will come out about its pattern of fraud. Will
others
on Wall Street be accused of the same thing? Maybe. Will this hurt trust for
Wall Street?
Hardly. How much lower can it go? Actually, the SEC action may help to start
to restore
some confidence that there is a cop back on the Wall Street beat. Most important,
for our purposes,
there is no evidence here that the alliance between Obama, the Fed and Wall Street led by
Goldman is breaking apart. A rising market is need by each for different reasons.
Each partner needs the others too much to breakup the alliance. So, in summary,
the Power Elite still wants higher stock prices and without a Peerless Sell signal,
a dip of 3% will likely be a good opportunity to buy more.
A Retesting of 10500 Is Possible. But There Will Be Lots of Buyers on Weakness.
The TigerSoft volume-based Professional Buying/Selling Power shows trend-breaks
following failures by it to confirm the recent new highs. This is true for the DIA,
SPY and
QQQQ (though its trend-break is very slight). Meanwhile Peerless
remains on a Buy and
the Opening and Closing Powers are still rising.
Bearishly, the steep NYSE A/D Line has broken is uptrend. Such breaks, without
a previous Peerless Sell most often bring drops below the 21-day to a point half-way
between that moving average and the 3.5% lower band. A decline like this of
3% to 5%
is not too unusual without a Peerless Sell, once there has been an A/D Line uptrend-break
and the P-Indicator and Accumulation Indicator fall below the 21-mvg.avgs. of these
indicators.
Here are some examples of what happens when there has been
1) a break in the NYSE A/D Line after a 10% advance which did not occur just after a
major market decline's bottom.
2) the AI and P-Indicator fall below their 21-dma and
3) no Peerless Sell.
In 6 of the 11 casses studied from 1928 to 1974, the DJI fell a point half way to the
lower band from the 21-day ma.
Dec 1934 fell 1/2 way from ma
to lb
Nov 1035 fell to LB and 65-dma
June 1943 fell 1/2 way from
ma to lb
Dec 1945 fell 1/2 way from ma to LB and reversed at 65-dma
July 1947 fell gradually 4% to 1/2 to LB
Nov 1949 fell just below 21-dma and rallied strongly.
Oct 1951 fell 7% just and below 4% lower band
Jan 1955 fell 1/2 way from ma
to LB and rebounded quickly
Jul 1955 fell 1/2 way from ma to LB and quickly recovered.
March 1961 fell to ma
June 1963 fell 1/2 way from
ma to LB
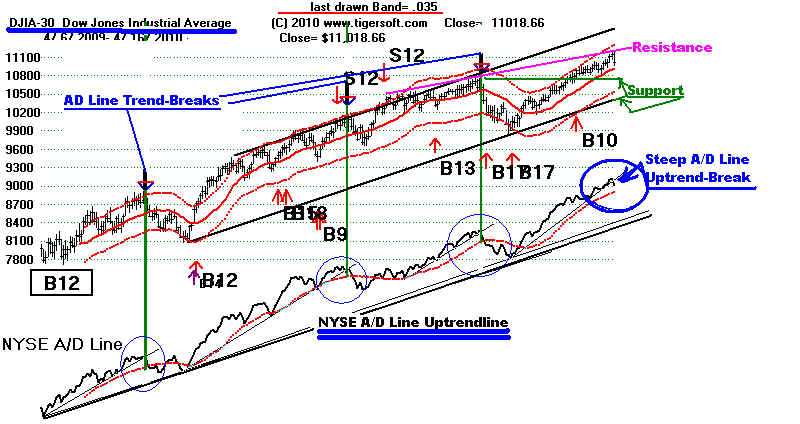

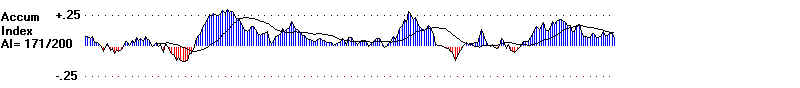
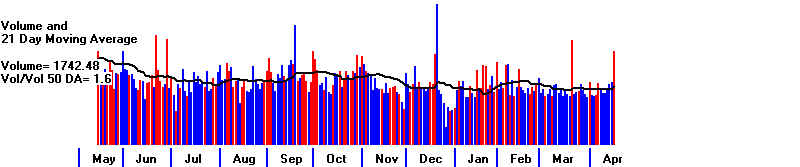
DIA - Both Opening and CLosing Power Are Still
Rising.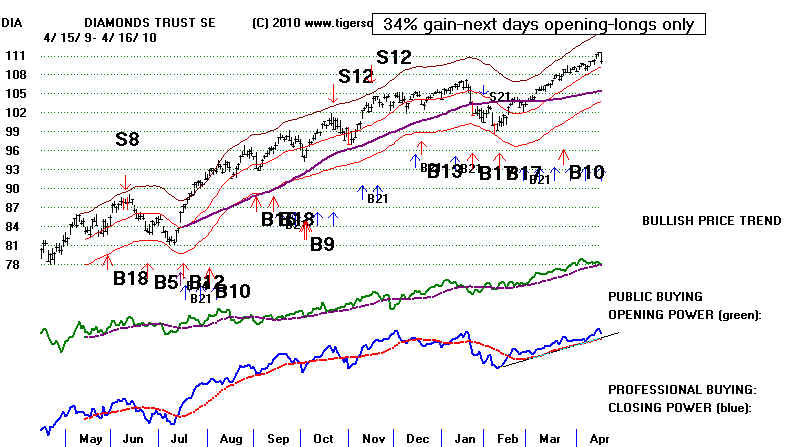
SPY - SELL
- Professional BUY/SELL Power Uptrend Break after NC of NH
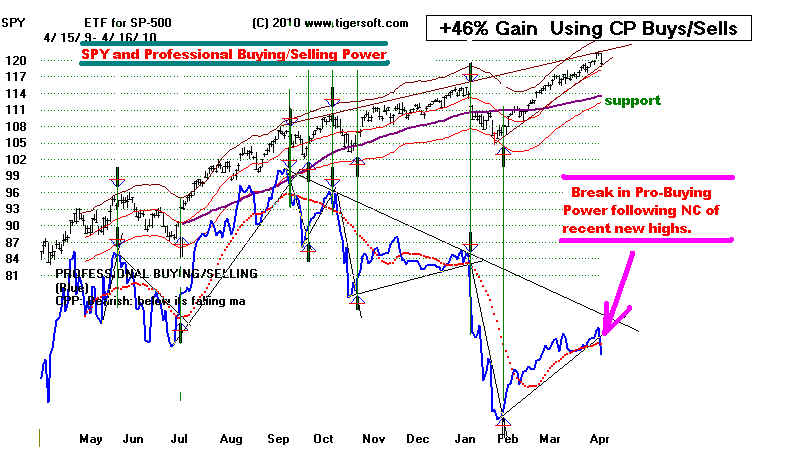
QQQQ
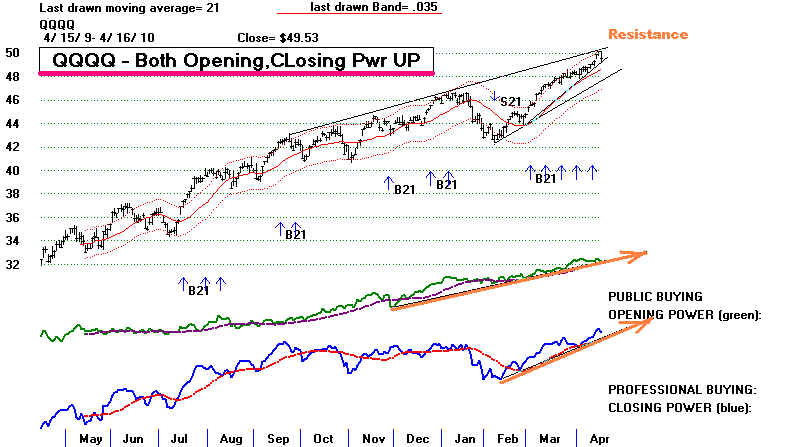
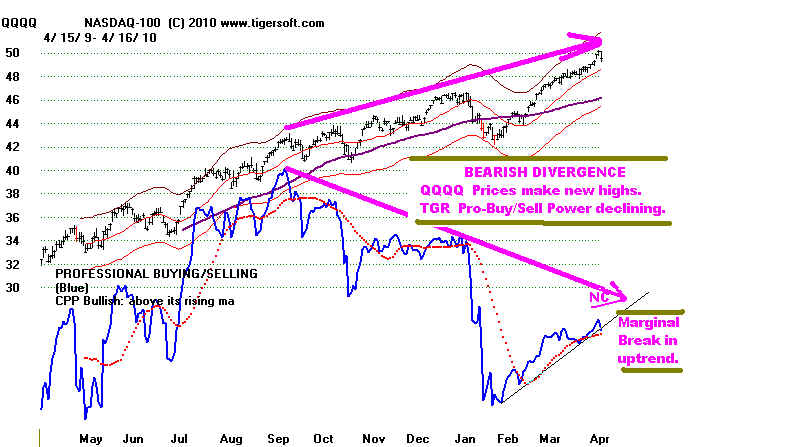
Important Notice: Redistribution of any text
or concepts here is a violation of copyright laws. This is valuable intellectual
property.
All violators will be subject to legal action. Please visit www.tigersoft.com Goggle TigerSoft and a technical subject, to get
additional examples and a further discussion of concepts and terms used here.
See also our Books for sale. .
(C) 2010 William Schmidt, Ph.D.
-------------------------------------------------------------------------------------------------------------------------------------------------------
5-day DJI Chart - 4/18/2010 Breakout Advance.
Daily NYSE 47 New Highs - NYSE 9 New Lows
No longer bullish.
Daily NASDAQ 59 new highs -
NASDAQ 5 new lows. Bullish.
So long as the ratio of new highs to
new lows is 10:1, it's hard to predict a significant
decline. New lows exceeding new highs within 4 days of making a new DJI high,
on the other hand is very bearish.
===================================================================================
===================================================================================
HOTLINE -
4/15/2010 Peerless Remains on A Buy.
With Peerless still on a Buy, the A/D Lines still rising for nearly all the important
groups
we look at and the Closing Power for the DIA, SPY and QQQQ each still in an uptrend,
I think we have to continue to let the market run. Admittedly, the quality of some
of
stocks rallying leaves something to be diesired. But "cats and dogs"
rallies can last 12
months, and also continue for a few months after the DJI has topped out. That gives
another 2-6 months, maybe more, to play them. See this uptrending A/D Line below.
Our universe here is the data base LOWPRICE.exe on TigerSoft's data page. When
this A/D Line is broken, we will will have to start to back off them quickly.
For now,
their A/D Line uptrend line is intact.
WATCH LOWPRICE STOCKS' A/D LINE
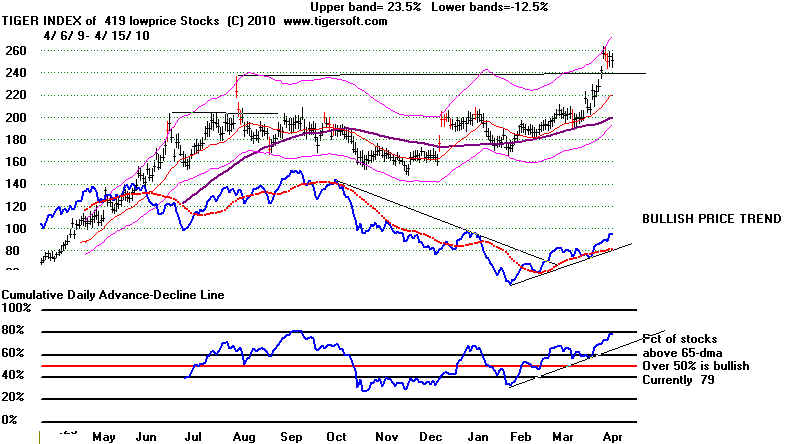
The market's momentum here has taken on a life of its own, I think. Folks that have
missed the rally are waiting for pull-backs to buy. I think the DC-Wall Street Power
Elite
that believes that a bull market will bring about an economic recovery and eventual
full employment will be proven wrong this time. But that misses the point.
They are
clearly in contrrol now. They believe that this highly Fed pumped-up,
program-trading-manipulated
market is their best and only real choice, given their self-interested vantantge point
that
most jobs not created by the private sector are illegitimate. Given their control
and
determination, higher prices probably lie ahead, until somethng unexpected occurs.
Before a big drop, of more than 8%, in the DJIA, there will probably be much bigger
breadth and Accumulation Index divergences than the small ones seen now.
High Long-Term Accumulation Stocks
In this environment, it usually works to buy the very, very highest Accumulation Index
stocks
and give them every chance to show why they are being heavily bought by insiders and
professionals. The TigerSoft Index chart of them here shows their performance
for the past
year. Many of the 15 stocks that comprise this index should go much higher, and
probably with
only minor pull-backs as the high Accumulation index readings. Such high AI/200
values,
pver 195, usually show that big buyers are in the wings in these stocks who are ready to
support them on most pullbacks. Here
are the highest AI/200 stocks' charts. They are
ARTC, IGTE, OGE, ATRM, DFT, EPAY, FOSL, G, LCUT, MSPD, QPSA, SOG, SMCI,
BITS and VRX.
Tiger Index of Highest Long-Term Accumulation Stocks
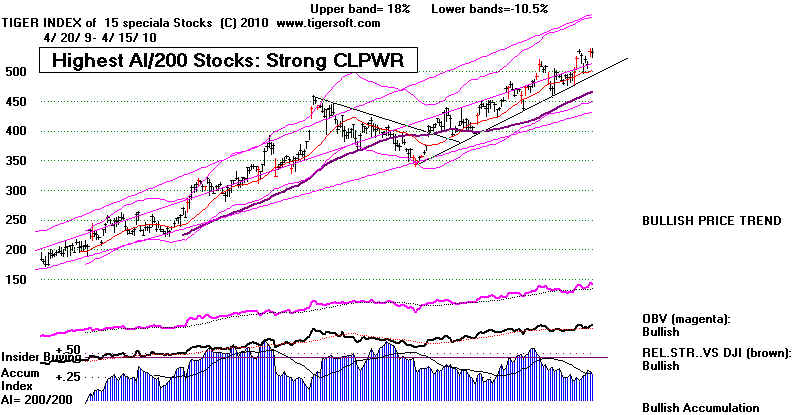
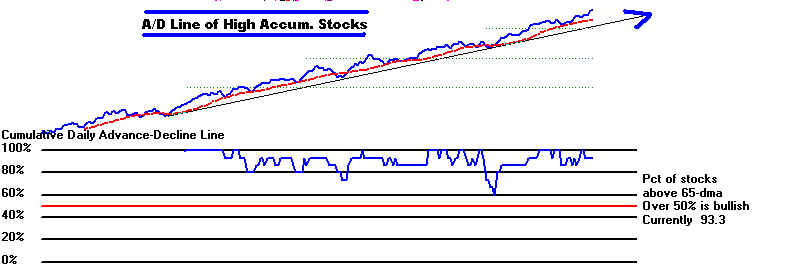
WHEN TO SELL
That does not mean you won't want to sell over-extended stocks (and there are a lot of
them) that:
(1) are very over-extended that break their CLosing Power uptrennds,
(2) that then drop their Accumulation Index below their 21-day ma or
(3) show negative Accumulation,
(4) make false breakouts,
(5) form head and shoulders tops with weak Accumulation on the right shoulder,
(6) drop below their 65-day ma with negative Accumulation and/or
(7) have their 65-day ma turn down.
I show tonight these rules applied to
Chinese stocks this past year. Chinese stocks are
wild and speculative. We watch them also because Chinese money is a force in its own
right now and a breaking of the Chinese Stocks' recovery's uptrend-line may spill over
and affect the US markets and others. Presently, despite the spectacular rise of
BIDU,
the Tiger Index of Chinese Stocks seems to have topped out and shows a declining
A/D Line.
Tiger Index of Chinese Stocks
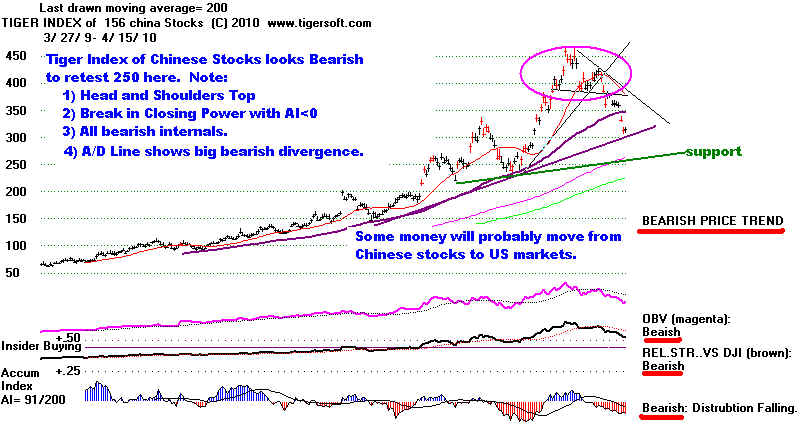
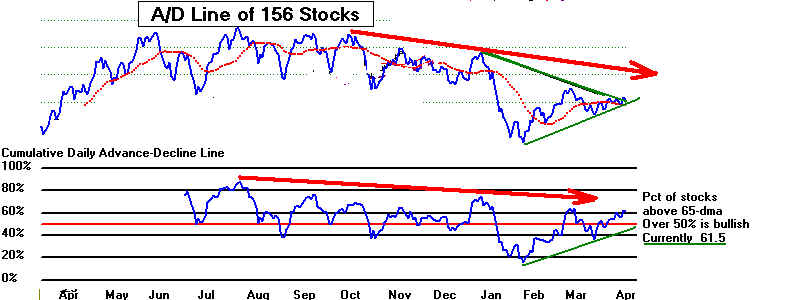
|====================================================================================
HOTLINE -
4/14/2010 Peerless Remains on A Buy.
(Summary:) There is no easy way to get aboard a speeding train.
But you should
be in this market. Even just buying SPY is probably a good idea. You can
always sell
when Peerless gives a Sell or trade it with Tiger's Closing Power. LCUT is
clearly the best stock we can find now. Buy a little and more on a 10% decline,
and hold
until there is a Peerless Sell.
Wall Street is clearly happy that window-dressing regulations and changes will be
instituted by the Obama Administration and the Democrats who do control Congress,
despite filibuster threats...
There is no indication that Glass-Steagall will be restored or that there will be a
windfall
profits tax on Wall Street executives. Pay limitations for Wall Street executives is
going nowhere. Higher taxes on mechanical high-frequency trading is not even
mentioned.
No one challenges Rubin (of Citigroup) and Killinger (of WAMU) when they deny that
they knew they had helped created a bubble back in 2006 and 2007, by mentioning the
fact that they sold out their shares at the top.
.
Nothing is being done to take away Goldman's privileges at the Federal Reserve
even though it uses the money for speculation not for commercial banking. This
should come as no surprise to our readers. In return, GS has apparently agreed
to help rig higher and higher stock prices. GS rose 5.67 today and is with 6 points
of reaching its September 2009 highs. Go to the Yahoo Message board for GS.
Look at the number of complainers that talk about how manipulated the marke is.
They would do better understanding the power of the Power Elite that are making this
happen. Who is going to successfully challenge a triumvirate made up of the
President,
the Federal Reserve and Goldman-JPM? Not even George Soros?
Wall Street is on its best behavior. The parallels are close to 1988-1989.
In October 1987 Wall Street's out-of-control computerized trading brought on a 33%
plunge in 3 weeks. It was all artificial. 1988 rose steadily. 1989 saw a
steep 9 month
advance. This parallel would suggest we have just gone through the 12 months of
a steady rise, now it is time for a take-off, an acceleration upwards. Compare the
levels
of Tiger's Accumulation Index in 1989 with it levels now. The present rally shows
a market under even more Accumulation and a market presumably in even tighter
strong hands. More of the time, the Accumulation Index has recently been above +.25
than in 1988-1989
Compare
the Level of Accumulation in early 1989 with That Today
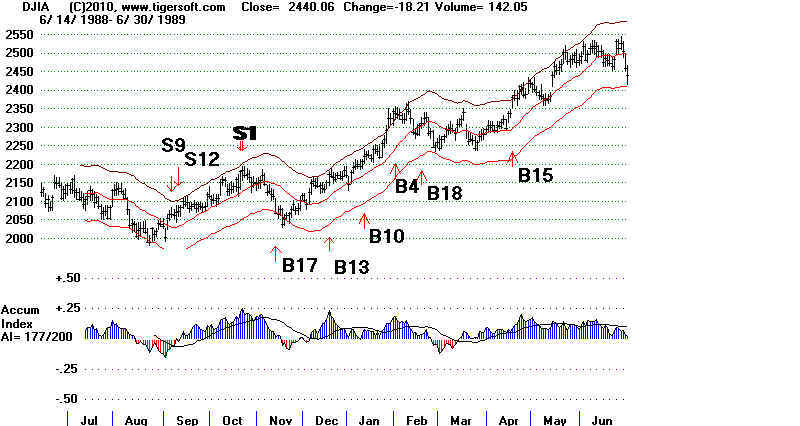
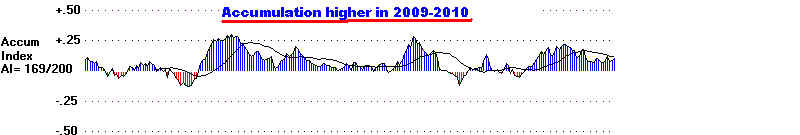
So, far, so good. The Tiger breadth, Accumulation and Public-vs-Professional
buying indicators each support this view. Before a significant decline is likely,
there should be a divergence between prices and these indicators. There is none.
Lots of folks have missed this speeding train. Most will wait for a dip to buy.
That could easily be at still higher prices in a month, the way the current action looks.
WHAT TO DO? IS IT TOO LATE TO GET ABOARD THIS SPEEDING TRAIN?
Hard to say. Buy SPY and use Peerless.... The track record since 1993
is solid.
Peerless Buys/Sells +30% Annualized
Return on SPY since 1993.
Buying the highest Accumulation stocks with high Accumulation levels for the last
two months also seems a good way to go. We are looking for stocks with an AI/200 score
above 150, an IP21 level above .45 (insider buying) and both Opening and
Professional-CLosing
Power rising. They should not have recently jumped up big in one day on news.
Here are
some ideas. "Gain-(P-L)" shows the gains trading on the long side only
using the Peerless
Buys and Sells. LCUT is still my favorite.
AI/200 IP21 GAIN(P-L)
Comments
------------ --------
-------------------------------------------------------------------------
BRE
150 .47
+55% Superb- above
yearly resistance lines.
FXO
160 .45
+51%
Closing Power is not making 12 mo highs
G
17.99 198 .54
+39% Looks good - slow
moving, though.
INZ 21.96 150
.53
+28% Closing
Power is not making 12 mo highs
LCUT 13.76 200
.55 +276%
Superb Running
wildly up.
http://www.lifetimebrands.com 30 is all-time high,
MUI 14.24 173
.59. +20%
Slow moving.
Blackrock Muni
SCI 9.61
156
.49 +106% Superb. Polite - declines are
all shallow.
45 is all-time high
A dying business - Service
Corporation International provides
deathcare products and services in the United States, Canada, and
Germany. Its funeral service and cemetery operations consist of
funeral service locations, cemeteries, funeral service/cemetery combination
locations, crematoria, and related businesses.
SDY 50.54 179
.62 +40%
Superb
VOE 50.88 184
.46 +59%
Superb Vanguard
Mid-Cap Value 62-ATH
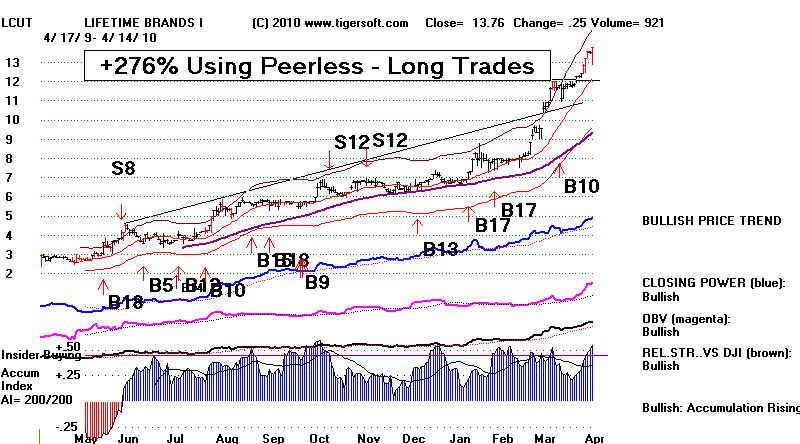
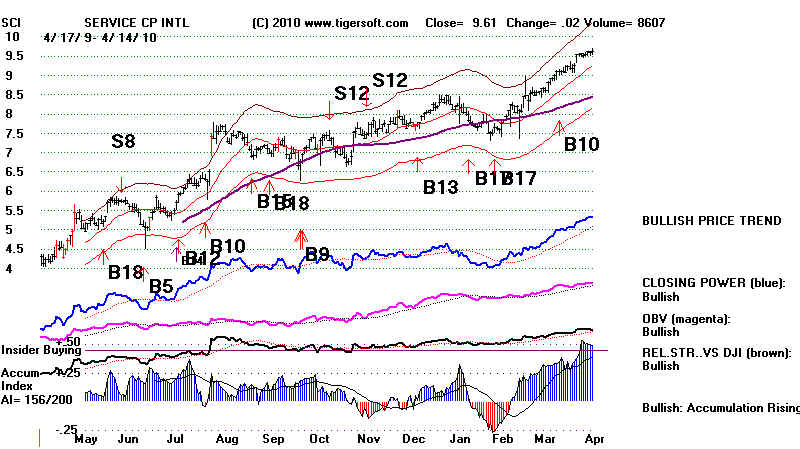
=================================================================================
=================================================================================
HOTLINE -
4/13/2010 Peerless Remains on A Buy.
The DJI refused to sell off. Down stock volume was bearishly above up-stock volume.
As the April 15th tax deadline approaches, I'm surprised there is not more selling and
profit-taking. The DJI, the NASDAQ and the SP-500 are at all at their upper
channel resistance-lines. So, it is not clear which
stocks will power these averages higher.
Intel reported "knock out" earnings after the close. That will boost tech
stocks tomorrow,
especially in the QQQQ. But it will take more. And it's not clear where
that will come
from. Financials turned down, as Obama politely asked the Senate now to water-down
the financial reform bill too much.
A further rally woithout a pullback seems hard to expect. I say this having looked
also "
at the high accumulation breakouts, most of which look extended. Interest-rate
plays among
bond funds are the exception. But ddefensive money goes into them. Note: if there is
a
retreat, it will very likely be shallow. The NYSE A/D Line and ETFs' CLosing Power
Lines
are all uptrending still.
No New Stocks Qualify as Explosive Super Stocks" Buys Tonight.
128 stocks qualified today as making high IP21 new new highs (above +.25).
These are the stocks on our data page in the NHCONF file.
18 of these had IP21s (current levels of Accumulation) over +.45 and
9 of these were in the vertically-up, bullish environment where both Opening
and Closing Power are rising. Late in an advance I would want the Tiger
AI//200 to be above 170, even 175 for new buys. A high A/I 200 shows
high levels of longer term accumulation. This means if the stock were to decline,
it is more apt toquickly find buyers. That there are not more stocks that meet
these qualifying conditions should make us pause and just watch now.
IP21 OpnPwer:ClosPwer
ATSG 5.04 .48
UU
ATSG has already advanced from 2 to 6 since mid March.
CECE 5.44 .49
UU
CECE had already risen from 3.75 to 5.5 since mid March
DLN 43.5 .51
UU DLN shows a lagging CLosing Power.
DSWL 5.31 .56
UU
DSWL made a new by exceeding 5. AI/200 =only 129
FRM 5.4 .46
DU
DSWL made a new by exceeding 5. AI/200 =only 92
FUN 14.37 .48
DU
AI/200=139
GCS 8.91 .50
?U
AI/200=105
HRP 8.2 .47
DU
AI/200=132
IAH 63.29 .47
DU
AI/200=121
INZ 21.85 .46
UU
AI/200=150 ING GROEP PERP DE very thin.
lagging CLosing Power.
BULLISH JOF
9.46 .56
UU
AI/200=163 But breakout was at 8.5 So, over-extended.
Japanese PTC fund.
JOSB 60.74 .64
UU
AI/200=134. JOS. A BANK.
NPSP 5.46 .46
DU
AI/200=90. Lagging CLosing Power.
NSR 26.6 .51
DU
AI/200=143. 25 was recent resistance
SDY 50.2 .61
DU
AI.200=178 SPDR S&P Div.
TPGI 4.02 .46
DU
AI/200=137
VRS 4.64 .45
U!U AI/200=134 High Volume breakout at 4.
WEDC 43.43 .58
UU
AI/200=126 Already up from 5 to 7 in one day a week ago.
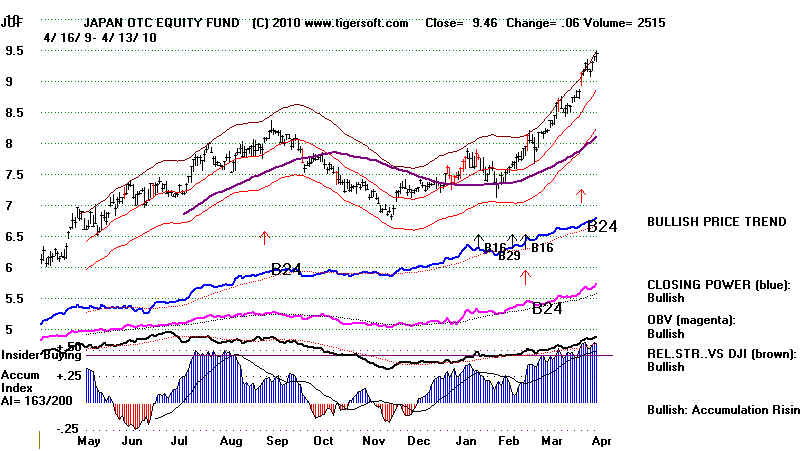
Watch CTSH in the QQQQ and INTC in the DJI, QQQQ and SPY.
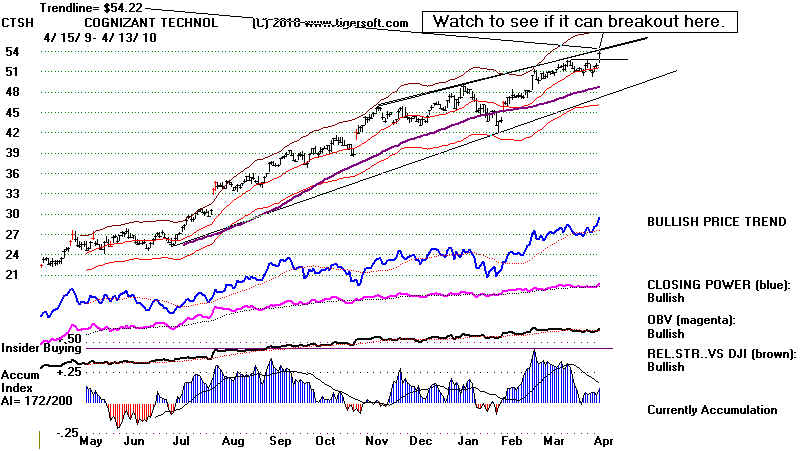
==================================================================================
HOTLINE -
4/12/2010 Peerless Remains on A Buy.
Gold's Internal Strength Is A Warning That The Rally in Stocks Will
Be Limited.
Stay long is our recommendation. Since 1965, the DJI has risen 73% of the time
in the week following April 12th. In fact, the DJI rallied 63% of the time in the
month after April 12th.
Volume was low, as usual. But the move past 11000 showed good breadth and the
internals have not slipped so much down from their previous highs to make a decline back
to
the lower band a high probability. The Closing Power uptrends are still
rising.
I
went through about 250 of the SP-500 stocks to see if there are any head and shoulders
patterns among their charts. There were none, except AA's. Oil, retail and
financial
stocks, particularly, are quite strong.
By my
thesis, the strength in the bank stocks is intentional on the part of the Fed and the
Obama
Administration. Sadly, the Power Elite finds it impossible to help their banker
friends and
also
create Main Street jobs directly. That is a contradiction that only they seem to
still
deny.
They must gamble that the rising stock market will give the rich and the
surviving middle class enough extra money to boost consumer demand. But will what
extra
they
buy really be made in America?
Gold, Bankers and Stocks
The
Power Elite's role now in propping up the Dollar would be nice to get data on.
They
do seem now to prefer a strong Dollar, which especially helps the big US banks
to
keep and attract deposits. My guess is that the Fed-Administration-Banker
triumvirate
are
probably shorting Gold to discourage a run upwards in it. Again no information is
available. A Goldman man runs the Commodities regulatory agency. He will not
permit
big
short sale positions to be disclosed publicly. Only big long positions must be
revealed.
How
long will the FED-ADM team succeed in holding down Gold? Look at all the
Accumulation in
the
perpetual contract for Gold (GO1620). (I believe the futures market in Gold is more
important and a better predictor than GLD. It seems likely that GLD represents
public
buying or selling, while the trading in Gold futures is done by big profesionals. )
I
keep remembering how from 1977 to 1980 when Democrats took over from Republicans
and
unemployment was very high, Gold quintupled even as the Fed raised rates steeply.
But
there are other President-Democrats. FDR ended all speculation in Gold. But,
Obama is
not
only no FDR, he is also no Carter. I think he is trying to be more like Clinton.
In
financial matters, Clinton took financial marching orders from Greenspan, Rubin and
Summers,
all
representatives of Wall Street. Under Clinton, Gold first rose from 330 to 420 and
held there
until
1996. Then it began a long slide downward to 250 in late 1999, as stocks became
a
much better investment. If stocks were presently at the start of a 5
year advance,
as in
1995, Gold would be in a decline or showing red Distribution from TigerSoft.
That
it now shows so much Accumulation, suggests that Wall Street's efforts to rekindle
a
long bull market will probably not be successful.
GOLD IS NOW UNDER HEAVY ACCUMULATION
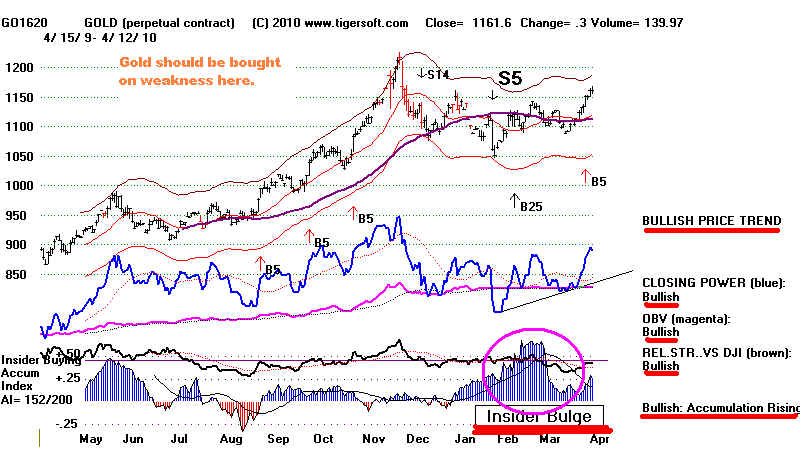
If
Gold were about to go into a long decline -thereby showing stocks would rally much
further - one would think it
would show heavy red distribution, as it did in 1996 when it
was starting a four year
decline.
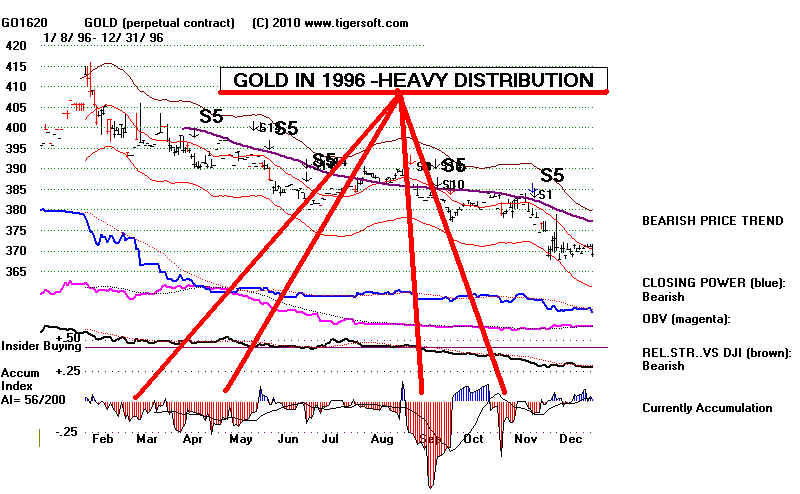
STOCKS
Generally,
it is best to focus on high AI/200 stocks with the market up nearly 6%
since the
first of the year. Then look for high current Accumulation (IP21) and rising
Cloning
Powers.
Group:
Stocks with Bullish Internals
========
=============================
SP-500 - D -
41.18 (AI/200=188, IP21>.25 )
NASD-100 LNCR - 47.18
(AI/200=178, IP21>.25)
FAST - 51.90 (AI/200=140. IP21>.25)
NHCONF LCUT -
13.54 (AI/200=200. IP21>.48)
VOE - 50.23 (AI/200=184, IP21=.43
PHT - 16.44 (AI/200=199, IP21=.26
LNCR - 47.18 (AI/200=178, IP21=.32)
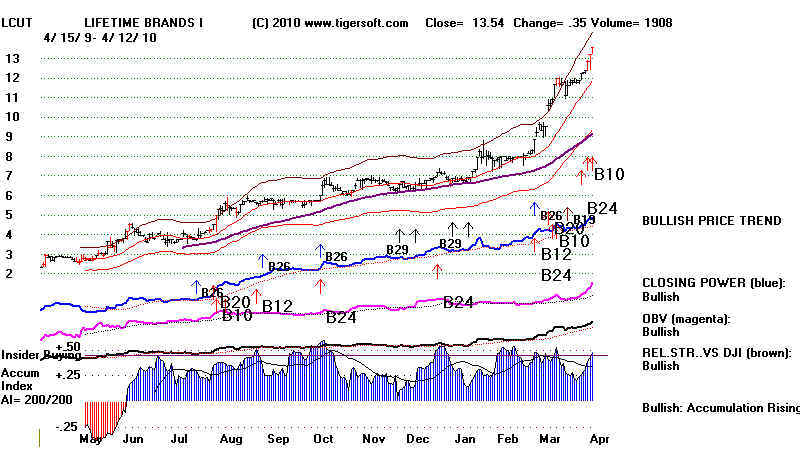
AIG - Turnaround
Look at AIG's chart below. You can see how important the 65-dma was and how the
Closing Power's trendbreaks have timed the stock's turns superbly. The AI/200
has
been very negative for a year. Eventually, the stock will decline. At least,
the
is
usually true with stocks showing so much red Distribution.
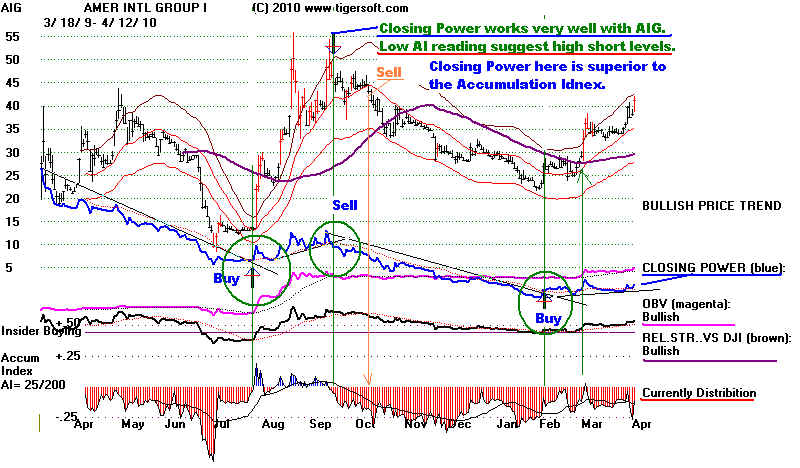
==================================================================================
==================================================================================
HOTLINE -
4/9/2010 Peerless Remains on A Buy.
The 10,000 Barrier Almost Overcome
The DJI is
challenging the 11000 psychological resistance. This actually seems to be
the top of
the resistance zone that crumbled in 2008 when Paulson demanded $800,000,000
for his
Wall Street buddies, "or else". The shock of that collapsed the market
below
the
attempted 10600-11000 support. As we all know, broken support becomes resistance.
It is that
resistance which the DJI has been eating up for the last few months. It seems
that now
the resistance may be nearly all eaten up. This is difficult to assess, admittedly,
and volume
has been low. Nevertheless, it now looks like the DJI is close finally to surpass
the
rest of the
10600-11000 resistance. With Peerless on a Buy and the NYSE A/D and CLosing Power
Lines still
uptrending, we have to remain bullish. I think I am correct that the Power Elite
wants,
almost desperately, for the rally to continue. The alternative, with unemployment
still so
high, is too grim. 4/8/2010 12000 or Bust. The
Power Elite's Biggest Gamble of All"
2008: DJIA's -10600-11000 Resistance Has Been A Barrier to DJI's Advance in 2010.
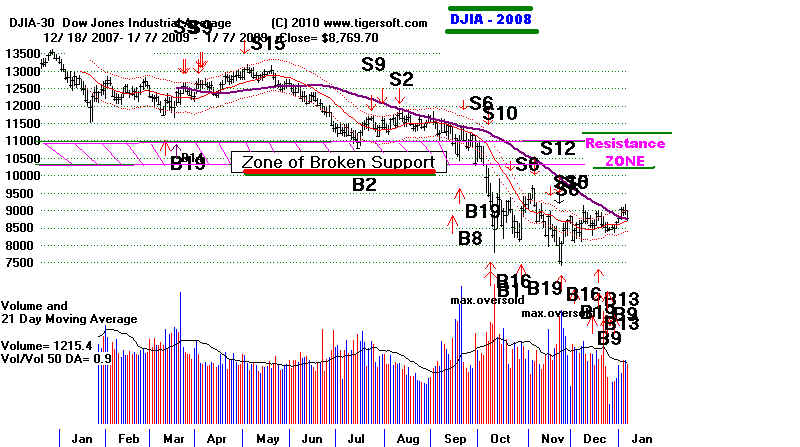
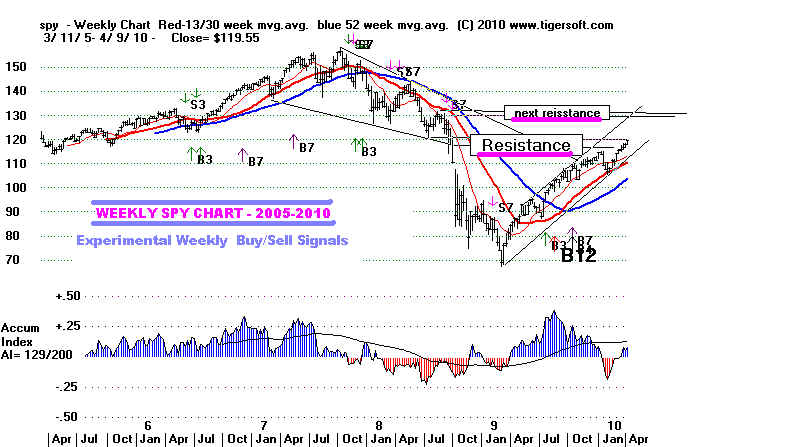
I think that the operative Peerless Buy signal should be respected. Confidence in
Peerless
grew for me
as I researched this weekend my new study of Peerless and trading SPY.
In
particular, besides great gains on the SPY using Peerless, I noticed that after a
+30% Annualized
Return on SPY since 1993.
big
advance since 1993, when a long trade on the SPY was up more than 8.4%, as now,
the odds
have been good (10 of 16) that SPY will rise still more and achieve a gain of more
than 13%
before the next Sell. In the other 6 cases, the SPY could not rise to a gain
of more
than 11.9%.
That might take the DJI only to 10200. Should this less bullish scenario play
out, it is
still worth noting that only shallow declines followed the next Sell in these 5 cases:
+2.6%,
+0.5%, +4.7%, +4.4%, +5.7%. So, the conclusion I reach is that the odds are
perhaps 60%
that the DJI will keep rising meaningfully. But if there is a Sell signal soon,
only a
shallow decline will follow.
Cases where the SPY Gained more than 8.4% aon a Buy: 1993-2010
2/27/1996 Sell S1 +3.3% decline after earlier +43.7%
rally
4/22/1997 Sell S9 -6.8% rally aftter +13.1% rally
9/18/1997 Sell S12 +2.3% decline after +14.1% rally
4/28/1998 Sell S15 +12.4% decline after +16.4% rally
6/18/1999 Sell S12 +2.8% decline after 36.0% rally.
- 12/28/1999 Sell S9 +2.6% decline after 11.9%
rally - minor additional rally
- 10/10/2001 Sell S9 +0.5% decline after 8.5% rally. - minor additional rally
10/15/2003 Sell S4 -1.3% rally after 17.9% rally.
- 2/11/2004 Sell S15 +4.7% decline after 9.4% rally. - minor additional rally
- 12/28/2004 Sell S8 +4.4% decline after 9.6% rally. -
minor additional rally
5/8/2006 Sell S9 +5.4% decline after +14.4%
rally.
1/5/2007 Sell S4 +2.1% decline after +13.4%
rally.
- 7/17/2007 Sell S9 +5.7% decline after 11.8% rally. - minor additional rally
- 3/27/2009 Sell S5 -4.4% rally decline after a
9.3% rally. - minor additional rally
6/9/2009 Sell S8 +5.6% decline after a +14.6%
rally.
10/21/2009 Sell S12 -1.9% rally after a 20.0% rally.
Current rally is +8.5%/
-------- PEERLESS SIGNALS ON DJIA ---------
4/9/2010 10997 la/21-dma= 1.016
21dma-roc = .474 P=
+323 Pch= 1 IP21= .117 V = 26 Opct
= .426
21dma-roc >.70 shows unusual momentum. A reversal down is
more unusual.
More information on back-testing this soon.
IP21 (Current Accum.) >.25 make it harder for a downwards reversal.
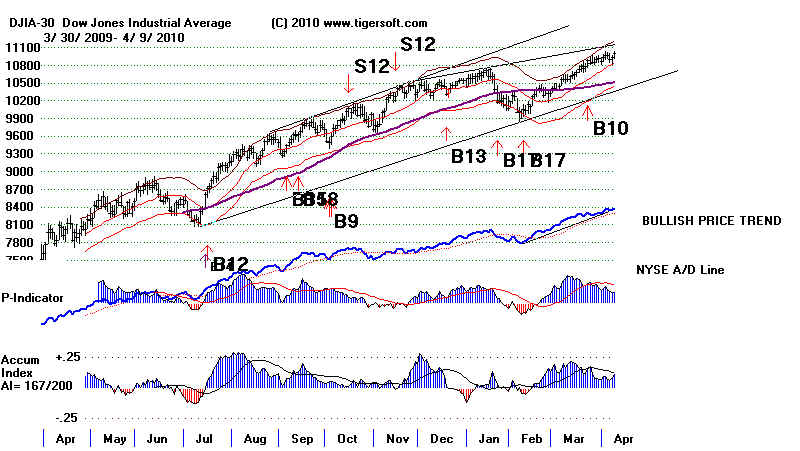
SP-500 - Closing Power is making
a new high.
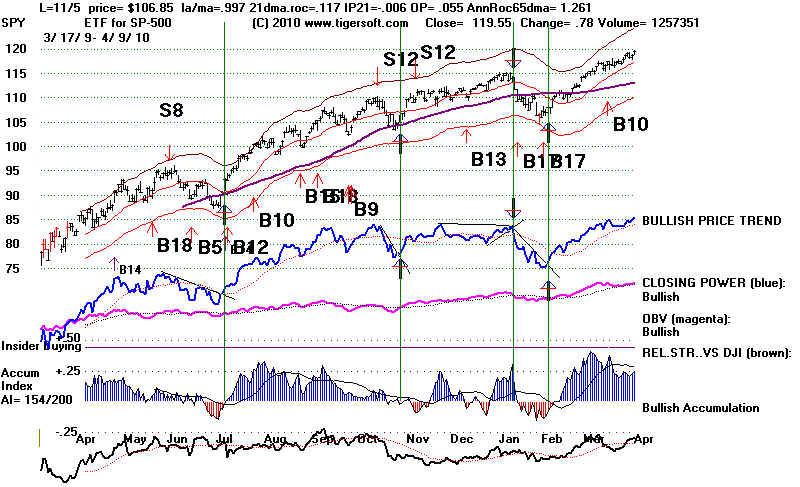
QQQQ - - Closing Power is making a new high.
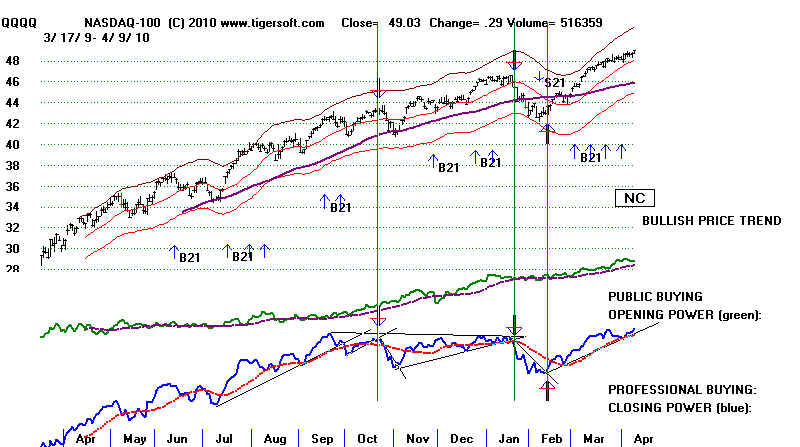
DIA - - Closing Power is making a new
high.
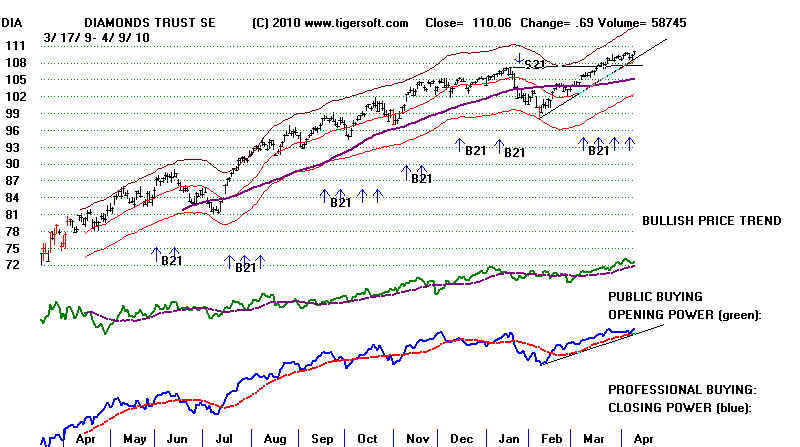
=================================================================================
HOTLINE -
4/8/2010 Peerless Remains on A Buy
The
Triumvirate-Power Elite (the
FED, Obama and Big Wall Street banks) have gambled big
that they can keep the stock market rising. Given
their financial orthodoxy, perspectives
and self interests, they really have no other alternative.
Their control seems unshaken
by the current blue-ribbon panel looking into the causes of
the 2007-2009 Crash and who is
to individually blame. The "Power Elite"
(this is easier to spell!) want to demonstrate that
they are very much in control. One way to do
this was to keep Goldman Sachs rallying.
Another is to turn up the market and move it past the
psychological resistance of 11000.
See - http://www.tigersoftware.com/TigerBlogs/April-9-2010/Index.html
Below are the charts of Goldman,
DIA and QQQQ, No Closing Power sells seem
possible tomorrow, in that it would take a very weak close
after a very strong opening to
break the Closing Power uptrends. 11000 is a good
target to bring in more trading volume.
That is not lost on Wall Street.
.
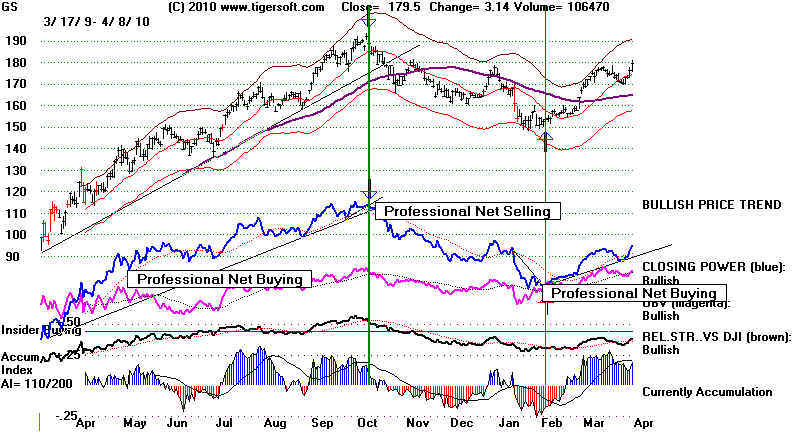
INDIVIDUAL STOCKS
Looking
at the Tiger data base NHCONF and running the bullish screen, it is clear
that insiders and professionals are
still pushing upwards high Accumulation stocks.
Use TigerSoft and view the charts of G, PHT, CHGY, MRT, HYT, RT, VCBI
=================================================================================
HOTLINE - 4/7/2010 Peerless
Remains on A Buy
We still have no new Peerless Sell.
The A/D Line uptrend is intact. Since the Closing Power
for the QQQQ did not confirm the recent
new highs,. we will consider any break in its
uptrendline to be a short-term sell.
Today, I can still find more stocks
that look like they will
rally than fall. But prudence
probably dictates taking some profits in stocks not showing
high or lengthy blue Accumulation.
After all, 11000 is a logical point for intense resistance.
Bearishly, volume keeps rising on
down-days, too. So, our Stocks' Hotline sold advised
selling a few lower AI/200 stocks.
I have argued that what makes this market so
unusual is the amount of MONEY the Fed is
pumping into it. It is as though all the
big players have been provided trillions in capital, as long
as they use the money to buy, not make cheaper
business, home or personal loans. I don't
think this strategy of the Financial-Politcal
Power Elite will change on its own until the
DJI is even higher. As long as the Dollar
does not collapse, the Fed will probably continue
to keep rates very low. A re-valuation
upwards of the Chinese currency might change
this. But for now, the Dollar's Tiger
chart has all "bullish" notations and its Closing
Power is in an uptrend.
Wall Street's failures and excesses were the
subject today of the "FInancial Crisis Inquiry
Commission" http://www.fcic.gov/hearings/ Its chairman
is Phil Angelides, former
California
State Treasurer interbiewed Greenspan and
Rubin. http://www.fcic.gov/reports/
Greenspan
says "I was wrong 30% of the time"?
Ex-Citi
exec says he warned Rubin on mortgage risk
Ex-Citi
executives face questions on mortgages
Such talk, I think, caused the decline
today.
But take heart, the market would
have crashed wide open, if this panel were really about
to do its job. The DJIA would have fallen
500 points is the panel was moving to recommend:
1) a separation of investing and commerecial banks functions into different
insttitutions'
2) the break-up of the too-big-to-fail banks,
3) the imposition of a stiff windfall tax on Wall Street's big bonus executives
in the bail-out firms,
4) a challenge to the Fed's secrecy in the matter of the trillions in bank bailouts and
5) clear refutation of those who would give the Fed even more powers vis-a-vis banks.
I think we can safely bet that there will
be no expose of the secret arrangement between
the Administration, the Fed and Wall
Street Banks, in providing these banks trillions from
taxpayers in return for worthless
toxic debt collateral. There is also very little chance that
anyone will challenge the Federal
Reserve, Greenspan, Bernanke or Bernanke for being
far too chummy with the very
bankers that caused the Crash. I think that I can guarantee
no one on this panel will attack their
central bankers' perspective as being unable to conceive
of economic growth that does not depend
first on Wall Street handouts and a Wall Street
bull market. Lastly, I would bet
that none will attack the central bankers' perspective that
conveniently forgets how dangerously
undemocratic the highly massive and monopolistic
Wall Street banks are as they push around
politicians of both parties with millions and
millions of dollars in what are politely
called "campaign contributions"
That's why Goldman Sachs rose today and
why such talk as was heard today will NOT much
dampen the spirit of the bulls.
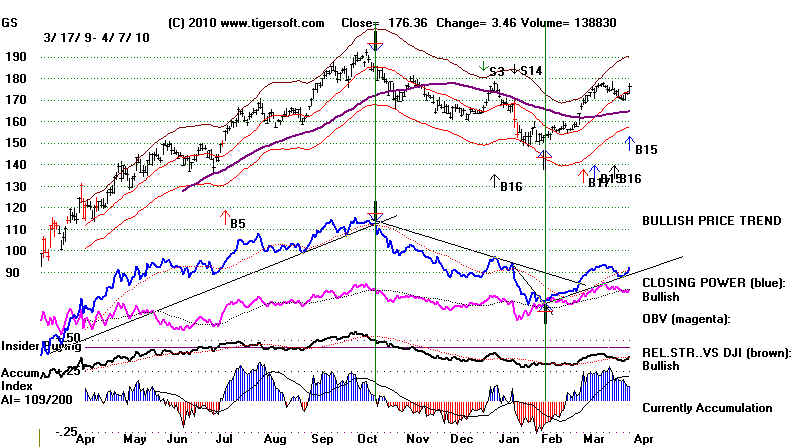
The most
succinct exposition and summation on how Wall Street and the Federal Reserve
are
boosting stocks by risking a bigger bubble than in 2000 for stocks, 2004 for housing and
2008
for oil, is offered today by Dylan Ratigan.
DIA - ETF for DJIA
Closing Power
Uptrend - violated
Bullishly both Opening & CLosing Power are
rising (above their rising 21-dma).
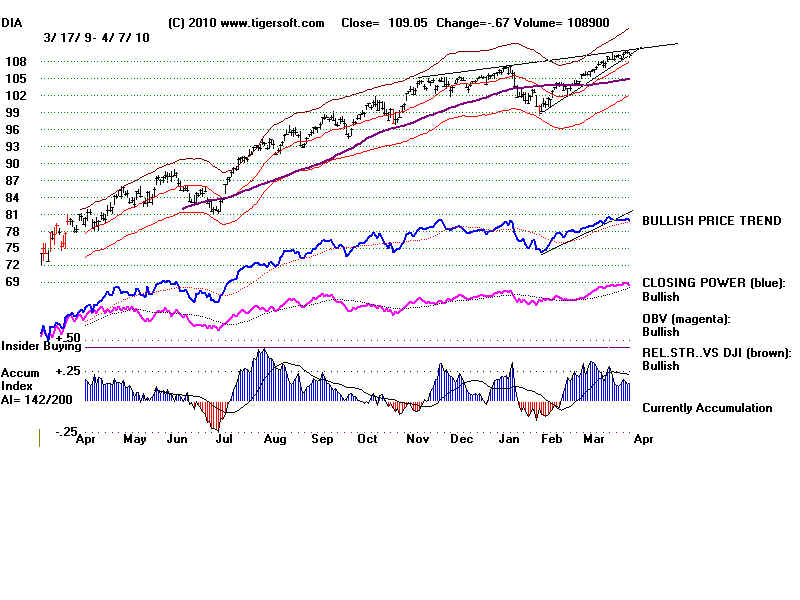
TIGER INDEX OF SP-500 and SPY
Both Opening and Closing
Powers are rising.
This suggests we are in a vertical ascent phase.
Closing Power-Percent - violated its
uptrendline.
The CP
and CPP have not confirmed the recent highs.
87% of the SP-500 stocks are above their 65-dma.
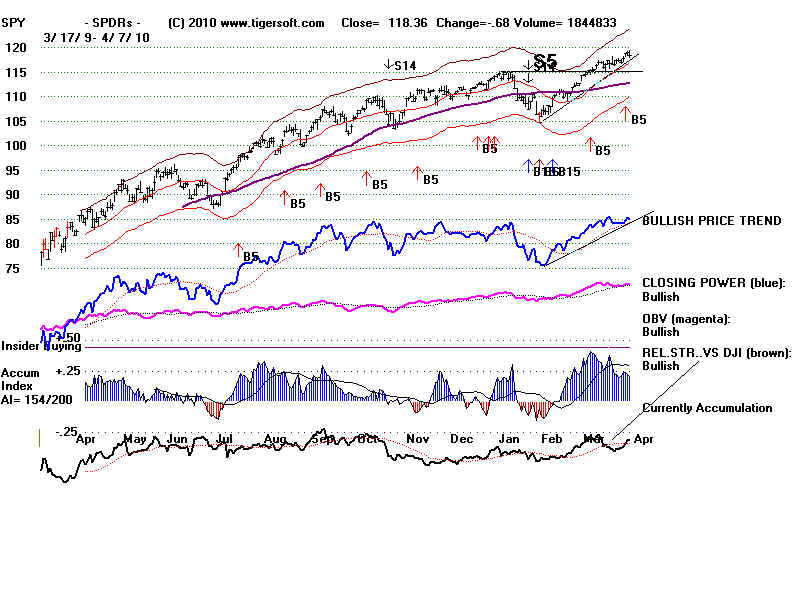
TIGER QQQQ and INDEX OF
NASDAQ-100
QQQQ - All Bullish
Closing Power Percent is not confirming the advance, could easily break its
uptrend-line.
and could be forming a bearish Closing Power head and
shoulders..
86% of the NASDAQ-100 stocks are above their 65-dma.
That uptrend has been slightly violated.
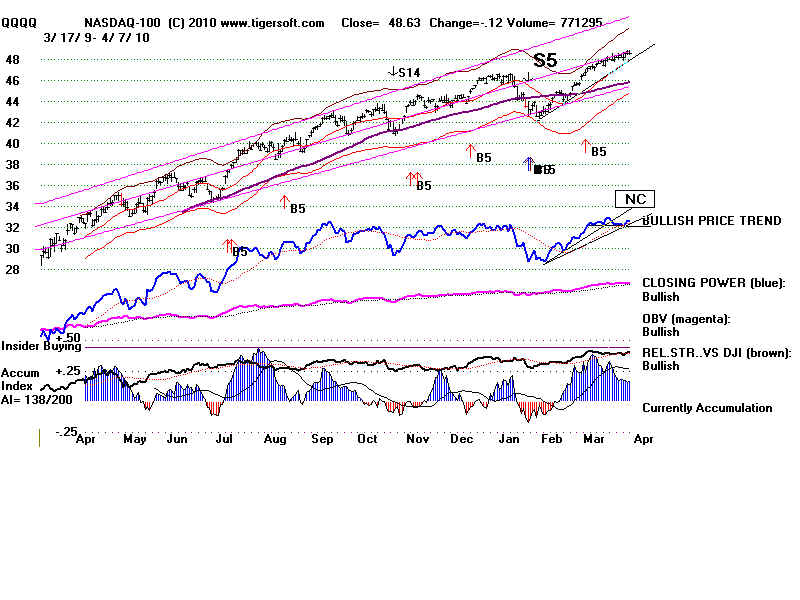
==================================================================================
HOTLINE -
4/6/2010 Peerless Remains Bullish....
11000 on the DJI is the logical place for sellers to concentrate
their sell orders,
if they want to take
profits or get out even. But, we have no signs that there will
be more than a very
shallpw decline, if there is a retreat. In two days, we will have
seen a 13 month rally
from the March 9th, 2009 bottom. Bull markets that last 12 moonths
this long are much more
likely (2:1) to last at least 3 additonal months than suffer
an 8% or more decline.
Breadth remains very bullish. Both Opening and Closing
Power are rising for the
biggest ETFs. Peerless remains on a Buy. There is no indication
that interest rates will be
raised. Interest sensitive stocks are among the best performing
and highest accumulation
groups. Meanwhile, other high accumulation stocks that make new
highs are spectacularly
strong and there are a lot of such stocks. Below is a composite of
more than 200 of them.
"Enjoy the ride". I have to say.
Index of High Accumulation New Highs
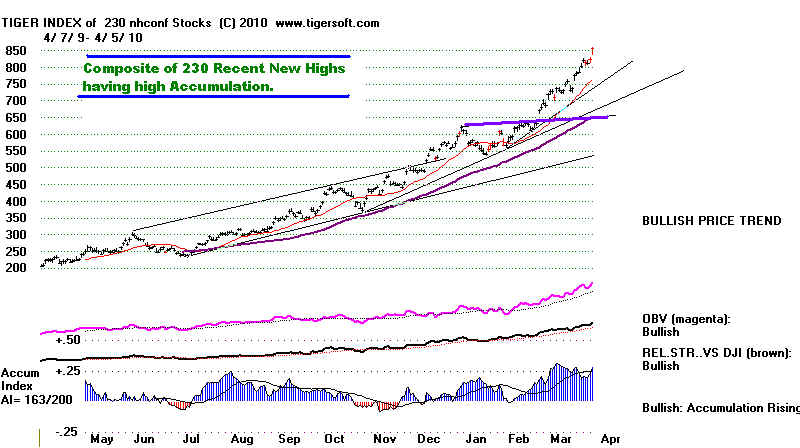
=============================================================================
HOTLINE -
4/5/2010 Peerless Remains on A Buy.
Speculative fervor continues to build.
We have no reason to sell. This is one of those times when we want to let our
profits run. Peerless relies
on automatic signals, derived mostly from
breadth indicators and Tiger's
Accumulation Index. The public is pushing up openings
now. Closings are neutral,
not bearish. Both Openings and Closing Powers are
rising. This shows the market is in
verticle ascent. I would, for now disregard other
normally useful tools, like the
MACD, CCI and RSI, whose non-confirmations of
new highs are sometimes very
premature in vertical ascent markets.
The biggest
mistake the Peerless automatic signals have made since 1981 was showing
premature Sell S8 and S12 Sell signals in
first quarter of 1999. In practice, this was easily
overriden by our Hotline because I
allowed for the special strength of the market at all-time
highs and we could see all the stocks
that showed powerful Accumulation on new highs.
I mention this for three reasons.
First, always be careful about
standing in front of a herd of bulls. Expect execess.
The QQQQ's Closing Power was wrong
for 3 months in early 2000. It was a lot easier
to ride some speculative
"bubble" stocks than resist the trend by going short, or
even sitting ont he sidelines.
Second, always be open to new
ideas. We have unprecedented collusion now between
an inexperienced,
semi-figurehead President, the Federal Reserve and the biggest Wall Street
banks. If they want the
market to go up, accept that it probably will.
Why the stock market keeps going up and up?
The Secret Deal Obama, The Fed and Wall Street Seem To Have
Reached.
I still remember reading in high school Emerson's essay "Self Reliance how a
"foolish consistency
is the hobgoblin of little
minds". (A radical idea for a public high school?). So, regarding the
need to keep an open mind, and not
be a victim of a foolish consistency, I keep checking
the worst of the Peerless signals.
It amounted to standing in front of a herd of bulls.
Today, I discovered something new
about this period from February to May 1999. This
period every four years, in the
year before a Presidential Election year have always been
either neutral or strong since
1927. As it turns out, cancelling Sell S9s in 1935, 1959, 1967
and 1999 during these three months
impoves our model quite a bit. Recalling Emerson,
a new Peerless will do this.
A new "SuperImpose DJIA saved signals" file will be provide
these results. The results
gotten trading the DJIA, SPY and QQQQ with this revised
Peerless since 1994 will be posted
in a few days. The on-line-book will show you these
details later this week.
Thirdly, TigerSoft's
Accumulation Index has never worked better. I say this out of pride
but also because there's a
message in this that we should accept or, at least carefully
consider. I take
it to be very bullish today that we see a large number of high Accumulation
breakouts. The 11000
barrier on the DJIA may not hold the general market back. There
were more than 25 new highs
tonight with recent or current Accumulation bulges over
+.45. See ALL the graphs of these high
Accumulation breakouts here.
In recognition of the proven
power of Accumulation Index bulges past +.45, to signify
key insider buying, the
revised Peerless will henceforth for stocks show a horizontal like
at the +.45 level.
You can see this "insider trading threshold: in the sample breakouts
shown just below.
Charts of high Accumulation new highs: PSMT, G, AGL, PXD and VRX
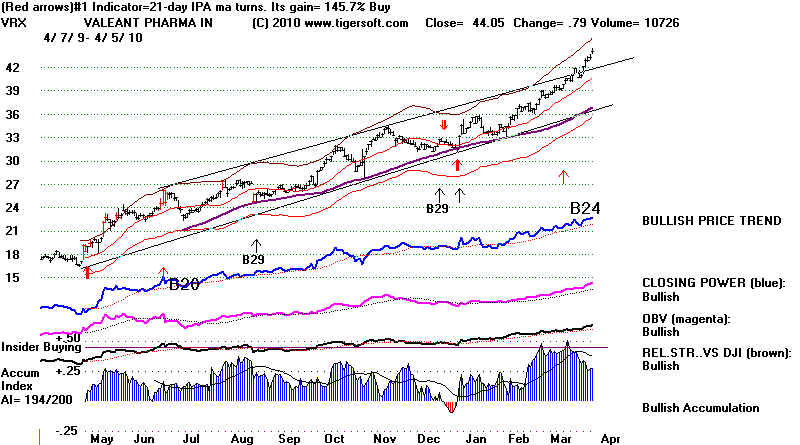 |
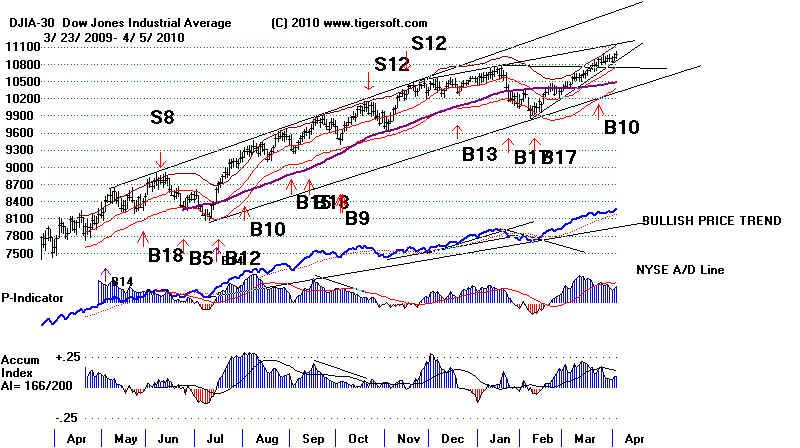
===============================================================================================
HOTLINE - 4/1/2010 Another Good
Day for the Rally. Notice the Rotation
The Nasdaq and
low-priced stocks took a day off, as traders noted the breakout by Crude Oil (below)
and bought the best of the oil stocks. Breakouts like this annul red Sell signals
based on
Stochastics and appreciate the value of trading mainly in
the direction of Peerless. Normally,
we recommend breakouts to be in the strongest stocks.
But at some point these are too
far extended and we should consider buying stocks showing
Buys based on their
crossing back above the 65-day ma with positive
Accumulation. (Gold is moved above
at level, too, today, but shows negative Accumulation.
Not surprisingly, the Dollar fell,
though its CLosing Power is still above its uptrend-line
and so may still recover. XOM
and CVX look like good long trades, as mentioned yesterday.
That will help boost the
DJIA. I looked at lots of stocks tonight and
except for PFE in the DJI, I do not see any
ahowing significant danger of a pullback, i.e. head and
shoulders patterns, negative
non-confirmations of new highs or breaks of their 65-dma.
CRUDE OIL NEW HIGH - TODAY.
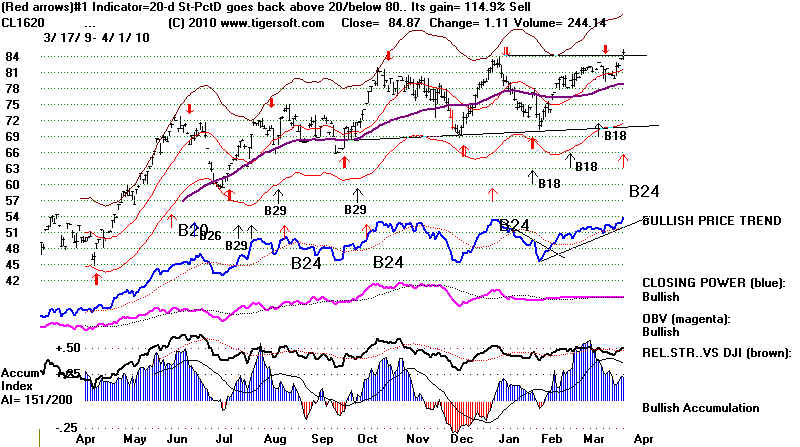
Of
course, in this market traders are still bidding up a number of the high accumulation
breakouts: HUSA, CRME (shown below) and JEF, JOF, VRX and ZQX which met our
"explosive super stocks" breakout
requirements. The new downloads NHCONF and ACCUMVER
should be a great source for these stocks.
Screen for Bullish, BOTHUP, B12, B10 and B20
using ANALYSIS from PEERCOMM.
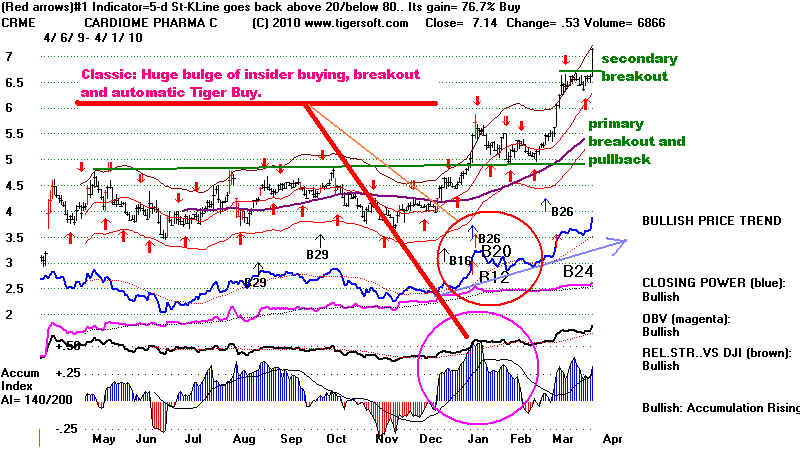
JOF, JEQ and
HUSA
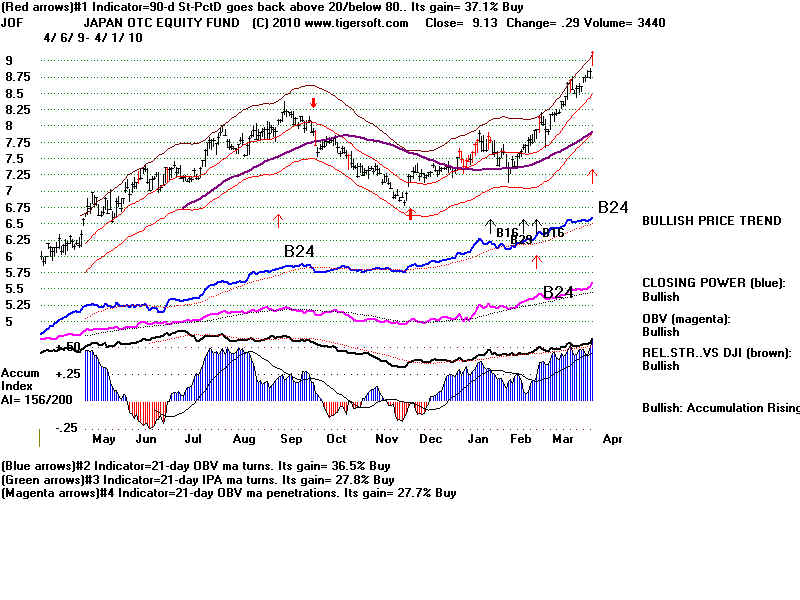
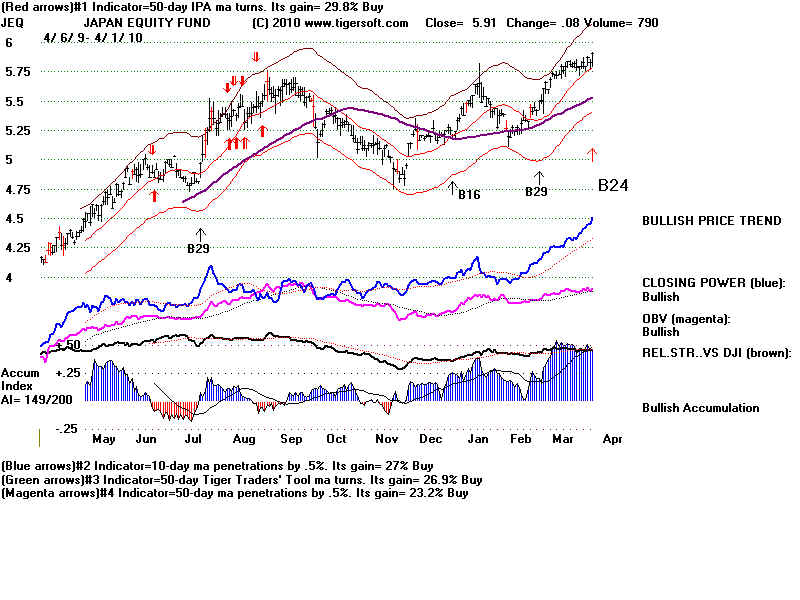
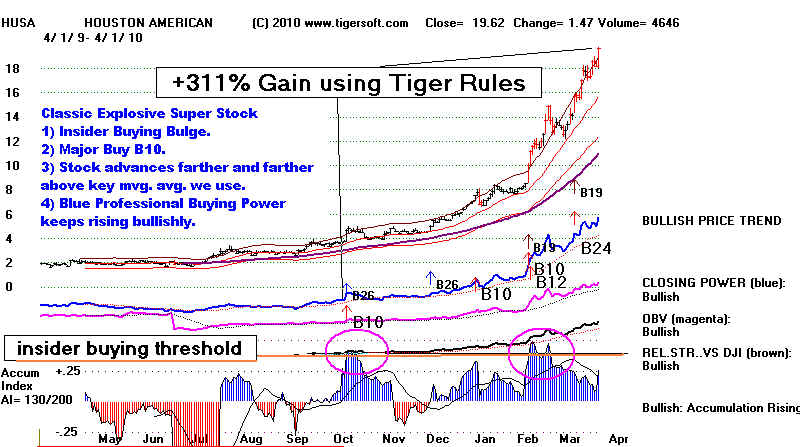
===========================================================================================
3/31/2010
Peerless Remains on A Buy. Speculative Low Priced Stocks Remain Hot
The Opening and
Closing Powers are both rising for the QQQQ, SPY, DIA and IWM.
Odds favor a Pull-Back to just below the DJIA's 21-day ma, a
decline of about 2% down from here
and then a recovery to new highs. The specualtive strength
in the market barely cooled down
today on today's mild sell-off. A number of stocks made
confirmed new highs, showing an
IP21 greater than +.25. Here are some of the best of their charts.
What keeps me bullish are a powerful technicals and a powerful
political trimverate:
1) We have no new Peerless Sell in this the 12th month of the
advance without an 8% decline;
2) Breadth remains very good, despite the last two days and the
market is now attracting the public,
judging from the rising A/D Line and surge of interest in thin
low-priced stocks.
3) The market is being pushed up by an unbeatable (in the
short-run) political-financial trimverate,
the President = Treasury Secretary, the Federal Reserve Chairman
and monopoly Wall Street
bankers, like Goldman Sachs.

This triumverate wants the public in the market for different
reasons. They believe business
confidence will be eventually be restored if they can get the
stock market back above
12000, even 14000. They believe that stock market is less a
reflection of corporate earning
expectations than an automatic predictor and precursor/promoter
of furure corporate earnings.
They believe rising stock prices will create new business
ventures and jobs. But where? In the USA?
They neglect that another crash after a bigger bubble is burst
will wipe out many more of the
surviving middle class who are now being enticed into this
market's specualtive phase.
How much will this induced and artificial investment boom address
the profound need for the
rebuilding of the American infrastructure and create and restrore
American manufacturing jobs?
This and the even greater conccentration of wealth and power that
will result GUARANTEES
eventually another financial collapse. The powers that be seem to
have learned nothing from the
last collapse. Want proof? Watch what happens to
financial reform in Congress!
Perhaps, because they know that a new Crash is a real
possibility, they will do all in their
power to keep the market rallying. I have written for a
year that Obama uses rhetoric to
satisfy his progressive base, all the while giving more and more
to boost to Wall Street and
big corporations. His concessions today to the "drill,
baby, drill crowd" are more proof of
how determined, pehaps desperately so, he is to keep this rally
allive. Oil stocks make up a big
part of the DJIA and SP-500: CVX and XOM.
Back to Technicals
The IWM shows a red Sell from a 14-day Stochastic-K Line.
This system (shown by the red signals)
has gained 43.4% for the last year. That should earn it
some respect. IWM/s Closing Power has
broken its uptrend. Its OBV, Relative Strength and
Accumulation Index have lost their "bullish"
status.
What If The Market Weakens Next Much More?
In that case, we will see a big increase in the number of stocks
that form head and shoulders patterns,
that fall below key support levels, break their 65-day ma with
negative IP21 (current Accumulation
Index readings) and then have their 65-day ma turn down.
New Bearish Tiger Data Downloads
See When Selling A High Accumulation "Bubble" Stock on
Weakness Is A Good Strategy.
This offers
TigerSoft's rules to to sell swiftly falling "super" stocks. Beyond this,
I will start to place
on our Tiger Data Page screenings of all stocks for bearish
conditions each night. A good place
to start with be to create directories of stocks to
download each night with all stocks closing
below the 65-day ma with a negative Accumulation Index AND
also for a separate Tiger directory
all stocks below a newly falling-65 say ma, as long as
their Accumulation Index is below +.25.
================================================================================
3/30/2010 Peerless Remains on A Buy. Speculative Low Priced
Stocks Remain Hot
The internal strength indicators are still too strong to predict
anything more than
a decline to the 21-day ma. The DJI is eating up the supply
of stock at 11000. Both
the Opening and Closing Powers remain in uptrends.
The upward power in the stocks showing the highest Accumulation
and highest
momentum is nothing short of amazing now. Momentum like
this draws the
public into the market. The result is that Opening Power is
now stronger
than CLosing Power. The period 1999-2000 shows that this
condition can last
for 3 months. A recognizeable top pattern is also likely to
occur, as well as
a Peerless Sell, at the top.
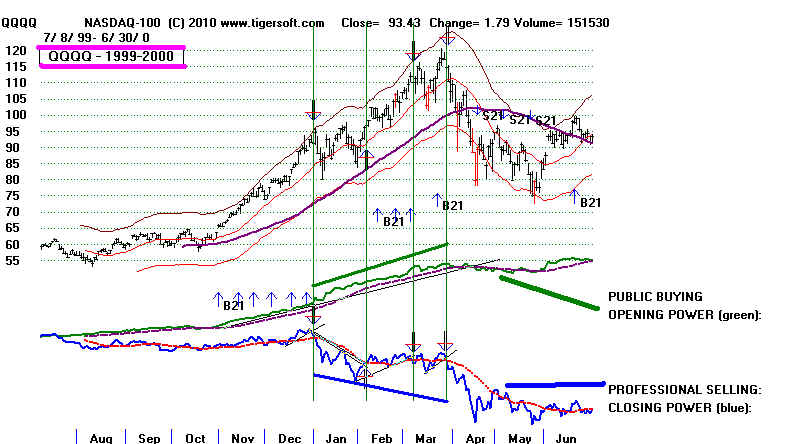
So, instead of telling the market to go
down, because we do not like Fed rigged
markets and we think the economy is still in deep trouble, I
would suggest working
with the trends of the stongest high AI/200 stocks and
trade their Closing Power uptrends
on the long side. The next decline to the 21-day ma will
likely be a good trading
Buy, just as it is with all powerfully uptrending stocks showing
high Accumulation.
The NASDAQ now shows a very high level of positive Accumulation.
Its AI/200
level is 188. Hesitation and more new new highs is what
this strength has historically
shown until there is a Peerless sell.
ISSI -
Typical Low-Priced Rocket-Stock - ISSI was 40 back in 2000.
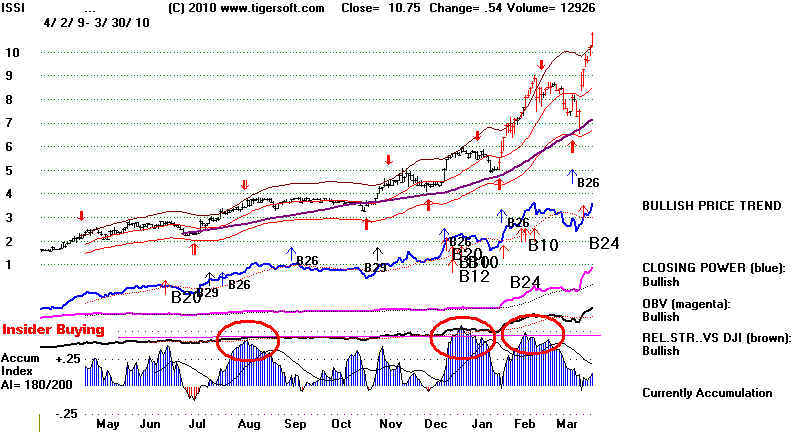
Tahiti Anyone?
Tomorrow will end the first
quarter. Followers of our Tahiti
system, as orginally
set forth, simply buy the highest AI/200 (the count of the number
of days with positive
Accumulation for the last 200 days) stock at the end of the
quarter and hold 21-months.
This system which was meant to be used with the DJIA, but could
and should be used
with other groups of stocks, like the SP-500 (a much larger
universe), the NASDAQ-100,
all medical and all oil stocks. See their charts here. HPQ now shows
the highest AI/200
value in the DJI and just made 5 year high, too.
HPQ
53.26 highest AI/200 stock in DJIA
DTE
45.38 highest AI/200 stock in SP-500
CHKP
34.8 highest AI/200 stock in NASDAQ-100
ARTC
29.84 highest AI/200 healthcare stock
MWE
31.61 highest AI/200 oil stock
=================================================================================
3/29/2010 Hotline Buy B17/ B10 - Give The DJI More
Chance to Reach 11000.
All
the reasons that I posted last week for still being bullish still pertain. It is
true that
the
Closing Power uptrends could be significantly violated on a reversal down
from
a stong opening tomorrow. Given the upwards momentum, I doubt if that would
bring
a DJI decline of much more than 2.2%, slightly below the rising 21-day ma.
More
and more signs show a pattern of higher openings. That suggests overseas and
public buying.
STOCKS
I am
starting to post the data for new yearly highs with an IP21 (current AI) reading
above
.25 at some point in the last month. Below are some of the better ones
tonight. Apply the principles of an augmented B24 to these and you should do well.
Either look at the "bullish", "both up" or "unusual volume"
flags with these stocks
to
find very good candidates to sue the rules in Explosive Super Stocks.
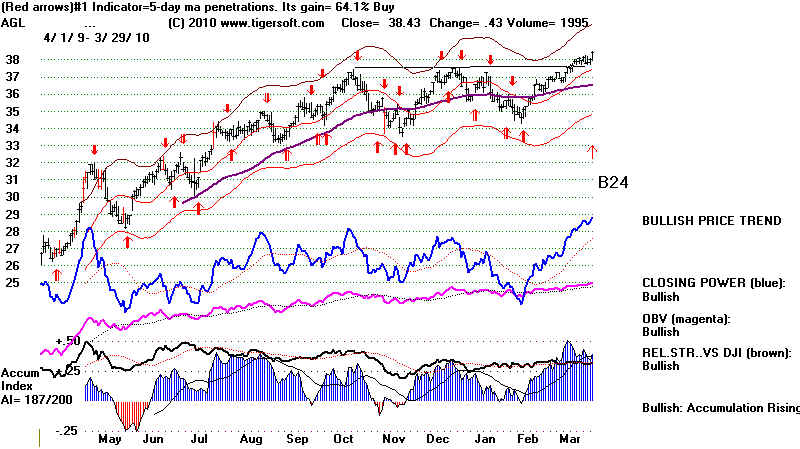
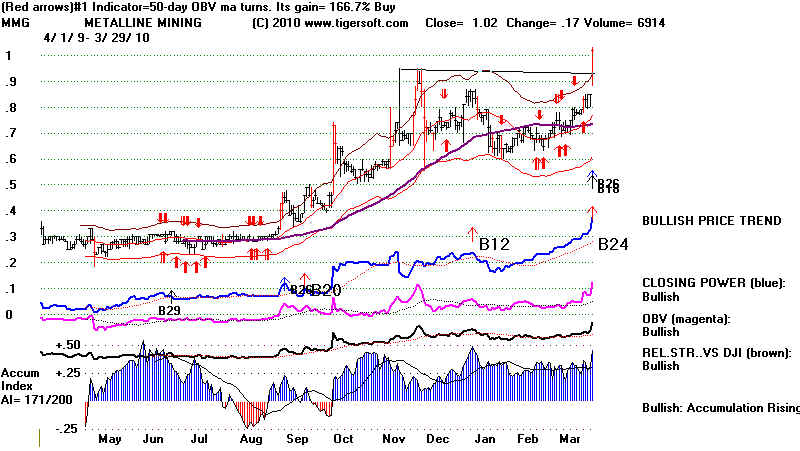
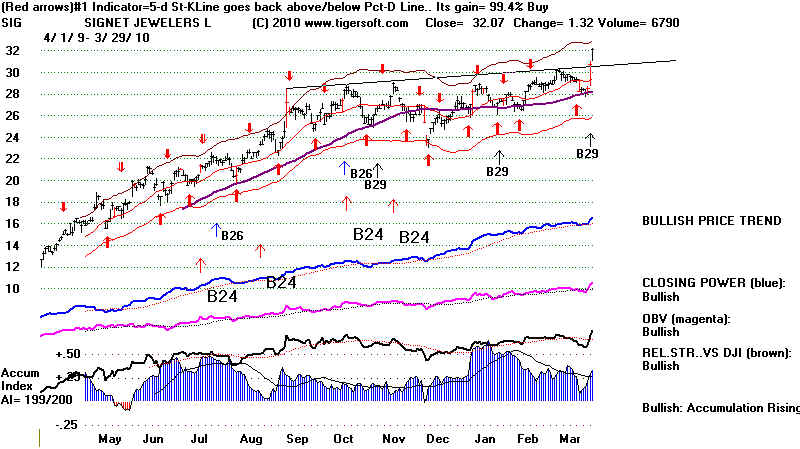
WHEN TO SELL HOT STOCKS -
When Selling A High Accumulation "Bubble" Stock on Weakness Is A
Good Strategy.
Back testing shows that these high Accumulation stocks making new highs
are
often superb BUYS for an aggressive investor who is willing also to:
1) Sell on a Peerless Sell,
2) if the stock breaks below its 65-day ma with negative AI readings or
3) when the 65-dma then turns down.
I am asked why sell such a stock in a strong general market. "The rising
market's tide
will
lift all boats". Sadly, this is not true. Insider can make mistakes.
And so will we
if we
do not have a "Plan B". The reason is that we just have to have some
insurance
against a bigger decline. Moreover, we can usually find a better stock to
replace
the
one we are selling. This new stock is apt to do better. Alternatively,
we can also promise
ourselves when we sell this stock that we will buy it right back if it gets back above
the
rising 65-dma with good internals. If you are still resistant to taking a loss
quickly,
wait
for the stock's 65-dma to turn down to sell. That will save some situations.
But
this
can also increase the loss on a stock that cannot rally. Here is a link showing
some
high Accumulation stocks that last year did decline from their 65-day ma
and
did not turn back up from it even though the general market has been strong.
Please read the unpublished Blog I did tonight.
When Selling A High
Accumulation "Bubble" Stock on Weakness Is A Good Strategy.
====================================================================================
3/25/2010 Buy B17/ B10 - Give The Market More Chance to Advance.
The DJI has now risen 12.5 months without an 8% correction. Since 1929, there
were three other big advances that
lasted nearly exactly as long as the present advance
and then started a decline of more
than 8%. But in 11 cases the DJI continued to move
higher. Based on the behavior of
longduration bull markets, I would have to say
these advances take on a life of
their own. They are self-perpetuating. We are nearing that
stage. Based on the history of
these long-duration advances, if the DJI were to advance
for another month, the odds would
be 8:3 that it can rally for, at least, 3 months after that.
Length of Long Rallies in Time
12-13 months
1936 (12.5). 1961 (12.5), 2006 (12.5)
13-13.5 month
1973 (13.5)
14-14.5 months 1943
(14.5)
15-15.5 months
1994 (15.5)
16-19.5 months
1946 (17.5), 1959 (19.5) 1984 (17). 1992 (17)
20-24 months
1955 (24). 1989 (21.5)
over 24 months
1965 (30.5). 1997 (30)
The only bearish condition we can identify presently are the break in the steep Closing
Power uptrends of the SPY, QQQQ and
DIA and the fact that the DJI is back to the point of
breakdown, 10850-11000 from
September 2008. That may bring a retreat to the rising
21-day ma. But the momentum
is clearly a factor. Until we get one or more of the following
conditions, a major Peerless Sell
signal, it is not consistent with market history to call a top here.
Even then, a decline of about 10%
would be typical in these cases. The bearish conditions
to for are:
1) a completed head and shoulders top,
2) a false breakout from above horizontal resistance,
3) a well-tested price-uptrend break or the V-Indicator is negative with the DJI at least
2%
over the 21-day ma.
Typcially there are much bigger non-confirmations of a new price high by the A/D line,
the P-Indicator and Accumulation
Index than we are presently seeing. The P-Indicator
and the Accumulation Index
typically drop to levels less than 60% of their previous highs
when making new unconfirmed highs.
STOCKS
1. Retail Apparrel
Strength.
For some reason, new health insurance rules or maybe fashion changes, a number
of retail clothing stores are
very much in favor and making new highs. The stronger
Dollar is helping these companies
buy more cheaply overseas. Higher end sales are
clearly picking up as the sotck
market rises.
The stocks I have put in this list are: AEO, ANN, BWS, BEBE, CHS, CWTR, FDO,
FINL,GIII, GES, GPS. JAS, JWN, LTD,
SHLD, SHOO, TGT, TLB, URBN, WEL, WTSLA and ZQK.
2. JOF (Japanese OTC
stocks look good)
3. Peerless has worked
very well with Indian ETFs since 1998, year after year. The world
markets seem totally
integrated now. How that will help American workers looking for
industrial jobs is not clear.
1.
Women's Apparel Stores - New Highs
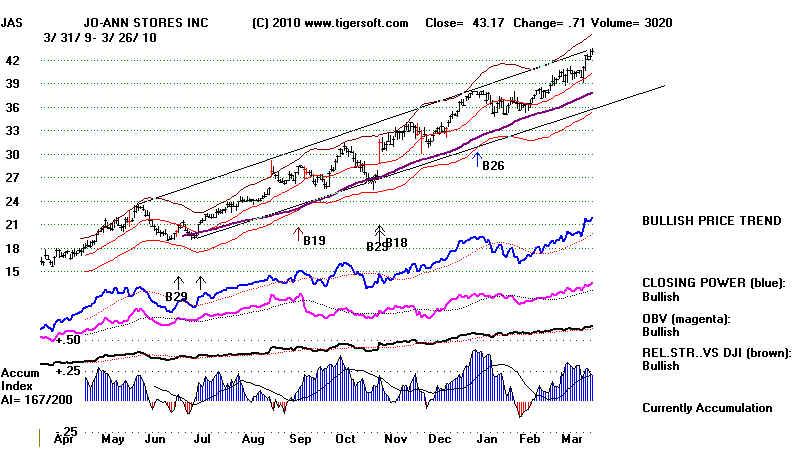 |
2. Japanese OTC Stocks Strong
While the Japanese Yen has been flat against the Dollar for six months, smaller
Japanese stocks may be starting
their own leg up. When one recalls the size of
the 1980s Japanese bull market,
JOF becomes an attractive specualtion. Their
strength reflects the same investing
emphasis on secondary stocks that exists
in the US.
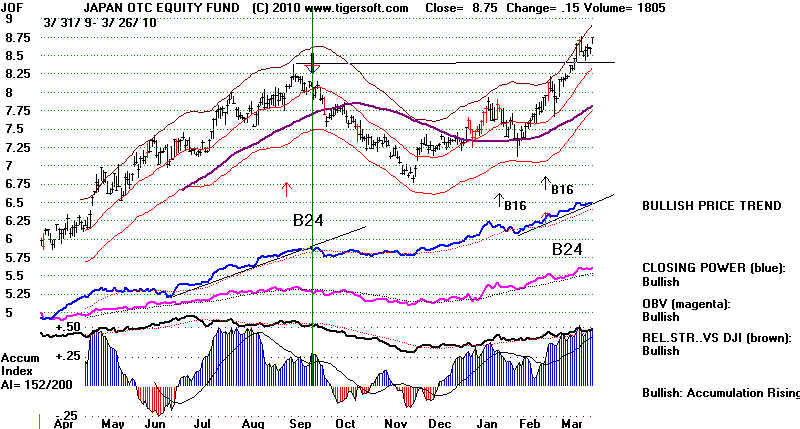 |
=========================================================================
3/25/2010
Buy B17/ B10 - Give The Market
More Chance to Advance.
There was a late market sell-off today. Only the DJI held a small gain.
The DJIA could not keep advancing into the heavy overhead supply
of stock at 10800-11000
from when Paulson appeared that Sunday night in September 2008
and gave Congress
an ultimatum to give Wall Street $800 billion or else the market
and the US economy would
drop into oblivion. A lot of people wish they had sold that
Monday morning. This 10800-11000
is clearly important resistance. But just reaching it
does not mean the market will go
into a decline. In fact, it is normal for a market moving
higher into overhead resistance
to eat up chucks of that overhead supply of stock, rest and again
move higher. We need to
see more than a failure to hold the highs to become bearish.
True - there were 459 more down than up, however. This is the second Thursday in two
weeks when breadth fell behind the DJIA. Given the momentum of
the 12 1/2 month bull market
that has not seen even a full 8% decline, we have to remain
bullish. Note, we have
no Peerless Sell signal. If we look at all the year-long
advances since 1928, there are only
two or three cases when the DJI dropped more than 8% without a
Peerless Sell. Usually,
tops occur only after the A/D Line clearly stops confirming DJI
highs.
True also - the P-Indicator is not confirming the recent highs by making a new high.
This often brings a small retreat, back to the 21-day ma, but
usually not more. It usually
takes a bigger non-confirmation to bring decline. I will
charts of all the cases of year-long
rallies since 1028 at this location, later tomorrow or this
weekend.
http://www.tigersoftware.com/TigerBlogs/March-25-2010/index.html
That a retreat is becoming more likely can be judged from the failure of the CLosing Power
Percent, which factors in volume, to make new highs on this
year's rally compared to last year.
Clear breaks in the uptrend are usually bearish. But
both the Opening and CLosing
Powers are above their rising 21-day ma. This
"BOTH-UP" condition is associated
with vertical ascents. That should cause us to give the
market more time to advance.
Other bullish factors: the B10 shows that support at 10800 should hold up in the
short-run. Since 1966, the DJI has risen 72.5 of the time
from the close on March 25th to
21 trading days later. The Public is not as Bullish as might be
expected at a top. Usually
we spot a top by a long series of higher openings. Lastly,
we can safely bet the FED is doing
everything it can to hold the market up until April 15th.
====================================================================================
3/24/2010 Buy B17/ B10 - A/D Lines and CLosing Powers Are still rising.
High Accumulation
Stocks still are behaving well. A San Diego medical equipment - VOLC -
company just
broke out to a new all-time high today.
Yesterday's Buy B10 is less important as a signal in itself, than it is to underscore that
the market is
still very strong. The breakout the Buy B10 reports is not from a pattern
showing three
tests of a resistance line relatively equally spaced over the last 3 months.
That is what we
want ideally to see in the price pattern for a Buy B10. The internals do
meet the
requirements for a Buy B10. The internals do not show the exceptionally
high IP21 (above
+.30) and OPct (above +.50) readings that are associated with the most
powerful B10s.
Another negative: Buy B10s in a market already well-advanced as this is
are much more apt
to gain a modest 3% to 5% more than the typical 10% seen for all Buy B10's.
Another factor to
lower our expectations is that March B10s - like our cases
presently - only
bring modest 4.3% gains, unlike Buy B10s in January and February.
whose 5 cases
average+20% gains. But there is still plenty of upwards momentum,
very fine breadth
and one other element. Buy B10s in the second year of a Presidential
cycle are quite
bullish. There have been 8 such automatic Buy B10s since 1928. Their
gains average
15.9%. See the new research
I have posted
about Buy B10s -
Buy B10 - historical research http://www.tigersoft.com/PeerInst/-Buy-B10.htm
Still No Problem Finding High Accum Stocks Making New Highs
VOLC - All time high breakout today and
B12 breakout from short-term flat top.
Yahoo reports corporate insiders are selling mostly. Our indictators suggest their
associates
are buying these shares. This is often a prelude to giving more sponsorship and
publicity to the
stock. Volcano Corporation 3661 Valley Centre Drive
Suite 200 San Diego,
CA 92130
http://www.volcanotherapeutics.com
Volcano Corporation designs, develops, manufactures, and
commercializes a suite of intravascular ultrasound (IVUS) and functional measurement (FM)
products
used in the diagnosis and treatment of vascular and structural heart disease. Its IVUS
products consist
of consoles...digital and rotational IVUS catheters, and imaging tools, including virtual
histology, IVUS tissue
characterization, and ChromaFlo stent apposition analysis; and FM offerings include
consoles and single-use
pressure and flow guide wires used to measure the pressure and flow characteristics of
blood enabling
physicians to gauge the plaque?s physiological impact on blood flow and pressure. The
company?s products
under development comprise IVUS guided therapy products, such as IVUS guided stents and
IVUS
guided coronary and peripheral balloons; forward looking IVUS for minimally invasive
diagnostic and
therapeutic applications in the coronary and peripheral vasculature; and optical coherence
tomography (OCT)
technology that allows imaging of detailed structures in the vasculature. Its ongoing
clinical studies include the
bifurcation lesion analysis and stenting, assessment of dual anti-platelet therapy with
drug-eluting stents,
and Volcano OCT image lesion analysis using intravascular optical coherence tomography. In
addition,
the company develops and manufactures micro-optical spectrometers and optical channel
monitors to
telecommunication companies. Volcano Corporation serves physicians and technicians who
perform PCI
procedures in hospitals, and other personnel who make purchasing decisions on behalf of
hospitals
through its direct sales force and distributors, as well as through supply and
distribution agreements with third
parties. As of December 31, 2009, it had an installed base of approximately 5,000 consoles
worldwide
Also:
PRST - 4.66 was a $98 stock in 1997
SFLY, RDWR and LZ show that stocks that have exceeded their parallel resistance line
are moving higher. Speculators and Insiders are still optimistically buying
very strong
stocks.
===================================================================================
3/23/2010 Buy
B17.
The DJI's upturn
accelerated. Peerless reamins on a Buy, The upwards velocity
owed technically to the fact that
both the Opening and CLosing Powers are rising.
This means the market opens higher
and closes still higher. I take this to mean that
both the Public and Professionals
are buying. That the Closing Powers made new highs
today means we should work with
newer, less steep uptrends for them.
Peerless reinforced the bulls with an automatic BUY
B10. The main significance
of this in our case is that
it posits 10750-10800 as new support. Normally, we
should see the flat and
well-tested resistance that the DJI has gone through.
A flat, thrice or more tested
resistance line is not so clear here. The result may
be that the usual immediate
vertical ascent that follows a Buy B10 may not occur
here. In addition,
11,000 is a natural round-number resistance level.
Buy B10 - historical research http://www.tigersoft.com/PeerInst/-Buy-B10.htm
The rally past 10800 will
drive the bears "nuts". The A/D Line has confirmed the
move. That is very
important. Most tops occur only after the A/D Line fails to confirm
a new DJI high. So, we should
see the DJI moving higher and chewing up the
overhead supply of stock with
each rally.
Meanwhile the number of new
highs rose sharply today. Speculative, tech,
restaurant, military and
interest-rate stocks are all doing well. Concentrating
on the highest accumulation
stocks - horizontally and vertically - should
continue to pay off quite
well.
=========== RUSSELL-2000 ===================
IWM: Both Opening and CLosing
Power are rising (above their 21(dma) The Closing Power
uptrend in still rising.
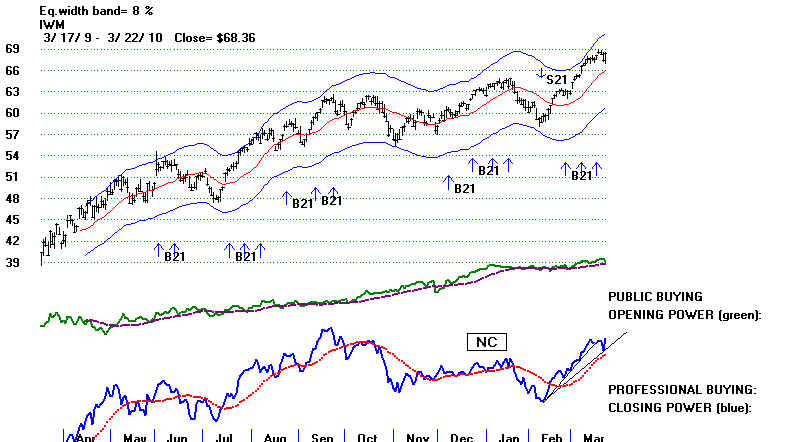
3/23/2010 Buy B17, Stocks continued to soar. It's helpful to look at the
stocks
up the most today that made new highs.
It shows the technical conditions that release
and propel a stock. (Do this with
Tiger using the older Tiger Charting programs +
Ranking Results + User Set Ranking + 1 +
1. ) Here are the top 3 gainers above 3.
INCY
PZZ
GIVN
GNET
MMUS
======================================================================================


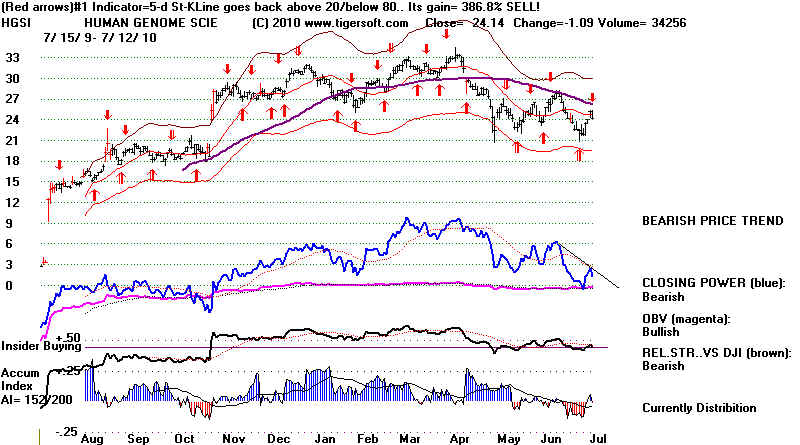


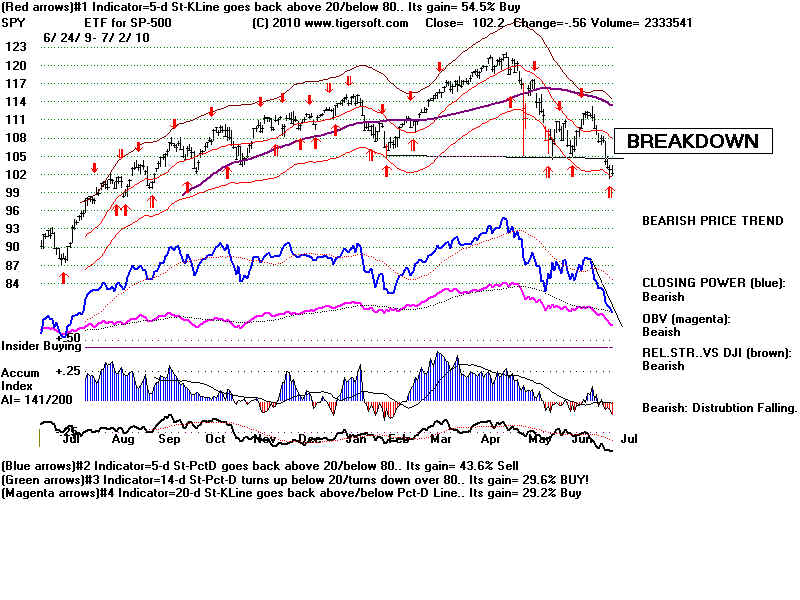
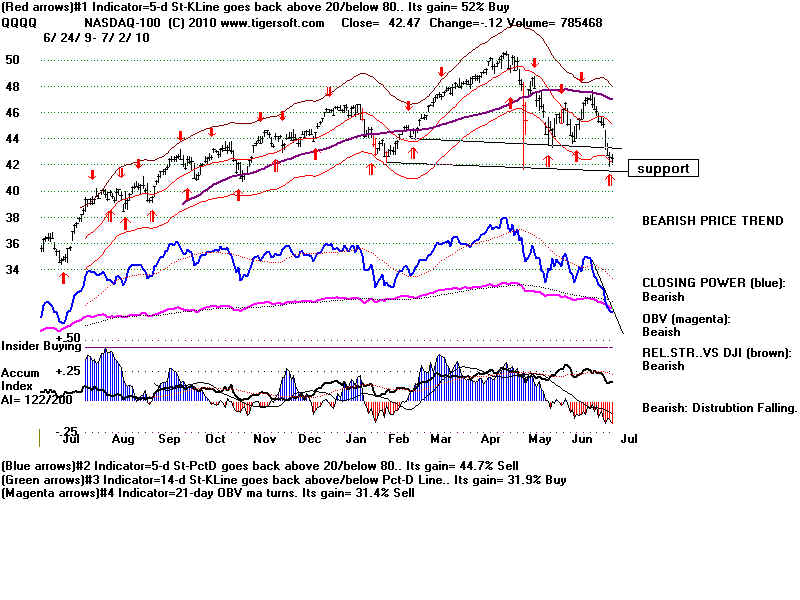

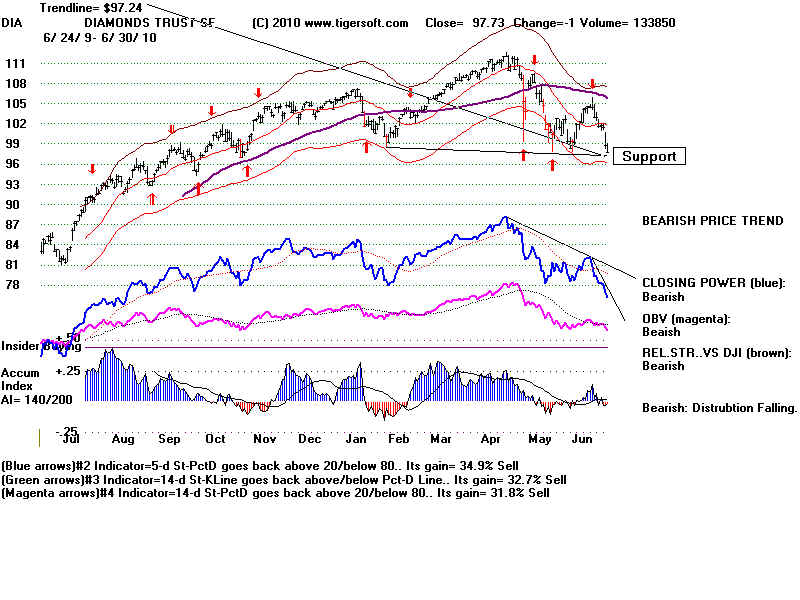
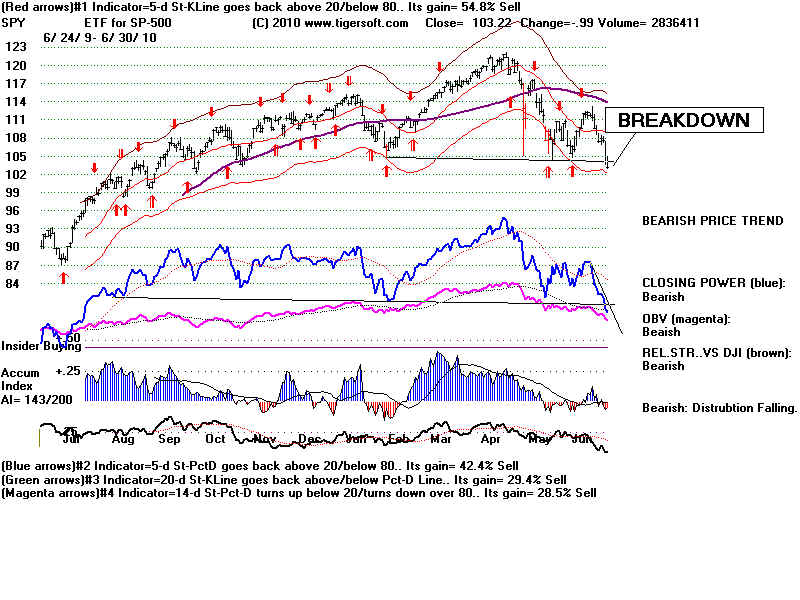
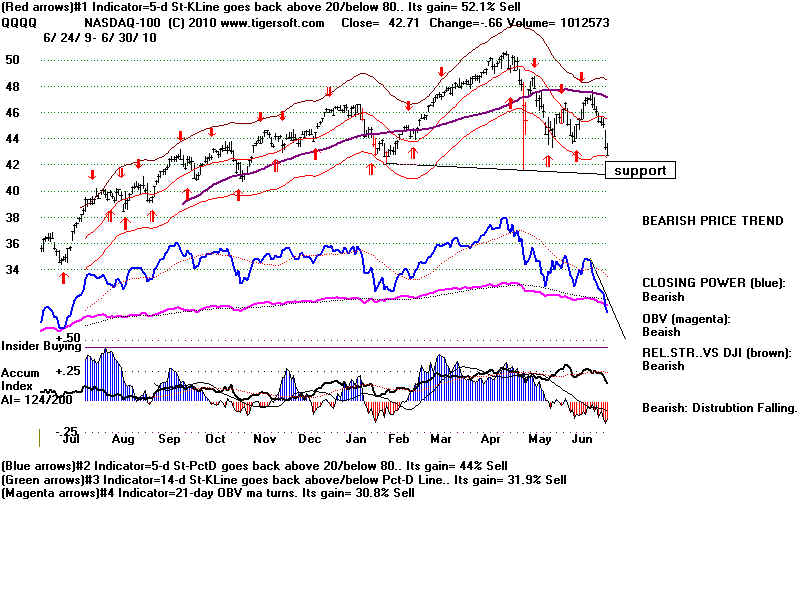
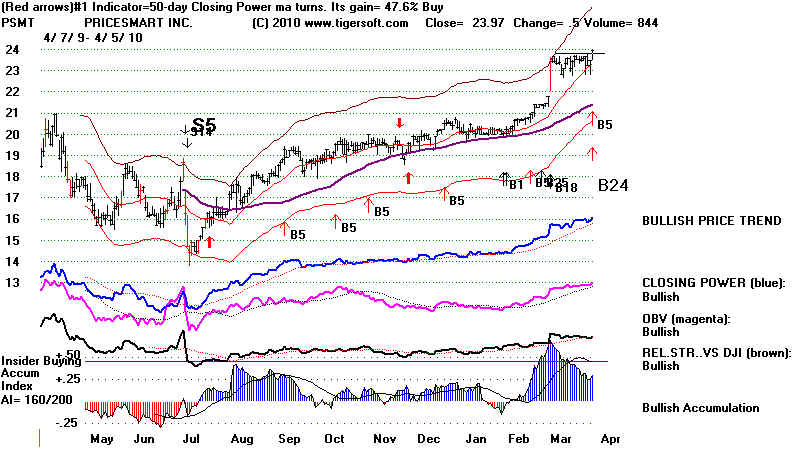
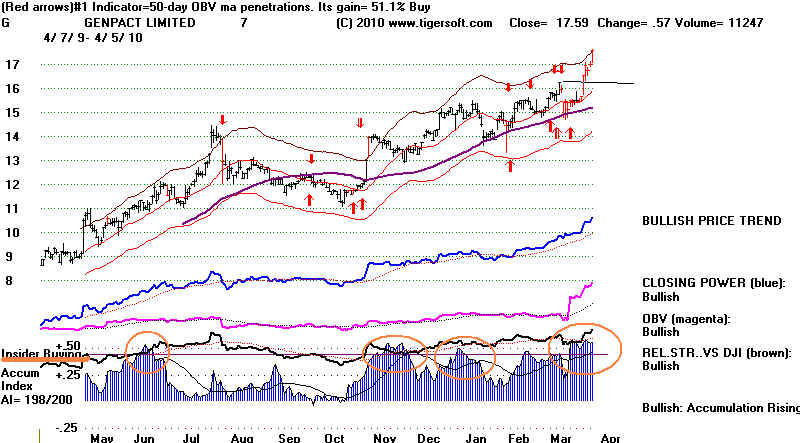
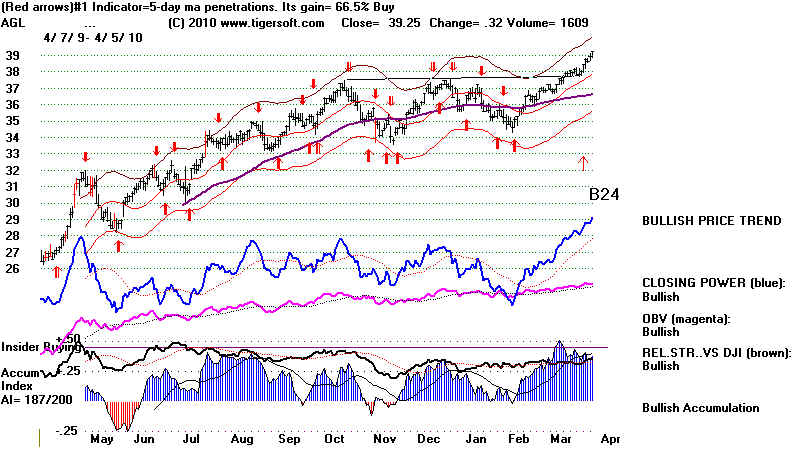
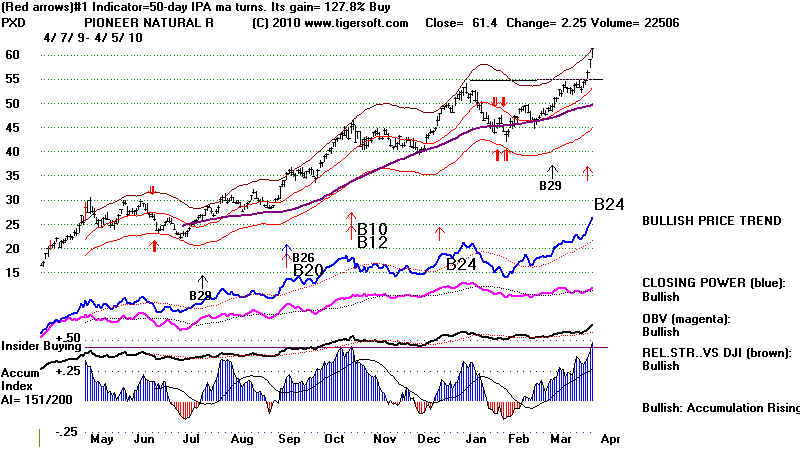
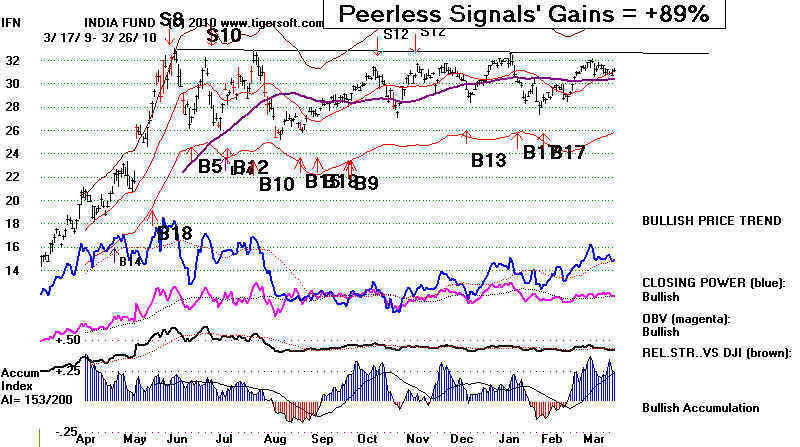
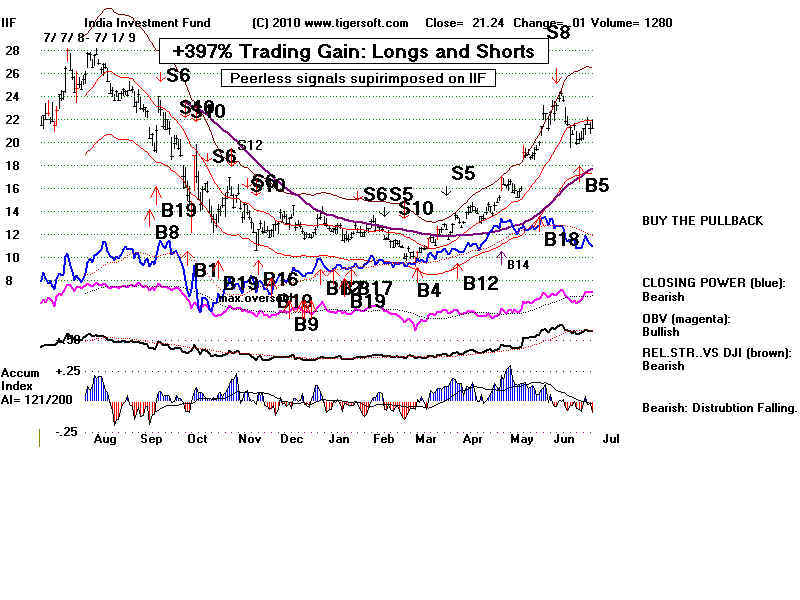
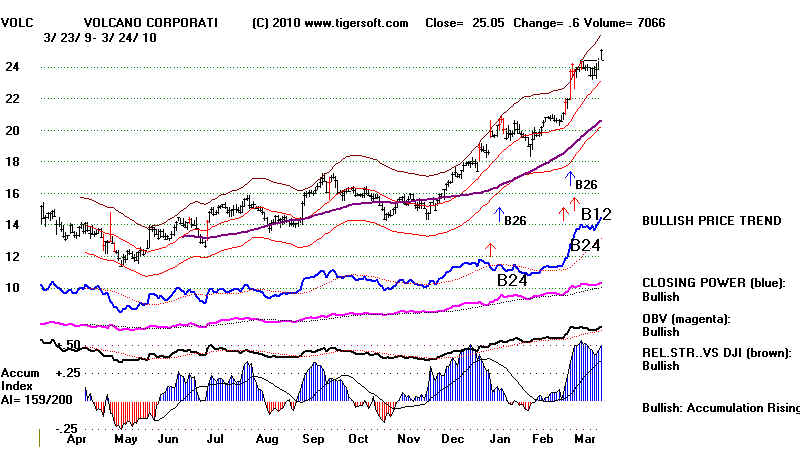
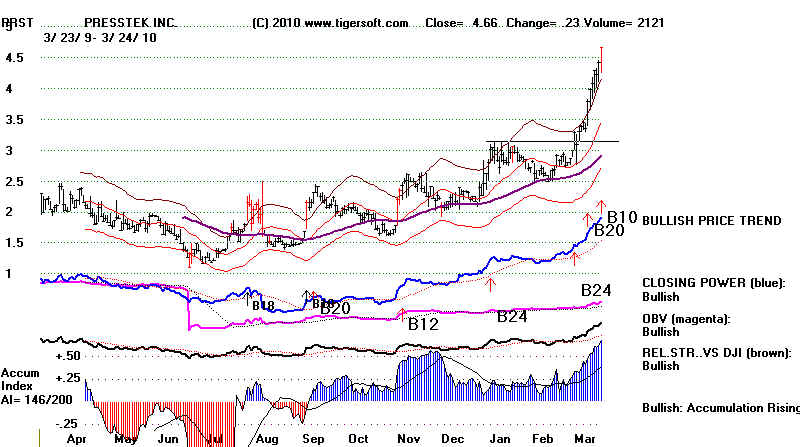
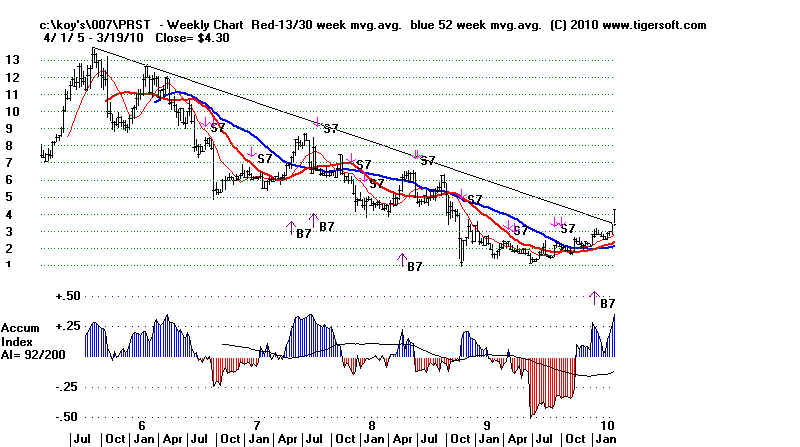
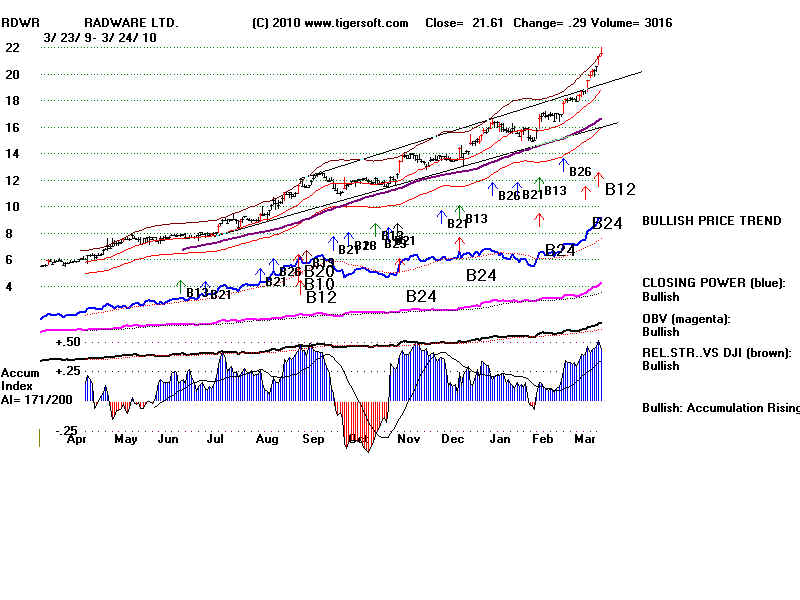
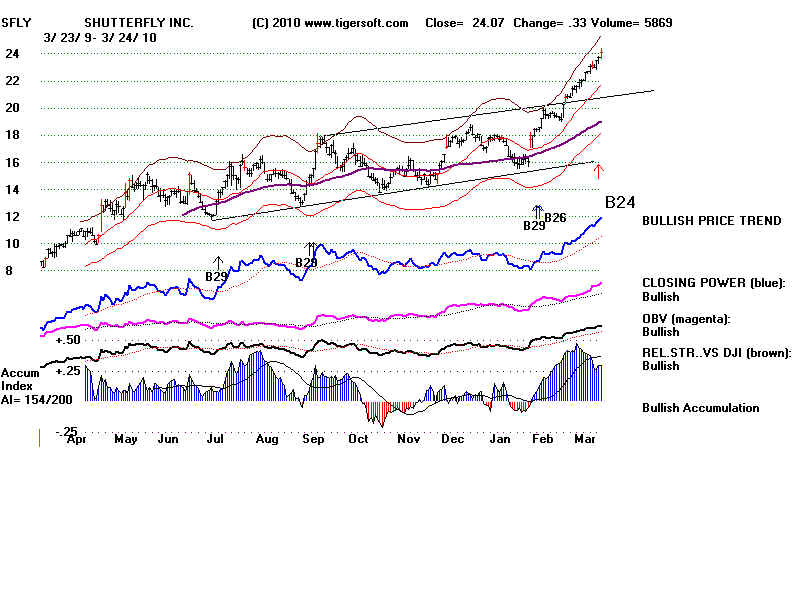
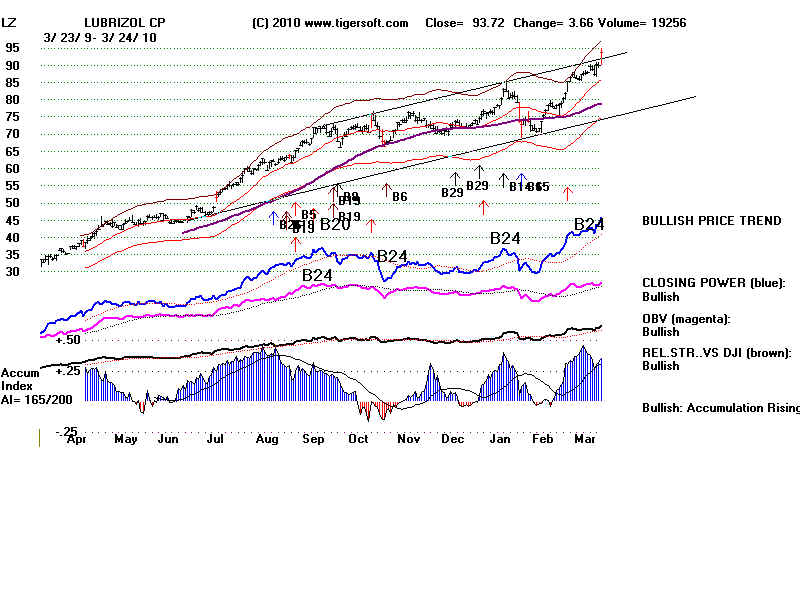
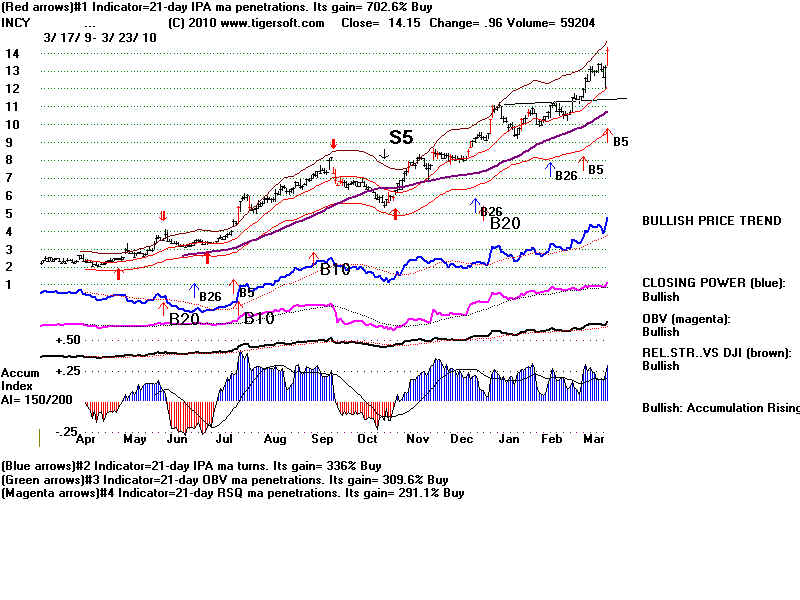
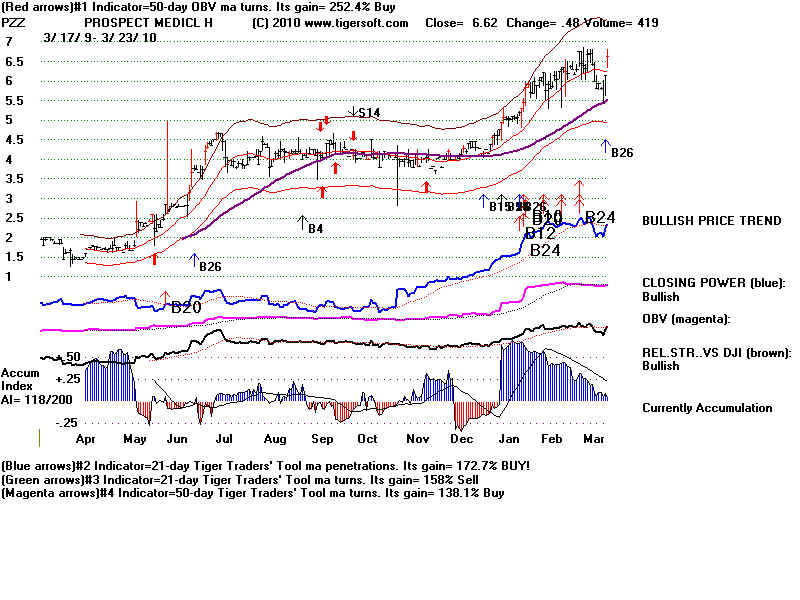
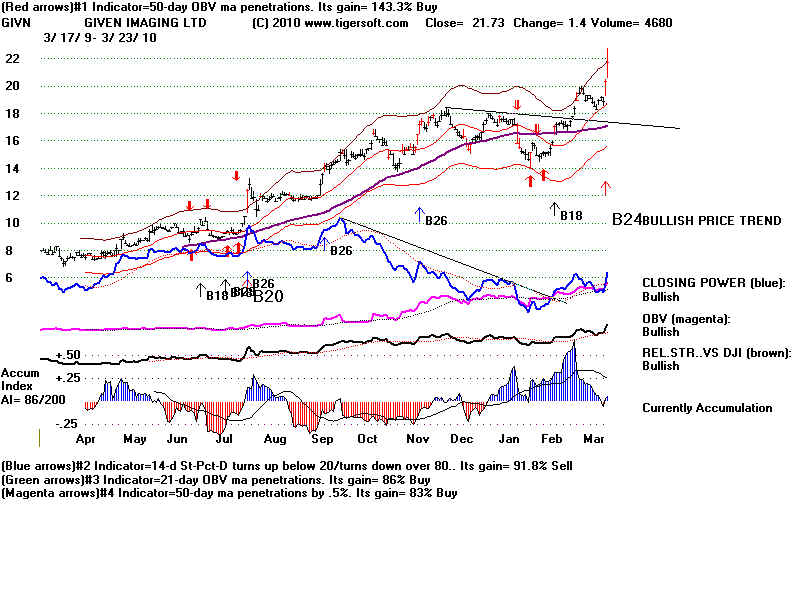
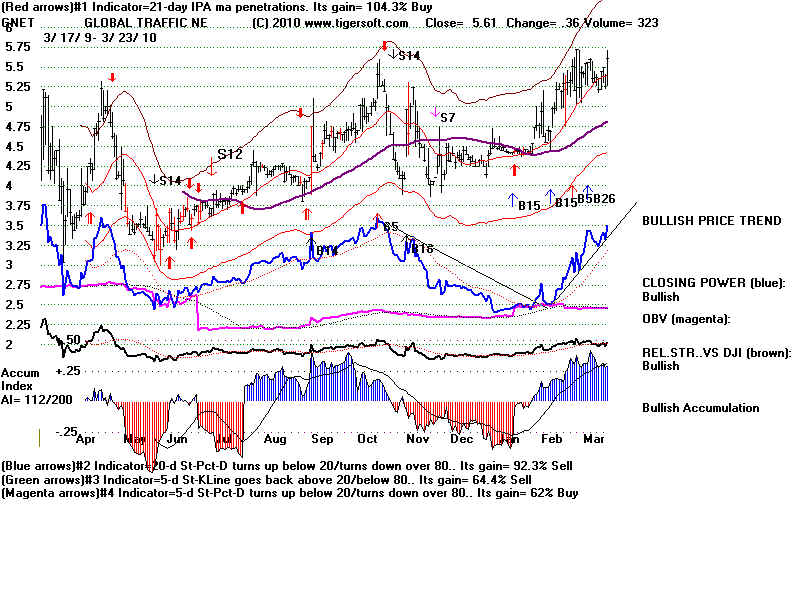
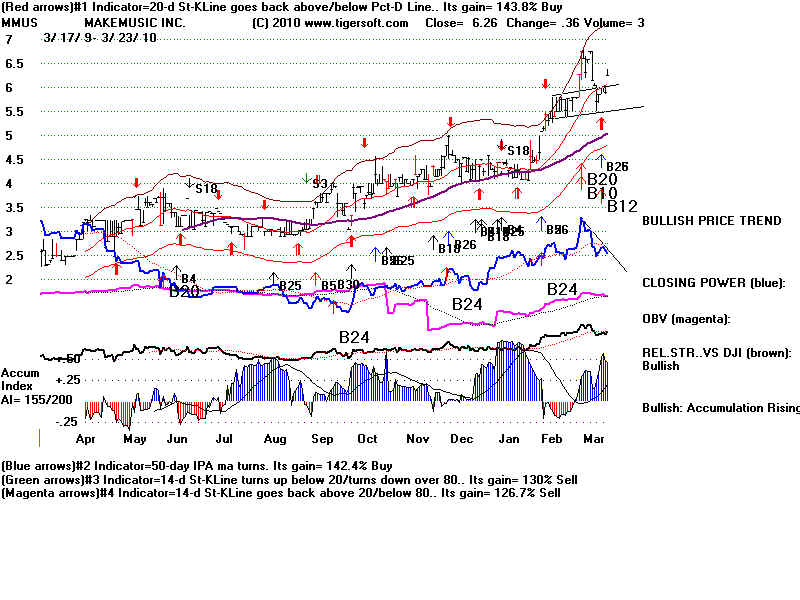