 Tiger
Software 2/21/2008 www.tigersoft.com See 2/4/2008 NEM technical study.
Tiger
Software 2/21/2008 www.tigersoft.com See 2/4/2008 NEM technical study.Spot General Market Tops
by Noting Newmont Mine's Run-ups
by William Schmidt, Ph.D. (Columbia University)
(C) 2008 All rights reserved. Reproducing any part of this page without
giving full acknowledgement is a copyright infringment.
Research on Individual Stocks upon Request:
Composite Seasonality Graph of Any Stock for $125.
Example of historical research NEM - Newmont Mining. Order Here.
 |
Tiger
Software Helping Investors since 1981
|
Calling General Market Tops
by Spotting Run-Ups in
Newmont Mines and Gold.
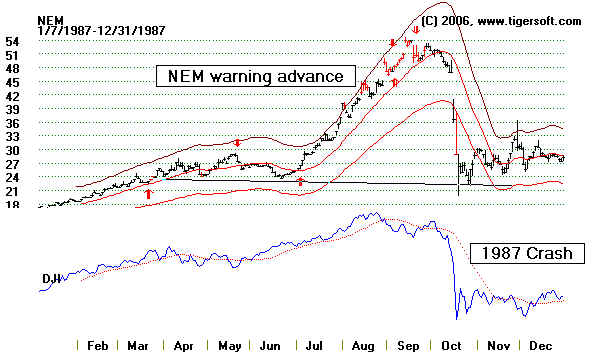
Newmont rose from 24 to 54 in the three months before the DJI's major top in August 1987.
The DJI then declined 36% in the next two months.
Sharp rises in Gold or NEM since 1987 are
usually quite bearish for the market.
You can see from the data farther
below that a quick advance by NEM of more than 27% in 2 to 5
months is normally reliably bearish
for the general market, as represented by the DJI-30...
When NEM finally does turn down,
the general market is already beginning a big drop.
Sharp advances by Gold were very
bearish for the market up until 2003 when very low interest
rates over-rode the close link
between a rise in gold and a steep decline in the stock market
soon afterwards. Below you
will see all the key Gold or NEM charts from 1971. The biggest market
Crash of all, 1929-1932, is also a
notable exception, too. Gold was then fixed at $32/ounce.
Gold as A Threat To The Economy.
But
speaking of the 1930s, did you know that speculation in Gold against the US Dollar was
considered so dangerous to the
stock market and a national recovery from the Depression
that Franklin Roosevelt issued
Presidential Executive Order #6102 which made it illegal for most
Americans to own gold, except in
jewelry? See http://www.the-privateer.com/1933-gold-confiscation.html
.
NEM as The "Angel of Death" for The Stock Market.
For many Gold Mining is dangerous, even deadly. NEM is accused of placing miners
and local peoples living at far greater
risk than would be allowed to in the US. See my Blog
or http://dte.gn.apc.org/cstd1.htm But
NEM is the angel of death in another way. When its
stock goes upl, the stock market often
suffers a severe decline.
Here are 14 DJI declines of 10% or more since 1987 and NEM's price behavior just before
the decline.
1. - in the 5 months before
the 1987 Crash, NEM rose 120%. (See chart above.)
2, - in the 3 months before
the January 1990 Plunge, NEM rose 40%.
3. - in the 2 months before
the July 1990 - October 1990 bear market, NEM rose 33%
4. - in the 3 months
Feb-March 1994 DJI drop of 11%, NEM rose from 38 to 48, 27%.
5. - in the 2 months
before the October-Novermber DJI 1994 drop of 10%, NEM rose from 38 to 46.
6. - in the 3
months before the September-October DJI 1997 drop of 15%, NEM rose from 36 to 46.
7. - not so before the 20% DJI decline of 1998.
8. - in the month
before the August-September 1999 DJI drop of 12%,, NEM rose from 17 to 22.
9. - in the four months
before the DJI plunged 20% in Jan-March 2000, NEM rose from 17 to 25.
10. - not so before the 12% DJI decline of late 2000.
11 - in the two months
before the early 2001 bear market began, NEM rose from 13 to 18.
12 - in the three
months before the May to September 2001 30% DJI decline, NEM rose from 16 to 24.
13. - in the three months
before the Feb.to October 2002 30% DJI decline, NEM rose from 20 to 26
14. - in the five months
before the Jan.to March 2003 16% DJI decline, NEM rose from 23 to 30
Newmont Mining is
not quite a surrogate for Gold. Its movements are related to, but also
independent of Gold. That
might give us some hope, as NEM has been moving mostly sidewise
as Gold rises steeply this year.
But NEM's relative weakness may be out of the ordinary
right now. NEM's weakness
vis-a-vis Gold stems from concerns about its rising costs
and the growing risks of
nationalization in Indonesia and Peru. NEM is now awaiting
Indonesia's decision about
withdrawing its rights to mine gold there. See NEM's website -
http://finance.yahoo.com/q/pr?s=NEM
So, it is unclear if NEM will work this time as our early warning
system. The very long
rise of Gold must be seen as a warning for the market even if NEM
is treading water.
Today's earning report for NEM shows how costly its approach to gold
mining is. We warned
about this: http://www.tigersoftware.com/TigerBlogs/02142008/index.html
2/21/08 Newmont Reports Fourth Quarter and 2007 Financial and Operating Results
(RTTNews) - reported a fourth
quarter net loss of $289 million or $0.63 per share, compared
to a profit
of $223 million or $0.50 per share in the same quarter last year. Loss from continuing
operations came in at $933
million or $2.06 per share, compared to a profit of $171 million or $0.38
per share in the
corresponding quarter prior year. Quarterly revenues dropped to $1.41 billion
from $1.42 billion in the
year-ago period. NEM included a $1.12 billion exploration "goodwill
impairment charge".
Newmont is currently going sidewise with heavy distrubution..
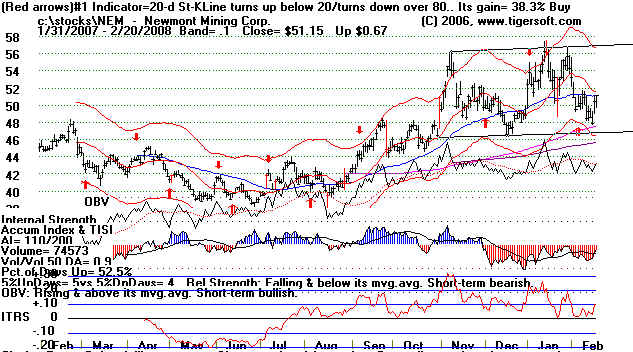
Gold is rising steeply. The DJI is in a downtrend.
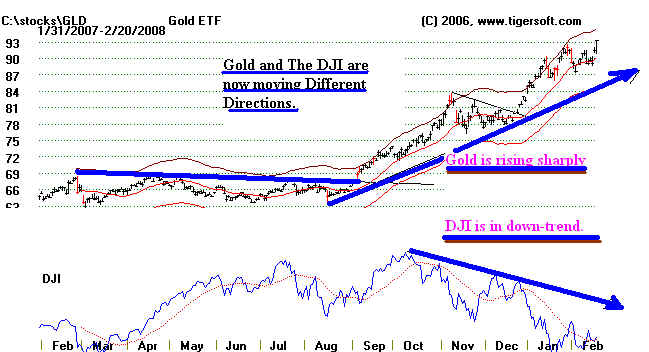
Actually, Gold can rise for some time before the general market turns down. NEM
seems
to follow gold's advance, but may
lag for some time. That's what makes it such a good predictor.
We see this in 1985-1987 when Gold
advanced from $200 to $500. Only when NEM doubled in
mid-2007, was the DJI set up for a
big decline. In the chart below, you can see that Gold has risen
steeply since December 2000.
Its advance in 2001 and 2002 did warn of a bear market. But its
rise from December 2004 to now,
from 450 to 950, has seen only one decline DJI decline of more
than 12%. Gold has been able
to rise this long, from 2004 to 2008, without a big general market decline
because the FED has kept interest
rates low. Unlike now, in the 1970's, the FED responded to inflation
by raising interest rates sharply
and that created a number of sharp sell-offs, which also
may have set the stage for the big
bull market after August 1982.
------------------------------------ 28-Year Chart of Gold:
1980-2008 -----------------------------------------------------
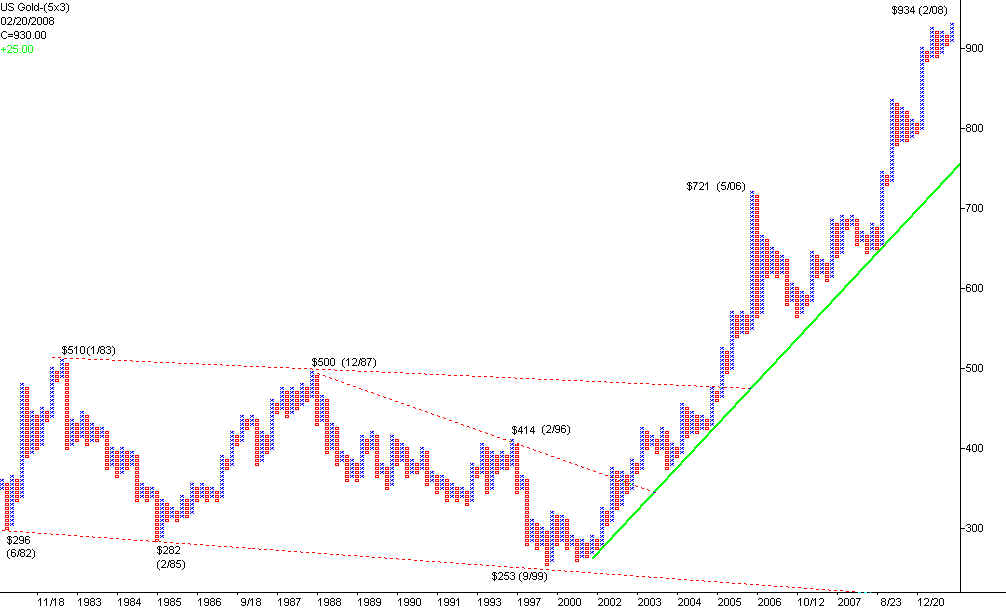
(source: http://www.the-privateer.com/chart/gold-pf.html
)
Gold Is A Commodity. Gold and The DJI - 1970s.
Usually Golds rise means
commodites rally, too. After the US Dollar stopped being convertible
into gold in the early 1970s, non-oil commodities tripled.
Then from 1980 to 1985, commodities fell
and the stock market rallied very strongly. In the
chart below, you can see how the bear markets
of 1973 and 1974 were preceded by sharp advances in Gold
prices. The last rally in Gold in 1975
did not bring a bear market, only a 10% dip in the DJI in
the second half of 1975.
Gold and The DJI: 1971-1975
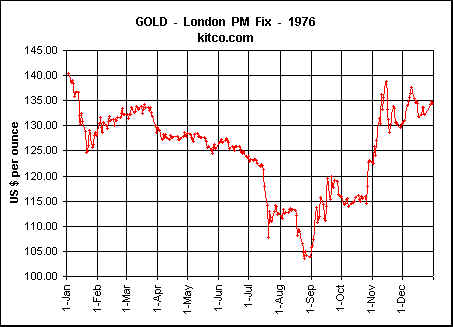
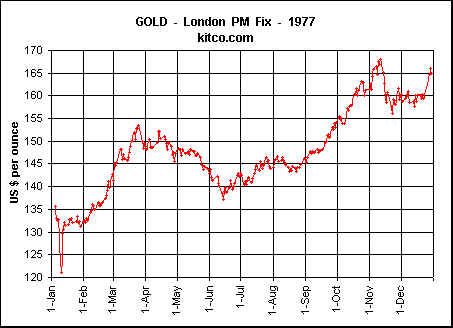
Gold 1976 - The rally in gold from 105 to 135 after September 1976, set the stage
for the bear
market of 1977 in the DJI. The DJI fell from 1000 in January to 800 in
October.
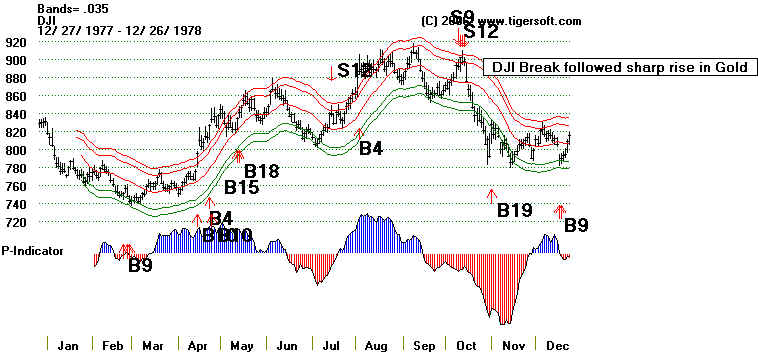
DJI - 1977
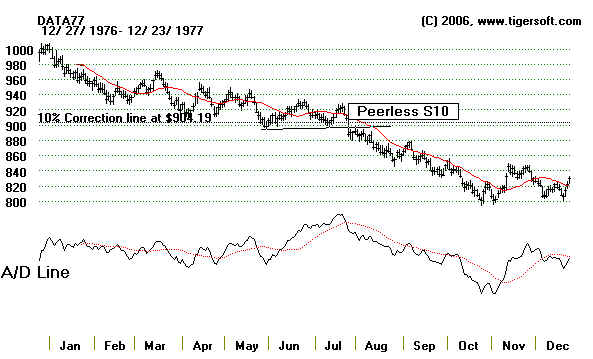
============================================================================
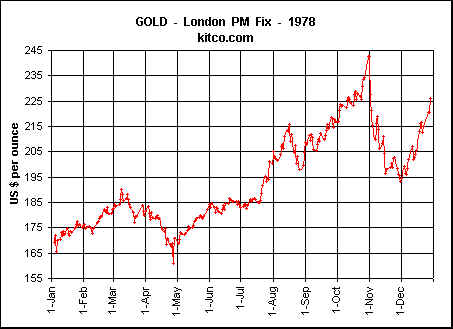
Gold had two big advances in 1977. They were soon followed by
the biggest
DJI declines: July to October and November to March 1978.
===========================================================================
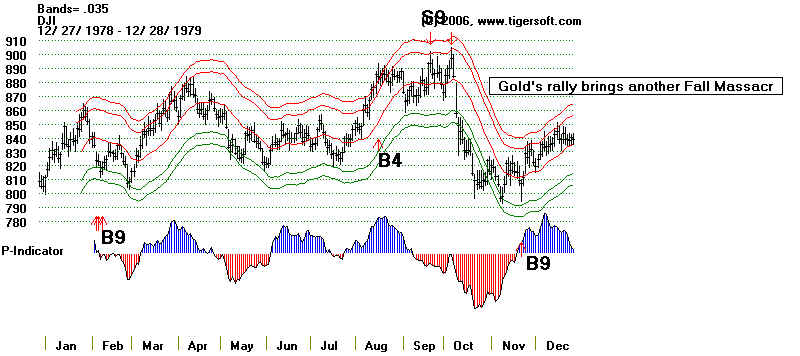
Gold's steep advance after July 1978 led directly to the October 1987 market
massacre when the
Fed boosted the Discount Rate.
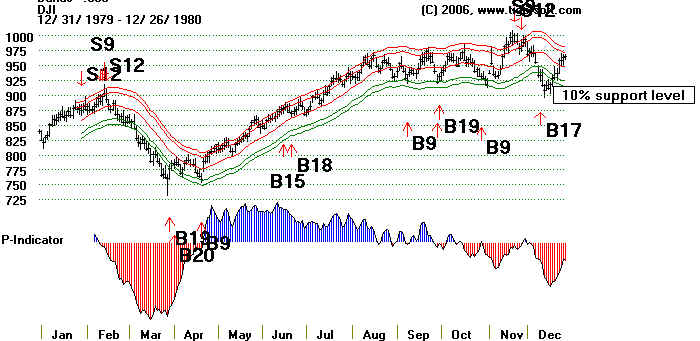
The steep rise in Gold after June 1979 served as warnings for the market sell-offs
in the Fall of
1979 and in March 1980.
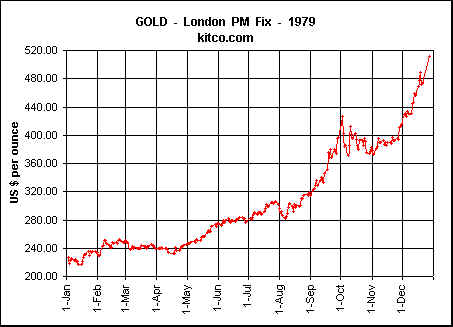
DJI - 1979
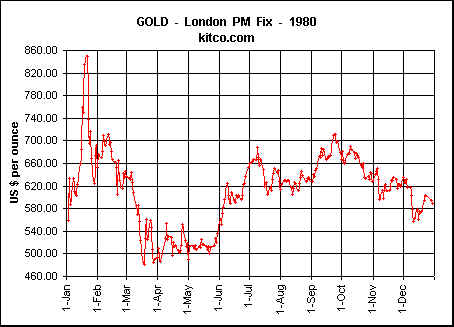
DJI -1980
Why Does Gold Often Move against The General Market.
A sharp rise in gold may be a sign
of rising international tensions, rocketing oil prices, a
falling Dollar and rapidly
advancing commodity prices. The Federal Reserve usually raises interest
rates when inflationary signs
appear and that sends the market reeling. Many economists
feel that inflation is better
defined by the falling purchasing power of the Dollar than the US
government's distortion of
inflation, the CPI. See my Blog of November 19,
2007.
Since Gold moves opposite to the
Dollar very often, it predicts inflation better than the
Government's closely watched CPI.
http://www.financialpost.com/scripts/story.html?id=2f254b6d-c441-48ad-b283-8de41c0a4251&k=98415
Newmont rises of more than 25% in five months or less are distinctly
bearish for the general market.
Stay Tuned
Note - I wish to thank James Dines for getting me to think about the
relationship
between gold and stock prices.
I have to say I have found most of his political views
startlingly retrograde and his advocacy of
nuclear power a direct insult to what I had
learned about the dangers of
low-level ioninzing radiation from doing research in
the 1970's in New Mexico.
The Federal Government, for example, and Tbe Bureau
of Mines would not release
epidemological data showing how deadly uranium minimg
was to uranium miners in
Grants, New Mexico and those down-wind, as far away
as Albuquerque. This
will make a good topic for a later Blog. Now the truth is coming
out. See http://www.ratical.org/radiation/CNR/RIC/NEJM.html
.
http://www.mindfully.org/Nucs/About-Low-Level-Radiation.htm
http://www.ccnr.org/nfb_uranium_biblio.html
http://web.uccs.edu/amilton/student/waste.html
http://www.berkeley.edu/news/media/releases/2007/09/04_GofmanObit.shtml