 TigerSoft and Peerless Daily Hotline
  3/22/2010
ON
TUESDAY NIGHT - THERE WILL BE A NEW HOTLINE PAGE
Look for an email from us on the 22nd to give you the new address.
Important Notice:
Redistribution of any text or concepts here
is a violation of copyright laws. This is valuable intellectual property.
All violators will be subject to legal action. Please visit www.tigersoft.com Goggle TigerSoft and a technical subject, to get
additional examples and a further discussion of concepts and terms used here.
See also our Books for sale. .
(C) 2009, 2010 William Schmidt,
Ph.D.
===> Order form to Renew On-Line,
"Nightly Peerless/TigerSoft Hotline " ($298)
New
3/11/2010 Tiger
Weekly Buy B12s on All Stocks, ETFs, Commodities.
3/1/2010 - Many Bubble Stocks
Are Going Higher.
2/20/2010 - Watch The Pros To Catch
The Tops in "Bubble" Stocks.
Market
Tops Seem To Follow Their Break-Downs
 Overnight
Market Action:
Overnight
Market Action:

Bloomberg
Futures around the world before the US Markets open.
24-hour Spot Chart - Gold
24-hour Spot
Chart - Silver Dollar and Currencies
5-day DJI Chart - 3/22/2010 - DJIA could not make a
new
high.
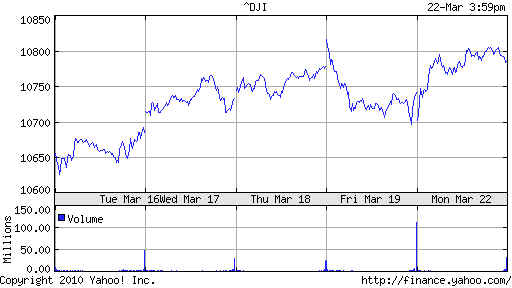
Daily NYSE 148 New Highs - NYSE 4 New Lows Bullish
Daily NASDAQ 121 new
highs - NASDAQ 5 new lows.
So long as the ratio of new highs to
new lows is 10:1, it's hard to predict a significant
decline. New lows exceeding new highs within 4 days of making a new DJI high,
on the other hand is very bearish.
------------------------------------------- ORGANIZATION HERE:
------------------------------------------------------
1. Hotline Summary
2. Charts of DJIA and DIA
3. Text and Graphs for Additional Nightly HOTLINE
4. Charts of QQQQ and SPY
5. Earlier Hotlines - Present - 2/13/2010 on this page.
===================================================================================
3/22/2010 Buy
B17.
The DJI's upturn today has taken it back to Friday's highs.
The market just does not want to
decline, to the dismay of most of the pundits. The
steep uptrend of the CLosing
Power was slightly violated for the key general market
ETFs on Friday, but today the DJI
opened at its low and closed at its highs. With both
the Opening and CLosing Power above
their rising 21-day mvg.avgs., we should
understand that we may still be in
a market phase that can bring a rapid ascent.
I explained yesterday why I did not
think a big decline is likely. Our Stocks' Hotline
continues ot hold the high
Accumulation stocks.
Today's rally shows that high-performance money is still pouring aggressively
into some of the hottest high
Accumulation THIN stocks. They have rising Opening
and CLosing Powers. Provided you
trade the short-term Closing Power trends,
they can be a lot of fun.
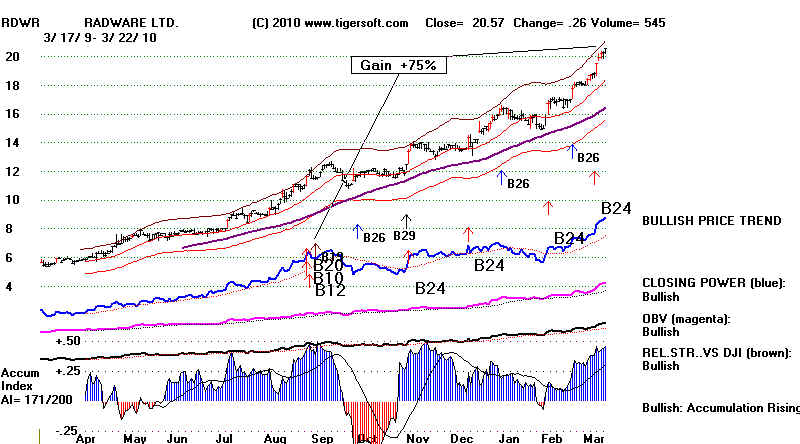
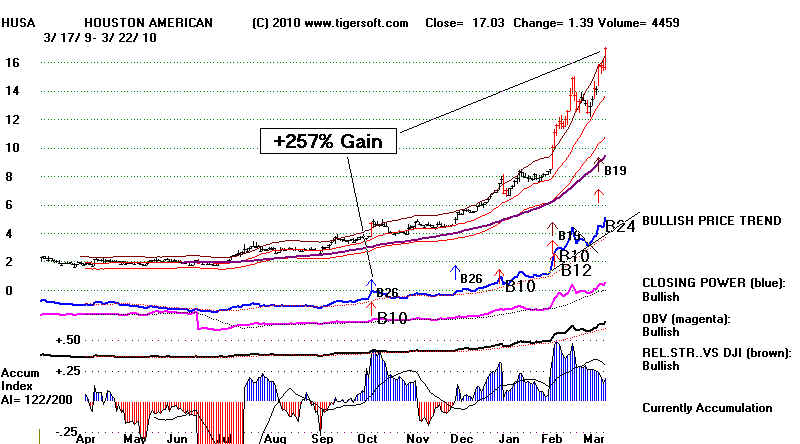
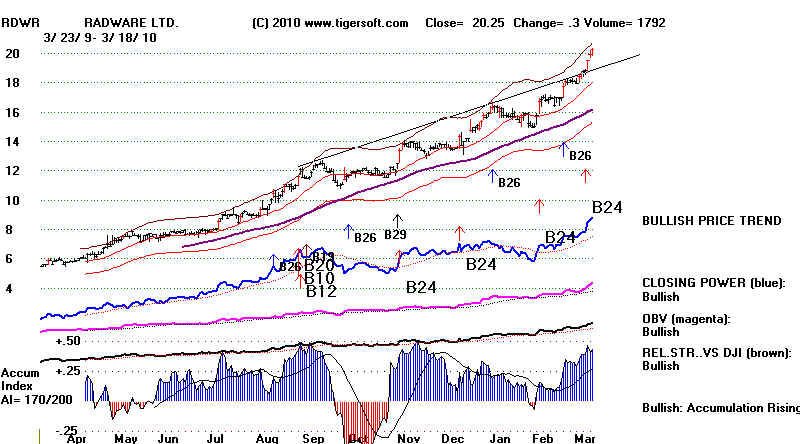
HUSA's chart shows that RDWR's much more modest ascent
may still have more to go. More
below the charts....
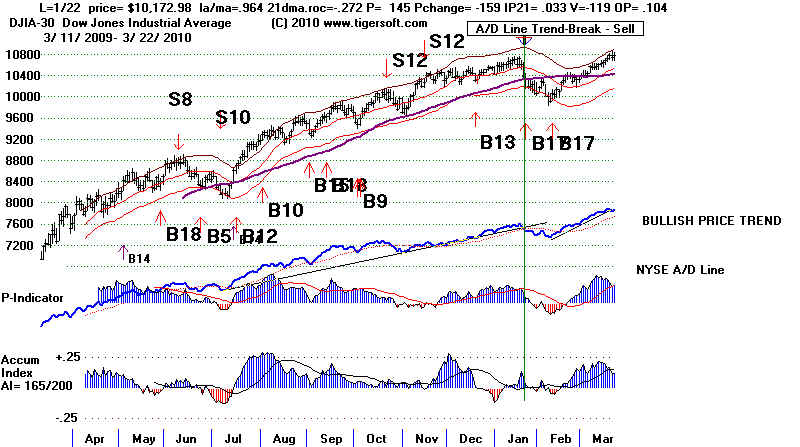
--------- SUPERIMPOSED PEERLESS SIGNALS ON DJIA ---------
3/22/2010 10785.89 la/ma= 1.024
21dma-roc = .434 P= +523
Pch= +19 IP21= .121 V = 66 Opct = .373
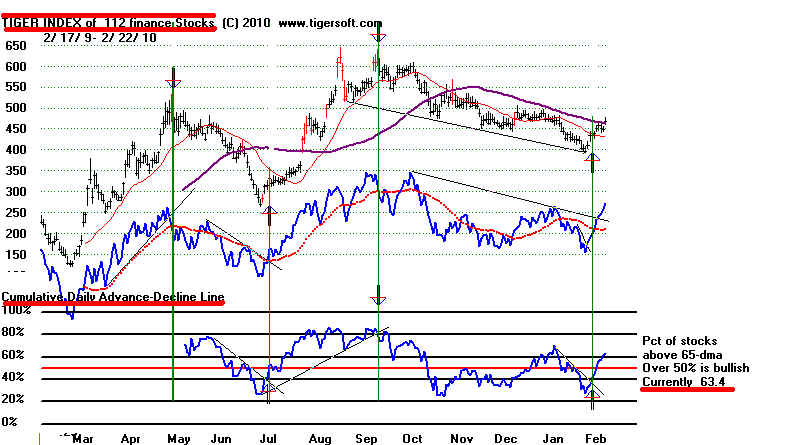
Peerless remains on a BUY, but you can see below that the
NYSE A/D Line uptrend
may eaily be broken this
week. Breaks in this line for the past year have only produced
shallow retreats.
_________________________________________________________________
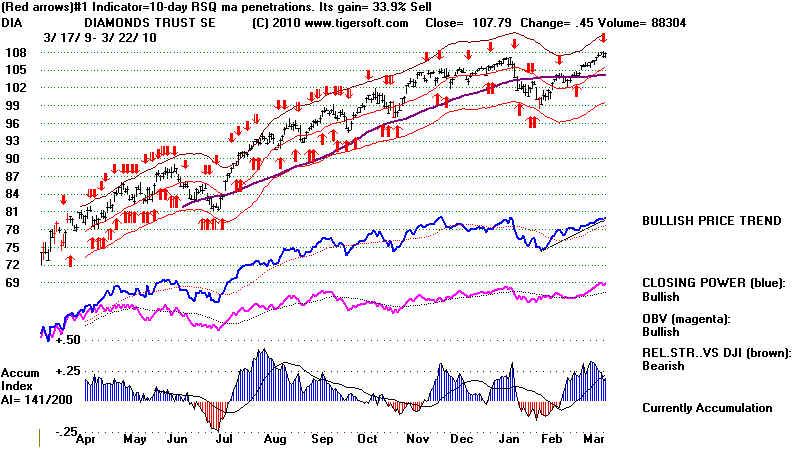
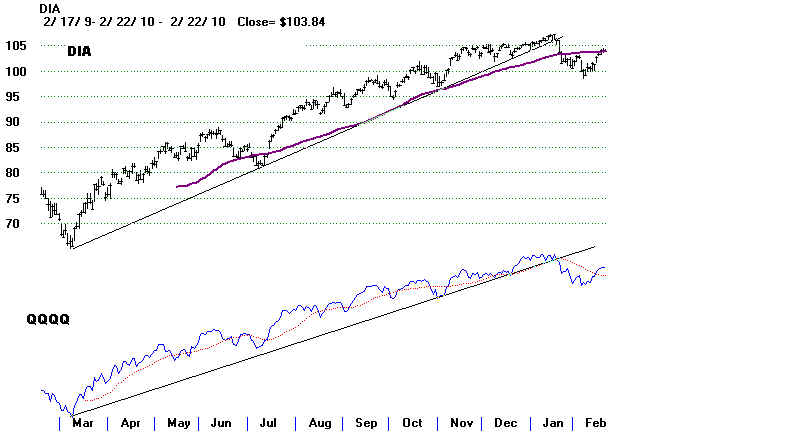
DIA - ETF for DJIA - RED SELL
Yesterday's Closing Power Uptrend-Break was very slightly violated.
Bullishly both Opening & CLosing Power are
rising.
We see a red SELL here based on its weakening
versus what
it purports to represent. That means this derivative vehicle is
being aggressively sold and sold short while the DJI-30 stocks
are being bought. The cause of the Sell is the 10-day ma of
the Relative Strength Quotient . Surprisingly, this signal has gained
34.5% for the past year after allowing for commissions on $10,000 trades
and using the next day's opening to make the trades. True, there are
a lot of 47 trades in the last 11 months. But the biggest paper loss is only 3.6%.
There have been 47 winning trades and 40 losing trades. Doing
no short selling would have meant 25 winning trades and only
18 losses. (Tiger Users: Chart
+ Operations + Ehat Happens to
$10,000 + Yes)
_________________________________________________________________
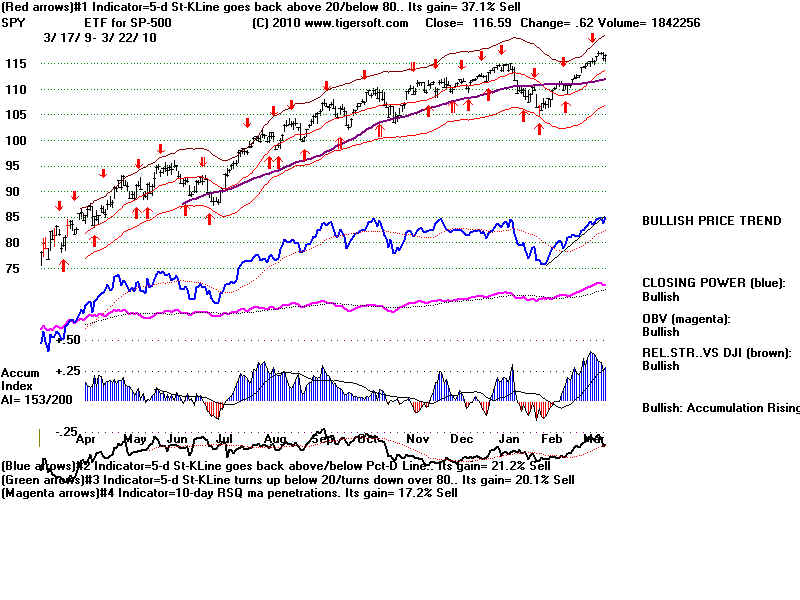
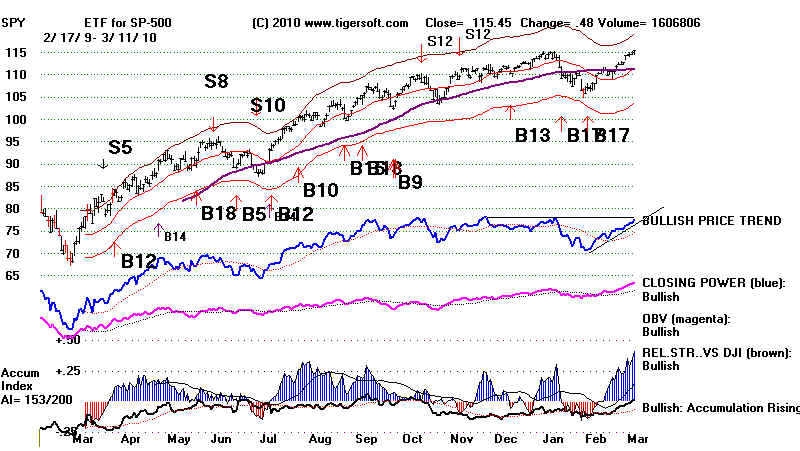
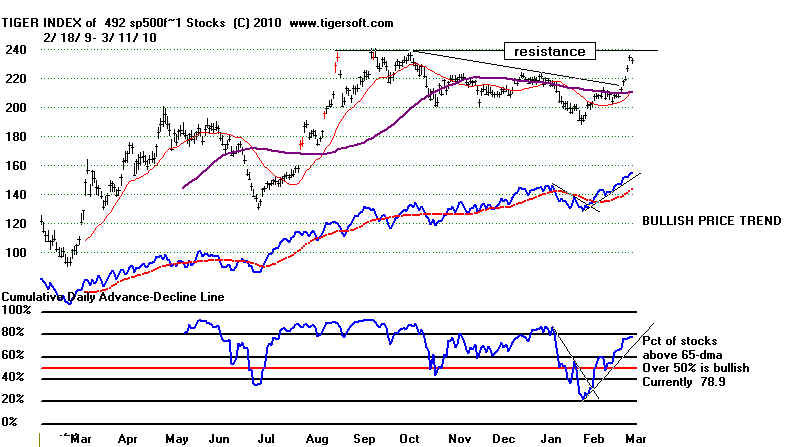
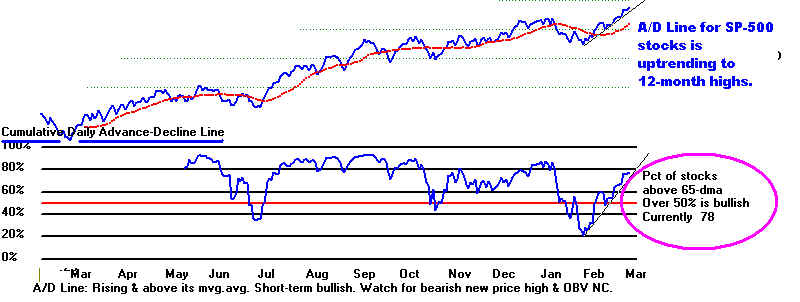
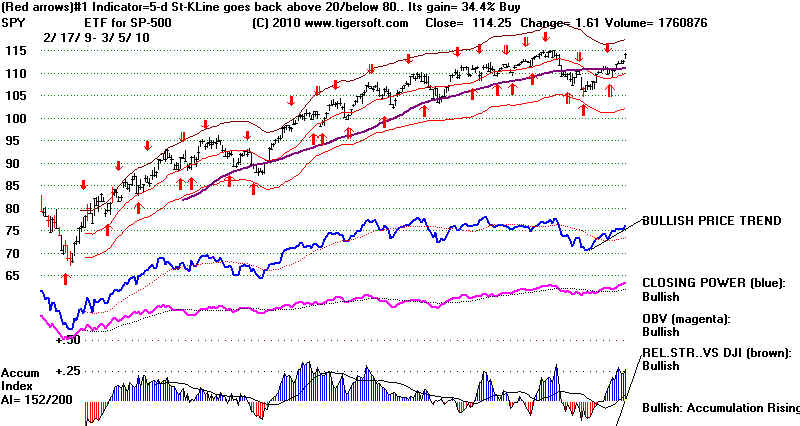
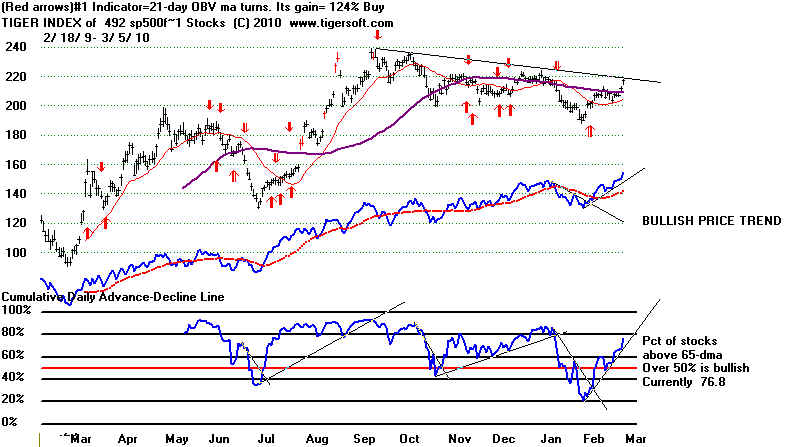
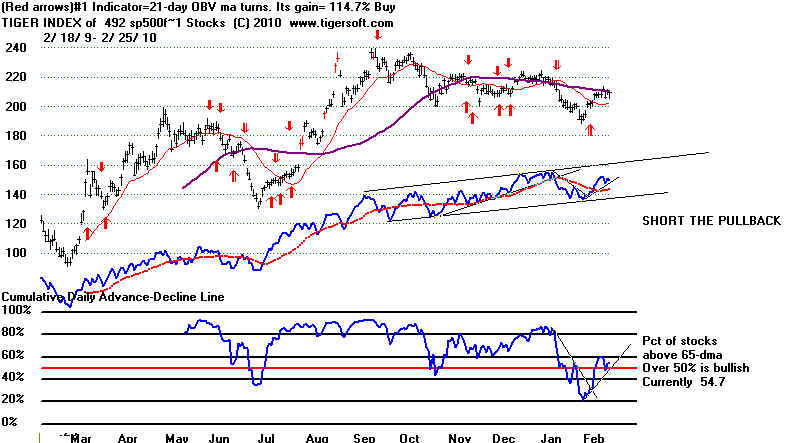
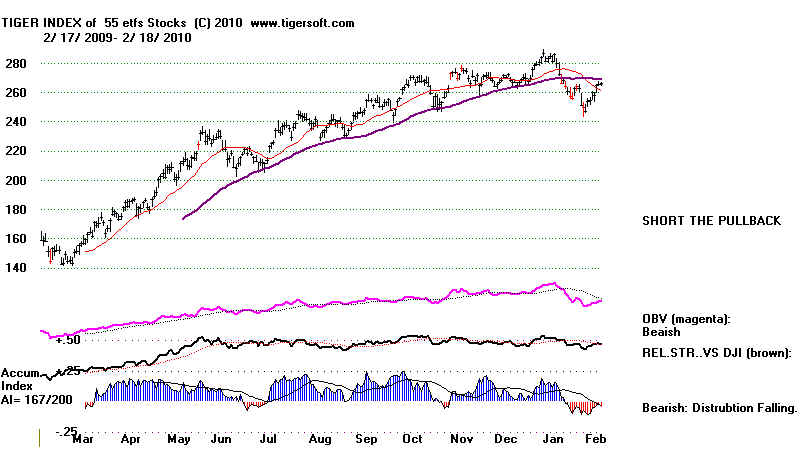
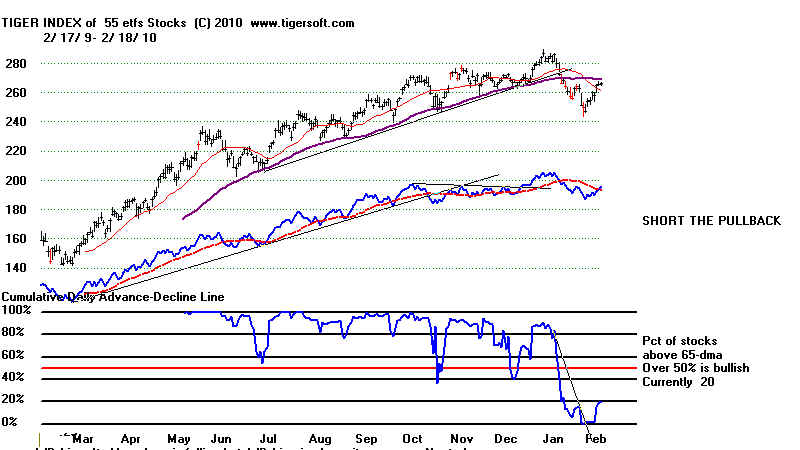
TIGER INDEX OF SP-500 and SPY
(Red sell and bearish break in Closing Power
uptrend.)
SP-500-A/D Line is in uptrend. But another down-day would break the uptrend,
83% of the SP-500 stocks are above their 65-dma. That uptrend has been violated.
SPY - SHORT-TERM BEARISH - red sell and bearish break in Closing
Power uptrend.
=====================================================================
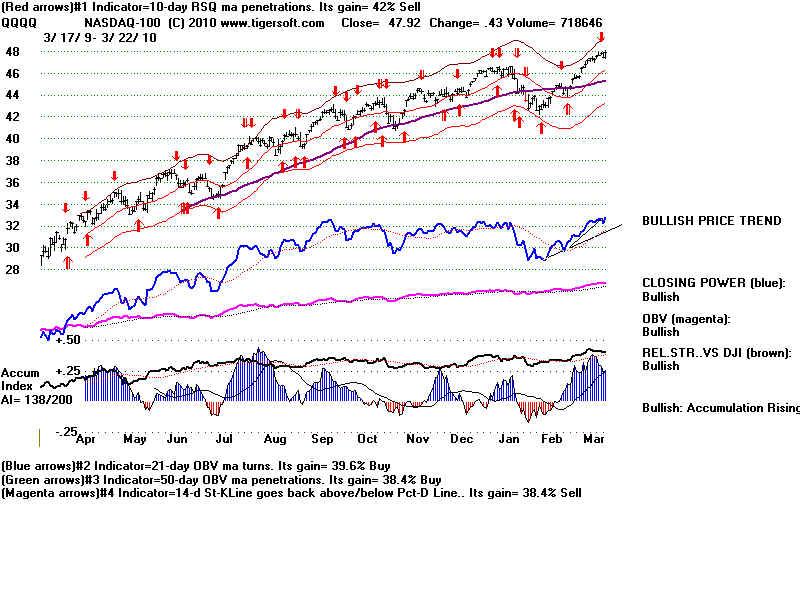
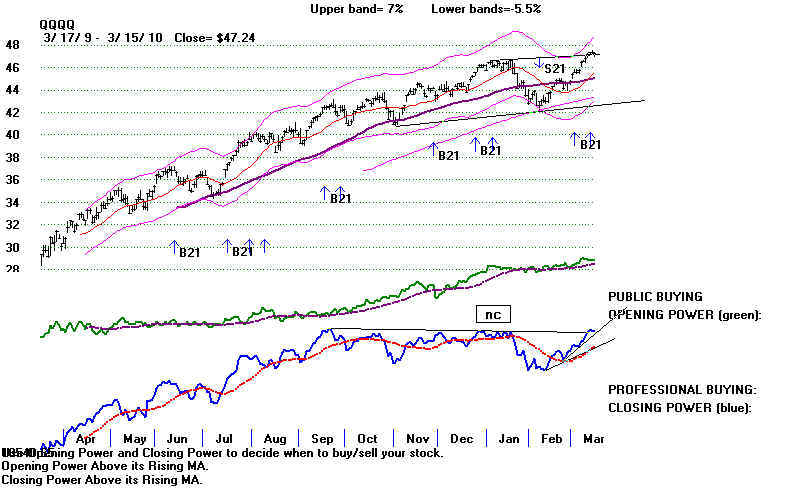
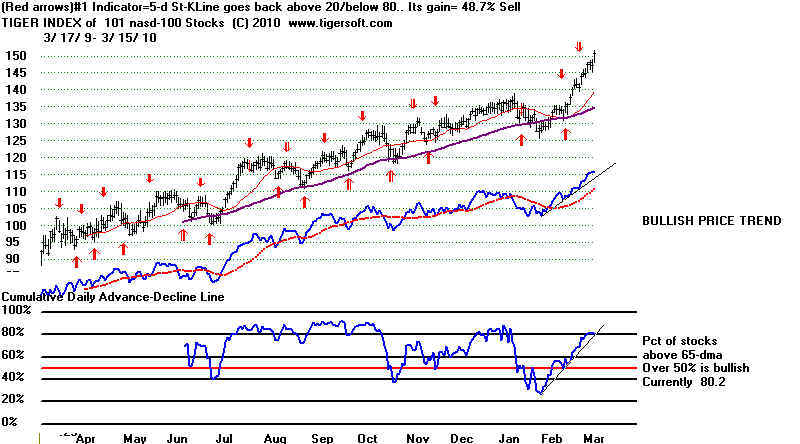
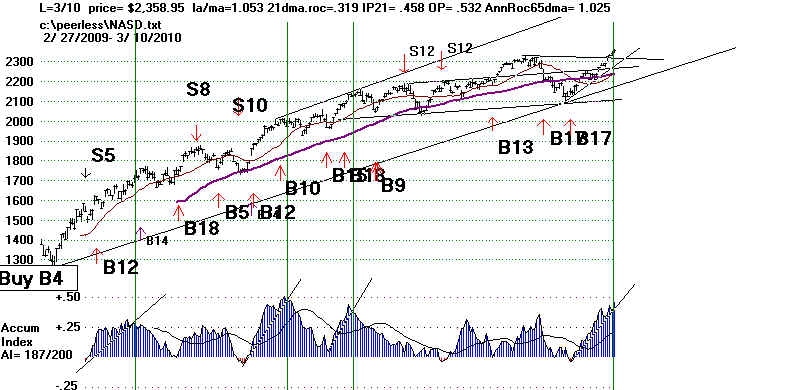
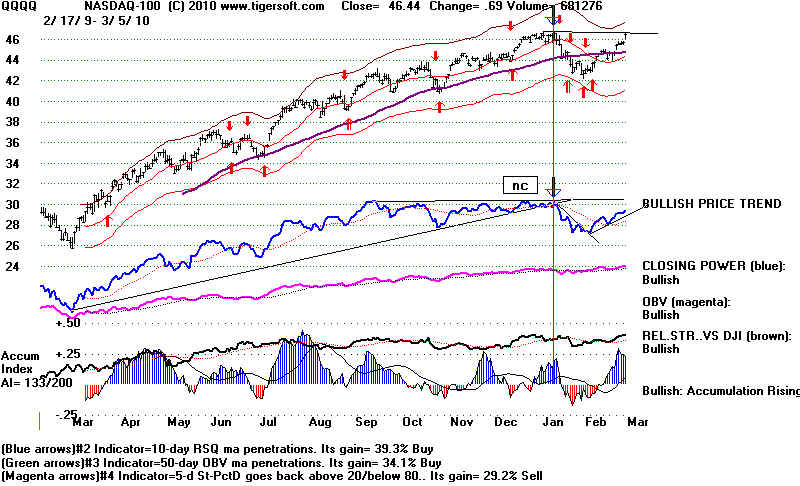
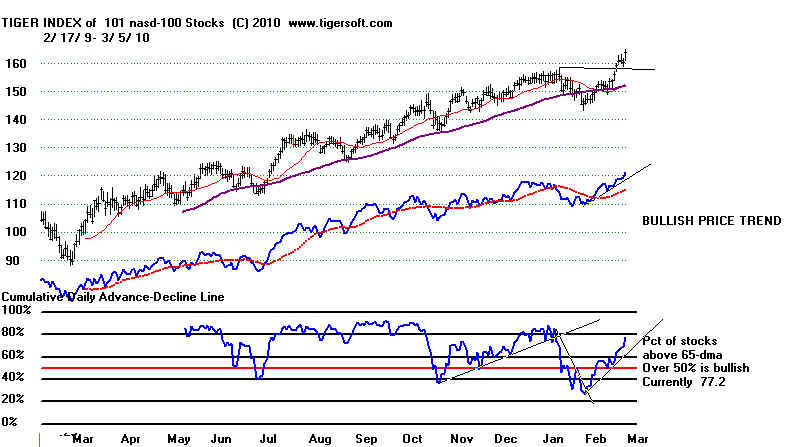
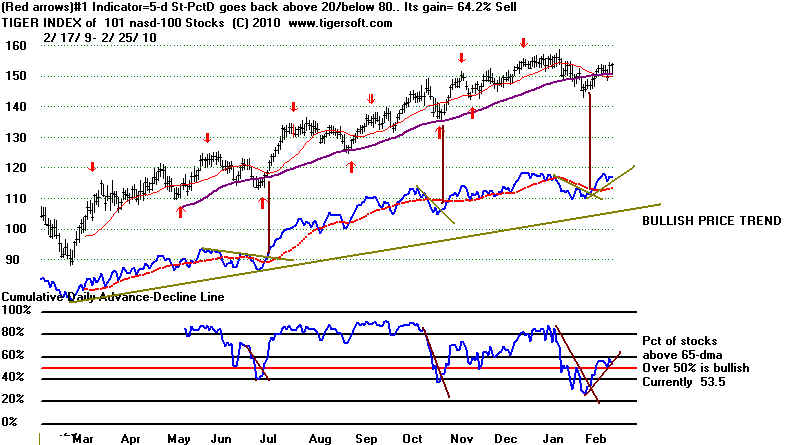
TIGER QQQQ and INDEX OF NASDAQ-100
QQQQ - BEARISH - Red sell and bearish
break in Closing Power
uptrend.
SP-500-A/D Line is in uptrend.
82% of the SP-500 stocks are above their 65-dma.
That uptrend has NOT been violated.
Both Opening and Closing Powers are rising. This suggests we are in
a vertical ascent phase.
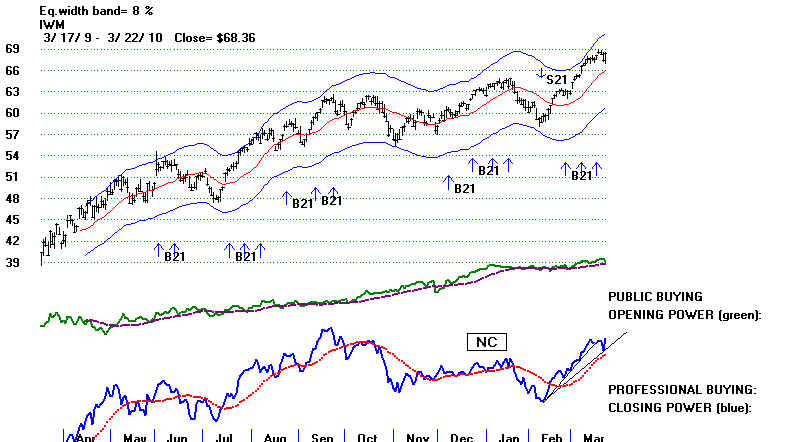
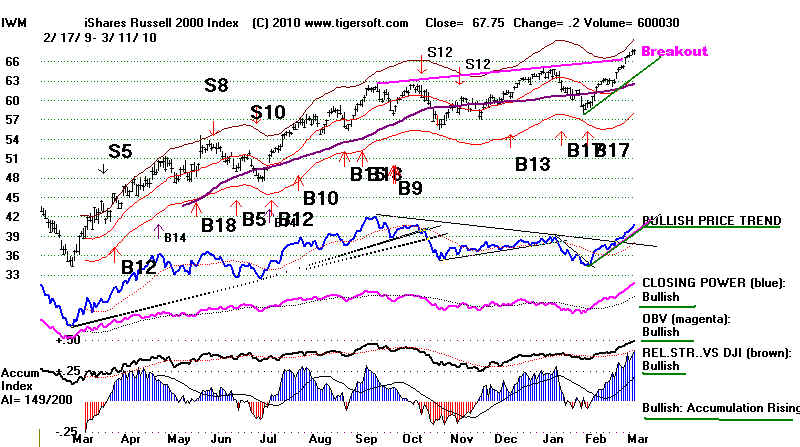
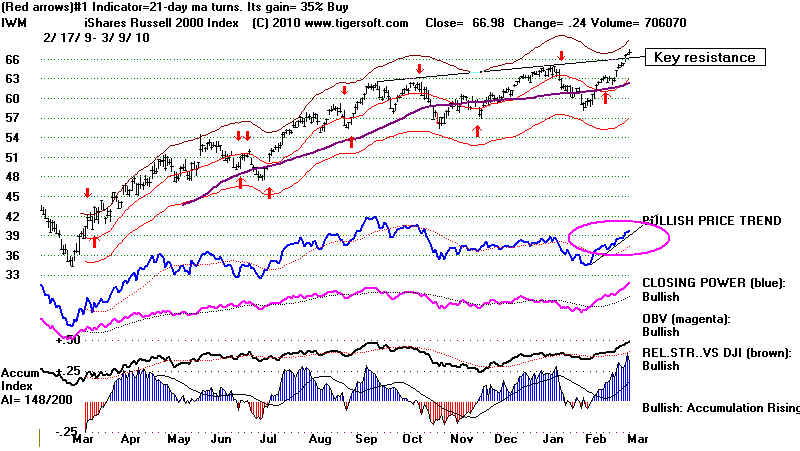
=========== RUSSELL-2000 ===================
IWM: Both Opening and CLosing
Power are rising (above their 21(dma) The Closing Power
uptrend in still rising.
3/22/2010 Buy B17. The DJI's upturn today has taken it back
to Friday's highs.
The market just does not want to
decline, to the dismay of most of the pundits. The
steep uptrend of the CLosing
Power was slightly violated for the key general market
ETFs on Friday, but today the DJI
opened at its low and closed at its highs. With both
the Opening and CLosing Power above
their rising 21-day mvg.avgs., we should
understand that we may still be in
a market phase that can bring a rapid ascent.
I explained yesterday why I did not
think a big decline is likely. Our Stocks' Hotline
continues ot hold the high
Accumulation stocks.
Today's rally shows that high-performance money is still pouring aggressively
into some of the hottest high
Accumulation THIN stocks. They have rising Opening
and CLosing Powers. Provided you
trade the short-term Closing Power trends,
they can be a lot of fun.
HUSA's chart shows that RDWR's much more modest ascent
may still have more to go.
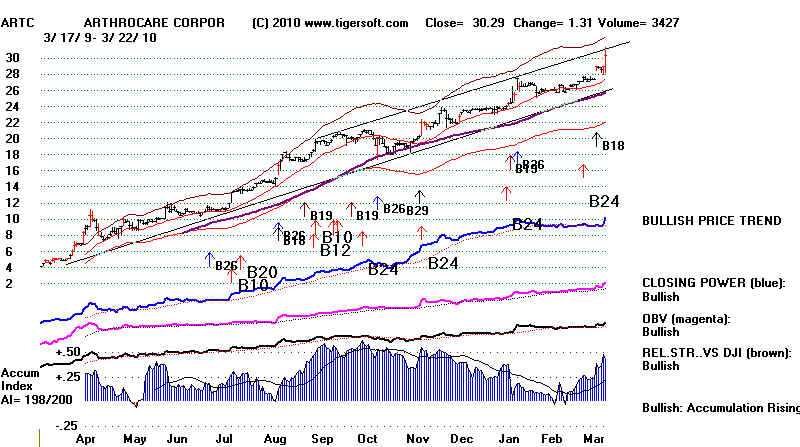
Buying
stocks with very high Accumulation, measured horizontally
as "AI/200=198" and
horizontally as ,45, are time-proven ways to make money,
though patience is often
needed because often the stocks are still under big-
money Accumulation. In
the case below, the stock now shows rising Opening (Public)
and Closing (Power). So
it has likely entered a more vertical mark-up phase.
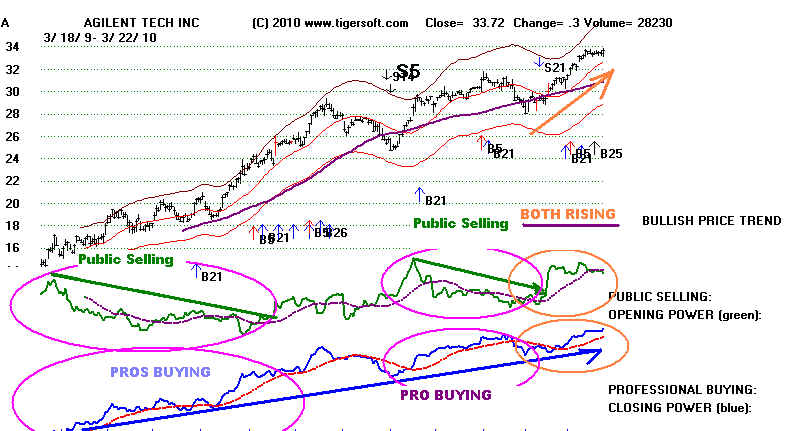
If you take a sample of high Accumulation stocks that are out-performing
the market
substantially, you will see a reliable pattern. In the beginning of the advance
the Tiger chart will
show public skepticism (a decling Opening Power) and
professional buying (a
rising Opening Power). After that, there is apt to be a
middle-phase where the
stock pulls back or consolidates and the public is
still not much
interested in the stock. The third phase is a vertical take-off.
In this phase, the
public buys aggressively along with Professionals. In the
final phase, the stock
starts to fall and Professionals sell to the Public. In our
charts, Opening Power
represents Public Buying or Selling and Closing Power
signifies Professional
sentiment. Agilent (shown below) has probably entered the
vertical phase. It
shows high Accumulation. I would expect it to breakout and
run. Agilent
looks like a good long trade now.
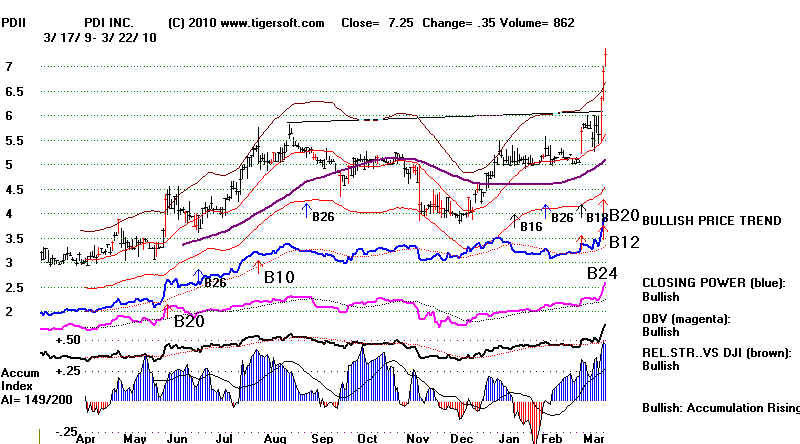
Usually, I prefer to buy B12s and B24s when they breakout above flat resistance
and show red high
volume on the breakout. But PDII has already jumped a point.
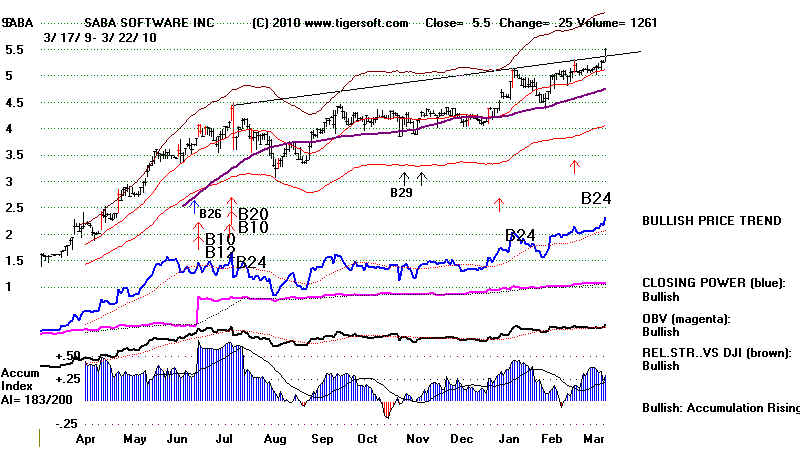
Looking elsewhere, SABA
also looks like it has been released by its resistance
and will move higher.
===============================================================================
3/19/2010 Buy B17, but we see breaks in DIA, QQQQ and SPY CLosing Powers
and they also Red Sells. Look
for a decline of 3% to the rising 21-day ma of the DJI.
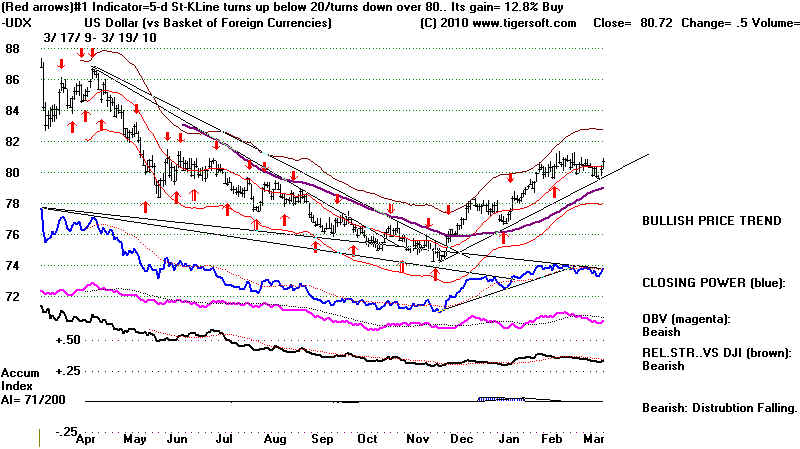
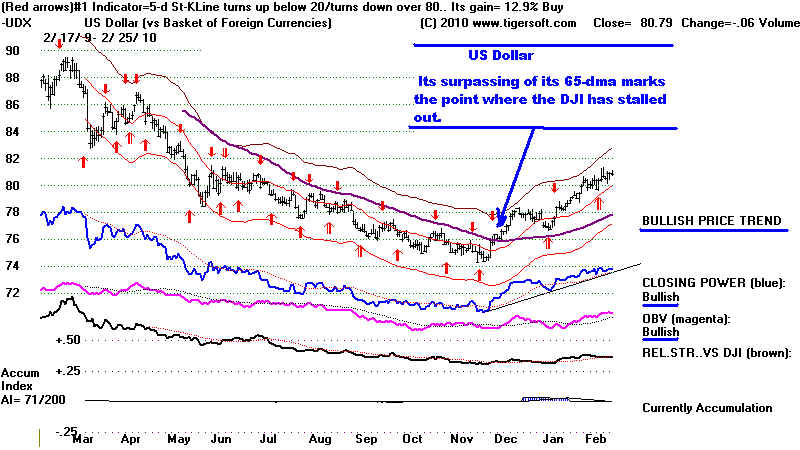
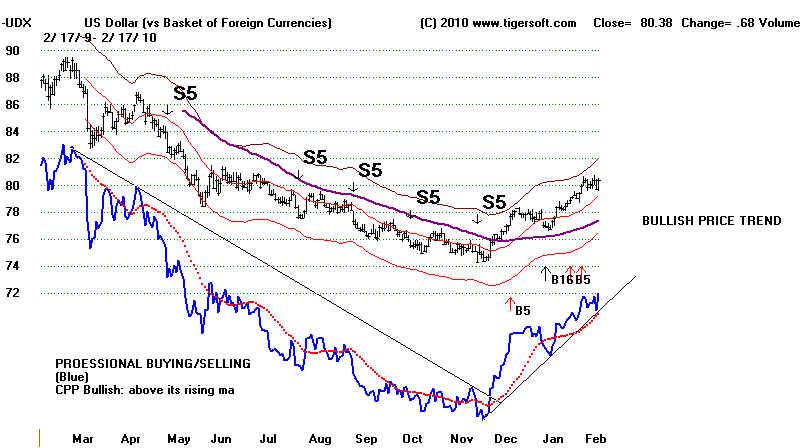
The Dollar has gotten strong again.
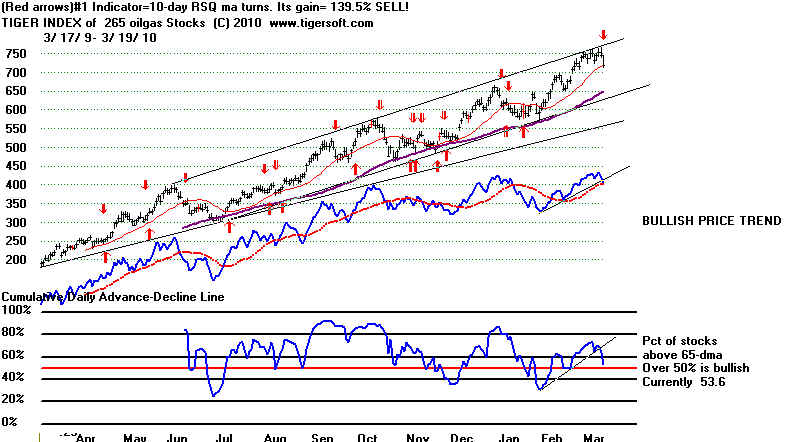
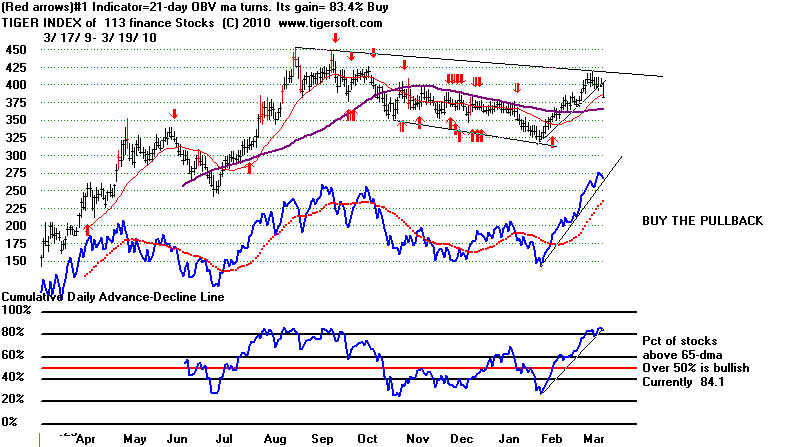
Finance, Oil and silver stocks are showing weakness.
Foreign ETF did not make a new high
on this rally. That poses technical problems for
them. I still believe any
decline will be limited. For one thing, big Sell-offs without a
Peerless Sell are very rare.
Secondly, the public still distrusts the rally. Usually, the
market does not top out until there
is public participation. Thirdly, t he NASDAQ shows
high levels of Accumulation most
reminiscent of 1991-1992, which led to much high
prices in the years that followed
then. (Perhaps, a new technology is on the horizon
just as the internet was back then.
If so, I don't see it.). Lastly, the Administration,
the Fed and the biggest Wall Street
banks have a very cozy relationship now, as
banks are allowed to borrow money
from the Fed and speculate with legal impunity.
I can't imagine that the FED and
the Treasury will stop what they are doing, at least until
after April 15th. So,
continue to hold the highest Accumulation stocks, but take
profits in the index ETFs.
================= US DOLLAR
=================
================= FINANCE
STOCKS =================
===================================================================================
OLDER HOTLINES
===================================================================================
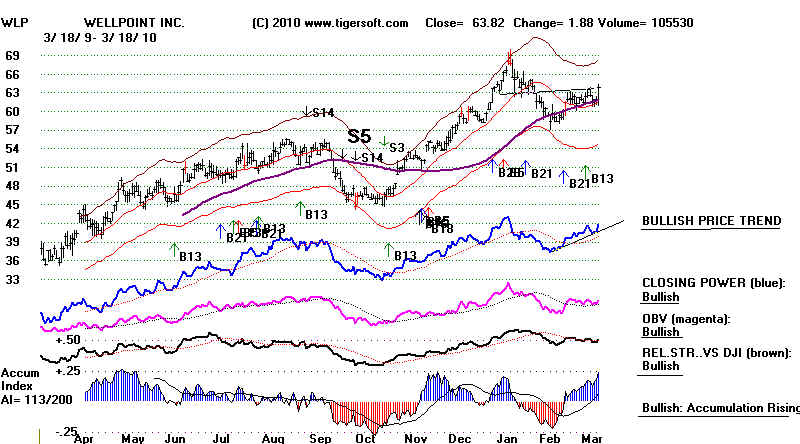
3/18/2010
We are still on a Peerless Buy B17. Look for still higher Prices.
I doubt
if passage
of the Health Insurance "Reform" Bill will have any effect on
the market,
except to send stocks like WLP higher, as millions more
Americans
will be required to buy health insurance and the limits on
what WLP
and others charge will almost certainly not be effectively limited.
Today the
DJI rallied +46 even though there were 500 more down than up on the
NYSE.
If there are many more bearish divergences like today's, we may have
a problem.
But, the technical indicators still look very positive.
The Closing
Power uptrend lines still have not been violated. There
is intense
pressure on short-sellers now and those that have missed the rally/
These folks
were either looking for a deeper pullback or they consider the
market now
a dangerous bubble about to break. While I agree that the FED
seems to
have NOT learned a thing from the excessive leveraging they encouraged
that proved
so dangerous in the housing and oil bubbles, the sad truth is
the market
is manic and speculative bubbles can get a lot bigger than we might
reasonably
expect. So, without a Peerless Sell we cannot expect a decline of
more than
2.7%, back to the rising 21-day, even if the steep CLosing Power
uptrendlines are violated. A mild retreat from the upper band would normally
be
what we
would expect. But the levels of Accumulation on many secondary stocks
and the
NASDAQ and IWM are so high, a price hesistation seems as much of
a decline
we will see in the two weeks ahead. After all, the government wants
us to have
plenty of money to pay our taxes on April 15.
High and
intense levels of Accumulation are normally quite bullish. They show
a strong
tendency for buyers to come in during any intra-day weakness and
push prices
back up to their day's highs. When stocks show an Accumulation
reading
over +.45 and the stock is in an uptrend, we consider insiders to be actively
buying the
stock. They are a substantial cushion. Shares are uually in a
"strong"
hands.
So, a deeper decline does not unfold, evem if there is bad news. That's
the reason
with stocks, the next few major Tiger Buys under these circumstances
usually
produce excellent gains. See the study of the best performing stocks I just
did for the
last 3 months.
Using TigerSoft's
Unique Measures of "Insider Buying" To Spot This Year's Explosive Super
Stocks.
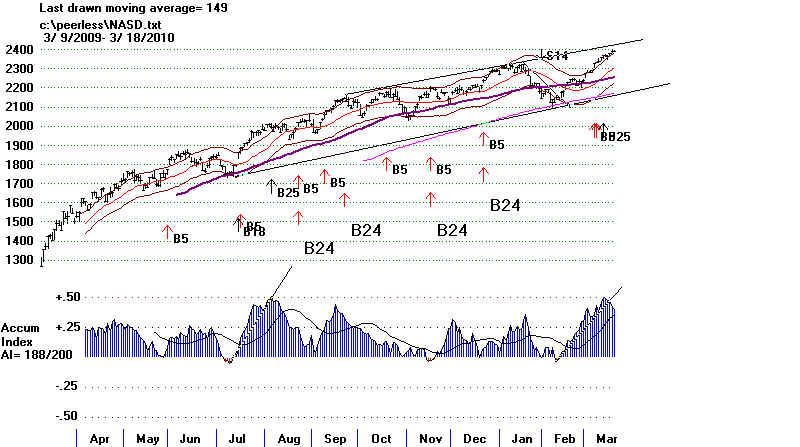
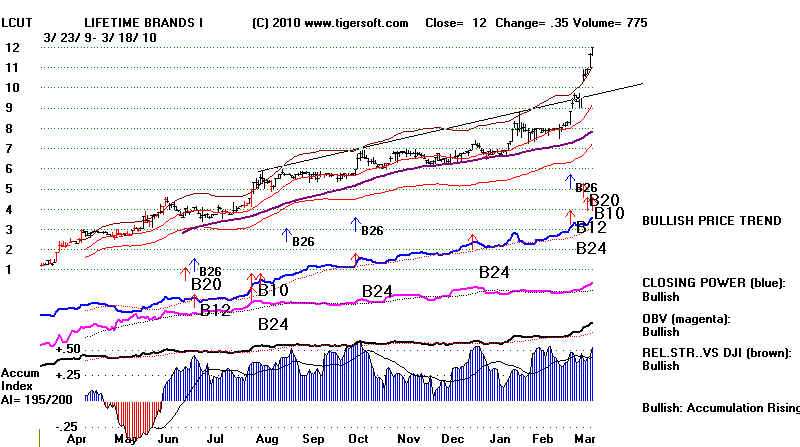
See
the chart of the NASDAQ now and compare both its price and Accumulation
Index levels
with
LCUT. I think there's a very good chance that the NASDAQ will be
able to surpass the
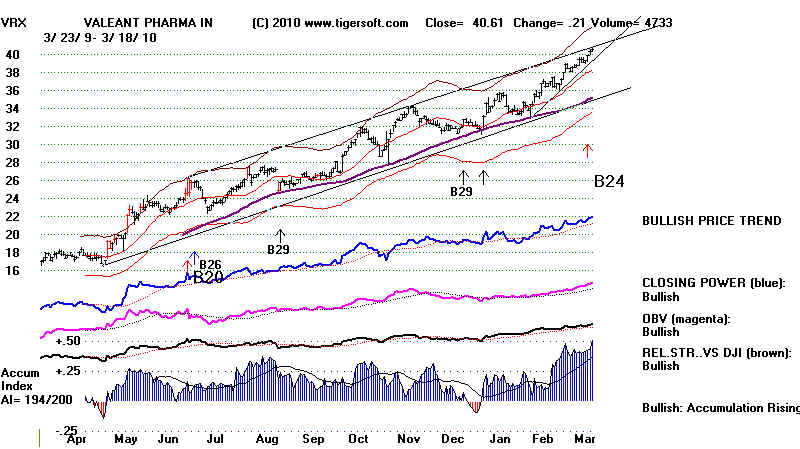
resistance line at the top of its channel and move up like LCUT has done. Watch to
see if VRX
can
make a similar channel breakout past 41. Typcially, channel breakouts set up price
targets points
which
are as far above the top of the channel as the price channel is wide. You can see
from RDWR
how
prices keep rising after the upper channel is exceeded.
----------------------------------------------------------------- NASDAQ
---------------------------------------------------------------------------------
----------------------------------------------------------------- LCUT
---------------------------------------------------------------------------------
------------------------------------------------------------- VRX
---------------------------------------------------------------
----------------------------------------------------- RDWR
-----------------------------------------------------------------
=====================================================================
3/17/2010 The uptrend stayed
firmly up today. We have no Peerless Sell. Trust the
uptrending breadth and Closing Power Lines. The Fed, the Administration and
professional traders all seem to be in agreement. They want the market to keep
on
rallying. Many believe this is an artifical and unsustainable rally, one that has
been
manipulated by a secret consortium made up of the Fed and the biggest banks.
That the
Fed has not required banks to make loans with all the cheap money the Fed
is
providing, certainly supports a conspiracy theory here. So, far sticking with
the
rally has paid off. I see no reason to change that approach at this time
=====================================================================================
3/16/2010 The uptrend strengthened today. We have no Peerless Sell.
Trust the
uptrending
breadth and Closing Power Lines. The Fed, the Administration and
professional traders all seem to be in agreement. They want the market to keep
on
rallying.
3/16/2010 There are lots of stocks making what are called flag formation
breakouts. Often this means a buying climax. But for now, this is
bullish.
BIIB (Biogen - 59.73
BMO (Bank of Montreal) 60.15
CELG (Celgene) 62.82
DFT (Dupont Fabrics) 22.84
HNZ (Heinz - 47.32),
TSCO 60.28 , ATLS (35.14)
I've never recommended a stock under $2 before. I am going to recommend
buying a gold/silver stock tonight under $1.. BULM - a Mining Stock
showing lots
of Accumulation and had broken its downtrendline on high volume. I would
think that the Fed's low interest rates will be a big boost to precious metal stock
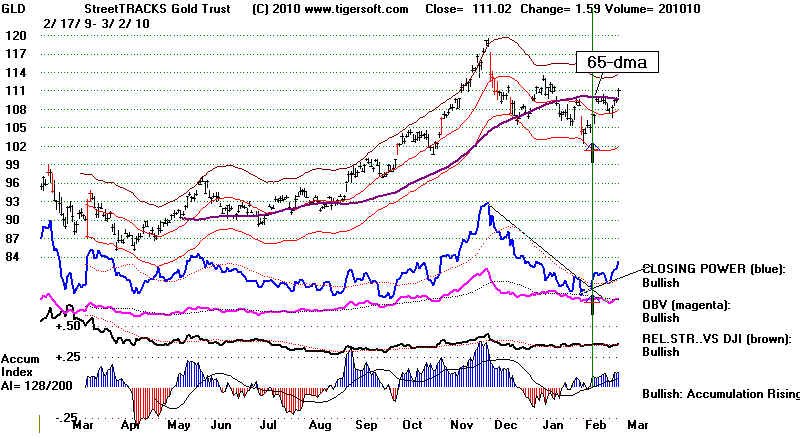
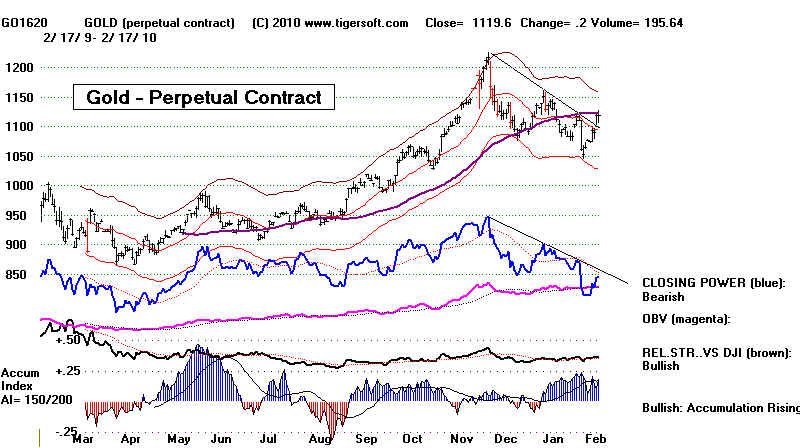
speculation. Gold is up $6 as I write this. It did rally back above its 65-dma
today.
This is not a stock to buy too many shares of at once. The total value of all the
shares traded was less than $90,000 today. The company has less than 10 employees,
besides the promoters of the stock.
 |
=====================================================================
3/15/2010 Buy B17
Operative. The NASDAQ Remains Very Strong.
Such A Trend Is Not Easily Stopped without A
Peerless Sell.
It was bearish today that the DJI rose 18 and
yet there were nearly 500 more down than up
on the NYSE. Seasonality since 1965 has been neutral over the next week following
the
Ides of March, but turns bullish again by April 15. The DJI has risen 75% of the
time between
March 15th and April 15th and 65% of the time it is higher on May 15th. The average
DJI gains
are 1.5% and 2.3% for these two periods, respectively. Good breadth has been
the hallmark
of the long advance. Watch to see if breadth continues to deteriorate.
With both the Opening and CLosing Powers rising, as they are now, we want to watch
for breaks in the rising Closing Power Lines. That would warn us of a DJI decline
back probably
to the rising 21-day ma. Without a Peerless Sell, more of a decline than that cannot
be predicted.
I would expect the NASDAQ, tech stocks and many low priced stocks with lots of
Accumulation
to continue to push higher, though look at longer term charts to see if they have reached
areas where sell orders are apt to be concentrated.
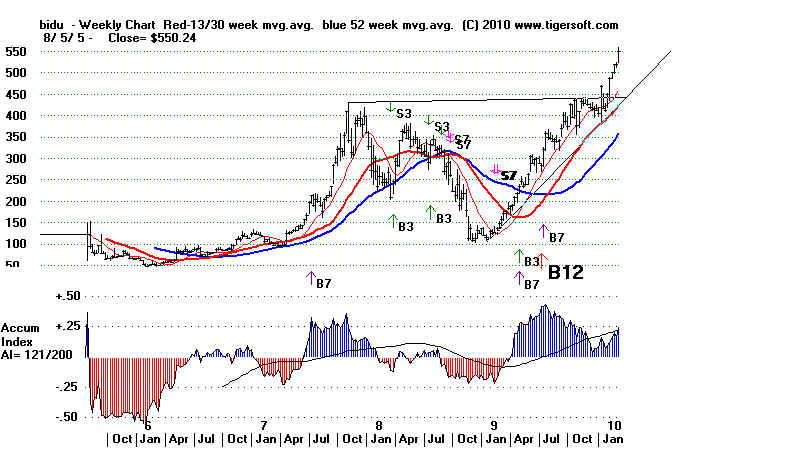
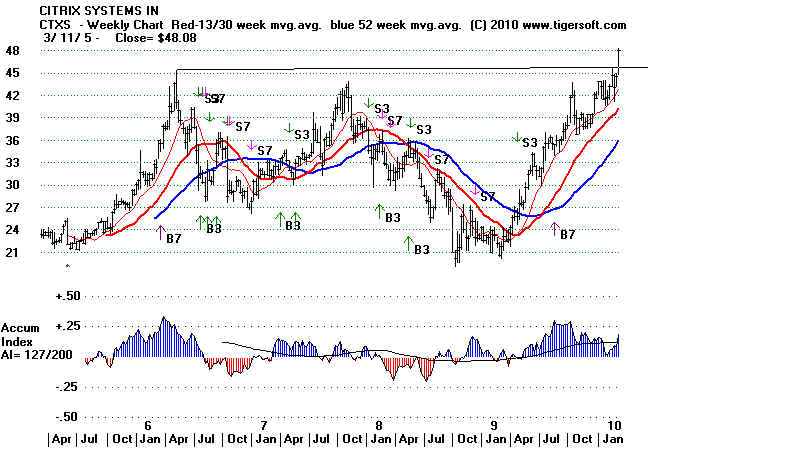
The Importance of Stock Five-Year
Highs.
Those tech stocks like BIDU and CTXS that can make 5-year highs are apt to rise much
more easily. Below are the 5-year Tiger charts of BIDU and CTXS, both of which rose
sharply today.
5-year highs are currently flagged by the Tiger programs for the SP-500 and NASDAQ-100
stocks. We will start flagging the 5-year highs and BuyB12s for all the stocks
making new 12-month
highs each night and providing their weekly data.
 |
---------------------------------------------------
QQQQ -----------------------------------------------------------
Both Opening and CLosing Power are
rising.
QQQQ-A/D Line is in uptrend.
80% of QQQQ stocks are above their 65-dma
|
===================================================================
3/12/2010 Buy B17
Operative. The NASDAQ and Russell-2000 Are Very Strong.
Such A Trend Is Not Easily Stopped without A
Peerless Sell.
A short-term retreat by the DJI from the upper
band seems likely. But with breadth still very strong
and CLosing Powers still rising, it is hard to see how there can be much of a pullback.
In addition,
the Dollar is weakening. That should boost the market, if the past two year's mostly
inverse relationship
between the market's and Dollar's trend continues. In additon, a very high
proportion of the stocks
that are running show very high Accumulation at the levels we ascribe to "insider
buying", in the
broader sense, meaning those that are insider-informed are confidently buying heavily
now. I also
take it as significant that CLosing Power (representing professionals) is anging up more
steeply
than Opening Power (representing public buying.)
Very high Accumulation has always been a superb predictor of stocks about to move higher.
That has been especially true this past year. Note on the Tiger Data Page, the data for
these high
IP21 (Accumulation Index bulge) stocks has been updated, so yu can work with just these
stocks.
When you do this, notice how many stock making new highs had earlier Buy B25s
(IP21>.45) by
graphing the stocks making new highs and noticing the levels of Accumulation below the
price chart.
Or place the B25s on the screen. Or chart all the historical B25s for the new highs'
stocks downloaded "
from our Tiger Data page (as HOTSTK8 etc.).
In the last 10-days, these strong New High stocks have also had IP21 levels over .45:
ACTG, BIDU, BLKB, BMRN, BRLI, CCNE, COHR, COLM, CSWC, CSWC, CUTR, DLR,
DMRC, DMRC, EPIC, EVBN, EVBN, EW, EXFO, GIVN, HOFT, IBB, ICOC, IFSIA, IRIX,
JNPR, LARK, LCAV, MDCA, NATI, NBN, NENG, NEOG, NEWS, OMCL, OSHC, OTT, PACR,
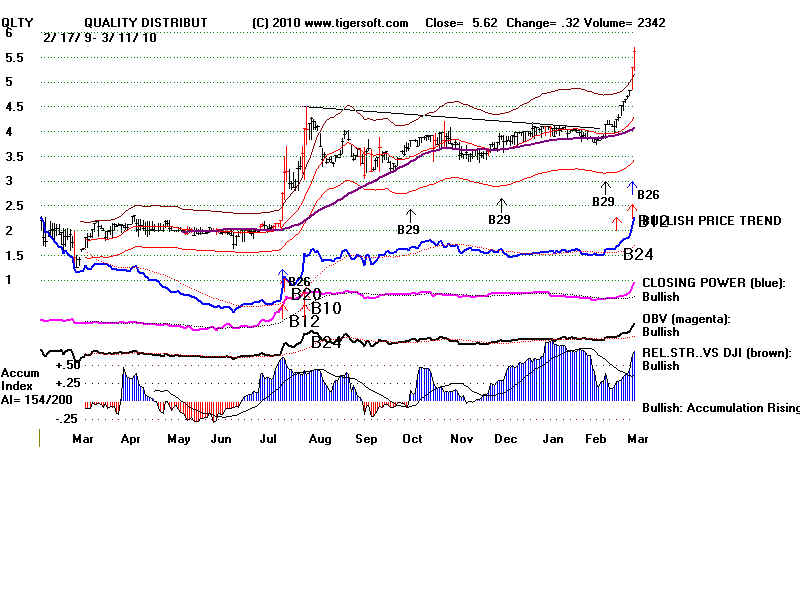
PICO, PRGS, PRTS, PSMT, PSMT, QLTY, QPSA, RCMT, SHLM, SLRC, SUBK,
SYUT. Graph some of these to reinforce the
concept of the value of an IP21 bulge followed by
new highs.
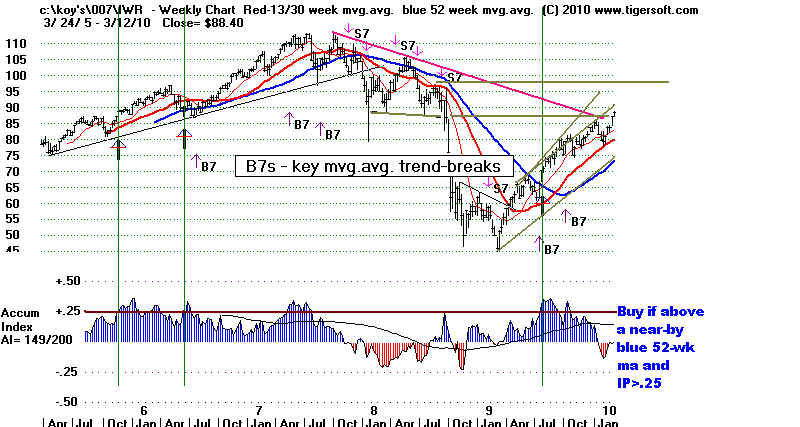
More on Weekly Tiger Buy B12s
The 5-year weekly Tiger chart below of the Russel-Mid-Cap shows
the importance of the
blue 52-week ma and the trend of bright red 30 week ma.
The Weekly Tiger
Accumulation Index below shows positive Accumulation
to the extent the stock
or index closes near the weekly high on high volume.
The new Buy B7s show
below marry these two concepts.
Why Weekly Buy B12s Are
Needed.
In
computing the weekly charts it would be a lot simpler to use any 5-day period.
But I doubt that would be so
significant. That makes it hard to be sure how much
Accumulation a weekly chart
will show by looking at the daily charts. Why would
Accumulation properly
calculated by the week matter? We might hypothesize
that insiders buying a lot of
stock would want to take their positions before a 2-day weekend,
not knowing who might decide
to buy the stock starting the following week. (I credit
this observation to my friend
RC Stanley.) So, we must work on a way to bring in weekly
data for more stocks and then
run the flagging program against all the A-Z stocks.
The more weekly charts we
inspect, the more significance we see we should attach
to weekly Buy B12s.
Of course, these weekly charts give us a chance to see things farther
back and also to become
aware of support and resistance lines we might easily
miss that go back more
than a year.
|
 |
 |
==================================================================================
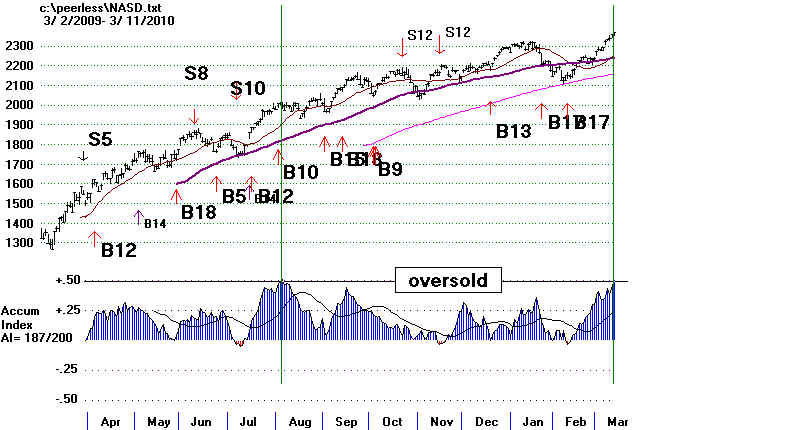
3/11/2010 Buy B12 Operative. The NASDAQ Is on A Rampage.
Such A Trend Is Not Easily
Stopped without A Peerless Sell.
.
The NASDAQ, Russell-2000 and low-priced
speculative stocks continue to rise steeply
and
steadily. This type of trend is not easy to reverse. The NASDAQ's Accumulation
Index
has now
reached +.50 This most often leads to a brief and shallow, flat-topped
trading range
and then a
breakout run to much higher levels. Only when there is a Peerless Sell Signal, can
such
high levels
of Accumulation be reversed. No such signal is in sight, I believe. See my new
study of
the NASDAQ back to 1988, where the necessary data begins:|
Below see the discussion of the NASDAQ.
And below that we offer 5 sections
to look at.
The length of this is unusual. Sunday's hotline will probably be much
briefer.
1. Weekly Tiger Buy B12 - PCP
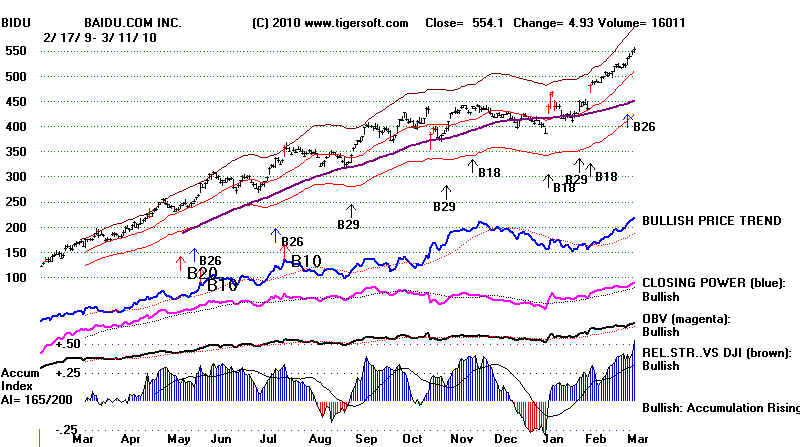
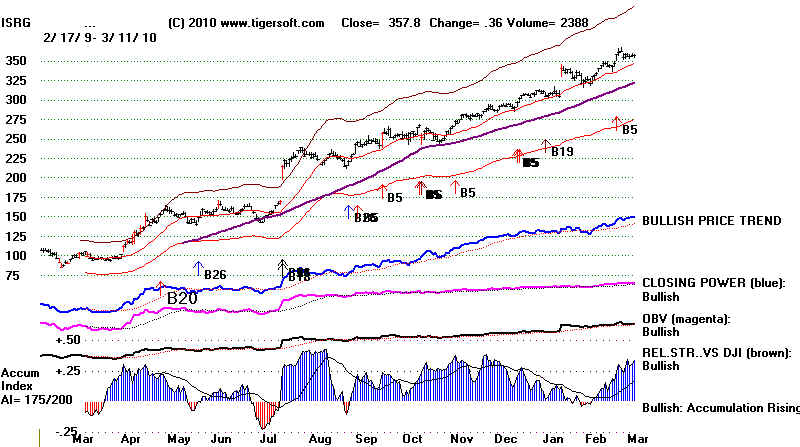
2. Leading High Priced Growth Stocks: BIDU and ISRG
3. Low Priced Breakouts Showing High Accumulation
4. When Will Charles Schwab Breakout?
5. DIA, QQQQ, SPY and IWM
What Has Been History of
NASDAQ Accum Index Bulges above +.50 ?
All NASDAQ Charts since 1988:
http://www.tigersoftware.com/nasdaqC/INDEX.HTML
All NASDAQ Charts since
1988:
http://www.tigersoftware.com/nasdaqC/INDEX.HTML
Conclusion of 1988-2010 Study of
17 Previous Cases:
Expect higher prices, probably after a shallow consolidation,
and then a rally until there is a Peerless Sell.
9 Consolidations/Advances or Advances
8 Declines after a Peerless Sell
March 2010 - ?
August 2009 - Very
shallow 4 consolidation followed by breakout
June 2005 - Very shallow 4 consolidation followed by breakout
July 1999 - Decline after S9 from
2900 to 2500, 3 mo flat consolidation and then breakout.
July 1998 - Declined after Sell S9 from 2000 to 1400.
August 1997 - Shallow
one month consolidation and then breakout to Sept. Sell
S12 15% decline
August 1996 - Rallied 4%
more, then Peerless S1 send NASDAQ down from 1250 to 1050
June 1995 - June and July 1995 - Part of a wall of Accumulation. NASDAQ
went much higher.
January 1994 - DJI
at 790 --> decline to 700. At top was a Peerless Sell S4
May 1993 - 6 week
shallow consolidation and then breakout.
November 1992 - a few days
hesitation and then breakout run.
February 1991 - DJI surged
upwards without hesitation.
June 1990 - One month consolidation. Then Sell S9/S12 and decline from 460 to 330.
January 1989 - leads to 2 month consolidation and then breakout.
June 1988 - 6% decllne after Peerless S1.
September 1998 - 6% decllne after Peerless S1
|
Tonight we offer 5 more
sections:
1.
Weekly Tiger Buy B12 - Many Sensational Gains. PCP Is A Recent Wkly B12
2.
Leading High Priced Growth Stocks: BIDU and ISRG
3.
Low Priced Breakouts Showing High Accumulation
4. When
Will Charles Schwab Breakout?
5.
DIA, QQQQ, SPY and IWM
1.. TIGER'S NEW Weekly Buy B12s
on All Stocks, ETFs,
Commodities.
I want to offer a scanner for weekly
Buy B12s of all stocks with one command.
We will be able to use the daily
data I offer for the A-Z stocks, rather than needing to
have 5 years of weekly data. There are so many earlier
examples of this signal's
sensational success, want to get
the update out quickly to take advantage of the
market environment. I hope I
can offer this in a week on the Elite Subscribers' Page.
Note that it will not necessary to
have a new weekly Buy B12, since this a longer-term signal
and the gains from the signal are
often quite large. We will want to follow such stocks
using our Closing Power. See
PCP' weekly and daily charts for example. If you do
not have the Tiger Power Ranker,
now would be a good time to consider getting it
Email me - william_schmidt@hotmail.com. For $395,
this also includes all updates,
Elite Page, data and hotline for 3
months.
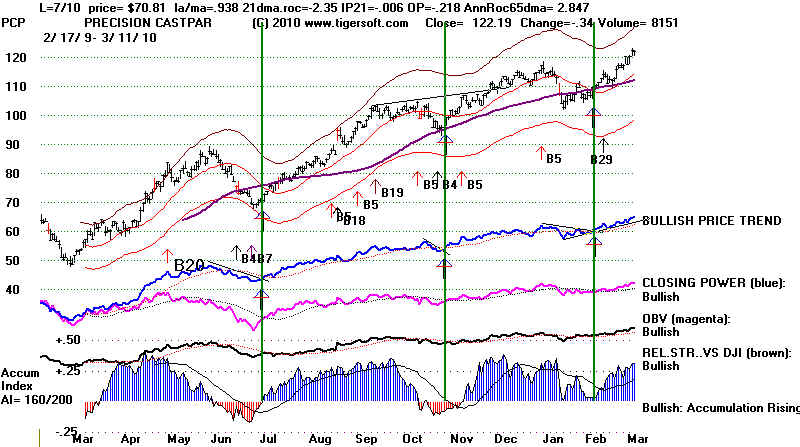
PCP Weekly - Note Buy B12
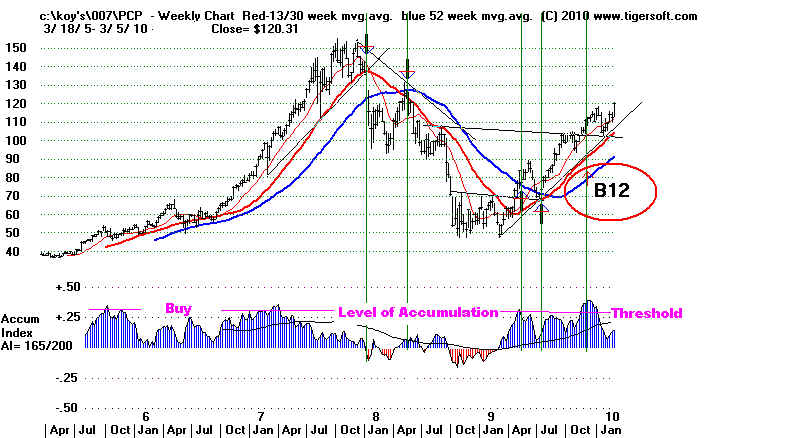
PCP DAILY - The Weekly Buy B12 signal occurred Friday, 12/18/2009
with the stock at
112.38... Watch each dip's CLosing Power. When it ends, BUY.
Only when the stock
reaches its 2007 high or gets too far above its 65-day ma
might we want to sell
it, prior to major Peerless Sell.
|
2...
EACH BULL MARKET HAS TO HAVE
ITS LEADING HIGH PRICED GROWTH STOCKS
BIDU and ISRG QUALIFY NOW.
 |
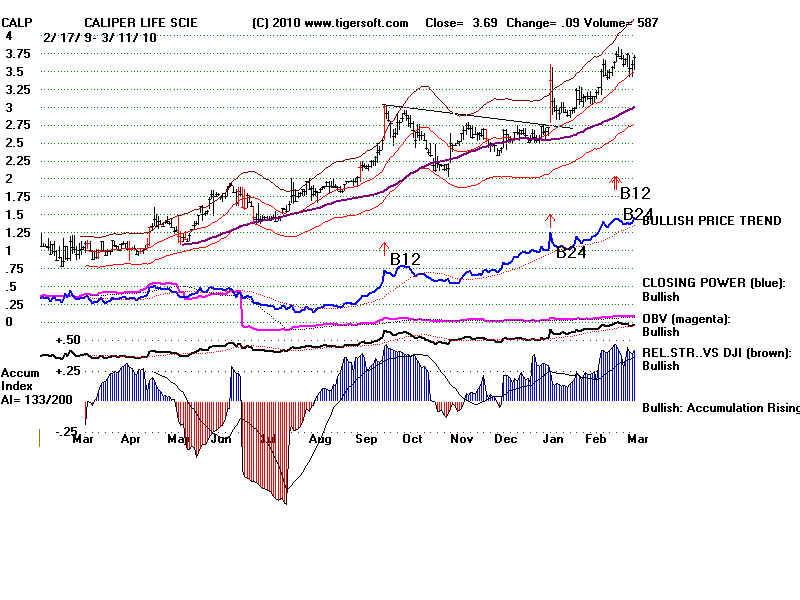
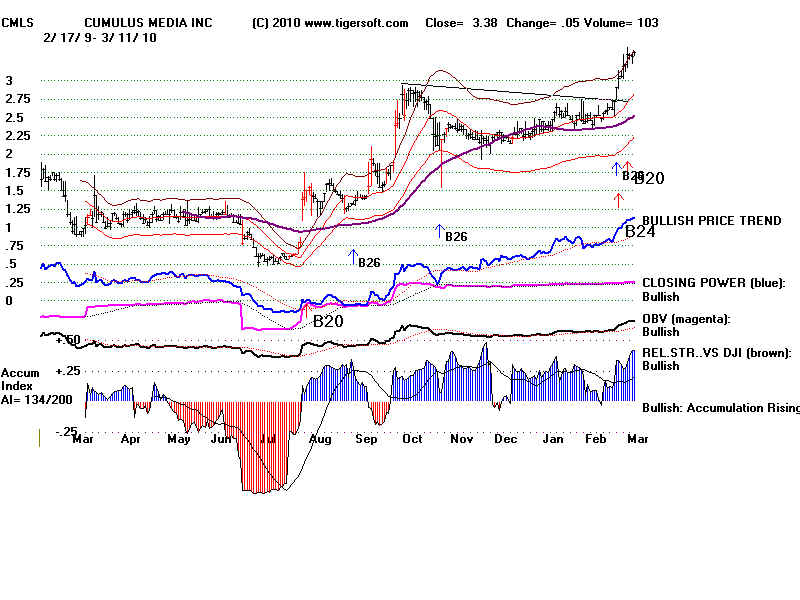
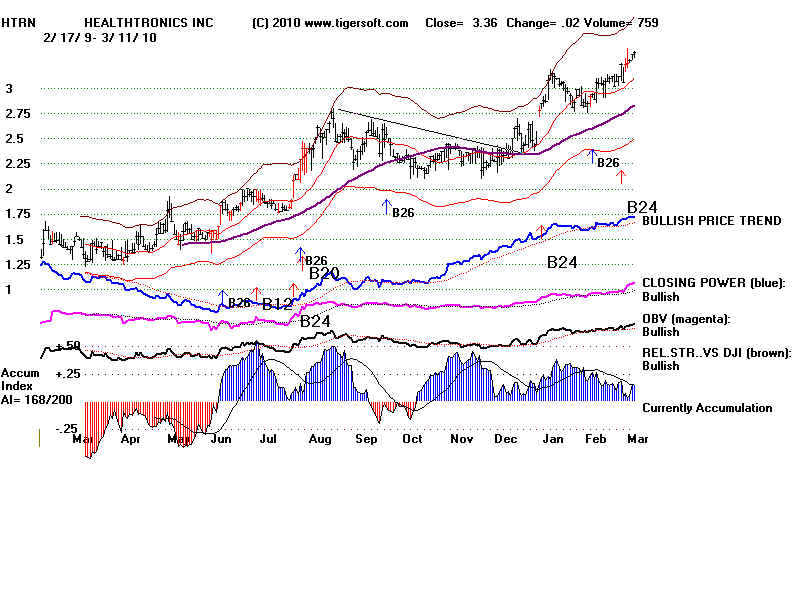
3... A SAMPLE OF CURRENT LOW
PRICED BREAKOUTS
WITH HIGH ACCUMULATION, STRONG CLOSING POWER
AND MAJOR TIGERSOFT BUYS.
|
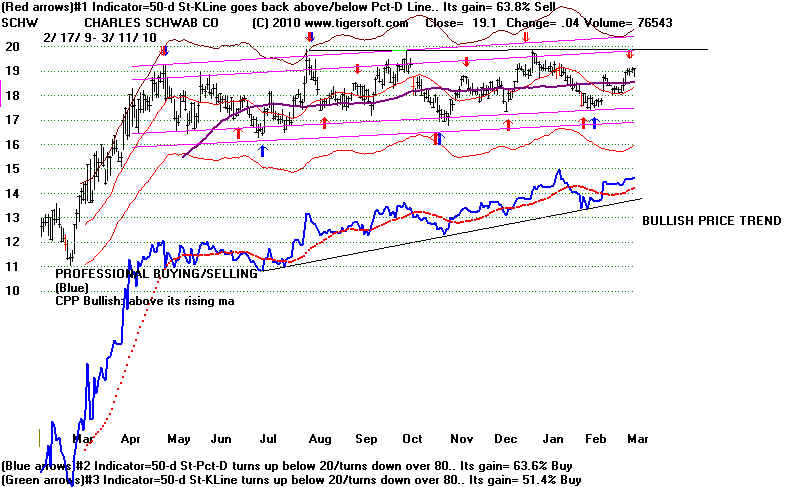
4..
WHEN WILL SCHWAB BREAKOUT?
10 Months of Backing and Filling Should Set Up
A Good Breakout. That's What Professionals
Are Betting on.
 |
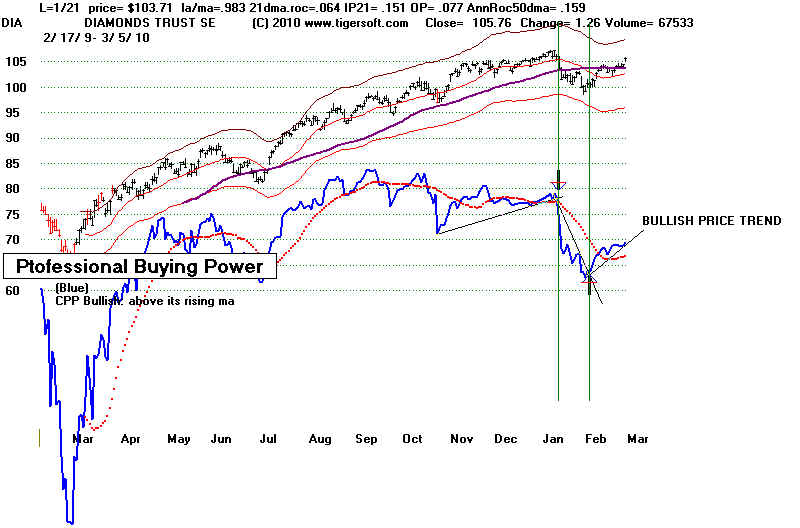
5. DIA and Closing Power Percent
Closing Power is bullishly rising.
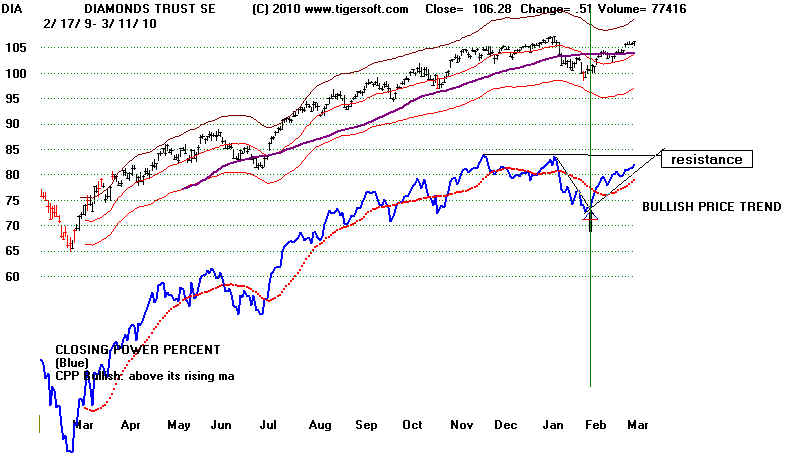 |
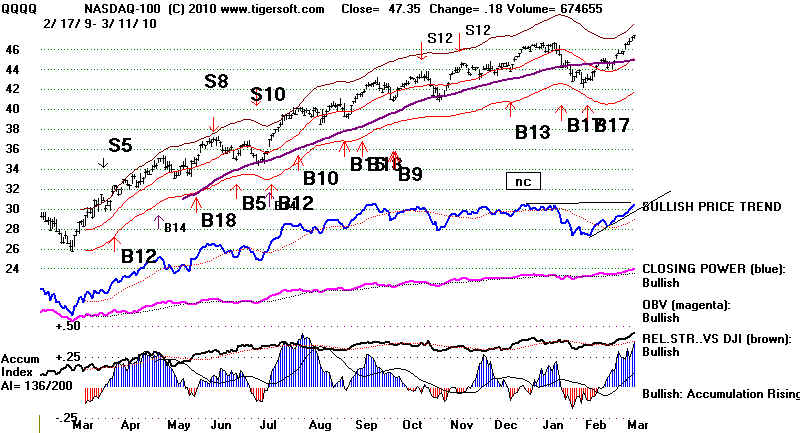
QQQQ and Closing Power
Closing Power is bullishly rising. It has reached its horizontal resistance.
|
SPY, SP500 A/D Line and Stocks above
65-dma
Closing Power is rising... It has reached its horizontal resistance.
|
IWM (Russell-2000) is exceptionally
strong.
High Accumulation. Rising Closing Power.
 |
=================================================================================
3/10/2010
Buy B17 Operative. Upper Band Reached by DJIA. When the ETF's
Closing Power Uptrends Are
Violated, Expect A Decline by the
DJI back to its rising 21-day
ma. The Other Indexes Will Likely
Continue To Out-Perform The DJIA.
I said last night that it was probably a little late to buy higher priced stocks with
good Tiger
internals because so many of them are up 20% or more above their
points of
breakouts. Many are at points of resistance seen on weekly charts.
With the DJI
facing resistance at its 3.5% upper band, it seems better to wait for
a retreat to buy
more of them. But as can see also from the NASDAQ, SPY and
SP-500 charts, we
are exeriencing exceptional strength in secondary stocks.
TWO MORE WAYS TO MAKE MONEY TRADING WITH TIGER.
What
I might have added is that this is likely still a very good environment for buying
low priced stocks
that breakout with Buy B12 and B24 signals. Until the speculative
tone to the
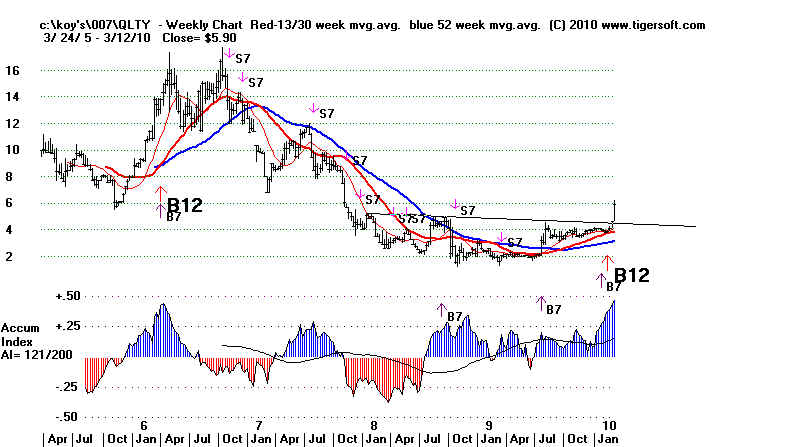
market ends, the "cats and dogs" will get a lot of new money. For example,
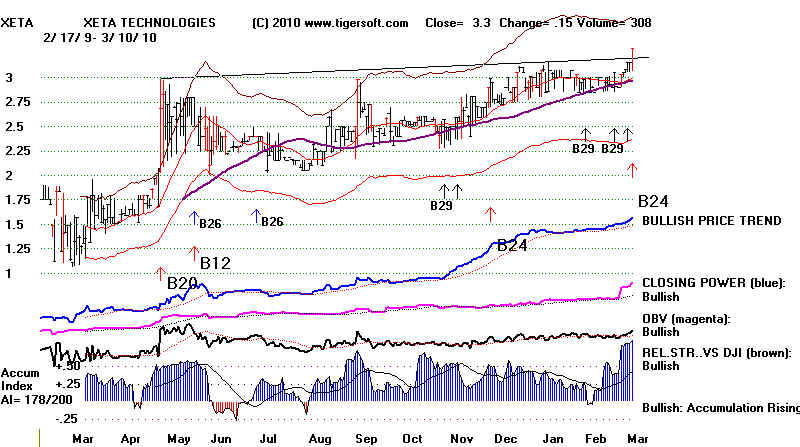
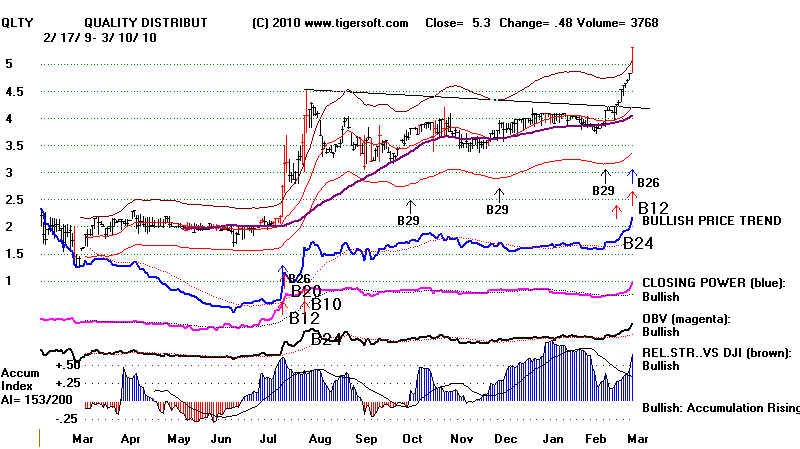
look at how well
QLTY has done this last week. Today, another low-priced priced
stock,XETA,
made a very similar looking flat topped breakout with quite comparable
internals. It
should be worth a trade. There are probably others that also look good.
I will be posting
them as bullish special situations on on our Elite Stock Professional
(ESP) Report.
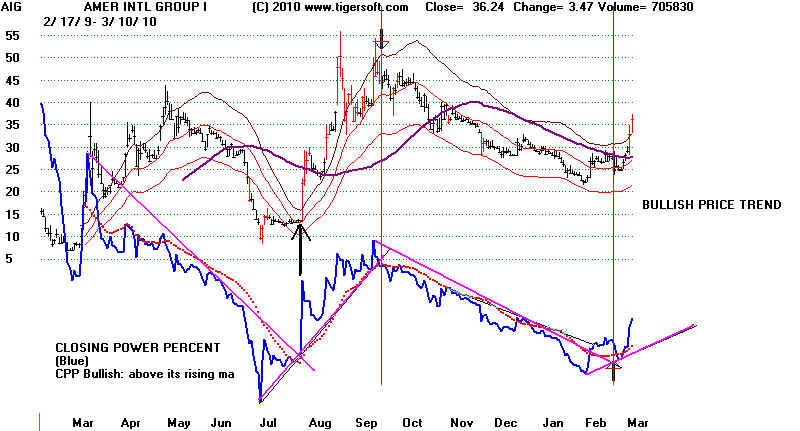
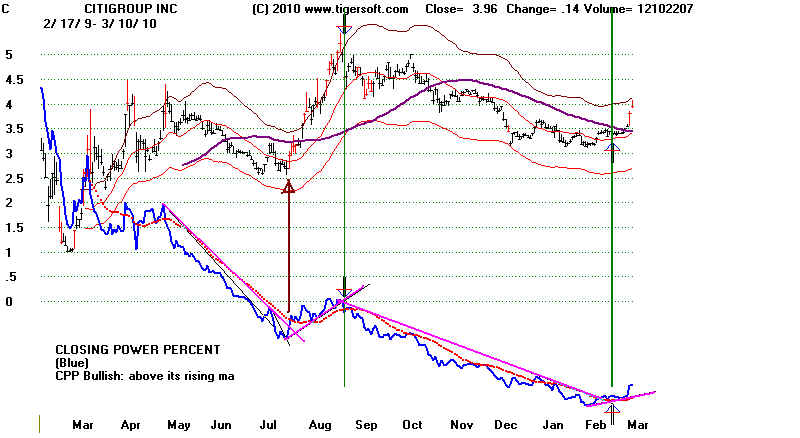
Stocks with heavy
short interests are also attractive. See how well CitiGroup and
AIG can be played
with the Tiger Closing Power. Their charts are shown just below.
Clearly these
trend-breaks show insider and profesional running in the shorts.
A quarter of
AIG's float has been sold short. We see in these charts that Closing Power
breakouts
reliably anticipate substantial moves. And when the stocks also move past key
moving averages
the shorts rush to cover even more. I did not realize how well the Tiger
Closing Power
worked with these type of stocks until I looked at AIG's chart tonight.
Traders, might
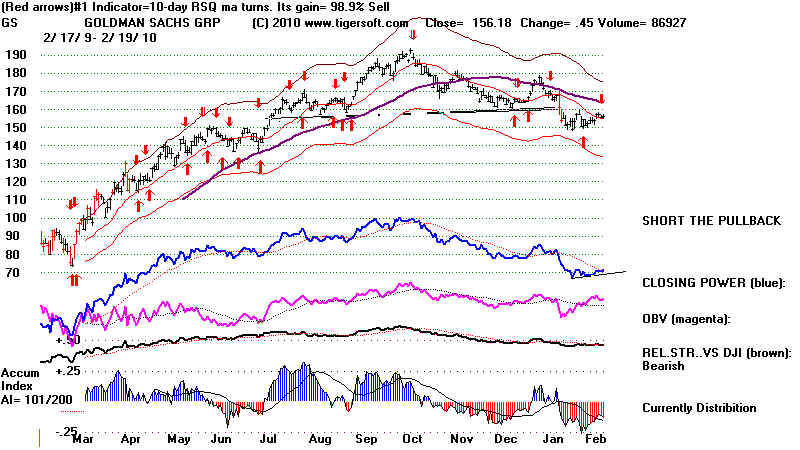
file this concept away for future use. We will be watch AIG, C, BAC
and GS to see
when they break their CLosing Power uptrends. For now, these
stocks are being
pumped by the likes of aggressive hedge funds and Goldman traders.
====== LOW PRICED STOCKS ARE BREAKING OUT AND RUNNING =======
======= LOW PRICED STOCKS ARE BREAKING OUT AND
RUNNING =======
=========================== Running Breakout
Buy B12./B24 ==========================
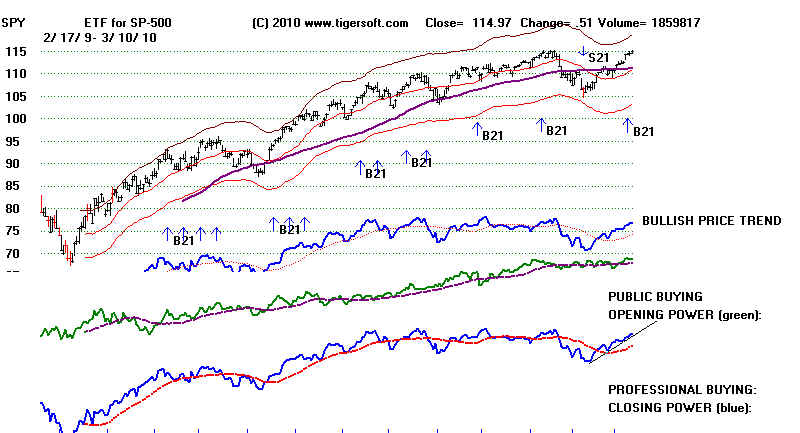
===================== SPY- All Bullish
Trends ========================
78% of SP-500 Stocks are above their 65-dma
Closing Power is Rising for SPY
A/D Line for SP-500 Stocks is Strong.
===================== NASDAQ - All
Bullish Trends ===================
=====================================================================
3/9/2010 Buy B17
Operative. Upper Band Reached.
The DJI would normally pullback a little from the upper band and, at
least, hesitate
after reaching the zone of
resistance that lies above from 10700-11000. The NASDAQ,
Russell-2000, NASDAQ-100 and
even the SP-500 are considerably stronger than
the DJI. This a result
of the excellent breadth we have seen for a year. At some
point, it is probably best to let
existing positions rise, if they will, but delay additional
buying until there is a decline
back closer to the lower band, or even the 21-day
ma. I think that time has
arrived. I spend three hours looking through the stocks
that were making new highs today. Most seem over-extended and
have reached
longer-term resistance or else they
have lower levels of weekly Accumulation.
If you have to strain to find
something to recommend, I have learned, don't make
a recommendation. This study
did have two benefits. First, it showed that a number
of the best performing secondary stocks also had weekly Buy B12s. So, the
study I reported last night applies
to them, too. And secondly, there ought to
be a way of flagging these stocks
using daily data which is compressed into
weekly data, for the purposes of
screening all stocks for these new weekly B12s.
The ETFs' CLosing Powers are all still rising. A break in them should start the
inevitable
retreat to the 21-day ma.
--------------------------------------------------------------------------------------------------------------------------------------------
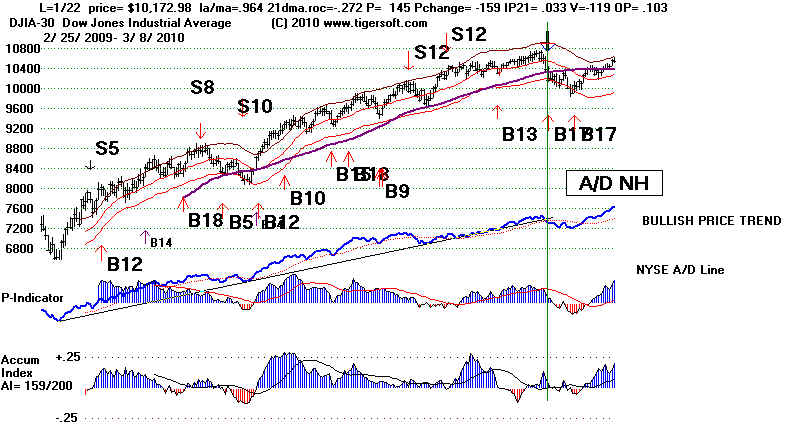
3/8/2010 Buy B17 Operative.
Upper Band Reached.
The A/D Line has made another 12 month high.
Favorable breadth has been the best
guide for last year.
But the DJI has now reached the upper band. Some profit-taking
mostly in high caps must now
be expected. Without a major Peerless Sell, it is hard
to foresee a decline below the flat
65-dma. Watch the ETF's Closing Powers to see
if they break their uptrends.
Watch your stocks' CLosing Power uptrendlines. If a
stock is very over-extended, draw
steeper trendlines. Violations by these stocks of their
65-day moving averages should be
sold. The study of weekly charts shows that
Friday closings below the 13-week
ma in stocks that are over-extended on the upside
should usually be sold, even if
there is a danger of being whip-sawed, though this
depends on general market
conditions and whether the Accumulation Index is
negative, or not.
TIGER WEEKLY CHART RULES:
www.tigersoftware.com/TigerBlogs/March-6-2010/index.html
I have been working on how
best to use Tiger weekly charts. Rules for this are being
offered as working
hypotheses. In particular, we want to start screening for
weekly Buy B12s. More weekly
data and a new flagging flagging program will
help a lot here. Very reliably profitable are weekly Buy B12. These signals
occur automatically with the latest
software when the Accumulation Index
rises above +.375. The
signals work exceptionally well when they occur with the stock
still in or close to its base, not
too far above its 52-week ma and with the stock not
up more than 40% in the last 10
weeks. Study of the NASDAQ-100 and SP-500 stocks'
5-year weekly charts show that 90% of these bring high gains using the rules discussed.
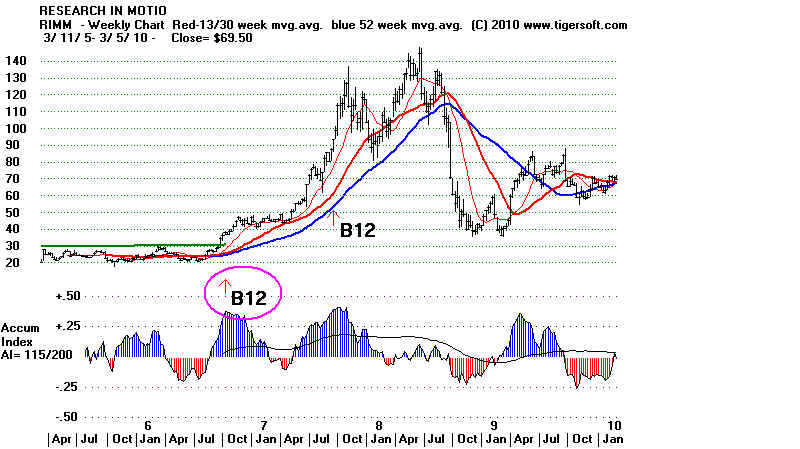
RIMM
and Weekly Tiger Buy B12s. One in base. One with prices somewhat
over-extended. I suggest studying some of the more successful
Weekly Tiger B12s.
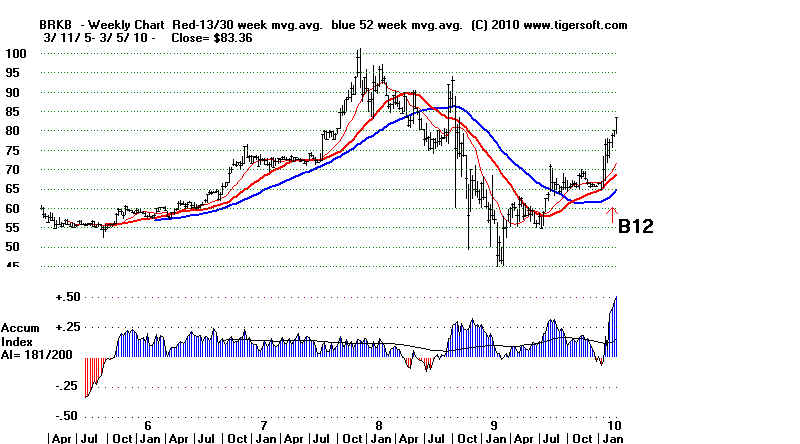
BRKB is one of the highest
Accumulation stocks recently. I reckon that 90% of
these bring
high gains using the rules discussed. A new
flagging program is now offered, too, to Elite
Stock Professional
subscribers.
=====================================================================================
3/5/2010 Buy B17
Brings Test of January Highs
for NASDAQ and QQQQ.
The strength in the NYSE A/D Line
should be trusted. The very good breadth
has kept us correctly long when
many feared the low volume and manipulation
of the market by the Fed through
the biggest Wall Street firms would surely lead
to a crash, when the market finally
reflected the realities of Main Street. What
the bears have not understood is
that Wall Street still looks like the best place
to put your investment capital,
when Main Street's buying power is too reduced
to make real investments look
profitable. Sure, this produces a bubble. But
that's a good thing if you are a
trader and you watch carefully for the tell-tale
signs of when an exit is prudent.
The key ETFs' Closing Powers are rising
still. Speculative stocks are much
stronger than the DJIA. That
means confidence is growing. More than 76% of the
stocks on the NASDAQ-100 and the
SP-500 are above their 65-day ma. Overseas
ETFs are also climbing back above
their 65-day ma. The Dollar's Closing Power
uptrend has been violated.
The stock market tends to rise more more when
the Dollar is not rising, too.
A weaker Dollar will give a boost to oil and precious
metals AND they will, in turn, help
the market to rise, and force more investors
to seek returns which beat the rate
of inflation.
The "talking heads"
are saying interest rates could jump by .5% in the next 6 months.
That would still be a very
accomodating monetary stance. A third up-wave seems
to have started for the
market. My sense is that this will be a much more speculative
phase. Elliot wave
theory supports this.
A retreat back to the lower
band will probably need a new Peerless Sell. I don't
see where that will come
from. The key internal strength indicators are all very positive.
A break in the rising CLosing
Powers without a Peerless Sell will probably bring a
decline only to the rising
21-day ma.
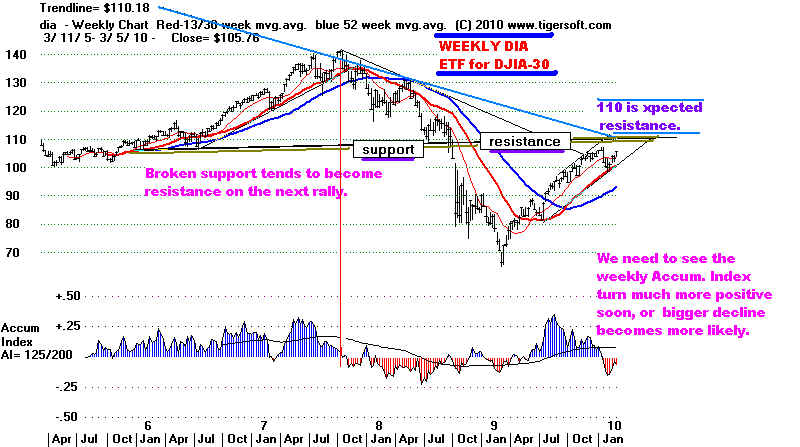
More and More Money Will Come Out of DJIA-30 Stocks
and Seek out More Speculative Stocks
11000 on the DJI and 110 on the DIA
seem good target now. These levels were
the support before Paulson scared
the country into a financial panic back in
September 2008. Broken
support usually becomes resistance on the next|
rally. Without more volume
and much better Accumulation Index readings on
the weekly DIA chart, I think it
will be hard to see a move higher than that on
the DJIA. Even so, that could
still permit much higher prices in favored speculative
groups. This is rare, but
there is precedent for this. 1968 was a wild year for
"cats and dogs" stocks,
even as the DJI ranged only between 830 and 990,
about 15%. 1977 saw the DJI fall
more than 20% while very speculative oil and gas
stocks on Alaska's north slope went wild.
From April 1999 to March 2000, the
DJI bobbed back and forth between 9800
and 1180, about 20%, but many
internet and biotech stocks rose 500%.
Low interest rates make that inevitable -
I would assert - when real business
oppprtunities look very risky given the lack
of public buying power.
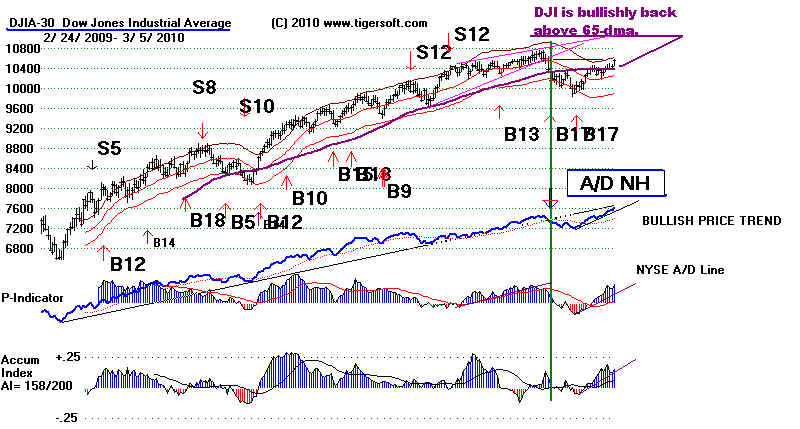
3/5/2010 10566.20 la/ma= 1.029
21dma-roc = .343 P= +535
Pch= +132 IP21= .153 V = 68 Opct = .232
A/D Line has made
a 12 month high. Favorable breadth has been best guide for last year.
=============== DIA ===============
=============== QQQQ ===============
=============== SPY ===============
============== SP-500 A/D Line ===============
77% of its stocks are above the 65-dma
================================================================================
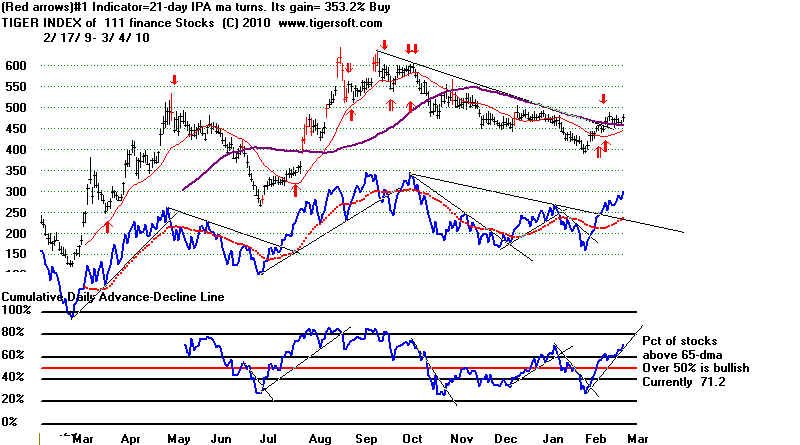
3/4/2010 Buy B17
Stick with the uptrend.. The DJI has climbed above its
65-dma more convincingly. The CLosing Power for the DIA did not drop today.
The CLosing Powers for the SPY and QQQQ are still uptrending. Meanwhile the
A/D Line for the NYSE, QQQQ and SP-500 each made a new 12 month high. It's hard to
argue with this bullishness, at least until the DJI reaches the 3.5% upper band
about 170 points above where the DJIA closed. The Finance Stocks are
showing strength for the first time since their August peak. 71.2% of the 111
finance
stocks are above their 65-dma.
Apparently, serious regulation of Wall Street will be blocked or neuralized in Senate.
I say this because our Home-Building stocks' Index is below its key 65-dma.
Another factor boosting bank stocks is Treasury Secretary Geithner. Now he is
busy helping non-Wall Street firms to tax-payer money,
" Midwest Banc Holdings Inc (MBHI.O)
agreed to swap $84.8 million of preferred shares
it sold to the U.S. government in 2008 for securities that will convert into about $15.5
million of
common shares -- roughly an 80 percent loss to taxpayers. To some analysts, the
transaction is an
outrageous giveaway to an ailing bank, and its investors. "There's a lot of
funny stuff going on here,"
said James Ellman, president at hedge fund Seacliff Capital in San Francisco. Others
say it is a sign
of the tough choices the Treasury faces dealing with banks that remain weak despite
receiving
government capital. In some cases, taxpayers must choose whether to lose 80 percent
of their money, or all of it." (Source: http://www.reuters.com/article/idUSTRE62303L20100304
)
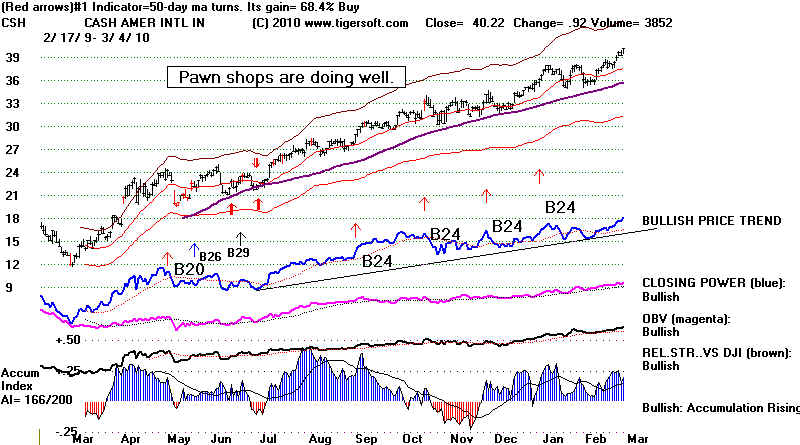
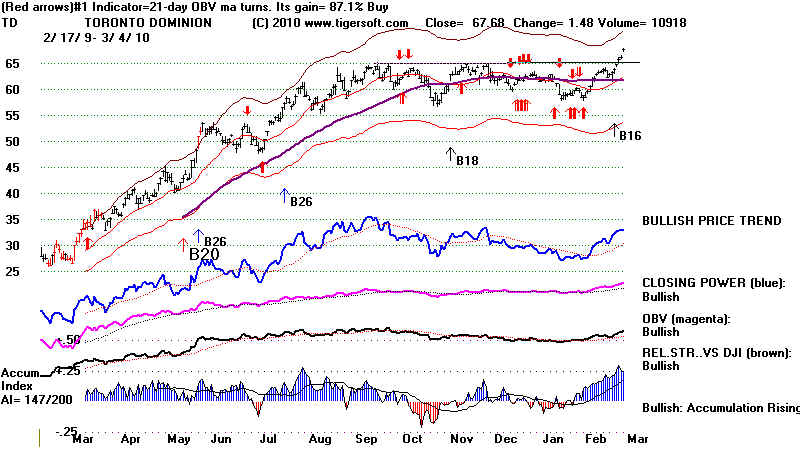
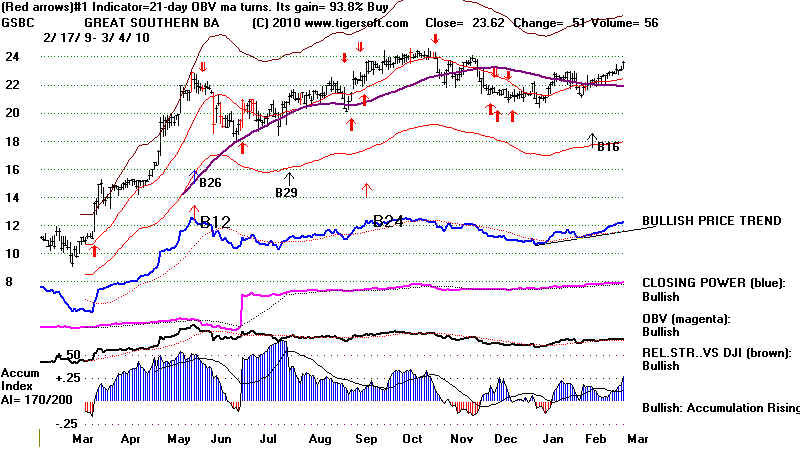
15 Finance stocks are either naking new highs or are within 4% of their 12-month
highs. As new highs, CSH and TD do look attractive. PRAA shows an IP21
(current Accumulation Index) that is quite high, + 51. Their charts are shown
below.
---- Tiger Index of Finance Stocks ---
=============================================================================================
===================================================================================
3/3/2010 Buy B17
The break in the DIA's Pro-Power Line's uptrend
with the DJI at the resistance of the 65-dma is a short-term Sell for the DJIA.
It is only a marginal break, so far. The other indexes have not had similar
breaks. The QQQQ is now considerably stronger than the DJI. The A/D
Line
for the NYSE has made a 12 month high, A short-term retreat seems
likely, but until Peerless gives an intermediate-term Sell, a decline to the
lower band cannot be predicted.
As mentioned yesterday, IBM cannot get past its flat 65-dma. This is
NOT good. Apple, on the other hand, rose .48. A move by it above 213
would destroy its bearish-looking head and shoulders pattern.
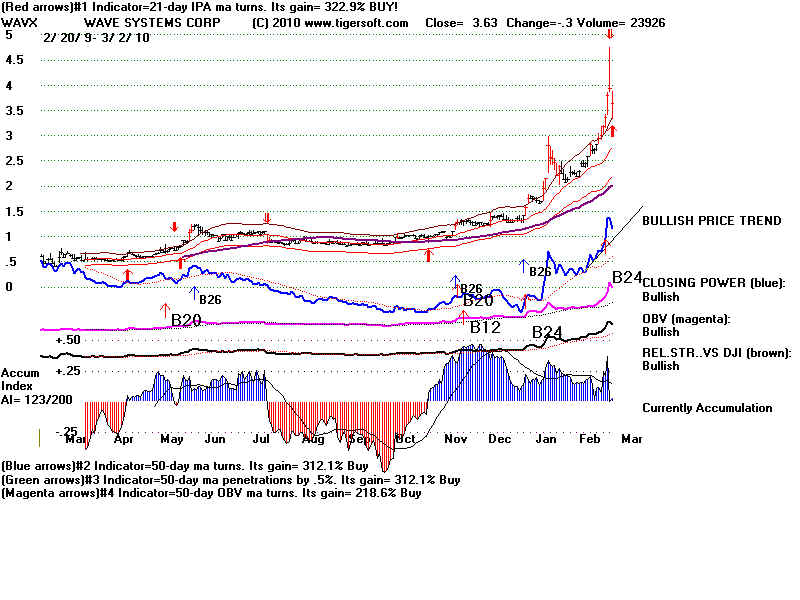
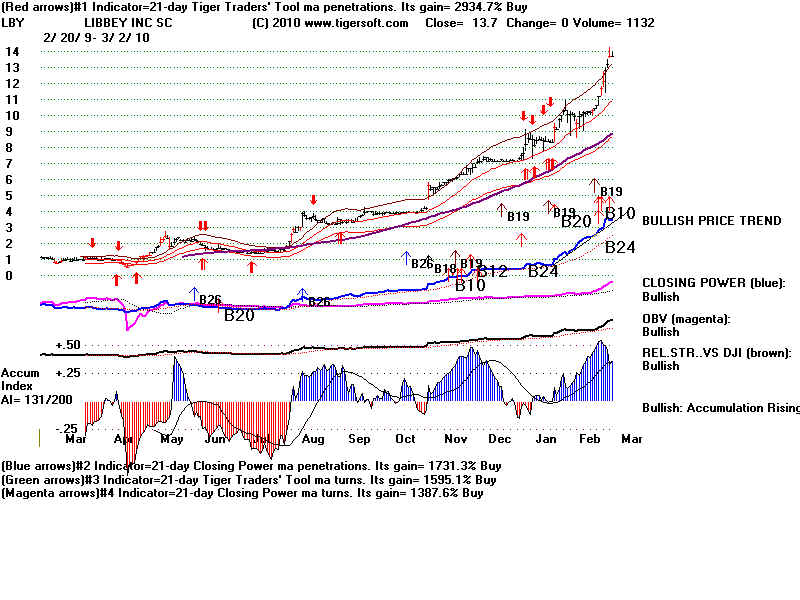
We warned folks that a market decline might be foretold by breaks in
the uptrends of Closing Power of a sample of unusually strong, even hyper-
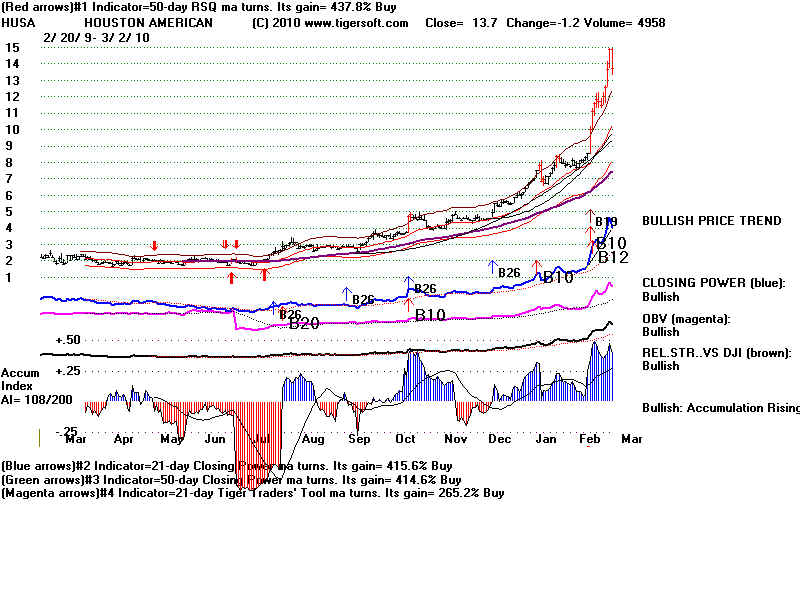
bolic stocks. HUSA (shown yesterday) did break its Closing Power uptrend
decisively today. So did WAVX and LBY. We are not advising
shorting these
stocks. But their weakness may be a warning that general market weakness
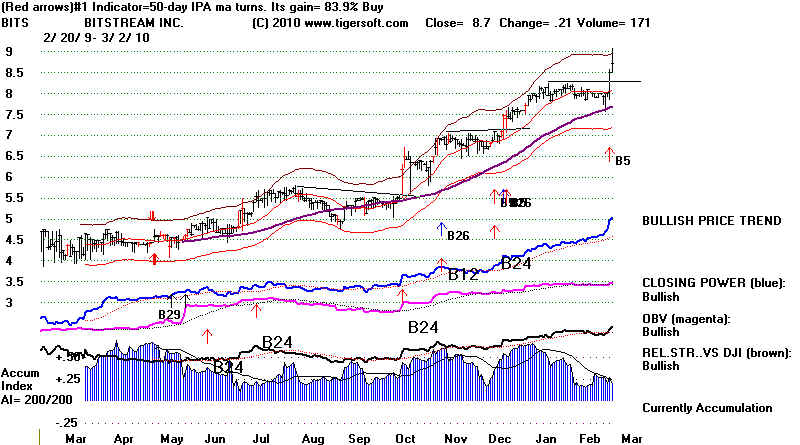
may lie ahead. Very high Accumulation BITS fell more than 10% intra-day today.
Its rising 65-dma acted as support. Most stocks that hav been making new highs
and were not so over-extended retreated only a little today. In trading breakouts,
try to find stocks that show red high-volume breakouts. They are more likely to
have a follow-through. Others will work out, too. But. high volume and gaps
are other signs that Buy B5s, B10s and B24s will prove very profitable.
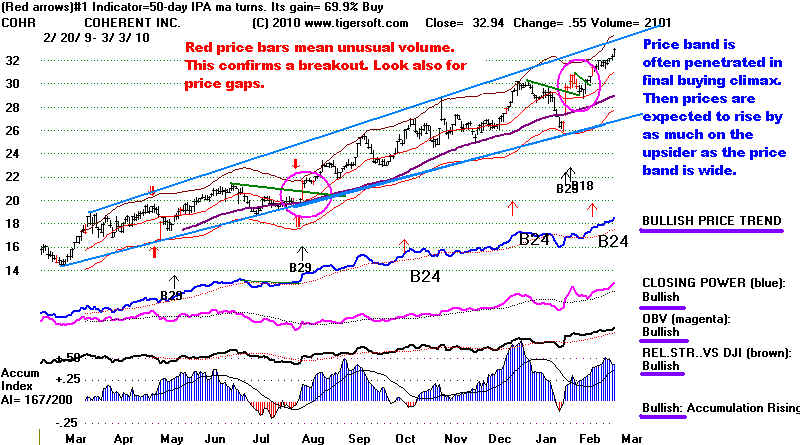
COHR
is a typical strong stock now, rising at a more sustainable rate.
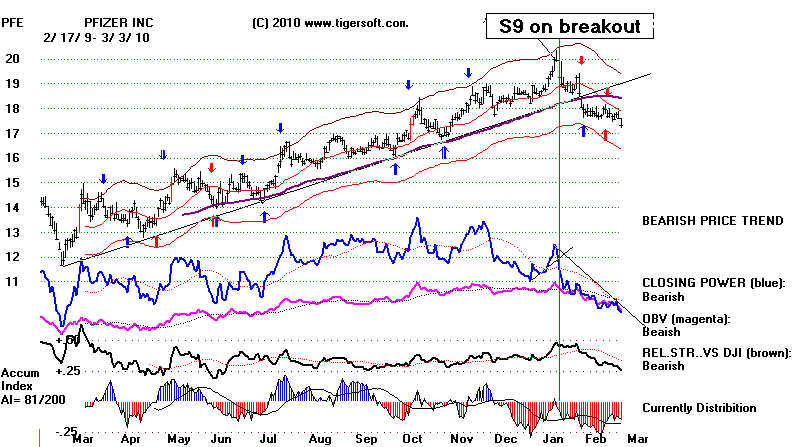
HEALTH INSURANCE "REFORM"
Health care insurance "reform" is now about to be decided by Congress. There are
three health care stocks in the DJIA: JNJ, MRK and PFE. JNJ and MRK have 3 of
their 4 key Tiger indicators now rated as bearish as they sit at their 65-dma. The
other one in the DJIA, PFE, short-term looks vulnerable. Having moved up
steadily for a year, It broke its uptrend and now shows a falling 65-dma.
Its internal strength indicators are rated "bearish". It looks like a good
short salem as a hedge, if one uses the Closing Power downtrend to judge
when to cover short-term. If it were truly reform, I would expect health
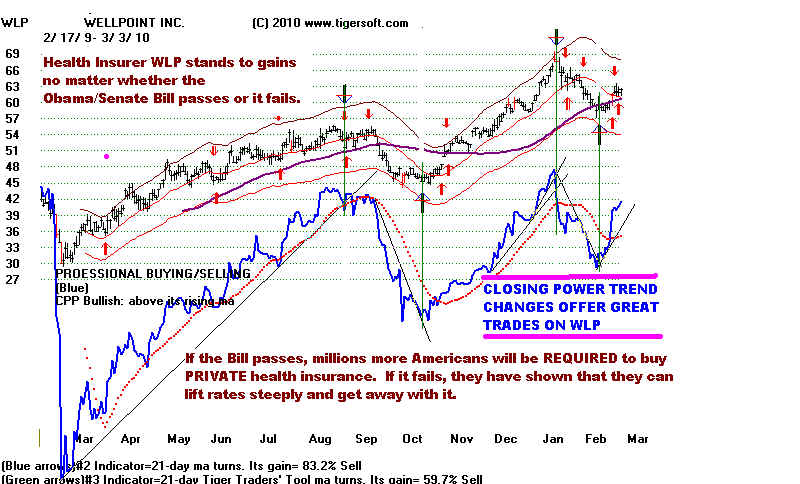
insurer WLP to be in decline. it is not. Well Point owns Blue Cross and
planned to boost rates steeply higher, 39% in California with one month's notice.
WLP can be traded very well with its Closing Power trend-breaks. See
its chart below PFE's.
BLUE CROSS FOR PROFIT WELLPOINT DOES NOT APPEAR
CONCERNED ABOUT THE CHANCES FOR A PUBLIC OPTION
IN HEALTH CARE INSURANCE, NOR DOES IT FEAR STATE
REGULATORY REVIEWS & CONTROLS OF INCREASES IN ITS PREMIUMS
===============================================================================
===============================================================================
3/2/2010 Buy B17
The 65-Day MA is Still The
Key Barrier for the
DJIA. Gold Has Moved Past It. But Why Is IBM Struggling?
And Is That A Head and Shoulders Pattern on APPLE?
Many Lesser Known Stocks Are Scoring Impressive,
TigerSoft Confirmed Breakouts. See their graphs
here.
The Buy B17 and good breadth on the DJI,
SP-500 and Nasdaq-100 still
give us hope that the DJI will move past the 65-dma, though usually this does not
change the need for another trip to the lower band, at least The NYSE A/D Line
made a 12-month high today and there were more than 1100 up than down on the
NYSE. Breadth divergences are the biggest concern we have. We see none.
If the DJI did reach the upper 3.5% band next with the P-Indicator and Accumulation
Index where they are now, there would probably be no Peerless Sell. Nonetheless,
would watch the rising CLosing Power uptrends in the DIA, SPY and QQQQ, as well
as the stocks you own. The research I have done shows that breaks of an Closing
Power
uptrend when the 65-dma is being tested from below must be considered short-term
Sells.
----------------- IBM is
struggling to get past 65-dma.
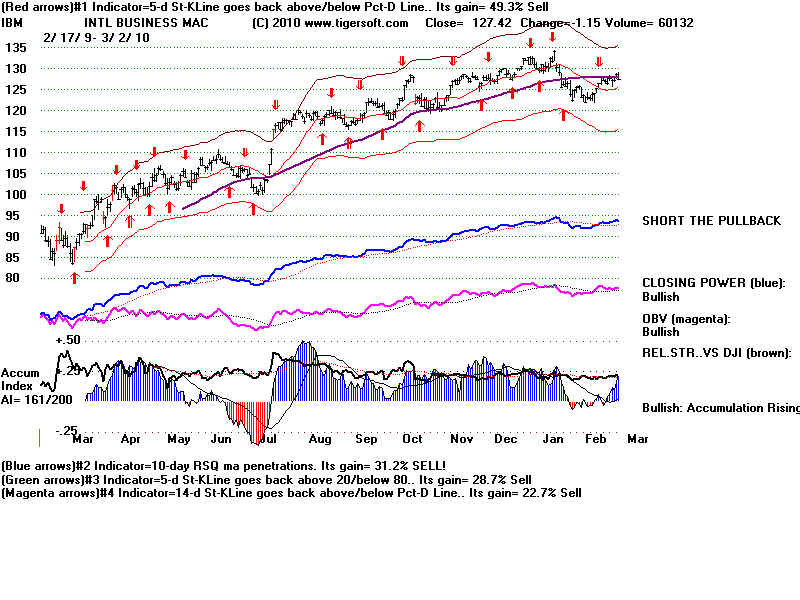
-----------------APPLE needs to get past 210
to destroy the bearish head and shoulders pattern.
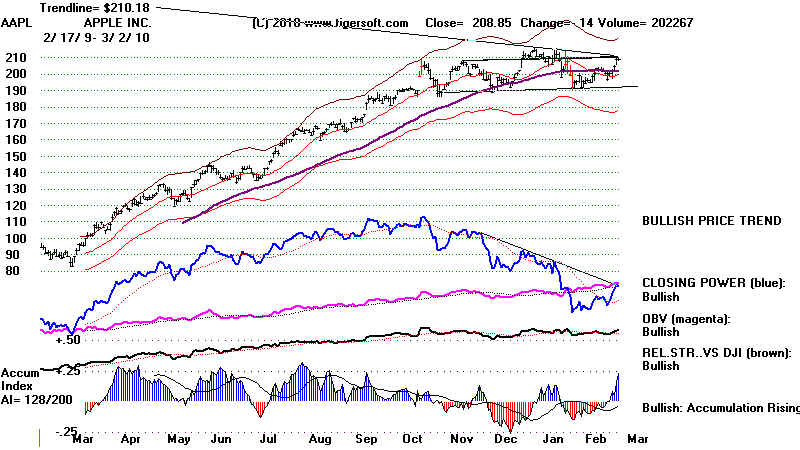
-----------------
=================================================================================
=================================================================================
Speculative Bubble
Please see - 3/1/2010 - Many Bubble Stocks
Are Going Higher.
We have recommended BITS as a way to
buy a speculative, low-priced
stock that shows extraordinary high levels of Accumulation and insider buying.
The exceptionally positive and steadily hight levels of accumulation has
likely left the stock very tightly held; so that it can rise very dramatically even
on lower volume. TigerSoft first recommended BITS at 5 in July. As
happens
when a stock is truly under insider Accumulation and is not yet being actively
promoted, BITS has risen, but not dramtically. The dramatic advance stage
often comes in the second six months following the first Buy B24.
I have also suggested watching for breaks in the CLosing Power of
stocks that have
risen a great deal, more than 1000% in the last 10 months. In the past, when such
uptrends
were broken with "bubble" stocks in 2000, 2007 or 2008, it meant the general
market was
seen to be entering a dangerous phase. Here are 3 stocks we will start watching in
this
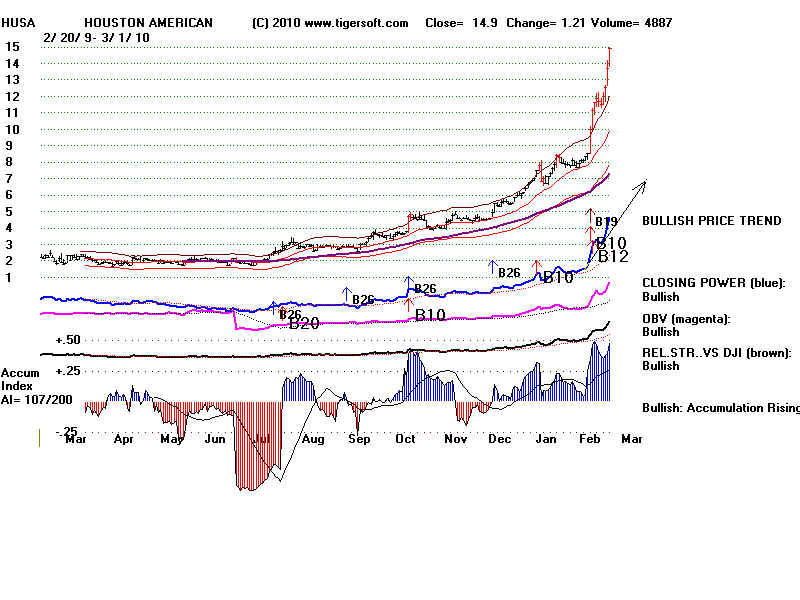
connection: HUSA, WAVX and LBY.
HUSA - All time-high, Houston American Energy
Corp. engages in the exploration, development, and production of natural gas, crude oil,
and condensate. It primarily focuses on properties in the U.S. onshore Gulf Coast Region,
principally Texas and Louisiana, as well as focuses on the development of concessions in
the South American country of Colombia. 3 full-time employees! http://www.houstonamericanenergy.com
Short squeeze?
We'll watch it. Should be fun.
Hypernolic HUSA -
WAVX -
LBY
-----------------------------------------------------------------------------------------------------------------------------------------------------------
OLDER HOTLINES
3/1/2010
Buy B17
The 65-Day MA is Still The
Key Barrier for the
DJIA. BUT Speculative Stocks Are
Starting To Go Wild.
Bernanke's statement that interest rates will likely remain low for a months has
given a big boost to speculation. So much "cheap" money needs to find a
home.
Sadly, it does not seem to be going directly into creating jobs. But there certainly
is a "trickle down" effect. Those who make money in Wall Street will
someday
spend some of their profits, assuming they get out before the bubble completely
bursts.
Bubble do develop in conditions like this, when there has been a long, steady rise in
safer,
high caps, eventually much of the hot money gravitates to the thinner more volatile
"cats and dogs". I saw this in 1968, 1976, 1980 and 1999-2000. My
advise is play it,
but be prepared to exit quickly when the Closing Power uptrends in "extreme"
and "bubble" stocks are broken. We will follow the saga here closely.
Read "Bullish
a year ago. robert prechter now sees "the biggest bubble
in
History". There were 134 new highs on NASDAQ today and 200 on NYSE,
where
there are many more interest-rate sensitive stocks. At a top, there may be 500
new highs on each. So, we may have some time to go. The QQQQ and SPY are
clearly
above their 65-day ma. The odds are good that the DJI will soon follow.
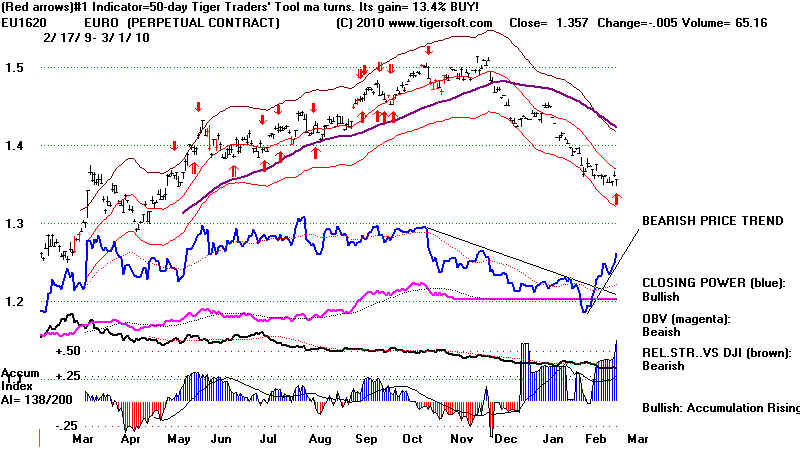
Gold
is sitting right at its 65-dma. The Dollar's strength has owed mostly to
the weakness
in alternative (competing) currencies, particularly the EURO, which has fall more than 10%
against the Dollar since early December. The EURO now shows a high level of
Accumulation
with a rising Closing Power. That should mean the Dollar will not keep rising
much longer,
and that would proably be bullish for American stocks, Gold and Oil.
EURO - Ready To Reverse Upwards? Looks
Like It.
What I said Sunday night bears repeating:
"The Buy B17 and good breadth on the DJI, SP-500 and Nasdaq-100
give us hope that the DJI will move past the 65-dma, though usually this does not
change the need for another trip to the lower band, at least If the DJI did reach
the
upper 3.5% band next with the P-Indicator and Accumulation Index where they
are now, there would probably be no Peerless Sell. Nonetheless, I would watch the
rising CLosing Power uptrends in the DIA, SPY and QQQQ, as well as the stocks you
own. The research I have done shows that breaks of an Closing Power uptrend
when the 65-dma is being tested from below must be considered short-term
Sells. "
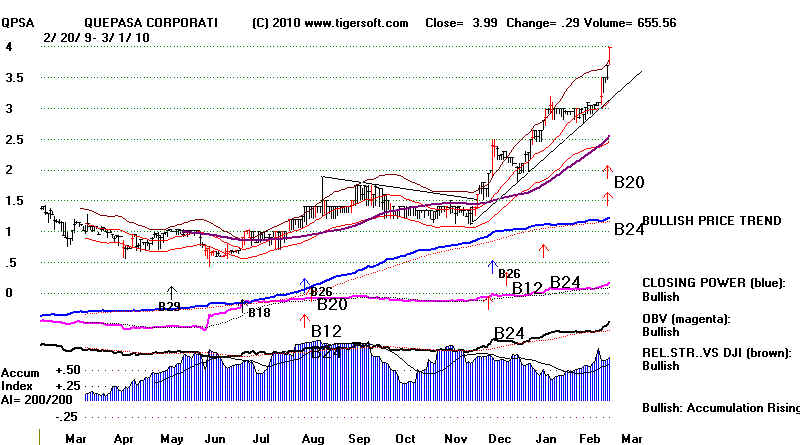
Interesting discovery about Yahoo today. They make mistakes
with their data
and what they say about companies. Case in point: QPSA. They mistakenly
say
"QPSA is no longer valid. It has changed to QPSA.PK. When you click on this link
you are told the price is .83 and it last traded on July 10. They provide no
profile.
But if you Google QPSA, you get QPSA - Stock
Quote for Quepasa Corp - MSN Money
Here you discover the stock closed at 3.99 today and showed an average daily
volume of more than 28,600 shares daily for 13 weeks. They also provide news:
Speculative Bubble
Please see - 3/1/2010 - Many Bubble Stocks
Are Going Higher.
The reasons why we consider this important are
because we are entering
a speculative bubble phase when lots of secondary stocks are shooting
upwards and we have recommended QPSA as a way to play this, because of
its extraordinary high levels of Accumulation and insider buying. The
exceptionally positive accumulation has, in our experience, left the stock
very tightly held; so that it can rise very dramatically even on lower volume.
TigerSoft first recommended this just above 1.5 in late November.
I have also suggested watching for breaks in the CLosing Power of
stocks that have
risen a great deal, more than 1000% in the last 10 months. In the past, when such
uptrends
were broken with "bubble" stocks in 2000, 2007 or 2008, it meant the general
market was
seen to be entering a dangerous phase. Here are 3 stocks we will start watching in
this
connection: HUSA, WAVX and LBY.
HUSA - All time-high, Houston American Energy
Corp. engages in the exploration, development, and production of natural gas, crude oil,
and condensate. It primarily focuses on properties in the U.S. onshore Gulf Coast Region,
principally Texas and Louisiana, as well as focuses on the development of concessions in
the South American country of Colombia. 3 full-time employees! http://www.houstonamericanenergy.com
Short squeeze?
We'll watch it. Should be fun.
Hypernolic HUSA -
=====================================================================================
2/26/2010 Buy B17
The 65-Day MA is Still The
Key Barrier.
We just have to wait and see if the DJI and SP-500 have the strength to get past
their 65-dma. The Buy B17 and good breadth on the DJI, SP-500 and Nasdaq-100
give us hope that the DJI will move past the 65-dma, though usually this does not
change the need for another trip to the lower band, at least/ If the DJI did reach
the
upper 3.5% band next with the P-Indicator and Accumulation Index where they
are now, there would probably be no Peerless Sell. Nonetheless, I would watch the
rising CLosing Power uptrends in the DIA, SPY and QQQQ, as well as the stocks you
own. The research I have done shows that breaks of an Closing Power uptrend
when the 65-dma is being tested from below must be considered short-term Sells.
I have also suggested watching for breaks in the CLosing Power of stocks that have
risen a great deal, more than 1000% in the last 10 months. In the past, when such
uptrends
were broken with "bubble" stocks in 2000, 2007 or 2008, it meant the general
market was
seen to be entering a dangerous phase. Here are 3 stocks we will start watching in
this
connection: HUSA, WAVX and LBY.
=================================================================================
2/25/2010 Buy B17
The 65-Day MA is Still The
Key Barrier, But The
Good
Breadth Makes A Move Past It Seem More Likely.
The Buy B17 is based on good breadth.
Good breadth is still a cause
for some optimism here. Breadth was flat today - not bad for a day when the
DJI
opens down almost 100. There are many more stocks making new highs than lows.
A good rally developed today after a weak opening. Thr DJIA's recovery may only
be closing a gap, but there are plenty of still positive signs. The most important
is that Peerless is still on a Buy. Big declines just do not start without a Peerless
Sell.
So, I would emphasize the half-fullness of the bottle of water. The DJI lost only
1/2%
and the broad-based NASDAQ lost only only 1.68 points.
A lot of people talk of the disconnect between the market and the real economy.
My complaint is unemployment this high is intolerable. Conservatives and the Left
alike
say that the Fed and Goldman Sachs are rigging the market. People like Robert
Prechter claim
that the the market must soon collapse as it snaps back to reflect reality soon.
These people contend that the Fed and Goldman are collaborating by buying SP-Futures
or using broad-based BUY programs whenever the market is down. That forces day
traders
to cover and not aggressively sell short. Maybe, they are right. But I see no
proof or smoking
gun-email yet. Maybe, in 2018 when the FED's records are supposed to be opened up,
the conspiracy-believers will proven right. Right now, true or false, I would say
let's pay
less attnetion to the bad news and more to the breadth of the market. Breadth is
clearly the
single best predictor of the market. NYSE A/D Line weakness and divergences are
usually present at significant tops. We just don't see these negatives yet.
So, any decline from the
65-dma will probably see the DJI not fall below 9500, 10% under the previous peak
and the 65-day mvg.avg. may well be exceeded before we go down again.
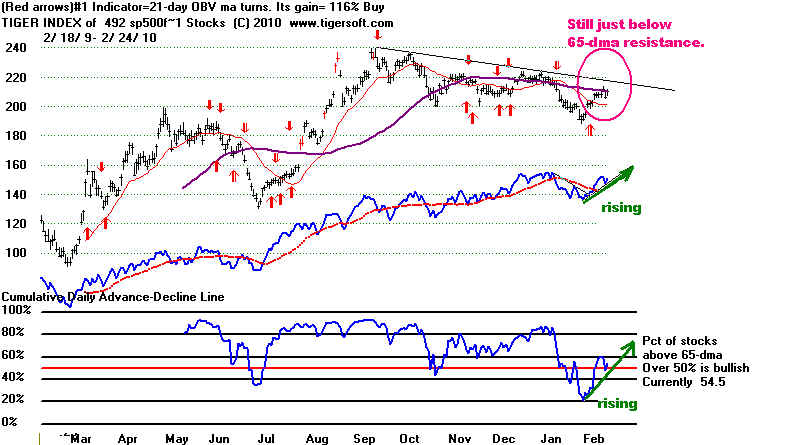
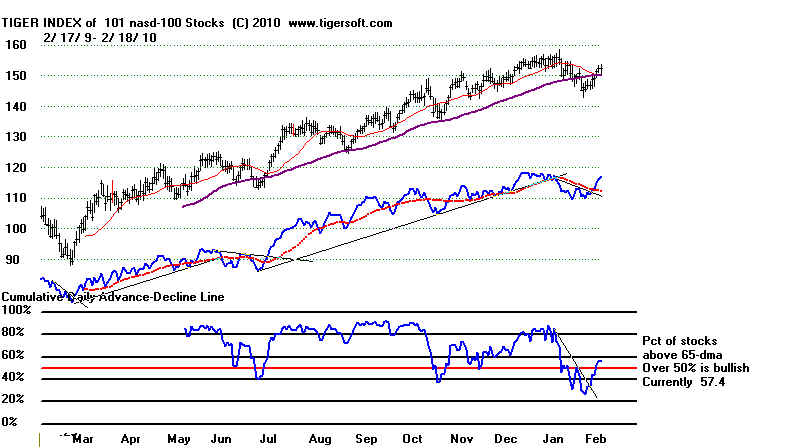
Look below at the A/D Line for the SP-500 and NASDAQ-100 stocks.
These have been uptrending since September. The NASDAQ-100 looks the stronger.
A number of stocks made what look like pretty good breakouts:
CCS, CNK, COHR, DMC, EOE, HSNI, HUSA, PRFT nd WBSN.
Their breakouts were confirmed
by high levels of accumulation, insider and professional buying. If the market were
about
to stall out, I would not expect to find so many good breakouts.
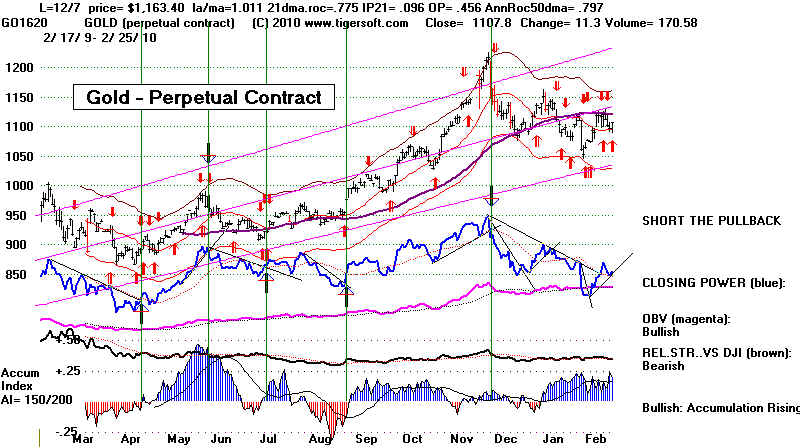
Gold rose one percent today. Watch the Dollar and Gold. A weaker Dollar will
help the market now, as it has for the last few years. Deflation, not inflation, is
the biggest
risk for the economy now, with official unemployment nearly 10%. Gold will have to
get past
its 65-dma and the Dollar will have to break its Closing Power uptrend, to make the
market regain its footing and get back above the 65-dma.
============================================================================
2/24/2010 Buy B17
No Peerless Sell.
Good Rally Today. The two-day zig and zag have set up
somewhat more reliable uptrend-lines in the Closing Power, A/D Lines, OBV Lines
etc. Now we can put a line through their recent bottoms and watch for that to be
violated.
But DJI is still under 65-dma and that poses important resistance. Even if the
DJI gets 2% past it, that would still be hisrotically consistent with a decline to
the lower band. One good sign: Autos, financials,
the NASDAQ-100 and the SP-500
are rated bullish, in that a majority of their stocks are
above their 65-dma and the
groups' A/D Line are rallying. Below is the
slightly bullish TigerSoft chart of the
SP-500 stocks. It is on a red Buy but it still remains below the 65-dma, like the DJI.
The Dollar is uptrending. This is distinctly bullish for big banks *which are on an
upswing)
but bearish for exports and the larger economy when unemployment is so high.
====================================================================================
2/23/2010 Buy B17
But The Odds of A Decline To The Lower
Band Next Are Greater than 3:1.
Watch to see if the 21-day ma 100 points lower at 10184 is violated. That moving
average acted as support in a few cases like this.
The DJIA has been turned back downards by the resistance of its 65-dma.
Even without a Peerless Sell, this is probably significant, especially since the DJI ran
up so much in 2009 without once breaking this moving average. When we look at all
the
earlier cases of rallies to a flat or nearly flat 65-day mvg.,avgs, we cannot help
but
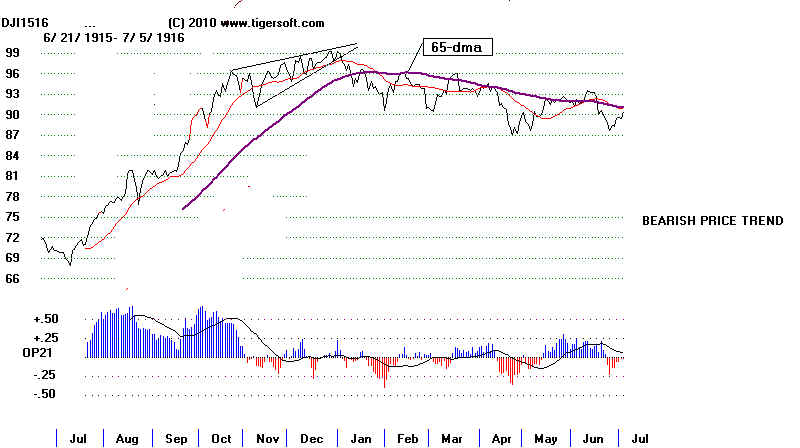
become concerned, even without a Peerless Sell. Below are the cases I could
find back to 1928.. You can see the same phenomenon in the 1915-1916 chart of the DJI.
In 15 cases (or 16 if we count 1916's) the DJI moved down significantly. In three
cases
here the DJI did move 2% over the 65-dma before falling. In only 5 cases, did it
rise significantly.
Even without a Peerless Sell signal, I think we have to be hedged. Our Stock's
hotline
has as many short sales as long positions. That makes the odds of a decline at least
the
lower band more than 3:1.
Rallies Back to the Flat 65-day
mvg.,avg following
a first break in a long DJI advance: 1929-2010
Tests of FLAT 65 DMA after recovery from first break by market following a strong advance.
In 15 cases (or 16 if we count 1916's)
the DJI moved down significantly. In three cases
here the DJI did move 2% over the 65-dma before falling. In only 5 cases, did it
rise significantly.
Even without a Peerless Sell signal, I think we have to be hedged. Our Stock's
hotline
has as many short sales as long positions. That makes the odds of a decline at least
the
lower band more than 3:1.
=================================================================================
P-I IP21
outcome:
----------------------------------------------------------------------------------------
10/21/1929 -103 -.067
new low in 8 days ... CRASH
8/27/1930 -36
.034 2 week rally and ... CRASH
11/14/1932 13 .128 test of recent low.Brief rally...
CRASH
10/6/1933 -107 -.102
97.5 to 84.5 in a week and then steady rally.
5/28/1936 58
.005 152.88 to 149.30 and then up.
3/29/1937 -59
-.086 184.10 to 167.40 in 3 months
1/3/1941 -1
-.049 132.. up 1.5% and then down to 115.50 in 5
9/17/1943 60 .126 139.6 then up 2% more ...then
down to 129.6 (11/30/1943)
3/21/1946 51
.09 197.70 ..rallied to 212.30 (5/31/1946)
8/8/1950 139
.14 215.80 ..rallied to 235.50 (11/24/1950)
10/25/1955 32 -.013
458.40 to 454.90 (21-dma) and
then up to 487.40 (11/16/55)
10/29/1959 11 .045 645.10 to 650.90 (11/6) ...then down to 634.50 (11/16) and then up...679.3 (12/31)
4/21/1966 32 -.035 954.73 ... down to 864.14 in 3 weeks.
12/26/1968 30 -.068
888.12 ... up to 908.29 (S12...1/9) and then down to 825.13 (3/21/1068)
2/14/1969 29 .141 951.95 ... down to 905.77 (2/26)
2/13/1973 -241 -.148 996.76
... Straight down....CRASH
9/2/1975 -140 -.122 823.69 ... down to 796.55 (10/2)
4/2/2004 93 -.098 110470.59 (S12 4/5)... down to 9906.91 (5/17)
6/29/2006 -122 -.021 11190.80
... down to 10739.35 (S12 7/14)
8/31/2007 -11 -.027 13357.74 ... down to 13113.38 (9/7) and then up.
2/19/2010 26 .04 10402.35 ... ?
|
==================================================================================
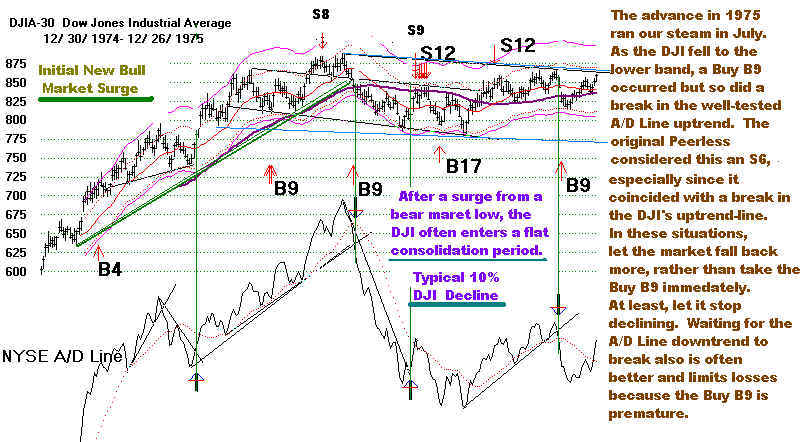
2/22/2010 Buy B17
The DJIA's rally seems to
be faltering at the resistance of its 65-dma.
You can see how close the DJI came to the upper band without tagging it. Rallies
back to
the 65-dma if the
previous long A/D Line uptrend had been broken, or hadbeen decliining,
brought many an important decline, but always before in these cases there was a
Peerless
Sell first. If the A/D Line were now in a pronounced downtrend, we also might be
more
worried. As it is, I'd say the closest parallel is 1975. A 10% decline from
the top occurred then.
Here that would mean the DJI might fall to 9600. But unlike in August 1975, here we
have
no Sell, at least, not yet. Since the upper band has not been reached and since the
CLosing
Powers are still rising, I'd say we just have to hold out long positions and adopt a wait
and
see policy.
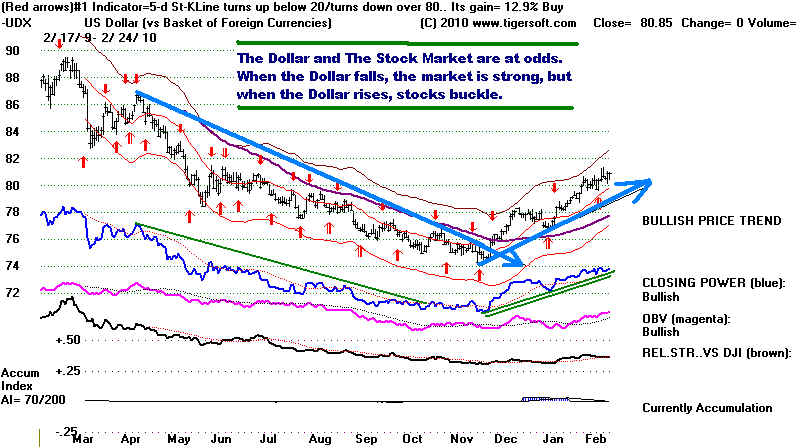
What's Going on with Financials?
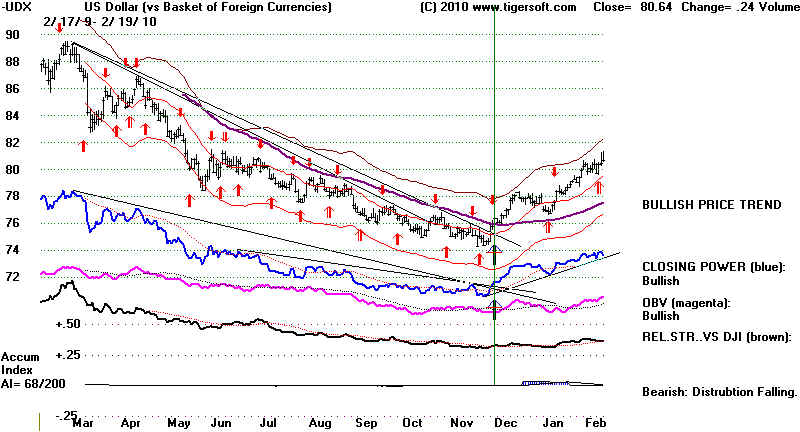
The Dollar's strength now is bearish
for the market. When the Dollar has gone up in the last
few years, the DJIA has fallen. When the Dollar fell in March last year, the DJI
started to rise.
The Treasury and the FED may want a strong Dollar to allow them to help keep interest
rates low,
but that is not without problems for the stock market. The chart of the Dollar below
shows the
uptrend-line for the Closing Power is still intact for the Dollar. This could pose
problems, though
you probably will not here them discussed in the regular media.
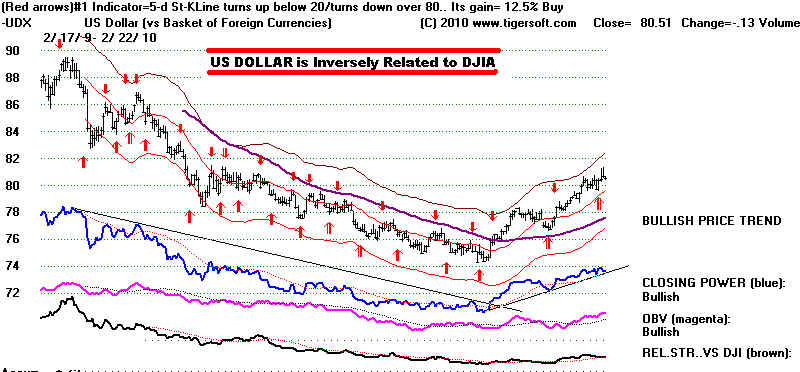
The Dollar remains strong. The
Dollar's movements are quite negatively correlated with
the DJI ups and downs. A strong Dollar, of course, deters exports, but it is not
bearish for all
companies. US Banks stocks do better with a strong dollar, which attract foreign
deposits. The
interests of big banks are certainly well heard in the Obama Administration, via Geithner
and Sumers.
But a strong dollar hurts employment. It is associated with deflation, just what we
don't need
in a near-Depression. My dissertation showed that in the UK in the 1920s and 1930s,
the London
Banks' and Bank of England's pressure for a strong pound contributed greatly to a
clinging
to orthodox financial policies that perpetuated and aggravated the chronic high
unemployment
in what was considered the Locust Years. One Chancellor of the Exchequer after
another
from 1919 to 1938 gave in to the orthodox self-serving bankers' mantras.


Churchill who was Chancellor
of the Exchequer, put the Pound back on the Gold Standard
in 1924 at the Bank of England's
behest. This led directly to a General Strike in 1926. Churchill
later rued that this was his biggest
mistake. (He probably chose not to remember Gallipoli) .
"Churchill later regarded this
as the greatest mistake of his life... The return to the pre-war
exchange rate and to the Gold Standard depressed industries. The most affected was the coal industry....
...the miners dispute led to the General Strike of 1926, Churchill was reported to have suggested
that machine guns be used on the striking miners.... Later economists, as well as people
at the time,
also criticised Churchill's budget measures. These were seen as assisting the generally
prosperous
rentier banking and salaried classes (to which Churchill and his associates generally
belonged) at the
expense of manufacturers and exporters which were known then to be suffering from imports
and
from competition in traditional export markets,[89""
==================================================================================
2/19/2010
Buy B17
The DJIA has reached the resisatance of its 65-dma. This is a point of high
inflection.
Besides,
the still operative Buy B17, breadth (advances minus declines and new highs minus new
lows)
remains constructive and the Closing Powers are rising for the DIA, SPY and QQQQ.
The studies
I have done show it is best to wait for a Peerless Sell and or a break in a well-tested
rising
Closing Power or the Tiger Professional Power Index.
See Tiger-Pro Indicator on the SPY charts since
1999.
http://www.tigersoftware.com/TGR-PRO-POWER-SPY/index.html
The uniformity of the market now is unusual here, possibly suggesting the way in which
market
is
dominated by the futures market, the major ETFs and some hidden understanding reached
between the
Fed and dominant market players like Goldman Sachs. All the key indexes and market
ETFs
have
reached simultaneously their flattening 65-day mvg, avgs. See the charts of the
DJIA,
SP-500,
NASDAQ and QQQQ. These levels usually constitute important resistance. This is most
likely to
bring a reversal if the Accumulation Index readings are negative when a reversal downwards
occurs.
Right now, the DJI shows a current Accum. index (IP21) value of + .04 as it
sits 2.1% over the
21-day ma
and rests on its 65-dma. More beairsh is the SP-500's IP21 value of +.004 and the
SPY's
IP21 of
-.047. Most bullish is the NASDAQ's IP21 of .142. Interestingly, the
QQQQ's IP21 is a bearish
-.001 with
it 2.3% over the 21-dma.
Generally, I have favored watching the stocks that look the most vulnerable only for
purposes
of hedging.
Instead, watch the super stocks, the "bubble" stocks, to get a sense of
when the
overall
market will become very weak. That was true in 1968 when I was a stock broker on
Wall Street
and I have demonstrated elsewhere that it was true in 2001, 2007 and 2008. The
trick here
seems to be to watch the CLosing Power or the Pro-Power uptrends. When they
are
violated after a long advance, 500% or more in 9 months, they have likely reached their
peak.
The holders in these stocks, I surmise, only sell them because they can see dark
clouds
coming for
the general market. That is, at least, my working hypothesis. The public, by
contrast,
chases
these stocks after being cautious or suspicious for most of their advance. So, watch
the
Closing
Power, not the Opening Power.
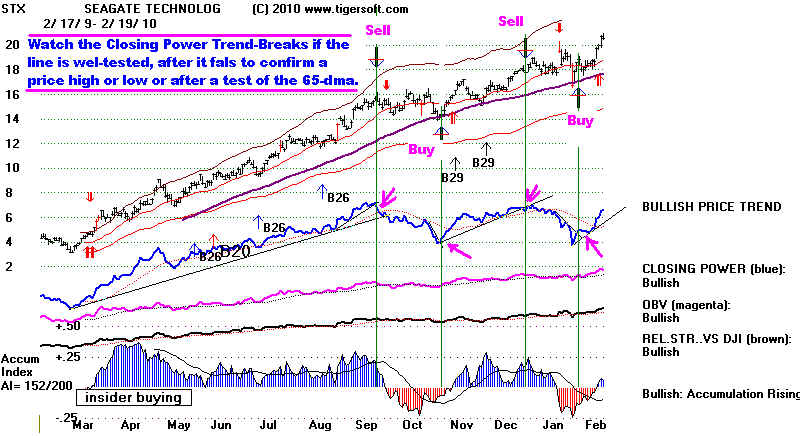
New 2/20/2010
- Watch The Pros To
Catch The Tops in "Bubble" Stocks
and The Market, Too.
STX is the
best performing in the NASDAQ-100 of the last 9 months. The study above would
predict
that when it breaks its CLosing Power uptrend-line, the overal market will be ready
for a 10%
retreat and possibly more. We will consider this concept later this coming week
and look at
more stocks.
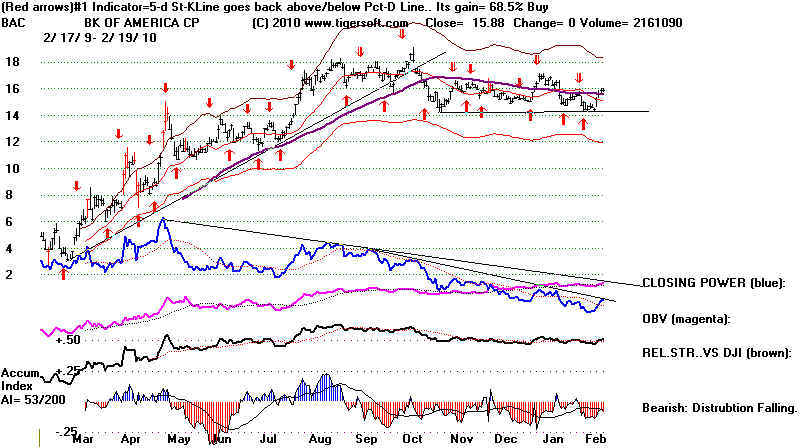
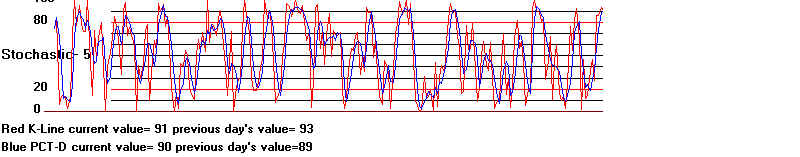
Watch BAC (Bank of America). It is on the verge of a new red Sell. These are
based on
5 day
stochastics. This system has given the best signals for BAC for more than 2 years.
BAC
shows internal weakness: a falling Closing Power and (red) negative Distribution.
If it
does fall back below its 65-dma, that is apt to cause the rest of the financials
and
then the market to retreat back to support again. But I would not look for a big
decline
based
on BAC or financial weakness. Such weakness in bank stocks seems reliably to prompt
the
Fed, the Treasury or Obama to do or say something to shore financials up. Recall
how
Obama praised the CEOs of Godman and JPM, just one day after he said "if the banks
want
a fight" they would get it in the matter of financial regulatory reform.
Watch Goldman Sach's blue Closing Power to see if it clinches the automatic red Sell.
Except for OBV, its internal strength indicators clearly topped out last October. If
it does clinch
the
Sell, that will put more pressure on the general market.
The Dollar's strength has hurt the performance of foreign and gold stocks. US stocks
are
generally on optimized TigerSoft Buys. More than half are now above their 65-dma.
Group Charts and Statistics: 2/20/2010
Tiger Index of Groups of Stocks with A/D Line and Percent above 65 dma
( http://www.tigersoftware.com/-1TGRHL2010/Gr-21910/index.html
_
Number
Buy/Sell Pct of Stocks
of Stock
Status above 65-dma
--------------------------------------------------------------------------
39
AUTO
Buy 56.4%
65
CHEMICALS
Buy 55.4%
158 CHINA
Buy 33.5%
34
DJI and 4 major ETFs
Buy 58.8%
55
FOREIGN ETFS
Buy 14.5%
Weakest Group. Strong Dollar.
112
FINANCIALS
SELL 61.6%
Falling back from 65-dma
129 FTSE
and LONDON STOCKS Buy
49.3%
58
GOLD/SILVER STOCKS
Buy 28.1%
Strong Dollar.
29
HOME-BLDG STOCKS
Buy
75.9%
101
NASDAQ-100 STOCKS
SELL 66.1%
267 OIL STOCKS
Buy 62.5%
492 SP-500
STOCKS
Buy 60.8%
=============================================================================
2/18/2010
Buy B17 The DJI's 65-Day MA Has Been Reached.
It will be bearish if the market
reverses sharply downward from the
65-day ma. This seems unlikely, but our Stocks' Hotline remains hedged
by being short some of the most "bearish" stocks the Power Ranker
can find.
The FED has raised the Discount rate
to 3/4% from 1/2%. This is a modest
increase. It should not come as a surprise to anyone. But it occurs with the
DJI at a potential pivot point, the 65-day ma. Some backing and filling here
is
expected next. The leaders in the market now are more defensive.
Biotechs,
military and food stocks made up manyt of the new highs. The DJI will have
to rally another 1% to set up the possibility of a Sell. Watch the breadth
(NYSE advances and declines). The P-Indicator will have to be in negative
territory (It now stands at -71.) with the DJI a percent higher for a Sell S9.
Because
the P-Indicator is the simple 21-day ma of NYSE advances and declines, the
days' breadth numbers a month ago that are going to be dropped off will have
as much importance as tomorrow's or Monday's breadth numbers. The next three
days' numbers that will be dropped off are each quite negative. These will
boost
the P-Indicator appreciably Friday, Monday and Tuesday. Another thing to
appreciate is that as we approach the end of February, the bullish seasonality of
March comes into play. Between 1965 and 2008, Marches saw the DJI rise
66.7% of the time.
1/20/2010 811 advances 2257 declines
1/21/2010 641 advances 2428 declines
1/22/2010 559 advances 2538 declines.
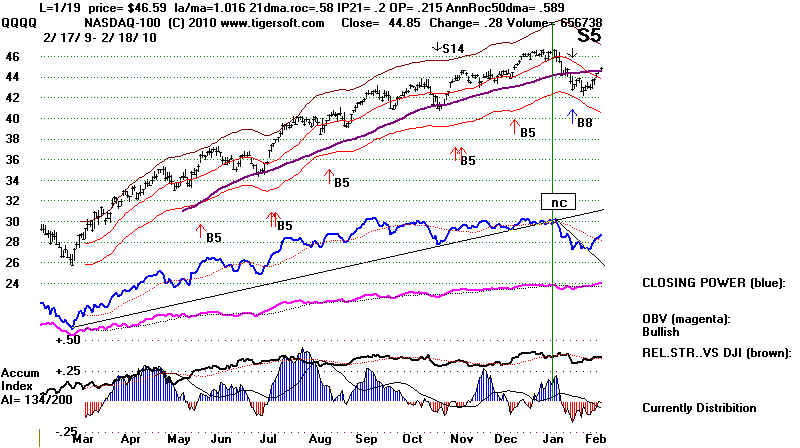
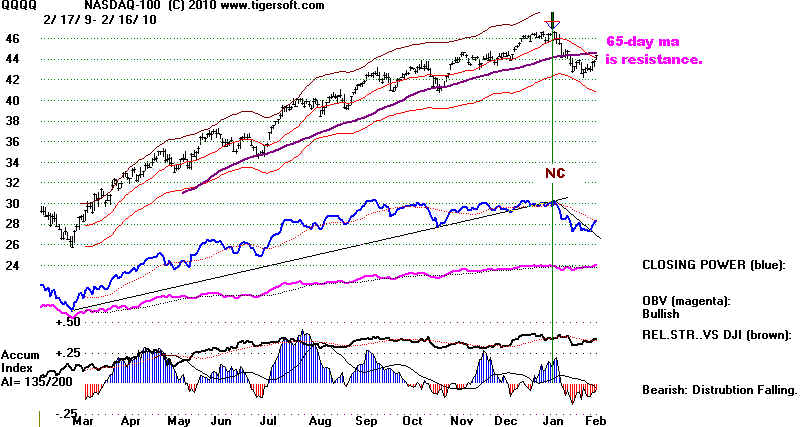
The NASDAQ and QQQQ are both above
their rising 65-day mvg.avgs.
This is more bullish than if the 65-day ma was flat or falling. However, as
you can see below, the Accumulation Index is still negative for the QQQQ.
57% of the NASDAQ-100 stocks are above their 65-day ma. Much more
vulnerable appear to be foreign ETFs, judging from the Tiger Index
charts of foregin ETFs. These charts (See further below.) show a negative
Accum. index, a falling 65-dma and the fact that only 20% of these ETFs
are above their 65-dma.
----------- TIGER INDEX OF
FOREIGN ETFS --------
============================================================================
2/17/2010
Buy B17 The DJI's 65-Day MA Has Been Reached.
Usually, a pullback starts from here. The
QQQQ and SPY are also at
the frequent high inflection point of the 65-dma. This is where we let the
market show us its intentions. The SPY's 65-dma is rising. That gives
us hope that the rally will continue. However, if the indexes do fall back
much, this will cause the key 65-dma to turn down.
The Buy B17 has brought the DJI to the
upper 1.0% level above the 21-dma.
The
Dollar's uptrend was reasserted today. Gold futures are down as this
is written.
The Dollar and the Stock Market have had an inverse relationship
for most of
the last two years. This would be in keeping with a minor
retreat now
from the 21-dma. If this happens, it will set up uptrendlines
for the
Closing Power and the Tiger-Pro-Power which we can use to judge
if the
65-dma is to be exceeded.
You can see the improvement in the percentage
of stocks above
their key 65-dma
for various groups of stocks with TigerSoft. Click on these
these links:
Home-Building, Financial
Stocks, QQQQ, SP-500,
Oil Stocks
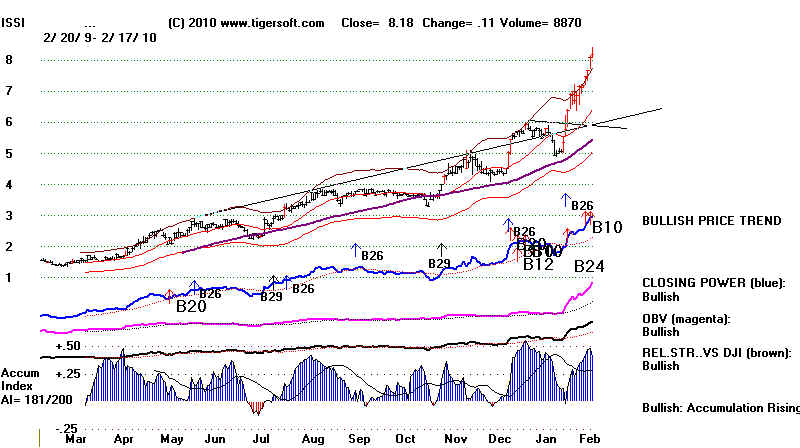
Here are some of
the strongest stocks right now: TEG, HRC,
DGIT, COHR, AEF
and below ISSI,
showing that the concepts behind explosive super stocks
still operate,
though with fewer stocks.
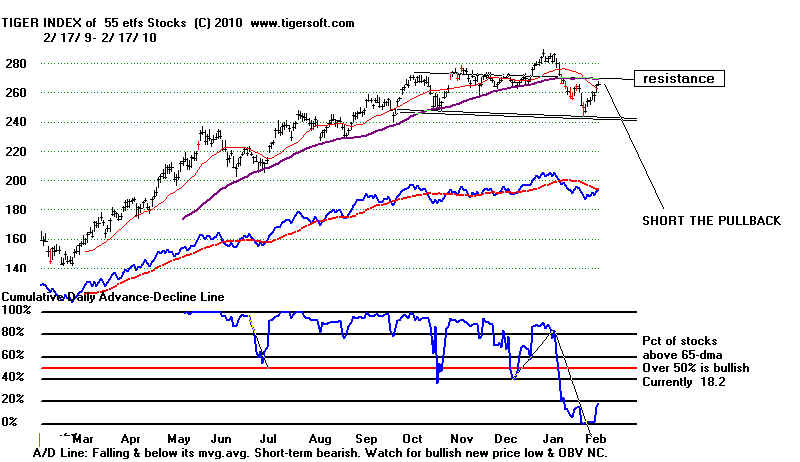
Below is the
Tiger Index of 55 foreign ETFs.
===============================================================================
2/16/2010 Buy B17 Now The
65-Day MA Will Pose Resistance.
The Buy B17 told us to expect a rally
to at least the 65-day ma. We are
almost there.
Will the market move higher? There is no Peerless Sell. But
that does not
guarantee against another decline, possibly to 9600. See the
history of B17s.
10 of the 47 B17s occurring in already rising markets like
we now have
produced declines of more than 2.5% before rallying to the
next Peerless
sell. This statistic should give us some comfort and optimism.
3/15/1935 B17 3% paper loss before 18.6% gain on next Peerless Sell.
1/12/1938 B17 5% paper loss before 1.0% gain.
8/11/1943 B17 5% paper loss before 0.5% loss.
4/7/1953 B17 7% paper loss before 8.8% gain.
2/5/1957 B17 4% paper loss before 10.3% gain.
9/15/1957 B17 2.5% paper loss before 8.7% gain.
2/11/1960 B17 3% paper loss before 0.7% gain
11/10/1971 B17 3.5% paper loss before 14.1% gain.
5/22/1984 B17 3% paper loss before gain of 9.8%.
2/4/2000 B17 9% paper loss before gain of 1.4%
NYSE's volume was
low on today's big jump. That is not good. Volume is
usually needed to
eat up overhead supply. But breadth today was excellent.
There were 2000
more advancing stocks on the NYSE than advancing stocks.
This is the best
such figure since early November. Good breadth has trumped
low volume since
March last year. Also bullish, and, at first surprising, the
market chose to
disregard the "news" that foreign buyers of US government
securities (DEBT)
back-peddled at a record rate, Actually, this news hurts the
Dollar and
therefore helps the stock market. The 10 week uptrend in the CLosing
Power for the
Dollar is still rising. So, we can't count on the Dollar's rally being over.
Watch to see if the QQQQ can get back above its 65-dma, a little above 44.5.
The (red)
negative distribution there usually indicates selling that is advisable
on a reversal
from this mvg.avg. But in this case, the 65-dma is still rising. That
makes our market
more bullish than if the 65-dma was flat or falling. A quick surpassing
the 65-dma would
be bullish.
We want to watch the CLosing Power and TGR-Pro-Pwr uptrendlines.
The study I did this past weekend of this
indicator and the SPY shows that
a failure to surpass the 65-dma AND a
simultaneous break in these indicators'
uptrends is relialy bearish, as a short-term
SELL. Of course, the lack of an
automatic Peerless Sell at the top, especially
the absence of a Sell S9, suggests
that any decline is likely to not take the DJI
more than 10% down from its peak,
about 9600. http://www.tigersoftware.com/TGR-PRO-POWER-SPY/index.html
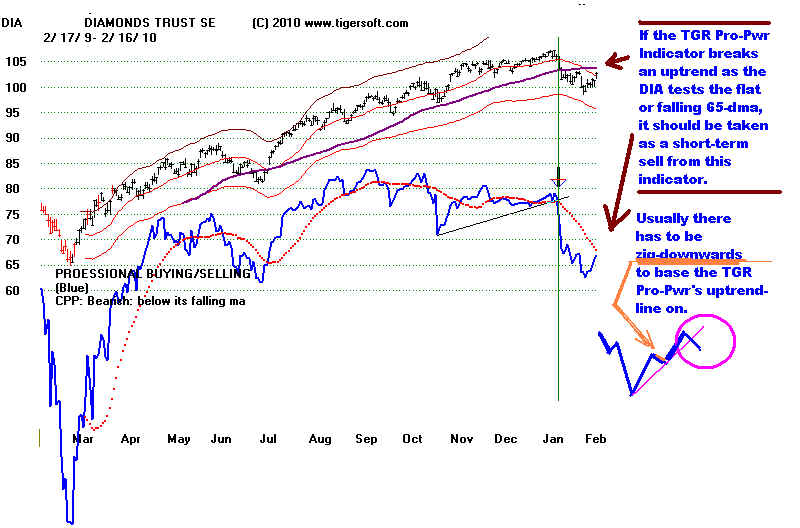
What to
buy? Oil stocks are the leaders, as I suggested last week. .
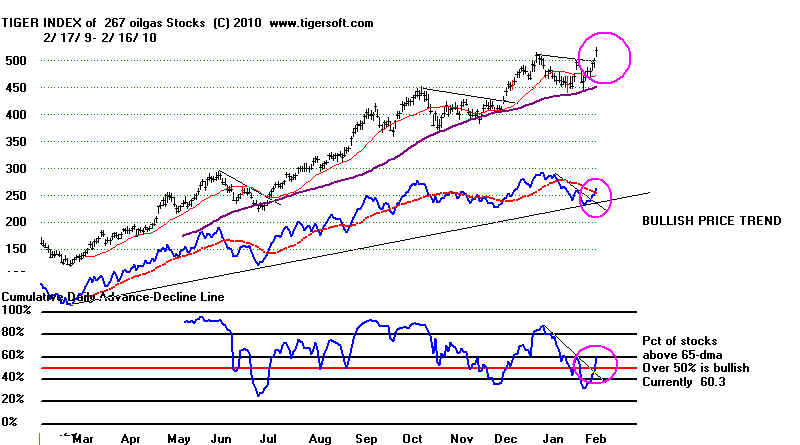
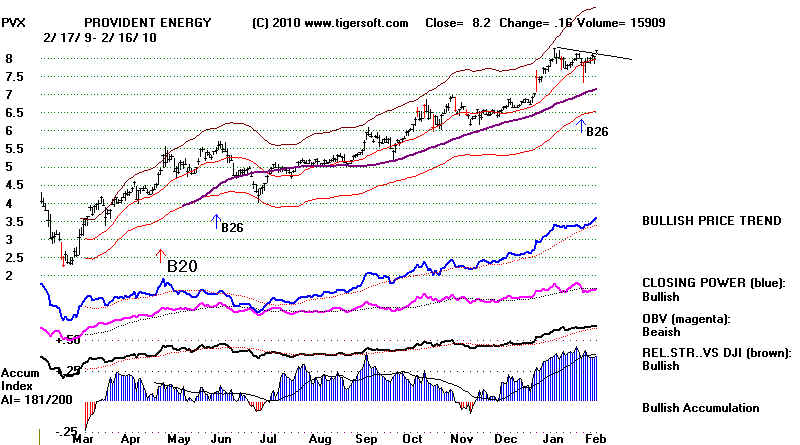
==================================================================================
2/12/2010 Buy B17
The Buy B17 tells us to expect a rally to at least
the 65-day ma. The
Closing Power
downtrends have been bullishly broken above. The NASDAQ's
high level of
Accumulation for the last 200 days stands at 187. This means that
the Accumulation
Index has been positive 187 of the last 200 days. This usually
means that
weakness will be met with lots of institutional support and buying.
A further rally
of 9%, at a minimum, should be expected for the NASDAQ, provided
the NASDAQ starts
again to outperform the DJIA.
High AI/200 Readings for the NASDAQ
A high AI/200
reading above 185 does not mean that there cannot be 10%-12%
declines.
But first, there must be a Peerless Sell Signal. And typically, the
NASDAQ rises, at
least 8% more.
(1) On 6/30/89, the NASDAQ's AI/200 was 193. 10% percent higher,
on 10/4/89, Peerless gave an S9 signal on the DJI. The NASDAQ immediately
retreated, falling 15% in 3 1/2 months.
(2) on 12/31/91, the NASDAQ's AI/200 was 184. Six weeks later it was 9% higher
when it formed a clear head and shoulders top pattern with a neckline still 5% higher,
and so still clearly profitable.
(3) On 12/1/95, the NASDAQ's AI/200 was 187. The NASDAQ was then 1066.
By 5/21/96, it has risen 15% to 1244
where a Peerless Sell S1 might have
been
used to take profits before a 2 month 15% decline.
(4) On 8/4/99, the AI/200 was 187. By the end of 1999, the NASDAQ was up 40%.
Please see
the new Tiger-Pro Indicator on the SPY charts since 1999.
http://www.tigersoftware.com/TGR-PRO-POWER-SPY/index.html
This new indicator factors
in volume to the Closing Power Percent. It excels,
I think in
showing when new price highs or lows are unconfirmed. In these
circumstances,
subsequent Tiger-Pro trend-breaks take on new significance
and reliability.
Such sells I call judged "Sell S1s" and "Buy B1s". The
SPY's
rally to 115 was
unconfirmed. The steeper "Pro's" uptrendline was crossed
at 115.06 on
1/19/2010. Using the less steep uptrendline would have meant
waiting until
1/21/2010 when the SPY was down to 111.70. After multiple
unconfirmed
new price highs, we want to start using the steeper trendlines
that begin at the
Pro's lowest point of the year.
--------------------------------------------------------------------------------------------------------------------------------
NEW - SPY and - TIGER-PRO
(PROFESSIONAL BUYING POWER)
1999-2010 Charts and Suggested Trading Rules:
http://www.tigersoftware.com/TGR-PRO-POWER-SPY/index.html
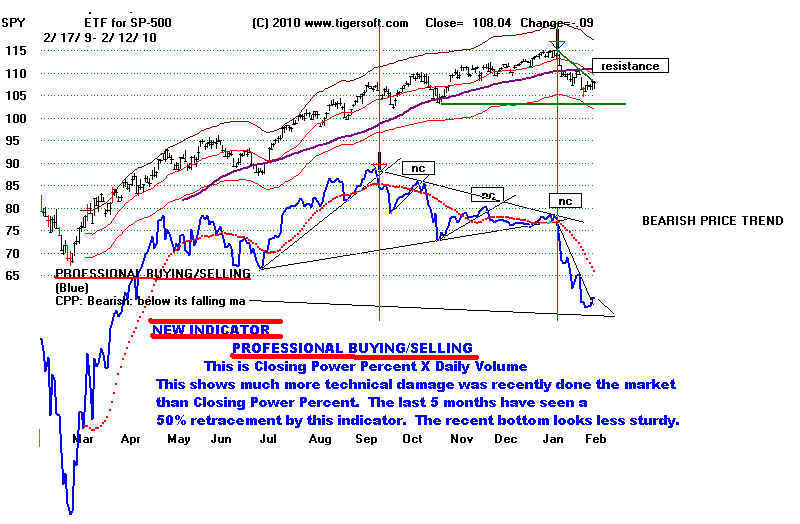
----------------------------------------------------------- NASDAQ
-----------------------------------------------------------
NASDAQ shows consistently positive Accumulation
A rally past right shoulder and 65-dma
would be very constructive, But first, it needs
to reach the 2200 resistance there. The signals
from Peerless-DJIA are superimposed on the NASDAQ.
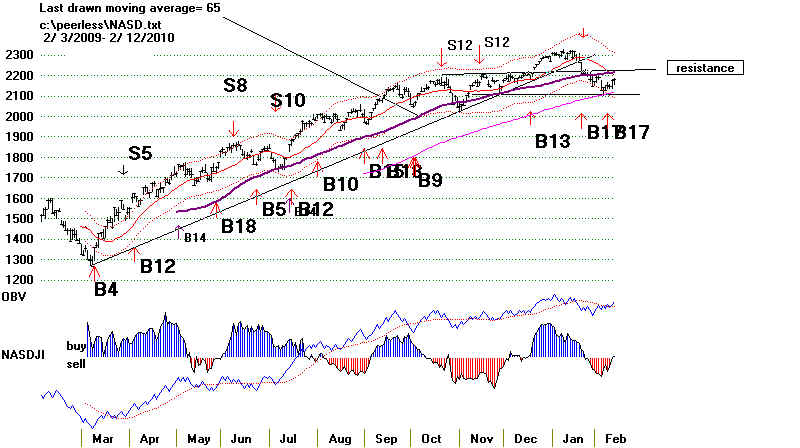
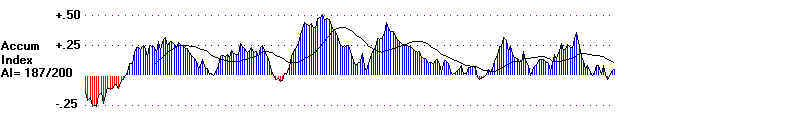
========================== DIA
==========================
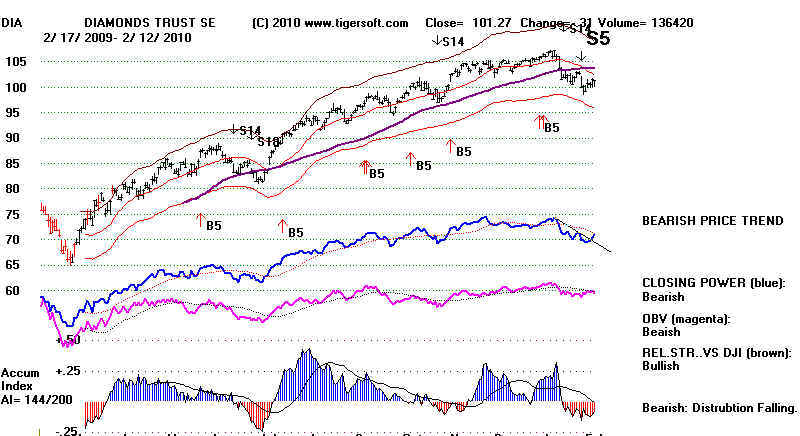
NEW INDICATOR - TIGERSOFT PROFESSIONAL BUYING/SELLING POWER
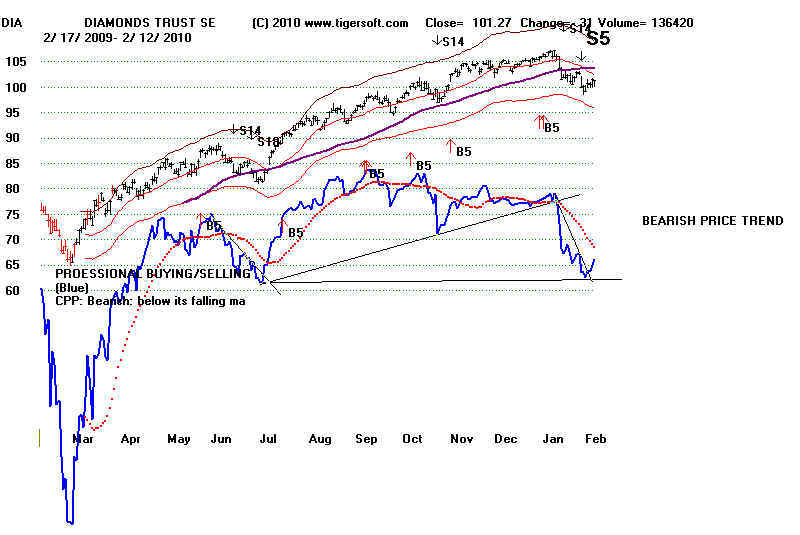
QQQQ, Professional Buying/Selling Power
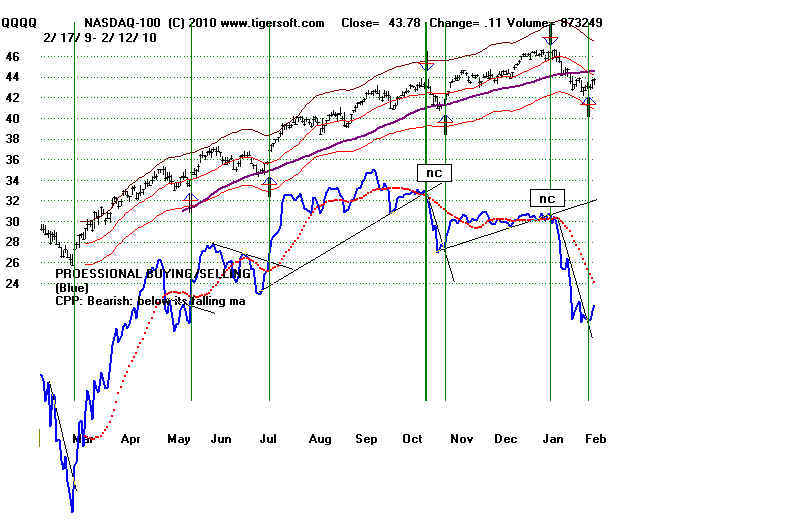
NASDAQ Shows A CCI Buy
NASDAQ has risen back above 50
after the CCI did not
confirm the last low in prices.
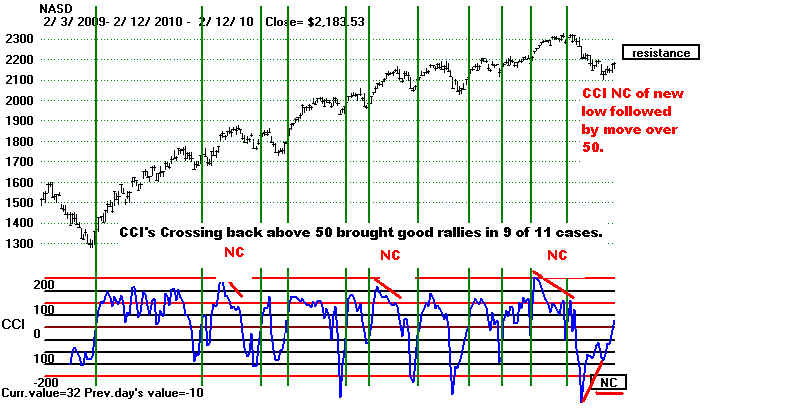


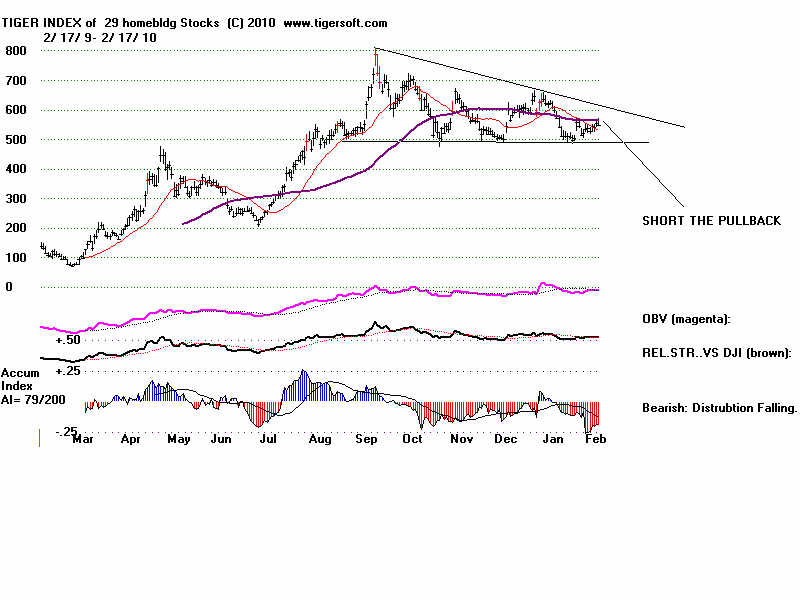
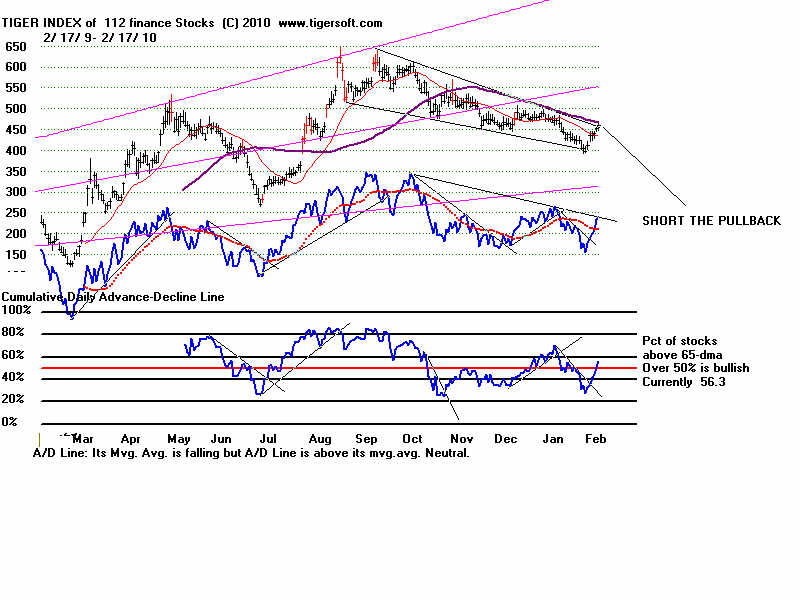
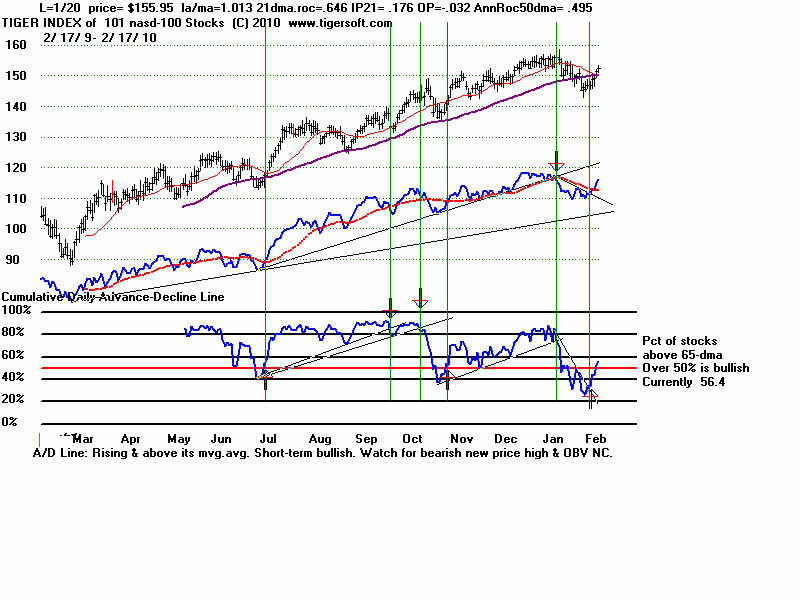
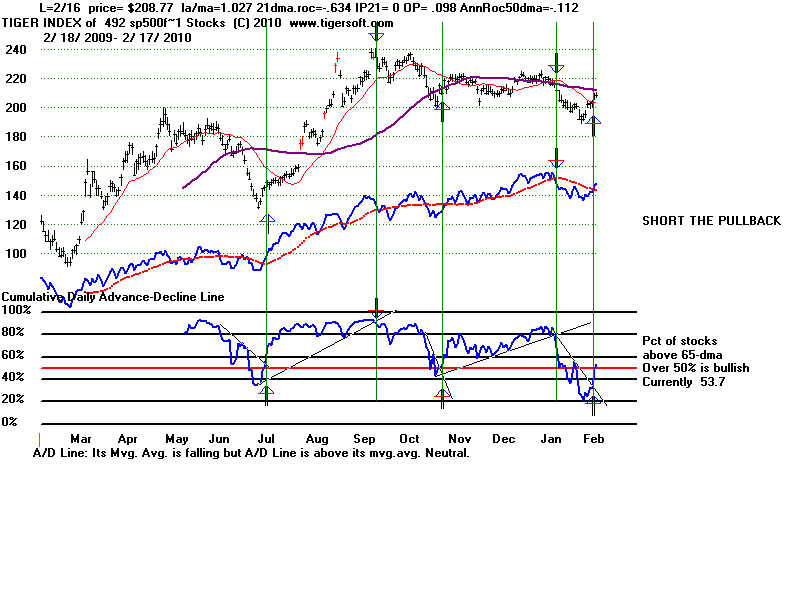
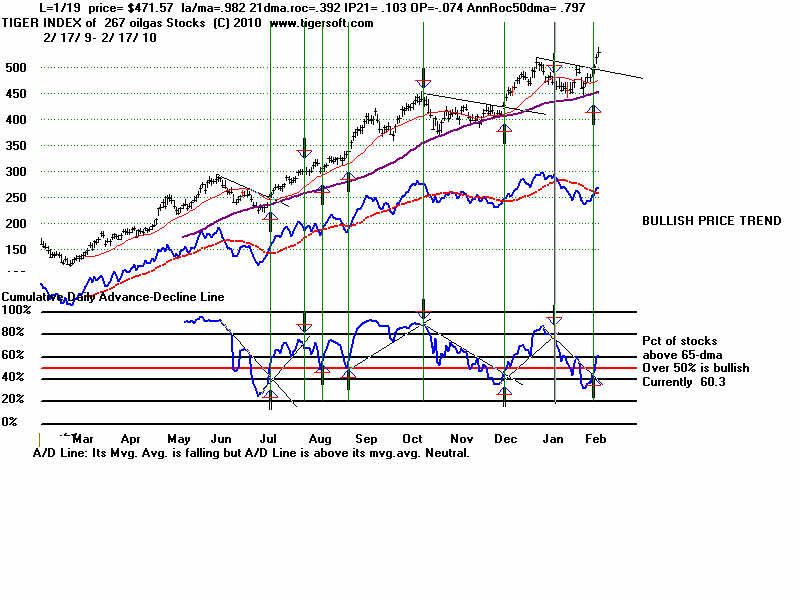
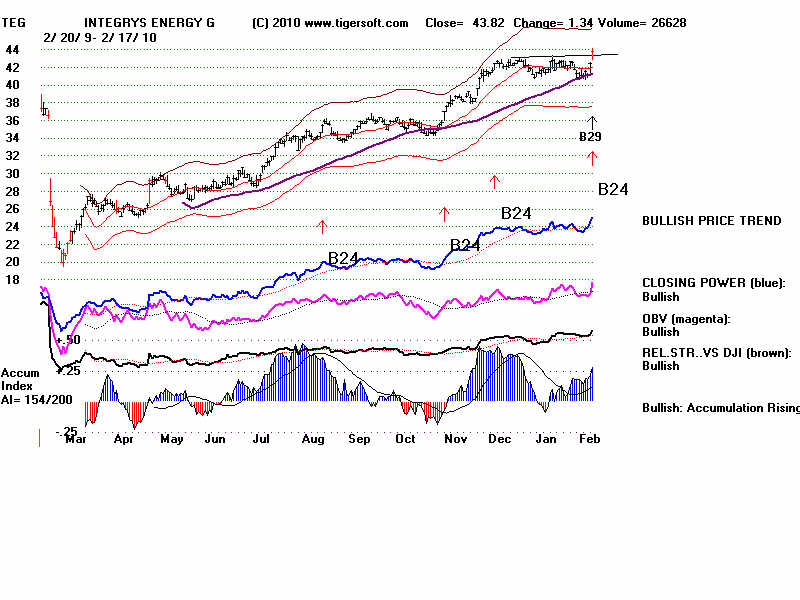
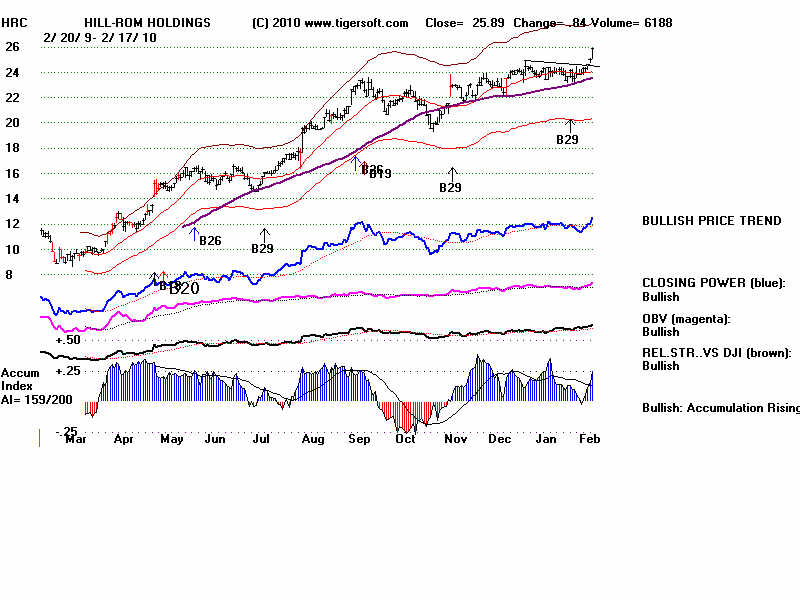
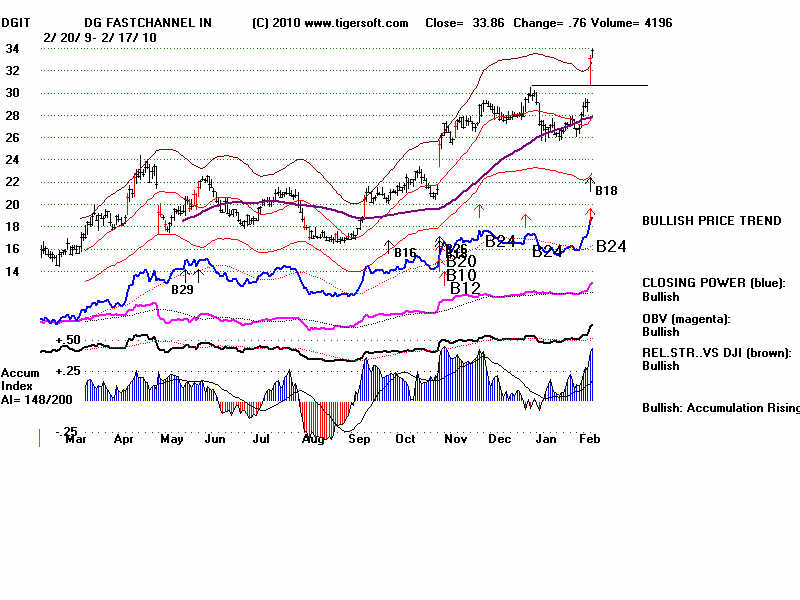
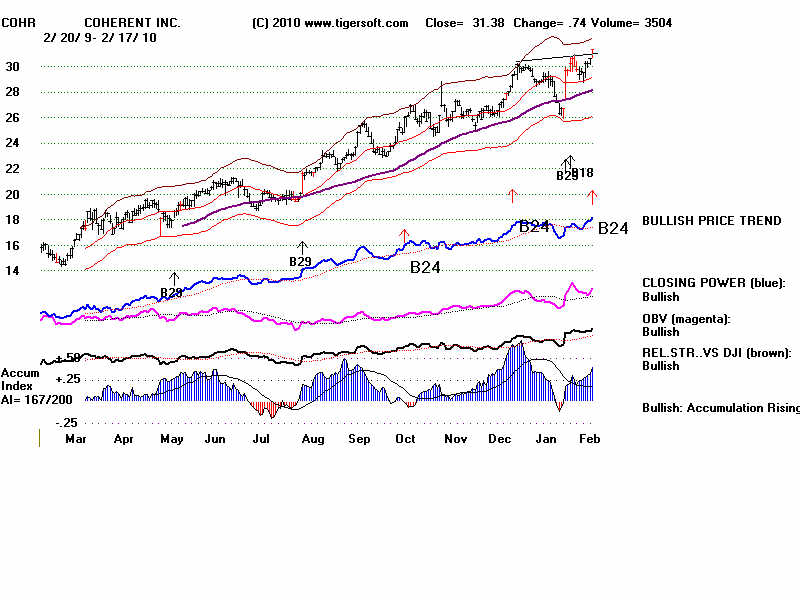
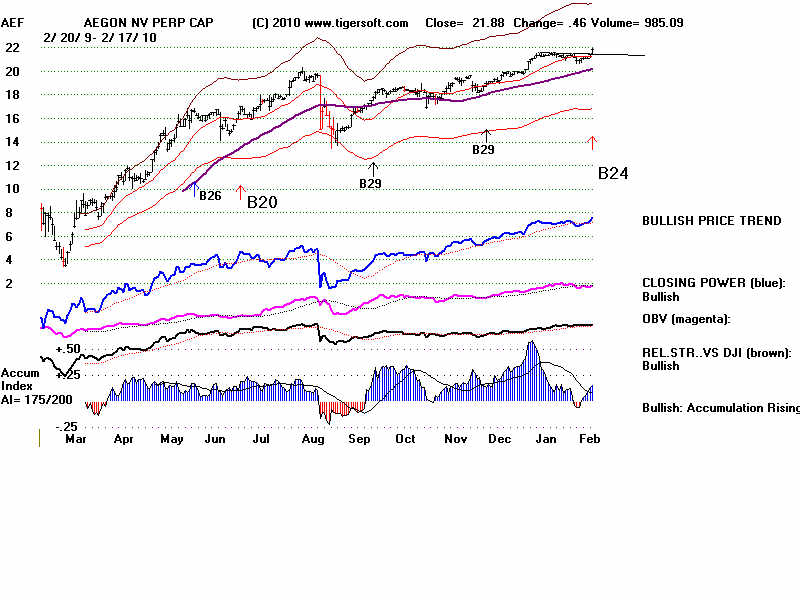