Older TigerSoft and Peerless Daily Hotlines.
3/31/2009 to 4/30/2009
(C) 2009, William Schmidt, Ph.D.
Important Notice:
Redistribution of any text or concepts here is a violation
of copyright laws. This is valuable intellectual property.
All violators will be subject to legal action.
www.tigersoft.com
====================================================================================
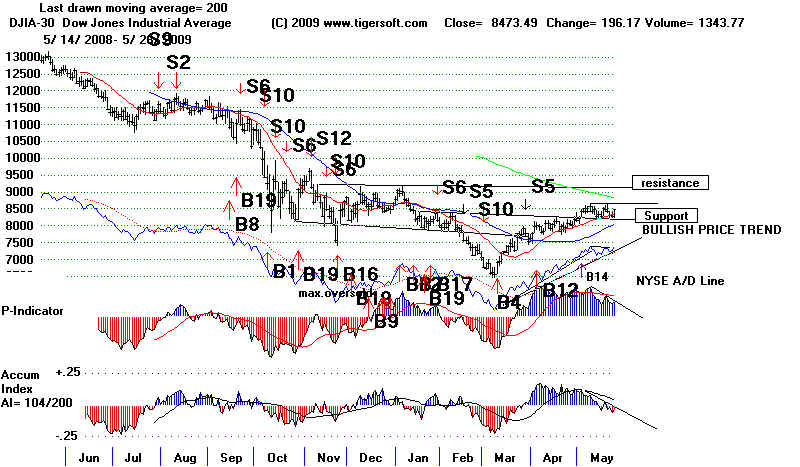
4/30/2009 8168.12
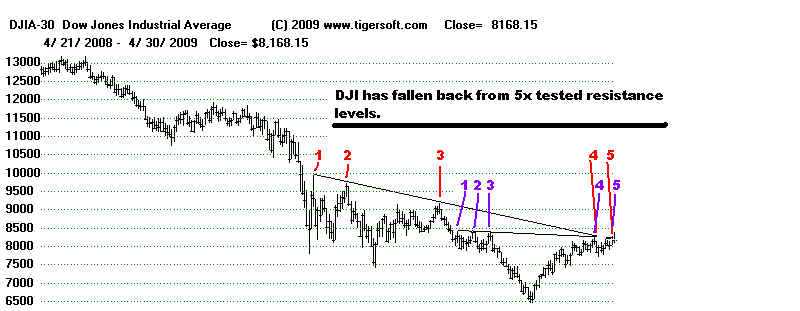
Resistance
Reached. No Peerless Sell Signal Yet. But We're Much Closer to A Resolution.
The
Closing Power uptrends are all still intact. So, is the NYSE A/D Line uptrend.
The
Buy B12 Has Not Been Reversed.
Often
a declining 30-wk ma is bearish. The DJI has reached that point and turned down
today
on
an increase in volume. Similarly, a 200-day ma is bearish. The NASDAQ reached
that level
today,
but did not close down for the day. I definitely want to continue holding our high
accumulation,
strong
Closing Power stocks.
http://www.tigersoftware.com/TigerBlogs/April-30-2009/index.html
Unfortunately, the DJI closed 100 points below its
opening. This shows professionals
were
selling into strength. This is the opposite of what we want to see to remain
bullish.
Weak
breadth tomorrow often leads to spill-over weakness on Monday. So, unless there
is
strength from the opening or a strong recovery in the second half of trading tomorrow,
it
looks like the NYSE A/D Line uptrend and the uptrends of the Closing Powers may be
violated
before the DJI can breakout on a closing basis over the 8250-8300 resistance.
You
may want to anticipate this if you are a short-term trader. In that case you will
take
comfort
in the fact that the DJI's Accumulation Index has closed today slightly below
its
21-day ma. If the DJI were now in extreme bearish mode, (which is not so because
we
are no longer down more than 40% from the 12 month high), this last event would be
a
Sell S6. Another thing: the new Peerless manual, which I am fitfully working
on and
will
release when it's done, mentions the importance of the fifth test of resistance as most
often
being a key pivot-point of reversal.
Watch the Accum. Index and Its 21-Day MA
I
want to stress that penetrations of the AI below its ma often give very good sell signals,
especially
when the 50-day ma is declining. That is only true here for the DJIA and the DIA.
It
is not yet true for the NASDAQ, SPY or QQQQ.
Peerless
has always been an intermediate-term system, so I have to say wait for a clear break
in
the NYSE A/D Line uptrend. Going back to 1965, the DJI, on average, is up
59.1% of the
time
over the next two weeks, but for the month of May rises only 47.7% of the time and
only
45.5% of the time over the next two months. By itself, this suggests that there
could be more
upside
action.
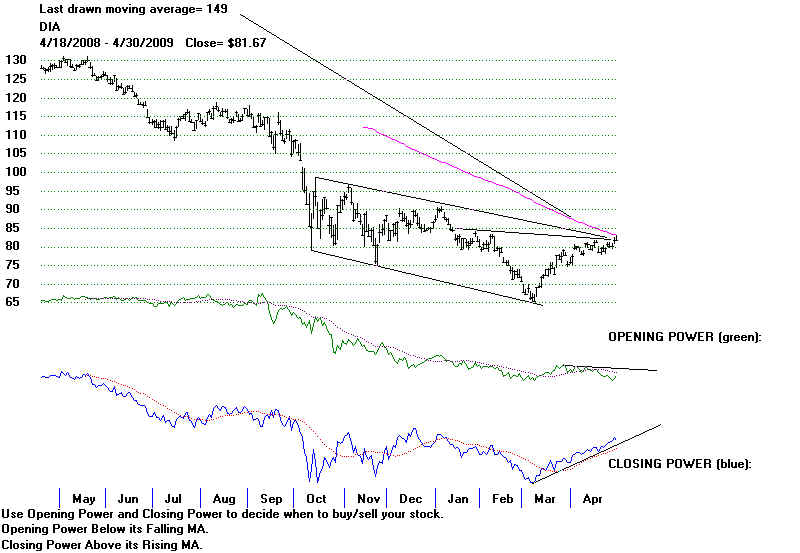
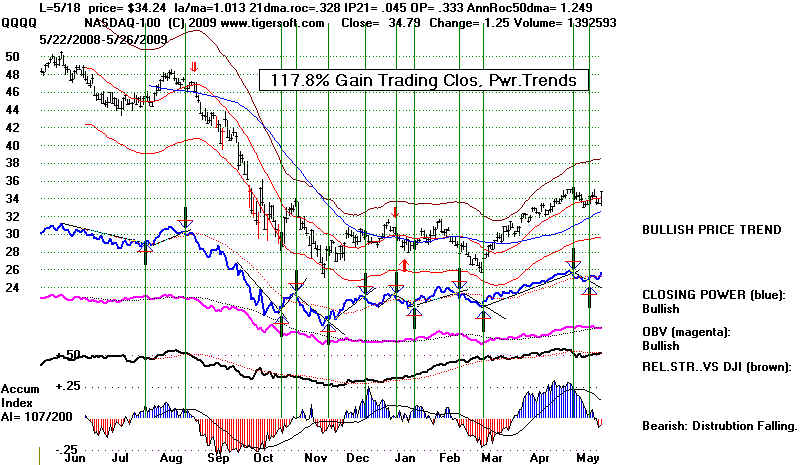
DIA
(DJIA-ETF below) - Closing Power is bullishly rising.
The
DIA is falling back from its falling 30-week ma. It could not
achieve
a decisive breakout past its flat neckline resistance.
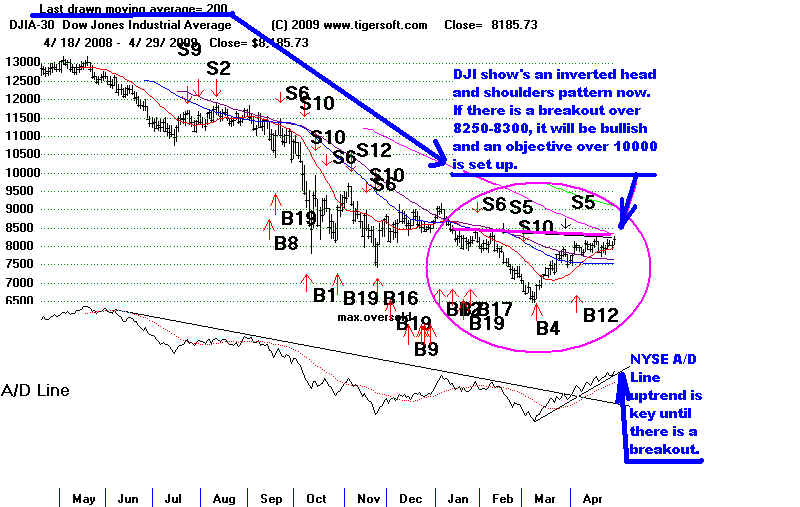
4-29-2009
DJI Chart with superimposed signals. We are using the normal more,
not the bearish mode,
as
the DJI is back above a line (not drawn below) that is 40% down from the highs of last
April.
We saw really excellent breadth today, There were 2597
up on the NYSE
and
only 493 decliners. Up volume was 8x down volume. I have previously said
that
this
rally is special because of the high number of days when daily NYSE advances were
5x
the number of declining stocks. I have also said that such very good breadth
goes
a
long way to make up for the generally low volume in the intermediate-term.
Eventually
the
low volume will prevent the rally from surpassing a resistance line. That target
will
be 9000 if we get a clearer breakout closing past resistance. There is a good chance
the
8250 intra-day resistance will be exceeded tomorrow at the close. That
will make
the
inverted head and shoulders pattern take shape so that others will see it, become
more
sanguine and buy.
The
DJI still will then have to get past its falling 200-day ma at 8326 and then the falling
200-day
ma at 9100.
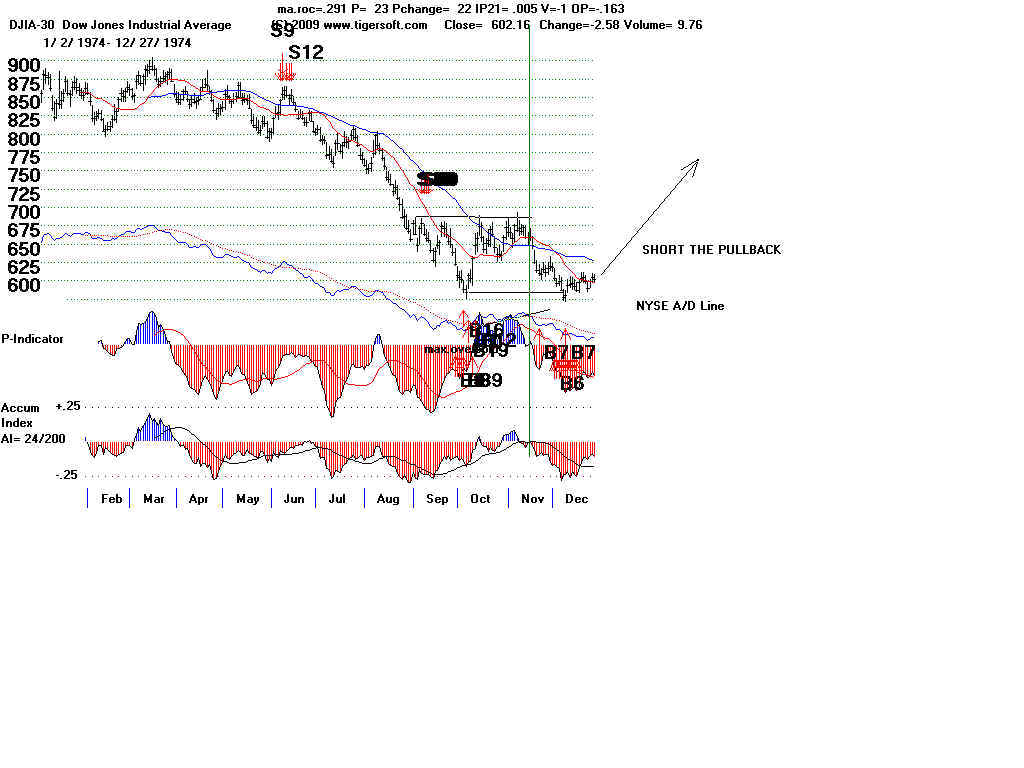
The
DJI's internal strength indicators are all too high now to make us expect a big
reversal
downwards. For example, they are much higher now than they were right before
the
DJI retreated in November 1974, from a similar resistance and then made a new low.
2009
11/7 before
decline
21-dma-roc
(annualized momentum) =99.6% 74.3%
P-Indicator
=
+66
124
P-ch
=
+175
-31
IP21
(Current AI) =
.129
-.005
V-Ind
=
222
0
OBVPct
=
.275
.034
Right
now, there's no way to rule out a pullback from the well-tested 8200-8250. A break
in
the NYSE A/D Line before the DJI surpasses 8300 on a closing basis would signal a retreat
to
the lower band near 7600, at least, in the next move for the DJI. A break in the
NYSE A/D
Line
uptrend would also have a ripple negative effect on many of the secondary stocks that
are
doing so well.
DJI-Signals Last
signal B12, NYSE A/D Line uptrend and at flat, well-tested resistance
DJI-1 All 3
internal strength indicators are rising above their rising ma.
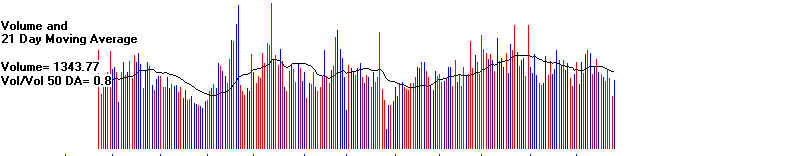
DJI-2 Volume
is low.
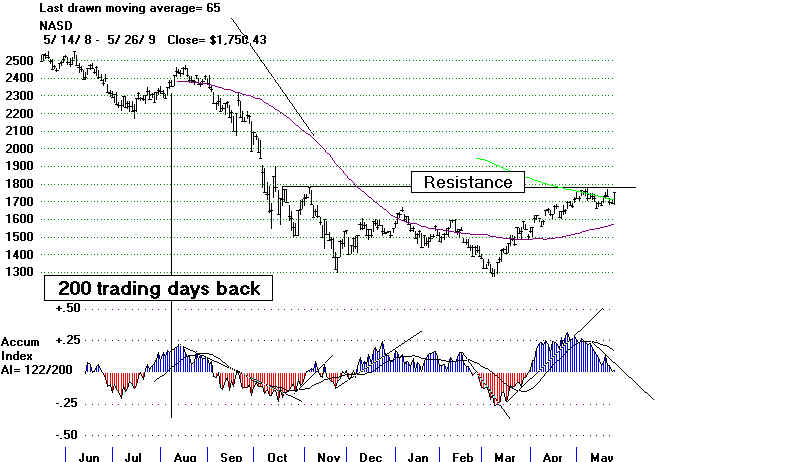
NASDAQ
The NASDAQ's NASDJI relative strength indicator remains very positive.
But
the NASDAQ is approaching its declining 200-day ma now at 1754,
41
points or 3% higher.
DIA Closing
Power is bullishly rising. The DIA's Closing Power is bullishly ahead of
its
price line.
QQQQ
All indicators are bullishly rising. There is some weakening of
its strength
relative
to the DJI. This may be explained by the fact that it is at its falling 200-day ma.
SPY
Closing Power is bullishly rising.
GLD
SLV
DJIA
stocks: IBM
CVX XOM
JPM
4-28-2009 The DJI's chart shows that a very
bullish inverted head and shoulders
pattern
has emerged. It will take much more volume to confirm a breakout above the
8300
neckline. But if that pattern is bullishly completed with an upside breakout,
in
keeping with the now active Buy B12, then 9000 and 10,000 become realistic upside targets
while
lower priced high accumulation stocks run upwards, as in a new bull market.
Unfortunately,
one severe day's decline with very bad breadth will cause the
NYSE
A/D Line uptrend to be violated for a judged Sell S6. In these circumstances, market
history
shows a decline to the lower band and 7500 is almost a certainty, with an outside
chance
for a deeper decline back to 6500. The pattern's symetry requires an upside breakout
in
less than a week. Seasonality is bullish for a week. But in it is
distictly bearish for the
next
month or two. Since 1965, the DJI has risen only 47.7% of the time in the
month
after
4/28 and after two months, the DJI is only up 43.2% of the time. Because the Closing
Power
is still uptrending for the SPY, QQQQ and DIA, I would give the DJI the rest of the
week
to mount its rally. If it does not, I would assume the resistance is just too much
at this time.

DJI-Signals
DJI-Volume
NASDAQ
DIA
QQQQ
SPY
See how breaks in the NYSE A/D Line uptrends before a horizontal breakout
brought
declines back to at least the lower band, but in 1974 and 2003 back to the previous
lows.
1957-1958
1966-1967
1974
1979-1980
1982 1990-1991
1998
2002-2003
The 50-day ma is resistance, especially if the Accumulation
Index is negative.
GLD
SLV
The
DJI-30 is being boosted by the rising Closing Power Lines of the higher priced
DJIA
stocks: IBM CVX
JPM

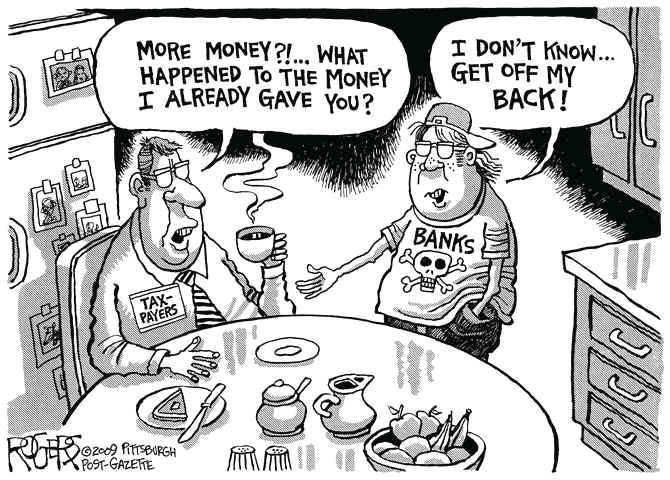
A
reader forwarded this piece to read about the ZOMBIE
BANKS.
http://www.gamingthemarket.com/2009/04/not-too-big-to-sink.html
Thanks!
4-27-2009
The
DJI has reached resistance at 8100. The last two day's hourly chart looks
bearish.
Do you see the head and shoulders' pattern with the neckline at 7980,
the
lows
of today? We have no new Sell Signal. I have said "stay with the rally as
long as
Closing
Powers of the DIA, SPY and QQQQ are above their uptrends. And also abide
by
the rising NYSE A/D Line uptrend." But once, these are broken, there will
likely be
a
bigger pullback. Short-term traders often play a resistance-level, like 8100,
as a place to sell
short,
provided they are ready to cover if there is a price breakout. They play support
levels,
like
7810, as places to buy, provided prices rebound and do not pullback more. From an
intermediate-term
perspective, I would say we should still stick with the rally. The market might
have
sold off a lot more based on fear of a deadly and economically paralyzing pandemic
emerging.
But it did not. That left stocks in stronger hands if another good
rally starts.
It
is important that the next rally succeed in taking the DJI over 8100-8200.
There
is more and more criticism of Geither's TARP-II as favoring banks excessively.
Wall
Street needs confidence badly. But, I don't see how making taxpayers have to risk a
trillion more
to
bail out the banks that are "too big to fail" will help the overall system.
Anyway you look at it,
the
facts still remain that it was the biggest banks' highest executives' greed that caused
the
financial
bubble and bust. There are better alternatives to making credit again become
available
to
consumers, buisiness and Main Street. But the FED and the Treasury see things only
through
the
eyes of the biggest bankers. If I am right, then I fear that even a breakout above
8200 will only
mean
another month's relief rally rather than a new bull market. The smaller high
accumulation
stocks
are worth holding for that possibility.
But, the rally may stall out in a matter of days as it did in
November 1974. The long 1973-1974
could
not end with a "V" bottom and required a re-test of the lows after resistance
proved too
much
for the first good rally, in October 1974. We will watch the NYSE A/D Line uptrend
closely.
See
DJI-1
Key
Graphs DJI-1
DJI-2
NASDAQ-1
NASDAQ-2
QQQQ
QQQQ-2
SPY
DIA
GLD
 4/26/2009
Obama
Is Pumping Financial Stocks and Wall Street Up.
4/26/2009
Obama
Is Pumping Financial Stocks and Wall Street Up.
He
Is Counting on It Trickling Down To Main Street before Hyper-Inflation Starts.
DJI
Has Readed A Key Resistance Level. Low Priced Stocks' Advances Suggest
A
New Bull Market.
The
DJI has now rallied and tagged its 4x tested horizontal resistance at about 8258.
Very
often there is a pullback on a fourth test, with the fifth test being the decisive
run
that either produces a breakout or a retreat.
If
there is a clear breakout and DJI close above 8300 with an increase in volume,
I
would treat that as a bullish inverted head and shoulders pattern and probably
a
Buy B10. This is a reliably bullish pattern if, say, 8300 is exceeded on higher
volume.
That
the P-Indicator stands at a +543, the IP21 (Current Accumulation Index)
is
now +.129 and the Opct is +.236 lends confidence to any breakout.
Even
if there is a shallow retreat by the DJI back 8859, possibly occassioned by the fears
that
we may see another flu pandemic like 1918, 1957
or 1968, I doubt if a bigger decline
will
unfold. But watch the NYSE A/D Line uptrend just in case. In 1918 and 1968 the
DJI
rose. In 1957 it fell. If the DJI does not achieve a breakout first, then we
have to
do
some selling, especially the DIA, when either the NYSE A/D Line or the Closing Powers'
uptrend
lines are violated.
But
if the DJI does achieve a breakout, give the market a chance to run. Then use the
rising
50-day, or even a 65-day, ma to show where a decline becomes dangerous. Then I
would
not use the Closing Power uptrend-line breaks too quickly.
Renewed
fears of inflation are sending gold and silver up now. As the stock market
goes
up, investors who previously were buying Treasury instruments for safety, are
now
selling them to buy stocks. As the Treasuries fall, so may the US Dollar.
China
is
rumored to be avoiding buying more US Treasury debt, which it already fears it
has
too much of, and instead may be buying mines and metals. And there's
more.
People
fear the inflationary consequences of Obama's statement that he will not let any
of
the major banks fail even though this may add a trillion more to the federal deficit.
Late
last week, new inflationary fears grew as the FED revealed it may have loaned out
1-2
trillion
dollars to big banks in exchange for what were probably bad debts and toxic
mortgages.
Bernanke Covers Up
Hundreds of Billions of Dollars in Losses
from Bad Loans The
Fed Made To Banks Using Toxic Collateral.
Last
year, as the financial debacle was unfolding Timothy Geithner, then NY Fed Chairman
and
now US Treasury Secretary, proposed asking Congress to guarantee ALL the debt
in
the US banking system. ( Source.
) Since that secret meeting, Obama's Treasury Secretary
has
been more and more clearly showing the "sky is the limit" to what Geithner will
generously
do
for big bankers with taxpayer money. Geithner trusts the very people who destroyed
the
US
and the global. Worse, they are his personal friends. Who protects the
taxpayer?.
Geithner:
Willing Tool and Fool or Just Too Isolated?
Below
are quotes from the NY Times article
this weekend: Geithner Day by Day.
"The
New York Fed is, by custom and design, clubby and opaque. It is charged with
curbing
banks’ risky impulses, yet its president is selected by and reports to a board
dominated
by
the chief executives of some of those same banks. Traditionally, the New York Fed
president’s
intelligence-gathering
role has involved routine consultation with financiers, though Mr. Geithner’s
recent
predecessors generally did not meet with them unless senior aides were also present,
according
to the bank’s former general counsel. By those standards, Mr. Geithner’s
reliance
on
bankers, hedge fund managers and others to assess the market’s health — and
provide
guidance
once it faltered — stood out.
"His
calendars from 2007 and 2008 show that those interactions were a mix of the professional
and
the private. He ate lunch with senior executives from Citigroup, Goldman Sachs and
Morgan Stanley at the Four Seasons
restaurant or in their corporate dining rooms. He attended
casual
dinners at the homes of executives like Jamie Dimon, a member of the New York Fed
board
and the chief of JPMorgan Chase.
Mr. Geithner was particularly close to executives of
Citigroup,
the largest bank under his supervision. Robert E. Rubin, a senior Citi executive
and a
former
Treasury secretary, was Mr. Geithner’s mentor from his years in the Clinton
administration,
and
the two kept in close touch in New York.
"Mr.
Geithner met frequently with Sanford I. Weill, one of Citi’s
largest individual shareholders
and
its former chairman, serving on the board of a charity Mr. Weill led. As the bank was
entering
a
financial tailspin, Mr. Weill approached Mr. Geithner about taking over as Citi’s
chief executive.
"But
for all his ties to Citi, Mr. Geithner repeatedly missed or overlooked signs that the bank
—
along with the rest of the financial system — was falling apart. When he did spot
trouble,
analysts
say, his responses were too measured, or too late...As late as 2007, Mr. Geithner
advocated
measures that government studies said would have allowed banks to lower their reserves.
When
the crisis hit, banks were vulnerable because their financial cushion was too thin to
protect
against
large losses.
"In
fashioning the bailout, his drive to use taxpayer money to backstop faltering firms
overrode
concerns that such a strategy would encourage more risk-taking in the future. In one
bailout
instance, Mr. Geithner fought a proposal to levy fees on banks that would help protect
taxpayers
against losses. The bailout has left the Fed holding a vast portfolio of troubled
securities.
To
manage them, Mr. Geithner gave three no-bid contracts to BlackRock, an asset-management
firm
with deep ties to the New York Fed."
There's
a lot more in this New York Times article that should trouble folks who are concerned
about
Omama' Treasury Secretary and his frequent to show any real concern to protect taxpayers:
Geithner's
role in giving Goldman Sachs $13 billion from the AIG bailout.
His
letting of $71 million in no bid contracts to Blackrock while head of the for the NY Fed.
"According to a recent report by the inspector general
monitoring the bailout, Neil M. Barofsky,
Mr.
Geithner’s plan to underwrite investors willing to buy the risky mortgage-backed
securities
still
weighing down banks’ books is a boon for private equity and hedge funds but exposes
taxpayers
to “potential unfairness” by shifting the burden to them. The top echelon of the Treasury
Department
is a common destination for financiers, and Mr. Geithner has also recruited aides from
Wall
Street, some from firms that were at the heart of the crisis. For instance, his chief of staff,
Mark
A. Patterson, is a former lobbyist for Goldman Sachs, and one
of his top counselors is
Lewis S. Alexander, a former chief economist at Citigroup. A bill sent recently by the
Treasury
to
Capitol Hill would give the Obama administration extensive new powers to inject money into
or
seize systemically important firms in danger of failure. It was drafted in large measure
by Davis
Polk & Wardwell, a law firm that represents many
banks and the financial industry’s lobbying group.
Mr.
Geithner also hired Davis Polk to represent the New York Fed during the A.I.G. bailout.
Treasury
officials
say (even admit) they inadvertently used a copy of Davis Polk’s draft sent to them by
the
Federal
Reserve as a template for their own bill, with the result that the proposed legislation
Treasury
sent to Capitol Hill bore the law firm’s computer footprints. "
DIA-2003 If the
DJIA breaks out over 8300, I would it expect to
behave
similarly to how the DIA moved up when it cleared the
89-91
barrier in May 2003. When the Closing Power finally does
break
its rising uptrendline, look for a decline no deeper than the
50-day,
or possibly the 65-day ma.
DIA
- 2003 - Role Model for Market Now
DJIA
- Superimposed Peerless Signals
The signals below are based on using the
40% down from the 12 month highs as the dividing line
between the
normal Peerless (above it) and the extremely bearish mode (below it). It may
be that
we should
use a different way to switch out of the Bearish Mode. One might be to require
a high
volume
advance before leaving the bearish mode. That has been absent here. We might
want to use
a move to a
new recovery high or a move past the 149-day ma to switch out of the bearish mode.
If these
approaches were used, then there would have been a Sell S3 on April 13 with the DJI at
8057.81.
We mentioned that, but shyed away from it in otder to give more chance for
the rally to
run its
course for averages and indexes other than the DJI-30. Breadth has been especially
good.
That has
enabled us to make some nice gains in stocks that look like the classic cases from the
Explosive
Super Stocks Book
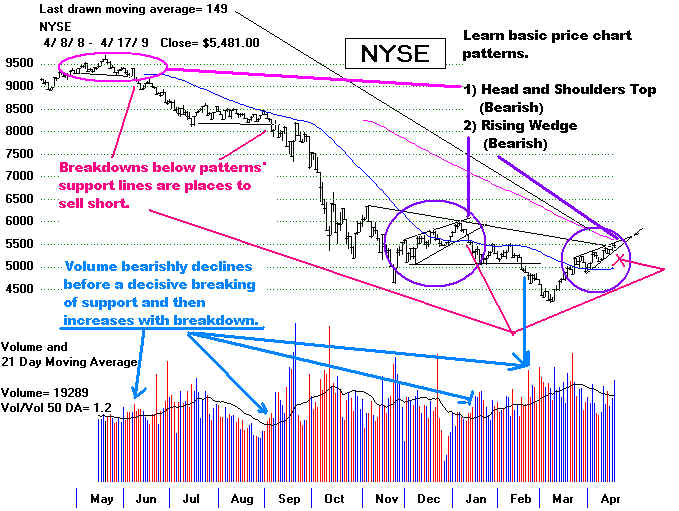
 NYSE
volume declining
NYSE
volume declining
4/23/2009
As I write this, 5 hours before the Openng. the Futures are up suggesting a recovery.
Today the Closing Power for the DIA turned up sharply rather than break down. And,
bullishly,
the DJI did not drop below its rising 21-day support. The first decline to the
rising 21-day ma,
as we are now seeing, usually acts as good support. So, we are advising that traders take
the
small profits in the short of DIA at 80.
So cover (This paragraph has been re-constructed.
It was dropped by mistake in the re-ordering of the paragraphs on 4/24/2009.)
The DJI has stalled out at the 8000 resistance. It has entered a very narrow
trading range with neckline support at 7750 and resistance at 8260. An upside
breakout
would
be very bullish. That would confirm the wonderful breadth we have seen. While
the
Closing Powers of the DIA, QQQQ and SPY are rising an upside breakout is favored.
on
the other hand, volume for the exchanges and the NASDAQ have been too low to make
the
rally look like the beginning of a bull market. So, we have to wait for prices
to end the
DJI's
present stalemate. While we are waiting, we are pleased that low priced stocks under
high
accumulation are being bid up. The bottom of this page shows some of them.
If the NYSE Advance/Decline Line in broken below, we will have to expect a
further retreat. But even then, the P-Indicator and Accumulation Index are so
positive,
only a shallow decline would seem likely, possibly only 7500, before another rally
develops.
Watch Silver.
Gold and silver stocks jumped last last week. Silver has broken its Closing Power
downtrendline. Strength tomorrow may develop into a very bullish inverted head
and shoulders
pattern. But the Accumulation Index is still
negative. So, it's best to wait and see, or hold
existing positions. See some of gold and silver stocks at the bottom that are
new Buys.
Of
course, the silver rally here must get past the 50-day ma. Check the Spot
Silver price.
That's about $13/ounce. The silver stock SSRI's price pattern looks similar to how
in looked
in 2003 when it jumped very sizeably. SSRI-2003 SSRI-2008-2009.
Closing power breakouts
should quickly cause the Accumulation Index to turn positive, or else the rally will be
short-lived.
4/22/2009
We went short the DIA ETF at 80 today. You can see the 4x tested
resistance line
that
crosses there. Volume has been so low that we cannot help but have doubts about the
current
rally. But I suggested tonight taking the small profits. The ETFs' Closing
Powers are
still
rising and breadth has been extremely good. See how the Closing Power is rising but
the
Opening
Power is falling for the DJIA. This is a bullish pattern.
So, we remain "long" many stocks on our Stocks' Hotline. If we had
continued to use
the
"Extremely Bearish Mode" until there was a clear upside breakout on high volume,
as
finally
occurred just after the major bottoms in 1932, 1933 and 1938, we would consider a
Sell S3 as
now active. Instead, I have used to 40% down-from-the-12 month high level.
See www.tigersoft.com/PeerInst As it
is, I have chosen to stay long these other positions until
the A/D
Line uptrend is violated. This approach tests well since 1945.
More Bad Publicity for Wall Street - That Can't Be Good for the DJIA
Watch for news from the Treasury's Inspector General, Neil Barofsky, about bank fraud
in getting
and using not only the TARP money, but the $3 trillion in loans to banks made
by the
Federal Reserve. This has to be a frightening prospect for some big banks. "I
hope we
don’t
find a single bank that’s cooked their books to try to get money but I don’t
think that’s
going to be
the case.”
( http://dailybail.com/home/tarp-inspector-neil-barofsky-smells-bank-fraud.html
)
The DJIA is heavily weighted with
financials, AXP, BAC, C and JPM. They leadens
this index
more than others. Additional bailout money for banks will be difficult for Obama,
Summers and
Geithner to get from Congress. But the banks' future solvency may depend upon
that if
what has been leaked about the "Stress Tests" is correct. The TARP
payments are
only now
starting to be scrutinized. Here are recent headlines you will come accross:
1. The taxpayer was short changed 30% in the original Paulson TARP giveaway.
Elizabeth
Warren (TARP overseer from Congress) interviewed by Jon Stewart. April 16
That will not soon be forgotten, except by Geithner.
2, Bank of
America's CEW Lewis said he was pressured by Paulson and Bernanke to
not talk
about Merrill problems and big bonuses. The SEC is investigating if BAC
shareholders'
rights to be informed were violated as merger was voted on. Today.
3. Economic criminal charges soon. Neil Barofsky - special
inspector general overseeing
the Troubled Asset Relief Program - released a 250-page report detailing a long list of
concerns
possibly illegal actions by banks and Wall Street firms.
Crimes
suspected in 20 bailout cases -- for starters - Los Angeles ...
4. Until banks tell Treaury how the TARP money is being used, I can't see how
Congress
could give a cent more to them without a vast backlash.
4/21/2009
Our Stocks' Hotline last night suggested going short the DIA between
79.5 and 80. That
seems reasonable given how far the DJI has advanced without a correction and noting the
declining well-tested resistance line that crosses at 80. But most stocks that we
are long,
we are just holding. More than a 5% decline would seem improbable. Breadth and
Accumulation are too positive.
The
Advance Decline and Closing Power uptrends were was not violated. So, the rally
for
most stocks and the QQQQ and SPY may go somewhat higher. The bearish rising
wedge
patterns and DJIA's resistance line at 8100 are limiting factors. Breadth was superb
today.
NYSE
up volume was 7x down volume. I have noted how positive the breadth has been
in
earlier hotlines. Look at the QQQQ and SPY especially. All their key
indicators are quite
bullish. It's hard to see how a big decline can start right now.
There
is another indicator you will want to get to know. This is the Tiger Day Traders'
Tool.
It
plots the cumulative daily post-Opening difference between the day's upside volatility and
the
downside volatility. Watch for its trend-breaks and non-confirmations. Day
traders should
use
its rising status to buy at the openings and use its declining status to sell short.
See the
bottom of the chart below.
4/20/2009
Today the DJI lost 289.60 and the DIA broke
its rising Closing Power uptrend. This was
what we said should get us to go short the DIA. But the DJIA and DIA are at the
support now of
their rising 21-day ma. A bounce for a day is quite possible. I would try to
go short DIA near
80. The NYSE A/D Line uptrend has not yet been broken. It is at its rising
uptrendline.
Usually breadth as bad as today's - 2515 more down than up on the NYSE - spills over to
the
next few days following an uncorrected rally as now. If breadth is poor tomorrow,
that will
bring a judged Sell S6, as we have discussed for the last week. The bearish rising
wedge
patterns in the DJI, DIA, SPY and QQQQ were correctly bearish warnings here along
with
pitifully low volume on the rally.
Short sales on the DIA on strength tomorrow are
recommended because of the expected
break in the NYSE A/D Line uptrend tomorrow and the DIA's Closing Power
uptrend-breakbreak.
The DJI has closed within 10 points of going down again more than 40% from its 12
month highs.
Unless quickly reversed from here (and the DJI is at its rising 21-day ma) it will mean
that the market
dangerously
resembles the 1930-1932 period. Perhaps, the recent very good breadth will win
out over the low volume. Again, note that the NYSE A/D Line uptrend has not been
broken
and the 21-day ma, where the DJI, DIA amd SPY now sit, often acts as support, especially
on
its first test in a rally. The Closing Power uptrends for the QQQQ and SPY have not
been
broken. 5 Dow components will report earnings tomorrow. Expect some wild
swings.
This Monday's sell-off occurred as rumors spread that the Treasury's Stress Tests
would show
that 16 of the biggest banks are now "insolvent". Worse, none could
withstand any disruption
of cash flow or any further deterioration in non-paying loans, something which is almost
certain given the
rising unemployment, growing mortagage and credit card default and public dislike
any more
bank bailouts. If any two of the 16 insolvent banks go under, all the remaining FDIC
insurance
will be wiped out. Geithner will be testifying before Congress tomorrow.
Watch C-Span for
the ongoing drama.
See - http://investment-blog.net/the-turner-radio-network-has-obtained-stress-test-results-for-the-top-19-banks-in-the-usa/
If we had considered ourselves operating in the Extremely Bearish Mode last week
we would have accepted the Sell S3 on 4/13/2009. For shorting the DIA, that probably
would
have been best. Further weakness will bring a Sell S5 in this mode as the DJI drops
below
the line more than 40% from its 12 month high.
There is some hope, I
want to add. Breadth has been very good. A decline to the lower band
would, if we were using the normal mode, bring a Buy B9. Perhaps, the leaked
Bank Test
results were the handiwork of short selling hedge funds. Big buyers must be expected
on
weakness. That is the message given by the very positive readings of the Accumulation
Index/
For a judged Sell S6 seems likely. And more weakness
tomorrow will make for a Sell S5.
I would switch to the Extremely Bearish Mode on any lower closing and work with its
signals.
With the P-Indicator so positive, any retreat to below the 21-day ma will set up a
Buy B9
near the lower band.
The NYSE A/D Line is barely still in an uptrend. Poor breadth tomorrow
will break that uptrend
and be a judged Sell S6.
Sunday
- 4/19/2009
The DJI has tagged the previously 3x tested downtrending
resistance line that parallels the
downtrending support
line that caused us on March 6th to cover our short sales and suggest going
long if the market did
turn up. Applying the same
rule here in reverse should cause us now to
take profits in any
ETFs like the QQQQ, SPY or DIA that we are long. But I would not go short
until the we get a new
Peerless sell signal in the regular mode or until the NYSE A/D Line breaks
its uptrend. NYSE declines would have to exceed
NYSE advancers by about 2500 over the next two days
to achieve this.
Such a decline would almost certainly also mean that the bearishness of the
rising narrowing wedge
pattern would be validated by a close below the pattern's
rising
support-line. That would require a DJI close below 7800.
Examples of rising wedge patterns appear in all the ETFs. See also: 1
2 3
Bearish Rising Wedge Pattern in
NYSE now.
The Opening and Closing Powers are both still rising.
This is short-term bullish until the Closing
Power uptrendlines are
violated. A bubble is being created by the bailout money for banks going into the
stock market, as we
explain below. Volume has not been high enough to confirm the 24.2% rise in the DJI.
Respect for now the
friendly trends of the NYSE A/D Line and the Closing Powers for the big general
market ETFs.
Stocks like C, GE, GM and JNJ suggest the rallies are false and unsustainable. They
are based on a steady
string of higher opening (perhaps manipulated), not steady buying during the
trading day buying by
many institutions. This scissors pattern is usually bearish. It is the same
pattern
these stocks showed
throughout their long declines since 2007.
The news for banks was good and bad this weekend.
Bank of America will report earnings this week. Will good
earnings be trusted? Last
week's Goldman Sachs
earnings were ripped apart by Barrons this weekend.
Obama said some banks "are going to need different levels of assistance from
taxpayers",
but that a nationalization
would be unlikely. The reality is that unless unempoyment, foreclosures
and bankruptcies stop
rising, it make take many billions more to keep the banks solvent. One way
the Treasury and the
Federal Reserve are increasing the big banks' apparent degree of solvency
in the face of the
general economy's continuing weakness, besides the hundreds of billions in bailout
money, is to let
the banks determine the value of their own "toxic assets" when borrowing
trillions
from the Federal
Reserve. Clearly this is very risky. Still another is to allow them freely to
buy stocks
(equities) and play the
rally in hopes of gaining more value. The regulators have been silent on
this development.
We can see from published NYSE statistics that Goldman Sachs has used the
Treasury bailout
billions to trade for its own account very aggressively. It is reasonable to assume
that other banks are
quietly doing the same. One thing that is clear: they are not using the TARP
bailouts to make a lot
more loans, except at very high, even predatory
rates.
Donald Trump on the Larry King Show this weekend on
CNN underscored that relying
on banks to make loans
only works well if you are willing to buy the properties that they don't want
and now own. Then
they will provide financing.
If banks are really betting their taxpayer billions on a rising stock market out of a
desperation
for ways to make money,
then the US Treasury has created another Stock Market Bubble. When
that breaks, the banks
will be in even worse shape. The conclusion I reach is that when the A/D
Line uptrendline is
broken, we want to sell and sell short. For now hold the long positions and wait.
Beaten down stocks with
high accumulation and strong Closing Power are still worth buying
But watch TigerSoft's
Closing Power.
April 16, 2009 Basic TigerSoft's Rules for Profitably
Trading Stocks and Limiting Risks.
Biggest Florida Bank
Given 20 Days ...
"The biggest financial institution in Florida, $14 billion BankUnited of Coral Gables,
was told by its regulator,
the Office of Thrift Supervision, to find a buyer who would raise
its depleted capital to acceptable levels or risk a government takeover. In an ominously
sounding "prompt corrective action directive", the OTS has essentially given the bank a 20 day
ultimatum. If Florida's biggest bank is on the hook, at a potential maximum taxpayer cost
of $14 billion, maybe the stress test will not be just the fluff everyone is now expecting
it to be.
Then again, Citi, with its
$3 trillion in assets, being told to find a buyer in under three weeks,
may not be the most amusing notion for Vikram Pandit and Sheila Bair."
|
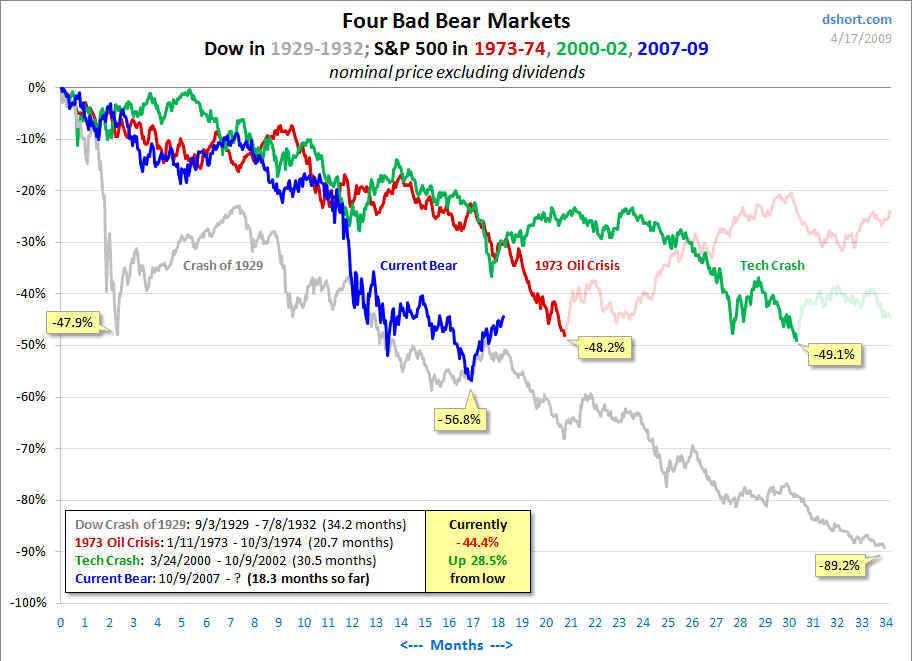
What History May Teach Us Now
The
DJI has rallied for six weeks. It is up 24.2% since 3/9/2009. There may be more to
go to the
upside and then to the
downside if we judge this by making simple comparisons between the current
bear market and the
bear market of 1929-1932, although it should be noted that we have now had
six intermediate-term
declines to new lows, as also occurred in the longer bear market.
If
we can say that more trading is now compressed in half the time, it might be significant
that
we have had six
separate down-waves. That's all there were from 1929 to the 1932 bottom. But
arguing that the
current bear market could last much longer, we have to note that this bear market
has lasted only 18
months, while the 1929-1932 bear market lasted 32 months.
Bear
market rallies in the earlier period averaged 10 weeks. The present rally has lasted
5
weeks. Back in
the 1930s, bear market rallies after the first big recovery ranged from +23.4% to
+35.0%. Ours now
is only slightly more than the minimum of 23.4%.
Conclusion:
If we believe that the faster flow of information has not compressed the time of
a market's moves, then
there is likely more upside potential short-term and, after that, more
downside threat, too,
once this rally is over.
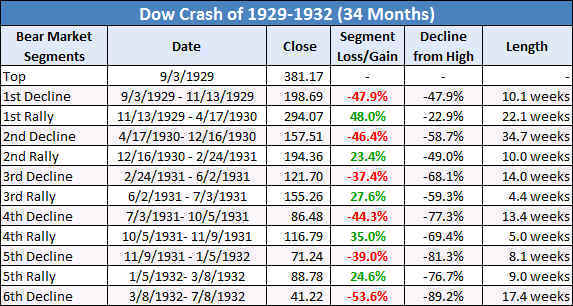
Since the DJI's top on
10/09/2007 we see the following swings:
Top
10/9/2009
14164.53
1st Decline
10/9/2009
- 11/26/2007 14164.53-12743.44 10.0%
length= 6 weeks
Ist
Rally
11/26/200
- 12/10/2007 12743.44-13727.03 +7.7%
length=3 weeks
2nd Decline
12/10/2007 -
3/10/2008 13727.03 - 11740.15 14.5%
length = 12 weeks
2nd
Rally
3/10/2008
- 5/2/2008 11740.15 -
13040.00 +11.1% length = 7 weeks
3rd Decline
5/2/2008 -
7/15/2008 13040.00 -
10962.54 15.9% length = 10 weeks
3rd
Rally
7/15/2008
- 8/11/2009 10962,54 - 11782.35 +7.5%
length = 4 weeks
4th Decline
8/11/2009
- 10/27/2009 11782.35 - 8175.77 30.6%
length = 10 weeks
4th
Rally
11/20/2009
- 11/4/2009 8175.77 - 9625.28 +17.7%
length = 2 weeks
5th Decline
11/4/2009 - 11/20/2009 9625.28 -
7552.29 20.5% length = 6 weeks
5th
Rally
11/20/2009
- 1/2/2009 7552.29 - 9034.69 +19.6%
length = 6 weeks
6th Decline
1/2/2009
- 3/9/2009 9034.69 -
6547.05 27.5% length = 9 weeks
6th Rally
3/9/2009 -
4/17/2009 6547.05 - 8131.33 +24.2%
length = 5 weeks.
4/16/2009
Stay long. The NYSE A/D Line uptrend is still rising very bullishly. That's the key
indicator here. Rising stocks' up volume was almost 4x down stocks' volume
today.
Breadth this good over a 5-week period has no precedent. Elsewhere I have shown
a few days ago that the NYSE A/D Line uptrend is a very good indicator to watch
as market bottoms seem to be developing.
The DJI is now up almost 25% from the lowest closing in March. Rallies don't
usually recover more than this, even after bottoms in the first advance in what will
be a new bull market. On the other hand, most stocks still look cheap when compared
with a year ago. Mutual funds that have cash must deploy it.
For now we have to remain bullish. The 50-day
ma of price has clearly turned up.
The Accumulation Index is above its rising 21-day ma and positive. Both the Opening
and Closing Powers for the DIA, QQQQ and SPY are rising. This is when prices rise
most easily. In these circumstances, for the market to again fall, the Closing Power
usually must break downwards to stat a rally. So we will keep watching the Closing
Power closely.
The DJI is approaching a 3x tested, declining resistance line at 8318 that parallels
the support line that the DJI turned up from on March 9th. Watch and see if it
breakout
above that level or turns down.
Volume remains low, but breadth is excellent. How is that explained? One
explanation
is that the news remains bad, fear high and distrust of the stock market even
higher.
Today foreclosures rose more than 20%. Another explanation is that this is a
"stealth rally"
and volume will surge when the DJI surpasses 8500. That is what usually happened in
the past when the DJI penetrated a clear bottom formation: August 1970, January 1976
and April 1978. But in our case, there is no clear lateral price formation here.
The bulls
must hope that the rally continues, leaving behind he cautious and skeptical and
force them to buy at still higher prices.
If We Can't Trust Geithner and The Banks, Can We
Trust The Rally?
Initially, I attributed the low volume to short covering, which still makes for a very
tradeable rally. But the superb breadth we are seeing does away with that
explanation.
I have also suggested that low volume and superb breadth (NYSE advances minus declines)
may partly be explained by the program trading by the likes of Goldman Sachs, as they
deploy their TARP and AIG billions in stocks, rather than make loans. Big banks may
believe
that they can induce the public to chase stocks at some point because stocks look so
"cheap".
Then they can sell the stocks and pay back their TARP loans to the Treasury and start
awarding their executives fancy bonuses again. Critics contend that Geithner has
given
the banks new powers to value their "toxic assets" anything they want to.
If true, the
bad debts worth $2 trillion according to the Treasury will eventually swamp banks like
Citigroup and Bank of America. Listen to what William
Black, who managed the
government's
remedial action in the 1980s savings and loan debacle. Read his
interview with Barron's last week.
http://online.barrons.com/article/SB123940701204709985.html?mod=googlenews_barrons&page=3
Whoever is doing the buying, we are "long" a number of stocks on our
Stocks' Hotline
and as you can see from the bottom of the page, it's definietely a new bull market for
some stocks.
4/15/2009
Stay long. Admittedly, the relative weakness in the
QQQQ suggests the rally today
was not based on a recovering economy as much as $10 billion more provided the biggest
banks. So, keep watching the NYSE A/D Line. Its break may lead to the
usual seasonal
weakness seen in mid-May and June. That both the Opening and Closing Powers are
rising
for the NYSE, QQQQ and SPY is bullish. We do see rising wedges for the QQQQ
and SPY. These are usually bearish. So is the diminutive trading volume.
I expect the
DJI to tag the 8300-8400 resistance line before there is a meaningful decline.
The Accumulation Indexes for the key indices and ETFs are all above their 21-day
ma. Note from the QQQQ chart below how the breaking by the Accumulation Index
of its 21-day ma can often set up a very fine Sell signal. It was announced today
that Obama
will provide 9.9 billions in incentives for the biggest banks to make more
home
loans. He still is following his advisers, Summers and Geithner, who tell him
that the big banks must be given still more incentives and money to make loans
again.
Obama does not answer his critics who believe his policies are the same that failed in
Japan.
Obama
continues to bet on "Zombie Banks" despite the news
today that The
Treasury says bank lending declined in February- AP
4/14/2009
Watch the NYSE A/D Line Up-Trend. Some
Peerless Rules Need Changing
The NYSE A/D Line uptrend is still intact. But be careful. A clear
break in its
uptrendline would set up a very risky market. From the chart below you can see that
such breaks bring serious declines. Note that anticipating the breakdown is
not advised.
Bear market rallies like those seen since 2007, or between 1930 and 1932, suggest the
present rally ought to last a week or two longer, at least.
A major technical problem for the bulls remains, the stubborn pattern of lower lows
and lower highs in the DJI. As Obama pointed put today, we are not out of the
woods.
And that's seeing the "stress tests" as meaningful, in which all the banks will
pass. Roubini
and others note that the Treasury's AIG pass-through brought "Goldman Sachs ($12.9
billion),
Merrill Lynch ($6.8 billion), Bank of America ($5.2 billion), Citigroup
($2.3 billion) and
Wachovia ($1.5 billion)" and "banks are benefitting from close to zero borrowing
costs
and fewer competitors; they are benefitting from a massive transfer of wealth from savers
to borrowers given a dozen different government bailout and subsidy programs for the
financial system; they are not properly provisioning/reserving for massive
future loan
losses; they are not properly marking down current losses
from loans in delinquency;
they are using the recent mark-to-market accounting changes by FASB
to inflate the
value of many assets; they are using a number of accounting tricks to minimize reported
losses and maximize reported earnings; the Treasury is using a stress scenario for the
stress tests that is not a true stress scenario as actual
data are already running worse
than
the worst case scenario.” Source.
Volume on the advance seems too low for a bull market. Today, volume bearishly
picked up on the downside. I have been saying that breadth would save the day.
This
weekend I learned something that changed that view. It was the realization that
computerized
program trading purchases could conceivably buy not hundreds, but thousands, of
stocks.
Program trading now makes up a very high percentage of trading volume, 75% of the
NASDAQ and ASE and almost 50% of the NYSE. And Goldman Sachs is the biggest
program trader by a wide margin. Suddenly, I realized that the rally may
owe in no small part
to Goldman's buy programs. They had a very strong reason to boost the market.
That
was to enable them to sell $5 Billion shares of their stock, which they did today.
Should
one brokerage establishment with special connections to the US Treasury, the Federal
Reserve Board and Larry Summers have such power? As my friend Dave
Rogers likes
say, "This is not your grandfather's stock market!"
Until volume on the NYSE picks up to show that there are many more participants,
I think we have to assume prices were manipulated and rose artifically. That
suggests
they will have to retrace 50% of their advance, or perhaps much more. A
decline below
the lower 3.5% band to 7300 would represent a typical retracement. More bullish
would
be a successful test of 6500.
Need for Peerless Revisions
I have suggested only using the Extreme Bearish mode only when the DJI is more
than 40% below its 12 month high. It is slightly above that. If we had been
using the
Extreme Bearish mode yesterday, we would have seen a Sell S3. This occurs when
the
OBVPct drops below its 21-day ma. after a rally takes it above it. This signal works
in
bear market rallies because it is sensitive to the way rallies lose their upside volume
near the top. Below, you can see that its Sell signals for the past 12 months have
been
very good.
I think in the future may want to continue to use the Extreme
Bearish Mode
until one of two conditions applies, and not only until the DJI surpasses the
40%-down-level:
1) the DJI makes a convincing high volume breakout above a previous peak.
Here that would be 8500. (From the historical charts you can see this took place
in 1933 and 1938) or
2) the DJI rallies more than 25% from its lowest closing on very high volume.
Rallies of 20%-24% are not uncommon. See below.
Such a rule change would mean that the Sell S3 applies and there would now be no
BuyB12.
Rather than switch to a sell now, I prefer to use the A/D Line. If the A/D
Line
uptrend is broken soon, we will know that is what we should Sell and use this rule
change in the future. (More on these concepts later. See www.tigersoft.com/PeerInst
for historical charts, rules and concepts.
Another rule clarification: The renewed S5s - which occur when the DJI falls a second,
third or even a fourth time below the 40% down-level - should be clarified, too.
They are
certainly useful in avoiding a renewed bear market, but they can cause whipsaws, as they
have the last month. I think it's worth putting them on the screen to remind
invetsors
and traders where the key 40%-down level is, but after two renewed S5s, I think they
should not appear.
My conclusion is that I don't think there is
enough evidence yet to say that
we are ready to see the DJI decline back to 6500. But a break in the NYSE A/D
Line would set up a decline worth playing by going short the DIA. That becomes more
likely when we realize that a further decline will cause breaks in the uptrends of the
Closing Power and the Opening Power Lines for the ETFs. That would add to the
bearishness.
4/13/2009 Judged Buy B6 - NYSE A/D
Line Uptrend Is Strongly Rising. Finance Stocks' Rally
Goes A Long Way To Remove Wall Street's Biggest Worry. BUT Without More
Volume,
The DJI May Struggle To Advance. The QQQQ Is Acting Better.
I consider the rally as more likely to continue, so long as the NYSE A/D Line uptrend
is not violated. Though the DJI lost 26 points, there were 526 more stocks up than
down on the NYSE. NYSE up volume was twice the volume of declining stocks. So,
the breadth remains superb. Historically, it pays to stick with these rising NYSE
A/D Line
uptrends, especially if you are trading individual stocks. A good number of low
priced
stocks look very good. (See the bottom of this page.) Seasonality is very good
for
the next two weeks.
We do have to worry about the very low volume. Usually rallies need more
volume
to eat up overhead supplies of stock. I have said that the very good breadth we have
seen
suggests that the current rally is not based on short-covering and so it may continue a
while longer. But I am persuaded that the rally may have another explanation, that
makes it artificial and less long-lasting.
Goldman Sachs Manipulation of The Stock Market, 4/13/2009
The reading I did over this weekend makes me see that the advance may well owe
more to program trading by only one firm, more than anything else. Goldman Sachs
is reported by the NYSE to be the biggest "program trading" firm. It is
reckoned that nearly
half of all the trading volume on the NYSE and 75% on the NASDAQ owe to program trading,
where many stocks are bought or sold all at once in an order worth at least $1 million.
Goldman
engages in this almost entirely to benefit its own account. They appear to have gone
net
short on balance in December 2007. Now with $33 billion more in tax payer funds,
they
are buying. Trading profits are the biggest part of the earnings they reported
today. Source.
By getting their own stock up, with the help of these earnings, they hope to do an
offering
of their stock to help them pay off their TARP-I loan. And judging from the jumps in
bank shares, they may be using the TARP-I loan to buy positions in the beaten down
financials like BAC, AXP and even C. Of course, we may never know this for sure.
But that was the concern heard this Winter when Congressmen belatedly worried that
the TARP money would not be used to loosen up credit. Goldman became a Bank Holding
company just in time to get $20 billion in TARP money from its former CEO, Hank Paulson.
Until Goldman has completed its new public offering, by this theory the market is being
manipulated and supported. After that, things could worsen and there could be
another
test of the 6500 lows. For now the NYSE A/D Line uptrend is intact and both the
Opening and Closing Powers are rising for the DIA, SPY and QQQQ. My friend and
very first customer in San Diego, Dennis Costarakis - who now lives in Las Vegas,
has sent me the following. That there are so many doubters about the rally's
durability, gives
a lot us hope, using standard contrarian principles.
Investor Survey Results (an AAII exclusive) April 9, 2009
|
This
week's survey saw bullish sentiment fall to 35.71%, below its long-term average of 39.0%.
Neutral sentiment fell to 20.00%, below the long-term average of 31.2%. And bearish
sentiment rose to 44.29%, above the long-term average of 29.9%.
|
|
|
|
|
|
|
|
To participate in the AAII Sentiment Survey, or to view historical results, click here.
4/9/2009 Pre-Holiday Rally, Very Good Technicals except Volume, DJI 8000 Breached.
The Treasury has directed GM to prepare for bankruptcy by June 1st. That will send
some
shock-waves through the market on Monday. But the internals are good. So, any
decline
should be contained and limited. I take the trend to be up so long as the last
month's
uptrend of the NYSE A/D Line is not violated. Trendlines are not easily
computerized.
But the original Peerless had Buy B6 signals when a well-tested A/D Line downtrend was
exceeded and Sell S6 signals when well tested A/D Line uptrends were violated. If
the
line can be constructed so that it goes through 3 lows (for uptrend-line) or 3 highs (for
down-trendlines), it is considered well-tested. The Lines should last at least a
month\.
The longer-term ones are more significant. See the materials I have put
together to show this.
DJI charts of
Bottoms, Peerless Signals and Accompanying A/D Lines: 1959-2009. .
Rallies that occur right before a 3-day weekend or a holiday are not usually
trustworthy in a bear market. Are we in a bear market still? The break in the
11 month
NYSE A/D Line downtrendline argues that the trend is up until its uptrendline is violated.
I now weight breadth (A/D Lines, New Highs/Lows) as more important than volume. But
until
the DJI surpasses 9200, I think it is best to watch the NYSE A.D Line uptrend closely.
Breaks in such uptrendlines before there is a clear price breakout from the bottom
formation
in the past were valuable in telling technicians when another decline would occur, with a
retest of the lows being the most likely result.
The "S5" (40% down from highs - extreme bearish mode
warning ) was cancelled
because of the DJI's recovery back above that level. This is bullish. The Buy
B12
seems to be winning out. The target now is the 3x tested resistance line for the DJI
at 8300.
This resistance line is important because it parallels the support line that the DJI
bounced up
from a month ago. The 40%-Down Line is apparently significant only on the first and
second
penetrations. The software will have to be modified for that purpose.
What we are seeing
now are low volume eating up overhead supply. That causes a lot of backing and
filling.
To keep using the 40% line now may bring more whipsaws.
We are seeing unusually strong breadth. Thursday's NYSE Up-Volume was
10x Down Volume.
A buying stampede was started as the market rallied from 6500. In the last month,
there have
been 7 trading days when NYSE advancers exceeded decliners by more than 7 to 1. This
is
unprecedented.
I have suggested that such superb breadth makes up for lack of volume since it shows that
more is going on than short-covering rally. Another important bullish element: both
Opening
and Closing Power for the DIA, SPY and QQQQ are rising. Thirdly, as in
2002-2003, the
QQQQ is significantly out-performing the DJI. Since January 2009, it has been
steadily
10% to 17% stronger than DJI over 50-day periods. Fourthly, the QQQQ has breached the
32 flat-topped resistance. With a 6 point wide trading range before the breakout,
this sets up
a target of 38, which would also be a 50% recovery what was lost from May 2008 to March
2009.
There
are now two major bearish signs. 1) Volume remains low. It usually takes
higher volume
to eat up over-head resistance. 2) The DJI is now up more than 23% since its bottom.
As you
can see from Section 8 near the bottom of this page, we are now more likely to be near
the top of a rally from the lows unless volume rises dramatically. If volume does
rise sharply,
that would be a signal for a new bull market. If upside volume does not rise
dramatically, the
parallel resistance line mentioned near 8400 will prbably stop the present rally.
See - Mutual Funds Report $11.9 Billion In
Inflows For Week Of April 8:
Throwing Fuel Into The Rally
4/8/2009
Sitting on The Fence. Rally to 8000 Seems Most Likely.
The DJI is down almost exactly 40% from its 12-month high. A rally from here
will neutralize the Sell S5 and bring another challenge of 8000. A decline tomorrow
may
bearishly break the NYSE A/D Line's uptrendline. It would keep the S5 alive and
force
us to use the Extreme Bearish Mode.
The bullish signs seems to predominate. The Closing Power trendlines are rising for
the
QQQQ, SPY and DIA. Each has rising Opening Powers still. Breadth
was again positive
today. So, the NYSE A/D Up trend-line in intact. The QQQQ is above its
rising 50-day
ma. After a big decline, this has to be a bullish sign. That the QQQQ
is stronger than
the DJI must also be considered a bullish sign, based on the tendency of the DJI to
bottom last and the QQQQ to rise before the final DJI bottom.
There is no breadth data for the 1930s. That means that we must use some judgement
in weighting the relative importance of volume and breadth. I have said that such
good breadth as we have seen recently suggests this is more than a short covering
rally. I have also said that Wall Street is desperate for Federal help.
This exposes
the "Greed
Connection" represented by Goldman Sachs between Wall Street and
Washington.
Goldman Sachs may keep on rising, because no one can touch it, if it
has its own man in the White House, but there is rapidly growing discontent on Main
Street towards Goldman and Wall Street. That puts real limits on how far a rally
can take stock prices. My guess is that 9300 will be reached at some point in the
next
quarter, based on April and May's bullish seasonality and what it would take to make for
some
symetry in the long-term DJI Chart.
A 33% recovery of what has been lost from 14150
to 7150, would bring a target of 6500 + 1/3 of 7150, or 6500 + 2800, or 9300.
An old trading adage says not to sell short a dull market. Looking back from
1930-1933,
we can test this concept. Here are very lowest trading days and what happened
subsequently. In 12 cases a serious decline followed. In only 6
instances, a good rallly ensued.
This shows low volume does not mean that a decline is over.
7/2/1930 - DJI fell 1% and then rallied 10% before declining again.
8/4/1930 - DJI rose 1% and then fell 8%.
8/22/1930 - DJI rallied 3% and then started a big decline.
9/18/1930 - DJI declined a lot.
11/15/1930 - DJI fell 4% and then rallied 10%
12/2/1930 - DJI fell 13%.
6/18/1931 - DJI fell 1% and then rallied 16%
7/28/1931 - DJI fell 3% and then rallied 5%
8/10/1931 - DJI rallied 7% and
then resumed declined.
9/2/1931 - DJI fell sharply
3/2/1932 - DJI rose 8% and then declined sharply.
3/24/1932 - DJI fell sharply.
4/26/1932 - DJI rose 1% and then declined sharply.
5/9/1932 - DJI fell sharply.
5/24/1932 - DJI fell sharply.
6/21/1932 - DJI fell sharply.
Our Stocks' Hotline is short very few stocks. And we added 3
niew Buys tonight.
A rally back to 8000 seems likely.
4/7/2009
New Sell S5
DJI Is back below the 40%-Down from the Highs' Level.
The good news is that breadth for the last month has been very good. That has
left
the P-Indicator in very
positive territory. So, with the DJI now 3.2% over the rising 21-day ma.,
we can reckon that a further
decline of 5% would set up a reversing Peerless Buy B9. Also, the
momentum has been so strong,
so, that makes it likely we will see another rally to 8000. For now, the
Closing Powers for the key
ETFs are still rising, though a bad day tomorrow could break the uptrends.
So far, the low volume shows
that selling is not heavy or aggressive. 7500-7600 would seem
the most obvious place for a
rally to start from. Unfortunately, the news is getting worse, not better.
We have held back on buying anything new on the Stock's Hotline this week. We have
to
wait a little longer to
recommend new buying. We have only a few short sales serving as hedges.
Note the breakout failure by
the QQQQ. This sets up 32-33 as stronger resistance on the next rally
and is a bearish technical
sign now.
TigerSoft users, short sellers will have to be very nimble, I suspect. The
best selections
would seem to be those stocks
showing recent optimized 5-day Stochastic Sells where the
stock is below its 50-day ma,
has a negative current Accum. Index and a falling Closing Power.
The Financial Problems Are Worsening
Hard to believe, but the ecominc news is getting worse. Tomorrow GM may declare
bankruptcy.
The IMF is predicting
that toxic bank debts "could reach" $4 Trillion, up 80% suddenly from the
$2.4 Trillion they
estimated last Fall. Leading Wall Street firm has made a lot of enemies. Look
at Yahoo's Finance's
Messages on GS. Slate.com's critique of GS
is frequently now heard. For the
rally to continue,
investor confidence is needs to grow, not contract.
CNN
Money has reckoned the US Government (and we taxpayers) have already spent $2.6
Trillion
rescuing banks from their own
mistakes. Obama is clearly continuing down the same path
that Bush and Goldman Sach's
CEO Paulson started. The
Zombie US banks will likely need $4
trillion
to make up for their "toxic" debts says the IMF. Will the American public
allow Obama to
keep giving unlimited amounts
of money to Wall Street as his advisors, Summers and Geitner want.
Scandal after scandal is
emerging for Obama. Even the liberal CNBC is critical. This weekend
the news broke that Obama's
Chief Economic Advisor, Lawrence Summers, got almost $8 million
last years for a few weeks'
"work" and speeches at Wall Street firms. Now the billions secretly
paid to Goldman Sachs by the
taxpayer through the newer AIG bailouts are being investigated.
As a result more and more
critics are emerging of the effectiveness of Obama's economic solitions
and his excessiveky close ties
to and and control by the biggest Wall Street firms. In former IMF
Chief Economist Simon
Johnson's words, "the finance industry has effectively captured our
government".
Leadership is desperately needed. Obama will not be able to
provide that if
the public realizes how
effectively Wall Street controls him. Despite his populist rhetoric, Obama
has shown no willingness to
confront entrenched interests anywhere. Muddling through this
gathering depression is not
much of a long-erm solution. Without significant new controls and
re-regulations, there can be
little public confidence in Wall Street that investments will be safe.
Sadly, the Obama SEC now is postponing a decision on returning back the short
selling rule
to requiring up-ticks.
This is very dismaying and more proof that Obama's SEC are run by
pathetic cowards who continue
to want to protect Wall Street hedgefunds rather than safegaurd
investors and Main Street.
This is the single most important step the SEC can do to protect
everyday investors from
predatory organized short selling bear raids.
4/6/2009
Buy B12. The 40%-Down Line crosses at about 7835. A DJI close below
that will produce
a new Sell S5. If that happens it will reverse the Sell S12. Folks who
wish to use a
purely automatic system should use this and not buy as suggested below at 7550-7600.
They should wait
for the next automatic Buy.
The rally now seems to have stalled. 8000 was earlier support until February,
Now the market is
having trouble getting back above it. That was one of the scenarios we
thought was likely.
The Futures are down more than 70 at this writing. A decline back
to
7550-7600 would seem
likely. But after a decline to the 5-day low, I would give the DJIA a
chance to again attack
8000. We want "head-room" to buy. If 8000 is the barrier, we should
probably wait for a
decline back to 7550-7600 to have 5% upside potential. A rally sparked
by short-covering when
the SEC tightens up the short sale rules seems reasonable to expect.
That might take the DJI
to the top of the price channel, the down-sloping line that parallels the
falling support line
from which the DJI turned up almost a month ago.
The rising Closing Powers lets us hope for a late day rally. That may happen again.
But the DJI is up more
than 19% in the last month. Much of its strength has come
from bank stocks, like
Citigroup +164%, Bank of America + 138%, JPMorgan +77%,
These are due for some
profit-taking. Red Sells have appeared today on C, BAC and JPM.
Technology leaders, IBM
and AAPL, rose today, See if they can hold up today.
Momentum is still up. Even if the steep uptrend-lines for the Closing Power and the
Accumulation Index are
broken, there is usually still another rally. Bear market rallies
tend to last four weeks
longer than the current rally. We will be watching the Accumulation
Index's 21-day ma to
top out first and then be violated by the current Accumulation Index,
as it was near tops in
August and December, before there is another significant decline.
Wall Street Is Not Trusted.
Wall Street is not out
of the woods yet, when it comes to public dislike and distrust And Obama cannot
protect it and prevent
the growing criticism of his Administration for being too friendly toward Wall Street
at the expense of Main
Street. This
weekend it was reported that Obama's chief Economic
Advisor,
Larry Summers, received nearly $8 million last year from Wall Street firms. Populist
rhetoric aside, that
help explain Obama's submissive and even fawning behavior towards
the biggest Wall Street
firms. Summers' big payments were mostlly honorariums for part-time
and symbolic work,
where he could lend his name to the success of a meeting or the operations
of a hedge-fund.
Bribe or not, can Summers be objective and disinterested towards the very
people who gave him so
much money for so little work. True or not, it smacks of "advance bribes"
to a lot of people.
If that criticism is picked up by Republicans and the Media, it may force
Obama to pursue
policies less liked by Wall Street. It would seem it is only a matter of time
before more and more
populists challenge him directly, as Paul Krugman has. They will seek a
criminal investigation
of economic crimes committed in 2007-2009; publicity, transparency and
limits on executive pay
for banks getting TARP funds; a re-thinking of the FDIC guarantees
of purchases of
"toxic assets" by private interests; restoring Gass-Steagall; nationalizing
"bad"
banks and even
prohibiting short sales altogether.
See Wall Street's $7
Million Dollar "Advance-Bribing" of Obama's Chief Economic Advisor,
Volume declined dramatically today as aggressive buyers stopped chasing stocks
and watched to see if
short sellers would become aggressive again. We have to watch
how deeply th
decline will take the DJI. If it is shallow, buyers will come back into the market
very quickly.
The SEC's plan to limit short sales to up-ticks weighs heavily on the minds of short
sellers
that have had an easy
time since July 2007. The SEC is scheduled to make their plans
known on Wednesday this
week. Leading technology stocks like IBM and APPLE
rose today. That
has to be a good sign. The flat topped breakout by the QQQQ I take
to have been about
31.70. A close below that would make the breakout look false.
Intra-day moves can
whipsaw us. So, we have to use closing prices.
Regarding breakouts, please see these two Blogs:
1. Tiger Blog - FALSE BREAKOUTS: How to Recognize Them and Profit ...
2. Flat-Topped
Breakouts Study
4/5/2009
Peerless gave a Buy B12 on Friday. This is based on unusually favorable breadth,
Until early 2009, these Buy
B12s signals were extremely reliable. But the one early in
2009 failed. I think
that can be partly explained as being the result of tax loss selling briefly
lifting. So, we should
probably deny B12s that are seen in the first few days of a new year.
What about the "B12" now? It signals something important. By itself,
the market's
relatively low volume might
well be a sign that the rally is mostly a big short squeeze.
But the "B12" shows
us that there is more to this rally. The market's breadth now is remarkable.
It is almost uniquely
positive. Stocks across-the-board are rising, not just stocks with high
short interest.
Understand that "breadth" here is the daily ratio of NYSE advancers to NYSE
decliners.
Please note that I did not
spot it at the time, but the first two of three days of the present rally
saw a breadth ratio, NYSE
advancers to decliners, of more than 10:1. On 3/10 there were 2936
advancing stocks and only 225
decliners. On 3/12/2009, there were 2864 advancers and only 284 decliners.
This is very rare.
There are no earlier cases since 1945 of two 10:1 positive breadth days
in a 3 day period.
(There are no other cases, since such breadth data began to be kept reliably
in 1945. There
are several cases of this in the war years for the data I have, but that data
seems spurious in that
the DJIA fell on each of these days when the ratio was so favorable.)
For data on Buy B12s, see http://www.tigersoft.com/PeerInst/-B12.htm
B12s are the most reliably
bullish Peerless signal.
In 12 of 26 cases, the signal brought a stampede into stocks. In only 5 cases
did the DJI fall back more
than 4.4%. Early January Buy B12s are now seen as not trustworthy.
The superb breadth for the
first few days of 2009 was more a sign of the end of severe tax loss
selling in 2008, than it was
evidence of a new bullish environment. In all other cases, a testing of
the lower band after a Buy
B12, if such a decline did occur, were very relialy bullish.
"Legacy Assets" - Orwell Would Be Proud of Obama.
I think what happened this year was that Obama was initially seen as a populist threat
because
of his rhetoric about Wall
Street excesses. In the last month, Obama has reversed course and
sent out numerous signals
that he wishes to only mildly reform Wall Street, not nationalize banks,
not pursue criminal
investigations or even limit Wall Street pay. Instead his Treasury Secretary,
Geithner, plans a TARP-II to
bring a second huge bailout to banks. See my Blog of March 25th,
Why
Is The Stock Market Rallying? Wall Street Now Sees That Obama's
Populist
Rhetoric Is Designed To Fool The Angry Public.
Obama Is
Signaling Wall Street He Will Protect Them.
The broader public does not
understand that Wall Street was by far Obama's biggest campaign
contributor and Obama has
surrounded himself with anti-regulation economists. If he can keep
that a secret from the public, Wall
Street is very safe. That may not be possible, especially
if his bailout, stimulus, deficit
budget and the FED'a loaning of trillions does not work. Even the current
issue of Newsweek is running as its
lead article one that focuses questions on Obama's
cozy relationship with Wall Street
from the viewpoint of the more populist, but Nobel prize-winning
economist Paul Krugman.
Returning to technical analysis, it is certain true that
volume relative to what it had been
on the decline is lower on
the NYSE than is normal for a new bull market. Moreover, "V" Bottoms
are rare. But there is
no mistaking the bullishness of the breakout by the NASDAQ-100 above its
4x tested, flat resistance at
32. The Closing Power is rising for all the major ETFs. Cyclical stocks,
like
tire companes (GT), airlines
like (DAL) and in the DJI-30, AA, DD and CAT, are among the strongest
stocks since the market
turned up last month. The biggest gainers over a month ago in the DJI-30
are financial stocks: C
+179%, BAC +133%, JPM +76%. Goldman Sachs is very pleased with
its million dollar investment
in campaign contributions for Obama, as shown in the first chart.
Another bullish element should be noted. Only the DJI-30 made significant new lows
in
March. The other
averages hit only marginal new lows. That is the main reason there
was not more resistance on
the recovery rally. Unusual weakness at the bottom by the DJI
coupled with much greater
QQQQ strength are not so unusual. The 2001-2003 bear market ended
first for the QQQQ, ahead of
the DJI. This stands to reason. We only know that there has been
a real selling climax when
normally safer, blue chip stocks are sold most heavily, even
recklessly. At
the same time, savvy professionals are buying the more volatile technology
stocks in the QQQQ because
they see opportunities to the upside. Thus, the breakout from
its base by the QQQQ seems
very important.
The QQQQ has now readily sliced right through it falling 30-week ma
resistance.
Normally some resistance
might be expected. So, the QQQQ looks like it is headed higher,
even though it has risen 22%
in the last month. Note now that the 200-day ma is at 35. Even
a 33% retracement of what the
QQQQ has lost in the last year, would bring the QQQQ to
34.76. A 50%
retracement would take it to 37.83.
Wall Street is taking to Obama as fondly, perhaps as they did to JFK in 1961. See
the
DJIA's 1960-1961 chart near
the bottom. Volume was slow to pick up then. It is not clear
that Main Street has enough
income and buying power to keep the rally alive for more
than a month more. But
that still might mean 10% higher prices from now. We want to
watch to see if the Dollar
starts to get weak, If that happens, the Fed's generosity may become
contrained. Obama said
in Europe that he would not oppose and even understood the merits,
from China's point of view ,
for the creation of an international currency. It will be interesting to
see how the Dollar reacts to
that. Usually Presidents always "talk up" a strong Dollar.
Apply the first-out-of-the-gate principle now. In this environment, I think we have
to buy
the best performing
stocks of the last month, apart from banks stocks which may still be in
for more bad news when
results of Geithner's "Stress Test" are released. The QQQQ seems the
best ETF to play on the
long side. Only a decline by it back below 32 would make it appear
the B12 was again
wrong. A DJI decline back below the 40%-down level would also be
bearish enough the
reverse the B12. After I wrote all this, I read that Geithner announced
some bank execs might
have to go and IBM has changed its mind about buying SUN. The Stock's
Hotline did warn not to
buy new stocks in the DJI opened down more than 50.
4/2/2009 8000
in the DJI may still pose resistance. But the breadth is unmistakeably bullish.
The NYSE
A/D Line downtrend has been clearly violated. In the old Peerless days this
would have
been considered a Buy B6. And very bullishly, 9 of the last 18 trading days
have
seen NYSE
daily advancers outnumber decliners by more than 3:1. Since 1942, this has
happened
only twice before, on 1/19/76 and 1/20/76. In these cases the DJI advanced
6.9%
and 6.2%,
respectively. Given how rare this very good breadth is, I think it would be wise
to consider
the market apt to rise still more, even though it is up 24% from its bottom 3 weeks
ago.
More research on slightly looser parameters will be done this weekend.
V-bottoms
are rare. They give no retreats for good re-entry points if traders
lose their
long positions. We need a better Buy signal for them. What looks like a good
BUY
signal is
when the ratio of the daily NYSE advancers to decliners is more than 2:1 for the sixth day
in a month
following a bottom. This looks promising. Thre are no ways to test it in
the 1930s
unfortunately, as the data was not kept. But here are the cases where this happened
after a V-Bottom.
We will
soon broadly test a rule based on this. For now see the charts 1942, 1949 and 1971
DJI Bottom
Six Days of
2:1 Adv/Decliners after bottom
1942 92.90 on 4/22/1942. 6/17/1942 106.30
At that point the DJI was ready to
retreat back to its 21-dma before resuming the new bull market phase.
1949 161.60 on 6/13/1949 7/1/1949 168.10
This would have been a superb entry point as the
DJI raced much higher immediately.
1971 798.53 on 11/24/1971 12/10/1971 856.75 This was
an excellent entry point.
2009 6547.05 on 3/9/2008 3/25/2009
7749.81 The followed a 2-day retreat to 3.5% upper
band and then a rally.
There's no denying the upward momentum. But the
over-head resistance
at 8000 may
not yet be eaten up. A very useful number to watch is the annualized rate of change
of the
21-day ma. The "AnnROC" is now 179.9%. This shows very
strong upward momentum.
I would
normally advise waiting for some signs that the rally is losing steam when momentum
s this
strong. Breadth has been superb. Cyclicals like autos are doing very well.
The DJI is back
above the
40%-down level. So, the Sell S5 is cancelled, as I suggested last night. Traders
should
revert back
to using either a Sell Stop beneath a 10-day ma, or a break in the Closing Power
uptrends,
or a
retreat by the DJI back below the 40%-down level at 7835. As said earier,
V-bottoms
can be
effectively traded using a 10-day ma ma. A further advance would take the DJI above
its falling
100-day ma. In the past this usually brings in more buying. Watch the QQQQ.
It closed
exactly in
its 4x tested flat resistance. A breakout above level that would be a Buy for
many traders.
shorts
would have no choice but to cover. All the key Tiger indicators are bullish for the
QQQQ now.
Rules
making it harder for short sellers are likely to be imposed in the next month. (Why
it should
take so long, is completely unclear.)
4/1/2009 8000 Is Important
Resistance. Even above that, it will be better to wait for
a pullback
to Buy. V-Bottoms are relatively scarce. 1942, 1949 and 1971 If
this turns
out to be a
bear market rally, it will still be better to buy when there is "head-room".
The
DJI advanced closer towards the 8000 resistance. Breadth was again 3:1,
advancing
versus
decliners. We also see that each Fidelity Sector fund is up more than 7% for the
last
month.
but the DJI is now up 19% from its lowest closing, on March 9th at 6547.
Bear market
rallies
late in the overall decline can sometimes advance 25%-35% and last 8-10 weeks.
So, the DJI
may get past 8000. That is the expected resistance, because it held up as support
on October
and January. A support level once volated with an intervening decline of
20% or
more
usually acts as probable resistance. Volume is usually needed to eat up such
over-head
supply.
Volume was lower again today on the rally, just as it was on Monday's
advance.
Volume is
needed to eat up over-head supply.
The
operative Peerless signal remains a Sell S5, based on the DJI falling back below the
40%-down
level. In all four cases from the 1930s, this type of resumed Sell S5s predicted a
further
decline of 15% or more, before there was a meaingful rally. But perhaps,
this time
things will
be different. Four cases are not enough to be stubborn about! So, I
would consider
the Sell S5
cancelled if the DJI closes back above 8000. That is not the same as getting a new
Peerless
Buy. But as long as the Closing Powers are rising for the QQQQ, SPY and DIA
and
there is no
new Sell, the LONG positions held on the Stocks' Hotline will be held.
Note how the DJI did find support at the 3.5% upper band. The momentum is still
quite
strong.
Bear market rallies tend to continue longer than we have so far seen.
And Aprils
have a very
positive bias.
Resumed Sell S5 - When
DJI falls back below the 40%-Down level.
This signal must
be considered nullified if DJI rises back above
this level.
That level is considered a key boundary. Above it
is
bullish... Below it is bearish.
Use the Extreme Bearish Peerless mode, as a result. We will have to wait for
the next
Peerless Buy
from either the regular Peerless if the DJI moves higher or a new Buy in the
Extreme Bearish
Mode. Buyers need some price-headroom if 7900 is the ceiling.
Resumed Sell S5s based on a drop back below the 40% down level from
a high of 12
months or less are very rare. In each case the market fell significantly
further down,
Here are the three cases.
1 The 1929 drop
recovered back above this line in November 1929 and did not drop
below it until
June. The DJI then resumed its long bear market.
2. The 1930 end-of year decline took the DJI 40% back below the April high of that year.
The DJI fell from 176.50 on 12/9/1930 to a low of 157.50 on 12/16/1931. The DJI then
rallied 24% to a
bear market rally high.
3
The September 1931 break in a similar line, 40%-down, led to an immediate 15%
decline,
then a recovery back to this line and then more of a bear market.
May 1932. Breaking this line for the first time, on 5/17/1932 at 54, the DJI fell to
42
and then rallied
up past the 40% down line at 54 and rallied to 80.
4
March 1938. DJI fell back below the 40%-down level on 3/24/1938, closing at 114.60 and
fell to a low of
98.90 on 3/31/1938. |
3/31/2009 Sell S5 Operative
The Closing Power
uptrends were broken tonight. But the DJI is finding suport at the
3.5% upper band.
Notice that the annualized rate of change for the 21-day ma is +139.5%.
That is strong
upward momentum. Bear market rallies don't usually "peter" out so quickly.
So, it is not
clear that the market is ready to decline yet. Seasonality is quite bullish
for
the next
two-three weeks. I would suggest shorting above 7800 when the resistance at 8000
again proves too
much for a rally.
3/30/2009
Friday's
new Sell S5 occurred because the DJI dropped back below the 40%-down-
from-the-12-month-high. The most recent signal governs. Trading with
DIA (on
a Buy) and
DOG (when we have a Sell) would have been very succesful over the
past year.
Support is now at 7200 and resistance is at 8000. Another rally
attempt is
quite possible next because the Closing Power uptrends for the SPY and
QQQQ
are still intact. Another test of 8000 would also be in keeping with
similar
past breaks in steep up-trends of the past year. Bear market rallies
usually
last longer than we have seen so far. Seasonality is bullish now. See
the
tables for
April Seasonality at the bottom of this page. The increased volume on the
downside
today would normally be bearish, provided the news behind the decline had not
yet come
out. But today we saw what the news was. Obama has chosen to show that he is seriously
ready to
abandon GM and Detroit, all the while he lavishes billions on Wall Street. He
figures
that blue
collar workers have no where else to go politically. With the news out, there is
a good
chance for a recovery back to 7900 if there is no further bad news.
Answer to
Question: You can Super-Impose the Peerless DJI-based Buy and Sell
Signals
on any
chart. You can also use the Extreme Bearish mode on any chart. The results
are most
realistically computed by using the next day's opening under Operations.
The Extreme
Bearish Mode signals and the S6s applied to the NASDAQ would have
gained
55.2% using the next day's openings. Super-imposing the Saved DJI signals
would have
gained 148%.
More Volume Is Needed To Eat Up Over-Head Supply.
Bearishly,
the up-day volume still remains unconvincing. The key bottoms of the 1930s (and at
most
other
times) all show big increases in up-day volume as the DJI surpasses the 50-day ma.
That
is not true now. And. in fact, we may need to move many months away from the volume
levels
now
seen, so that when there is a breakout, the volume will look good.
On
the bright side, Spring is here and the market's seasonality gets much better as we
approach
April 15th.
What
We Need To Become Bullish.
Bear market rallies are as fierce as they are short lived. A rally
back to 7575 would
still
face overhead resistance. So, we can't get excited on a smaller rally. The DJI
will
now
need to surpass 8000 to really spring a trap on the shorts and launch a real rally.
Volume
would need to rise sharply.
We
will watch:
(1)
the Closing Power of the DJI with great interest to see if its can rally
and
exceed its downtrend;
(2)
the level of NYSE trading volume, which must rise to signify a real rally;
(3)
the OPCT (aka "OP21") which will need to improve dramatically
on
the DJI to make any rally look authentic and
(4)
to see if the DJI can break its 7 month price downtrendline which crosses now at 8100.
(5)
A close above the 42-day ma of prices would be a short-term Buy. This move
must
be confirmed by a positive Accum. Index.
(6)
A turning upwards by OBV's 39-day ma.
(7)
Traders can use the crossing of the 10-day ma in beaten-down markets to make
some
very good trades. But volume should increase on the surpassing of the 10-day ma.
=================================================================================
 |
Bank Reform Is Needed Badly to Rebuild Investor Confidence..But Obama Is Loudly Silent.
He seems bound to protect his biggest campaign contributors, Wall Street bankers
All of Obama's closest advisors all sought to de-regulate Wall Street. Giethner's
top assistant drafted the 1999 legislation that
did away with Glass-Steagall and allowed banks to become too
big to fail!
The most significant change that seems necessary is to restore the Glass-Steagall Act of
1933 that prevented banks from becoming brokerages and insurance companies. In
November 1999, Senator Byron Dorgan of North Dakota warned his colleagues and the public
that the de-regulation banks would be disastrous. With amazing prescience he said:
"I think we will look back in 10 years' time and say
we should not have done this but we did because we forgot the lessons of the past, and
that that which is true in the 1930's is true in 2010... I wasn't around during the
1930's or the debate over Glass-Steagall. But I was here in the early 1980's when it was
decided to allow the expansion of savings and loans. We have now decided in the name of
modernization to forget the lessons of the past, of safety and of soundness.'
Source: http://www.boingboing.net/2009/03/24/democratic-north-dak.html
At the time, Senator Bob Kerrey, a Democrat from Nebraska poo-pooed
Dorgan's warnings. ''The concerns that we will have a meltdown
like 1929 are dramatically overblown,'' said Senator Bob Kerrey, Democrat of Nebraska."
Here is a great link: "The Long
Demise of Glass-Steagall"
|
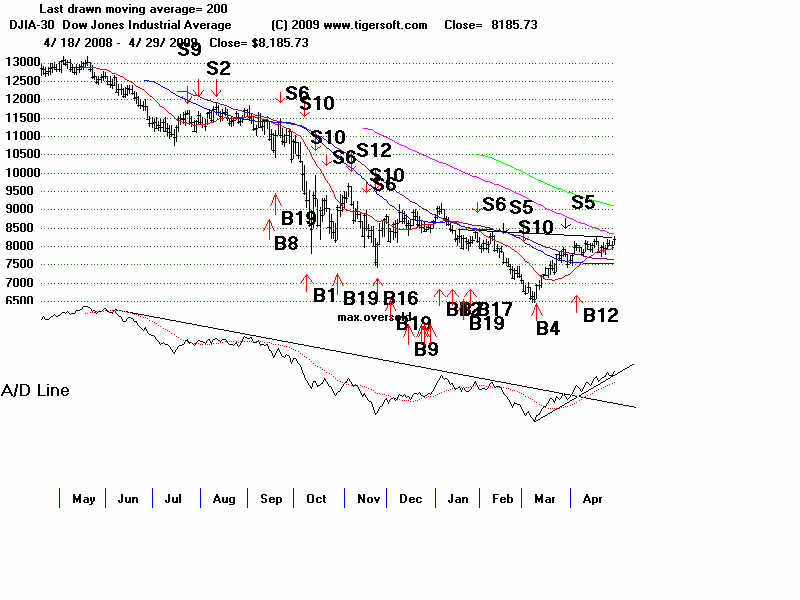
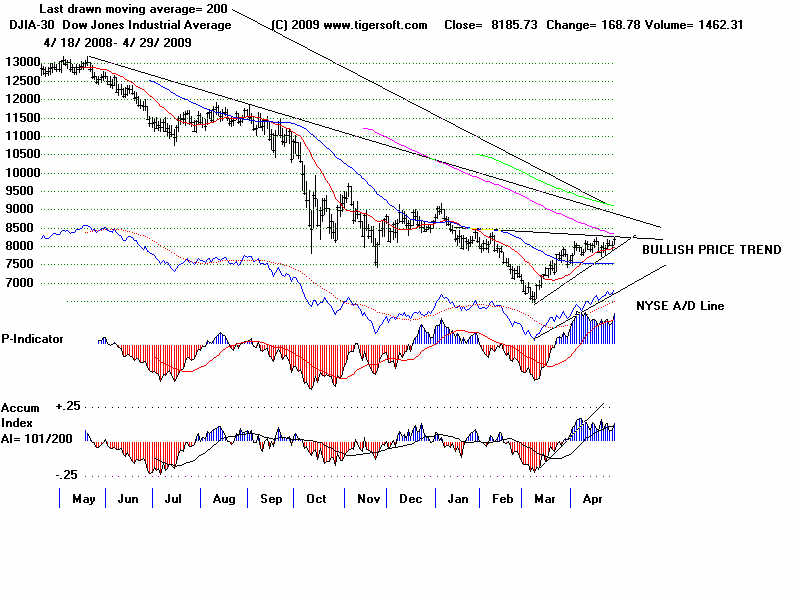
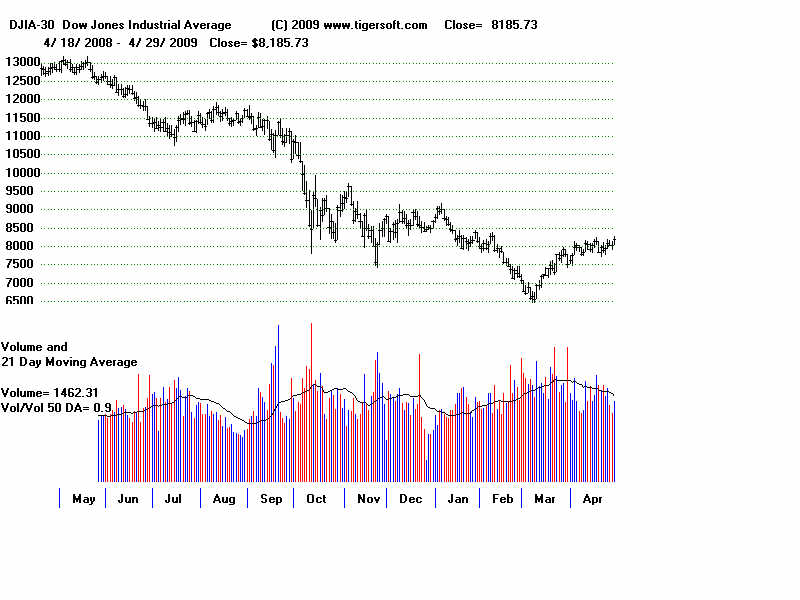
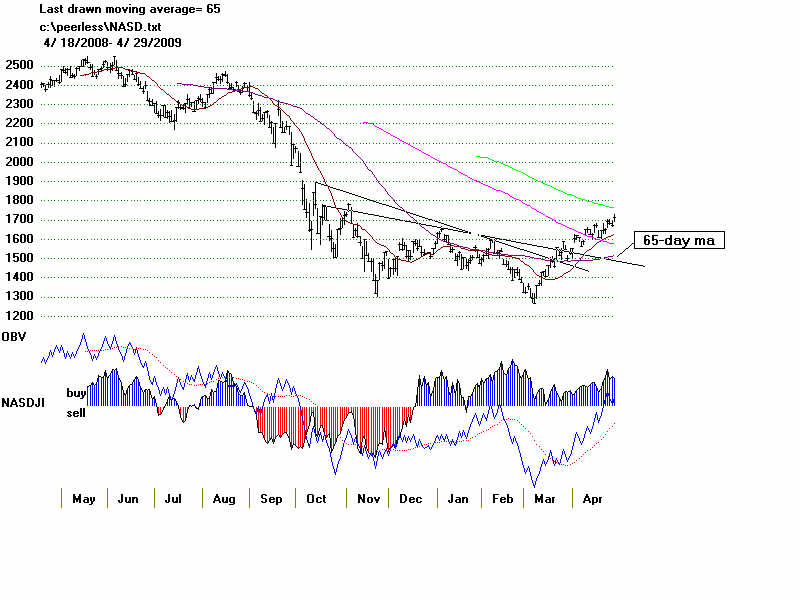
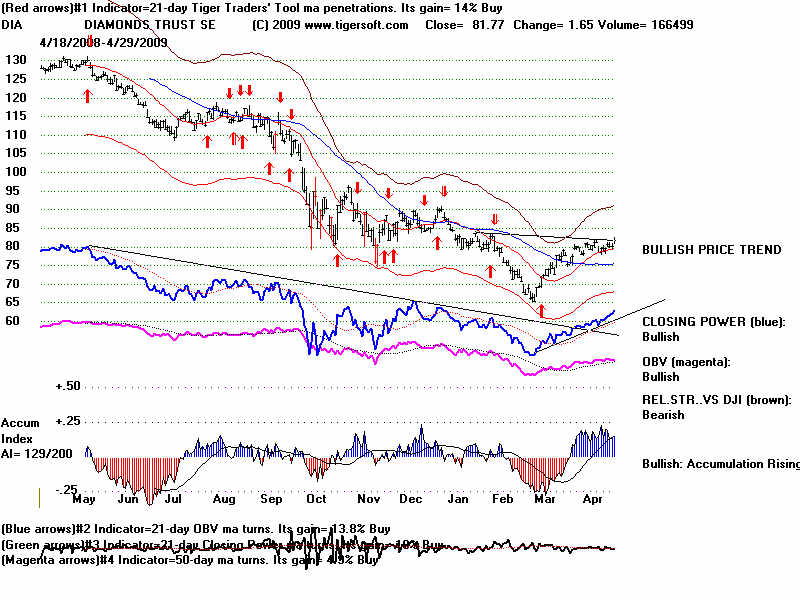
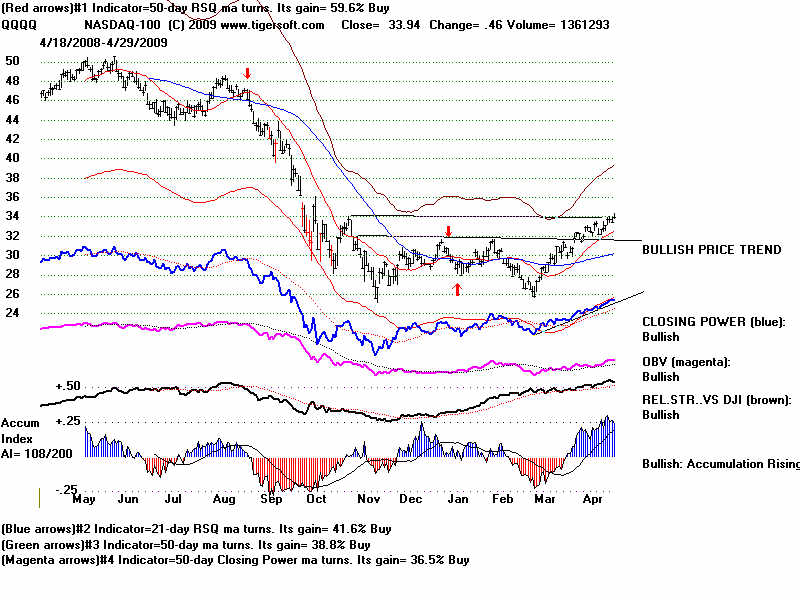
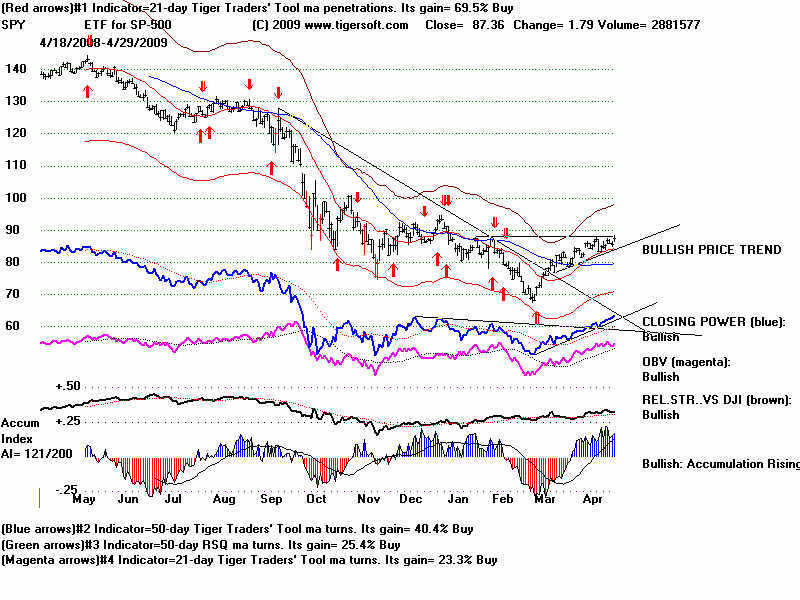
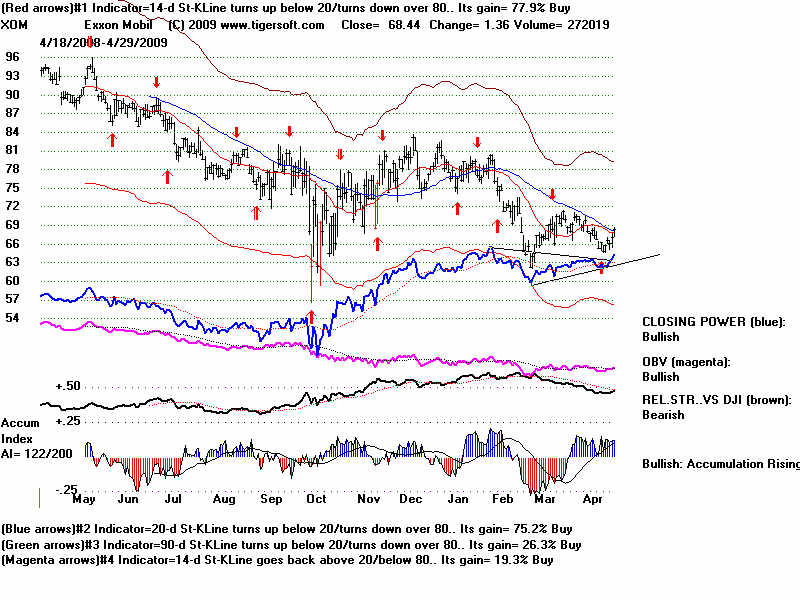
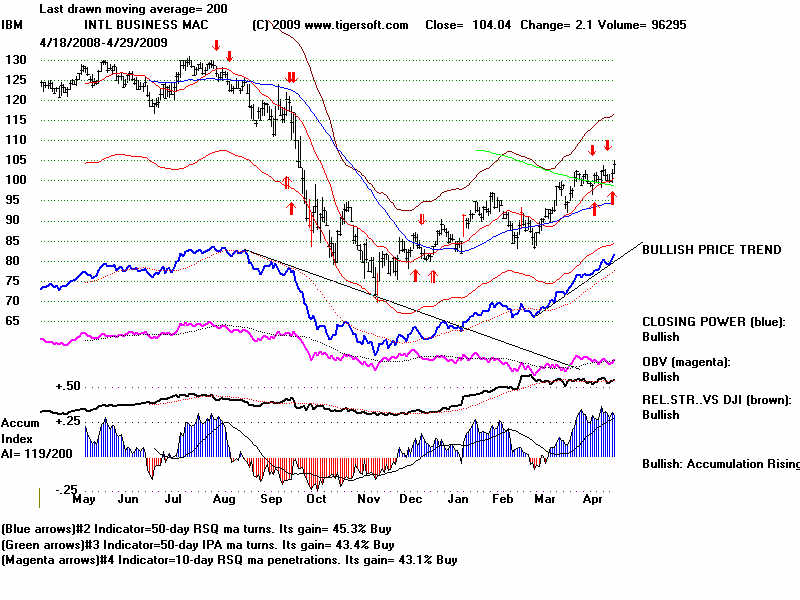
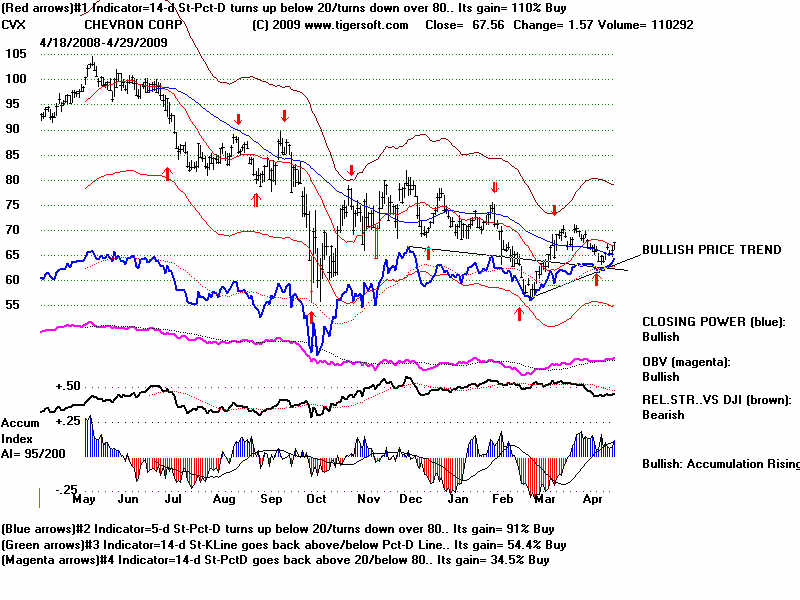
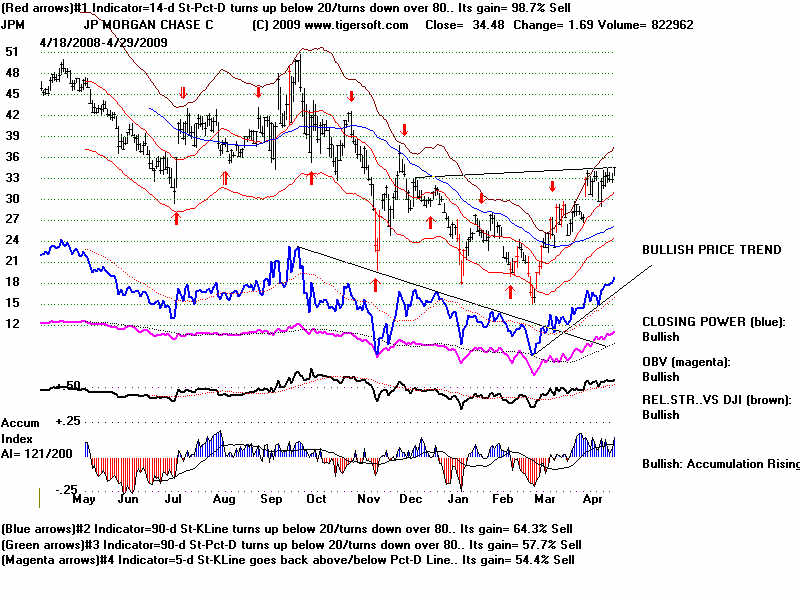
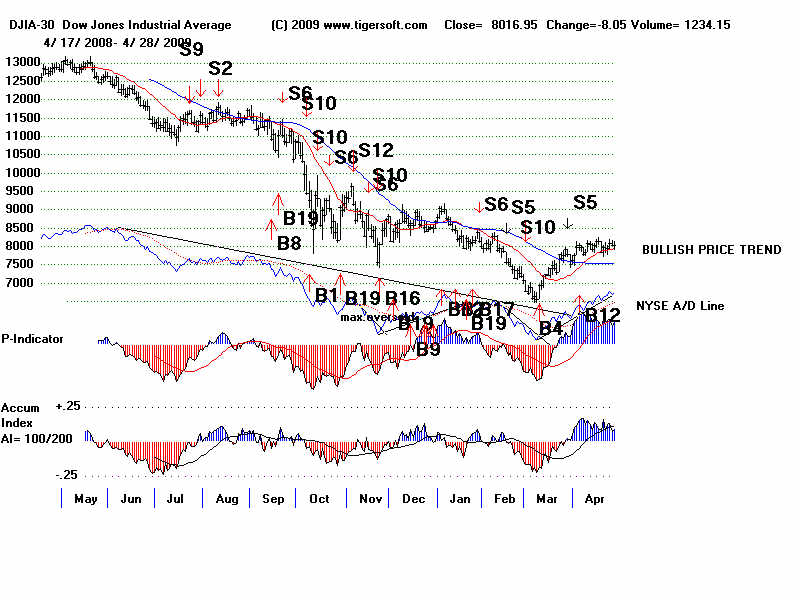
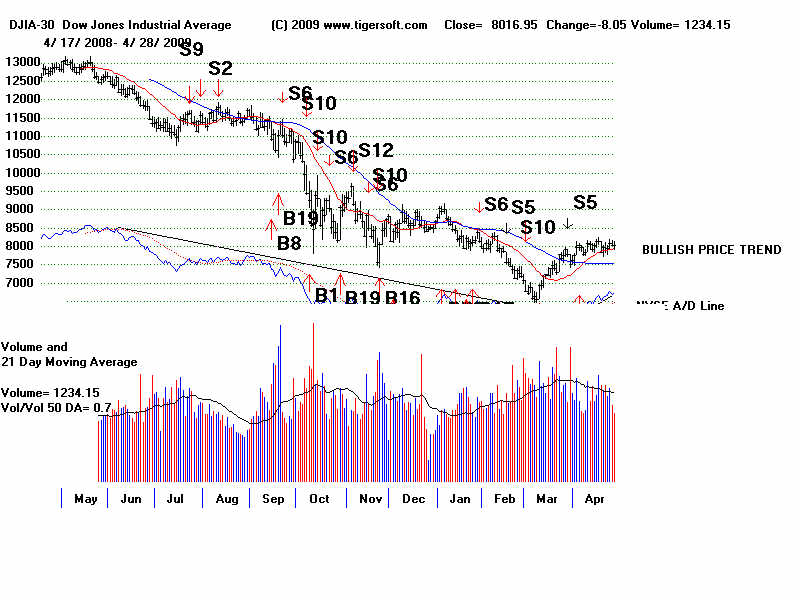
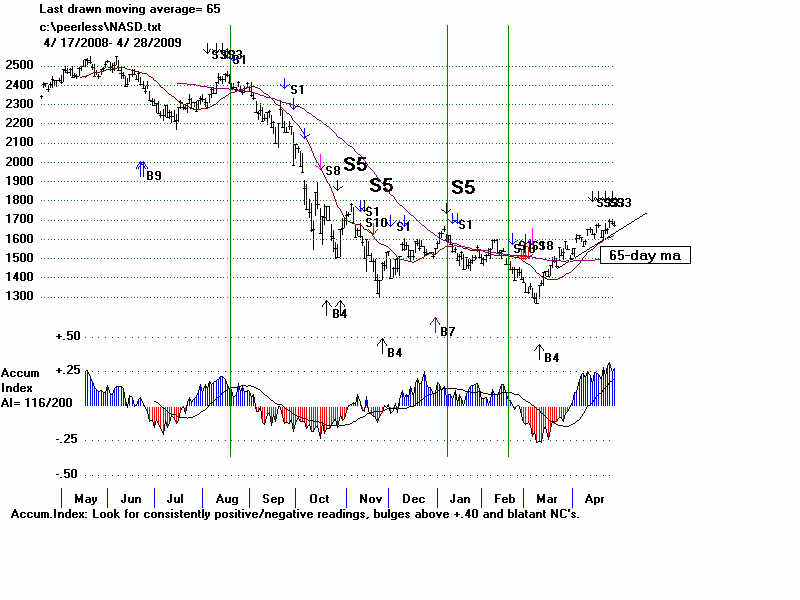
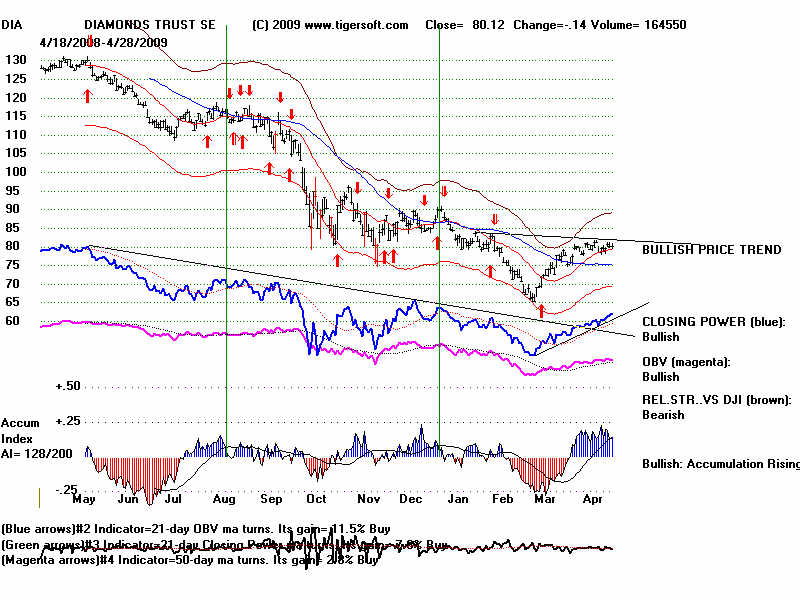
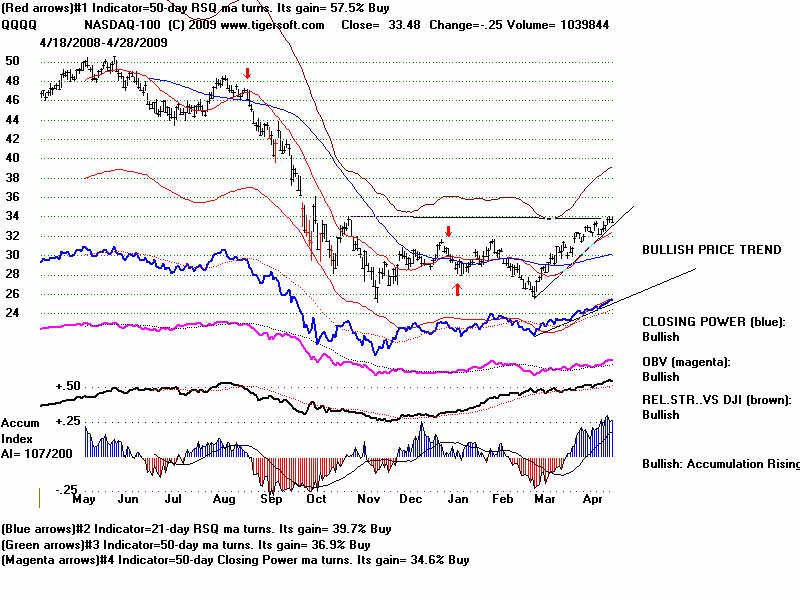
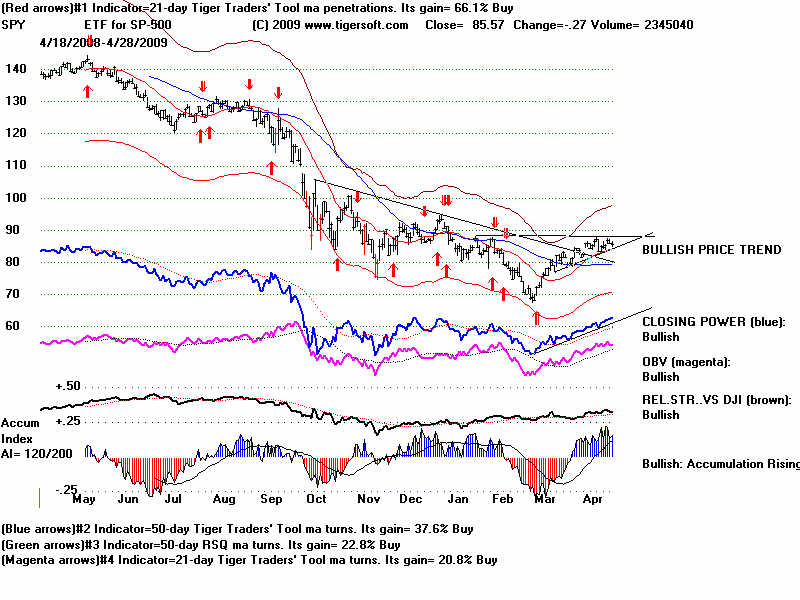
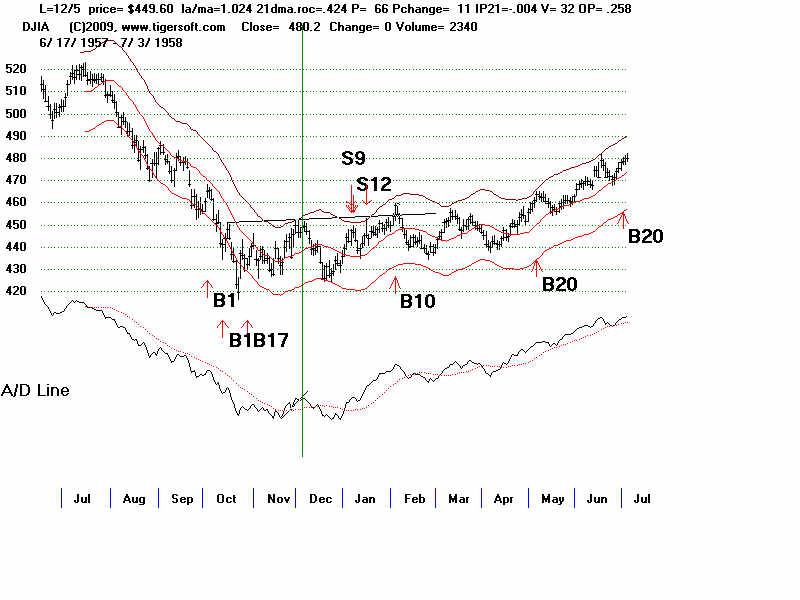
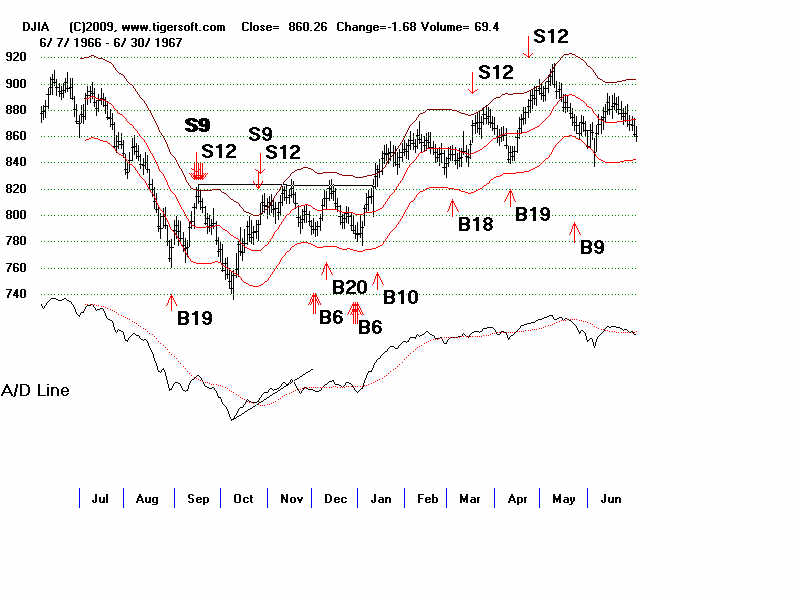
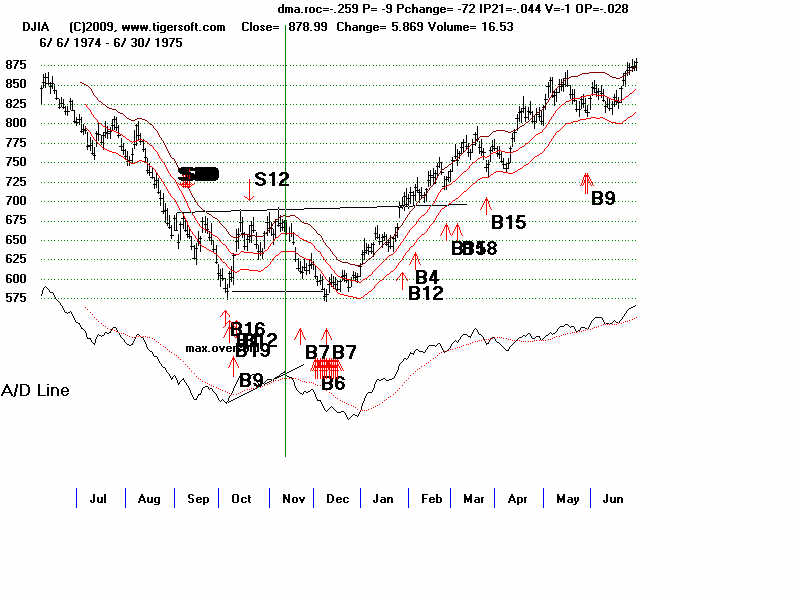
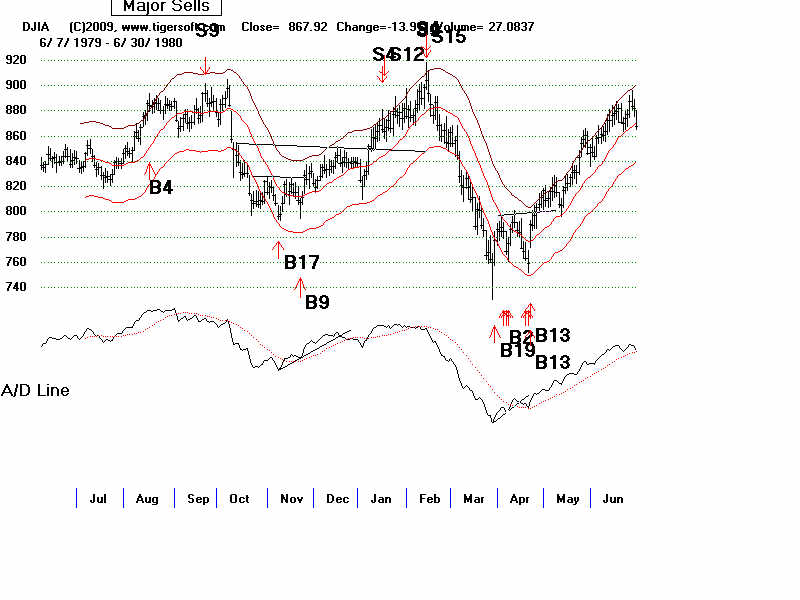
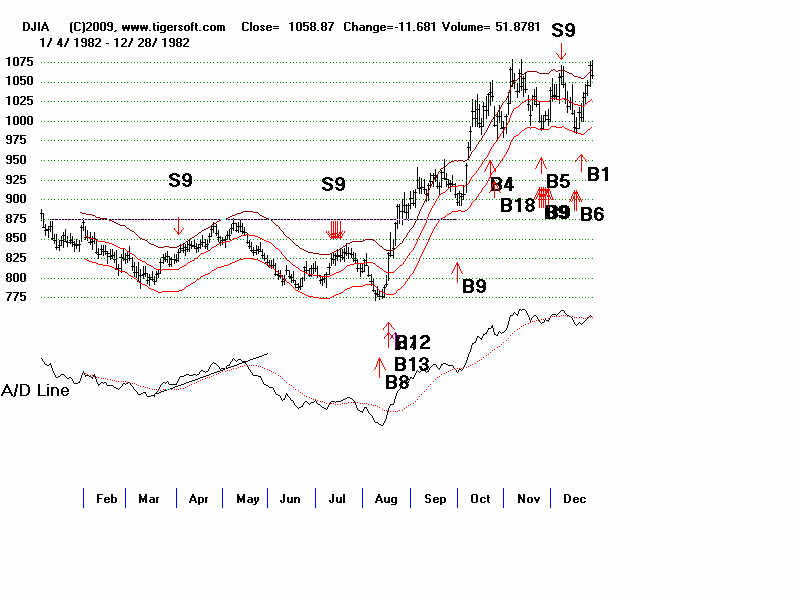
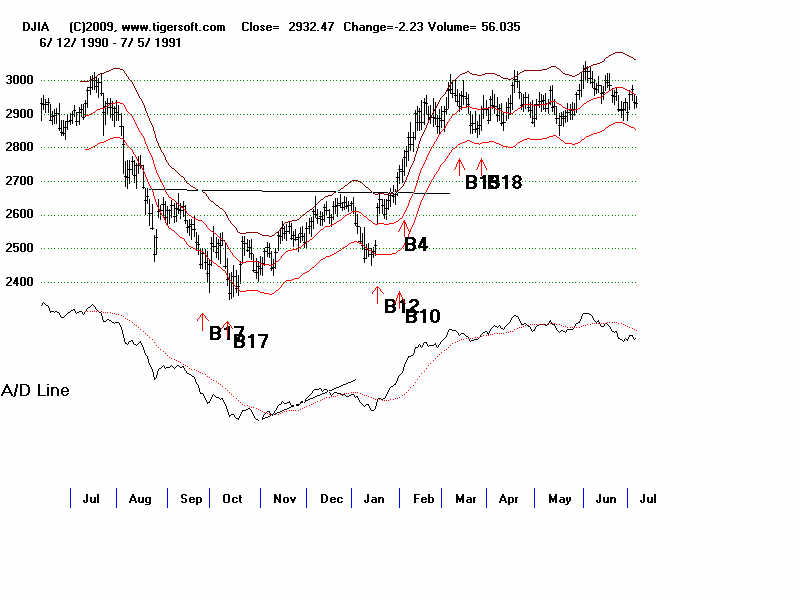
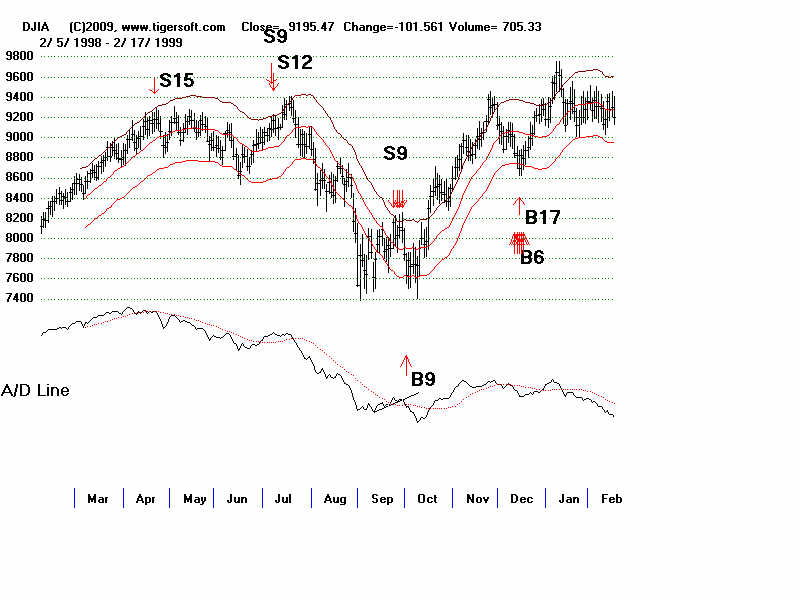
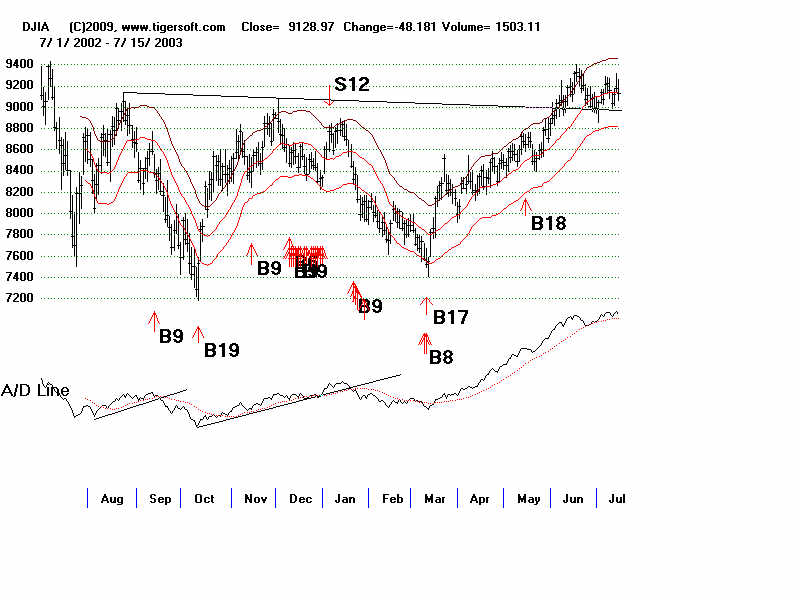
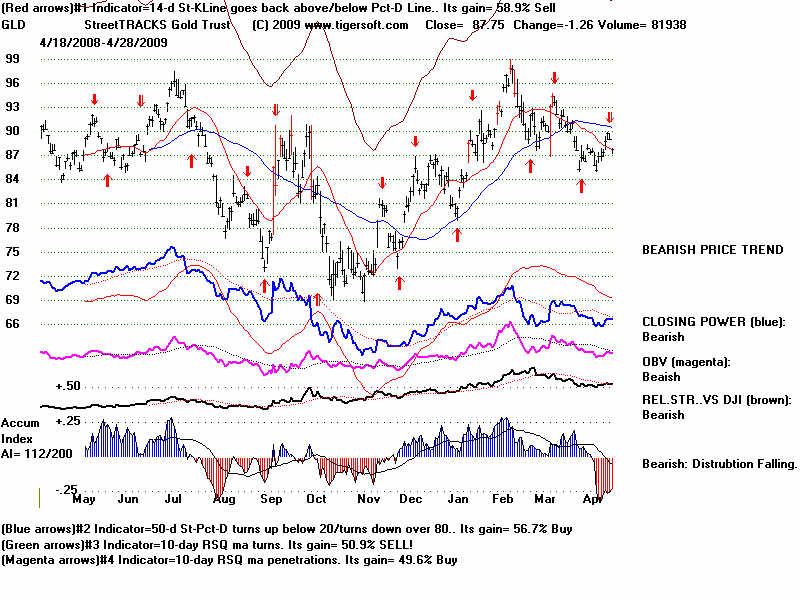
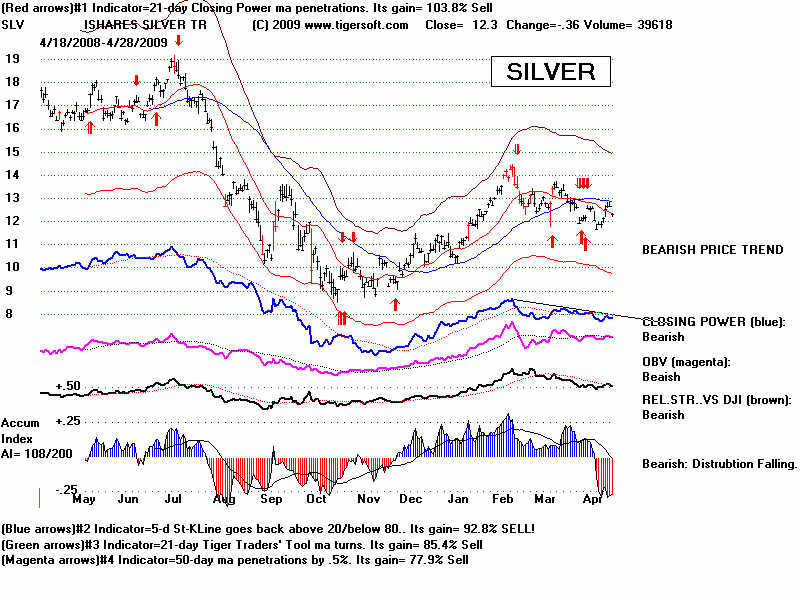
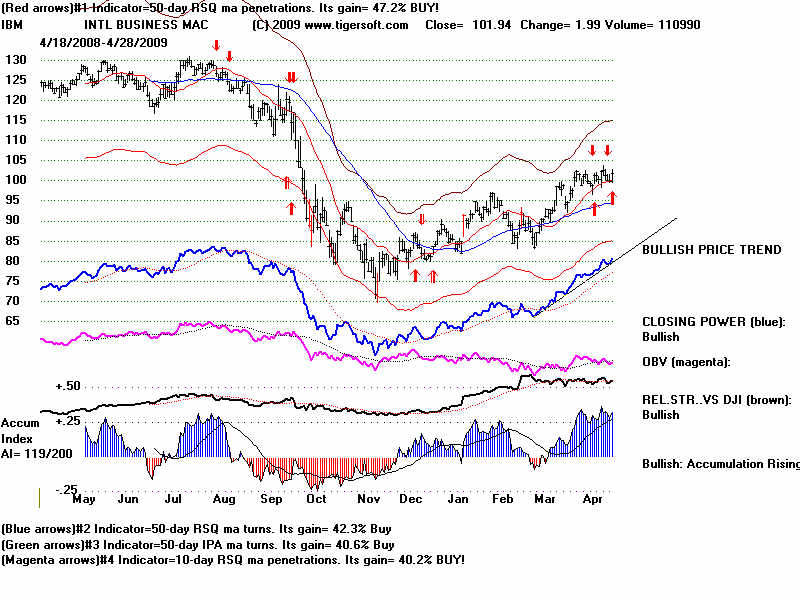
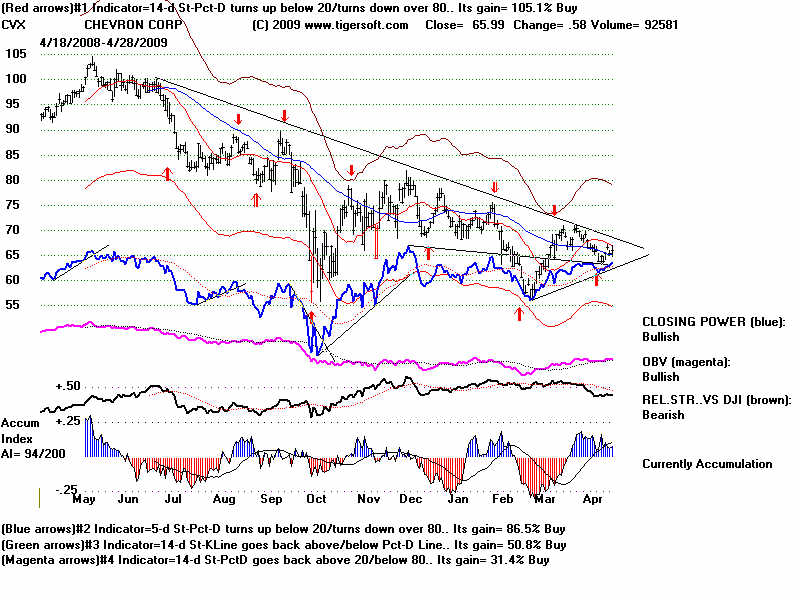
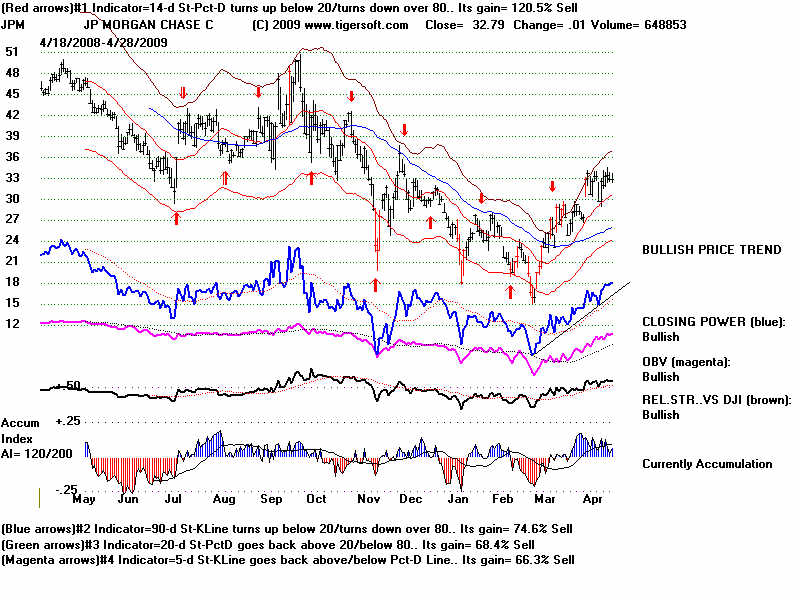
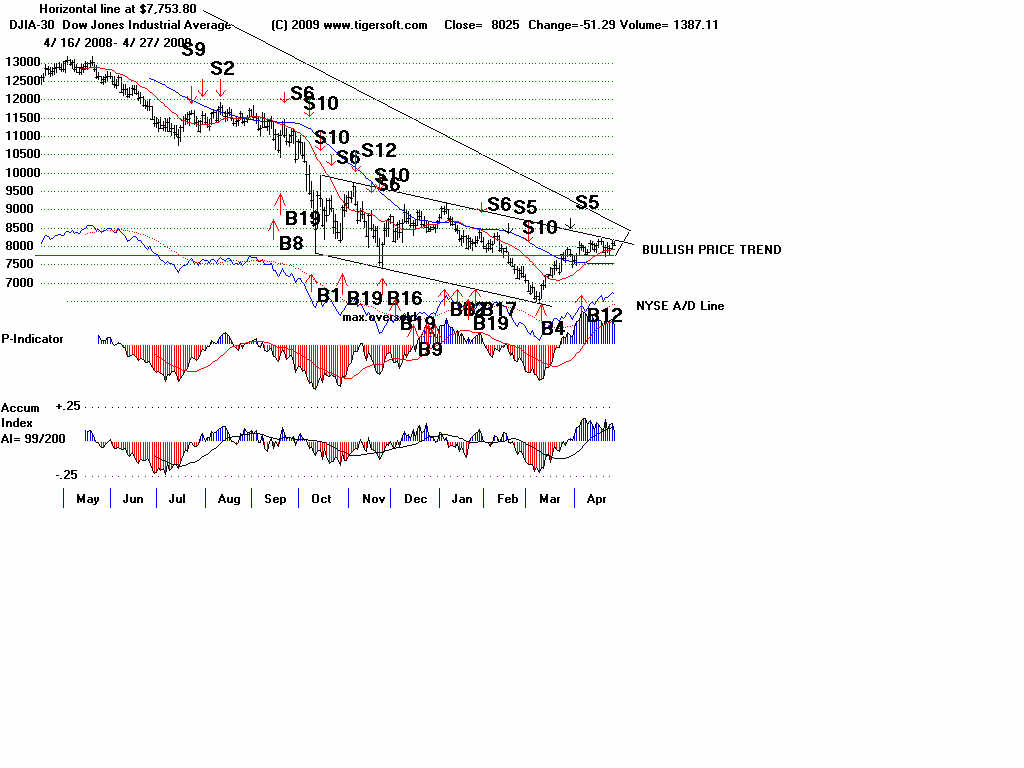
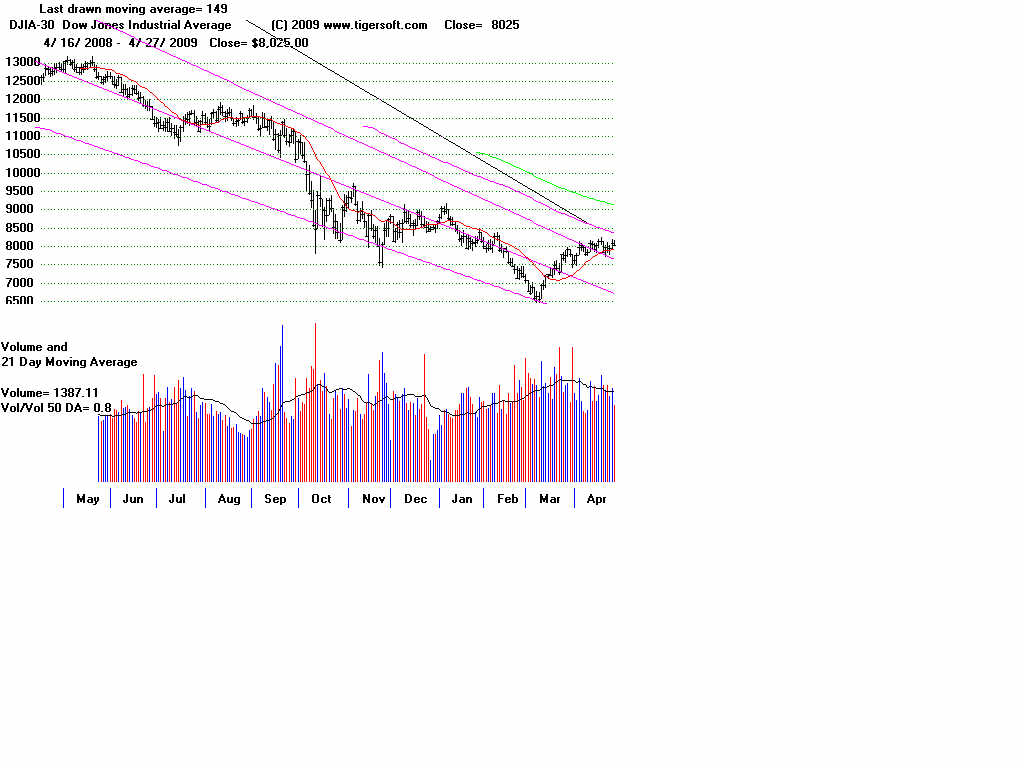
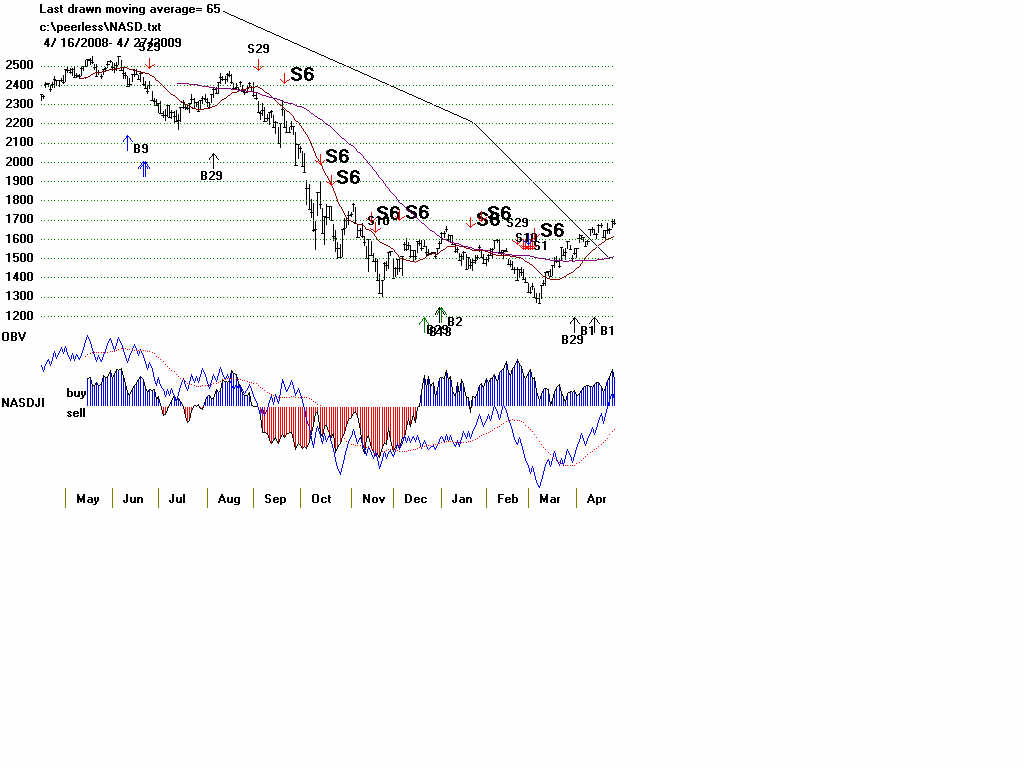
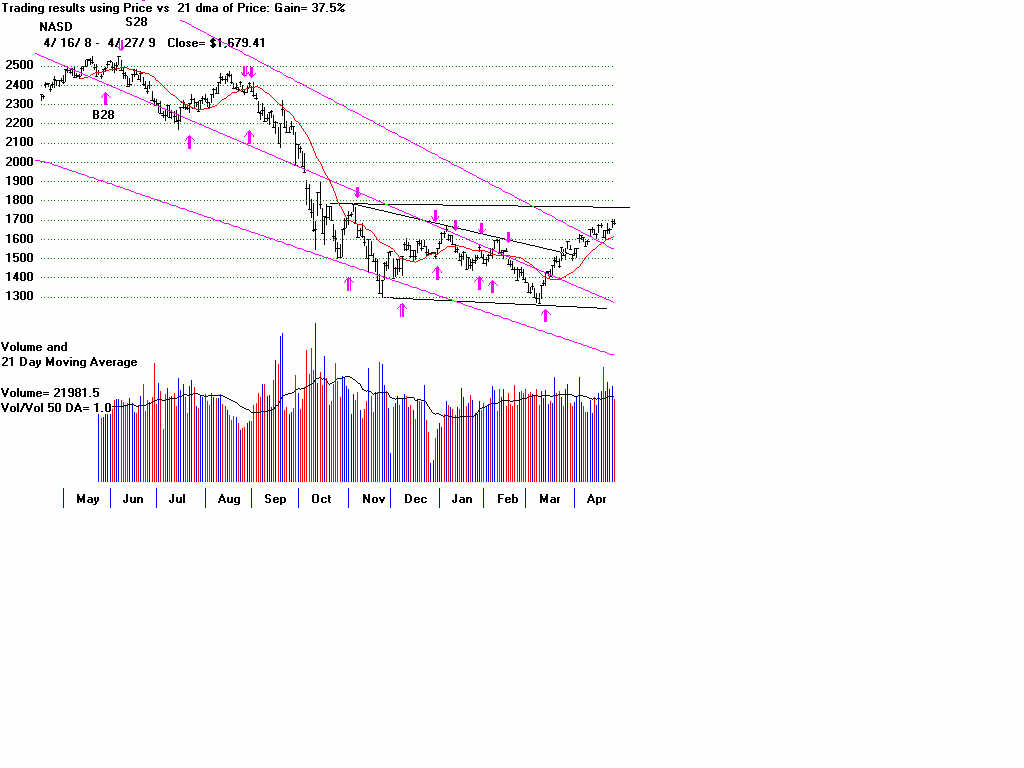
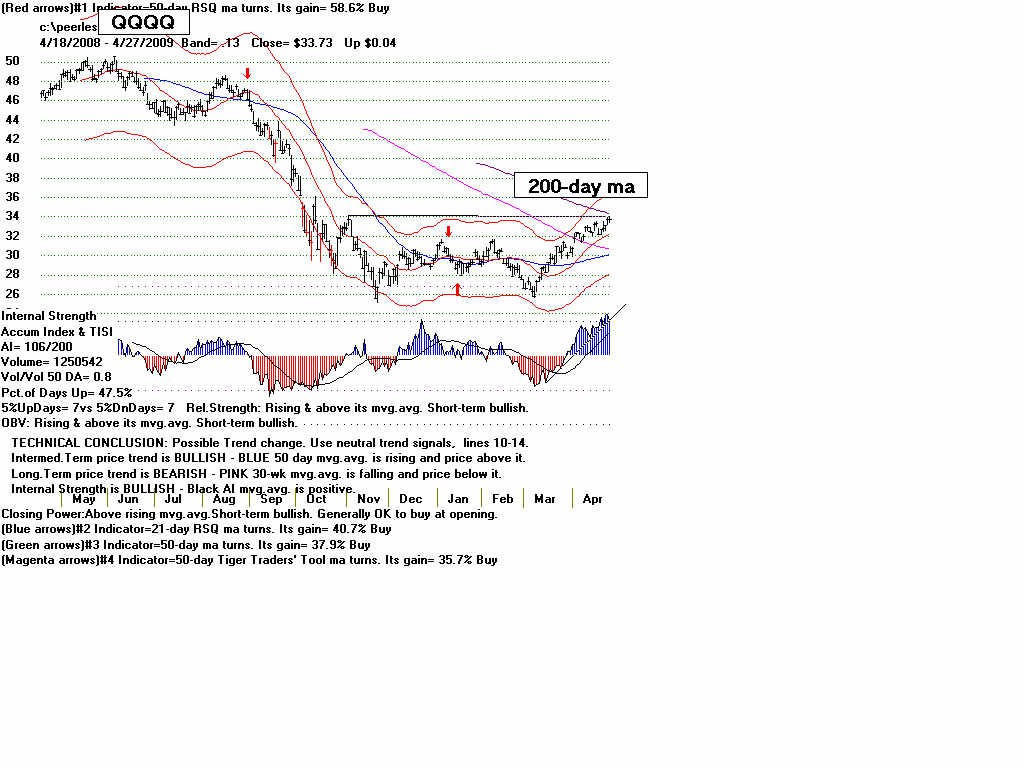
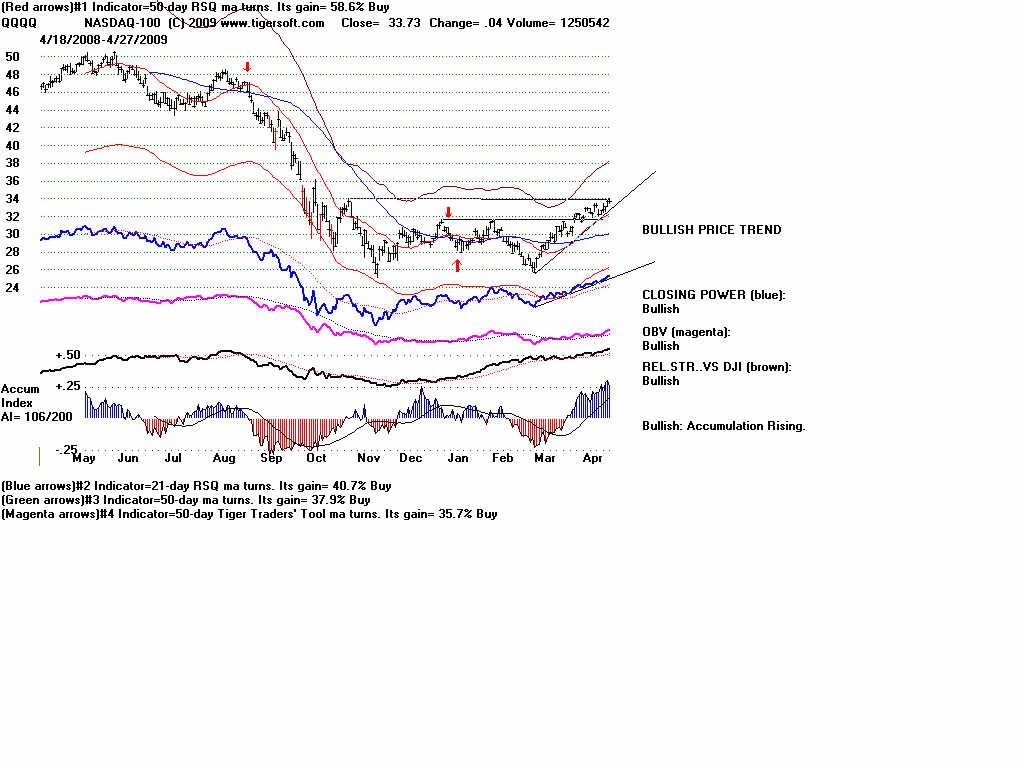
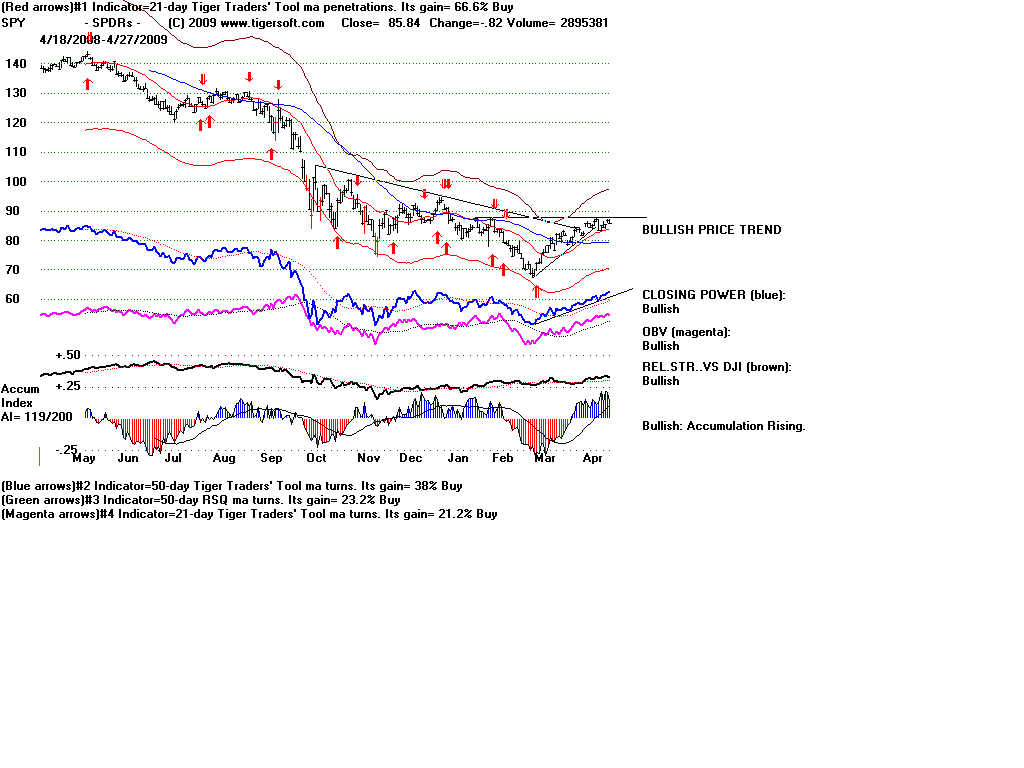
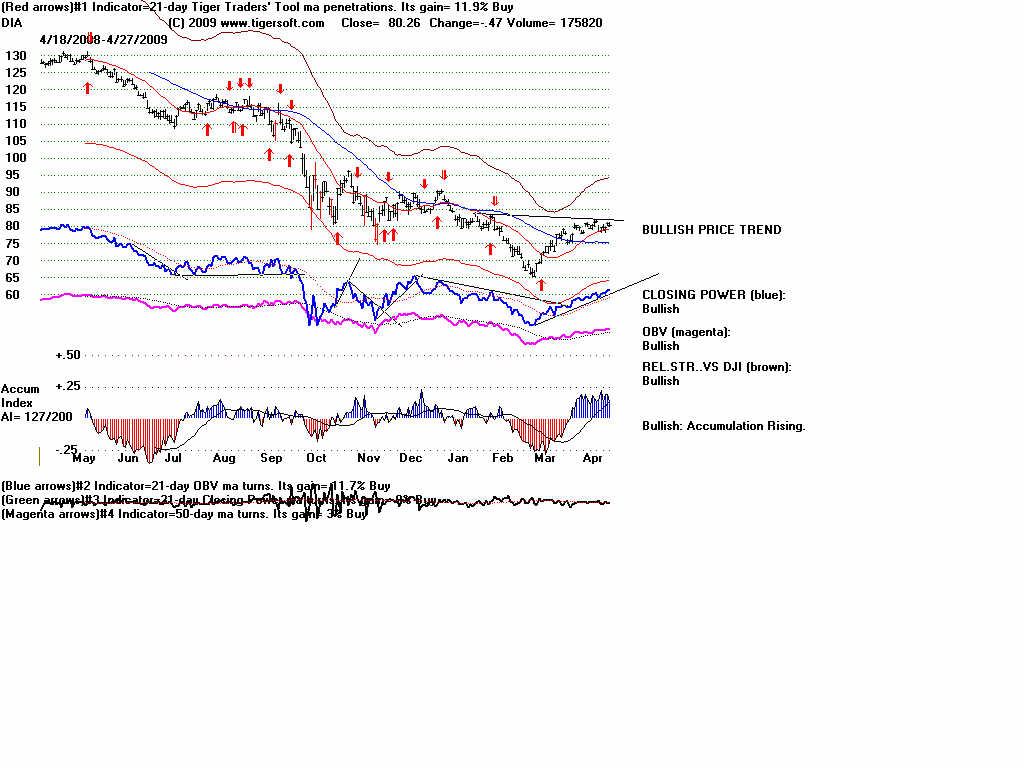
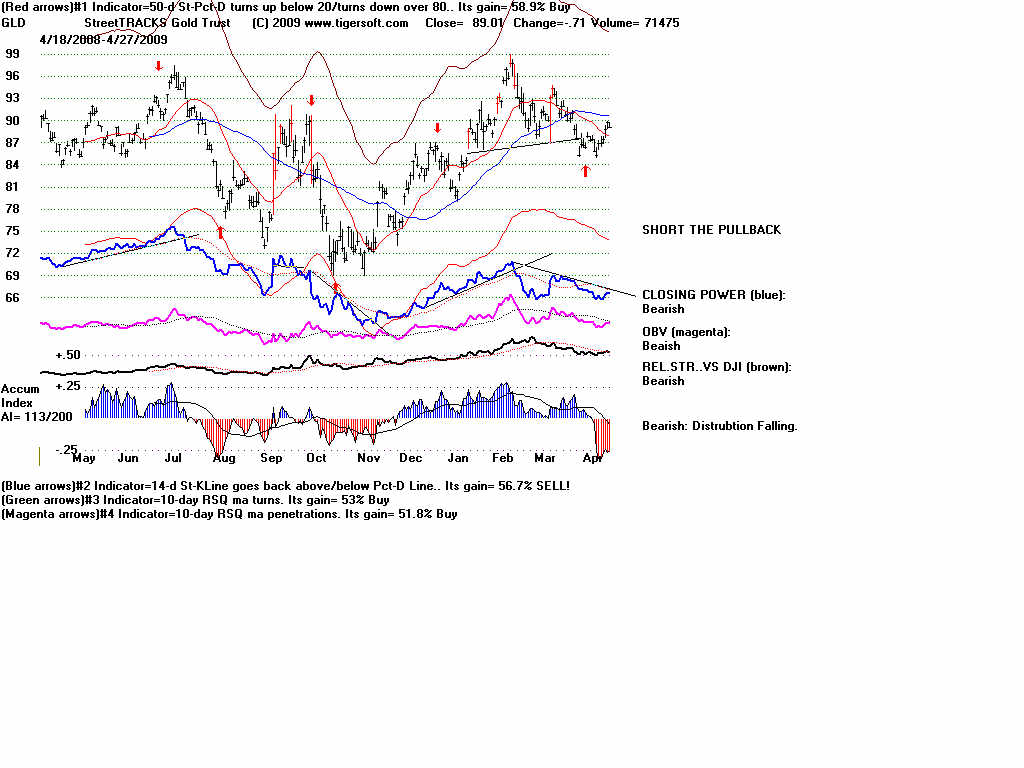
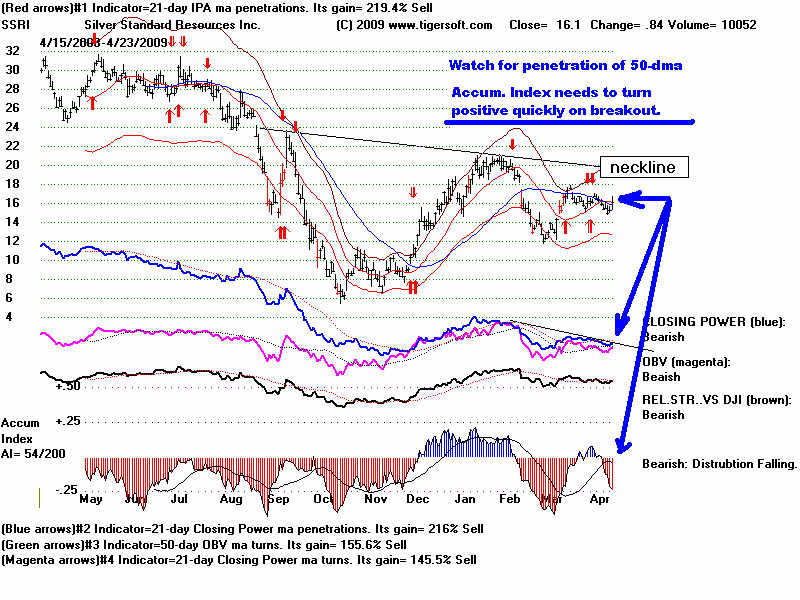
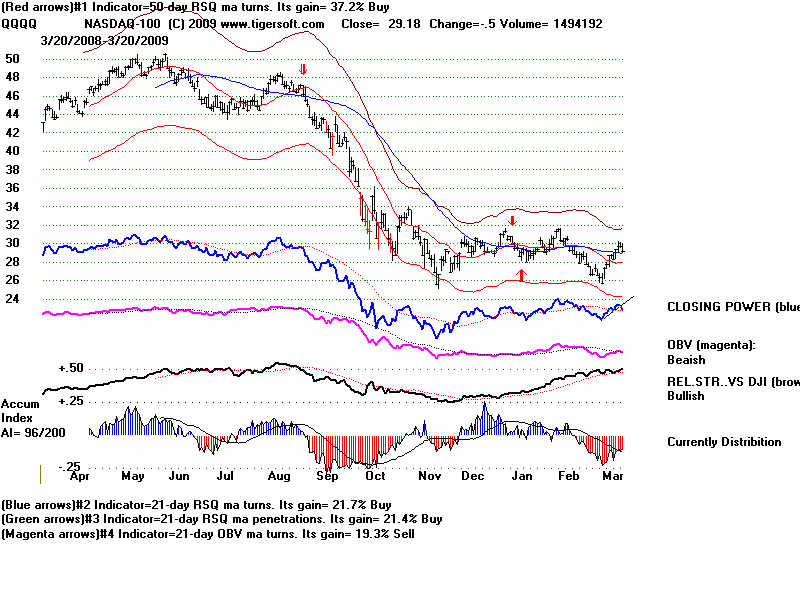
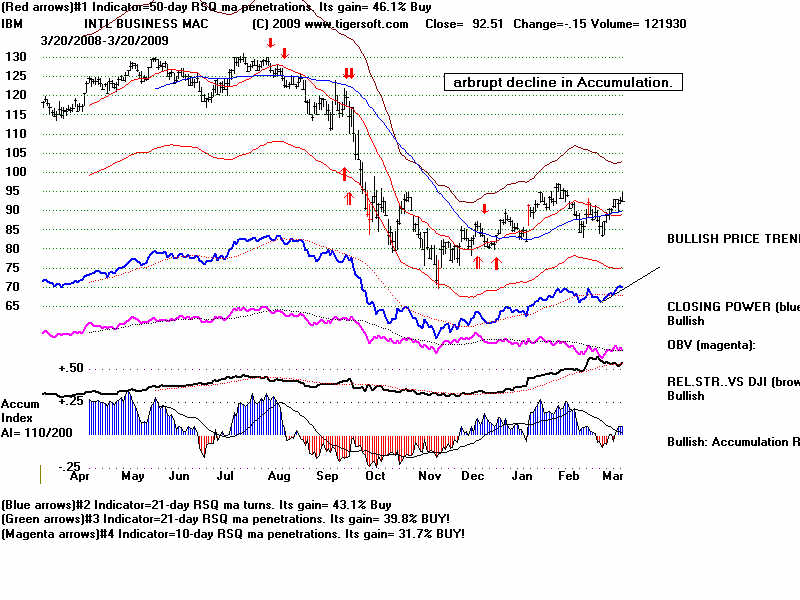
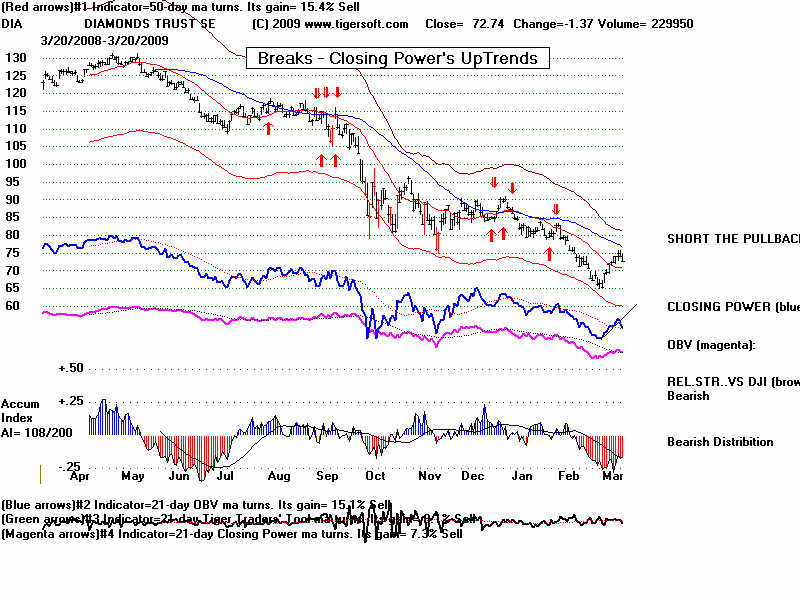
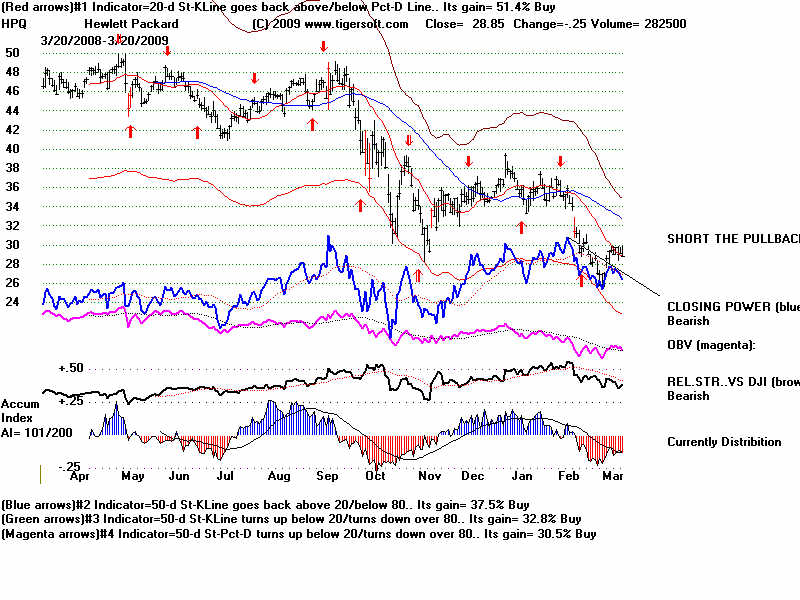
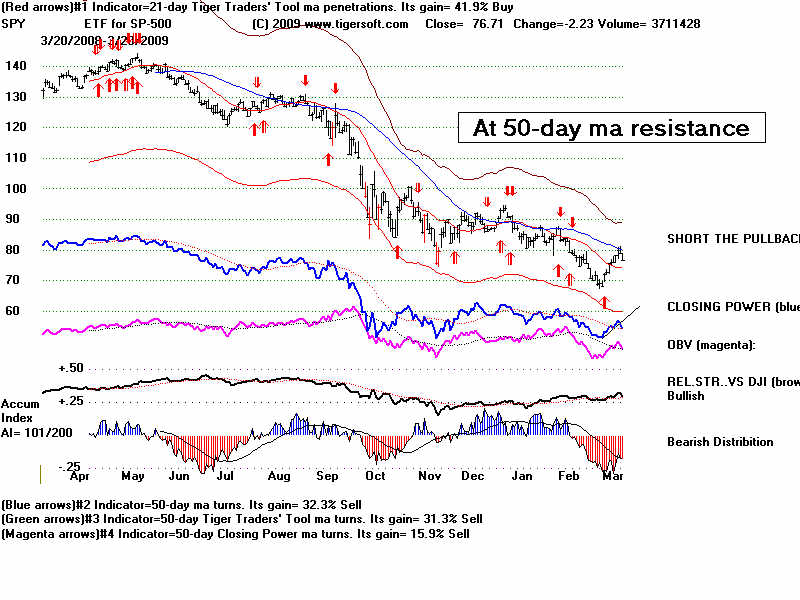
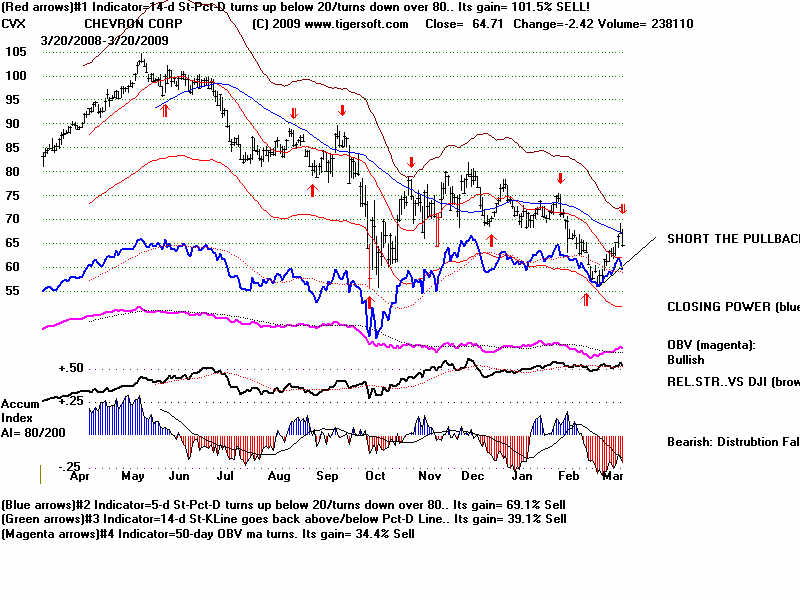
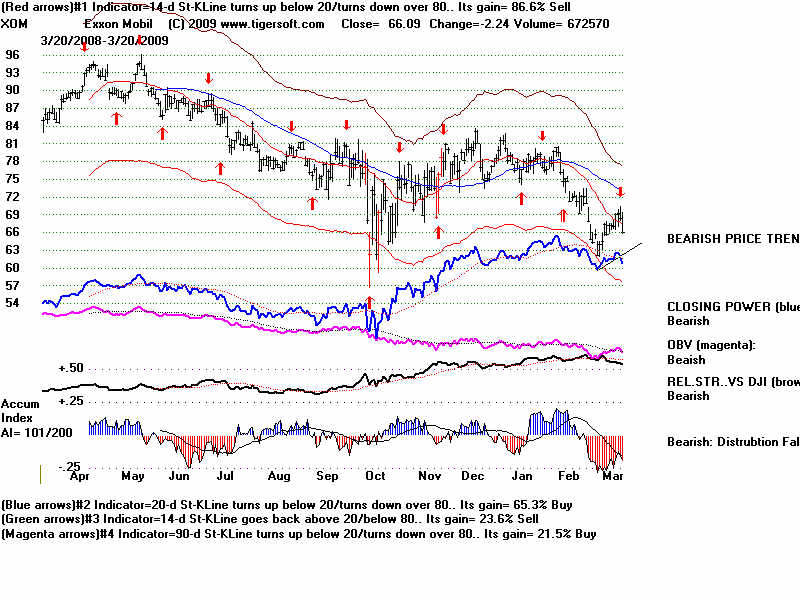
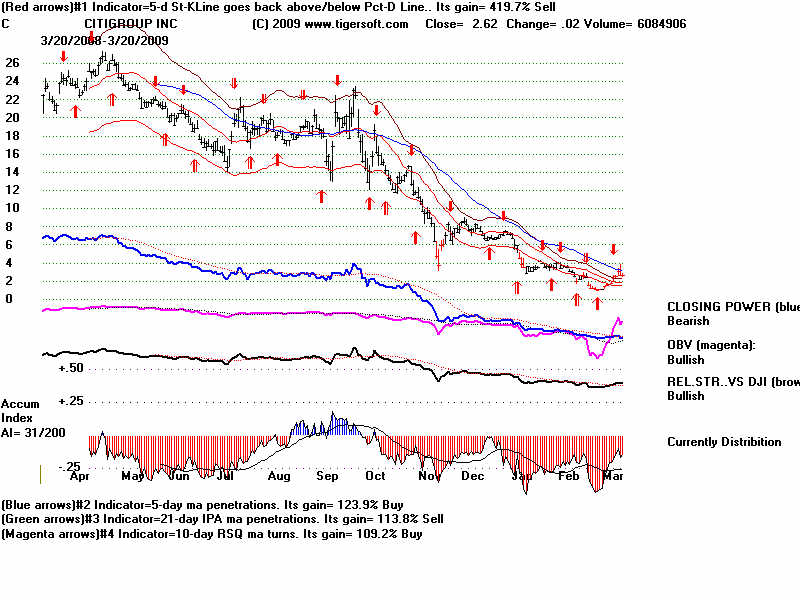
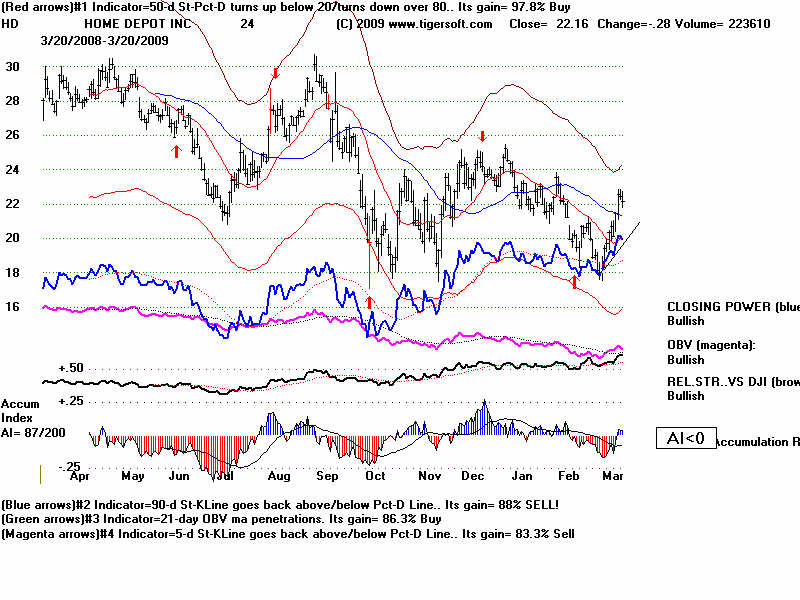
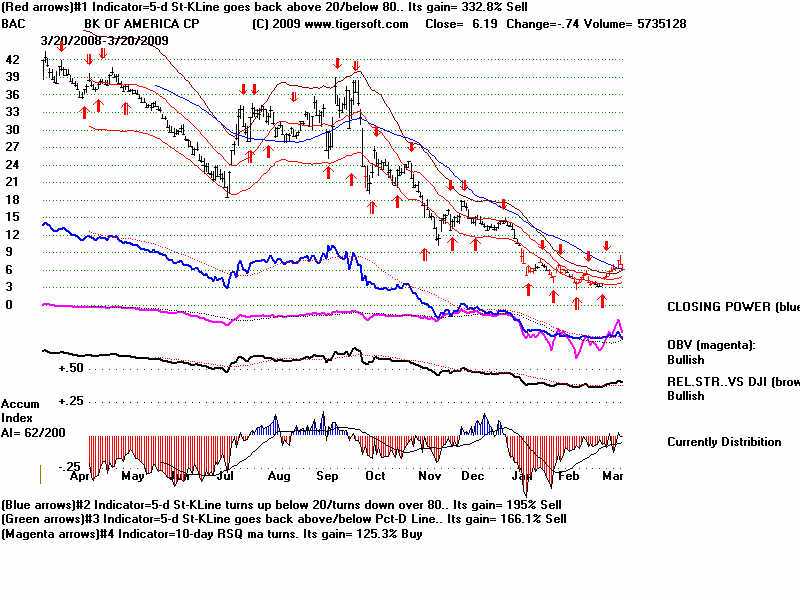
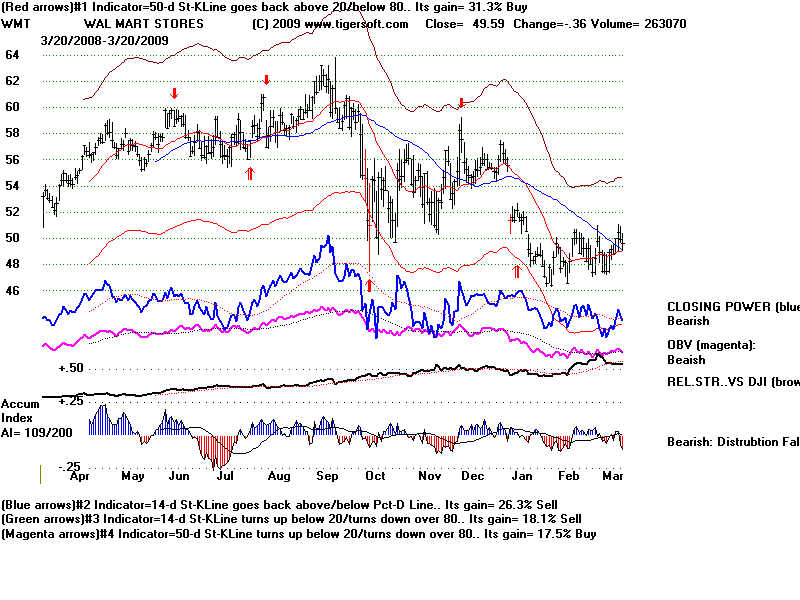
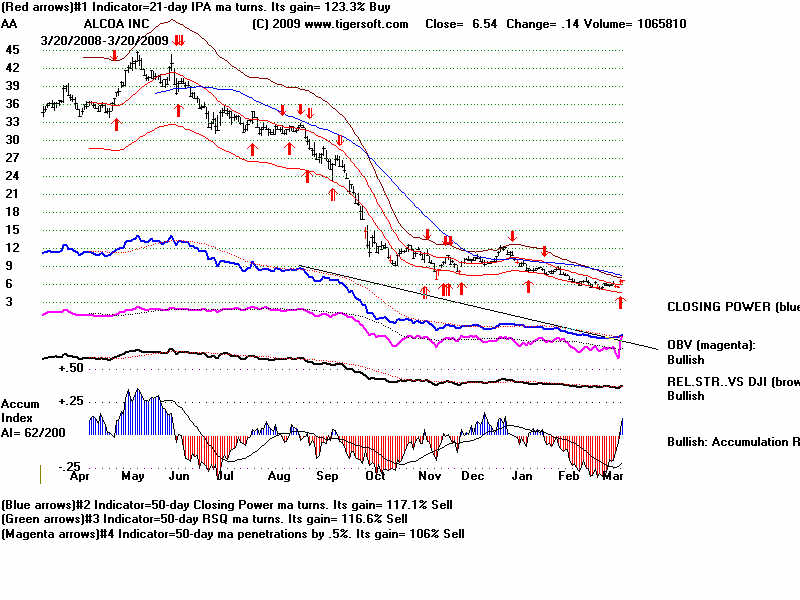
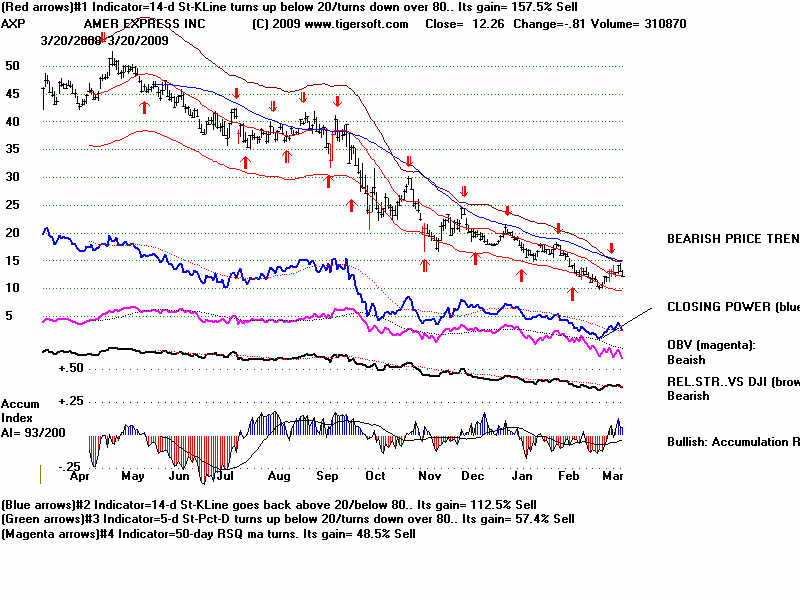
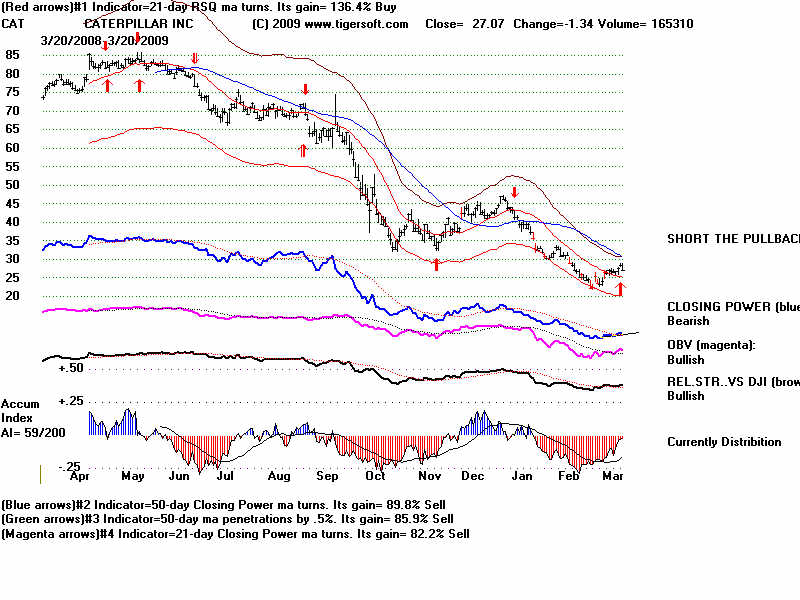
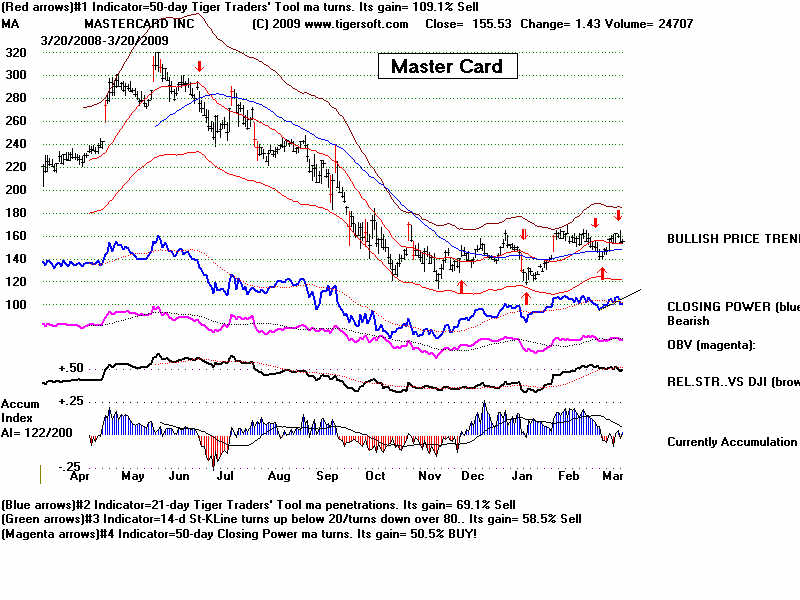
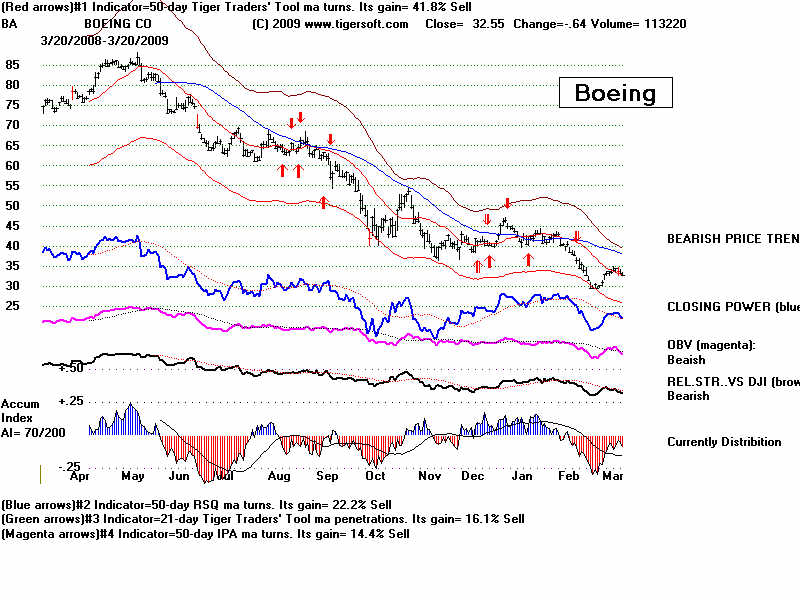
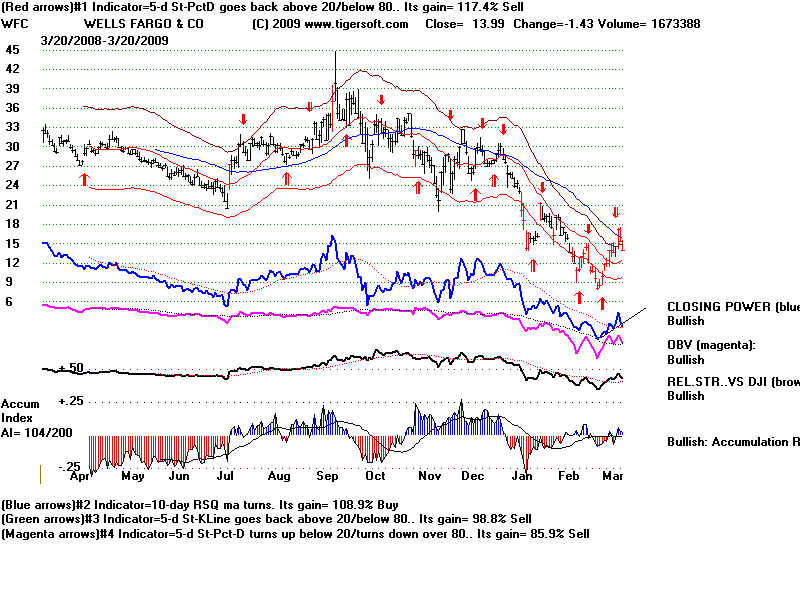
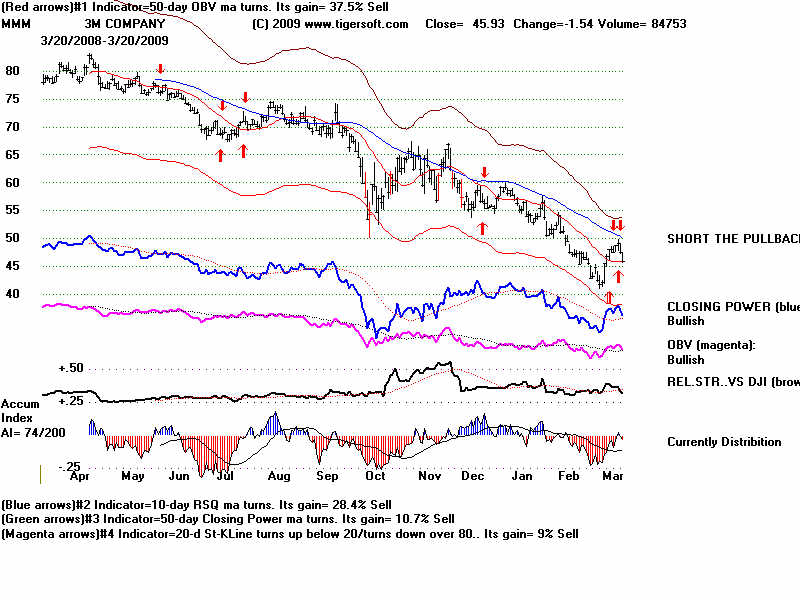
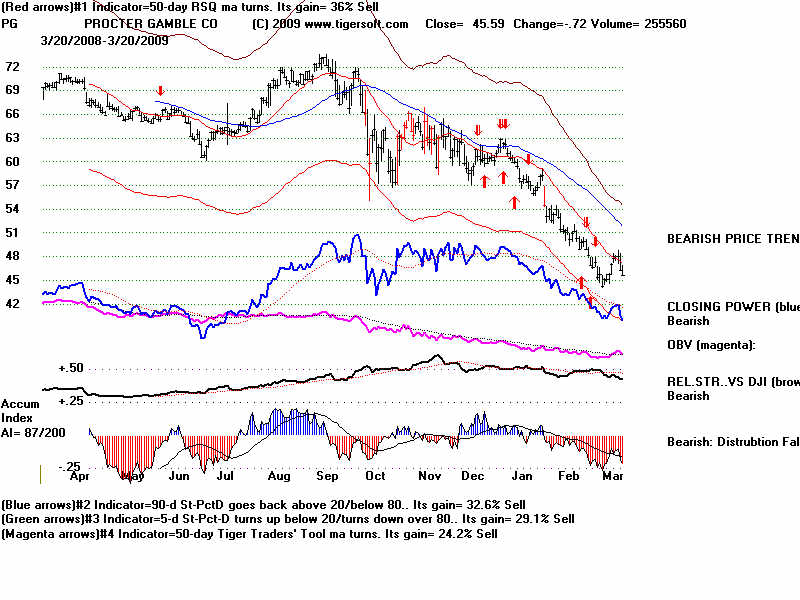
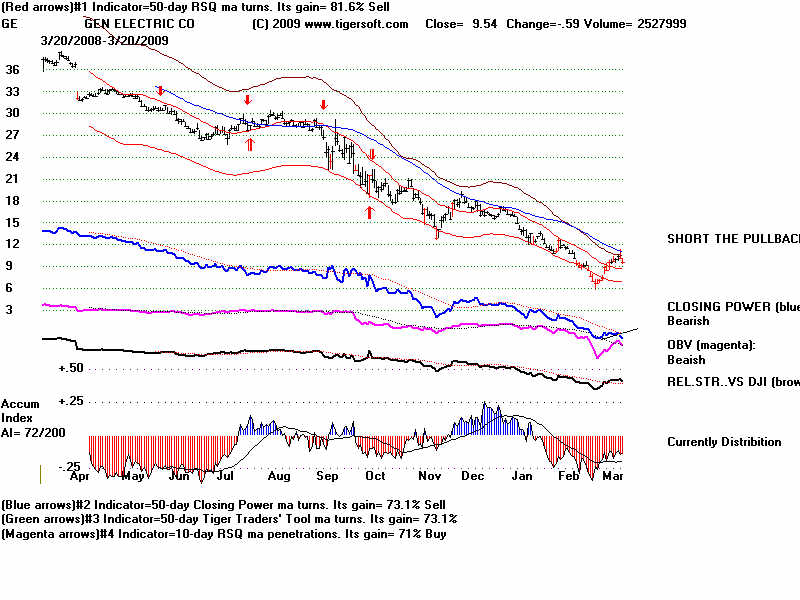
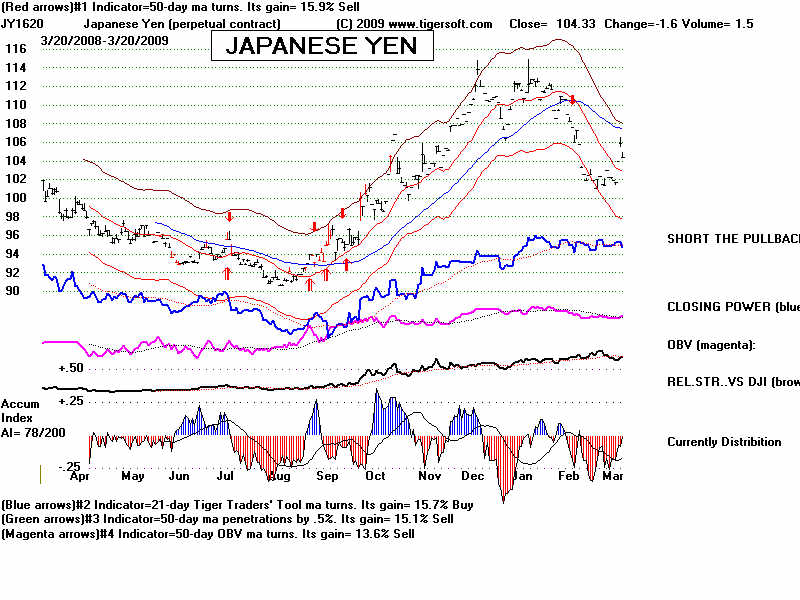
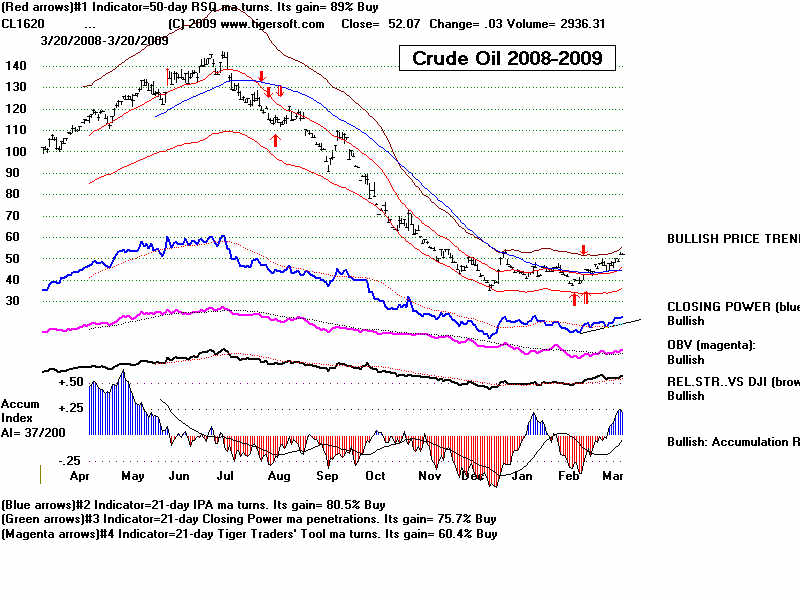
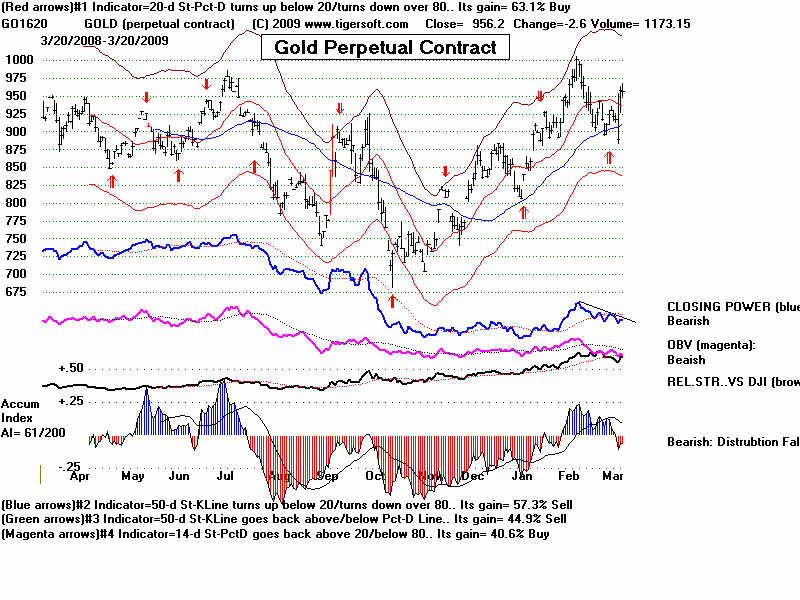
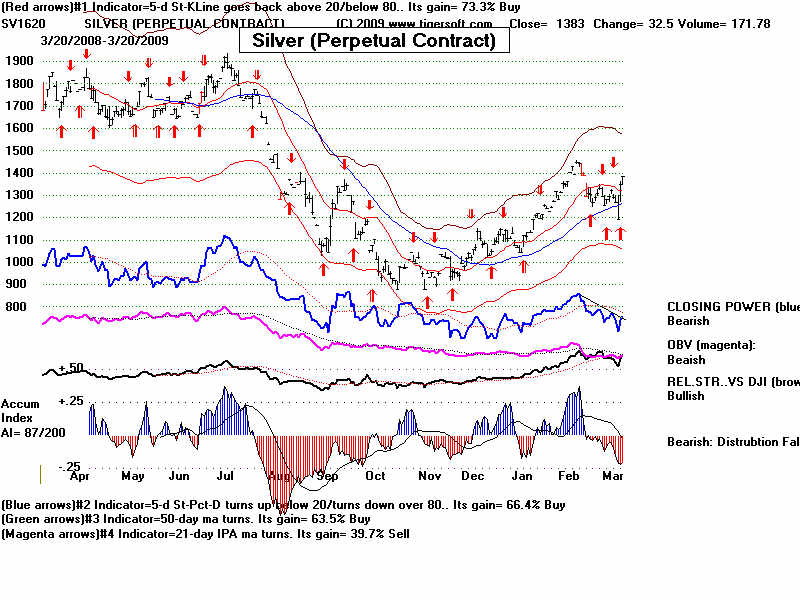
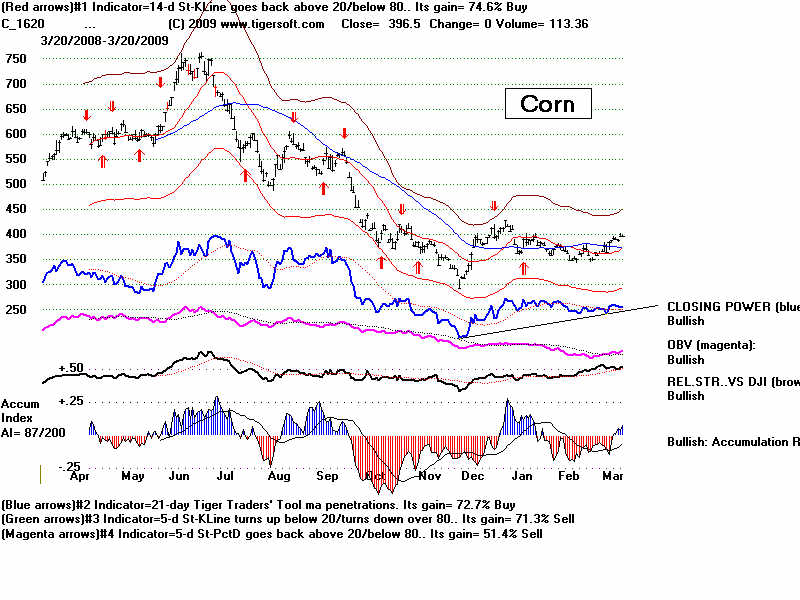
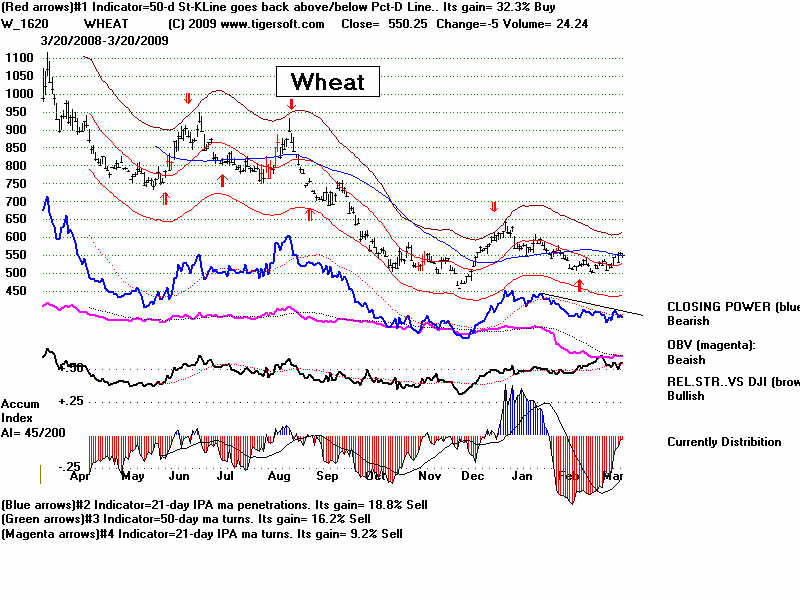
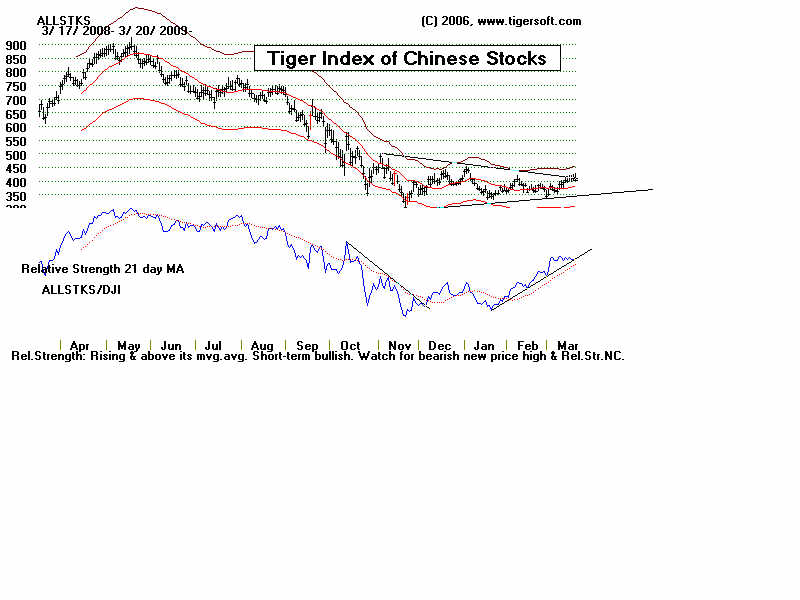
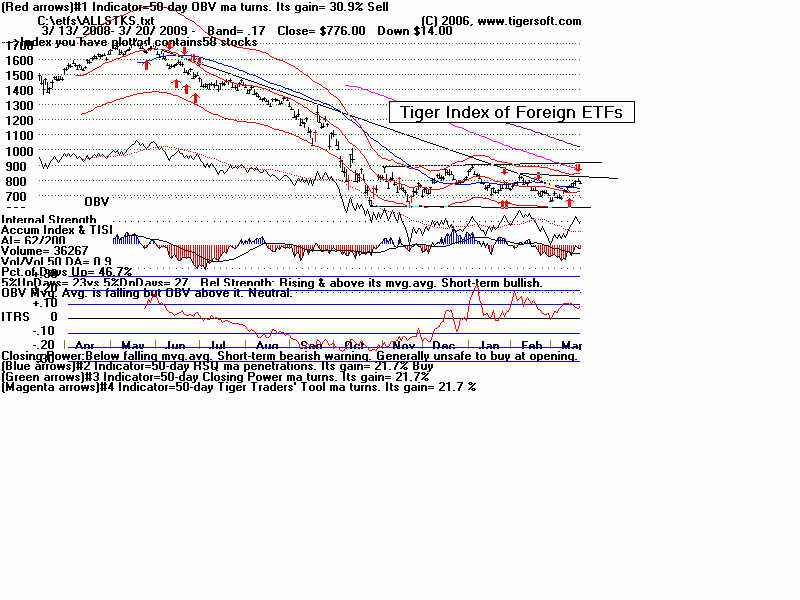
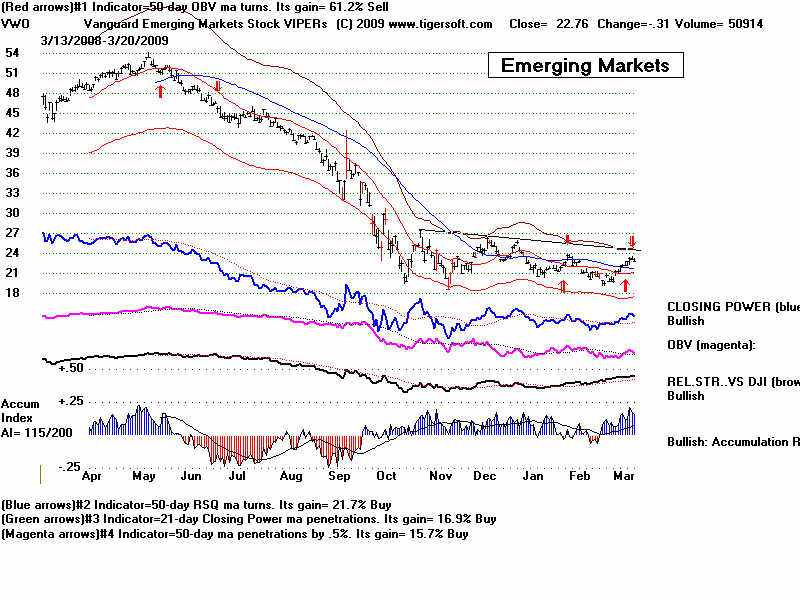
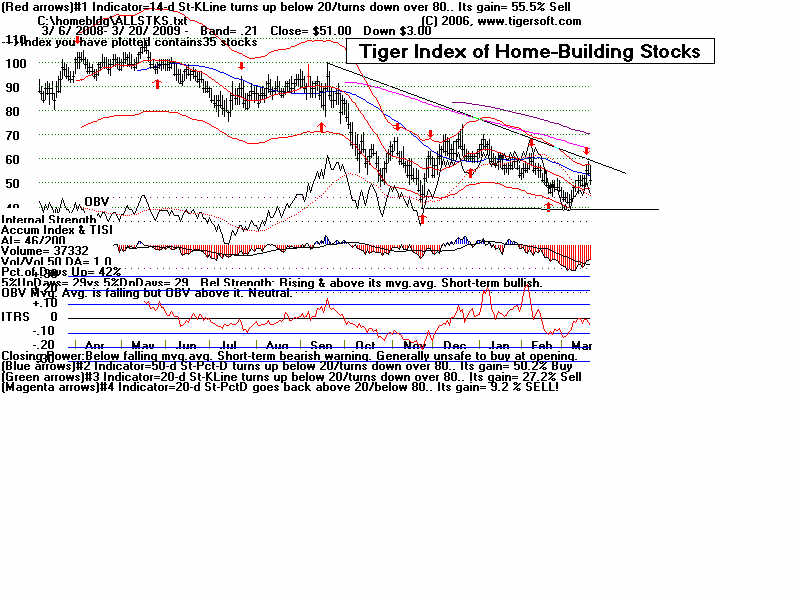
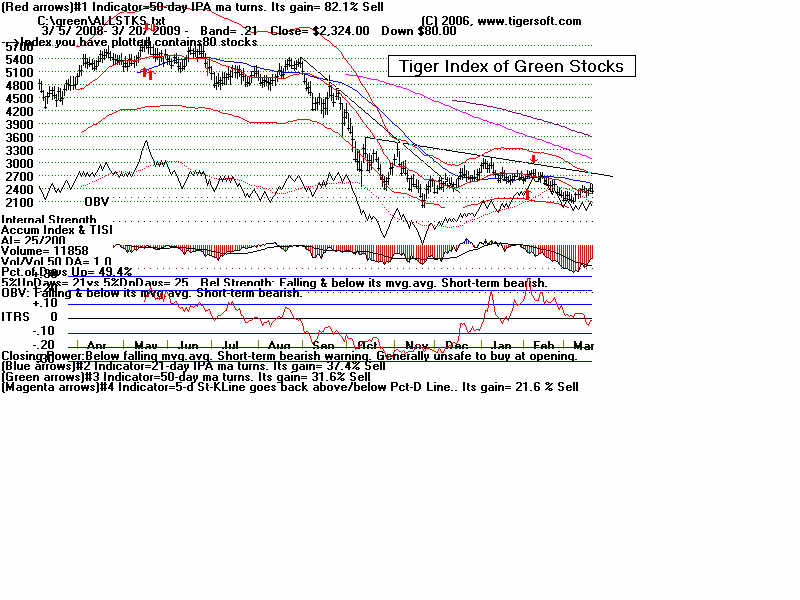
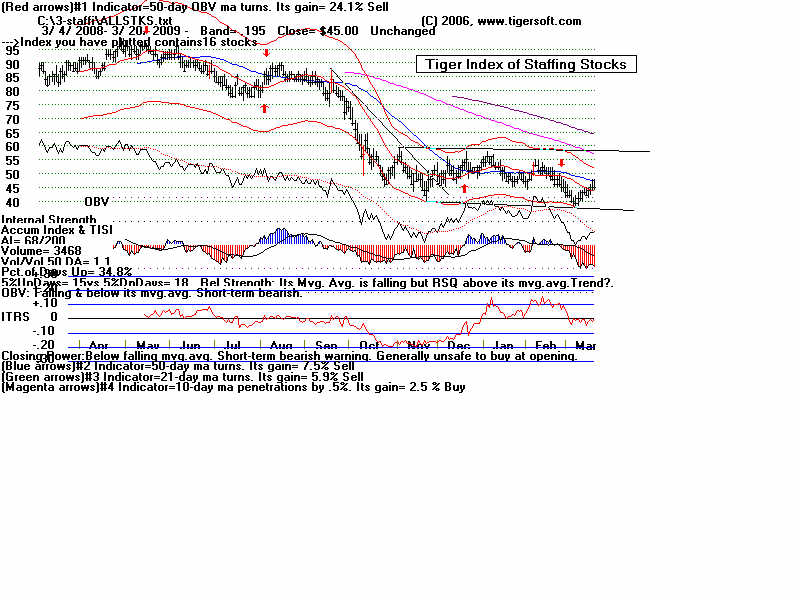
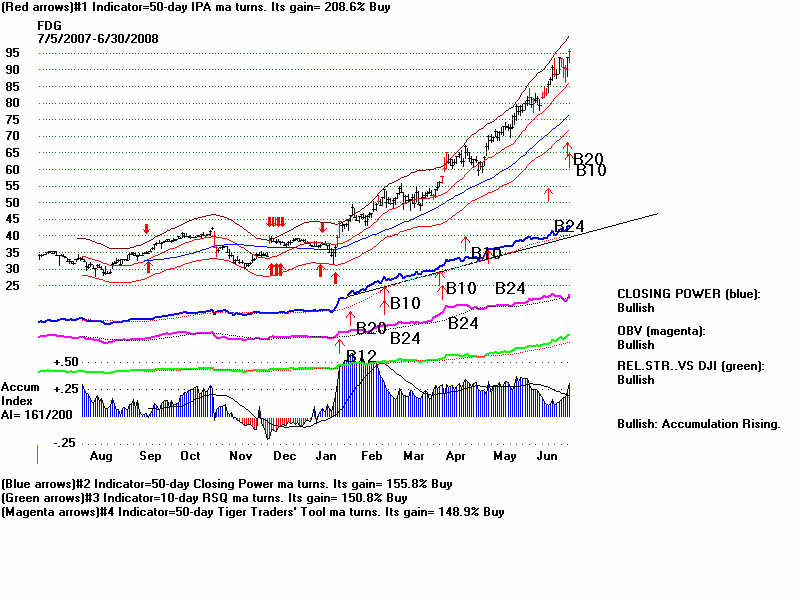
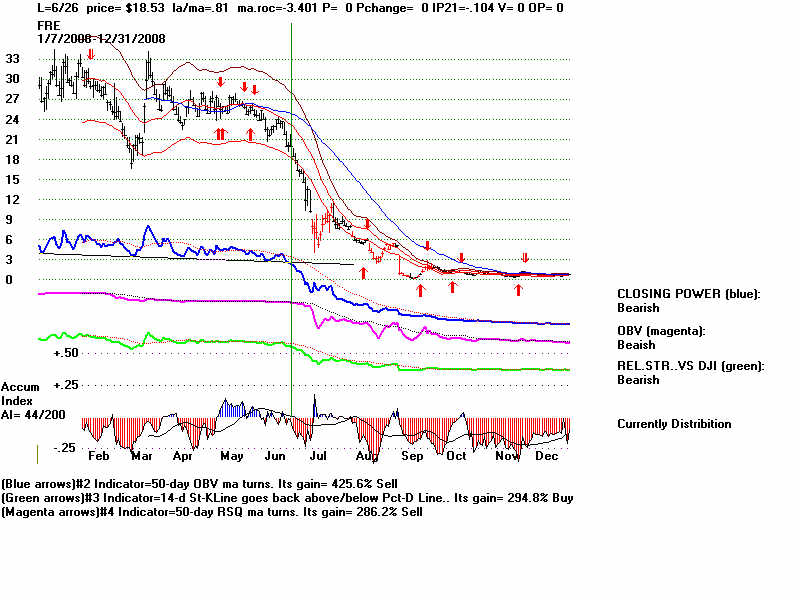
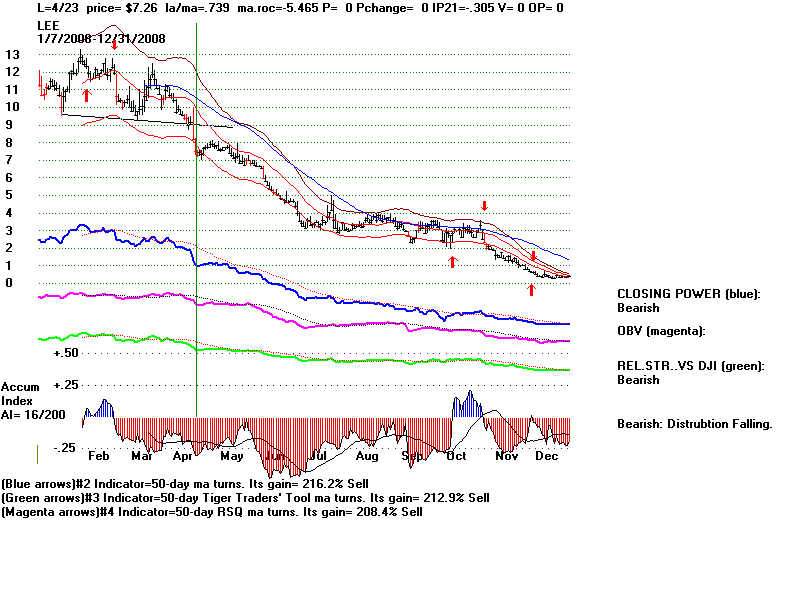
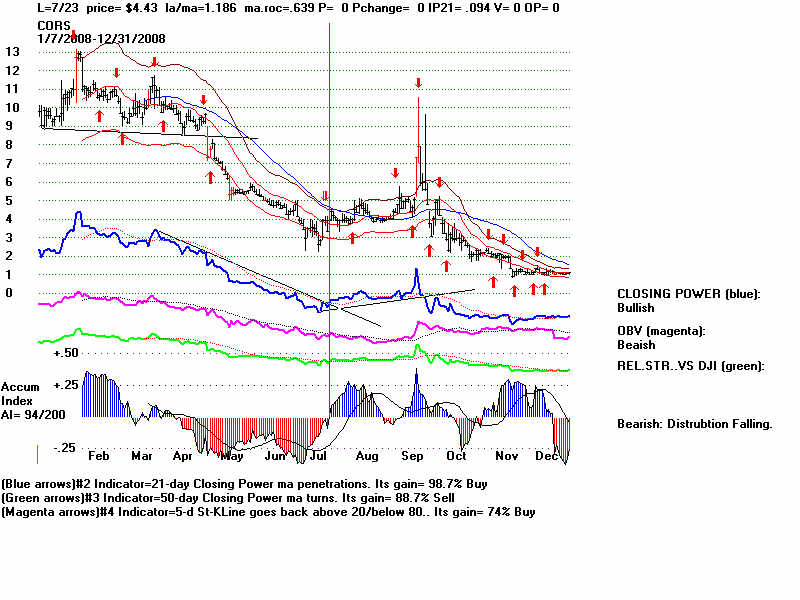
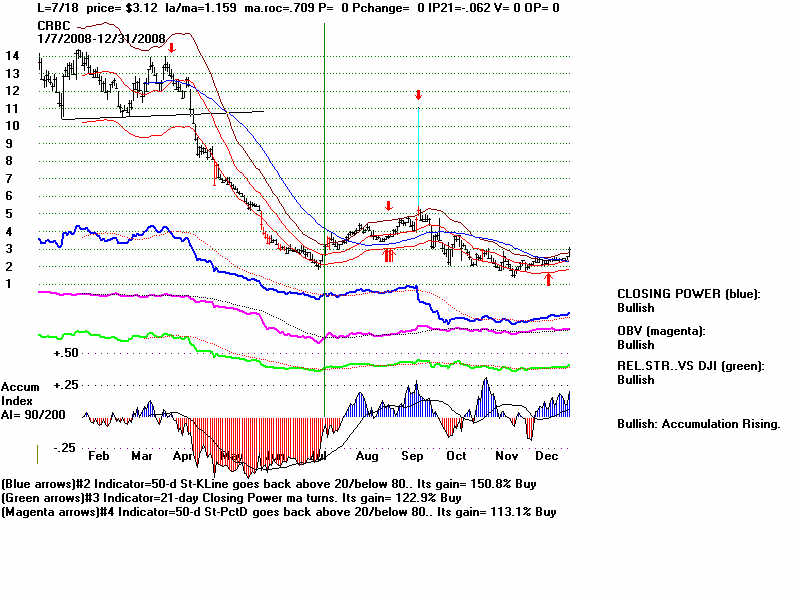
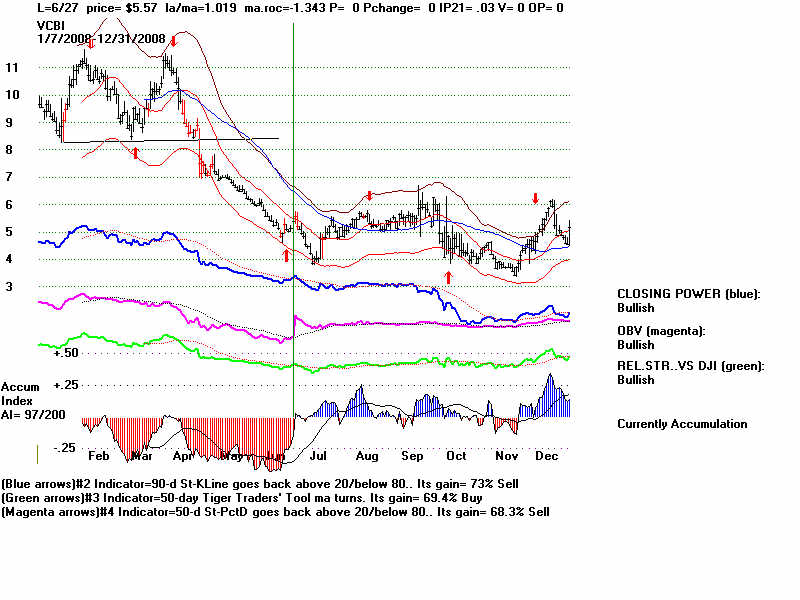
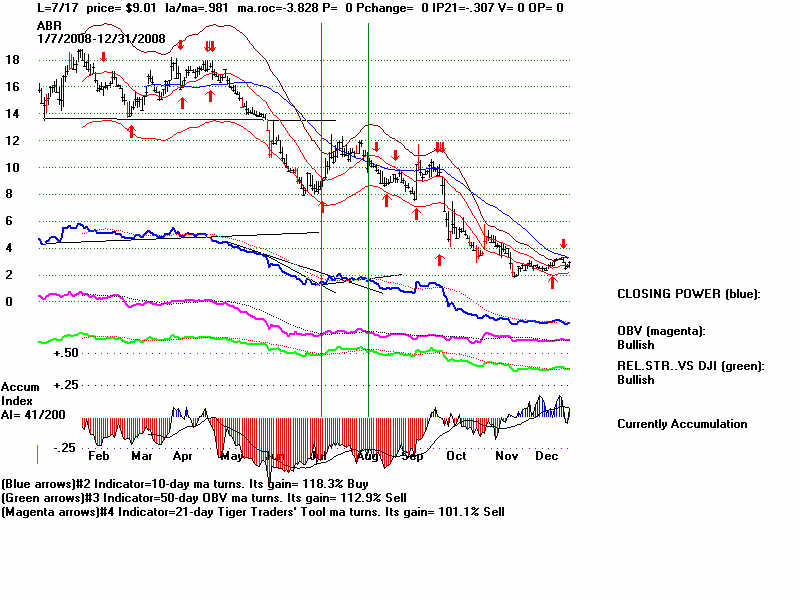
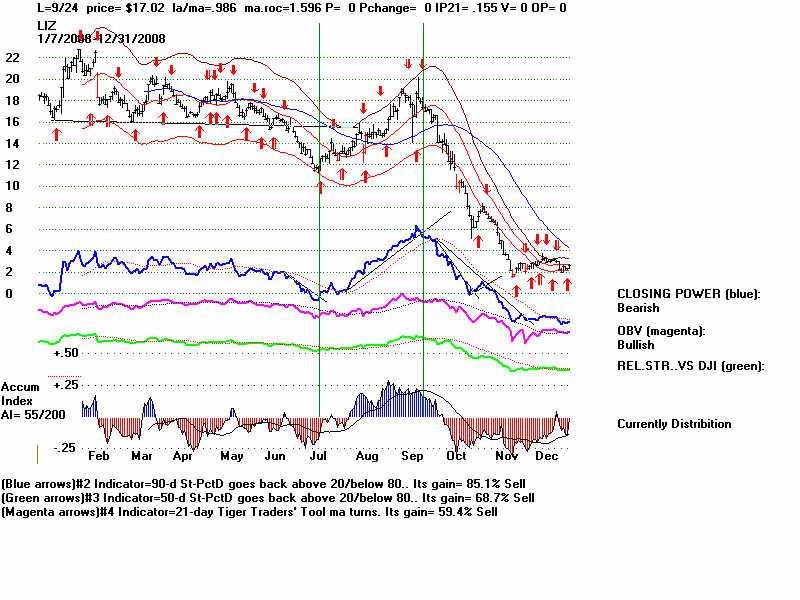
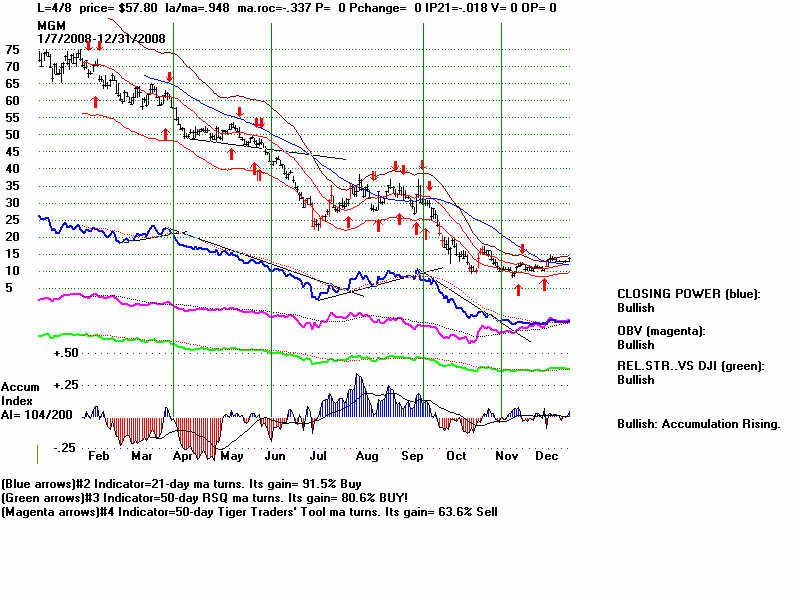
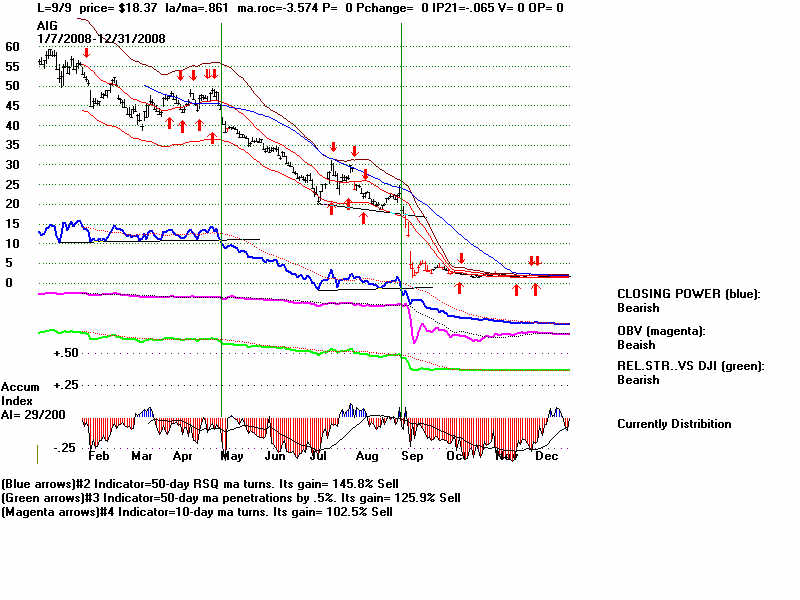
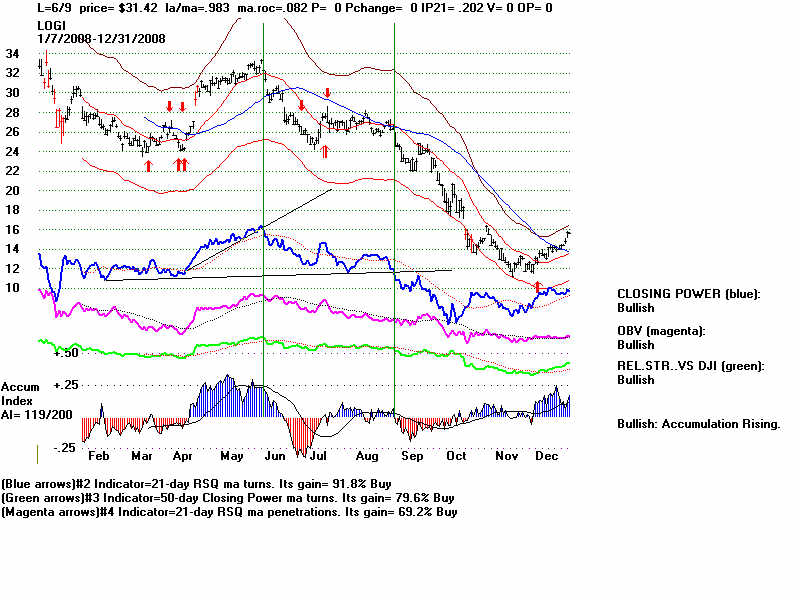
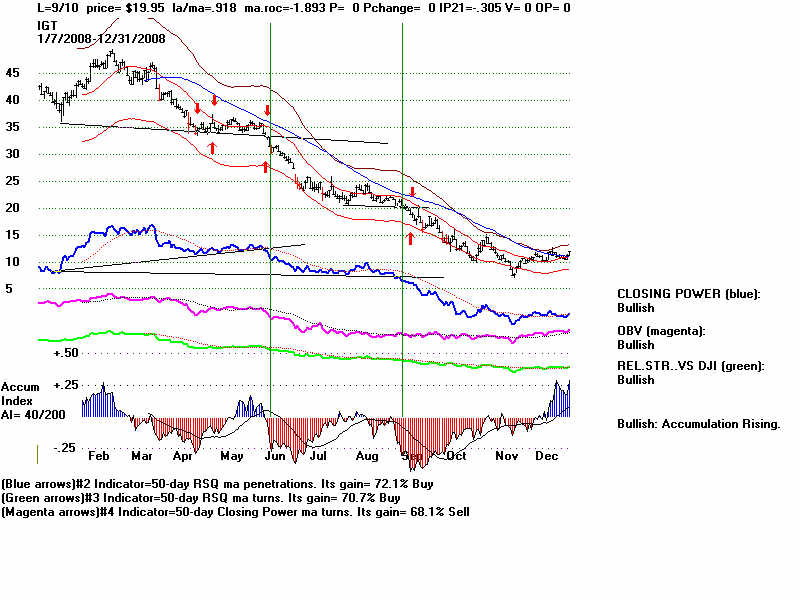
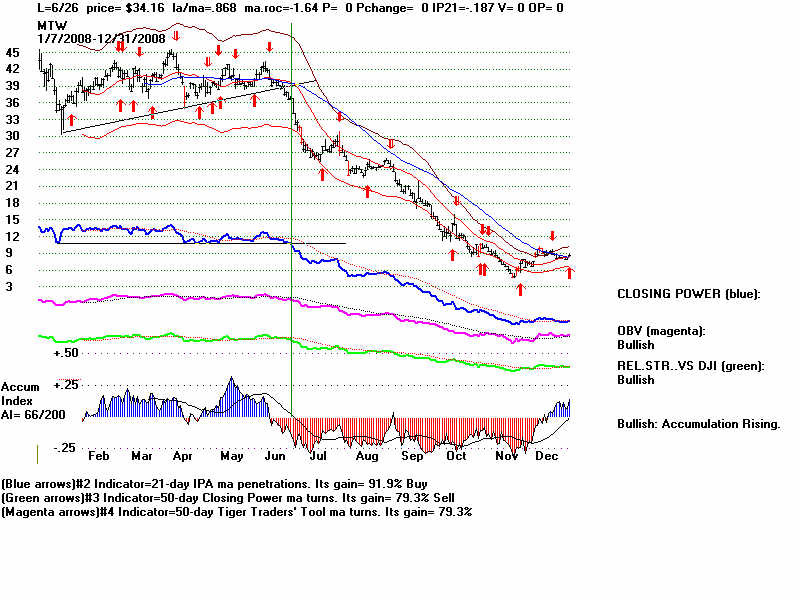
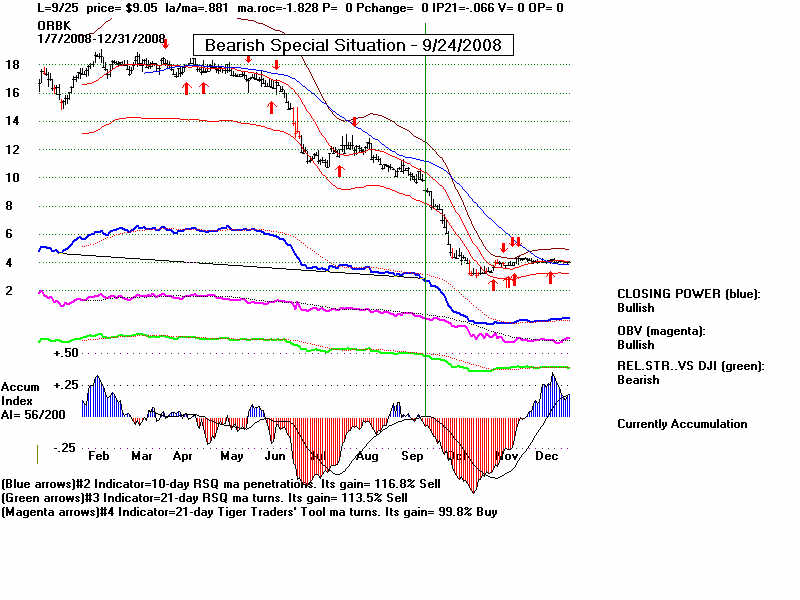