 TigerSoft and Peerless Daily Hotline
Important Notice:
1/14/2010 - Our Hotline Address Changes This Sunday.
To Renew for $298/year - click here.
Current subscribers will get new address by Saturday evng.
Tonight's Summary:
Still on A Peerless Buy. Closing Power and A/D Uptrends Continue
Wall Street is on its "best behavior" after 2008.
Watch Breakouts' Levels of Current Accumulation (IP21)
and watch for False Breakouts. Enough false breakouts
will bring a retreat. This does not appear the case now.
Next Hotline will be Sunday Evening.
Daily NYSE 186 New Highs - NYSE 1 New Lows
Daily NASDAQ 88 new highs - NASDAQ 1 new lows.
 Next San Diego Tiger User Group
Meeting is first Saturday of February
Next San Diego Tiger User Group
Meeting is first Saturday of February ---------------------------------------------------------------------------------------------------------------
1/14/2010 Peerless Book Purchasers - More Updated Materials
1915-1930 Charts/Analysis, List of All Signals: 1929-2010, Buy B13 Santa Claus Rally,
Extreme Bearish Mode Signals, Extreme Bearish Mode Buy B8... Go to link sent.
More is on the way!
Previous Hotlines:
8/30/2009-10/20/2009
7/31/2009-8/28/2009
7/1/2009-7/31/2009
6/14/2009-6/30/2009
5/1/2009 - 6/11/2009
3/30/2009-4/30/2009
(C) 2009, 2010 William Schmidt, Ph.D.
===> Order form to Renew On-Line, "Nightly Peerless/TigerSoft Hotline " ($298)

Important Notice: Redistribution of any text or concepts here is a violation of copyright laws. This is valuable intellectual property.
All violators will be subject to legal action. Please visit www.tigersoft.com Goggle TigerSoft and a technical subject, to get
additional examples and a further discussion of concepts and terms used here. See also our Books for sale. .
Overnight Market Action: Bloomberg Futures around the world before the US Markets open.
24-hour Spot Chart - Gold 24-hour Spot Chart - Silver Dollar and Currencies
5-day Chart of DJI - 1/14/2010
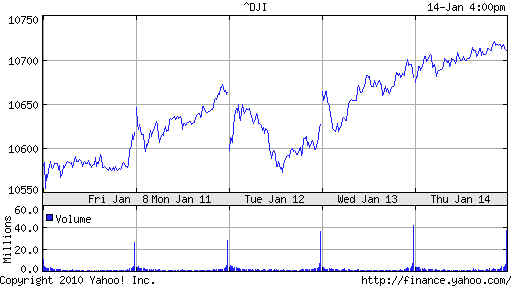
1/14/2010
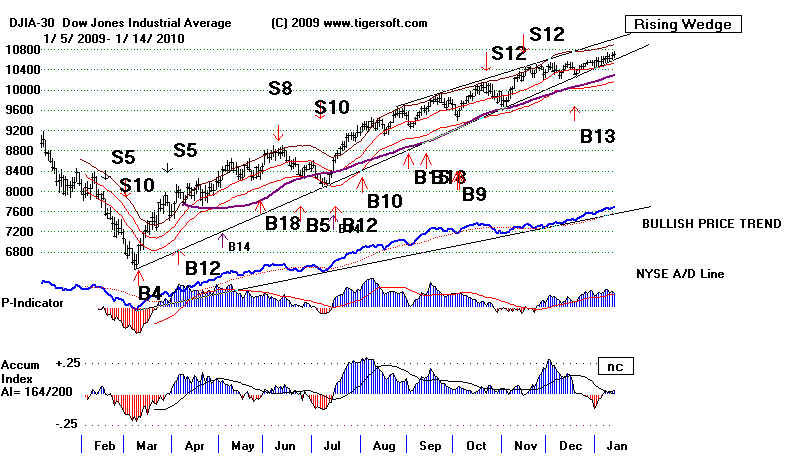
--------- SUPERIMPOSED PEERLESS SIGNALS ON DJIA ---------
1/14/2010 10710.55 la/ma= 1.017
21dma-roc = .237 P= 409 Pch= -50 IP21= .03 V= 12 OPct = .294
DJI is moving steadily up past the 10660 resistance 10200 is support. A/D Line is very strong.
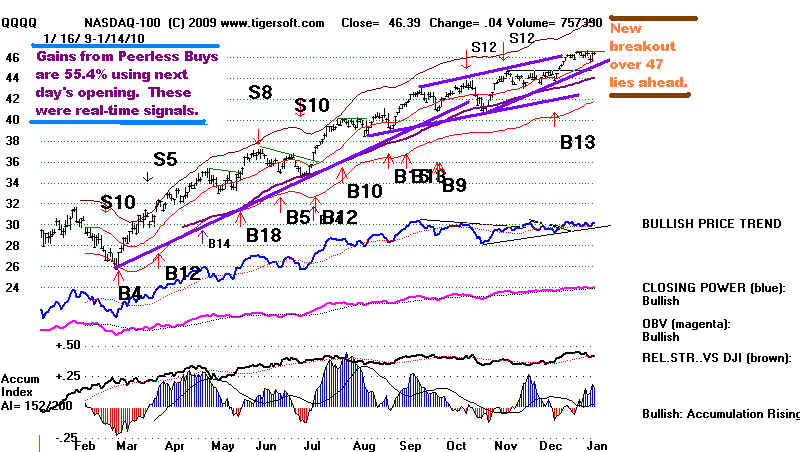
QQQQ may make another flat-topped breakout.
Its Closing Power uptrend is UP. The Accumulation Index is bullishky rising.
---------------------------------------------- HOTLINES -----------------------------------------------------------
Important Notice: Redistribution of any text or concepts here is a violation of copyright laws. This is valuable intellectual property.
All violators will be subject to legal action. Please visit www.tigersoft.com Goggle TigerSoft and a technical subject, to get
additional examples and a further discussion of concepts and terms used here. See also our Books for sale. .
Overnight Market Action: Bloomberg Futures around the world before the US Markets open.
Color Codes blue or green = new to this night's report or considered more important
black = from a previous night's report
Introduction. When reading this HOTLINE, please note the dates that show when the comments in a paragraph or set
materials were written. Always read the first comments at the top with the most recent date. They show the Buy or Sell
which now applies. Older comments are there entirely for background and to teach TigerSoft and Peerless technical analysis.
On a Peerless graph, only the new and latest signal applies. Again, always note the date at the top of a set of paragraphs.
INTRODUCTION.
Readers, our assessment of the stock market's future trends is based on the following.
Google TigerSoft and these subjects to get additional links, besides those shown below.
1) Peerless automatic Buys and Sells for intermediate-term trend.
Details of Peerless Signals are given here as they occur.
2) Price charts and moving averages.
3) Closing Power and Closing Power Percent for 2-4 week trends.
4) Accumulation Index to measure support on weakness or distribution on strength.
5) Volume (and OBV to a small extent).
6) Breadth: Advances minus Declines. P-Indicator, A/D Line
Tiger Charts produce this for groups of user specified stocks.
7) Stochastics when they are the best trading system. See QQQQ in 2003.
8) Relative Strength - QQQQ/DJI rising is bullish. Compare QQQQ Chart now, on this page, with 2003..
9) CURRENT Seasonality Example 9/1/2009
10.) CURRENT Sector Strength/Weakness Analysis. Example 9/1
11) CURRENT NASDAQ New Highs/New Lows. Interesting NH/NL Stocks. Example `10/15
12) News and Political Economy. See Tiger Blog
See also Predicting The QQQQ Using TigerSoft's Opening Power,
Closing Power and Tiger's Day Traders' Tool: 1999-2008
=========================================================================================
1/14/2009 Hotline
Study The New Highs/Lows
Peerless is still on a Buy. The Accumulation Index for the
DJI could be higher. But breadth remains superb. The A/D Line
is in a powerful and steady uptrend. The ratio of new highs to
new lows is very positive. The DJI is lagging the more speculative
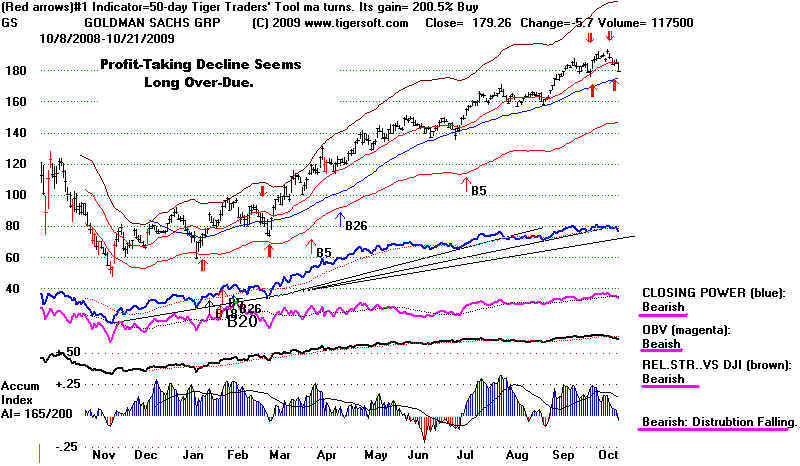
indexes. The key ETFs' Closing Power are rising. Wall Street
is on its "best behavior" after its misconduct and fraud (which
Goldman denies) in 2008.
In the news Treasury Secretary defends the 100% payout to
Goldman and other big banks by the taxpayer when AIG went
bankrupt and its debts were repaid. If he is so proud of the
billions he allowed the big banks be paid by the taxpayer,
then why did his NY Fed office try to cover this up in 2008
and 2009? Stay tuned. Geithner is not going to make it, I
predict. That will hurt Wall Street big banks and possibly
the stock market. Wall Street's special influence in the
Obama Administration will be disclosed if Geithner is challenged.
Let's see if the Republicans can step up to the plate now.
In the 1970s, before I wrote Peerless, I was much influenced
by Nicolas Darvas' system for playing new highs. See the Blog
I wrote in 2007. In particular, I would watch the ratio of NYSE
new highs to new lows. As long as the 10-day ma ratio was 4:1,
the market was safe enough to keep buying breakouts. I
watched the market mainly with weekend charts I subscribed to.
What I noticed was that before a big decline would start, there
would be a number of false flat-topped breakouts. That is
still something to look for. But now, I would look for the key signs
that a breakout is apt to be false. In particular, I count the number
of breakouts that occur with the current Accumulation Index
(termed "IP21" here, after the original name of the Accum. Index)
that are in negative territory.
First, I go to http://dynamic.nasdaq.com/asp/52weekshilow.asp?exchange=NYSE&status=HI
Second, I either download these stocks or build a directory of
just these stocks using the BUILDER.exe program on out data
page.
Third, I run the older TigerSoft program (dated 7/27/2006) and
rank these new highs for Current Accumulation (IP21) using
Ranking Results + User Set Ranking... + 21 + OK + 3 + OK
The seventh column displays the stocks by IP21.
(You can also use our spread sheet program after
running the Analysis. From Peercomm. just click View at the top,
then Tiger Spread Sheet and then click the heading for "IP21".
This ranks the data by IP21. )
Here I compare the number of stocks with a current Accum.
Index (IP21) value greater than +.25 (considered healthy)
with the IP21 number under zero (bearish). Thursday night |
the ratio was 75 to 14. That seems healthy. What we do not
want to see are stocks starting to look like MED.
MED - False Breakout Picked Up on by IP21 NNC
(Accum. Index - Negative NC on new high near upper band.)

It should be empasized that a negative non-confirmation (NNC)
of a new high by the Accumulation Index, which is often
a Tiger S9, does not always bring a quick reversal and breakdown.
If the Accumulation has been steadily very positive, a brief
dip into negative territory may mean very little at the
time of the NNC and the stock may keep rising. But this
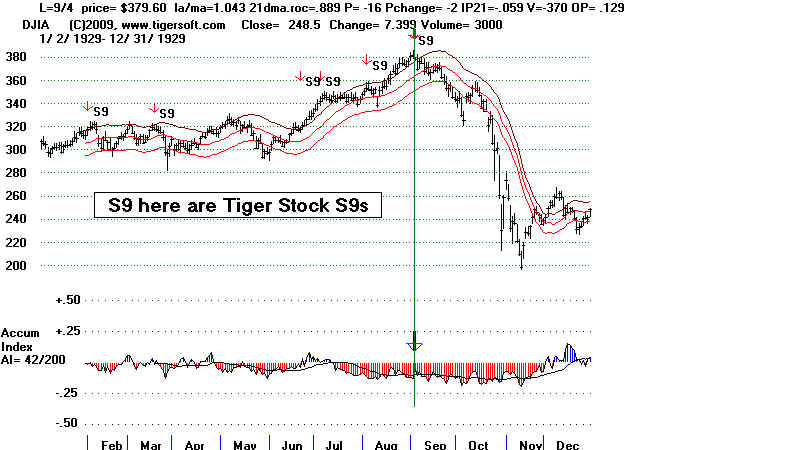
is a sign of dangerous speculation. See the chart of CTEL
below and then the DJI chart of 1929! (With Peerless
charts of the DJIA, such IP21 NNCs are called Sell S12s.
The Peerless DJIA Sell S9 is actually a NNC by the
P-Indicator. See Peerless Sell S12 Sell S9 )
CTEL's SPECULATIVE ADVANCE FEATURES NNC oF NEW HIGH
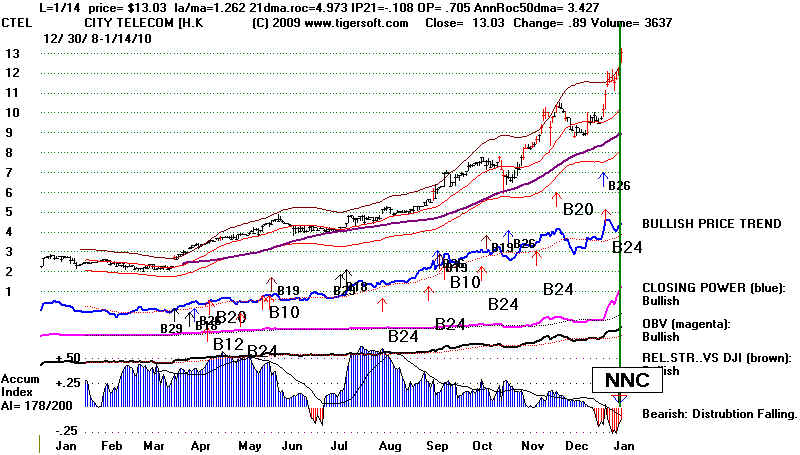
TigerSoft IP21 NNCs are bring S9s when the DJIA is
treated like a stock. (If this is confusing, just know that
both types of NNCs (AI and P-Indicator) are bearish.
And they are doubly so, when both indicators are negative
as the DJI reaches the upper band.)
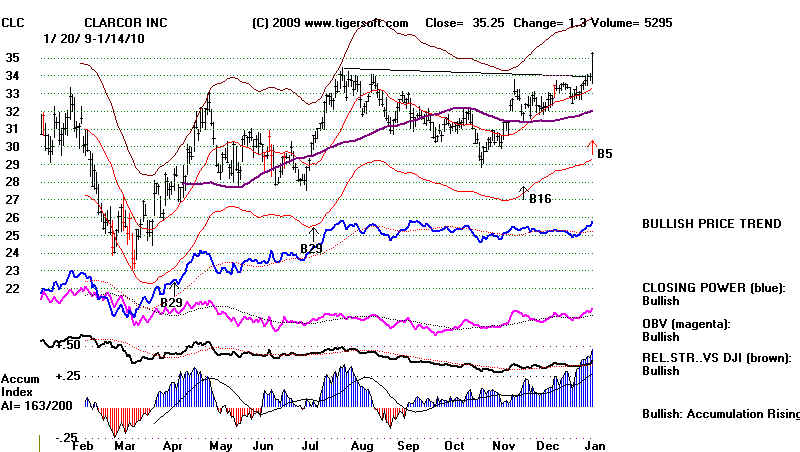
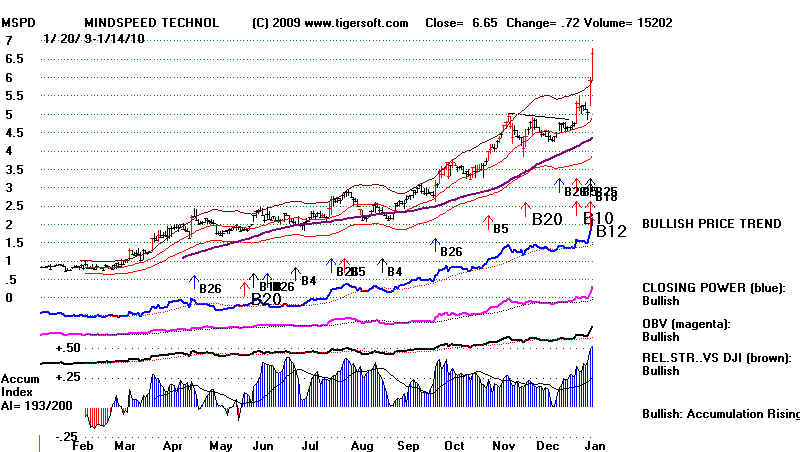
It should be also be said - and emphasized - I looking for
stock breaking above flat tops that show high Accumulation.
I take this to represent insider Buying. CLC (below) seems perfect,
until you ask the question: "Why has it taken the stock so
long to breakout?" We usually do better if we find these
such stocks soon after a fresh and reversing Peerless Buy.
as in our Stock's Hotline's MSPD.
.
=====================================================================================
1/13/2009
Peerless Remains on A Buy B13.
Sticking with The Peerless Signal Usually Pays Off.
Once again the DJI shook off news that might have sunk a technically vulnerable
market. The creme of Wall Street's elite bankers had their integrity challenged
publicly by Congress and the immense biblical JOB-like tragedy of the Haitian
earthquake should and would normally shake our rosy confidence that man can always
prevail over natural calamities. I take these to be signs that the market wants to go higher.
What vehicle should users employ to take advantage of Peerless Buys and Sells.
The answer may be obtained with historical studies using the Peerless software's ability to
let the user super-impose the DJI based Peerless Buys and Sells signals on any chart
the user wishes. Using DIal Data I can get the data back to 1980 on any stock that is
still extant and trading now. (So, could users if they want to pay $40/month and would like
me to set them up with this capability).
To help us decide how best to use Peerless I gathered the data year by year since
1999 when the major ETFs, DIA, QQQQ and SPY, were established. I super-imposed the
DJI signals on the DIA, QQQQ and SPY for each year and let the computer calculate
the trading gains for each year from the first signal of the year. I think this shows that
the QQQQ is generally the best instrument to buy using the Peerless signals. AAPL has been
a great stock to trade using the signals. Its current chart is not so bullish looking now.
So, I post below some other QQQQ stocks that now look attractive.
Three sytematic approaches should be mentioned. One could reasonably search the NASDAQ-100
using Tiger's POWER-STOCK-RANKER software:
(1) Buy the highest Power Ranked DJI stock, now ISRG, but it has tripled since March
and shows weakening Accumulation; or
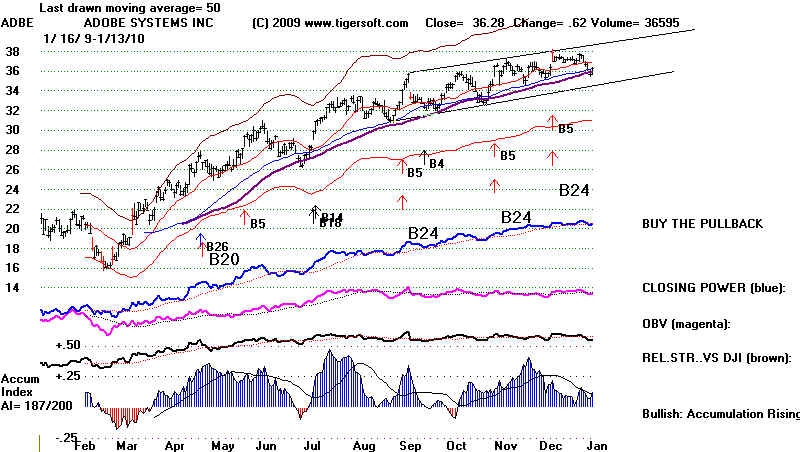
(2) Buy the highest Ai/200 stock, ADBE (see below); or
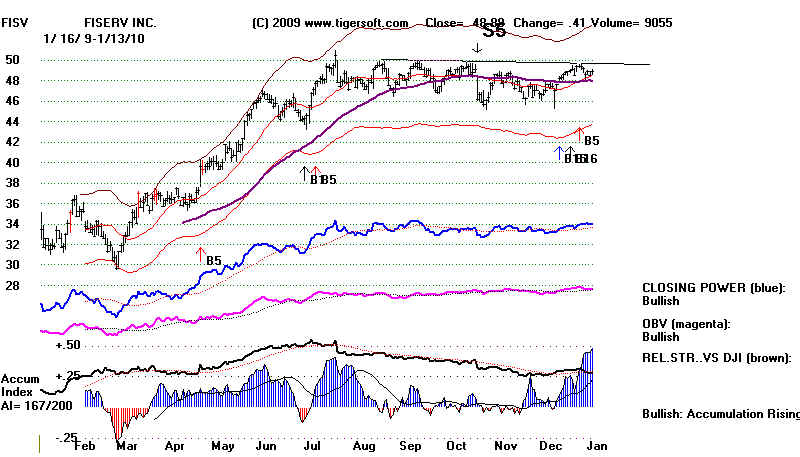
(3) Buy the highest current Accumulation Index stock with a rising CLosing Power, FISV.
As it turns out, FISV seems ready to score its own breakout past 50 and should be watched closely
for that. (See chart further below.)
|
Trading Results Using Peerless
Buys and Sells on DIA, QQQQ, SPY and AAPL: 1999-2009 June-Dec 1999 March-Dec 2000 Feb-Dec 2001 Feb-Dec 2002 DIA +10.8% +22.6% +5.6% +30.7% QQQQ +38.5% +11.5% +9.3% +9.3% Buy/Hold +77.5% -45.2% -15.6% -28.6% SPY +12.4% +22.4% +6.9% +6.3% AAPL +97.4% -20.1% +12.3% +1.2% ========================================================================= Mar-Dec 2003 Feb-Dec 2004 April-Dec 2005 Jan-Dec 2006 DIA +39.9% +11.4% +4.6% +24.6% QQQQ +54.5% +10.4% +13.5% +19.5% Buy/Hold +51.5% +14.2% +13.9% +1.7% SPY +37.5% +12.0% +7.2% +19.9% AAPL +57.0% +94.4% +94.7% +43.9% ========================================================================= Mar-Dec 2007 Mar-Dec 2008 Jan-Dec 2009
DIA +25.3% +10.0% +42.3%
QQQQ +33.0% +11.4% +61.7%
Buy/Hold +21.5% -30.9% +62.8%
SPY +20.9% +13.7% +51.8%
AAPL +114.5% +21.1% +136.6%
=========================================================================
ADBE (below) is at the support of its rising 50-dmay and 65-dma
and shows steady positive Accumulation.
|
 FISV (below) appears to be setting up for a powerful breakout past 50.
Its current Accumulation Index is the highest in the NASDAQ-100.
Its CLosing Power is rising and the flat resistance at a round number,
like 50, shows lazy, unskilled selling. Once there is a breakout, it
should rise nicely. The considerable length of time (7 months) of its
flat trading range between 46 and 50 will make a breakout more bullish.
FISV (below) appears to be setting up for a powerful breakout past 50.
Its current Accumulation Index is the highest in the NASDAQ-100.
Its CLosing Power is rising and the flat resistance at a round number,
like 50, shows lazy, unskilled selling. Once there is a breakout, it
should rise nicely. The considerable length of time (7 months) of its
flat trading range between 46 and 50 will make a breakout more bullish.
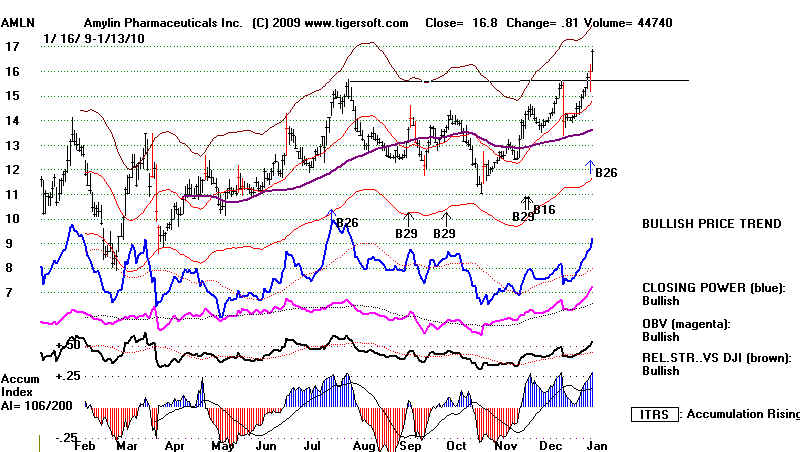
 AMLN (below) is playing catch-up, as biotechs often do
at the end stage of a makret rally.
AMLN (below) is playing catch-up, as biotechs often do
at the end stage of a makret rally.
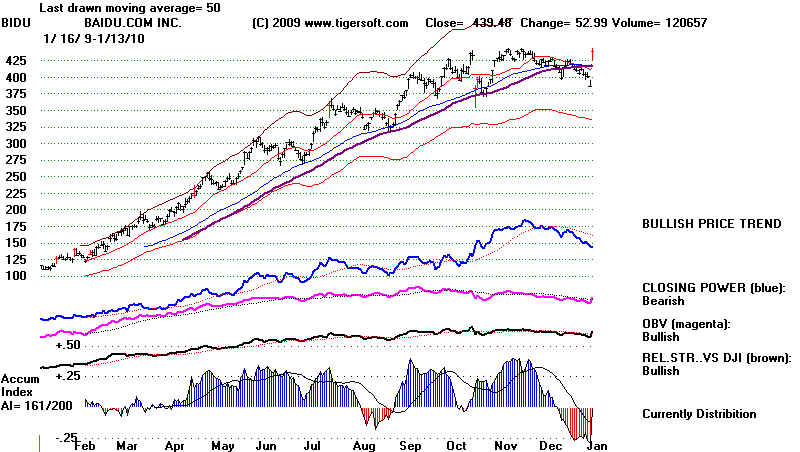
 BIDU (below) is benefiting from the prospects of GOOGLE withdrawing
from the Chinese market. BIDU is a Chinese language search engine.
BIDU (below) is benefiting from the prospects of GOOGLE withdrawing
from the Chinese market. BIDU is a Chinese language search engine.
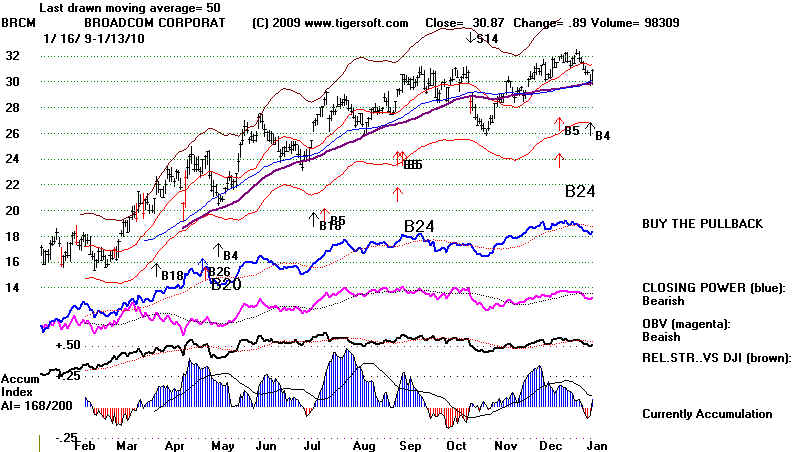
 BRCM (below) is turning up from its rising 65-day ma support. Its
Accumulation Index readings are high. There will be resistance at 32.
BRCM (below) is turning up from its rising 65-day ma support. Its
Accumulation Index readings are high. There will be resistance at 32.
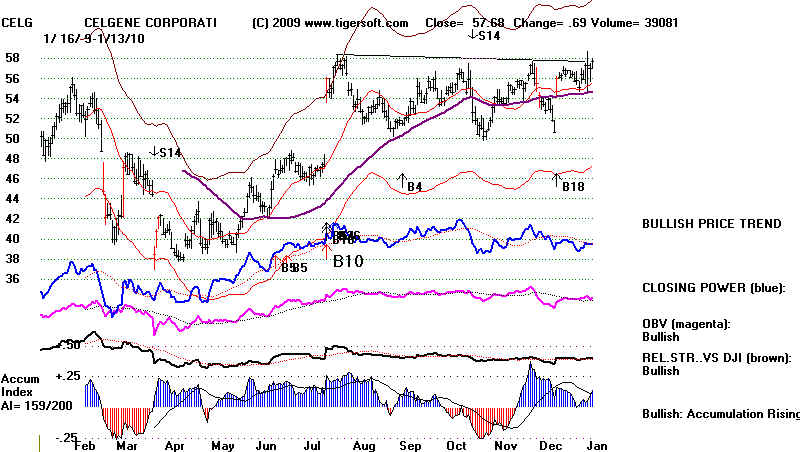
 CELG (below) is a about to breakout from flat resistance. It is a top-flight
biotech and will attract a lot of buying if it can surpass 59 and 60 for a clear
breakout. Peerless suggests there will be a breakout soon.
CELG (below) is a about to breakout from flat resistance. It is a top-flight
biotech and will attract a lot of buying if it can surpass 59 and 60 for a clear
breakout. Peerless suggests there will be a breakout soon.
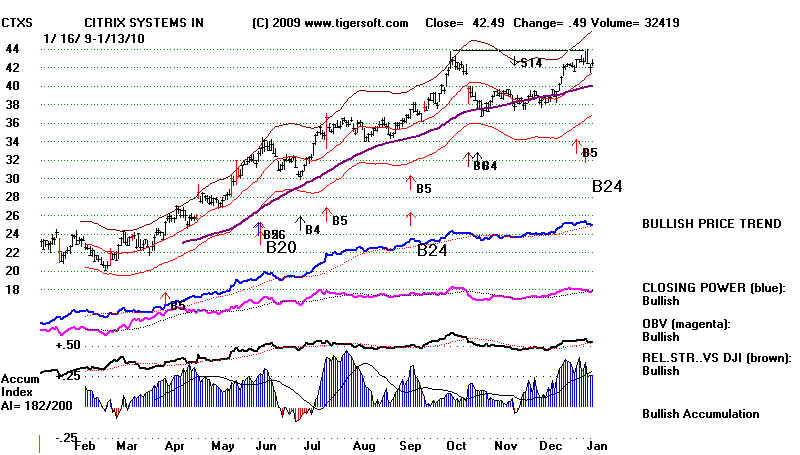
 CTXS (below) shows very high Accumulation. The active Peerless Buy
suggests there will be a breakout here to new highs soon.
CTXS (below) shows very high Accumulation. The active Peerless Buy
suggests there will be a breakout here to new highs soon.
)
-----------------------------------------------------------------------------------------------------------------------------
1/12/2009
The Coming Financial Storm
- Wednesday AM, 1/13/2009
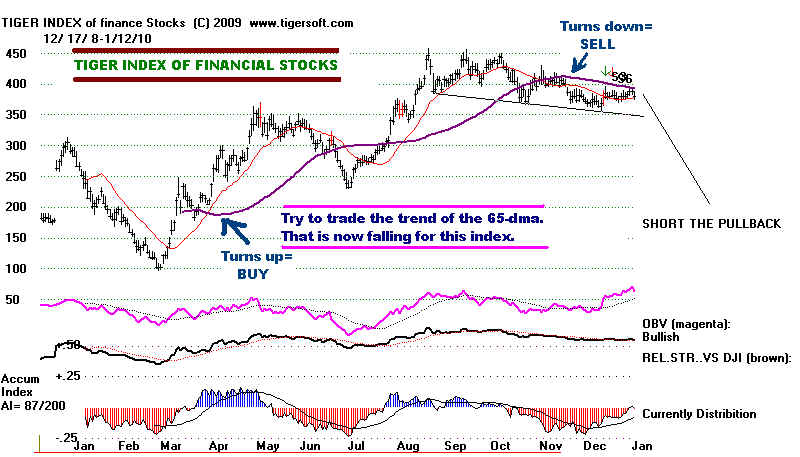
Finance stocks drove the market down
today. BAC lost -.57, JPM -1.04, WFC -.72, GS
fell 3.74 (below its now falling 65-dma and IP21<0 and AIG -1.17. But bullishly
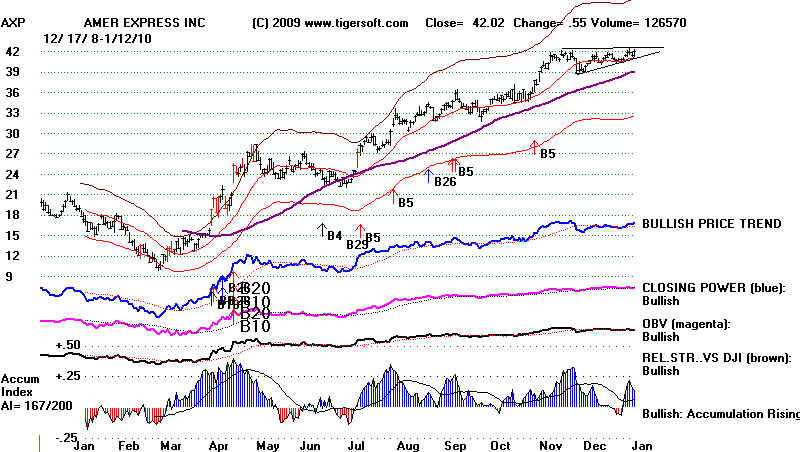
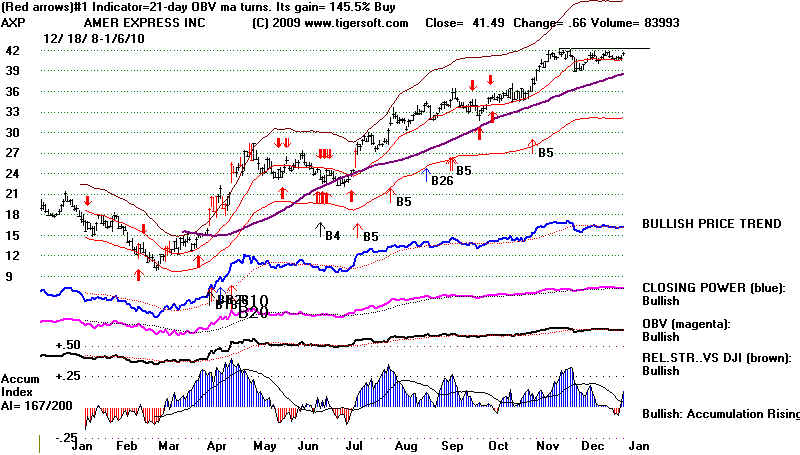
AXP rose +.55 to 42.02 and
looks ready for an upside breakout above a flat top. That the Closing Powers
were rising
for the DIA and SPY and MDY helped keep the losses very limited. Talk
of regulation of
banks
and Obama's
talk of more taxation of bank bonuses and trading profits clearly
frighten them and create new uncertainties. The public may deeply resent their excessive
pay
and believe without deeper regulation of Wall Street another financial bubble and panic
are inevitable,
but these Wall Street bankers also hold the recovery hostage. Who doubts that they
could
quickly dramatically drop the stock market in a few days, even hours, if that was their
wish?
Such is their dangerously excessive power and the problem in a democracy of banks
"too big to fail".
Needless to say, there is a an on-going and gathering movement to much more heavily tax
and regulate
banks. So, we must be careful. All this talk will amount to very little
unless Glass Steagall is restored
amd commercial banks can once again no longer be investment banks. I hear no such
proposals from
the rhetoric-minded White House or the Republicans who rightly see a real political
opportunity
in Geithner's cover-up of his favoring Goldman Sachs with $13 billion from taxpayers in
the AIG bailout.
"The F.D.I.C. board, in a 3-2 vote, approved a preliminary plan to tie the fees that
the
F.D.I.C. charges banks to fill its insurance fund to the banks’ compensation
practices.
Under the plan, banks that use long-term stock to reward employees and adopt provisions
to claw back compensation would pay lower fees."

GS has to be very concerned that unseemly revelations will come out about its special
treatment
by Geithner and the FED in the matter of the AIG bailots. Geithner has to be
concerned that
he has committed criminal perjury if he denies knowledge of illegal Fed instructions last
year to AIG
to conceal its payments to GS from the public and Congress. Obama has to be
concerned that
he could be committing an impeachable offense if he protects Geithner too much and insists
he knew nothing. An independent prosecutor should be called for. Obama will
resist doing
what is right. The degres to which Goldman runs the Administration's financial
policies would
then have to be disclosed.
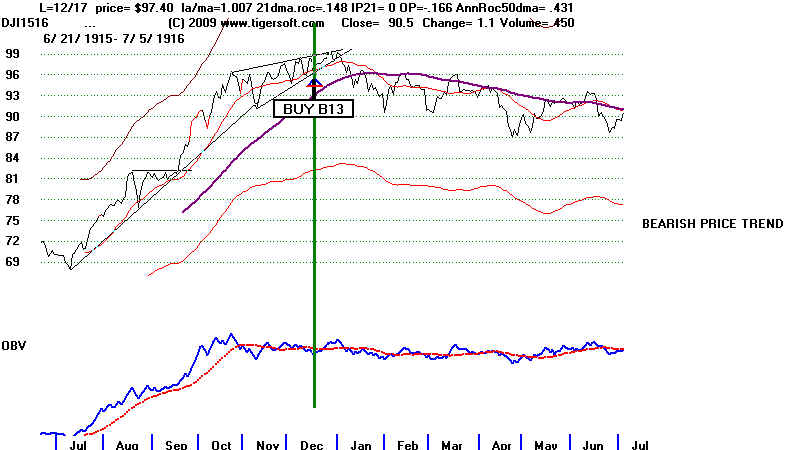
The DJI has been in an unusually narrow range for 10 weeks. There are a few cases
trading is similarly stuck in a narrow range. The closest parallel I can find is
also at the end
of a year and the begining of the next. It is 1915-1916. In this case the DJI
gradually retreated
10% over the next year. An OBV NC of the January 1916 high, a violation of DJI's
uptrend,
and then the 65-dma were the best clues. The DJI's OBV Line now is confirming.
In general,
it pays to believe the evidence of a decisive breakout from the narrow channel. If
it is to the upside,
the market is bullish. But if it breakdown, here below 10200, it will be bearish.
Very likely
such a breakdown would also bring a Sell S10, although breadth would need to deteriorate
more.
Falling 65-Day MA with Negative
Accumulation Is Bearish.
More Upside for AXP? Impending Flat-Topped Breakout.
====================================================================================
1/11/2009
A New Chinese Market Bubble?
While the DJI struggles to decide if it will achieve
a decisive 2 month new high,
foreign markets, especially Russia, Eastern Europe, Brazil, Indonesia and especially
China are rising with great speed. Many Chinese stocks may be easiy purchased
in the
US. That and the strong
Chinese recovery are creating a speculative bubble in
China. Two dozen, or so,
Chinese stocks up several hundred percent in the past year
are getting most of the play.
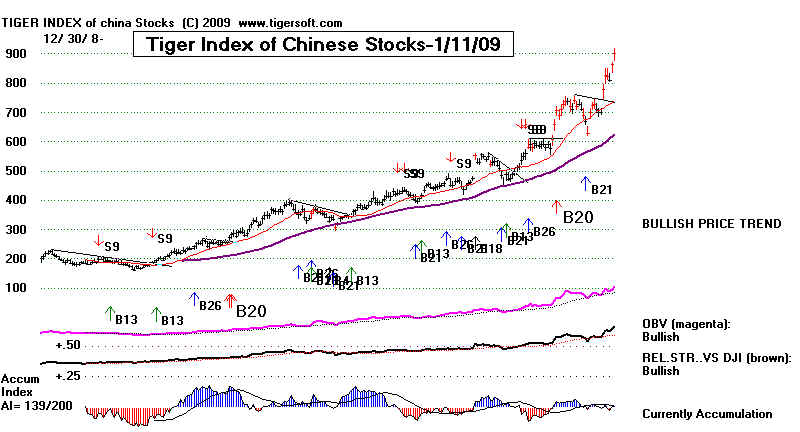
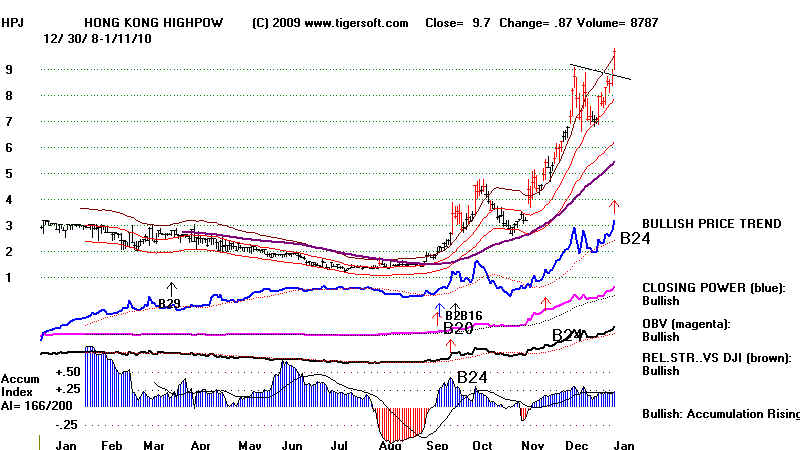
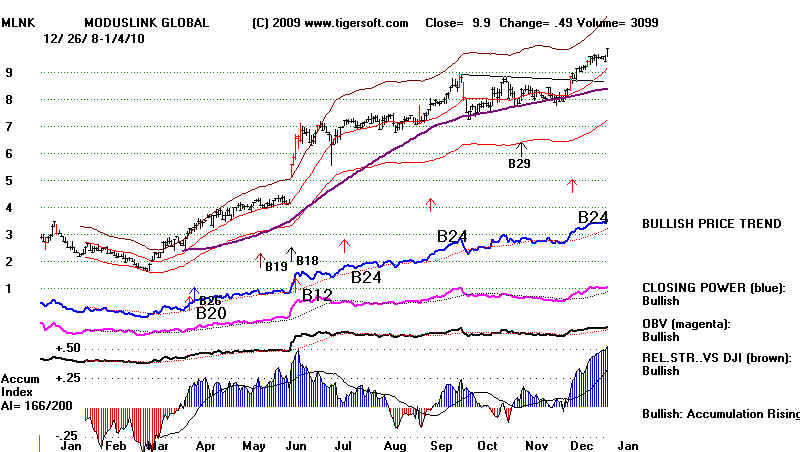
These Chinese super stocks show the same characteristics that explosive US
stocks do: Early bulges of Insider Buying (AI>+.45), Flat Topped Breakouts, Buy B10s,
B12s and especially B20s and B24s. Closing Power is less significant with these
overseas companies. What you may not realize is how much big US investors are
buying in the way of Chinese stocks. One can easily use Yahoo to research the
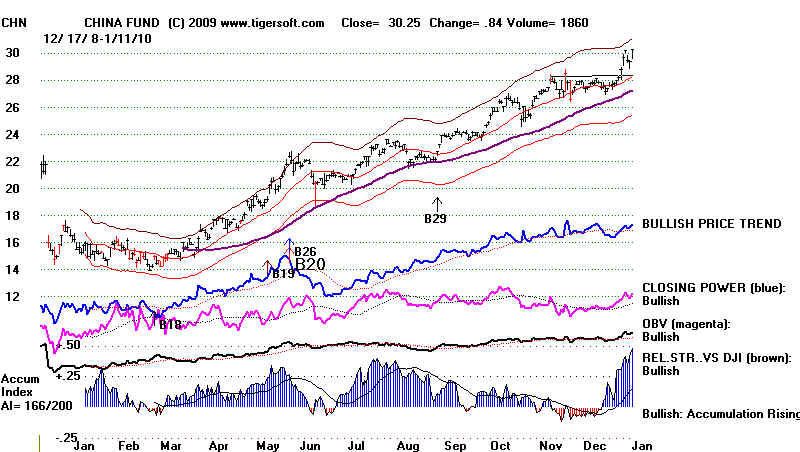
biggest holders. Below is the TigerSoft Index Chart of 158 Chinese Stocks. The
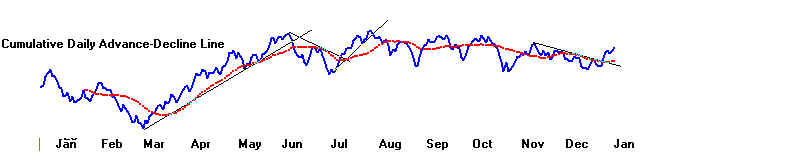
TigerSoft index weight each stock by trading volume times price. Look at the A/D
Line
for the group of 158 Chinese stocks. Notice it is flat. This shows a
narrowness to the rally.
This is a bearish divergence. When this A/D Line actually turns down and starts
making
new lows, we will have to be ready for a severe shakeout. Meanwhile, we are in
the climatic, blow-off phase of this advance. There are stocks now thatr look like
they will make good trades to buy. Seethe table below of the best performing
CHinese stocks.
26 Chinese Stocks Leaders 1/11/2010
Pct Change
Since
1/9/2009
----------------------------------------------------------------------------------
+232%    BIDU - S14 S29 IP21<0 and below flat 65-dma  Chinese langauge search engine
+668%    CAAS - AI Bulges and B10,B20,B24     AUtomotive
+668%    CAGC - AI Bulge and B10,B20,B24      Oraganic liquid fertilizers
+445%    CGA -  AI Bulge and B20,B24          Agritech
+223%    CPHI - AI Bulge and B20,B24          Pharm

                                                            BUY
+378%    CSIQ - B20                           Solar Energy
+333%    CTEL = AI Bulge and B10,B12, B20,B24 Hong Kong Telecom
               Negative AI with stock at upper band.
+266%    CTRP - B20                           TRAVEL SERVICES
+314%    CYD  - B10, B20                      DIESEL ENG. MFG.
+98%     FMCN - AI Bulge and B24              MEDIA
+328%    HMIN - AI Bulge and B10,B12, B20,B24 HOTELS
+181%    HRBN - AI Bulge and B10,B20          ELECTRICITY
+176%    JOBS - AI Bulge and B24              JOBS
+590%    KNDI - AI Bulge, Line Formation, B20 TECHNOLOGIES
+273%    KONG - AI Bulge and B10,B12, B20,B24 WIRELESS PHONE SERVICES
+427% NEP - AI Bulge and B12, B20 OIL EXPLORATION +142% PWRD - B20 ON-LINE GAMES +530% SEED - B20, 6-Mo. Trading Range Break-Out AGRIC. +445% SORL - B20 AUTO +484% SPRD - Flat topped Breakout, B20 WIRELESS SERVICES +524% TSL - Flat topped Breakout, B20 SOLAR +920% TSTC - B20, B10 WIRELESS SERVICES +130% VIMC - AI Bulge and B20,B24 SEMI-CONDUCTOR +296% VIT - B20, B10 TECH +306% WATG - AI Bulge and B10,B12, B20,B24 AUTO +141% WX - B20, B10 PHAR +210% YZC - B20, B10 COAL |

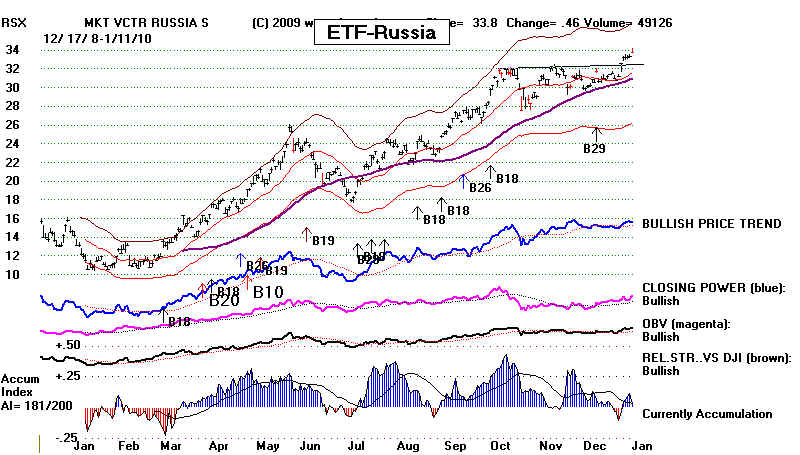
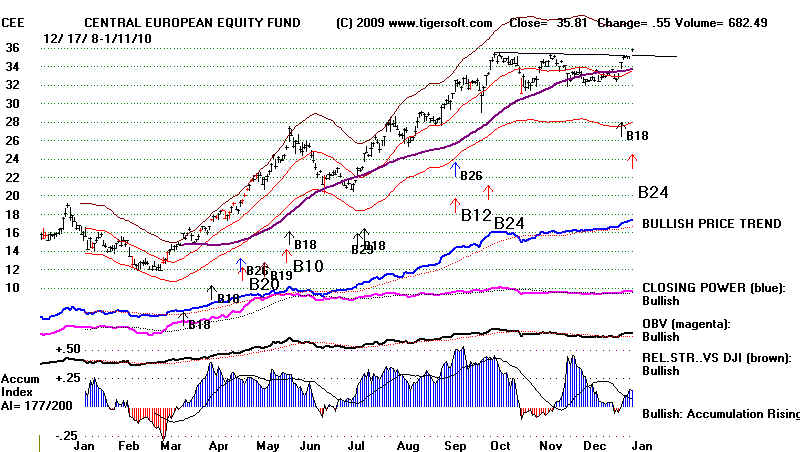
The Russian ETFs. RSX and CEE, look like they are making bery tradeable breakouts now.
This is partly a reflection of the rising
oil and gas prices.
============================== Country ETFS =====================================
Pct Change
Since
Country
Peerless Buys and Sells'
Recommendation
1/9/2009 ETF
Performance - Long Side Only
-------------------------------------------------------------------------------------------------------------------------------------------
158% RSX - Russia
+166%
Breakout BUY
157% MF - Malaysia
+69%
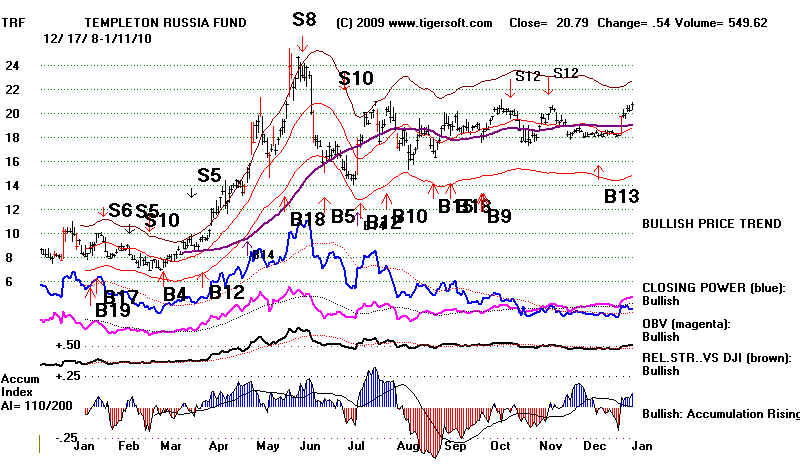
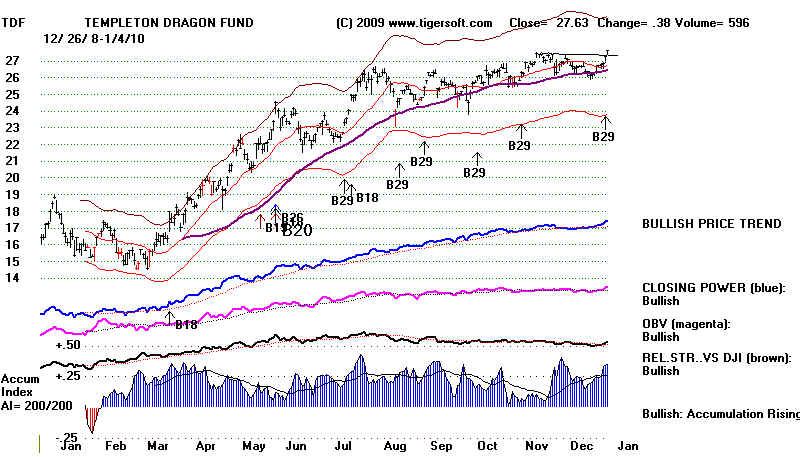
133% TRF - Templeton
Russia +325%
117% CEE - Central
European +202%
Breakout BUY
115% EWZ - Brazil
+120%
103% IF - Indonesia
+258%
95% CHN - China Fund
+71%
AI Bulge Breakout Buy
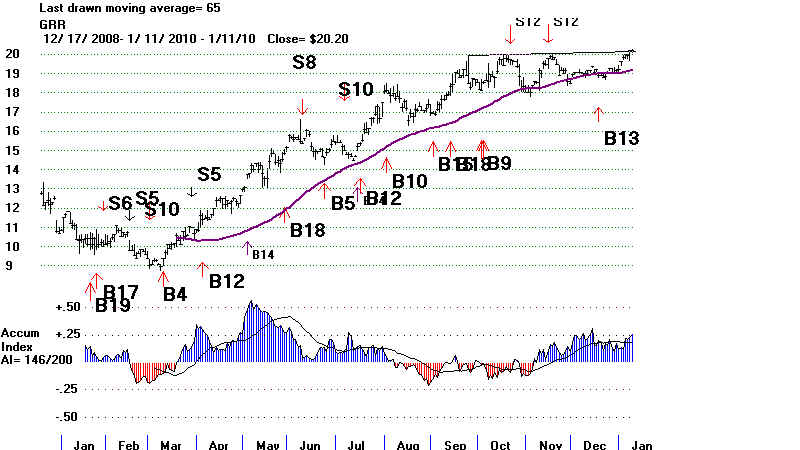
94% GRR - Asia Tiger Funds,
+108%
On verge of Breakout
--------------------------------------------------------------------------------------------------------------
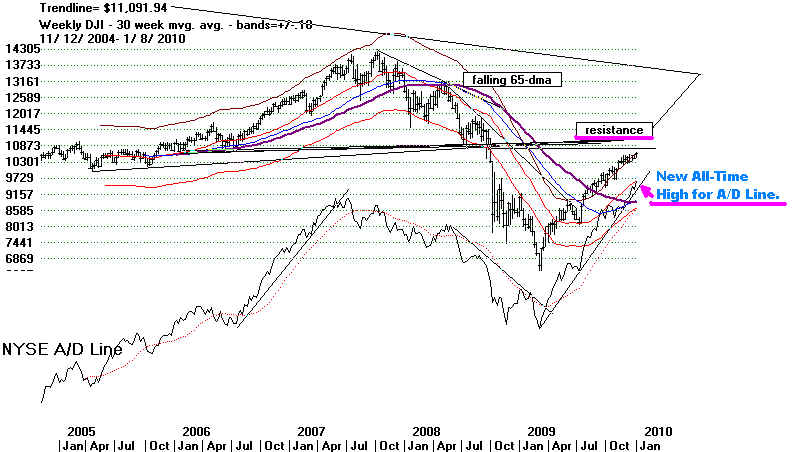
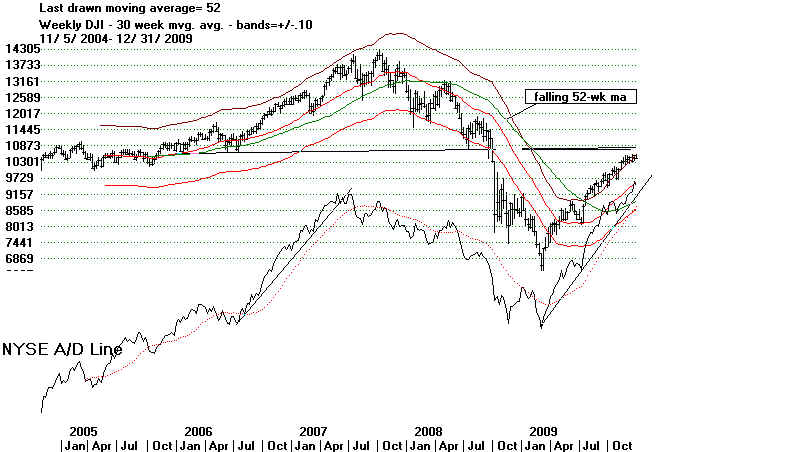
1/8/2009 A/D Line Keeps
Moving Higher.
The DJI-30 is the only major DJI that has not been able to make a clear
breakout to new highs. As you can see above, all the others have. Not only
that, but the NYSE A/D Line keeps bullishly streaking to new ALL-TIME highs on our
weekly chart, way ahead of the DJI. See below. Going back to 1928, I would judge
that 70% of the major tops occur with the the A/D Line not confirming a DJI high.
(The others we pick up with Sell S12s, head and shoulder tops and some other rarer
signals.) So, the strong A/D Line is very encouraging.
We should be even more bullish now because in many past cases, especially
in a lengthy bull markets, it often takes a number of such non-confirmations by
the A/D Liine of new highs to bring about a top technically. We have not had even
a first such A/D "NC" of a new high. So, the exceptionally strong A/D Line should
keep us bullish.
Of course, we can always find exceptions or something else to worry about.
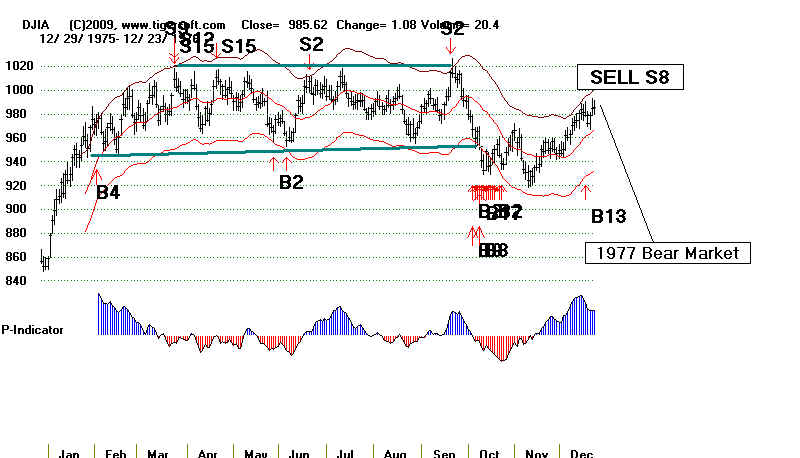
We could worry that this is a market like 1977 when a weak Dow Jones wins out
over the A/D Line. But that takes months and months of the DJI hitting its head
on resistance before the bulls give up. In 1977, after 6 months of floundering and
then slipping more than 12% from its high, a "fail-safe" Peerless Sell S10 finally
should have been used, because the DJI then dropped another 15% over the next
nine months anf the A/D Line turned down.
We will want to watch the Accumulation Index on the DJI. It is not very positive.
But an S12 seems unlikely, since I have found that S12s work best when the
P-Indicator is not so positive as now. The P-Indicator measures monthly breadth.
Strong Sectors Abound - That's Bullish, including
Cyclicals, which Suggests Am Improving Economy!
Inspection of the Fidelity Sector fund yearly charts show quite a few
that are making new highs in what I consider to be a sustainable way:
Cyclical FCYIX Multimedia FBMPX Outsourcing, IT FBSOX
Natl Resources FNARX Energy Services FSESX Air Transp FSAIX
Automotive FSAVX Small Caps FSCBX Ind Equipment FSCGX
Chemicals FSCHX Military FSDAX Developing Comm FSDCX
Ind. Materials FSDPX Electronics FSELX Energy Services FSESX
Medical Delivery FSHCX Medical Equipment FSMEX Health Care FSPHX
Environmental FSLEX Transportation FSRFX Wireless FWRLX
I offer the biggest 10 stock-holdings of all the 40 Fidelity Select funds on the
TigerSoft data page each night. So, this a safer, more vetted universe to run
the Power Ranking program against. Presently, the top Power-Ranked stocks
here with an IP21 over +.25 and rising Closing Powers are:
Price AI/200 Curr. AI (IP21) TGR Signal
HPQ 52.59 189 +.37 Down (public) Up (professional)
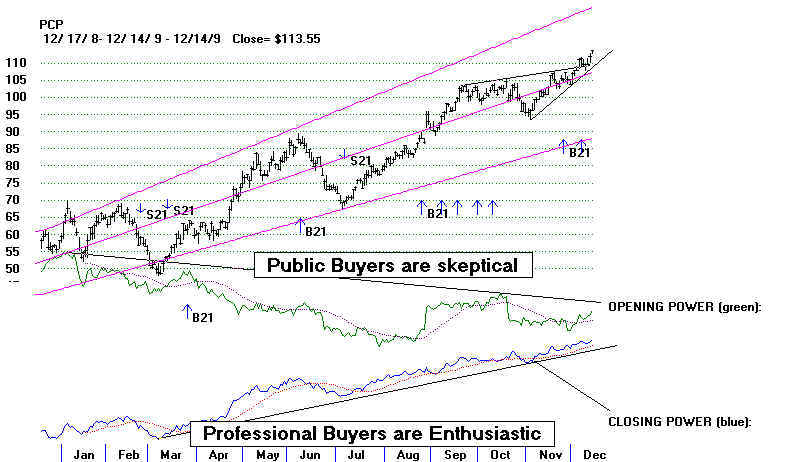
PCP 117.22 160 +.31 ? (public) Up (professional)
MDT 45.99 168 +.35 Up (public) Up (professional)
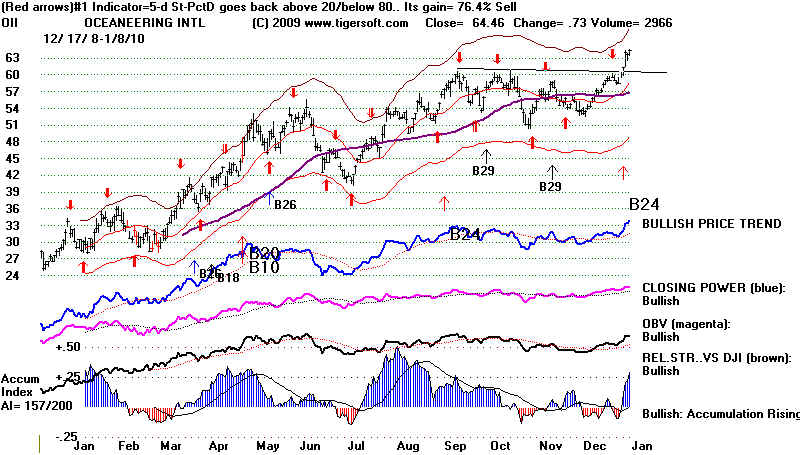
Oceaneering (OII) among these Fidelity favorites has just made a flat-topped
breakout after consolidating for four months. Its internals are all bullish. Both
Opening and Closing Power are rising. The breakout nullifies the short-term Sell.
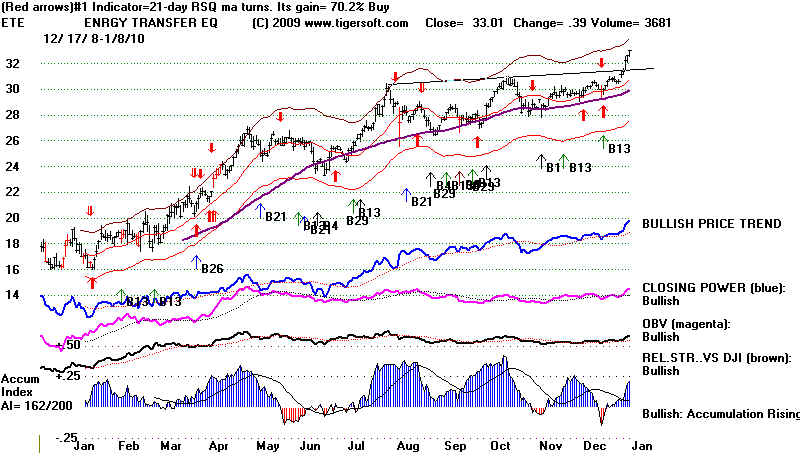
A number of energy stocks not owned by Fidelity also look very good, in the sense
that they have very a high power-ranking value, an IP21 above +.40 and and both
their Opening and CLosing Power are rising: NOG, SWM, IOC. But each these are
already up at their upper band. So, I suggest simply looking at the oil stocks
making new highs. This reveals ETE as another attractive trade now.
=== ==========================================================================
1/6/2009 Still A Buy B13.
The DJI failed to breakout past 10600. Having failed to overcome resistance,
it may have to test its support near 10250 again. The NYSE A/ D Line again outperformed
the DJIA. There were 605 more up than down on the NYSE. NYSE New Highs rose,
though NASDAQ New HIghs did not. Breadth, I keep saying trumps volume. And as
long as we have no new Sells from Peerless and the NYSE A/D Line uptrend is not
broken, I think we have to expect higher prices, proably a move to the 11000 broken
support from 2008, which should now be reisstance. NYSE Down Volume keeps
declining. So, downside pressure is limited now. Also, bank stocks like BAC and C
are on the upswing again.
Doubters of the rally point out the artificiality of the recovery. They say the advance
has been fueled artificially by essentially free money that banks have been given by the
Fed, Bernanke refuses to give details, Small wonder! What we do know is that in
return for toxic debt collateral, Goldman, Chase, Bank of America, CityGroup,
Wells Fargo and other very big manks have been able to borrow more than
$2 trillion at the Fed' Discount Window in return for collateral consisting of taxic
debt that has little market value. The banks, it is said, certainly Goldman Sachs,
have run up the market, hoping to sell shares to every-day investors once the
economy picks up. There is no evidence that the FED has restricted speculative
stock purchases or efforts by Goldman and Morghan Stanley to rig the market. There
are those that belive that the Fed has encouraged and even orchestrated these
activities. All this would, of course, have been completely illagal under the laws that
existed from 1935-1999, when Glass-Steagall was in effect. Now there are those who
claim that the FED may be directly causing the market tp rally. Personally, I
believe tthe FED has always tried to move the stock market up and down. And
it has always shared its intents with the biggest banks, so that their intentions
would more easily come to pass. That conclusion is easily reached looking back
at November 1970, Septmber 1978, mid 1982, September 1987, December 1987...
My new Peerless book shows this to be a regular theme in US Stock Market
history: insiders always know first. And the job Peerless is to track them.
The blatancy is greater now, because the insiders, the bankers, are more desperate,
- "The source of approximately $600 billion net
new cash necessary to lift the market's overall
capitalization by $6 trillion last year could not be identified by TrimTabs, Biderman said. The money,
he said, didn't come from traditional players such as companies, retail investors, foreign investors, hedge funds
or pension funds. - "We know that the U.S. government has spent hundreds of billions of dollars
to support the auto
industry, the housing market, and the banks and brokers. Why not support the stock market as well?"
(someone's been reading my blog...) The Federal Reserve or the Treasury, Biderman said, could have easily
manipulated the stock market by purchasing $60 to $70 billion worth of futures of the S&P 500 Index
on a monthly basis. (especially in premarket when the market is thin...recall so much of the rally in the spring
and summer was overnight, rather than during the day )
(Source:
Another reason for still being bullish, it's not hard to find stocks that still look like Buys.
Rank the stocks in the SP-500 and the new highs' list for current Accumulation. If
a stock shows current Accumulation above +40, is making a new high and shows
high past (blue) AI/200 scores, it is considered attractive for purchase. Only when
it becomes difficult to find attractive stocks like htisto buy, we often then have
good reason NOT to buy. That is not true now.
Watch to see if AXP makes a flat topped breakout past 42. That will be bullish.
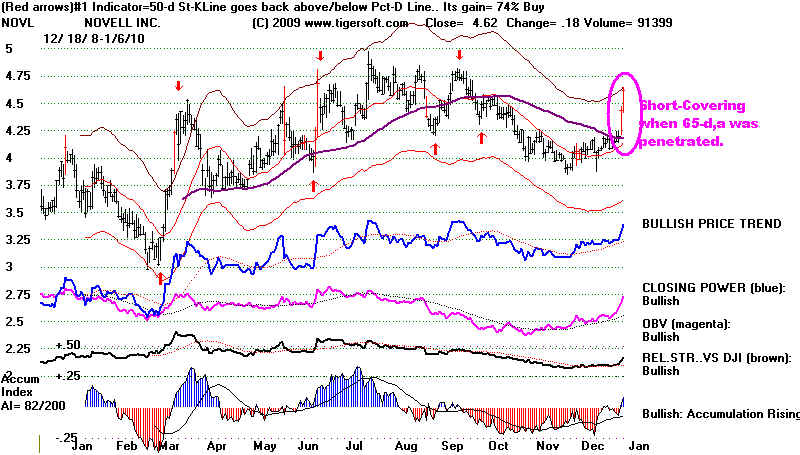
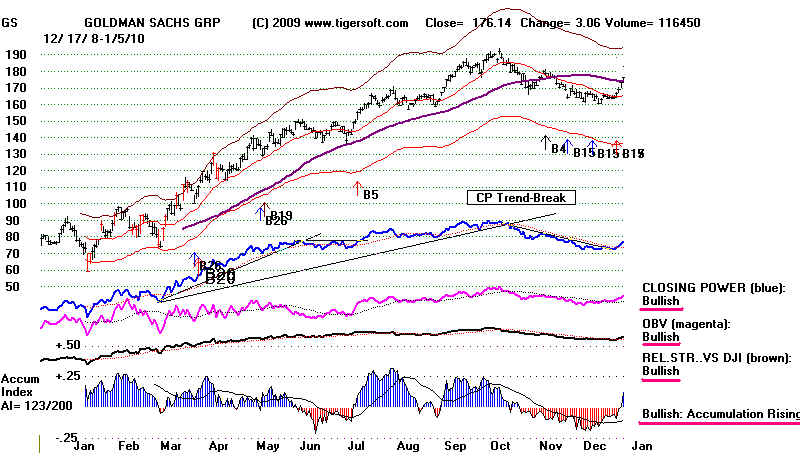
BAC and GS have just penetrated their 65-dma. With a positive Accumulation
Index, they could move up smartly now like NVOL has done below.
High Accumulation stocks like KVU seem reliably bullish now.
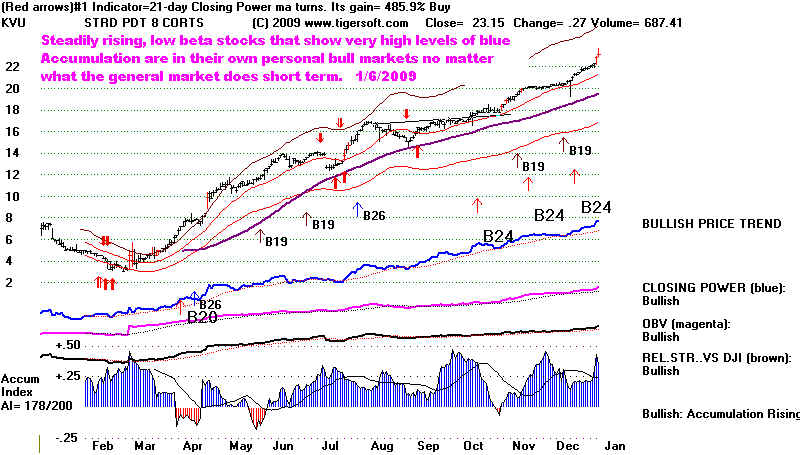
New flat topped breakouts confirm the uptrend. Note red high volume.
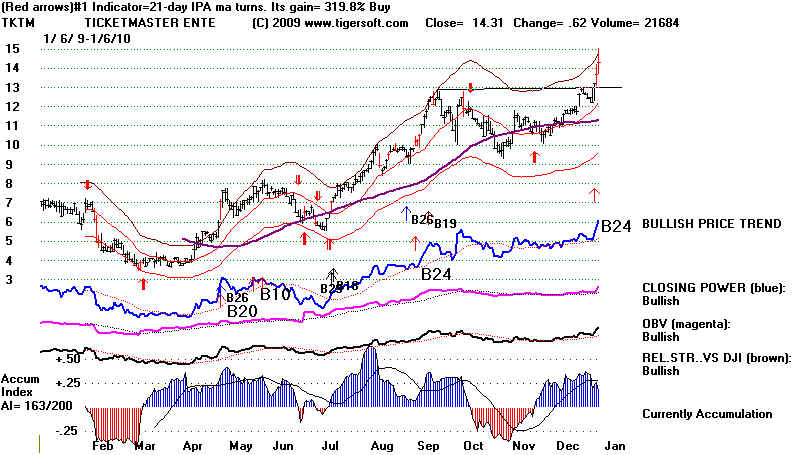
Internals are all rated bullish for TKTM.
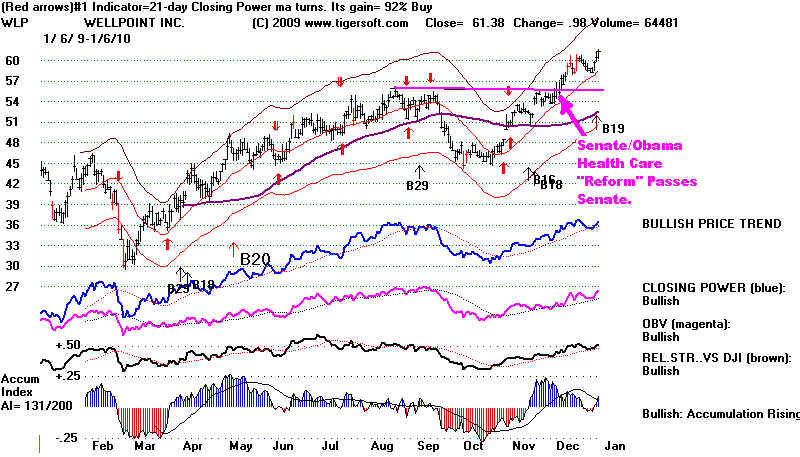
Beneficiaries of public policy are making new highs. Well-Point is a direct
beneficiary of the new health care "reform" which will require all Americans
to buy private health insurance. Blue Cross of Califrnia is owned by
Well Point. Their premiums have gone sky-high in the last five years.
People buy high deductible health "insirance" from them and then have
no money left for preventative tests and care. Small wonder that we
spend 12 to 15 times per person more on health care in the US than
Cuba, but have exactly the same lide expectancy.
=======================================================
1/5/2009 Still A Buy B13.
The DJI nearly closed above the 10660 resistance. (See chart above. )
A clear price breakout above its well-tested, slightly rising resistance line
would suggest a rise to 11000 based on the rising channel. It still might fail.
But that seems unlikely, as breadth remains very positive and January
is when such breakouts often occur. Volume remains low on rallies and
picks up on declines. This has to be of concern. IBM (-1.6) faltered as market
leader today. But its Accumulation Index has been consistently
very positive. Dips will probably be quickly recovered from.
On the positive side, there were 650 more up than down on the NYSE. Money seems
to be shifting around, but not exiting. Goldman is back above its 65-day ma but
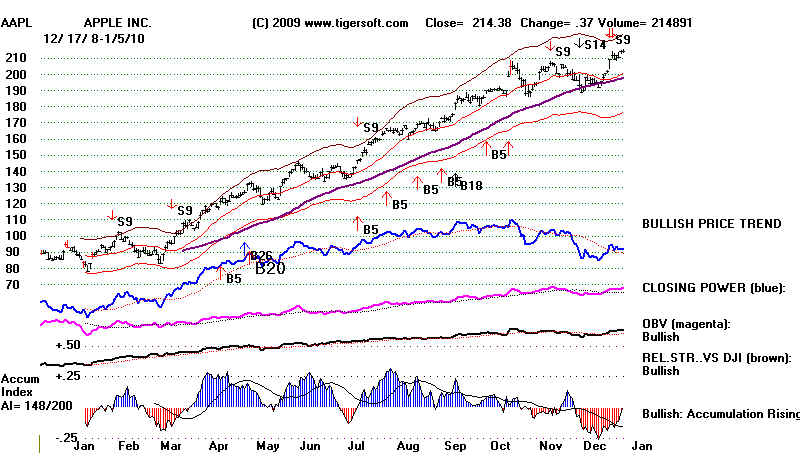
APPLE shows red distribution and a Tiger Stock Sell S9. Without a Peerless Sell S9
or Sell S12, this probably only shows short-term re-deployment of funds from
Apple on the announcement of its new Slate and a growing sense that it must
do battle with the formidable Google goliath.
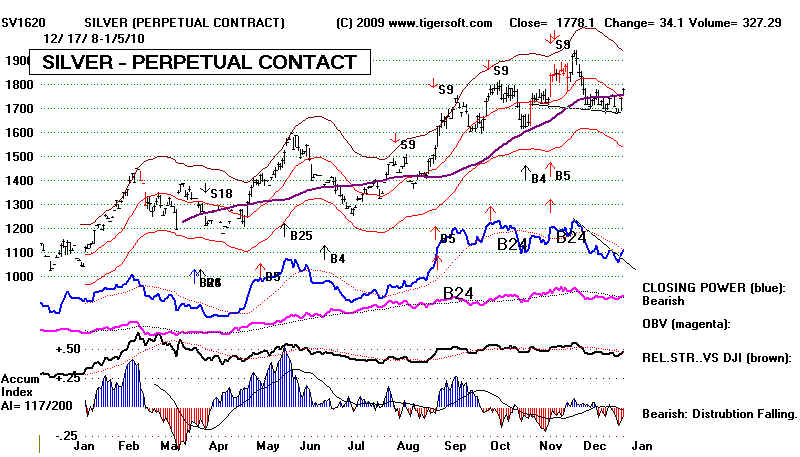
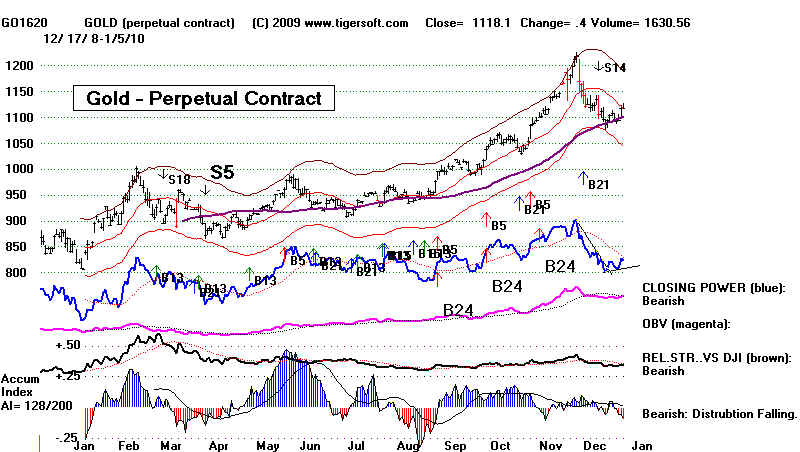
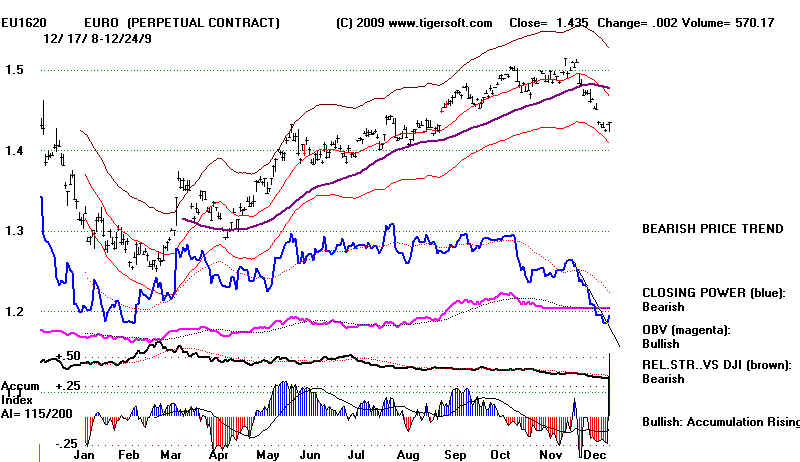
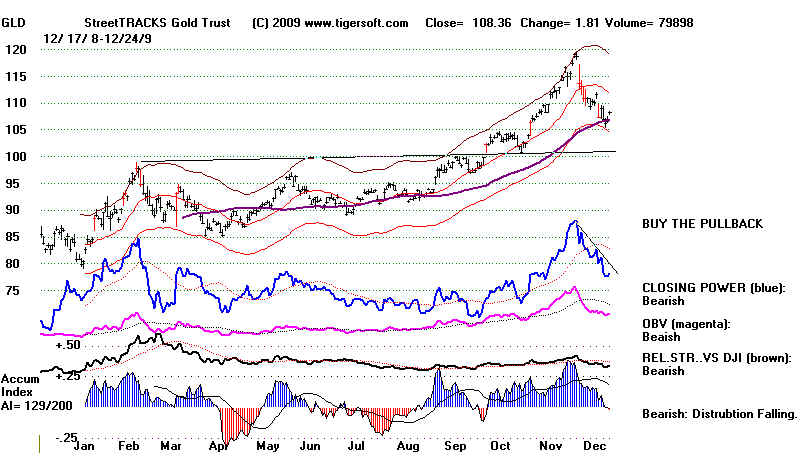
Precious metals (Gold and Silver) are rallying again. Silver seems headed for
its recent high of 20-21. But their Accumulation Indexes are in red (negative)
territory. While that may put a limit to how far they can advance on their current moves,
see how quickly Gold bounced up off its rising 65-dma. That shows a lot
of patient (usually smart) buying interest, The CLosing Power downtrend-liens have been
broken above.
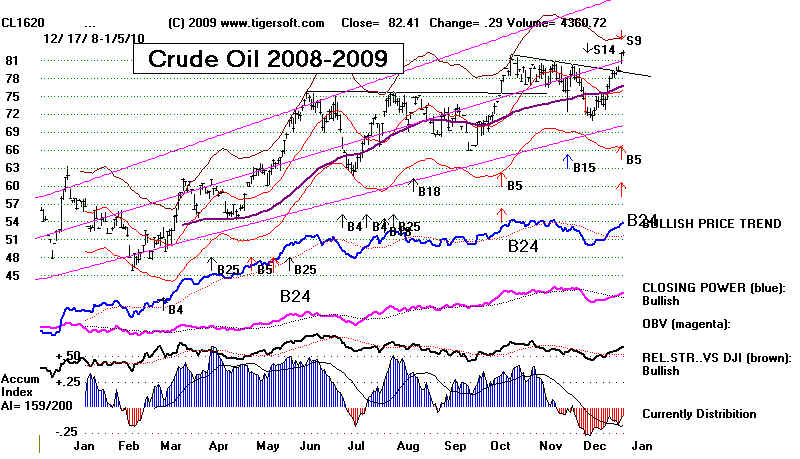
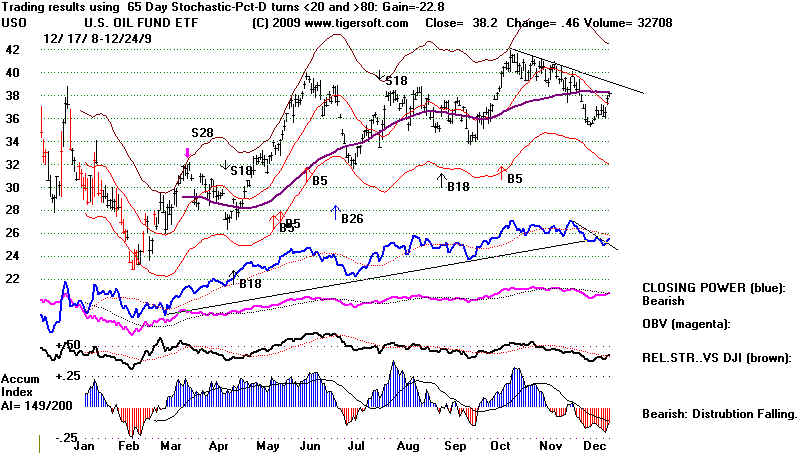
Crude Oil's Accumulation Index is also negative as it makes a run now to new
highs, bringing a Tiger Stock S9. After substantial advances, this can show
extreme vulnerability if the overall market also showed Peerless Sell S9s
and Sell S12s. But that is not so now. In addition, there has previously been
six months of (blue) Accumulation. So, I take this only to be a sign of heavy selling
into strength. Without a Peerless general market sell, it probably means a period
of hesitation and backing and filling is likely after a limited rally. Breakouts like
Crude Oil shows now past a well-tested line of resistance do have a considerble
short-term bullish momentum that usually must be played out.
See how strong the weekly A/D Line is on the 5 Year DJI chart. Accumulation
is weakening, but not negative. My judgement is that NYSE Volume is not high
enough to make a penetration of the 11,000 resistance imminent, but NYSE Down
Volume remains very low. So, the DJI will continue to eat up the overhead supply
while avoiding a significant sell-off that takes the DJI below the rising 65-dma. .
======================================================
1/4/2010
Buy B13 Continues. The rally took most stocks up today. I would favor stocks
making new highs soon after a period of "insider buying", which is signified
by a clear Accum. Index bulge past +.45. See the bulge of Accumulation in the
chart below as an example. Below are some stocks that show that pattern now.
Today many of the best performing stocks rose as a result of short-covering.
BAC was the best performing stock in the DJI and WYNN was the best in the
NASDAQ-100. It is bullish that the shorts are being forced to cover. Their buying
can push up selected stocks 25% over a few weeks time,. But after that, the
best performing stocks are usually those showing lots of Accumulation, flat-top
breakouts, red high volume and good relative strength. Lots of my studies of past
market moves upward in January suggest we want to own the stocks insiders
are buying with the start of the new year. Last year, the DJI started off weakly.
So, the insider buying in March and April was more important. See how
often this insider buying correctly identified the explosive super stocks of 2009.
http://tigersoft.com/2009-Super-Stocks/index.html
I would favor the stocks on the Tiger Data page under ACCUMULA. ACCUM.
Example - China Biologics - CBPO
,
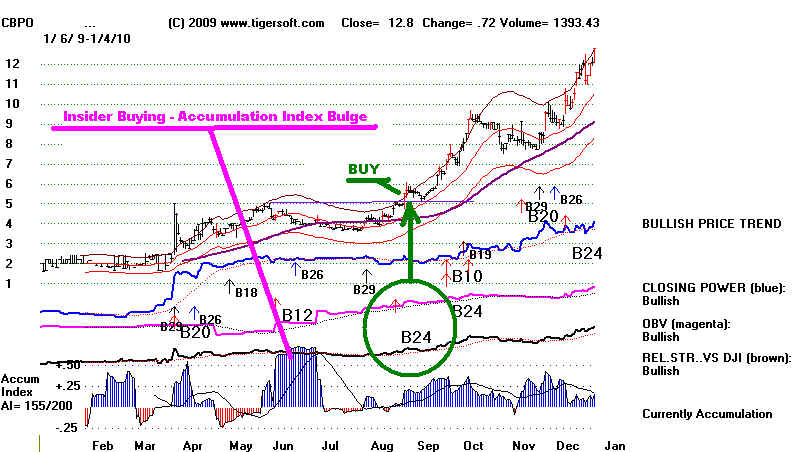
Stocks showing this much Accumulation are still under Accumulation. They may
actually be held back a months, so that insiders can buy more. Give this plenty
of time.
====================================================================================
1/3/2010
Buy B13 Continues. The Buy B13 reminds us that the DJI is likely to
rise in the 10 trading days after December 17th. Tomorrow's trading
will be the tenth day. The next three trading days have seen a gain 61.5%
of the time since 1965. The bullishness wanes after that considerably.
Will Friday's weakness of 1.17% (671 points) spill over? I checked back
over all the past years to 1928. This was the second biggest percent decline
on the last day of the year. In 1996 the DJI fell 101 on December 31st
and then immediatelt rose 9% to early February. In 1998, the DJI lost 1% on the last
day and then also immediately rallied 5% a week later. So, one day does not
stop the rally. Both occurrences were years before the lasting, year or more
length bear market that began in 2000. Remember that flat tops like we now
see usually bring excellent breakout runs early in the new year. Hope the
bullish pattern continues!
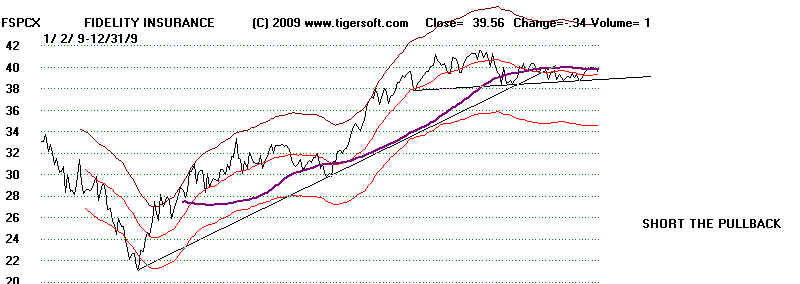
Looking at the 40 individual Fidelity Select funds, that show all the various industries,
one sees weakness right now only in financial, brokerage and insurance stocks.
Most stock groups are in staunch uptrends. Certainly, the Financials' weakness
could be a warning. It could grow. If the government really were to regulate
and go after big banks, financials might sabotage the whole stock market, as a whole.
This is surely a big fear that influences Obama. We just have to keep watching
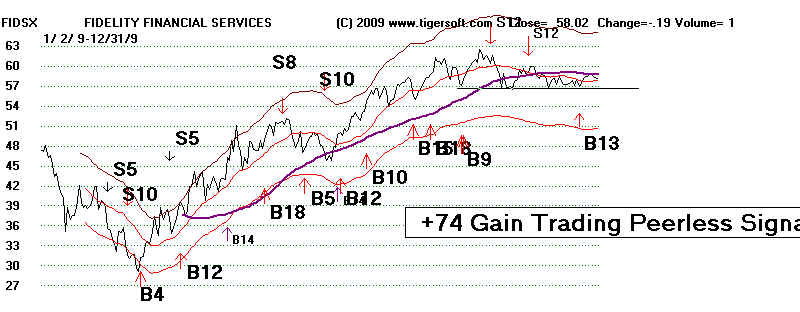
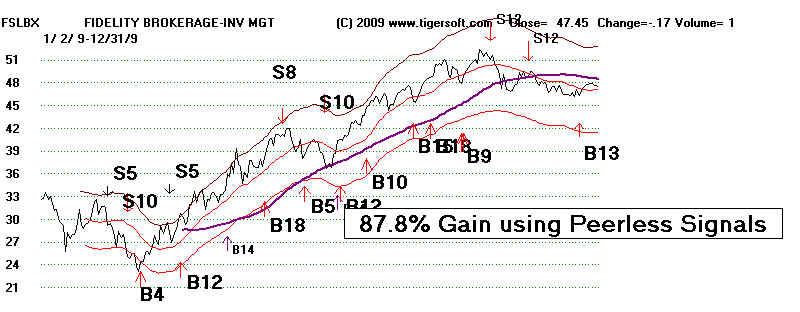
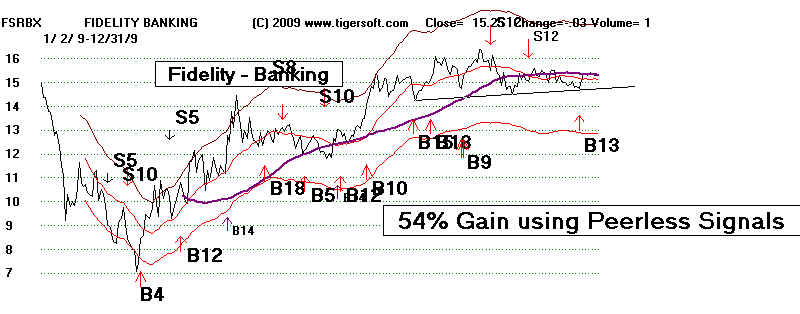
them. Singificantly, my extensive back-testing shows that since 1987, the Peerless
Buys and Sells can be applied most profitably among all funds to the Fidelity Financials'
Sector Fund, FIDSX. This demonstrates that the fate of the stock market and these
Financial Sector funds seldom uncouple for very long. (I would add that past pro-bank
governmental policies have made this relationship closer than it might need to be
in the future. )

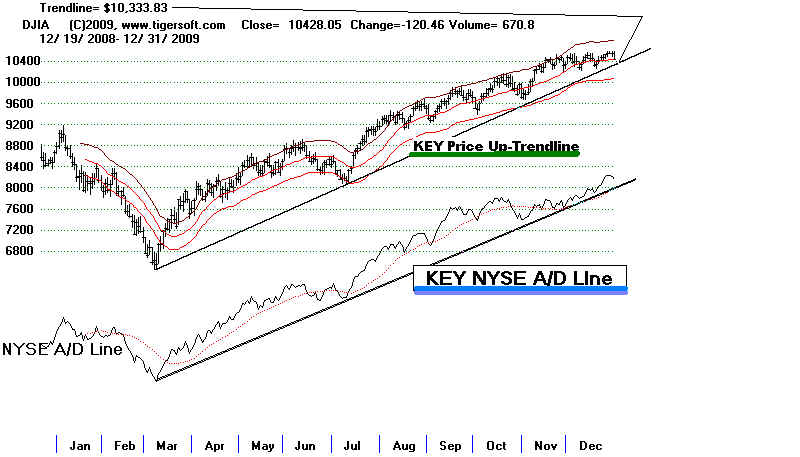
If the DJI violates 10200, there will be a significant break in a well-tested
support. A close below that might, depending on breadth, bring a Sell S10.
The bullish fact remains now that we are not likely to be at a top until
there is a significant deterioration in breadth (the difference between
NYSE advances and declines). A break in the 10 month A/D Line uptrend
would change that. The NYSE AD Line trendline is shown below. Its uptrend
is still continuing. But No Sell S9 is close to occurring. However, a break a
long NYSE uptrendline in May 2002 signified the post 9/11 recovery was over.
Very low interest rates could only take the market up so long.
For now, stay bullish.
Historical odds usually favor higher prices until breadth deteriorates.
Since 1928 ended because of the NYSE A/D Line deteriotation and Sell S9s.
I count 18 tops made in this way: 1929, 1932, 1937, Sept-1939, 1950, 1957,
1959, 1969, 1973, 1979, 1981, 1987, October 1989, July 1990, July 1998,
January 2000, May 2002, July 2007.
11 other major tops were signalled not by a weak A/D Line or a Sell S9,
which is triggered by weak breadth.uajpp
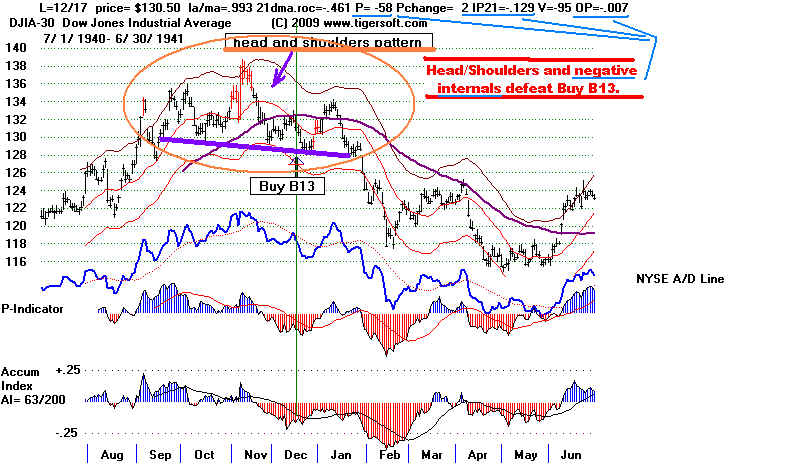
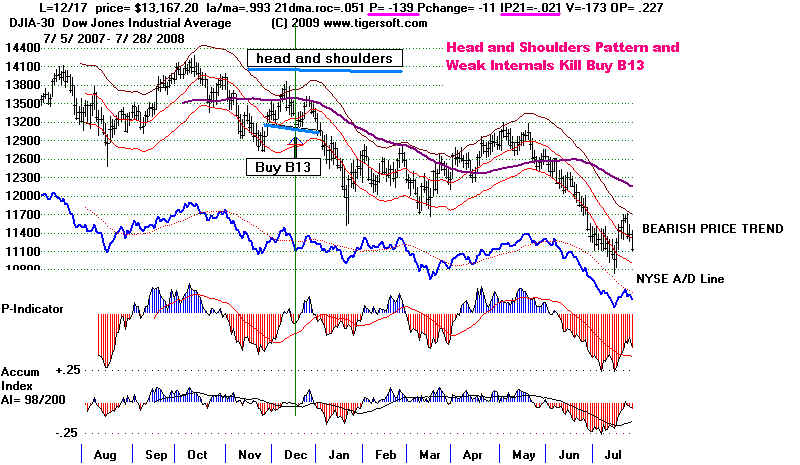
Head and shoulder tops accounted for four additonal tops in August 1941,
1946, 1962, March 1974. The sidewise action of the DJI since late October
is not a head and shoulders pattern. I would note, though, that most of the
DJI's trading has taken place near the top of the pattern. If there is a price
breakdown, that would make the pattern seem to be distribution.
Negative Accumulation on a new high (Sell S12) alone signalled the tops
only in 1966, September 1978, February 1980 and September 1997.
That's only 4 cases. Sell S12s are more important because they reinforce
and add to the bearishness of S9s and bearish A/D Line divergences.
Other signals called the tops in 1968 (S1), 1976 (S8), January 1994 (S4)
=======================================================
12/30/2009
Buy B13 Continues. As long as the NYSE A/D Line uptrend-line in not violated,
we should give the DJI every chance to score a breakout above 10600 and make
a strong advance in 2010. There many examples of such runs at this time of year.
Study the NYSE A/D Line charts for these years showing such breakouts. .
One warning, if the Accum. Index stays negative on the breakout, the advance will be
much smaller. See the case of 1966. If a breakout does take place, we will want
to see a boost in volume. Our Stocks' Hotline is heavily invested in stocks that have
already made flat topped breakouts. I expect more from them, if the DJI achieves
a breakout. This will get publicity and invite more of the cautious public into stocks.
My General Prediction for 2010
Rhetoric aside, this Administration seems committed to getting the economy
out of its slump by helping first, banks, second, insurance and housing stocks, then
the stock market, then GM and lastly the rest of America. What might derail the
current market trend and their plans will be higher American Joblessness and populist
demands on the Administration that the biggest banks be broken up and Glass-
Steagall be reinstated. There should be a small improvement in the Unemployment
numbers for the next few months. If not, I would think the market will stumble. And
as logical as a return to Glass-Steagall (where cannot banks cannot be brokerages
and investment banks) seems to me, given the recent near-fatal collapse of the
financial system, almost no political leaders are demanding this and certainly not the White
House. (After all, it was Summers and Geithner's mentor Rubin that sold Clinton
on ending this Depression era banking reform.) So, American discontent with banks is
likely to be unfocused and will probably be satisfied by token financial reforms. That
Geithner allows big bank bonuses and high CEO pay, shows me that the Administration
does not fear a populist revolt and believes they can manage it using occasional
bursts of feigned indignation expressed solely via unbacked rhetoric.
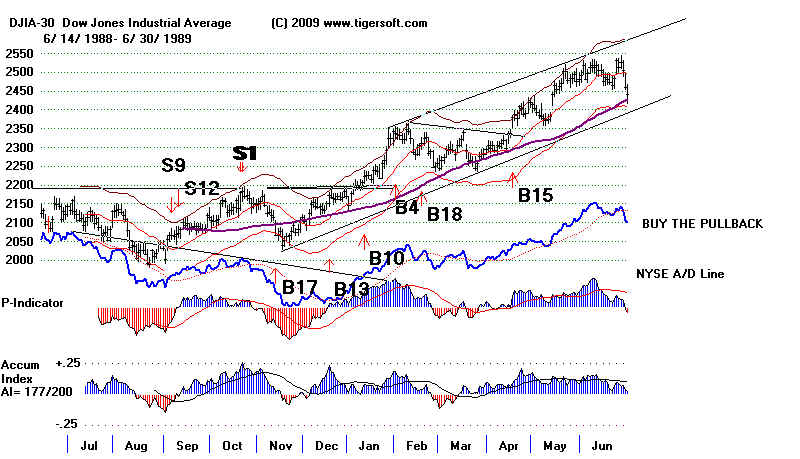
If this prediction is correct, the uptrend should continue in 2010. Another significant point:
Just as in 1988, after Wall Street computerized trading crashed the market in the previous
October, the stock market is now also on its best behavior! It is clearly in Wall Street's
interest to let prices rise gradually. They may even have reached an agreement to do this in
return for Treasuty and Federal Reserve aid. Notice that after a year of a steady uptrend
in 1988, the Dow Jones Avg. broke out on January 11, 1989 above a very flat top and then
took off, running handily upwards until the Sell S9 of October 1989. See below, also,
how in 1989 the NYSE A/D Line was much weaker than it is now. The overhead resistance
at 11000 will be a problem. But it is surmountable after a lot of backing and filling, such
as we are seeing since October. So, except for fact that 2010 starts a new decade, and
such years, 1890, 1900, 1910, 1920, 1930, 1940, 1950 (less so), 1960, 1970, 1980, 1990 and 2000
have been historically jinxed, I would think that 2010 should start off as a good year.
If I'm wrong, fortunately we have Peerless to tell us when to get out. HAPPY NEW YEAR..
=======================================================
12/29/2009
Buy B13 Continues. Technically, we must require good breadth to compensate
for the low volume. Bullishly, the NYSE A/D Line is still uptrending. Today there
were 83 NYSE stocks making new highs and zero making new lows. On the NASDAQ,
the same numbers are 45 and 7, respectively. That represents a deterioration from
a few days ago. The QQQQ's breakout has not been matched by the DIA or the
SPY. In the DJI, we have seen impressive breakouts by HPQ, IBM and MSFT. But
breakouts are needed by DIS, AXP and JNJ. They have flat topped patterns,
but no breakouts. As I showed last night, the breakout need not be just as the
new yars starts to bring a very good rally. But it should occur in the next three weeks.
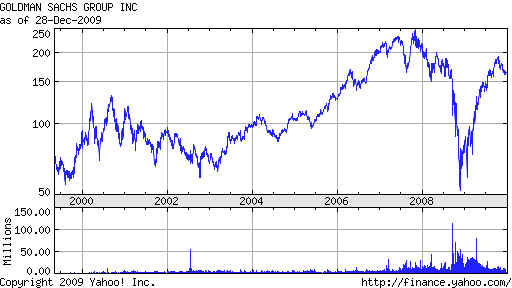
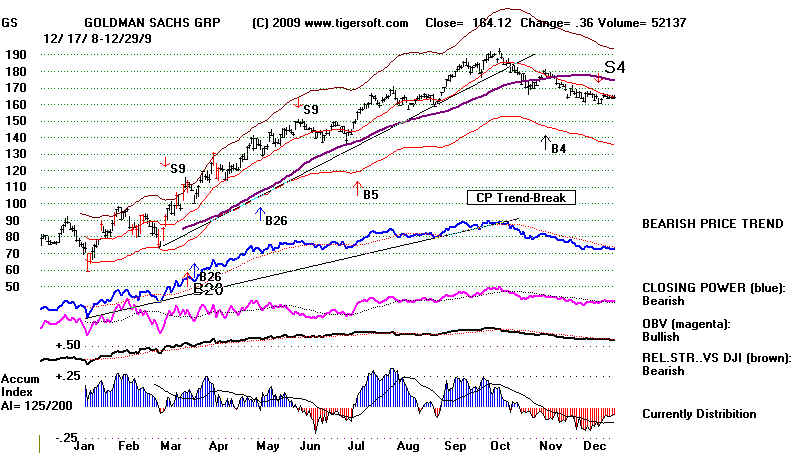
We want to watch Goldman Sachs closely. GS historically starts to fluctuate
violently when it and the market are topping out. That was true in 2000 and also
in 2007. The current decline does not yet look so serious. But the decline
is not over, judging from the Tiger Daily chart.
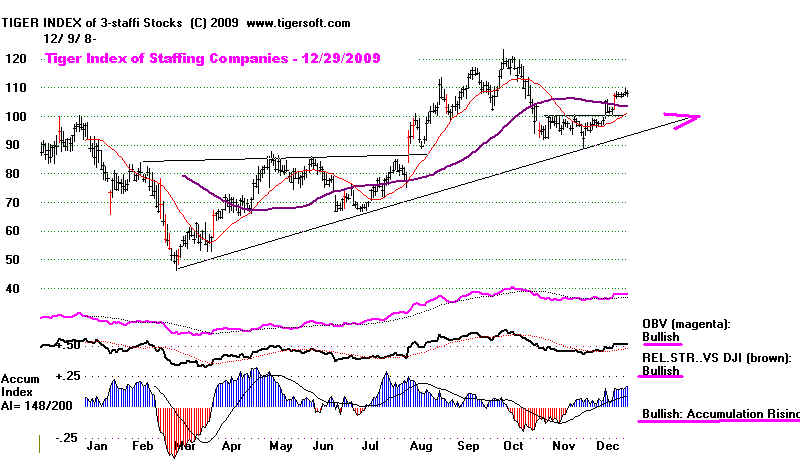
Jobs Will Be Very Important Politically in 2010
Our chart of Staffing stocks is in a rising trend. This is a coincident indicator.
It does not lead the market, but a serious lag in it would be bearish. Let's hope
the uptrend continues.
As Obama starts 2010, he must create more jobs and not just promote
a rising stock market by taking money from tax payers and then helping banks.
A bitter populist backlash is now working against the biggest banks, especially
Goldman Sachs for getting $13 bilion from the taxpayer through AIG with the
total complicity of Paulson and Geitner. Populists advocate closing big bank accounts
putting money in community smaller banks. The politicians understand this. It will be
hard for Congressmen and even Senators to pad their banker friends' wallets so easily.
That has caused bank stocks to languish and even act like they might even breakdown.
See the key support level in the Tiger Financial Stocks' Index above. While it held,
the falling 65-day ma is clearly acting as a barrier. A penetration by Finance stocks of that
support without a further move upwards by the SPY and DIA would be bearish.
Fortunately for the banks, Geithner and Bernanke are like two knights on
a chessboard protecting each other.
17% of Americans who need and want work are still unemployed. There are 38
million Americans on food stamps and another several million without homes
who have difficulty qualifying for them. Mortgage defaults are not going away,
No doubt, the rising the stock market has prevented the big banks from failing and
given some spending cash to those who trade the market while making retirement
accounts still look like a viable long-term option. But job creation will be essential
in 2009. Democrats should appreciate the urgency of this. Obama has done little
to make the most enthusiastic of his supporters still believe in him. So, Congressional
Democrats will have to do something to dramatically reduce the unemployment.
As always, that will create winners and losers on Wall Street. So, stay tuned politically.
Can the stock market rally with a dwindling American middle class? Seems
unlikely. Presently, tech stock stocks are leading the rally. But it's not clear how many jobs
this creates, especially since many of these now go overseas. Worrisome, too,
there is nothing that I know of in the Obama stimulus program, that is designed to
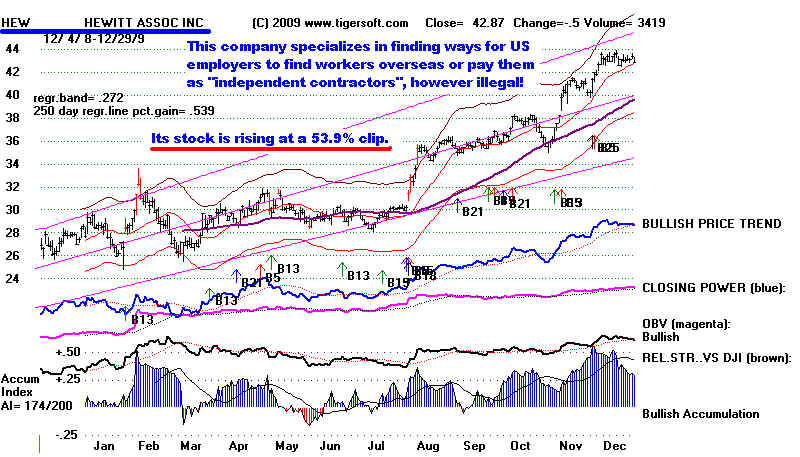
keep exisiting jobs in the US. Notice how well Hewitt is doing. HEW is a leader in the
growing field of consulting companies specializing in helping US employers
export jobs and avoid paying full wages and benefit to American workers.
Here is a recent quote about HEW from their Yahoo message board:
"During difficult economic times, should Hewitt sponsor an all-expense
paid trip to St. Thomas for their executives and sales leadership group...
including family members? It seems that Hewitt continues to struggle financially
with all the layoff that occur, but yet, find enough capital to conduct an all-expense
paid trip to St. Thomas for RF, JR, SF, KS, Sales Mgmt, HRO Mgmt, etc. How does
the rest of Hewitt feel about such a trip paid from our bonus plans? How does
the rest of Hewitt feel about such a trip knowing our fellow coworkers our being
laid off due to economic constraints while the rich enjoy their all inclusive Carribean
vacations? And ALL this while Hewitt lays off American workers and replaces
them with Indian workers. ..."Who says that companies like Hewitt will hire Americans
when there are openings? Customers are upset, the offshoring of their work has
resulted in poor quality. The constant dismissal or talented people in favor of
cheap labor will be the end. Clients will NOT renew."
( Source: http://messages.finance.yahoo.com/Stocks_%28A_to_Z%29/Stocks_H/threadview?m=tm&bn=25345&tid=3504&mid=3504&tof=8&frt=2 )
======================================================
12/28/2009
Buy B13 Continues. A Flat-Topped Breakout Seems Likely
There have been 9 flat-topped, year-end breakouts by the DJI since 1954. Each led to
superb gains in the new year. They all occurred between December 30th
and January 22nd. In the one other case, 1956, although there was no breakout
as the new year started, but it did occur in early March. With such a bullish track-record
for price patterns like we now see in the DJI and the SP-500, we have to be bullish
now. See these charts here. Our weekend studies of all stocks found many
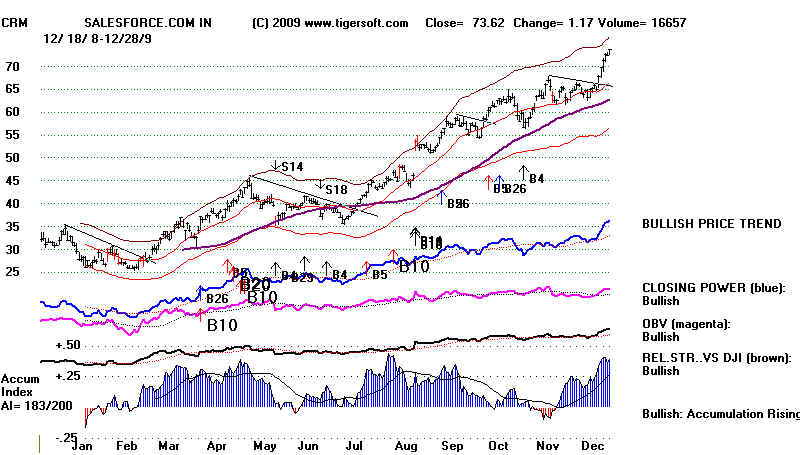
confirmed, bullish chart pattern breakouts among more speculative stocks.
Look at CRM, NOG, WDC, SRQ, HPQ and GDI for example.
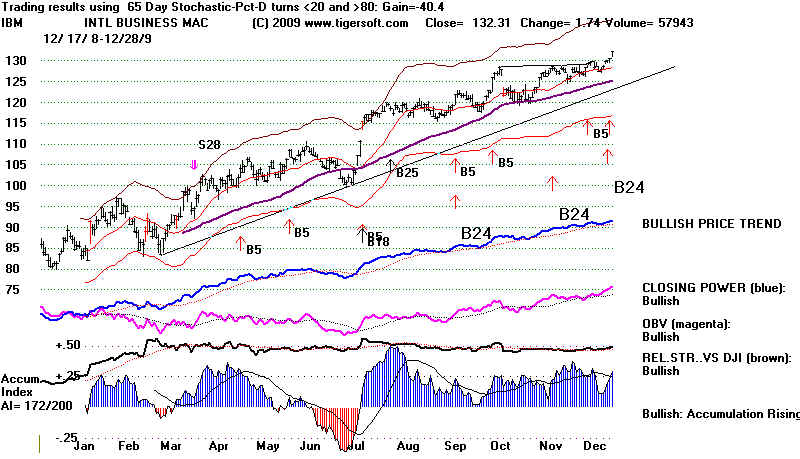
IBM's breakout is typical. But because the DJIA is calculated by simply adding the
components' prices, an advance by IBM will have more than 4.3 times the weight of
a DJI stock trading now at 30. And IBM's strength will boost tech stocks generally.
With IBM leading the DJI, the market now is somewhat reminiscent of the period 1963-1965.
The big difference, of course, is that the DJI is not now, as it was then, making all-time
highs. So, there will be a lot more over-head resistance to eat up for the other DJIA stocks.
But IBM's flat topped breakout into all-time high territory with so much prior positive
Accumulation should be exceedingly helpful to the bulls now.
Year-End Flat Resistance Breakouts:
1/2/1951 cl/ma= 1.044 roc= .639 P= 202 P ch= 18 IP21= .119 V= 354 OP= .278
1/15/1954 cl/ma= 1.017 roc= .313 P= 82 P ch= 37 IP21= .094 V= 354 OP= .278
3/6/1956 cl/ma= 1.027 roc= .349 P= 93 P ch= -11 IP21= -.008 V= 107 OP= .114
1/4/1963 cl/ma= 1.02 roc= .196 P= 30 P ch= 2 IP21= .03 V= -104 OP= .309
1/22/1964 cl/ma= 1.015 roc= .297 P= 66 P ch= 19 IP21= .026 V= -93 OP= .356
1/5/1976 cl/ma= 1.044 roc= .429 P= 201 P ch= 119 IP21= .148 V= 1 OP= .245
1/21/1985 la/ma= 1.041 21-dmaroc= .525 P= 237 Pch= 38 IP21= .097 V=8 OPct = -.097
1/5/1987 la/ma= 1.024 21-dmaroc= .149 P= -88 Pch= 73 IP21= .094 V= -13 OPct = -.115
1/12/1989 la/ma= 1.023 21-dmaroc= .454 P= 188 Pch= 21 IP21= .078 V= 11 OPct = .188
12/30/1992 la/ma= 1.074 21-dmaroc= 1.071 P= 168 Pch=50 IP21= .134 V= 15 OPct = .302
IBM's Flat-Topped Breakout into
All-Time High Territory Is Very Bullish.
--------------------------------------------------------------------------------------------------------------
12/24/2009
Buy B13 Continues
The Santa Claus rally usually lasts until the end of the year. There are
a few exceptions, but heavy profit-taking is often delayed until the
new year for tax reasons. At the same time, the inexorable window-dressing
by institutions helps push up prices for stocks in strong uptrends.
The DJI has risen 2/3 of the time looking out a week and looking out two
week. The odds drop to just a little more than 50% if we look out a month.
Since 1915, a new year has produced a pivoting significantly down
in 20 cases. It produced a strong rally in 22 cases. And in 47 cases, the
DJI did not move much up or down in the first two months. This shows
the potential that January offers. Fortunately, if there is a Peerless Sell
signal between now and the end of January, we should know that 33
of the first such sell signals were profitable when reversed by a Peerless
Buy. Only 3 of the Sell signals produced losses. Here are two new
studies showing this:
Big Market Moves That Start Early in The New Year: 1915-2009
What Happens after the First Peerless Sell Signal of The New Year: 1928-2009
Geithner has announced that Fannie Mae and Freddie Mac will get a
blank government check to guarantee home mortgages for banks. This
was announced the day before Christmas. It should keep the FInancial
stocks' rally alive up from support. That will boost the market. However,
WFC, BAC, GS and JPM are each below their falling 65-day ma and
show red Distribution and falling Closing Powers. Citi-Group has
all-bearish indications.
We will watch retail stocks this coming week to see how their Christmas
sales went. MC, V and AXP are in powerful uptrends. AXP's AI/200 score
is 171. That means it Accumulation Index has been positive 171 of 200
days. In this, it is only 1 less than IBM. HPQ is the highest AI/200 stock
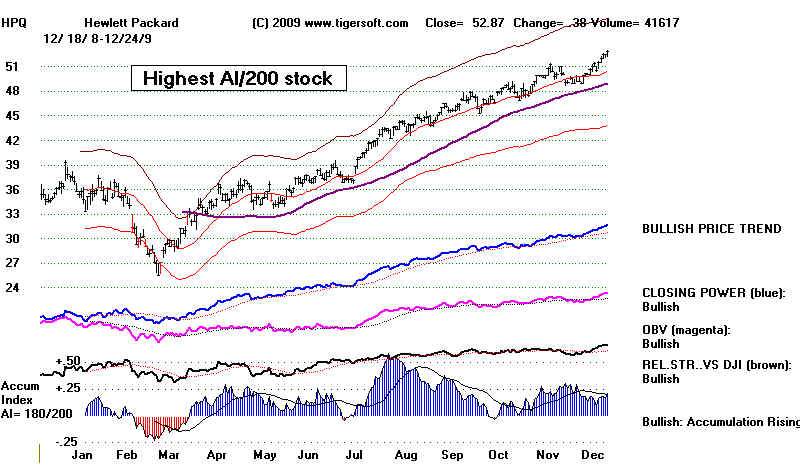
now in the DJI. In these circumstances a few years ago, it rose handily.
Gold and Crude Oil have started moving up. Geithner's announcement
puts the US in the position of backing-up $5-6 Trillion in mortgages.
That must be a big strain on the Dollar, no matter how troubled certain
EEC countries' economies and finances are. The EURO did move
up on the 24th. A renewal of it's strength will put pressure on the Dollar
and boost Gold and Crude Oil.
------------------------------------------------------------------------------------------------------------
12/22/2009
The indexes have not yet broken above their flat resistances. The QQQQ
is the closest. Watch it closely and IBM, which is within a point or two of
making its own breakout into all-time high territory. The seasonal odds
favor the rally continuing. From 1965 to 2008, the DJI rose 77% of the
time over the next two weeks. Lots of stocks are making new highs. A
good number have scored flat top breakouts above well-tested resistance
accompanied by both Opening and CLosing Power rising, confirming OBV
and relative strength, an AI/200 score over 150 and a current Accumulation
Index over +.25. These are the bullish situations we look for. Finding
these, there is no need to wait for an ETF breakout. Look at some:
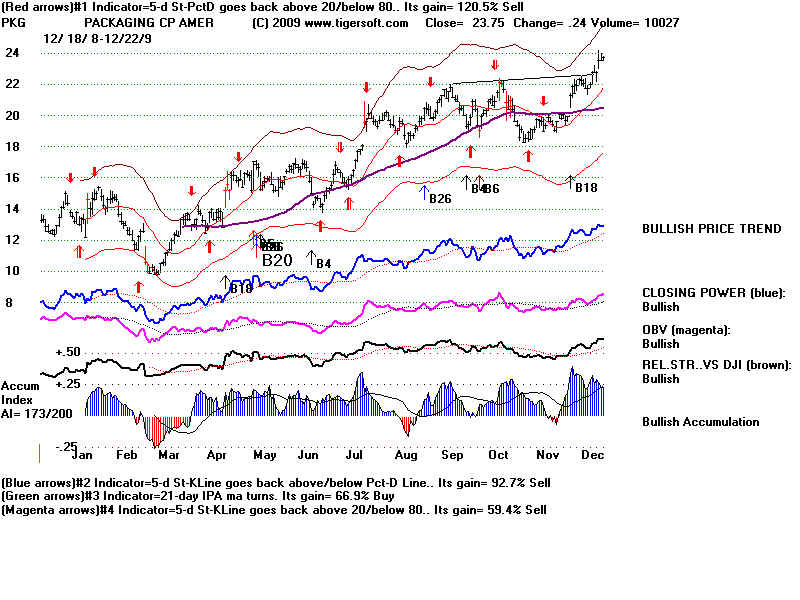
ASYS ATHR CAVM MRVL PKG PRGS SANM UIS WLP WLT
It is bullish, I think, that the market is rising without the help of Gold and Oil
and a weak Dollar to attract foreign buyers. The bullish periods from
1953-1957 and 1982-1990 saw gold and oil in decline.
See the data - Consumer Price Index Historical Data: 1913-2009
But before too long, we need to see breakouts. If there is no breakout by
the end of the year, the buyers will become discouraged, stop and the
sellers will take over. There are four cases in history that show how a
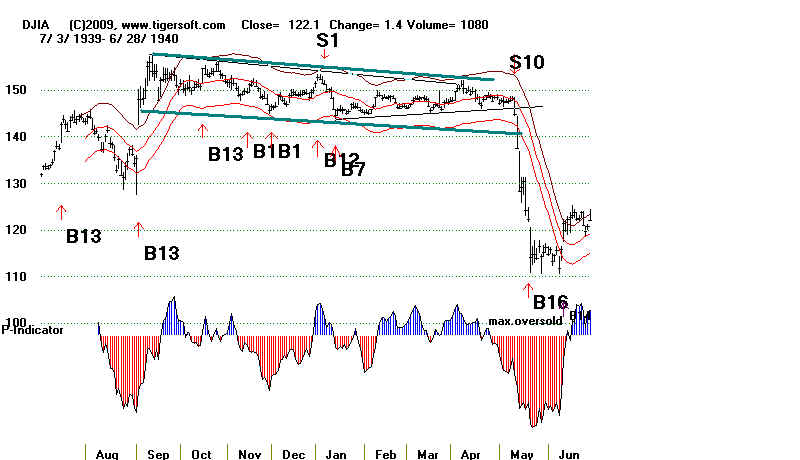
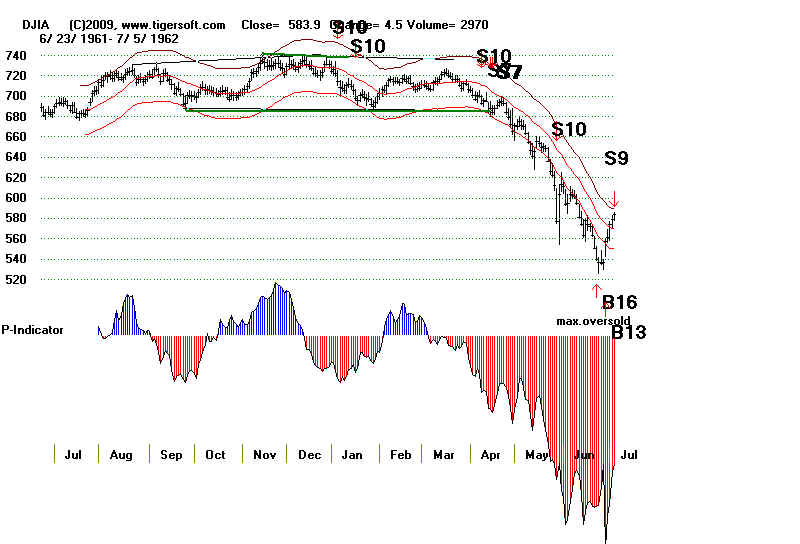
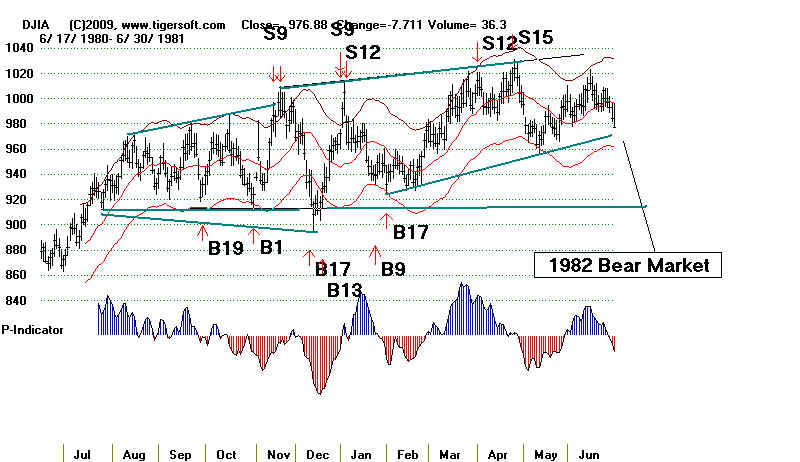
flat top in the DJI eventually becomes quite bearish. 1940, 1962, 1976
and 1980-1981. Six to nine months of sidewise action was common before
the DJI pivoted down. That's why I would guess a broader trading range
we will develop between 10000 and 11000 or, if there is no breakout, a
trading range bounded by 9500 and 10500.
Tops in 1940 1962 1976 1980-1 Are Essentially Flat
They take 6-10 months to form.
======================================================
12/18/2009 Buy B13 - Short Term Buy
We got suspicious data on Friday for the NYSE Up and Down Volume.
But that is less important than simply understanding that until the DJI
and the major ETFs breakout decisively from their flat trading ranges,
price movements for the market as a whole will be random and mostly
inconsequential fidgets. The fact that the Closing Powers are in shallow
declines now tells us to wait for a very strong or very weak close to
bring a breakout or breakdown.
If I was forced now to have to guess which way the stock market will move
next, I would have to say UP, because of the short-term Santa Claus -
Buy B13 (that we have been mentioning recently.) As the P-Indicator
and Accumulation Index are positive, there is no change in the President
in January and we are not in a severe bear market, the probabilities are
more than 90% that the DJI will be higher either at the end of the year
or on the next Peerless Sell.
The Dollar has been helped mostly by the EURO's weakness. We may
have entered a period when the DJI may be able to rise even if the Dollar
is strong. But watch the Financials. They remain the weak link in the chain.
Oppositely, watch the QQQQ. It may breakout first. IBM will probably
need to make an all-time high past 130 to send the DJI up to the top of its
channel, even if 10600 is broken above.
---------------------------------------------------------------------------------------------------------
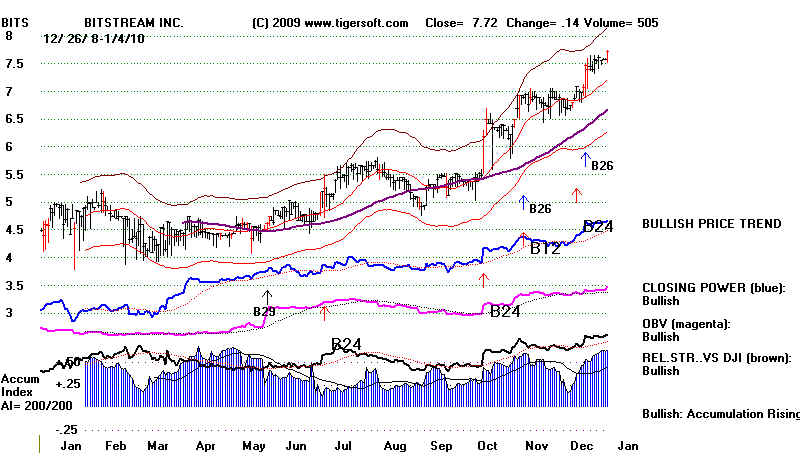
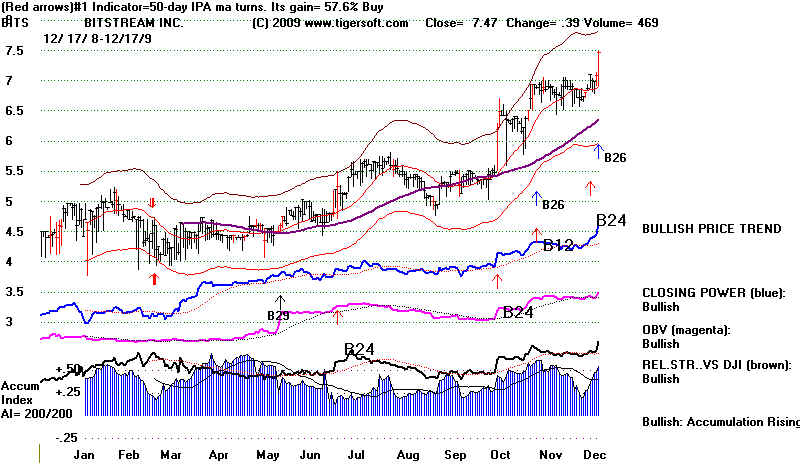
12/17/2009
Some stocks look like they will go up, no matter what the market does,
because they show so much Accumulation and because we can guess that
portfolio managers will want to show they own these stocks at the end of
the year. Look at BITS. See its wonderfully high and steadily positive
Accumulation. The AI/200 score is a perfect 200 of 200. Download high
Accumulation stocks from Tiger's data page as ACCUMLA. I would post
this as an example of what we should generally be searching for when
we are seeking little know companies that could well become "explosive
super stocks."
Today's decline brings the DJI back closer to its 65-day ma support at 10100.
The recent lows line up at about 10150. That may have to be tested because
the volume rose substantially today, sending the aggressive buying/selling
oscillator, the Tiger OBVPct into negative territory. Still positive is the P-Indicator
and the Accumulation Index. As such, that makes the probability of a profitable
Santa Claus Buy B13 quite high. This signal is not in the current verson of Peerless.
Some more tweeking is needed, using the data shown in yesterday's Hotline.
It MAY be posted for downloading at the Elite Subscribers' Page this weekend.
At this stage, my view is that the Buy B13-Santa CLaus Rally signal works
most of the time. But it does not have a significant track record in reversing
an existing Sell to a new Buy, as would be true here. But perhaps, a little
more study will show otherwise with a tweaked B13.
Buy B13s in the older Peerless occurred automatically on Decmber 17th or the
next trading day. From 1965 to 2007, buying at the close on December 17th
and selling at the close 10 trading days later would have brought a trade a profit
in 89.7% of the cases and there would have been an average gain of 2.2%.
It should be noted that for the last 3 years the Buy B13 would have brought
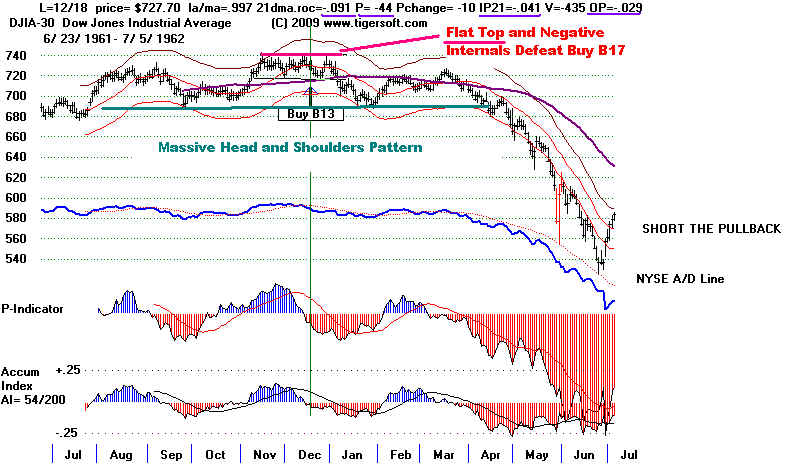
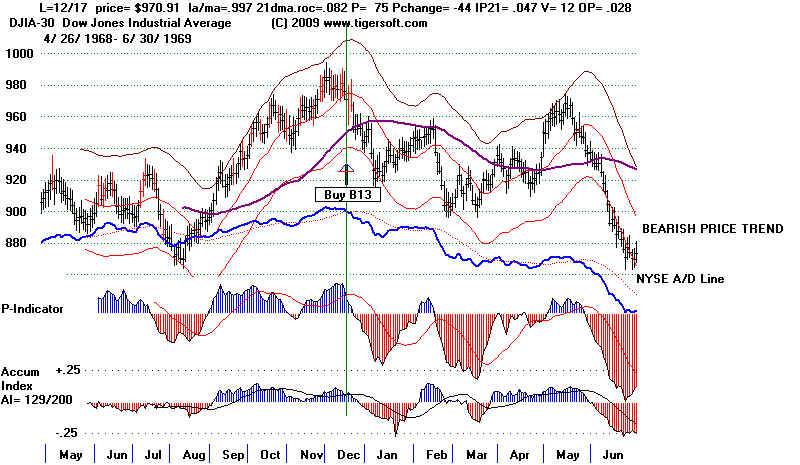
a loss. I want to say here that I am concerned about a parallel now with
Dec. 17th, 1961 (where the DJI also could not breakout above a flat resistance)
and Dec. 17th, 1968, when the DJI declined rather than rising as the new year
approached. (1968, like 2009, was period of a great boom and bubble
in low priced stocks.)
The data since 1915 show that B13 signals which have no additional qualifiers
beyond simply buying on December 17th are profitable in about 70 cases
and produce losses in only 12 cases. When a loss occurred, the DJI was more
likely to be in a bear market and/or show negative readings from the
Accumulation Index and P-Indicator. In addition, there are a number of
cases where a bearish head and shoulders pattern developed to destroy the
B13. This last consideration is important now because a break in the 10150
neckline here would make the DJIA look like a distribution top and would
resemble a head and shoulders's pattern.
My conclusion is that we can take the old Buy Buy B13 with today's closing
and consider the S12 reversed, if we understand also that a close below 10150
would introduce much more risk. There is still support at the rising
65-day ma on the DJI at 10100. But a decline below this level, even at this time of
year, would break the DJI's long uptrendline in its rising wedge pattern and
very likely bring a break in the long uptrend of the A/D Line. That could drop
the DJI another 5%. My guess now is that the DJI will be seeking a 10% wide
trading range for the next 3-6 months. That range might be 10000-11000 or
it might be 9500-10500. A bigger move seems unlikely, though historicaly
the new year tends to start a bigger move, which is not necessarily up!
Here are the charts of the failed Buy B13s since 1915.
4 Cases Where The Buy B13 Did Not Work
1940
1961
1968
2007
----------------------------------------------------------------------------------------------------------------
12/16/2009
A breakout seems likely above the flat resistance lines in the DIA, QQQQ
and SPY. The most imprtant reason for thinking so is the very bullish
seasonality of the market from December 17th thru December 31st.
Here are the statistics I am gathering now. It will be refined more in the
course of Thursday. A Peerless Signal, a Buy B13, is in the old Peerless
but needs to be added with refinements to th current version. It would
presumably reverse the Sell S12 in effect. New here is the evidence showing
that this signal is made more reliable by adding the requirements that the
P-Indicator and the Accumulation Index not be under 0 on the date of the
Buy B13. As such, a new Buy B13 tomorrow must be expected to be more
reliably bullish, because the current P-Indicator and Accumulation Index
values are clearly positive.
|
Peerless Santa Claus Rally, Buy
B13: 1928-2009 Also shown below each line are the key values for the date of the signal. They are close/21-day ma, rate of annualized change of 21-day ma P-Indicator P-Indicator daily change Current Accum. Index (IP21) V-Indicator OBV-Pct 1915-1927 Date DJI Gain/Lost if sold at end of year. ------------- ---------- --------------------------------------------------- 12/17/15 97.40 99.2 on 12/31/1915 12/17/16 98.10 95 on 12/29/1916 12/17/17 67.10 74.4 on 12/31/1917 8% gain 12/17/18 83.40 82.2 on 12/31/1918 12/17/19 107.30 107.2 on 12/31/1919 12/17/20 70.30 72 on 12/31/1920 12/17/21 80.30 80.8 on 12/31/1921 12/17/22 97.60 98.2 on 12/31/1922 12/17/23 95.30 95.5 on 12/31/1923 12/17/24 114.40 120.5 on 12/31/1924 5% gain 12/17/25 152.80 156.7 on 12/31/1925 12/17/26 160.70 157.2 on 12/31/1925 12/17/27 200.90 200.7 on 12/31/1925 ========================================== 8 gains 5 losses 1928-2009 X = B13 signal cancelled because of negative internals while DJI is above .992 of the 21-day ma. Do not use B13 is Republican replaces a Democrat and a country is at war,1972. Use as the internals the P-Indicator or Accuulation. Do not use OPct/ A very high IP21 cancels a negative P-Indicator - 1986 Date DJI Profit at time of next Peerless Sell ------------- ---------- --------------------------------------------------- 12/17/28 270.2 +.066 Reverses a lone S12. DJI then reaches 320.
.961 .034 -38 -11 -.027 -518 .044 Negative internals at lower band are OK for a Buy
12/17/29 249.6 +.002 DJI falls to 230.90 before rallying.
1.014 1.572 81 -17 .137 101 .119
12/17/30 165.6 +.031 also B6
.926 -.988 -125 22 .034 -599 -.246 Negative internals at lower band are OK for a Buy
12/17/31 73.8 +.058 B13 is able to reverse a severe decline.
.833 -4.28 -242 027 -.285 -936 -.538 Negative internals at lower band are OK for a Buy
x 12/19/32 60.1 -.136 DJI fell below lower band and then rallied to 63.8 on 1/11/33
1.002 -.554 -62 -1 -.096 -160 -.097
===== ===== ===== ===== =====
la/ma ma-roc P-Ind IP21 V-Ind. Opct
12/18/33 97.2 +.12
.974 -.215 -42 -36 -.226 -158 -.138 Negative internals at lower band are OK for a Buy
x 12/17/34 100.9 +.036
.993 .141 28 16 -.029 -7 .313
12/17/35 140.6 +.071
.98 -.472 -51 0 -.214 -303 -.01 Negative internals at lower band are OK for a Buy
x 12/17/36 180.8 +.048
.997 - .269 -54 -27 -.143 -264 -.202
x 12/17/37 124.9 +.034
1.014 -.251 -128 -7 -.131 -238 .085
x12/19/38 150.4 -.160 reached 154.90 on 1/4/39
1.009 -.191 -63 -21 -.118 -116 .05
X 12/18/39 149.2 +.014
1.005 -.16 -55 -22 -.10 -71 -.344
X 12/17/40 130.5 -.034
.993 -.461 -58 2 -.129 -95 -.158
12/17/41 109.4 +.044
.96 -.709 -76 -18 .004 -234 -.392 Negative internals at lower band are OK for a Buy
12/17/42 118.7 +.195
1.029 .434 23 40 .193 -2 .475
12/17/43 135.4 +.021
1.02 .467 69 26 .074 41 .37
12/18/44 151.5 +.083
1.019 .465 127 -22 .192 129 .477
12/17/45 190.4 +.046
.991 -.043 25 -53 .071 -34 .108
X 12/17/46 174.5 -.045 but on 2/10/47 DJI reached 183.60 and formed small H&S
1.026 .336 P=-42 9 .155 -52 .255
X 12/17/47 179.8 -.013 12/31/48 DJI = 181.20 Head and shoulders then developed.
1.0 -.04 P=-36 8 .072 -96 .088
X 12/17/48 175.9 no proximate Sell. Rally peaked on 1/7/49 with DJI at 181.20
1.004 -.014 P=-63 9 -.102 -137 -.061
12/19/49 198.2 +.086
1.019 .423 98 -26 .247 76 .167
12/18/50 231.0 >13% DJI peaked at 263.10 on 5/3/51 Next Peerless Sell was 8/3/51 @ 262.90
1.01 .109 108 32 .027 114 .156
12/17/51 265.8 +.032
1.013 .222 22 -4 .055 -41 .104
12/17/52 285.7 +.022
1.01 .472 130 -11 .174 120 .311
12/17/53 282.7 +.059
1.01 .375 43 17 .164 -18 .102
12/17/54 394.9 +.037
1.019 .468 114 4 .059 114 .255
X 12/19/55 481.8 +.02 but DJI only rallied to 488.40 on 12/30/55 and then fell back to 462,40on 1/23/56
.997 -.086 22 7 .059 -.148 -.035
X 12/17/56 493.8 > +.05 but DJI only rallied to 499.50 on 12/31/56 and then fell back to 454,80on 2/12/57
1.027 .337 P= -38 3 .059 IP21= -.002 -230 -.142
12/17/57 431.1 +.052 Here was a rare B13 at the lower band. Unusual.
.966 -.369 -27 -75 -.047 -200 .255 At lower band negative internals do not cancel B13
X 12/17/58 569.4 +.096
1.018 .043 17 -7 IP21= - .026 -203 .151
12/17/59 673.9 +.017
1.018 .679 28 -1 0 -142 .501
12/19/60 593.3 +.133
1.018 .264 51 4 .074 -72 .129
X 12/18/61 727.7 -.018 Rallied to well-tested flat resistance and then caved in.
.997 -.091 -44 -10 -.041 -435 -.029
12/17/62 645.5 +.086
1.001 .303 80 -12 .095 127 .293
X 12/17/63 766.4 > +20% Next Peerless Sell S8, 5/13/65 @ 938.9
1.023 .309 -47 11 -.012 -493 .226
12/17/64 863.6 +.087
.989 -.297 -119 5 -.138 -761 -.138 At lower band negative internals do not cancel B13
X 12/17/65 957.85 +.029
1.008 .016 18 11 -.002 6 .019
12/19/66 798.99 +.087
.995 -.252 -24 8 .027 1 -.108 (OPct by itself cannot cancel the B13)
12/18/67 881.65 +.03
1.002 .297 29 -34 .002 3 .231
12/17/68 970.91 -.036 Bear market starting THIS WOULD HAVE BROUGHT A LOSS.
.997 .082 75 -44 .047 12 .028 ELECTION YEAR B13s must be checked?
Other factors? Two years of computer stocks' bubble.
Republican taking over from a Democrat while at war.
12/17/69 769.93 +.052
.961 -1.074 -382 9 -.215 -4 -.402 At lower band, negative internals do not stop B13,
12/17/70 822.15 +.14
1.03 .923 221 13 .172 1 .532
12/17/71 873.8 +.079
1.039 .734 195 21 .07 1 .298
12/18/72 1013.25 +.034
.991 .111 -10 -55 .065 0 .102 At lower band, negative internals do not stop B13,
12/17/73 811.12 +.054
.978 -.907 -329 -5 -.099 -5 -.243 At lower band, negative internals do not stop B13
12/17/74 597.54 >40%. Next Peerless Sell on 7/1/75 @ 877.42
.992 -.986 -274 22 -.182 -3 -.098 Near lower band, negative internals do not stop B13
X 12/17/75 846.27 +.193
1.007 -.147 -111 2 -.027 -3 .074
12/17/76 979.06 +.017 Presidential Election Year - Change of Presidents.
1.019 .509 292 -28 .104 3 .276
12/19/77 807.95 -.018 This was in on-going bear market. Right shoulder in H&S.
Peak was 831.27 on 12/30/77
.981 -.345 -30 -27 -.063 -2 -.032 At lower band, negative internals do not stop B13
12/17/78 787.51 > +12% also Buy B9 - DJI rallied to 880.38 at time of next Sell.
.975 -.098 8 -91 -.007 -2 .038 At lower band, negative internals do not stop B13
12/17/79 844.62 +.024
1.021 .336 178 -14 .028 4 .159
12/17/80 928.5 +.048
.968 -.715 -272 32 -.066 -8 -.061 At lower band, negative internals do not stop B13
X 12/17/81 870.53 -.043
.994 .227 -28 -9 .03 -1 .252
X 12/17/82 928.5 +.059
.991 -.187 -38 -10 -.215 -6 -.177
12/19/83 1244.61 +.034
.985 -.063 -77 -21 -.051 -7 -.158 At lower band, negative internals do not stop B13
12/17/84 1176.79 >+15% next Peerless Sell was on 10/14/85 @ 1354.73
.991 -.294 -69 23 -.073 -5 -.099 At lower band, negative internals do not stop B13
12/17/85 1544.5 +.183
1.042 .882 176 -13 .10 14 .279
12/17/86 1918.13 +.161 Note how very positive the IP21 was. This cancels negative P-Indicator
1.004 .361 P= -99 -7 IP21= .184 -8 .107
X 12/17/87 1924.4 +.01
1.02 .014 -48 22 .085 -12 .197
12/19/88 2172.68 >+27% next Peerless Sell was on 10/4/89 @ 2771.09
1.029 .758 32 55 .234 12 .38
X 12/18/89 2697.53 .042
.995 .272 -36 -44 .073 -9 .096
12/17/90 2593.32 >+25% DJI fell to 2470.30 before rallying
next Peerless Sell was on 4/14/92 @ 3306.13
1.009 .224 56 -11 .117 4 .093
X 12/17/91 2902.28 .139
.998 -.167 -148 28 .014 -.23 -.182
12/17/92 3269.23 .11
.998 .276 121 34 .064 7 .136
12/17/93 3751.57 .058
1.011 .152 0 62 .05 -13 .348
12/19/94 3790.7 >+48% next Peerless Sell was on 2/27/96 @ 5549.21
1.015 .119 -131 18 .067 -33 OPct=-.082 (not significant)
12/18/95 5075.21 .093 next Peerless Sell was on 2/27/96 @ 5549.21
.993 .247 75 -108 .072 -11 .182
X 12/17/96 6308.33 .084
.982 -.074 P= -71 -4 .051 -37 .031
12/17/97 7957.41 .154
1.005 .39 76 -59 .019 -37 .143
12/17/98 8875.82 .075
.982 -.145 -116 22 .055 -45 .001 Near lower band, so B13 was allowed.
X 12/17/99 11257.43 .019 A simultaneous S12. Declined to 9800 3 months later.
1.014 .402 -465 50 -.041 -108 .107
X 12/18/00 10645.42 .021
1.005 -.012 60 58 -.052 -11 .009
12/17/01 9891.96 .023
.991 .024 56 26 .062 -97 - .061 (OPct not significant here,)
12/17/02 8535.39 .028
.985 -.06 142 -62 .006 -113 - .171 (OPct not significant here,)
12/17/03 10145.26 .058
1.028 .525 388 90 .048 9 .286
12/17/04 10649.52 .019
1.009 .113 220 -39 .102 -17 .212
X 12/19/05 10836.53 .068
.999 .128 172 -147 - .103 -16 -.08 If last Peerless signal was a Buy
the B13 is more likely going to be profitable.
12/18/06 12441.27 -.003
1.012 .131 234 -60 .039 234 -9 -.168 (OPct not significant here,)
X 12/17/07 13167.2 -.047 Note head and shoulders. Severe bear market follows.
.993 .051 -139 -11 -.021 -173 .227
x 12/17/08 8824.34 -.077 Peaked at 9034.69 on 1/2/2009. In severe bear market no B13s.
1.038 .773 162 102 .115 44 .237 See 1930, 1931, 1932, 1937
12/17/09 10308.26 Open
.991 -.148 140 -51 .015 -120 -.049 (OPct not significant here,)
--------------------------------------
67 up 12 down
|
===============================================================================
12/15/2009
Tomorrow the Fed makes its announcement about
interest rates. Perhaps
that will generate some interest in buying or selling. The key indexes have
seemingly stalled out. They cannot make a clear breakout or a breakdown
below the narrow range they have been in for a month. Financial stocks
may still drag the entire market down. But the Santa Claus seasonality will
be a boost until the end of the year, The DJI's decline was made worse by
selling in XOM after they announced they would buy out XTO. That Home
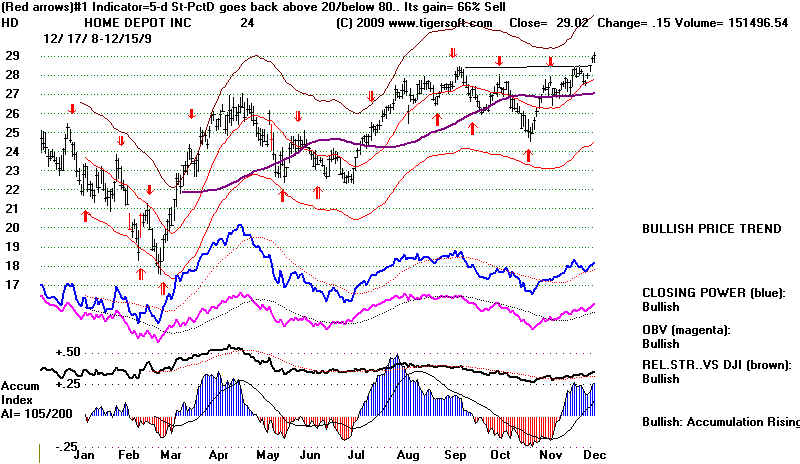
Depot made a new high today offers hope hat the FED will keep rates unchanged.
That, in turn, should allow a run to new highs by the key averages.
The charts since 1929 suggest very strongly that as long as the A/D Line
is uptrending,at its present angle and confirms the DJI's steady rise, the
market's rise will continue. Only when we see weakness from the Peerless
P-Indicator and/or the Tiger Accumulation Indexes does a serious decline
unfold. Of course, something unexpected, outside the box and very bearish
cpuld occur to spoil my optimism. But, these unusual developments seem
always to have been anticipated by someone, somehow. Even IKE's heart
attack in September 1966 took place witht he A/D Line failing to confirm
the DJI's high. It then fell 10%. My Peerless book shows that the market
. or its weakening internals somehow anticipated the the
most important events of
the 20th Century. Here are some of these occasions.
1) Wilson's entry into World War I, despite his campigning heavily
using the phrase, "He Kept Us out of War"
2) The Bolshevik Revoution in November 1917."
3) The German attack on Western Europe in April 1940.
4) The North Korean attack on South Korea in June 1950
5) The Cuban Missile Crisis in 1962.
6.) The JFK Assassination. Nov. 1963
7) The Gulf of Tonkin attack that started the War in Viet Nam. August 2, 1964
8) The 9/11 Attack on The Twin Towers and The Pentagon...
-----------------------------------------------------------------------------------------------------------
12/14/2009
The key indexes appear to be waiting for the FED to
keep rates low at this
week's meeting. Bernanke is seeking reappointment. It seems unlikely he
will change his policies, especially with the Dollar showing
some strength
and Commodities weaker, especially Gold and Oil. But the cynic in me
makes me wonder if Gold is falling because the Fed has let the word out that
they will soon be raising rates. My new Peerless history of the DJIA since
since 1915 is replete with examples of FED leaks before big moves by the
market. Let's hope Gold's decline is simply profit-taking. Bulls would not
want the DJI to reverse down from here or just after a breakout. It would
make the market's rally look very stalled out and vulnerable.
As I said last week, tech stocks are moving higher following the leadership
of IBM and HPQ. The drop in
Crude Oil prices has helped the Airlines take off.
See some examples below. Or run the Tiger Analysis again the Transportation
stocks. Buffet's purchase of Burnington-Santa Fe is boosting all the other
train stocks. They also see a brighter future if the government puts new
money into rapid rail transpoirtation.
As predicted, too, Health Insurance stocks have broken further above their nine
month price pattern's resisatnce, because the Democrats with zero leadership
from the timid and
inexperienced Obama are tying themselves up in knots over health
insurance reform, mainly because they lack the courage to take head-on the
ridiculously obstructive voting requirement of having a 2/3 majority in the
Senate.
Volume remains low. But unless the FED surprises everyone right before
the biggest year's retail period, the breakouts in the key ETFs, DIA,
SPY and
QQQQ seems very likely. And a further advance should
come if Santa's Rally
appears this year, as it does 90% of the time.
The Crude Oil price decline has provided opportunities for trading
profits in airlines issues. Tiger's Closing Power, high accumulation and bullish
looking charts are a winning combination. The Buy B21 registers the fact that
both Opening and Closing Power are rising.
-------------------------------------------------------------------------------------------------------------
12/11/2009
SELL S12 - Right now
the Sell seems to have been an aberration, where the DJI
reached the upper band for one day with the Accumulation Index negative.
The Accumulation Index and the breadth Indicators (A/D Line and P-Indicator)
are positive and rising. They are the indicators that work best year in, year out,
A price breakout is needed soon by the SPY and QQQQ. If they do not breakout
soon, though, the rally up to these levels will look like a ball that has been tossed
high in the air and then hangs there seemingly for a ,moment before turning down
and falling faster and faster. The DJI, SP-500 and QQQQ are the indexes to watch
this
week. The chart of the DIA is displayed above. The SP-500 and QQQQ are
shown here.
Watch these three ETFs.
The DIA closed at 104.92 and needs to
get past 106.
The SPY closed at 111.11 and needs to
close above 113.
The QQQQ closed at 44.13. A close
above 45 will achieve a significant breakout.
Gold and Oil declined last week despite the Dollar abd the market's strength.
The 1980s saw this pattern most of the decade. So, we should watch to
see if the pattern of the market rising when the Dollar is weak that
prevailed from March 9th until this week has ended. Or whether Gold
and Oil come roaring back. Or whether the strong Dollar will hurt the
stock market.
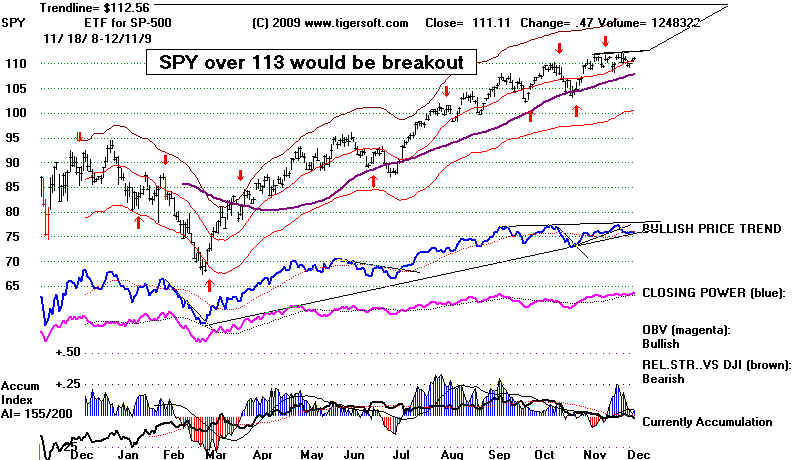
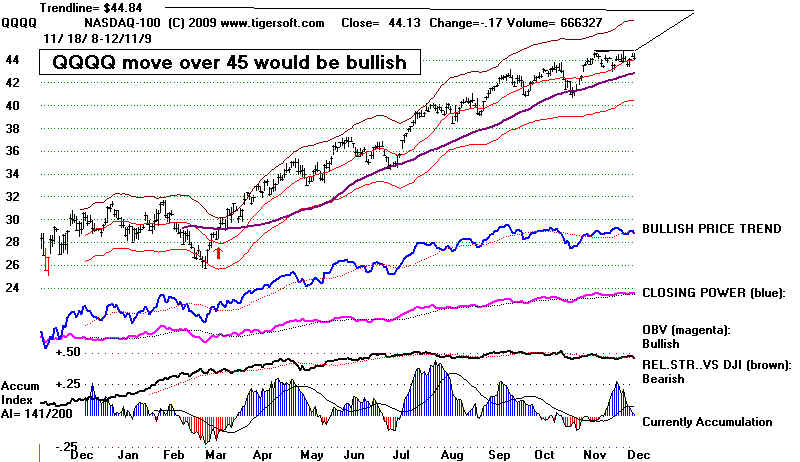
------------------------------------------------------------------------------------------------------------
12/10/2009
SELL S12 - But the
high cap averages have their sights set on making breakouts.
I would think they will make breakouts unless the financials weigh down
the DJIA and SP-500 too much. It sure seems as tough most of Congress seems
utterly unwilling to do much of anything to offend Wall Street. So, that may be what
the market needs to make a breakout. I do have to note that tax selling in some of
the strongest stocks before the end of the year may occur, but mostly I would
think it will be postponed to next year, since Congress is not planning to change
the rate of taxation on capital gains.
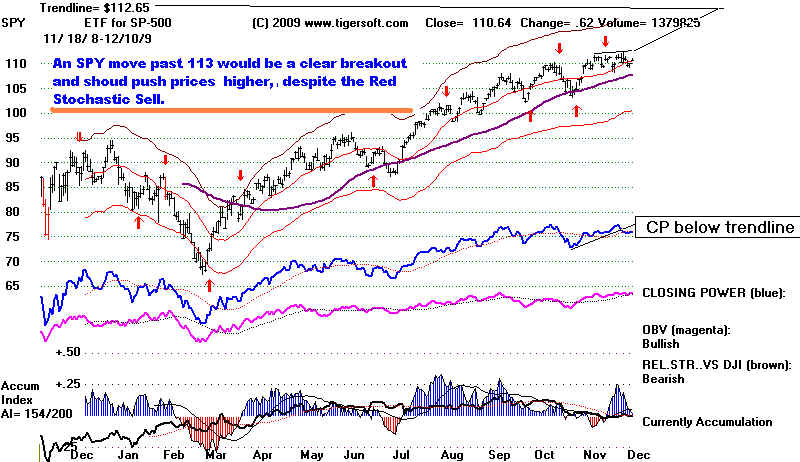
IBM moved up a point to a marginal new high and seems ready to
move much higher. See its chart in yesterday's Hotline. HPQ in the
second most accumulated stock in the DJI-30 for the past year, after IBM.
This tech strength makes the QQQQ the best index ETF to buy and
trade long. A breakout must be expected, I would say.
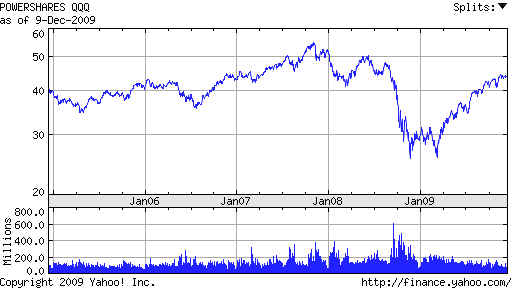 hot
hot
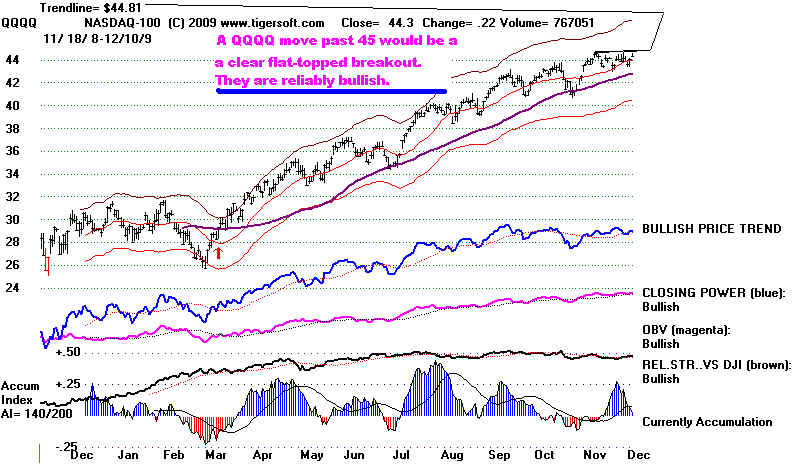
Health care and health insurance stocks like MRK, UNH and WPT made new
12 month highs today, as a result of the Senate's killing the Public Option in the
new Health Care legislation.
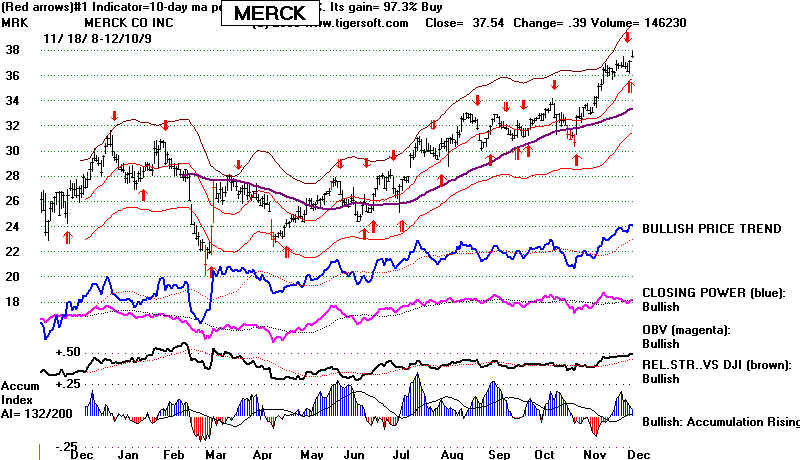
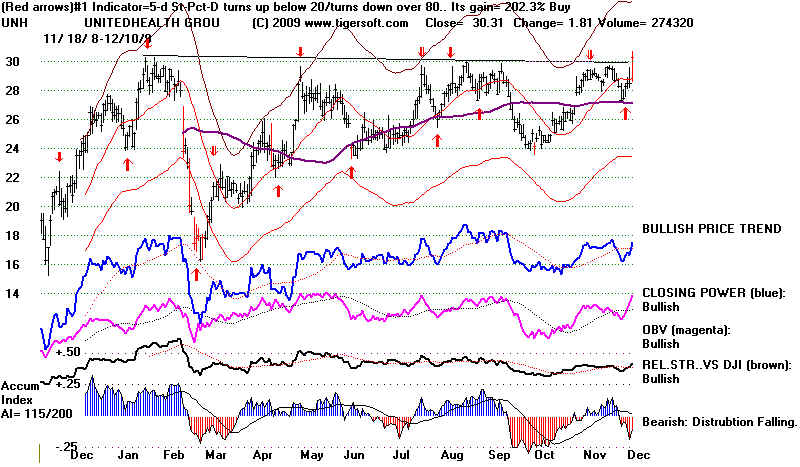
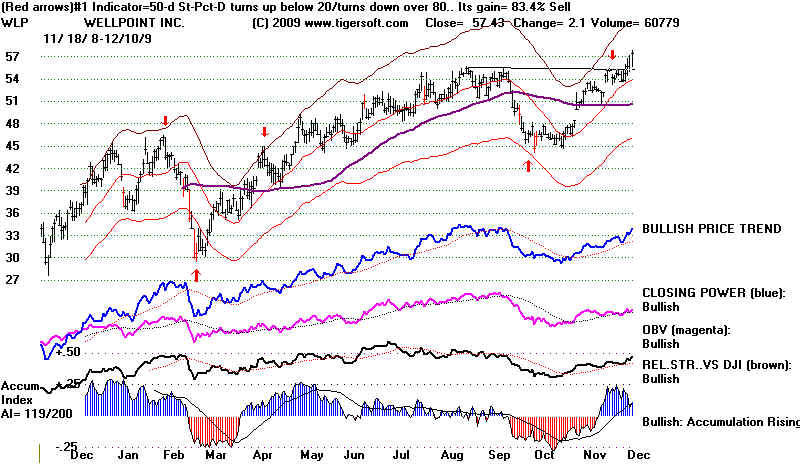
In the DJI-30, DIS and KO also made 12 month highs. If it were up to the
health
care and tech stocks in the DJI-30, breakouts by the major high cap indexes to
new highs would seem assured, given the bullish seasonality soon ahead.
But finance stocks, other than AXP, V and MA, are generally drooping
and as a group may break their support levels, as LM and WFC have already.
In the DJI-30, watch JPM and BAC. and,
of course, Goldman Sachs (GS) always.
Congress is considering what legislation is needed to regulate the Financial
Industry after the over-leveraging by banks nearly destroyed the entirety
of the world economy 15 months ago. That there still has not been a thorough
public investigation of what happened to cause the Crash makes it verydoubtful
that the root causes of the collapse will be addressed, nor will Wall Street get
much more than a token "slap on the wrist", if that. After I wrote this
last line,
I saw in Yahoo the following two links
House
scales back proposed Wall Street rules- AP
Europe
exceeds US in bank bonus crackdown- AP
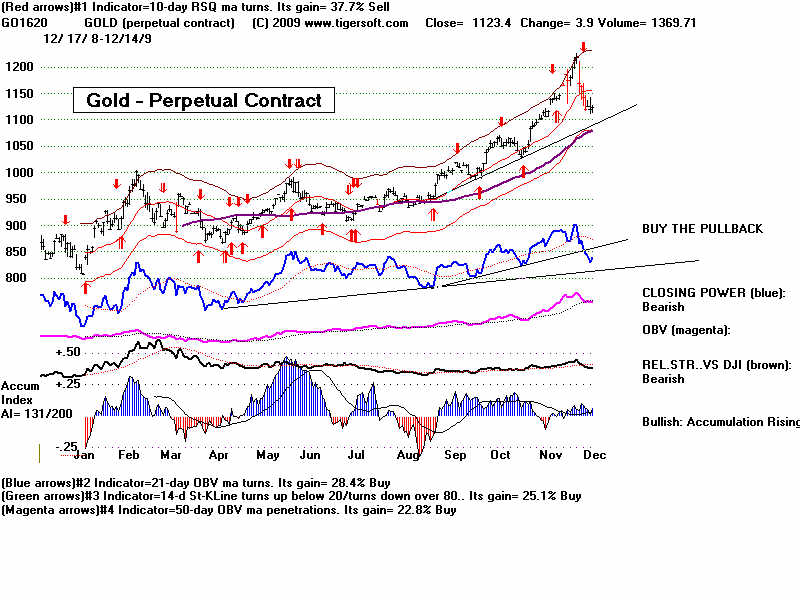
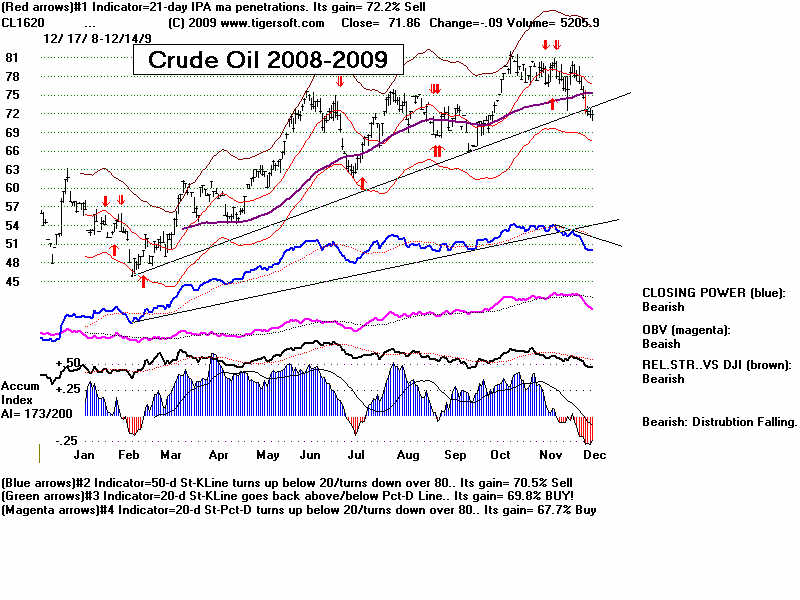
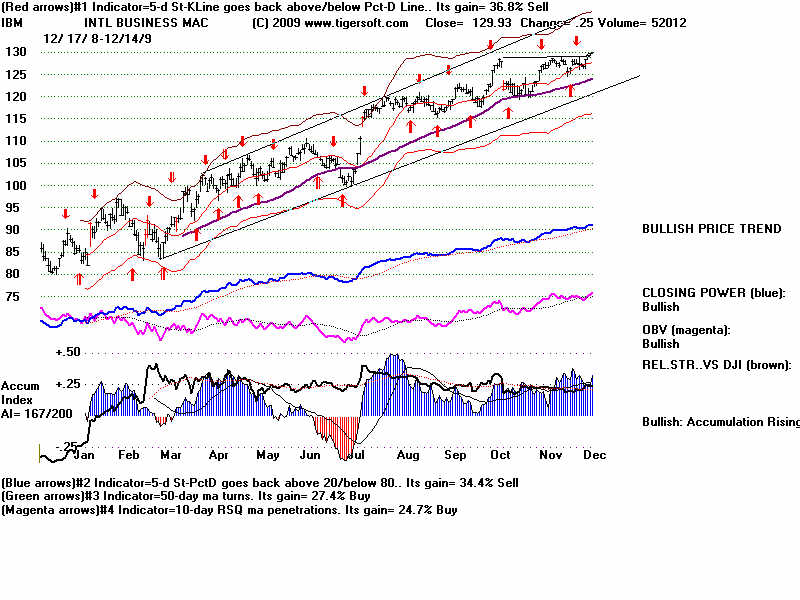
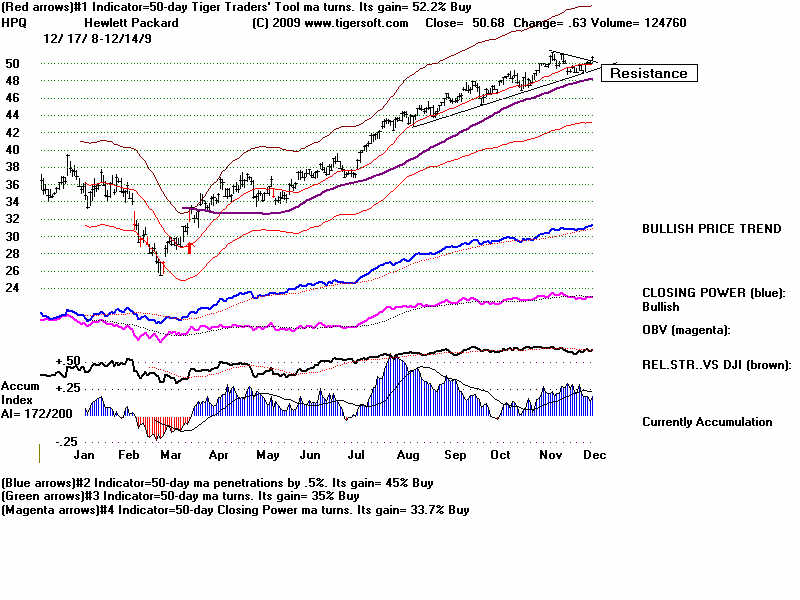
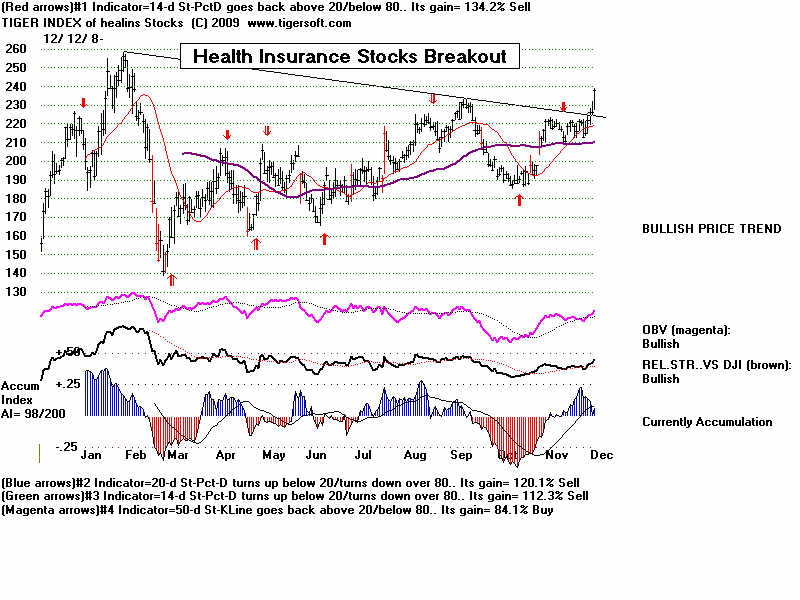
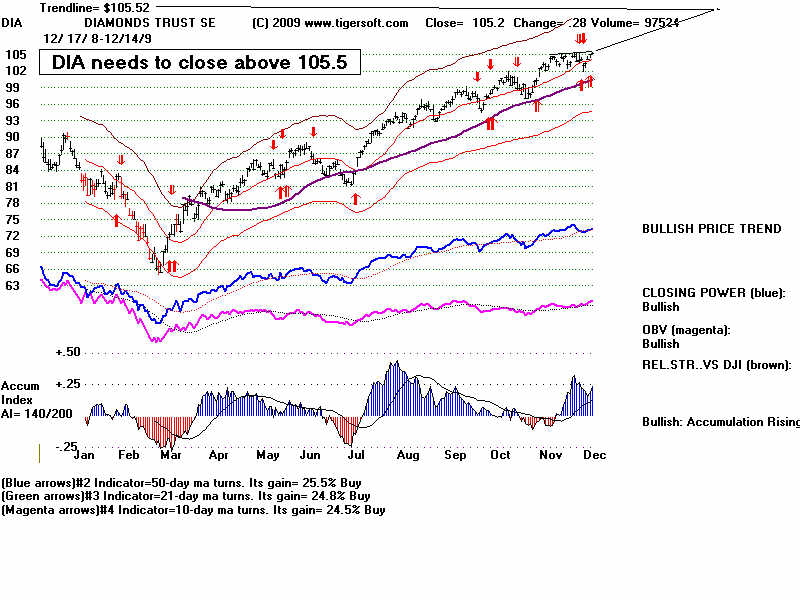
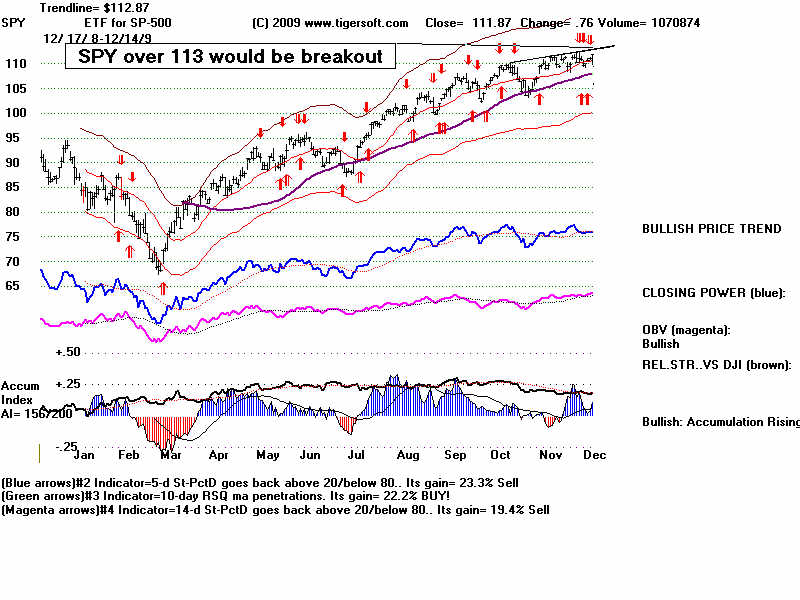
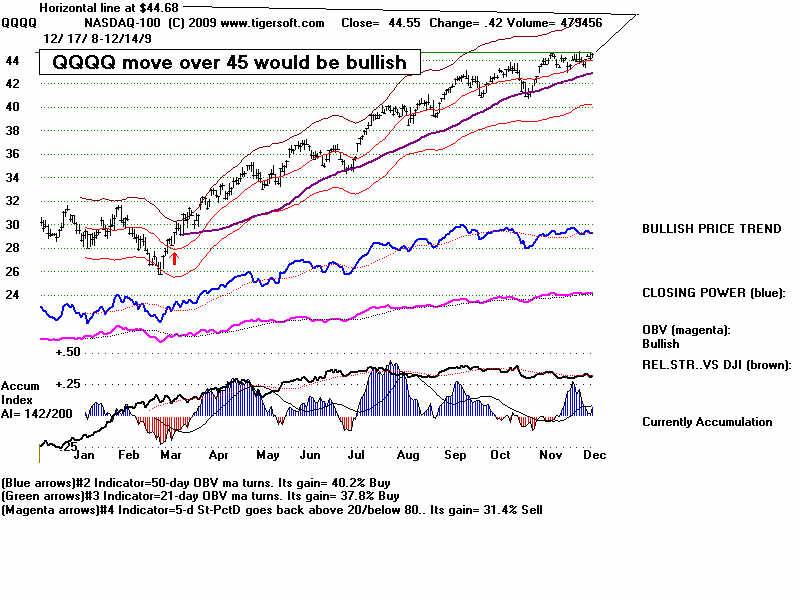
The financial regulatory "reforms" may not take shape before Congress
goes on recess. That uncertainty would be a reason to think that there will
be no breakout. On the other hand, as I said at the last Tiger User Group
meeting, one of the best ways Wall Street can get off the regulatory hook
is by having stocks go up and seemingly remove some of the memories
of last Fall's far-from-free Free-Fall decline. So, I would bet on a breakout
by high-caps.
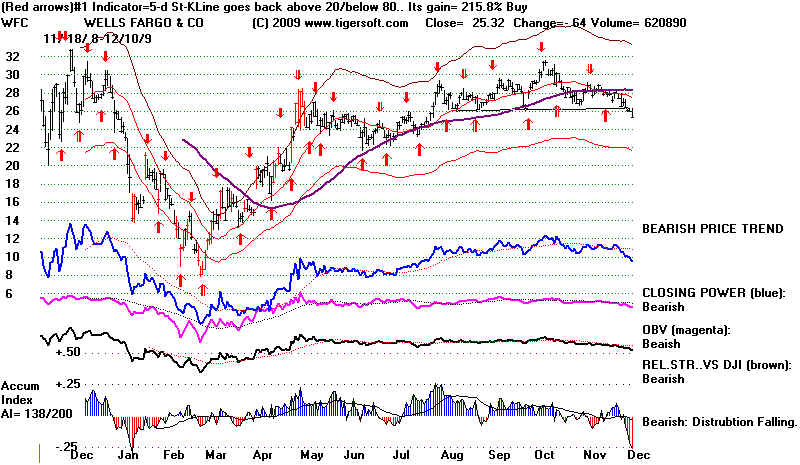
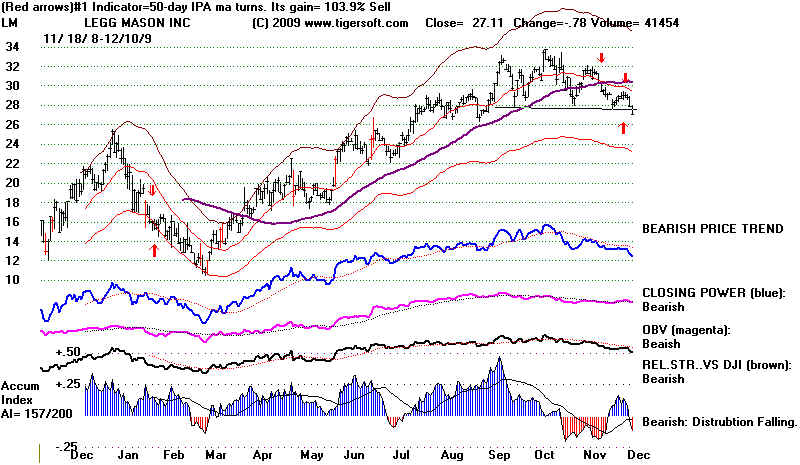
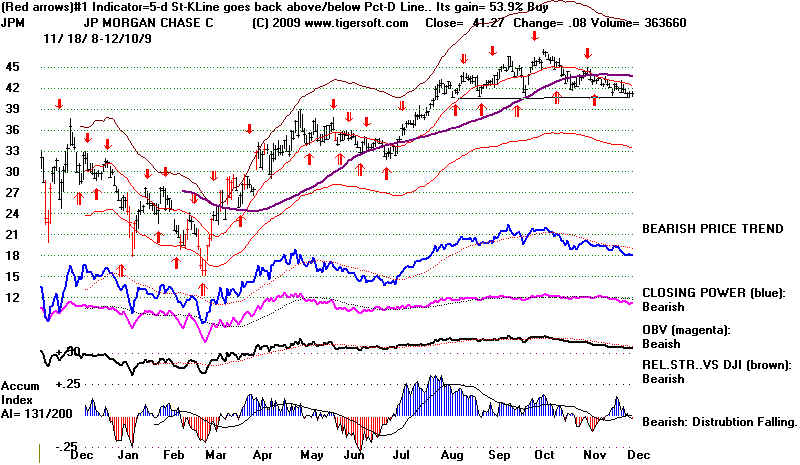
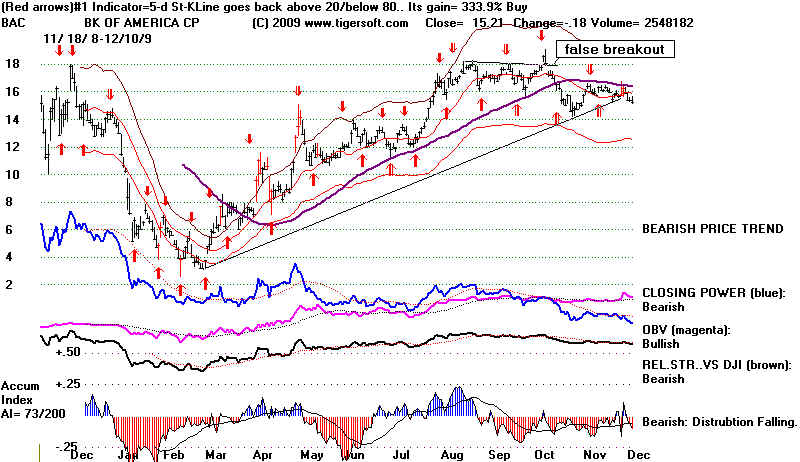
======================================================
12/9/2009
SELL S12 - But the DJI
rallied up off the 21-day ma. That was expected.
The news is should make it rally more. I realize volume has been low and
heavier on down-days AND the CLosing Power uptrends for key ETFs
and leading stocks have been violated, but I now see three news items that will
very likely boost the market, If there is no rally with this external help
and the CLose is weak, then the prediction of 10000 and the rising 65-day
ma stands. Keep in mind that after December 17th, the DJI rallies 89%
of the time until early the next year, if 1865-2007 is considered a good sample.
The next wild card will be the Congressional
bill for new Wall Street regulations.
1) Tech stocks in the DJI-30 jumped today, particularly IBM which is on the verge
of a clear and potent price breakout. I would bet now it will breakout along with
HPQ.
Both of these stocks show very high Accumulation and steeply uptrending CLosing
Power and a disbelieving public (down-trending Opening Power). Moves up by these
stocks will be a big boost for the DJI. IBM could jump 13 points based on a 10% move
past 130. Since the DJI-30 is weighted only by price, and has a divisor now of
0.125,
a 10% rise just by IBM will raise the DJI by 104 points. Such a breakout
would also lift the tech heavy QQQQ. And that index may then breakout above its
flat resistance. Our stocks' HOTLINE is long both HPQ and IBM. See these
bullish looking yearly charts at the bottom of this day's charts. You will want to
compare their rising CLosing Powers and falling Opening Powers with
GS and APPL when they began their moves up at the beginning of 2009.
The charts of these two stocks was displayed and discussed here two nights ago.
QQQQ would achieve a bullish breakout on a move past 45.
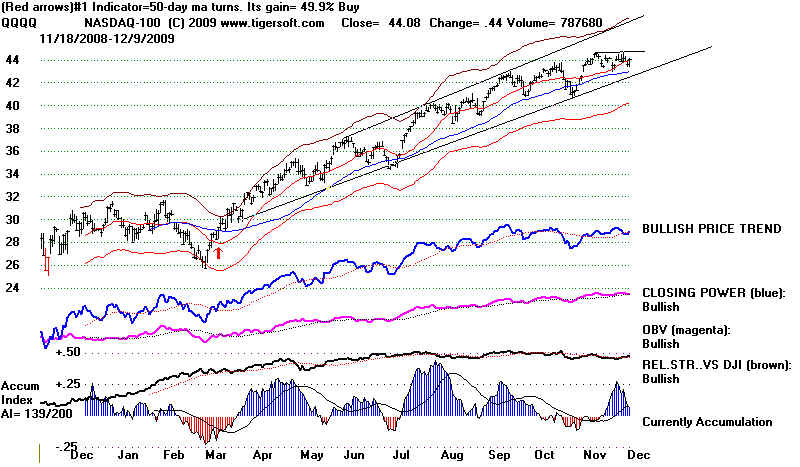
2) It looks as though Obama and the Senate Democrat's planned health bill has
now taken out the public health care option while leaving in a mandate for
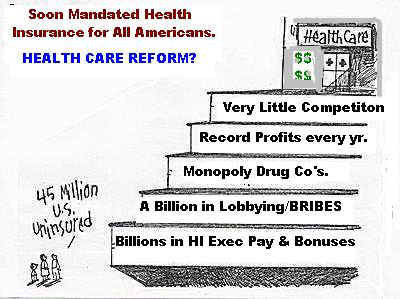
people to buy private insurance. What will stop the insurance companies
from raising prices even more? I take this as a huge victory for the private
insurance
industry. Perhaps, Congress wants to help AIG. The new bill's emergence from
the
Senate has boosted two DJI health stocks, MRK and PFE. The Tiger medical insurance
stocks' index has just broken out. The chart is shown below.
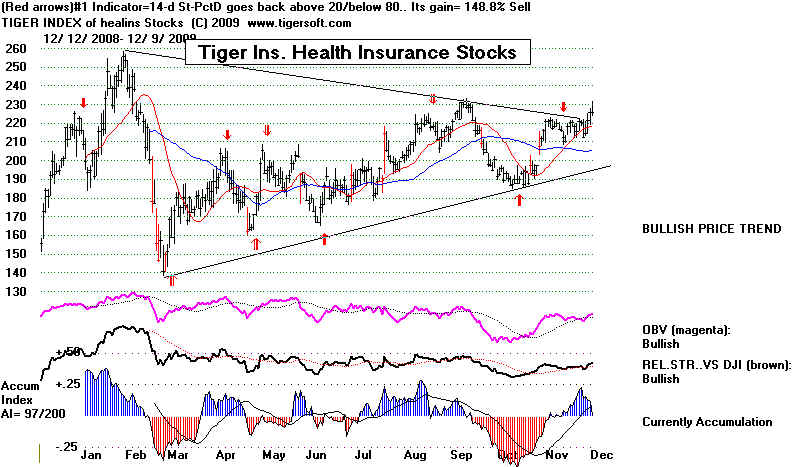
3. Geithner is now seeking the extension of TARP for banks by 6 more months.
That should help them avoid breaking below the key support in the Tiger Index
of Finance stocks below. JPM and BAC in the DJI will get a lift from this.
IBM
AND APPLE CHARTS
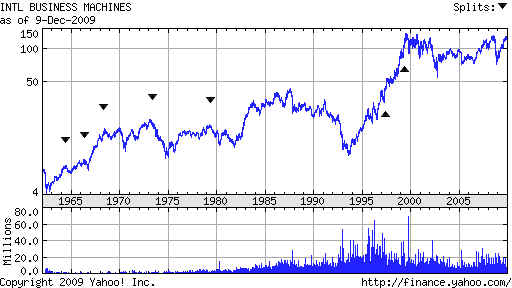
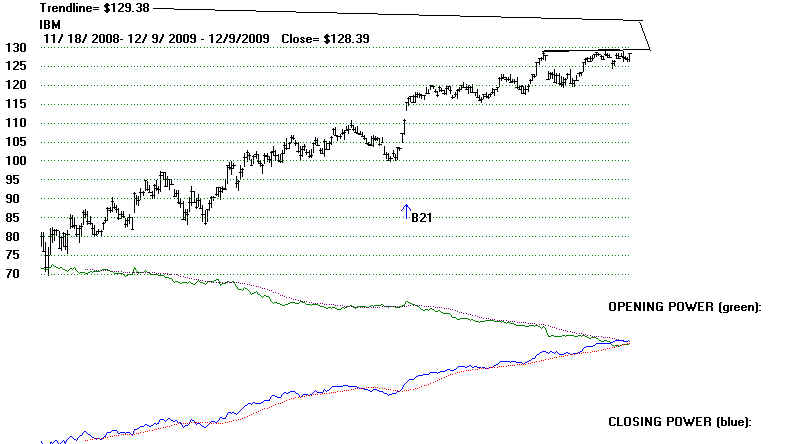
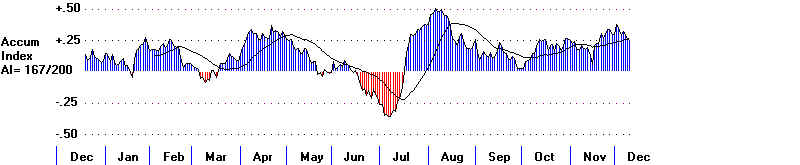
HPQ
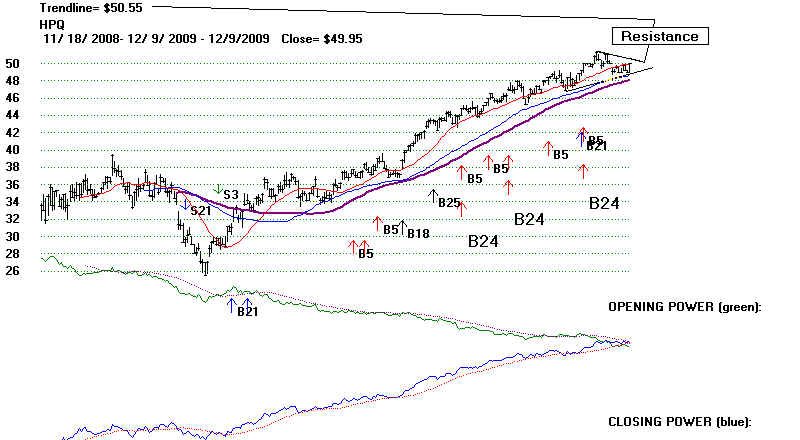
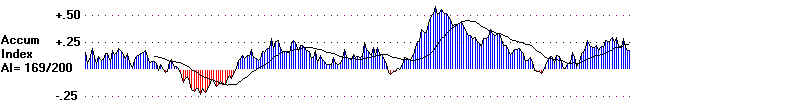
-------------------------------------------------------------------------------------------------------------
12/8/2009 SELL S12 - Watch for more weak closes. The short-term
CLosing Power uptrends have been violated. The DJI and DJIA have reached
and
slightly penetrated their 21-day ma. The annualized rate of change value
for
the 21-day ma (21-dma.roc) is +.302 and the IP21 (Current Accumulation)
is
+.164. Initial studies posted here suggest we now apply a "rule of 7".
This
rule
tells us that retreats by the DJI to this level are most likely to go lower when
the
both of these key values are BELOW +.07. So some hesitation or rebound
is
more likelynext than a further penetrationof the 21-day ma. However, with
the
Sell S12 operative, I would wait for either a pullback to the rising 65-dma.
December 17th or upside breakouts to buy.
Watch Crude Oil
I have previously said that the market now is a lot like the 1970s. But there is
one
very big difference. Crude oil prices now are not rising steeply to
promote inflation which, in turn, invites a Fed reprisal of much higher interest
rates.
Continued short-term price weakness for Crude Oil will be likely be bullish for
the
overall market, just as it was in the mid 1980s and boost the transportation
stocks I mentioned. So keep an eye on USO (the ETF) or CL1620 (Crude Oil's
Perpetual Contract.

GOLD
Gold
is apt to turn back up. I would think it will enjoy a huge exponential rise
before the whole run is over. Gold-bugs will likely hold until then, because they
have
all seen that chartt showing what it did between 1976 1980 when the
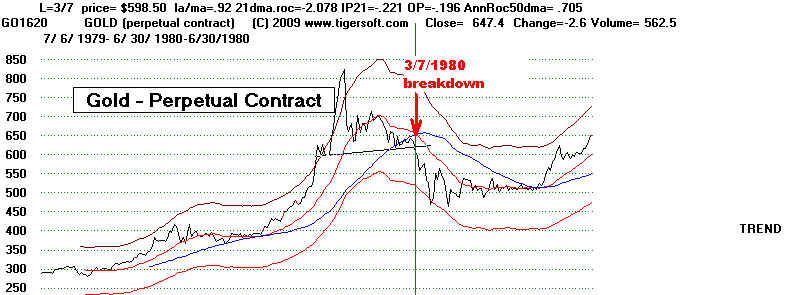

Democrat Jimmy Carter was President. I project an upside target is 1300. That
has not
been
reached. 1000 will be very strong support. That is where Gold's breakout was.
Broken resistance usually becomes support on the next decline or two.
Gold,
apart from crises that sometime send it up sharply whenever they
occur, on average peaks in January. though in weaker periods, which this is
not,
December tops are more common. In strong up-moves, it may peak later.
See Gold Seasonality
Over 30 Years
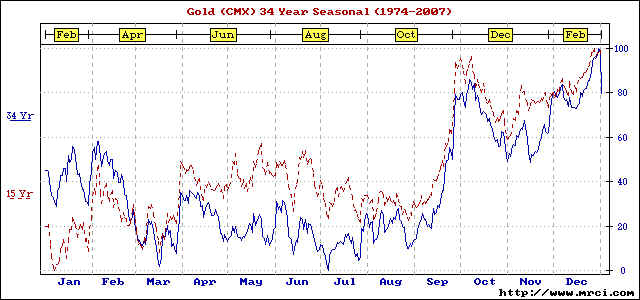
( http://www.spectrumcommodities.com/education/commodity/charts/gc.html
I certainly may be wrong, but I
would weight heavily Gold's inverted H&S pattern
and its inherent appeal because of the deficits and Bernanke's disdain for
Gold.
I believe him when he says that he will seek to keep rates near 0 until he
sees more signs of a lasting economic recovery. And that will take some time.
A Very Slow Recovery May Bring A 6 Month Trading Range with Lows
and Highs 6% from Where We Are Now. There Are Lots of Cases
of Such Trading Ranges Develping after the First Leg Up in A Bull
Market Is.
I fear wealth, as in the 1930s, is too narrowly distributed to bring a much more of
a meaningful market advance or a big urge in consumer buying beyond what results from
what the higher stock market now brings active investors. Higher retirement
accounts'
valuations are not immediately helpful. Sadly, I have serious doubts
that a real recovery can take place without the Government playing a much bigger
role in guaranteeing jobs (As, in effect, it did in World War II.). 80%
of US
workers owe too much, are either paid too little, are too under-employed or are
unemployed to be taxed much. The political aversion to taxing wealthy campaign
contributors virtually guarantees the deficits will keep rising. And Bernanke
displays open disdain for Gold when he promises rates will be kept low a lot
longer. So the gold-bugs will have no reason to sell, even though the CPI increases
will be modest.
===============================================================
12/7/2009 SELL S12 - But There May Be A Price Breakout.
Transportation Stocks
Should Lead Such A Rally if Oil Prices Fall
along with Gold while
The Dollar Rallies.
The red distribution that produced the Sell S12 has changed
to accumulation.
But Sell S12s work 2/3 of the time in
Novembers and
Decembers. So the odds still favor a DJI decline,
though it may be
postponed a few more weeks.
Perhaps, weakness in
the high priced oil stocks, CHV and XOM,
will bring that to
pass, if the Dollar rises. The Closing Power uptrends
have been violated for
the DIA, QQQQ and SPY. That also suggests
a pullback. But
because of the bullish seasonality and Bernanke's
reinterration of his
nearly zero-interest rate monetary policies, any
decline this month will
likely be shallow.
Secondary stocks have
gotten somewhat stronger. The NASDAQ's
relative strength has
turned positive, as measured by Tiger's NASDJI.
The NYSE A/D Line has
made a new recovery high. That trumps the
low volume. Will
it lead to breakouts by the DIA, SPY, QQQQ and IWM
above the nearby flat
resistance lines just above current prices? Flat
tops like the DIA, DJIA
and QQQQ show usually bring breakouts, though
not necessarily
immediately. Flat DJI resistance in 1940 and 1976 are the
only two cases since
1915 where a flat resistance area four to eight months
in the making led to a
big decline.
The market's
strength has been closely linked to the Dollar's weakness
since the March
market bottom. The Dollar is at a
point now where it may breakout
above its
downtrendline. Is that necessarily bearish for the stock market?
If it means
interest rates are going to jump up, then probably. Much of the
rally owes to
too-big-to-fail-banks buying stocks with money they have borrowed
from the Fed at
1/4%. A withdrawl of very cheap money make make banks
take profits and
stop buying.
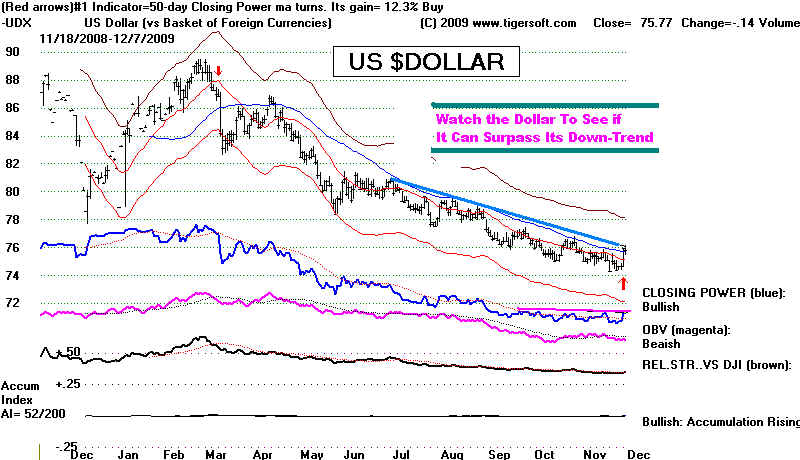
A Dollar breakout would very likely
mean coincident lower gold and oil
prices.
Could such a Dollar upside breakout actually help the stock
market in the
short-term?. As I said, since March the Dollar's weakness
has occurred with
a rising market. Dollar weakness also invites foreigners
to buy cheap US
stocks and it has aided stocks like XOM and CVX in the DJI-30.
But now we want
to think about the possibility of a disconnect between
the Dollar and
the stock market. Last night I showed here that the decline
in the first
decline in the official Unemployment rate in a recession has
historically been
bullish for the stock market over the next three months,
probably up to
the point at which it causes the FEDs to raise interest rates.
Accordingly, I think we should consider what to buy if the Dollar does
rise, "
Oil falls and the
stock market surprises us by not falling back, but breaking out to the
upside.
The answer is that a number of cyclical airlines stocks, aerospace stocks
and
transportation companies like FDX and BA in the DJI-30 should do
very well if
Crude Oil drops further and the market can breakout past
its resistance
levels. Already BA, FDX, PCP and BEAV are making new highs.
So this may be
the new leadership if Gold falters. Hot money is always
looking for new
leadership to hop aboard.
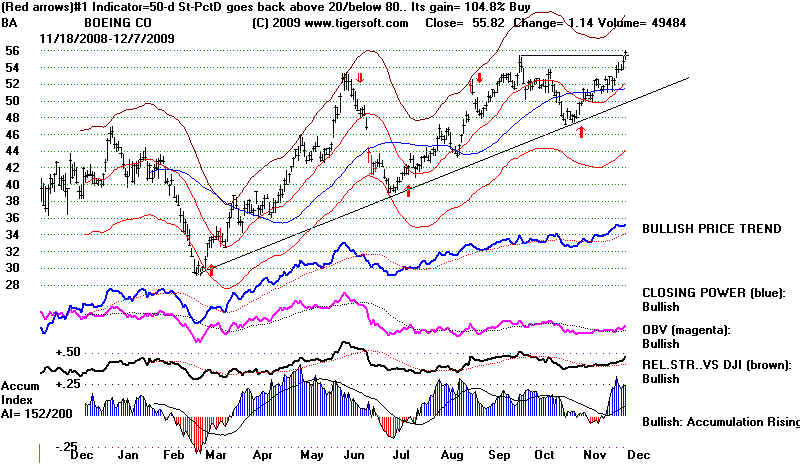
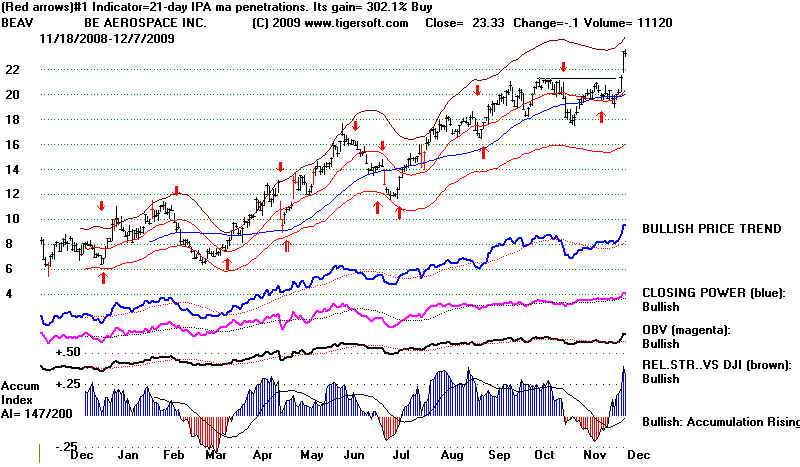
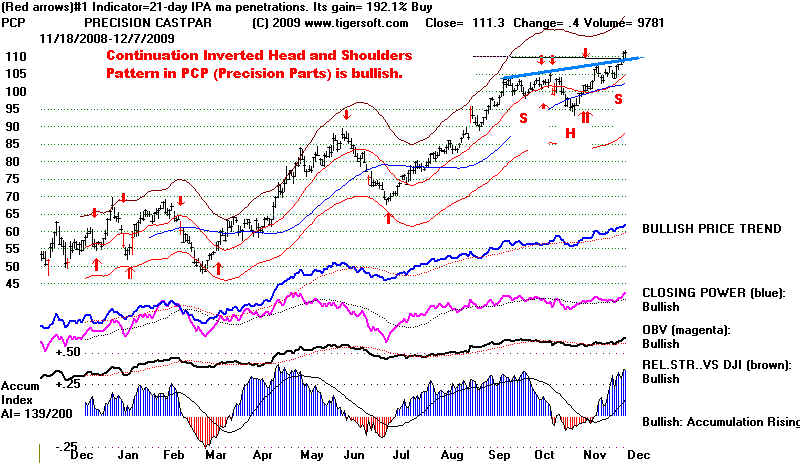
.
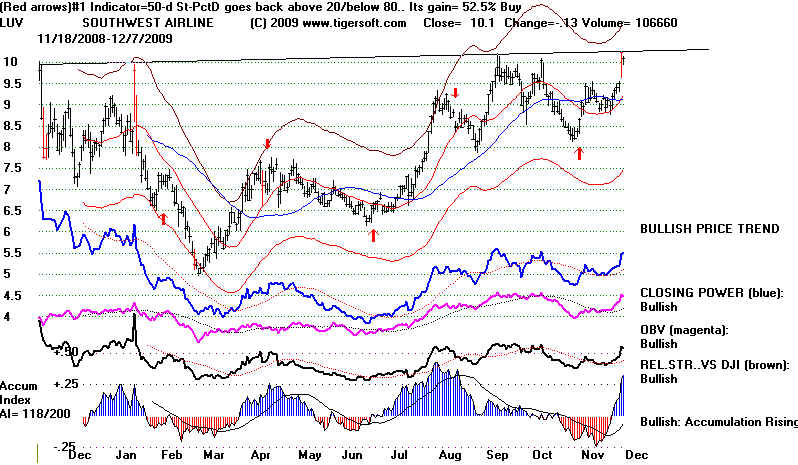
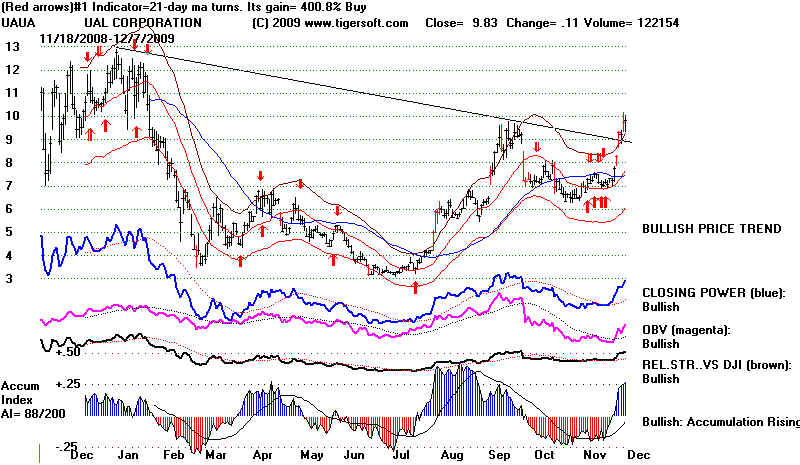
-------------------------------------------------------------------------------------------------------------
12/4/2009
SELL
S12 - A Decline To 10000 Seems Likely, followed by a Santa
Claus Rally and a Breakout Past The
FLat Tops Seen in Many of
The Averages. Watch for A
Break in The 9 month NYSE Uptrendline.
The current Sell S12 is under pressure from the bullish seasonality of
December,
the Fed's liberal
Discount Rate of 1/4%, a still rising NYSE A/D Line and now finally
a decline in the
monthly Unemployment Percentage. After December 17th, we are
apt to see a Santa
Claus rally. In the words of Merle Haggard's song, "If we make it
to December..."
17th, there should be a good breakout above the flat resistance
levels shown in the charts above. The odds of the DJI being higher two weeks after
December 17th are 90%.
But buying on December 5th and selling on December 12th,
would have been
profitable only 48.7% of the time between 1965 to 2008.
The NYSE A/D Line is still in an
uptrend barely. But a clear break in that A/D Line wouid
bearish. The 2002
expierience is a warning that such a break after the Fed has
provided very easy
credit to banks can bring a very big decline. The DJI fell more
than 2000 points in the
aftermath of that A/D Line trendbreak. This was in an
on-going bear market.
So, a clear break in the A/D Line ought to bring a DJI drop
to the lower band and
the rising 65-dma. We will be watching breadth closely next week.
Look at the chart of
the DIA just below. The flatness of the well-defined, well-tested
resistance at 105 is
very unusual. Flat tops ordinarily bring big breakout advances,
assuming volume picks
up. But there also can be a retreat back to the lower band
or well tested support
BEFORE the breakout. If we get a breakout, we want to play
the breakout. The
blue Closing Power's uptrend has just been broken. Trading these
Closing Power
trend-breaks is a great way to stay in allignment with the market's
most likely direction.
So, a short-term decline by the DJI and the other averages
is most likely.
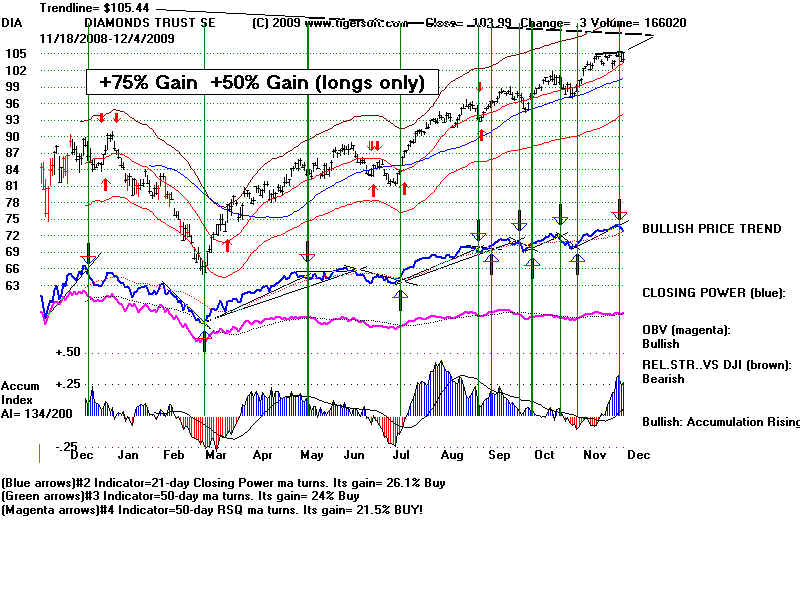
Genesis Lease Limited, an aviation company, engages in the acquisition and leasing
of commercial jet aircrafts and other aviation assets worldwide.
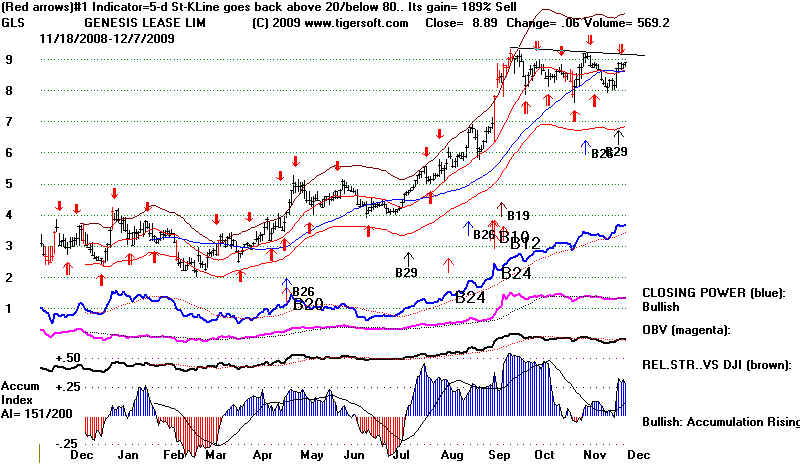
The good news is that
Unemployment fell and this is usually good for the stock market.
We have monthly
unemployment data back to 1941. If we look back at all the recessions
since World War II, we
see that this drop is reliably bullish, though the degree of bullishness
is much less in the
recessions since 1974. There have been 7 recessions. Typically
the DJI turns up 7
months before the official Unemployment Rate makes its first
monthly decline.
If we can assume that Unemployment will not make a new high over
10.2%, then the average
rise in the DJI in these 9 cases is 10% buying on the 6th
of the month when the
Unemployment Rate drop is announced and selling at the
next DJI peak before it
falls next to the lower band. Unfortunately in the 4 recessions
since 1971, the gain
doing this is only 3%. But, the DJI always rallies, though in a few
case it falls to a
point somewhat below the 21-day ma.
The market's advance
both anticipates/discounts an economic recovery and
gives investors more
buying power to fuel an econimic recovery. The problem
now is not the threat
of a big swing upwards in Interest Rates or a backing off
by the Fed and The
Obama Administration in wanting to boost the stock market.
That, after all, has
been their wager all along. The problem is in the general
consumer and investor's
buying power and whether investors will choose to
invest in US stocks
with a falling Dollar. The core problem now - that no one is
talking about - is that
wealth and income are as concentrated in the hands of the
top 10% as they were in
1929 and the DJI is now up much more over the last 25
years than it was in
1929. So, unless the average worker in the US gets a good job
and gets credit again,
there will likely be very little recovery. What jobs that are created
may go overseas.
In regards, to this, one of the leading stocks now is HEW, an
outsourcer of jobs.
So, will those smart investors that bought near the bottom
who want to not lose
their profits if a decline unfolds bearishly over-power the new
buyers pf stock who are
lured back into the market because the economy is starting
to recover a little?
These big, smart investors will try to wait until next year to sell
to postpone paying
taxes for another year. That factor will help the market now.
But the trading volume
remains low. This shows me that the average investor has
a lot less money to buy
stocks with. And looking around, he may well not be convinced
that the US economy has
a bright enough outlook to buy stocks.
The public is starting
to buy, though. Look at the uptrend in the Opening Power for the DIA.
We measure Public buying or selling trends by looking at the trends of the green
Opening Power.
Professionals are, so far, only taking light profits judging from the
still rising Closing
Power for DIA. But short-term, that uptrend may break down.
The DIA's Closing
Power's steepest uptrend-line was violated late last week.
Of more concern, would
be if more closely watched, leading stocks start to display a bearish
shift from the
combination of Professional Buying -
Public Selling (rising blue Closing
Power and falling green
Opening Power as was seen at the bottom of the market back
in March) to a pattern
of Public Buying - Professional
Selling (rising green Opening
Power and falling
blueCLosing Power). We see this now in bellwether stocks like
Goldman Sachs and
Apple. But it is the exception. Looking at the DJI-30 stocks
we see only four DJI
stocks - CAT, JPM. KFT, and TRV - that have the bearish "UD"
designation. By
comparison, 6 stocks have the bullish "DU" quality now: CSCO, DIS,
HPQ, IBM, JNJ snd
MSFT.
| Public/Overseas
Buying versus Professional Buying Below the TigerSoft charts' green lines show Opening Power. This represents Public and Overseas Buying or Selling. Below that, the blue line shows Closing Power. This represents Professional Buying or Selling. We postulate that the most bullish intermediate-situation a stock can be in is "UU" (Both Up - also shown by "B21" arrows. The most bearish intermediate-situation a stock can be in is "DD" (Both Down which is also shown by "S21" arrows. In the DJI-30, there are now no stocks having the extremely bearish designation of "DD". But bullishly there are 9 stocks with a "UU" current situation. In addition, the very bullish "UU" pattern is present for four of the most important ETFs, QQQQ, IWM, MDY and SPY. Breaks in Closing Power uptrends often mean a bursting of the "UU" bubble of broad optimism. The DIA's designation is "U?" The "?" occurs because the Closing Power is below its rising 21-day ma. Explanation I know this is a little tricky at first, but it is worth understanding. This is unique to TigerSoft. It i snot discussed elsewhere. The more bullish pattern is "DU" by our nomenclature. Here the first character displays what Openings are doing and the second character shows what Closings are doing, going "DOWN" or "UP". Our Tiger Power Ranker displays these characters in its spread sheets and we flag the "BOTHUP" and "BOTHDOWN" stocks quite fruitfully, I think. Consider the examples of GS and Apple below. See how they shift from being "DU" to "UU" (both up) to "UD". If they next shifted to "DD" they would be falling very quickly and we would likely be in a significant correction. 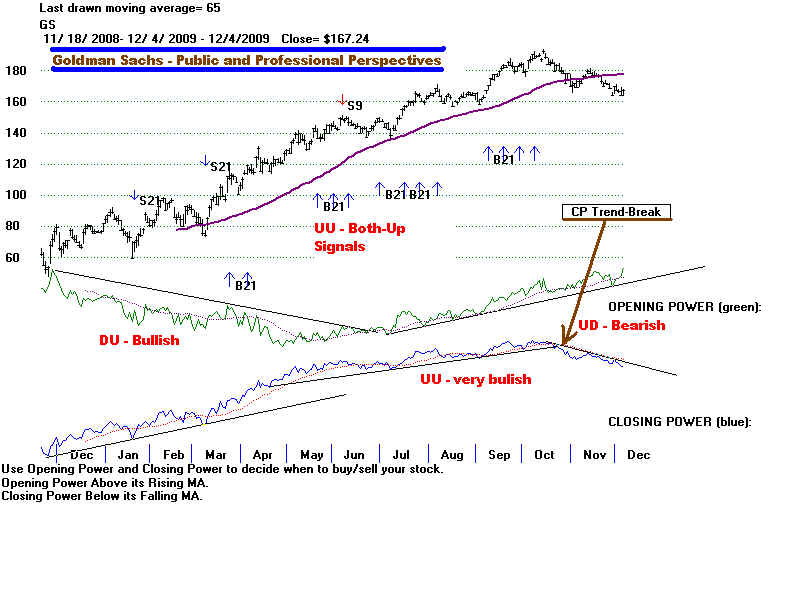 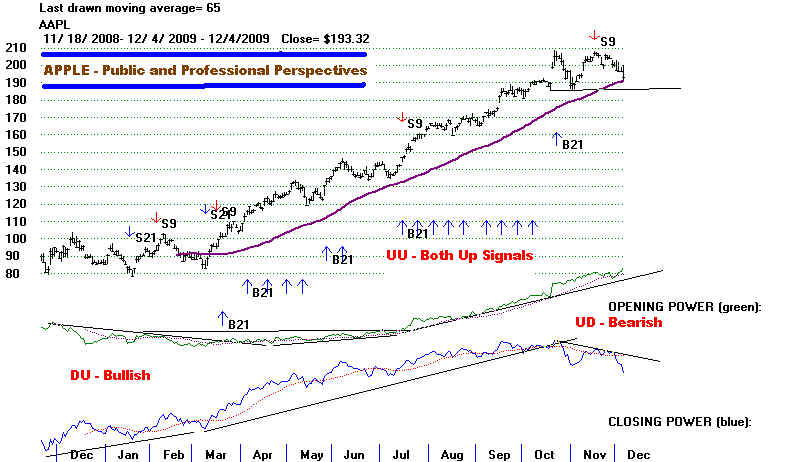 |
|
WHAT HAPPENS TO DJIA IN A
RECESSION AFTER UNEMPLOYMENT PCT FINALLT TURNS DOWN Lag between DJI DJI Bottom Unemployment Peak Trading Results if One Buys the DJIA Bottom and First Unemploment When Unemployment Drops Decline And Sells at Peak before Next Decline to The Lower Band ------------------------------------------------------------------------------------------------------------------------- 5 months June 1949 October 1949 Nov 49 Gain = 19.4% DJI rose from 191 and ralled to 228 in June 1950 ----------------------------------------------------------------------------------------------------------------------------- 12 months September 1953 September 1954 Oct 1954 Gain = 21.7% DJI rose from 345 and ralled to 420 in February 1955 ---------------------------------------------------------------------------------------------------------------------------- 12 months October 1957 July 1958 Aug 1958 Gain = 18.6% DJI rose from 506 and ralled to 600 in January 1959 ---------------------------------------------------------------------------------------------------------------------- 7 months October 1960 May 1961 June 1961 Gain = 3.1% DJI fell from 702 to 681 and ralled to 724 in August 1958 -------------------------------------------------------------------------------------------------------------------------- 7 months May 1970 December 1970 Jan 1971 Gain = 14.0% DJI rose from 837 and ralled to 950 in April 1971 --------------------------------------------------------------------------------- ------------------------------------ 6 months December 1974 May 1975 June 1975 Gain = 3.8% DJI rose from 840 and ralled to 872 in July 1975 -------------------------------------------------------------------------------------------------------------------- 4 months August 1982 December 1982 Jan. 1983 Gain = 1.0% DJI rose from 1071 and ralled to 1092 three days later It then fell to lower band and rallied from 1030 to 1250 in June 82 ------------------------------------------------------------------------------------------------------------------- 8 months November 1991 June 1992 July 1992 Gain = 3% DJI rose from 3295 and ralled to 3393 in two wks.. It then fell below lower band to 3137 in October and rallied to 3978 in Jan 93 ----------------------------------------------------------------------------------------------------------------- 9 months October 2002 June 2003 July 2003 Gain = 4.6% DJI rose from 9217 and ralled to 9645 in Aug 2003 ==================================================================== AVERAGE 7 months Gain = 10% But in last 4 cases since 1975, the gain has only been 3.2%
|
--------------------------------------------------------------------------------------------------------------
12/3/2009
The current Sell S12 may still work out. Sell
S12s often do not bring declines
immediately. See the Peerless chart for 1967 example further below. 1967 was
also
the first
year after a bear market. When S12s occur in isolation, I have suggested
that we
might want to wait for the A/D Line to breakdown clearly to view the Sell S12
"clinched". Accordingly, watch the NYSE A/D Line. My new Peerless
book makes
much of
this idea.
The key indexes are a little below flat tops. They each have improving internals.
Their
Closing Powers are in uptrends and the Accumulation Index for each is positive
and above
its 21-day ma. For the DJI, the P-Indicator remains quite positive. From
this
picture, I conclude we should BUY as trades the major ETFs if they close above
the
resistance lines shown above.
Flat resistance lines are wonderful for traders. Sell at resistance. Buy in a
breakout.
Sell and sell
short if there is a false breakout.
The Tiger/Peerless chart of the
SP-500 stocks, as opposed to the SP-500 Index
or SPY
chart is helpful now because it shows the same flat top. But more generally,
I like this
chart because the A/D Line for these stocks gives as good a representation
of the
general market's strength as any single indicator we use. The automatic and
optimized
Red Buys and Sells are most reliable when the gains for their gains for
an ETF like
the SPY or the Sp-500 stocks is more than 35%, as is true now. At the
same time,
our manuals emphasize that we do not want to fight flat topped breakouts.
So, a
breakout must be used to Buy. It should reverse the red Sell we see now.
--------------------------- TIGER COMPOSITE CHART OF SP-500 STOCKS
------------------------------------------
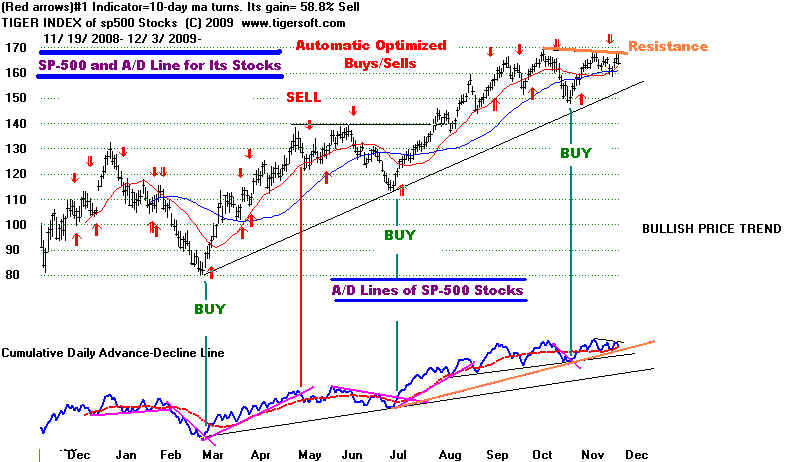
ISOLATED SELL S12s ARE SOMETIMES PREMATURE: The Case of 1967
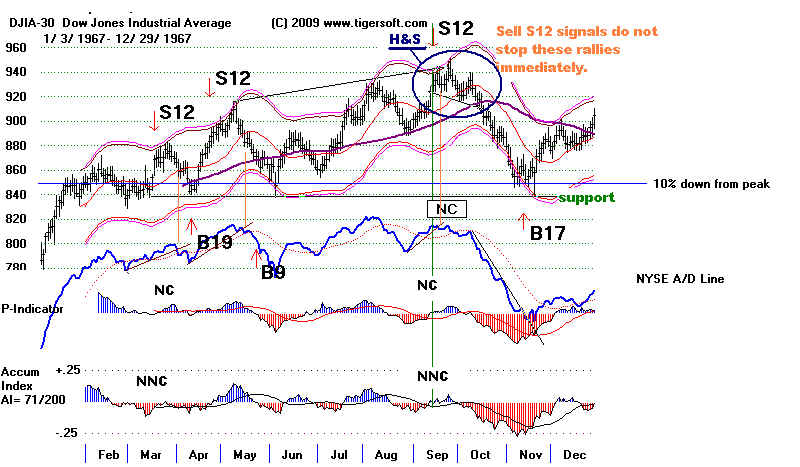
POLITICAL ECONOMY
"When
I make a mistake I have to pay for it. When banks make mistakes, I have to
pay
for it, too."
KUDOS TO REP. SENATOR BUNNING
FOR
CHALLENGING BERNANKE'S HANDLING OF HIS JOB AS FED GOVERNOR


See -
http://blogs.wsj.com/economics/2009/12/03/live-blog-bernanke-under-fire-in-the-senate/
The
Full text of Bunning's statement is here
http://blogs.wsj.com/economics/2009/12/03/bunning-statement-on-bernanke-you-are-the-definition-of-a-moral-hazard/
and I
will post it on a Blog tonight.
C-Span is superb. I listened to their broadcast of the Bernanke confirmation
hearings.
As I
listened to Bernanke, I was amazed at his refusal to acknowledge any real
responsibility in permittng the housing bubble, in not seeking to prevent the
misuse of leverage by the biggest banks and their misrepresentation of the risks in
in
the bundled mortgages they sold. I was struck by his lies. In particular, he
pretended
that
it was not a bailout to allow Wells Fargo or Bank of America, for example, to use
as
collateral at the Fed's Dicount Window their most dubious "toxic" housing and
consumer mortgages and loans.
BERNANKE'S PREDICTIONS ARE ALWAYS WRONG
At one point, Senator Jim DeMint of SC read for 3 minutes a series of quotes from Bernanke
from
2005 to 2008 where he denied there were dangers ahead for the economy or particular
banks. Why would Obama reappoint and the Senate confirm as Fed Governor some
who
has such a terrible record.
March 28, 2007:
“The
impact on the broader economy and financial markets of the problems in the
subprime markets seems likely to be contained.”
May 17, 2007:
“We do not
expect significant spillovers from the subprime market to the rest of the
economy or
to the financial system.”
Feb. 28, 2008, on the potential for bank failures:
“Among the largest banks, the capital ratios remain good and I don’t expect any
serious problems of that sort among the large, internationally active banks that make
up a very substantial part of our banking system.”
June 9, 2008: “The risk that the economy has entered a substantial downturn
appears to have diminished over the past month or so.”
July 16, 2008: Fannie Mae and Freddie Mac are “adequately capitalized”
and “in no danger of failing.”
"Currently, we don’t think it will get to 10 percent. Our current number is
somewhere
in the 9s"
(These were read into the record by Rep Senator Jim DeMint of SC. They also appear
in
http://www.amconmag.com/article/2009/sep/01/00012/
)
--------------------------- TIGER COMPOSITE CHART OF SP-500 STOCKS
------------------------------------------
---------------------------------------------------------------------------------------------------------------
12/2/2009
The SELL S12 is the last Peerless automatic signal.
But we know see
gathering strength just below clear points of breakout for the DIA, DJIA,
QQQQ and even the IWM. I can find cases of isolated Sell S12s where
the NYSE A/D Line made a new 12 month high before a Peerless Buy or
a pullback to the rising 65-dma. Still, I would close out the short positions
if the breakouts above resistance (as mentioned above) occur. Similarly,
I would close out short sales that get above the apex of their right shoulders
if they have head and shoulders pattern. Our Stocks' Hotline would also
use clear breaks in down-trending Closing Power trends to cover stocks we
are short.
While volume is low and there is no assurance that the markets are not
being manipulated higher by the big banks' trading programs in collusion
with the FED, our research shows that breadth trumps low volume. Remember
that the NYSE A/D Line made a series of 12 months highs long before the DJIA
did. As long as the NYSE A/D Line uptrend continues, this is quite bullish.
When looking for stocks to buy at this stage, use:
1) the Explosive Stocks precepts: augmented B12s and B24s with very positive
current Accumulation (IP21>.35) and OBV and CLosing Power making new highs.
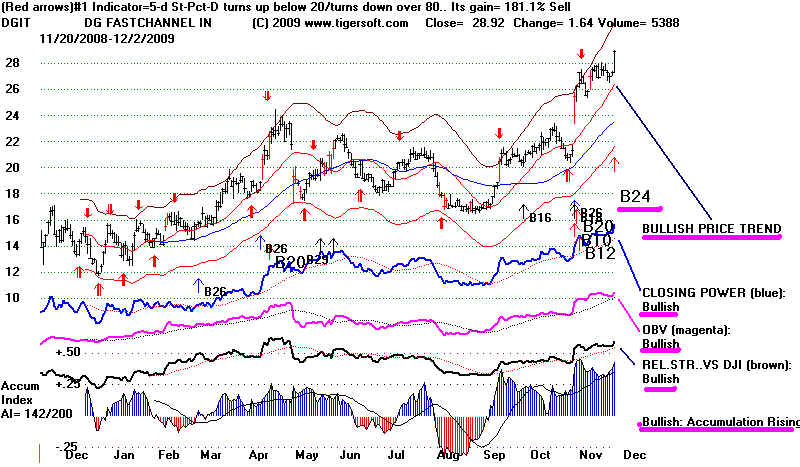
2) Stock making breakouts above flat tops where there has been steady and
very high Accumulation. ELP, EWZ and SIRO are examples tonight.
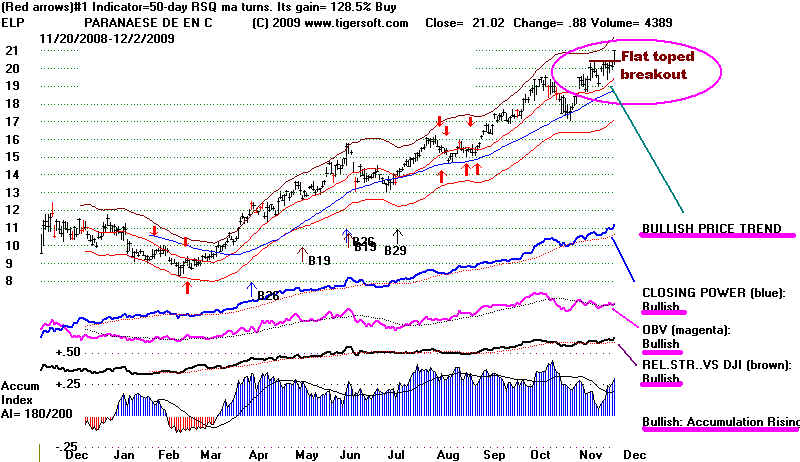
3) At this time, traders should look for stocks whose Opening and CLosing Powers
are rising. This means they are above rising 21-day mvg.avgs. Stocks
that
are "BOTHUP" usually make the best short-term buys. Buy them soon after
the first Buy B21s, on retreats to their 50-dma or on breakouts above flat tops.
BOTHUP stocks open higher and then go up still more by the close. The perpetual
contract for COMEX GOLD shows how helpful is watching for this "BOTHUP"
condition.
You can see these two indicators at once by placing a chart on the screen and
then picking the first item under Indic-3. We also find and flag these stocks
abd commoddities. Presently, Copper shows a
Bullish condition in additon to
showing a powerful uptrend. So does Orange Juice, Silver
and Platinum.
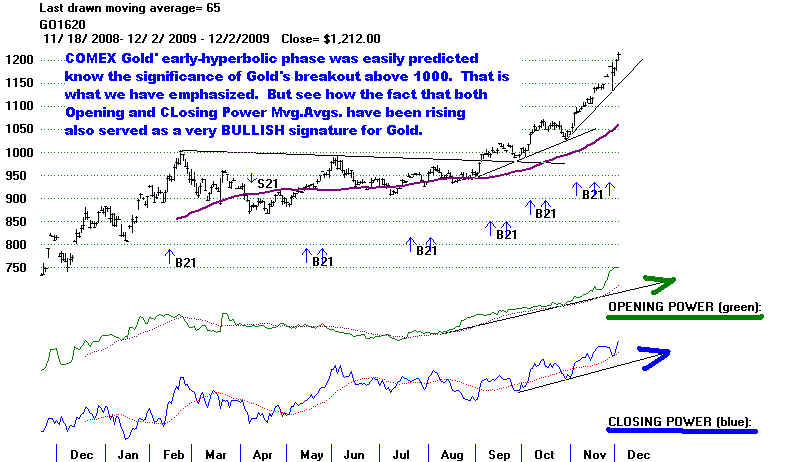
----------------------------------------------------------------------------------------------------------------
12/1/2009
A SELL S12 is the last Peerless automatic signal. If the DI fails to
follow
gold upwards tomorrow, that will show the price channel is still operative.
A retreat back to 10000 is still possible, though I suspect we will have to
wait for that until early next year. The FED is determined to boost retail
sales and the weakness of the Dollar makes US stocks seem attractive
as a hedge against inflation. Professionals in the US are scrambling to
take positions now that the DJI is above 10000 and the train seems to
be leaving the station. Respect how positive are the upward momentum and
internal strength indicators for the DJI. Our new book will explore similar very
positive upward momentum and internal strength readings in the very bullish
past years of 1954, 1958, 1964, 1965, 1985, 1995 and 1996.
I have noted that the Accumulation Indexes turning very positive makes
us postpone the bearishness of the Sell S12 for 4-6 weeks and 2% to 4%.
A NASDAQ new high would be bullish. New highs with current Accumulation
readings above +.25 and rising CLosing Power for IWM and QQQQ would
have to be played on the long side. See the NASDAQ's chart above.
Accordingly, despite the Sell S12, we have limited our selling to a handful
of stocks with weak head and shoulders patterns. A movement by any of
these above the apex of their right shoulder would cause us to cover them.
The same is true for IWM, which we are short in our Stocks' Hotline.
Above you will see how weak-looking Finance stocks and many low-priced stocks
are, while the QQQQ and DIA show very strong internals.
We remain long on Gold, Gold stocks, high caps like IBM and HPQ that
show very high levels of Accumulation and some other high Accumulation
stocks.
The very weak Dollar continues to send Gold to new highs. We are very bullish
about gold for the reasons stated previously and repeated last night. I should have
added that it has been reported in the last few days that the Chinese Government,
India and Germany will increase their buying of Gold to shore up their reserves.
At this hour it is up another $12/ounce. The Tiger Index of Chinese Stocks
scored a powerful breakout on this news. CAAS (China Automotive)
has already broken out. I would look for Trina Solar (TSL - 47.44) and BIDU
(436.55)
to make similar breakout runs. The Brazil ETF, EWZ, should be bought by
traders on a breakout, I believe. That could come tomorrow.
.
Tiger Index of Chinese Stocks
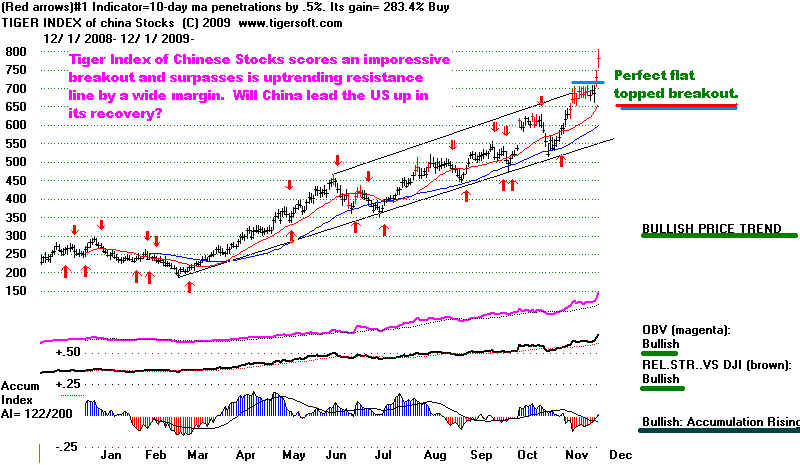
Leading Chinese Intermet Stock - BAIDU
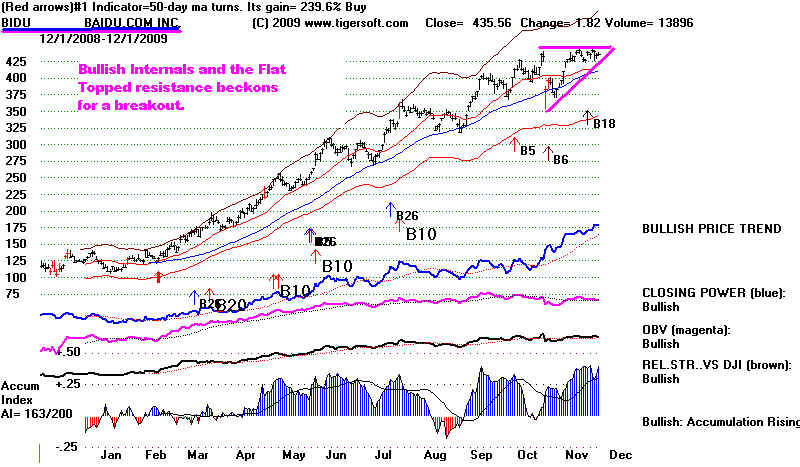
Chinese Solar Stock - TSL
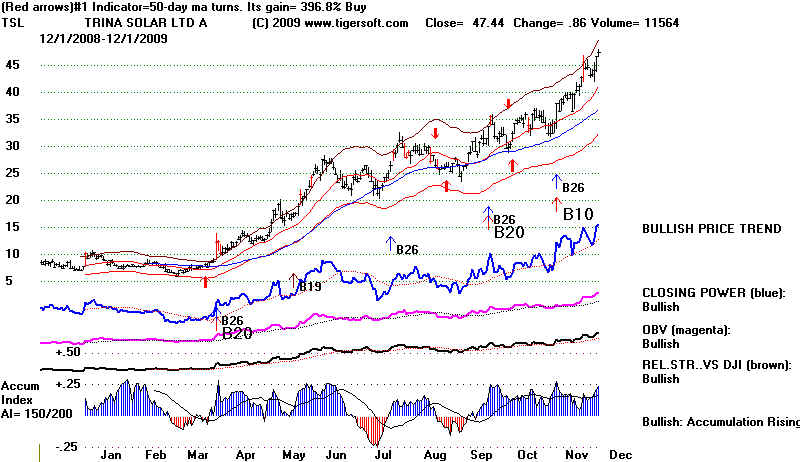
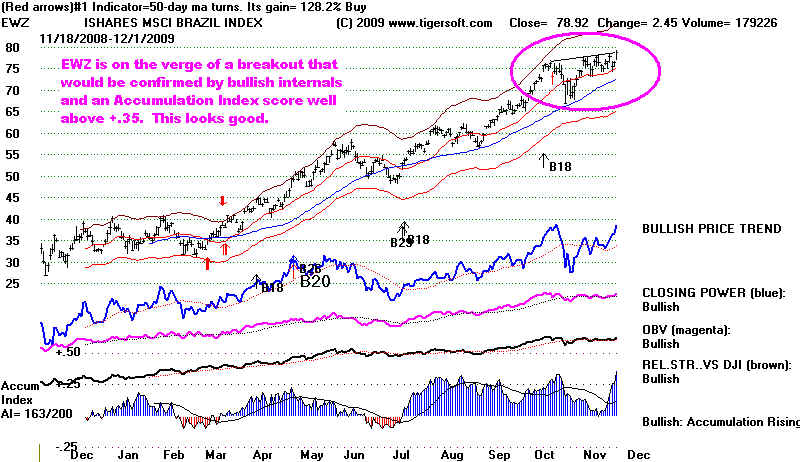
-----------------------------------------------------------------------------------------------------------------
11/30/2009
SELL S12. 8-Month NYSE A/D Line Up-Trend Line
Was Slightly Broken Friday.
But a more
decisive break is needed. Seasonality is bullish as the FED tries to
encourage holiday
retail sales. As often happens after an extended advance, we
see professionals
taking profits in speculative stocks and driving up high capitalization
stocks that are
doing well. This lifts the DJI, SPY and also the QQQQ. The rising
Closing Powers
for the DIA, QQQQ and SPY reflect this. Meanwhile the broader
NASDAQ,
Russell-2000, Finance Stocks and Low Priced stocks are much weaker.
All in all, as the Dollar drops, high cap stocks are a natural place to put Dollars.
These
multinational companies have lots of ways to turn a falling Dollar to their
advantage.
Many smaller companies will be squeezed by rising costs and
falling
sales. Those are the stocks we are short. That is why they look so
weak.
We will remain short the Russell-2000 a little longer as a hedge because of the
Peerless Sell
S12. We are long high capitalization, gold and gold stocks plus a few
very high
accumulation special situations. The stocks we have shorted on our
Stocks' Hotline
now show bearish head and shoulders patterns and negative
readings from the
Accumulation Index. Below you can see these stocks' chart
as group.
My guess is that if you study these companies, you will see that many
import heavily,
so that the falling Dollar increases their costs and they sell more
domestically in a
very financially subdued market. (Someone else can see if this
true.)
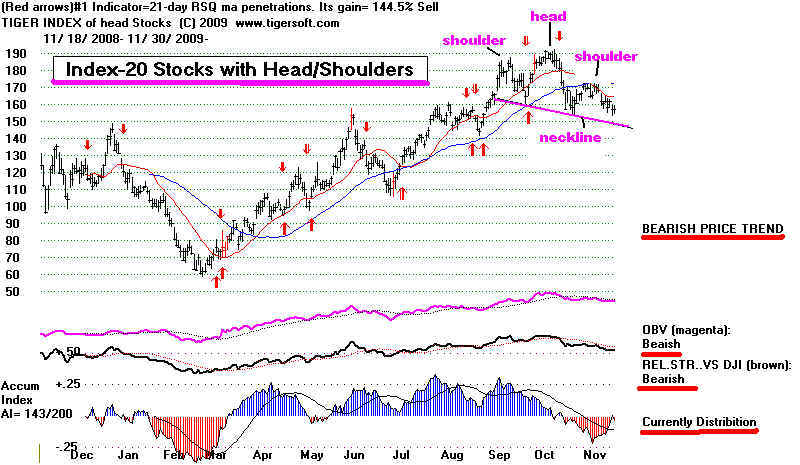
Oversight of The Fed and The Current Weakness in Bank Stocks
The move to open up for public scrutiny the FED's secret subsidies of banks
is very popular.
It will be hard even for the powerful banking lobby to stop it. But don't
underestimate the
power of the Senate. As much as ever, stopping populist surges
appears to be the
Senate's primary function. In the 21st Century, that means protecting
rather blatantly
the biggest corporate lobbyists at the expense of small businesses and
ordinary
tax-payers. So, we should watch how goes this battle to curtail monopoly-
too-big-too-fail
banks. Judging from the weakness of the TIger Financial Stocks Chart
shown above,
their exceptional power may be curbed. The defeat of the move to
re-appoint
Bernanke to another term as Governor or the unlikely resignation by Geithner or
Summers, because
they have failed to reduce the staggering levels of unemployment
will also be big
blows to the special position the biggest banks have with this
Administration,
rhetoric aside.
Gold Is Going Much Higher
Gold is going much higher, I believe. Gold has a minimum target of 1300 based on
its upside
breakout above 1000 from a 300-point high inverted head and shoulders pattern.
It is up overseas
$15, as I write this, It will go higher because the only way out of the
staggering US
government indebtedness is to inflate the Dollar. I wrote a long study
of Argentina's hyper
inflation. It seems more and more relevant.
Warren Buffet Was Right
The real issues go unattended by the Obama administration. The very wealthy
in America
are the only ones who own so much that they can truly afford to be taxed
Their wealth is hardly taxed at all. And their income taxes dropped by 8.4%
under Bush.
Their
levels of taxation are at historically low levels. From 1917 to 1921, the
top income
tax rate ranged from 67% to 77%. You have to go back to 1925-1931 to
see a lower
rate, 25%, except in 1929 when the rate was lowered to 24%. From 1942 to
1963 the
highest incomes rates ranged from 88%
to 92%, except for 1946-1949 when
they varied
between 82% and 86%. The huge stock market gains of the 1950s all took place
when the
highest marginal rate of taxation was 92%. The stock market did not
recover in
1932 UNTIL the highest tax rates were raised from 25% to 63%. They
are now
35%. So until the taxes on the very rich are sharply raised, not as a
token to
honor social justice in a democracy, but to reduce the national debt, Gold must
rise
sharply. If the taxes on the super rich were raised, millions of
Americans
who are now
unemployed could be hired to start fixing America's badly neglected
infrastructure. They could pay taxes and contribute to their own social security.
Until then,
tax receipts will decline, gold and the number of souls begging and
becoming
homeless will keep rising.
There's so much that could be done. That's the bright side. More and more
people,
who do not in
live in Washington DC. realize that our vast network of overseas military
bases in 157
countries and undeclared Trillion Dollar wars will surely bankrupt America,
just as they did
ancient Rome. (A good Christmas present to ask for is
Cullen
Murphy's "ARE WE ROME?" But is there any serious chance of
reducing
all this military
expenditure under Obama? He is going to send 30,000 more troops
to Afghanistan,
even though Al Qida has moved elsewhere.
Unemployment is more than 17%. Obama has no cure for this. Looking
around
desperately for ideas, he will hold a "Jobs Summit". Tragically, he
expects
them to politely wait years for a recovery. So, the dynamics of grinding
stagnation
and social decadence are set in place. As in the late 1970s, next year
the Fed
will be pressed to raise rates very steeply. But by then Gold will probably
be going
hyperbolic. Bernanke will be as slow to see the new storm as he was
the last.
=======================================================
11/29/2009
SELL S12.
8-Month NYSE A/D Line Up-Trend Line Was Slightly Broken Friday.
But Bullish
Seasonality and A Very Supportive FED Have Produced a Divided Market.
High Caps are
much stronger than secondary stocks that make up NASDAQ and
Russell-2000.
These weaker groups we remain short. The highest Accumulation
DJI and
NASDAQ-100 stocks should be held.
How serious is
what is happening in Dubai? Only the Dubai folks know and like
anyone in serious
financial trouble, what they say is less important than what they do.
So, we have to
watch for more selling. There are lots of fat profits. It will not take much
to get traders to
take them, though they would probably prefer for tax reasons to not
take them until
2010. In circumstances like these, the first reaction is to get liquid
and wait and see
how bad the fall-out will be. If a lot of upside potential existed,
but the DJI's
rising wedge suggests otherwise, traders might be readier to jump back in
on the long side
if the market does not sell off badly tomorrow. As it is, there does
not appear to be
a need to rush back in the market. The closeby recent highs should
act as resistance
with most stocks.
The hedged
position we took last week should serve us well until we can see if the
A/D Line uptrend
will be more decisively broken.
Is this an important top? Probably
not. Here's why.
Seasonality generally
argues against that. Declines that start in Novmber or December
have been mostly very
shallow fsince 1965. But it was not always this way.
Declines of 7% or more
from November peaks took place in 11/20/1916, 11/23/1917,
11/8/1918, 11/3/1919,
11/3/1920, 11/21/1930, 11/9/1931, 11/14/1932, 11/20/1936 (only 7%),
11/12/1938, 11/10/1939,
11/17/1940, 11/25/1941, 11/1/1949, 11/15/1962, 11/5/1975,
11/14/78, 11/6/2000 (only 7%)
and 11/29/2002. So since 1963, 46 years, there have been
only 4 November tops that
brought declines of more than 7%. But in the 48 years from
1915 to 1962, there were
14 cases. Probably, the Fed saw the pattern and decided to save
retail shopping profits.
Technical analysis goes a
long way to answer the question of whether this is an
important top. Really
important tops usually show multiple Peerless Sells and a variety of
different non-confirmations
(NCs) and negative non-confirmations (NNCs). A "NC"
occurs when a new high is
made by the DJIA but another index or internal strength
indictator fails to make a
corresponding new high. An "NNC" takes place if the DJI
makes a new high and an
internal strength oscillator is in negative territory as the
DJI makes a new high.
The degree of the non-confirmation is thereby shown. An "NNC"
is usually much more bearish
than a simple "NC".
The Peerless system of
Sells is based a number of different indicators and
non-confirmations.
The two most important tools for judging market tops are P-Indicator
and the Tiger
Accumulation Index. The OBVPct Oscillator shows aggressive public buying
too much to rely upon,
especially late in a bull market. The A/D Line often diverges for
some time from a rising DJI at the end of a bull maket. But
its trendbreaks, where the
trendline is
well-tested, usually bring on additional selling. The more Peerless Sells and
NNCs, the more this
tenet is apt to be true. Of much less value are the other indicators:
OBV,
"IPA" and "IDOSC". Too often they confirm a final high.
Of course, when they
do not confirm a peak,
it is more bearish.
If we focus on
just the last Peerless signal(s), the top two indicators and watch
for trend-breaks
in the NYSE A/D Line, we have to be bearish now. But not so bearish,
as to believe the
DJI will drop below the lower band, now at 9828. For us to be more
bearish, we would
expect to see more Peerless Sells and/or some negative non-confirmations.
Consider making
your decision about where the market will go by puting the data in the
following table:
Date
Recent
P-Indicator
Accumulation
NYSE A/D
Peerless NC? Value
NC? Value
Trend Break?
Signal
11/25/2009 S12
NC +195
NC
.168
YES
Also factor in
the Automatic Buy/Sell and direction of the CLosing Power Pct for the
DIA, SPY, QQQQ
and IWM. Uptrend-breaks are bearish. They are more bearish if there
has just been a
non-confirmation of the recent highs.
11/27/2009
DIA
SPY
BUY, CPNH - rising SELL, CPNH - rising
QQQQ
IWM
BUY, CP - rising SELL, CP falling after NC
If there is a decline, because there are not more Sells and negative non-confirmations,
I would
think that the lower band and the rising 65-dma in the DJI will act as good support.
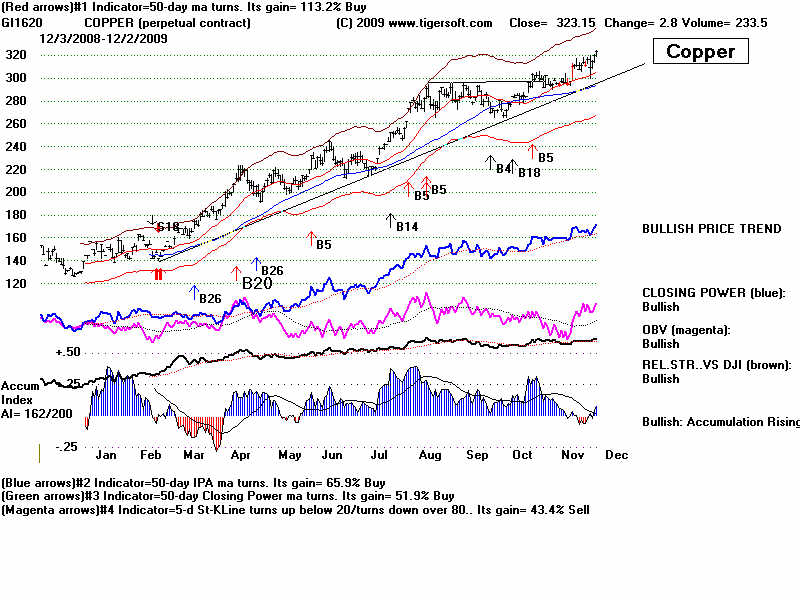
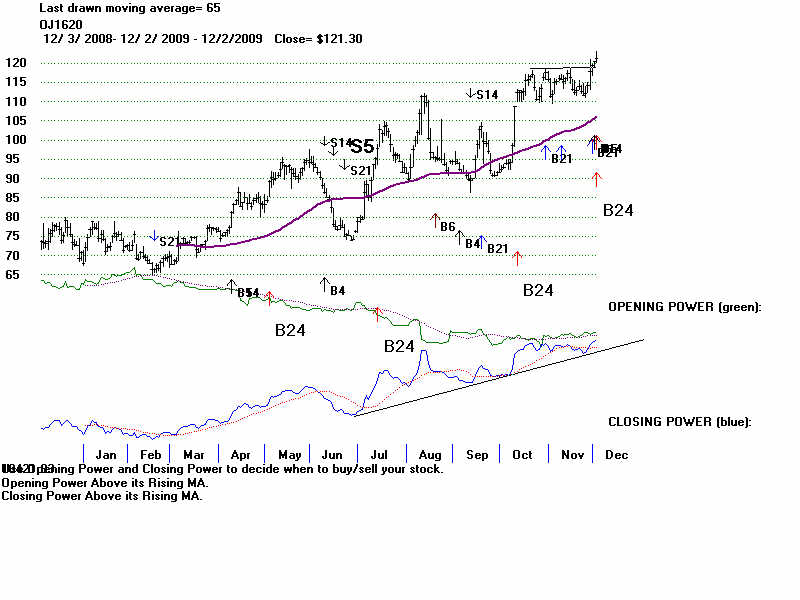
| My new Peerless book shows that just like all
Peerless Sells are not to be weighted equally, so to each internal strength indicator should be weighted diferently. Some are clearly more sensitive and reliable than others. Consider the statistics below to see how well these indicators (and more are studied in the book) predict tops by making non-confirmations and negative non-confirmations. Below see how well our signals and the main indicators we use flagged the last 12 key market tops. HOW WELL HAVE RECENT TOPS BEEN SIGNALLED BY NON-CONFIRMATIONS (NCs) AND NON-CONFIRMATIONS (NNCs) FROM KEY INDICATORS. All but the IDOSC (Marc Chaiken) and OBV (Joseph Granville) were created by TigerSoft.Market Tops DATE Signals P A/D AI IPA Idosc Opct OBV 11/25/2009 S12 NC NC conf conf NC conf NC 5/2/2008 S15 NC conf. NC NC NNC NC NC
12/11/2007 S9/S12 NNC conf NC .014 NC conf .051 conf
10/9/2007 S4 conf NC conf NC NC conf ?
7/19/2007 S9/S12 NNC NC NNC NC conf .034 conf
5/10/2005 S9 NC NC conf NC NC conf conf
2/11/2004 S15/S9 NC conf NC .092 conf conf NC .14 conf
1/14/2003 S12 NC conf conf conf NC .039 NC
8/22/2002 S12 conf conf conf conf NC conf ?
5/17/2002 S9/S12 NC NC NNC-.014 ? conf .002 conf ?
5/21/2001 S4 conf conf NC .151 conf conf .08 NC
1/14/2000 S9/S12/S15 NNC NC NNC-.058 NC NNC conf conf
8/25/1999 S9/S12 NNC NC NC .085 conf conf NNC NC
============================================================================
12 of 12 4 NNC 6 NC 3 NNC 6 NC 3 NNC 1 NNC 4 NC
5 NC 5 NC 4 NC 7 NC
3 conf 6 conf 4 conf 5 conf 6 conf 4 conf 6 conf
|
indicator tells a story
about the nature of the current buying and selling.
oscillator.
--------------------------------------------------------------------------------------------------------------
11/26/2009 SELL S12. Rising Wedge Pattern Remains Bearish.
The Dubai Deluge
From the Peerless point of view, the basics remain unchanged. We have
a Sell signal and must decide
whether to believe or ignore it. Sell S12s at this time
of the year, I showed a week
or so ago, work out profitably only 2/3 of the time and
average only shallow
declines. With the bullish seasonality also in mind, our TIGER
STOCKS HOTLINE remains
hedged. We are long such high accumulation stocks
as IBM and HPQ, both high
caps and are short a number of stocks showing bearish
head and shoulders patterns.
We are also also short the Russell-2000's ETF but
long gold.
Tomorrow is apt to be an ugly day. A lot of US traders who might stablize the
market will not be
present. News that Dubai cannot pays its bills will send a far-reaching
tsunami around the
world tomorrow. Asian markets and gold are down 4%-5%. Will this
end the 50% recovery
rally since March? I would bet that the Fed will fight this new
crisis with still more
easy money. That will turn gold up very quickly. The Fed
knows all to well that
40% of retail profits come from business for the next month.
So, it would be highly
unusual for a big decline to start just one day after Thanksgiving.
Dubai's massive
indebtedness will hit British banks first. But, so integrated is the world's
economy now, it
would be a surprise now for the DJI not to retreat back to 9923, almost
542 points lower.
This where the thrice-tested uptrendline that started in March and
the 65-day ma cross.
This prediction does assume that the NYSE A/D Line breaks
its uptrend-line Friday
or next week. See the chart below.
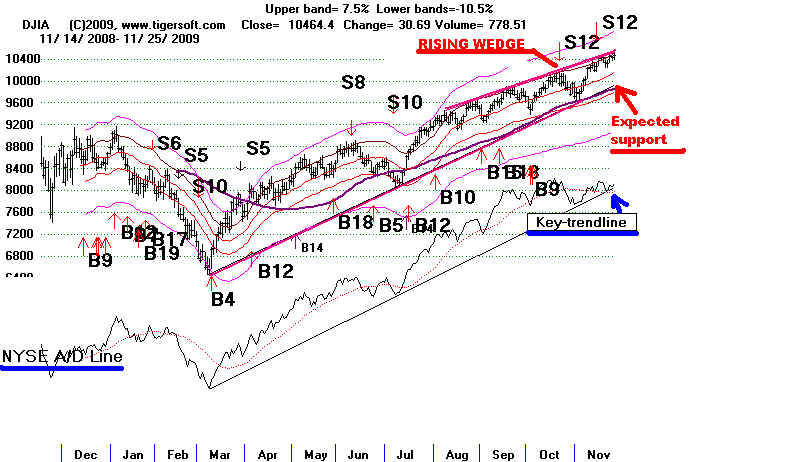
.
its Yahoo's story is here on this.
Oil
slides to near $74 as Dubai woes roil markets
============================================================================
11/24/2009
"Sell S12 Delayed" But
The Rising Wedge Pattern May Mean Another
Decline Starting Next Week.
With a Sell S9, we watch the P-Indicator.
If it turns positive for three days, it generally
means a rally for 4-6 weeks of 2%-3% and
then a decline to at least the lower band. We
last saw this in the Spring of 2008.
It seems reasonable to apply this now, I think, to the
Sell S12 as the Accumulation Index has
turned positive for several days. This
postponed bearishness fits in with
our prediction of a decline early next year after
the upwards seasonal bias plays
itself out and the Fed reconsiders its 1/4% Discount
Rate for Wall Street banks in
February. By then the political pressures on the Fed are
apt to be enormous to defend the
Dollar and stop coddling banks, who don't make make
new loans anyway and show no
inclination to adjust downward mortgage or credit card
payments.
TIger's IPA Indicator Is Bullish for DJIA
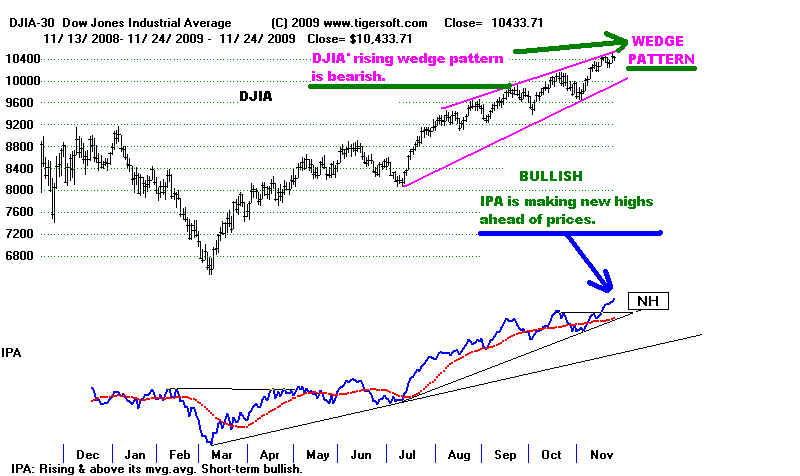
Our IPA Indicator is like the
OBV and A/D Line. It is a cumulative indicator, not an
oscillator. A
percentage of total volume is added to the previous cumulative IPA
based on how close to the
daily high or daily low the stock closes. Closing near the
lows means a negative number
is added to the cumulative IPA for that day. A close
near the highs adds a
positive value. Our Peerless books show that this indicator
is more reliable than the
widely used cumulative OBV Line, except at all-time highs
or when there is a sudden
volume explosion upwards.
Significantly now,
TigerSoft's IPA Indicator for the DJI is making new highs. As you
know, the DJI is a high
capitalization "blue chip" stock index. Its bullishness does not
mean at this stage, after a
long advance, that all stocks will rise. It seriously
underweights financial and
housing stocks and now overwights oil and technology stocks.
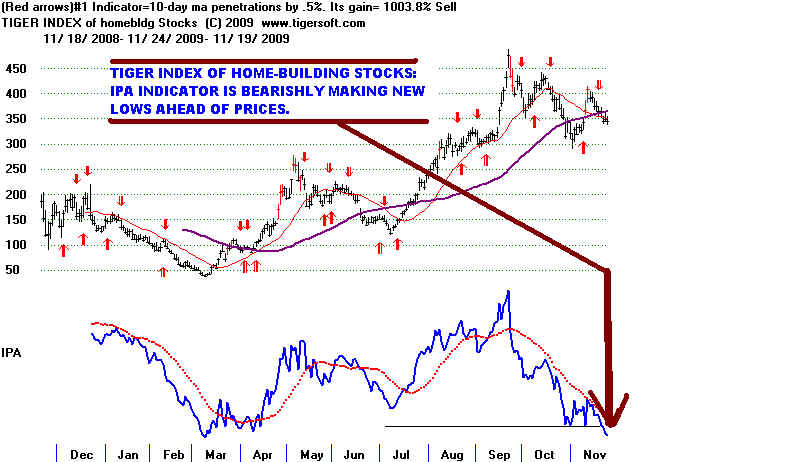
That the DJIA's IPA is making
new highs is bullish for the DIA for the time being. The
research I am doing for my
new book shows that 4 month new highs by the DJIA'
IPA made when the DJIA has
been down a long ways are usually bullish, though
not always. More
reliable are similar IPA new lows far ahead of a price new lows
by the DJI. A new
low by the IPA is not absolutely necessary, I should note, since
we can also employ a
calculated bearish divergence between the DJI's price action
and the IPA. The
mathematicians out there will be curious about how we do this.
It is pretty simple actually.
We compare where the IPA stands within its 100-
day range and where the DJI
is in its 100-day range. For example, if the DJI is 80% of the
way up from its 100-day low
to its 100-day high, while the DJI's IPA is only 10% of the way
up from its 100-day low to
its 100-day high, we would get a bearish IPA divergence of -70.
That is what was seen for
example in January 1940, four months before the stock market
fell 40% when the German Army
attacked Western Europe.
DJIA and IPA'S BEARISH DIVERGENCE: 1939-1940
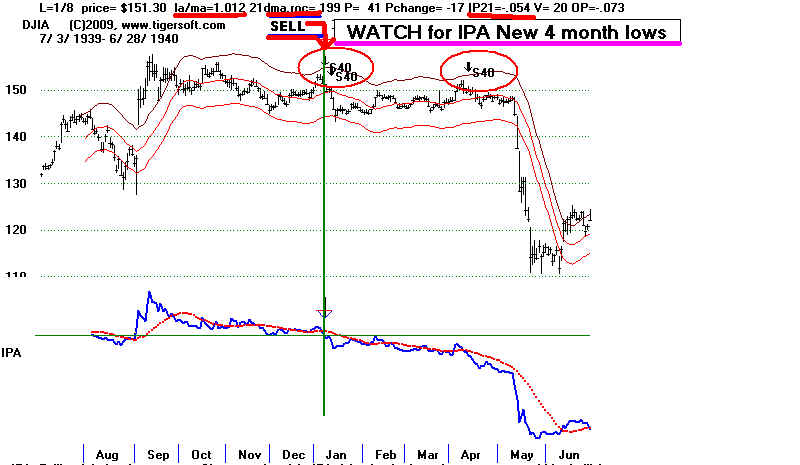
Our new Peerless manual
shows how this gave great signals in 1929, 1932, 1933.
1938, 1940, 1955, 1966,
1967, 1974, 1978, 1980, 1981, 1998, 1999, 2000 and 2005.
We also show how this
signal can be tightened up to avoid the losses in 1964 and 1982.
==============================================================================================
New Peerless On-Line Book: 1915-2009:
$50 until 11/27 and $95 afterwards.
Important
breaks in A/D Line trends is a theme in the new Peerless book that will be available in
early December. It will be offered on-line first for
$95 and show and discuss the Peerless signals,
the A/D Line and the use of the key TIGER internal
strength indicators. If you wish to save $45,
order it now by emailing me before November 27th and I
will instruct you how to pay by credit card.
The book will be uniquely helpful. It will show all
the DJIA charts since 1916, the full year and
the two-half year charts. It will be an
inavaluable reference book.
http://www.tigersoft.com/55111/order-Peerless2010-Book.htm
On-Line Peerless Book
Alternatively, click on the link below
Order Here: Only $50 until 11/27 and $95 afterwards.
========================================================
11/23/2009 Sell S12. Thanksgiving Should Help Boost The Market Upwards
This Week.
GOLD 's Rise and The Dollar's Fall Is The Real
Story. Confirmation of Bernanke To Another
Term Will Be Even More Bullish for Gold Stocks
than It Will Be for The Big Wall Street Banks.
The low volume rally today was a typical
pre-Thanksgiving celebration. It saved the uptrend
of the NYSE A/D Line from a significantly bearish
violation of its key trendline. The warning
signs for caution are still there. The Sell S12
at this time of year is bearish, but does not typically
bring a deep sell-off. The broad-based
Russell-2000 is much weaker than the high cap DJIA. This
occurs when investment managers take profits in
smaller companies, but still want to stay invested
in more liquid big caps. The A/D Line can lag
for 9 months or even a year. That is what preceeded
all the biggest bear markets, like 1929-1933,
1973-1974, 2000-2003, except 2007-2009.
==============================================================================================
New Peerless
On-Line Book: 1915-2009: $50 until 11/27 and $95 afterwards.
Important
breaks in A/D Line trends is a theme in the new Peerless book that will be available in
early December. It will be offered on-line first for
$95 and show and discuss the Peerless signals,
the A/D Line and the use of the key TIGER internal
strength indicators. If you wish to save $45,
order it now by emailing me before November 27th and I
will instruct you how to pay by credit card.
The book will be uniquely helpful. It will show all
the DJIA charts since 1916, the full year and
the two-half year charts. It will be an
inavaluable reference book.
http://www.tigersoft.com/55111/order-Peerless2010-Book.htm
On-Line Peerless Book
Alternatively, click on the link below
Order Here: Only $50 until 11/27 and $95 afterwards.
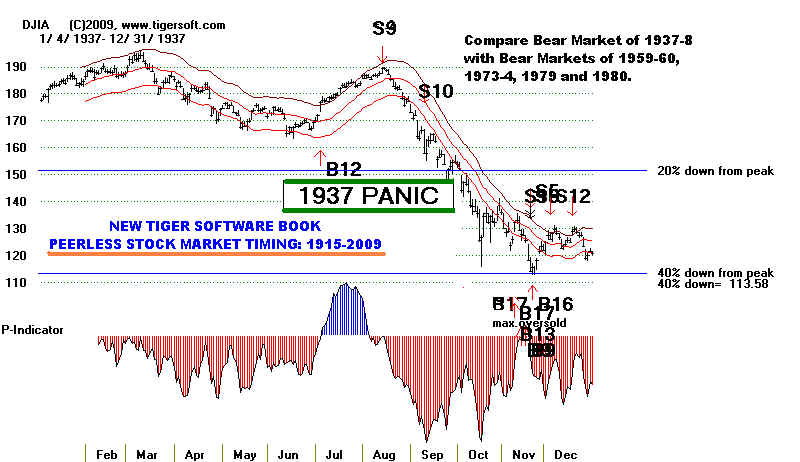
===============================================================================================
The real story is the
continued weakness of the Dollar. Even with Paul Volcker as Fed Chairman
and raising interest rates very steeply, Gold boomed
from 140 to an 840 peak under the Democrat
Carter. Imagine how much it will rise with
Helicopter Ben in charge. Obama has far less understanding
of economics than Carter, who had been a Governor.
Commodity prices usually do not peak until
they have gone hyperbolic. Gold and gold stocks
should go up hugely in the next few years, in
my opinion. ANV is the stock I like the most.
You can see I am not alone. It is starting an even steeper
ascent, by breaking above its price channel.
ANV shows very high Accumulation. I take that to be
insider buying. As I can calculate
a minimum target of 1300 for GLD based on its breakout from
a 300-point-high inverted head and shoulders pattern,
there should be another 15% more rise in Gold
before there is much retreat. Gold is strong
seasonally through January or February, too.
![]()
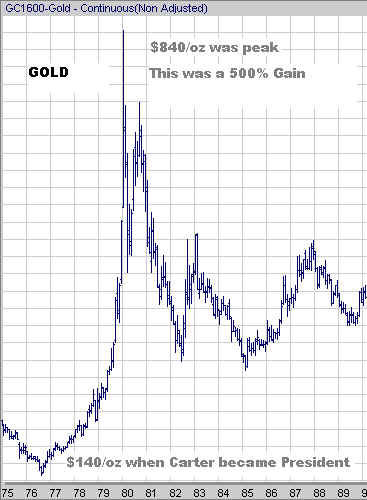
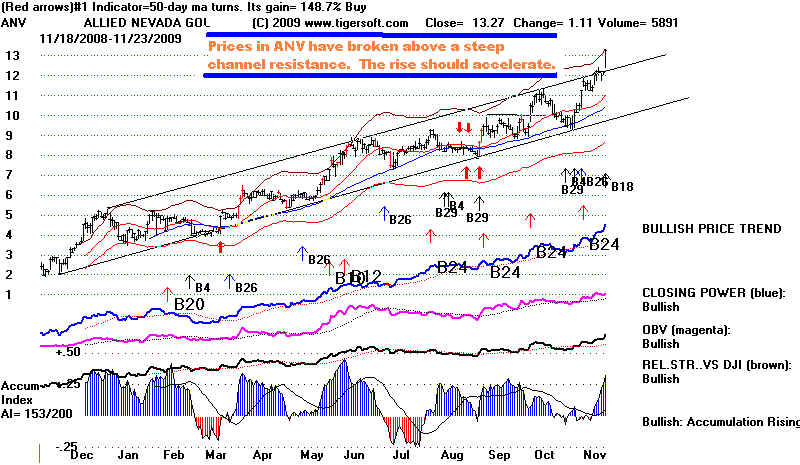
Our Stocks'
Hotline is hedged. We are short the Russell-2000 and a selection of stocks showing
bearish head and shoulders patterns, such as
AA, which lost .07 today.
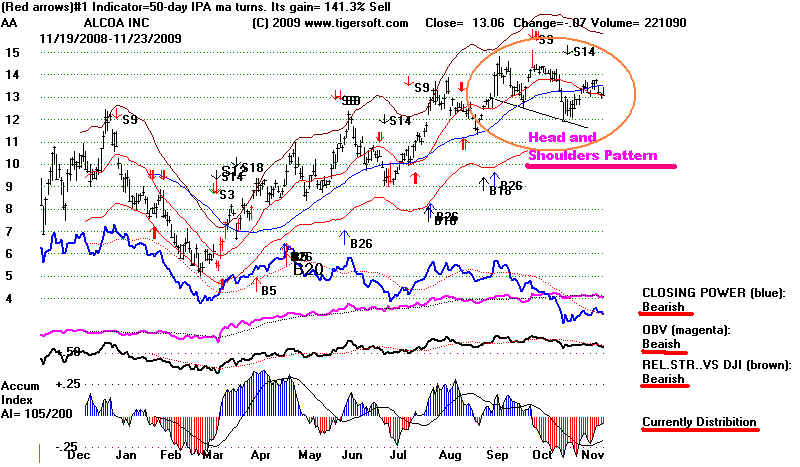
We are long
very high accumulation DJI stocks, IBM and HPQ.
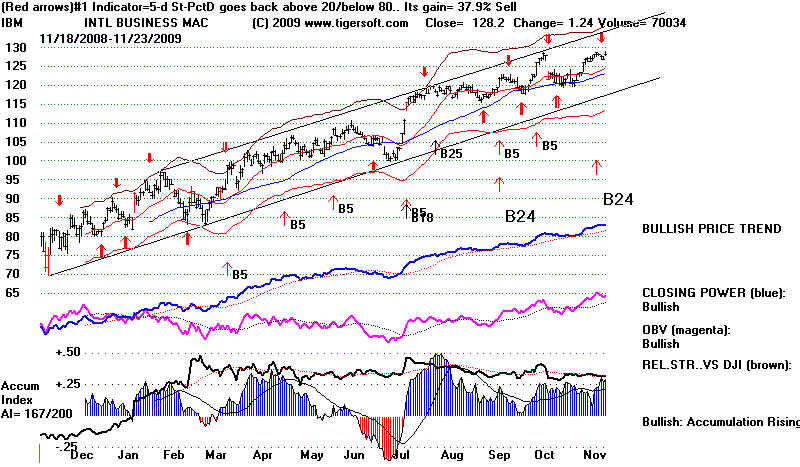
WARNINGS FROM SPY
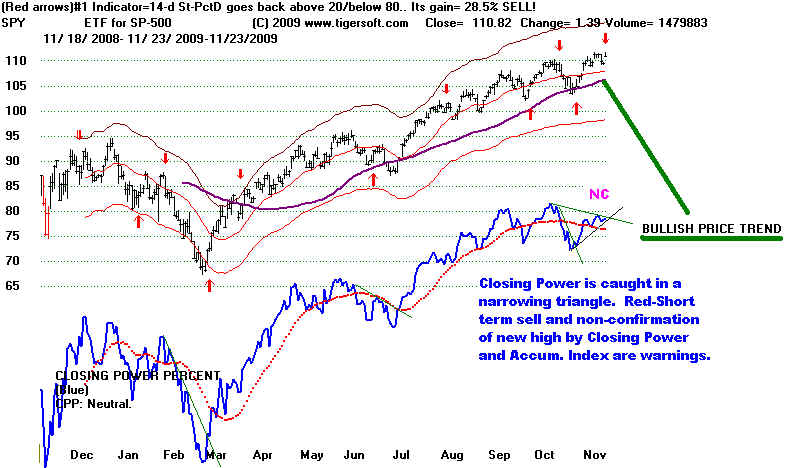
=====================================================
11/21/2009 Sell
S12. Thanksgiving Should Help Boost The Market Upwards This Week.
But A Decline by the DJI To Its Lower Band
Seems Likely in Two-Three Weeks. The NASDAQ
S8 Should Add To Our Concern. Watch The
NYSE A/D Line Uptrend. A Clear Penetration
Would Be Reminiscent of April 2002. The
Greenspan Liquidity Infusion after 9/11 Only
Held Up Stock Prices 9 Months in 2002.
Bernanke Has Pumped Much More Money
into The Stock Market Through The Banks.
At Some Point Early Next Year, It Will
Lose Its Power To Lift Prices. The US
Ultimately Will Then Be at Much Greater Risk.
Gold Should Continue To Rally Much More.
Stocks Are Viewed as A Hedge against
Inflation in These Circumstances. That is
why we are now seeing stocks rise on days
that Gold is up. At some point, the FED
has to worry about Too Weak A Dollar and
Raises Rates, Which Usually Kills The Rally,
When Democrats were in office between
1977 and 1981, Gold quadrupled in price.
That was a period of numerous rallies and
mini-bear markets; 1977, Fall of 1978, Fall of
1979, February-April 1980.
The DIA is much stronger now than IWM (the Russell
2000) This condition can last
for months, just as the NYSE A/D Line can lag
for a long time. Bearish breadth
divergences that last at least 6 weeks usually,
but not always, preceed important
market tops. We have only seen a month of
A/D Line lagging the DJIA, so far.
The longer the period in which the A/ D Line or
IWM lags, the more bearish it will eventually
be for the market. Similarly, gold's
exceptional strength usually is bearish after two
or three months. When both Opening and
CLosing Power are rising for an ETF, we
often see the biggest short-term advances. That is true presently. To be
truly bullish,
so that the rally can continue for the rest of
this year, the DJIA and the DIA will need to
add onto even big early gains at the opening by
the close of trading. Tomorrow will
be a good test of that. The Futures are
up 75 now.
DIA - BOTH OPENING AND CLOSING POWER ARE RISING
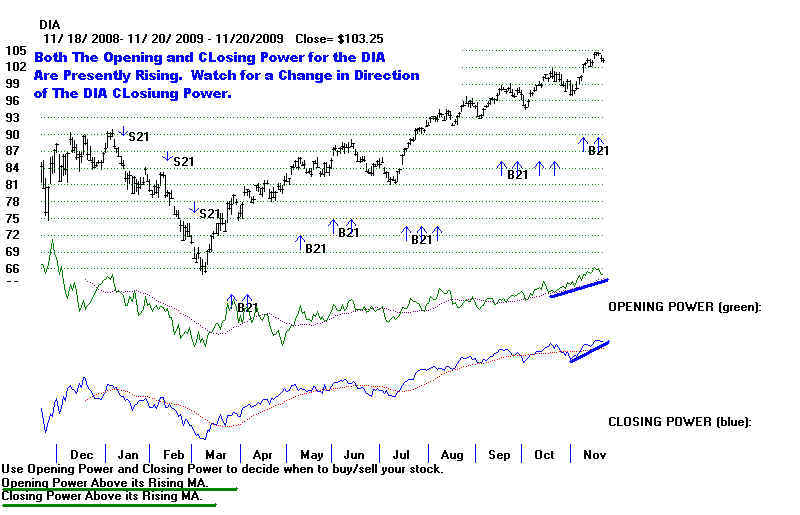
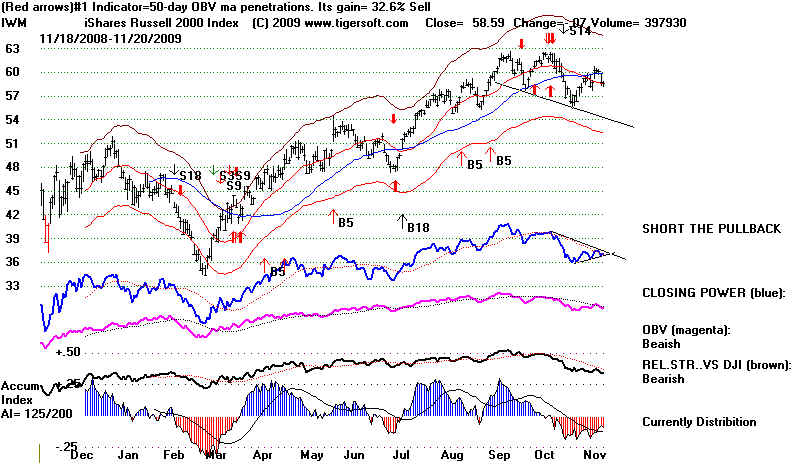
The current Sell S12 is fighting the bullish
seasonality that tends to prevent big declines for the next
six weeks. Since 1965, a rising DJI was
seen for all the time periods after November 22 that
we look at:
3 trading days 69.2%
5 trading days 56.4%
10 tradng days 66.7%
21 trading days 69.2%
42 trading days 66.7%
65 trading days 64.1%
The DJI-30
Is stronger than secondary stocks. That is often true as tops are made. IBM,
by far the
most heavily weighted component of the DJI-30
will help hold the up the DJIA because it is the highest
AI/200 stock among the DJ-30. Meanwhile,
cyclical Alcoa shows heavy red distribution as it plays out
its bearish head and shoulders' pattern.
The DIA's Closing Power still looks firm. That will help
keep up the appearances that the market is
stable. But, it is bearish that the DJI is now back below
its 50% retracement level. While it is
true that independent Sell S12s do not bring steep declines
at this time of year, we have come very close
to a coincident Sell S9. Poor bread and lots of
red big money distribution are a dangerous
combination.
SPARKS WILL FLY THIS WEEK
This coming
week will see Senate confirmation hearings for Bernanke for another terms
as Federal Reserve Chairman. In normal
times, these would not make much news. From the 1950s
until 2008, Wall Street bankers enjoyed
bi-partisan support. Just as Obama the Democrat is now renominating
the Republican appointed Bernanke, so too,
Clinton the Democrat renominated the Republican appointed
Greenspan.
Discontent
is growing. Small businesses cannot get needed loans, despite more liquidity being
the
rationale for the bank bailouts pushed and
advocated by the Fed, Paulson's and Geithner's. Layoffs
continue. 17.5% real unemployment.
Unaffordable health insurance. Evictions. Un-negotiable mortgage
payments. Everywhere one hears, Where's
my bailout? Why are rich on Wall Street treated so much
better than the people who actually make
something? Congress seems awakening now to the
white-hot national outrage at publicly paid-for
Wall Street bonuses, government guarantees against bank
failure with all their wastefully high pay,
unconditional TARP bailouts and arrogant Federal Reserve
insistence on secrecy and non-accountability in
the matter of its $3 trillion in 1/4% Discount Window loans to
banks secured only by "toxic" assets.
The Bernanke hearings virtually guarantee more terrible bad publicity
for Wall Street. Questions that should
have been asked long ago, will be heard by more and more on
a wider range of public forums.
Should
banks that are too big to fail not be broken up, so that their continued existence will
not
threat American national solvency? Should
sweet-heart NY Fed and National Fed deals, like the $13 billion
AIG to Goldman pass-through even be allowed ot
stand? Why should the giant hedge fund Goldman
be treated like a commercial bank? Why
should the taxpayer back-stop speculative trading by JP Morgan,
Merrill-Bank of America, Citigroup? What
if they lose money? Is the taxpayer really expected
to pay for that? Can American afford not
to reinstate the Glass Steagall separation of commercial
and speculative investment banking?
Why must the Fed
act in total secrecy? What other conflict of interests are occurring now in
the every day
practices of the Fed? Which banks
are getting preferential treatment? Who protects the public when
the Fed is run by the bankers themselves?
Why is there no public investigation of the dangerous-to-the-
nation role banker fraud and CEO greed?
What makes anyone think that Bernanke and the Fed have learned
anything from the recent past and will not make
the mistakes again that they made leading up to the mortgage
meltdown? How can they oversee the
industry they have such an incestuous relationship with?
Goldman, JP Morgan,
Band of America and Citigroup charts show heavy distribution and relative strength
weakness now. They are they likely to be
hard-pressed to defend the basis of their heretofore special
treatment by the US Treasury and the Federal
Reserve.
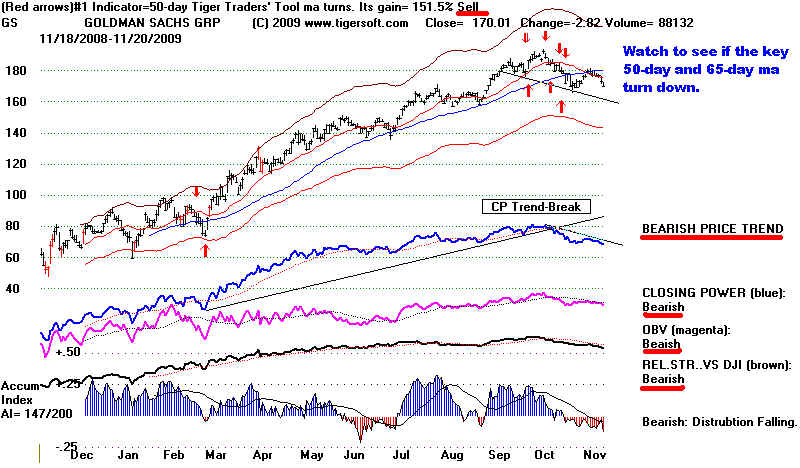
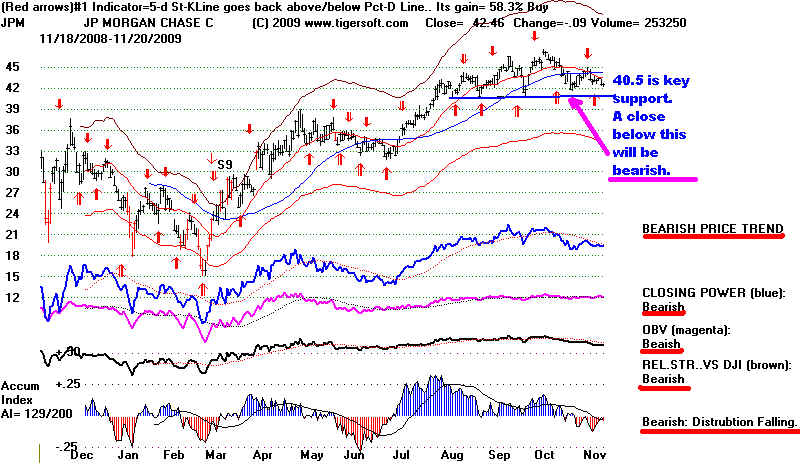
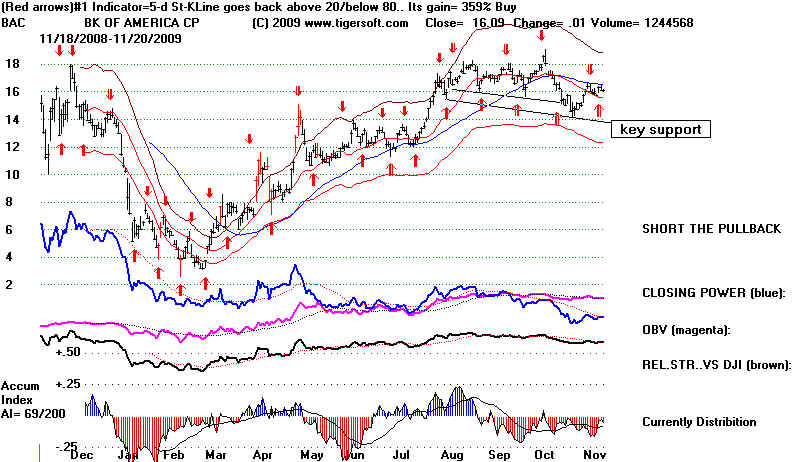
NASDAQ Sell S8
When the NASDAQ reaches its upper band or makes a new high and the TIGER
relative strength
inficator, NASDJI, is negative and the Accumulation Index
is below +.02, nearly negative, the older
Tiger Peerless software produces a Sell S8. A friend
from Connecticut suggested that this might
be worth discussing, because that is the current NASDAQ
chart shows a very recent S8. Study its "
key values and you will see that the internal strength
readings are much more bearish now than
on the earlier cases:
11/16/2009 2197.85
NASDAQ
LA/MA = 1.034
21dma-ROC = .23
IP21 = -.028 ------------ Accumulation Index is more negative than earlier NASDAQ
S8s.
OPct= -.015 ------------ OPct is more negative than earlier NASDAQ S8s.
50dma-ROC = .423 ---- Typical
DJI - 1/15/2009 Sell S15
DJI 1/16/2002
LA/MA = 1.039
21-DMA-ROC = .489
P = 26 ------ almost negative and an S8
IP21 = .001 ----- basis for Sell S12.
V = -146 .--- more negative than
earlier NASDAQ S8s.
OP21 = .169 --- lower than the earlier NASDAQ S8s.
Besides the
bullish seasonality, which delayed for two months the 1996 S8 case, the main problem with
believing this
signal is that there have only been three earlier cases. Still, their outcomes are
were
quite bearish and
their rationale is straightforward; big money is selling and speculative money wants
out of the
market. If there is a sell-off, the Sell S8 will have to be reinstated in Peerless.
| #1 5.8% NASDAQ
DECLINE FOLLOWED 4 MO. LATER . 11/14/1996 1270.36 rose to 1388.06 on 1/22/1998 and then fell to 1201.00 on 4/2/1997 NASDAQ LA/MA = 1.028 21dma-ROC = .187 IP21 = .037 OPct=.163 50dma-ROC = .592 DJI - NO Signals until DJI-S8 SELL on 12/30/1996 DJI 7/16/1990 LA/MA = 1.034 21-DMA-ROC = .571 P = 150 IP21 = .146 V = 11 OP21 = .342 |
#2 38% NASDAQ DECLINE FOLLOWED. 1/7/2002 2037.10 DJI fell to 1220.99 on 7/23/2002 NASDAQ LA/MA = 1.028 21dma-ROC = .187 IP21 = .037 OPct=.163 50dma-ROC = .592 DJI - no signals DJI 1/7/2002 LA/MA = 1.017 21-DMA-ROC = .098 P = -56 IP21 = -.015 V = - 61 OP21 = .2 |
#3 7% NASDAQ DECLINE FOLLOWED. 1/3/2005 2152.15 fell to 1904.18 on 4/28/2005 NASDAQ LA/MA = 1.001 21dma-ROC = -.048 IP21 = .045 OPct=.157 50dma-ROC = .476 DJI - 3/4/2005 Sell S15 DJI 1/3/2005 LA/MA = 1.004 21-DMA-ROC = .161 P = 274 IP21 = .029 V = 6 OP21 = .221 |
=====================================================================================================
11/21/2009 Sell S12. Weakness Today in All Areas but
Gold.
Further Weakness Will Likely Bring A Decline to 9800.
But A Much Deeper Decline
Cannot Be Ruled Out. The Holiday Season Should Help
Hold The Market Up.
Today's
94 point DJI decline saw poor breadth today. The weakest stocks, such those that
comprising
the sample used last night showing a classic head and
shoulders top, were quite weak. See these stocks'
sharp sell off today in the second chart below. If
there is further weakness, the 8-month A/D Line uptrend of
NYSE will be broken. That surely will bring more
weakness. A/D Line breaks like this in the past
have started much bigger declines thanmight be otherwise
expected. So more selling and buying
short ETFs is advised. If there is such a break
tomorrow, I will show similar charts of broken A/D Line
uptrends. I have previously shown similar breaks in 1930
and 2001.
-------------------------------------------------------------------------------------------------------------------------------------------------------------------
26 of the DJI-30 stocks fell more than 1%.
Intel lost .82. It sports a top-looking price pattern
and heavy distribution for the last two months. In
the NASDAQ-100 95 of the 100 stocks fell by 1%
or more. MRVL, whose chart looks like INTC''s, was the
biggest loser there falling 6%. In the SP-500,
466 were down more than 1%. So the decline was
quite broad.
The Sell S12 has been reinforced by trendbreaks in the rising
Closing Powers of the DIA and SPY.
In addition, the recent steep A/D Line uptrends have been broken
for most of the groups of stocks
we follow. The 8 month NYSE uptrendline is now being
tested. A break in that will be significantly
bearish.
8-Month A/D Line Uptrend of NYSE
Will Be Tested Tomorrow
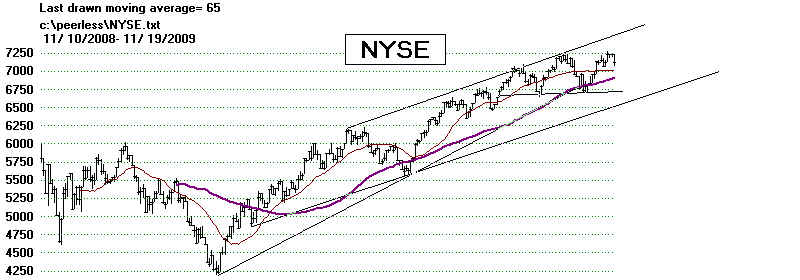
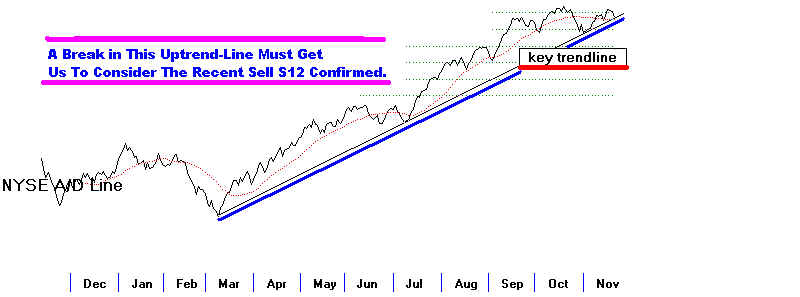
Sample Stocks Showing Head and Shoulders Patterns.
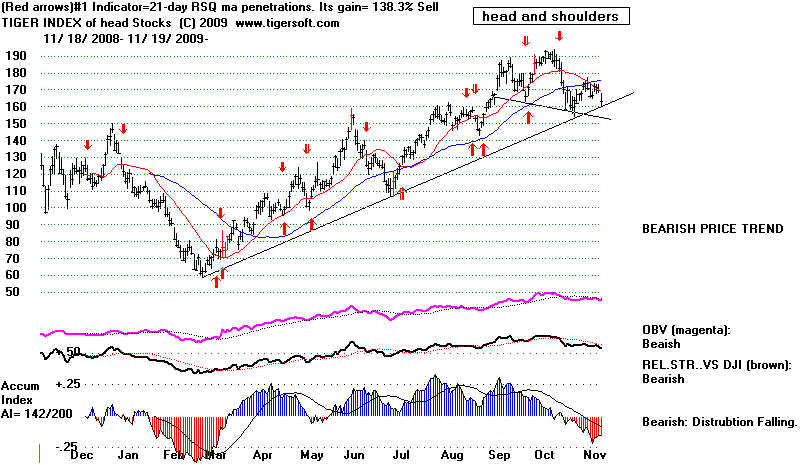
Breaks in CLosing Power Uptrends and A/D Line Uptrends.
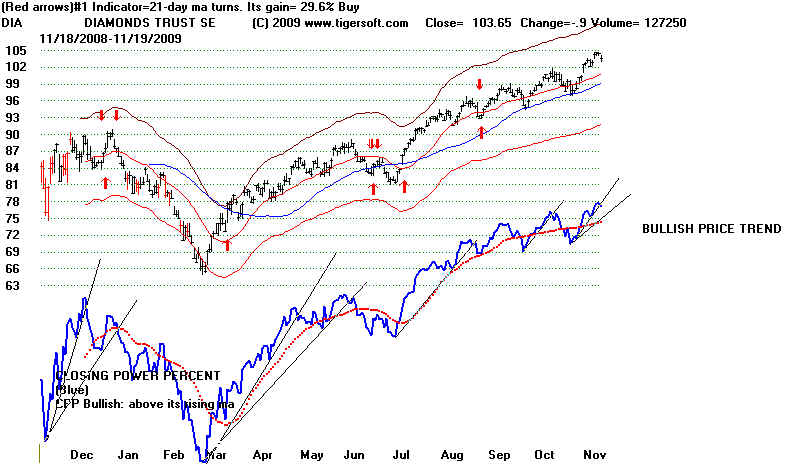
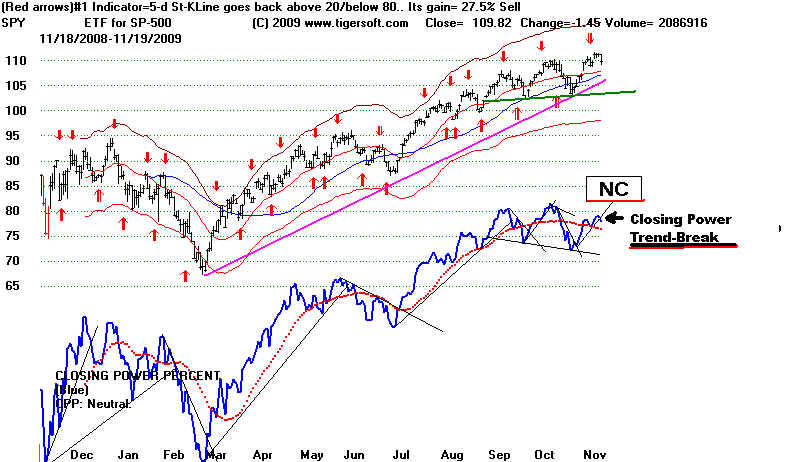
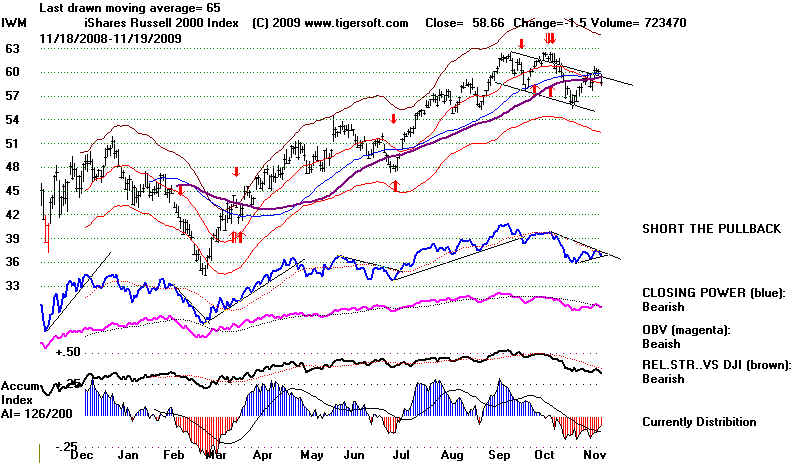
A/D Lines of Various Groups of Stocks:

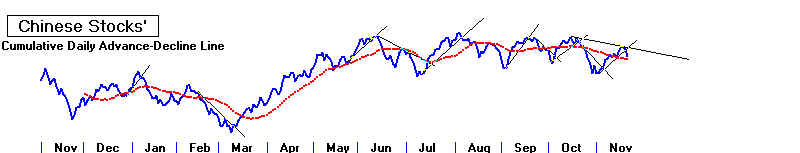
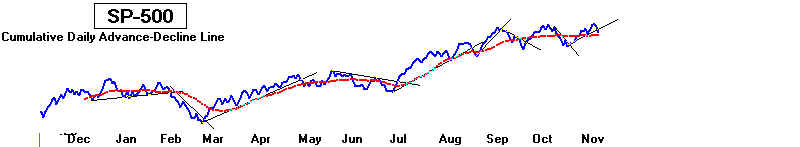
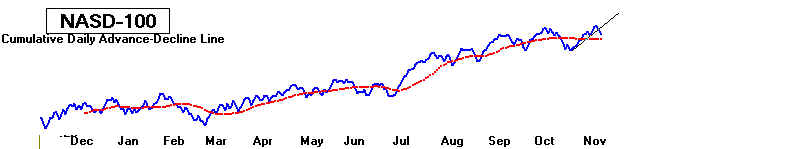
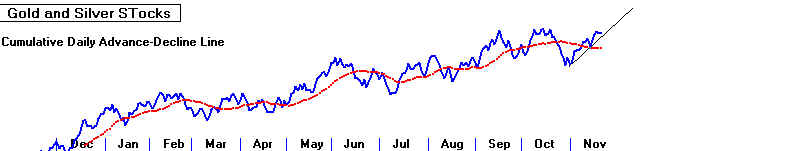
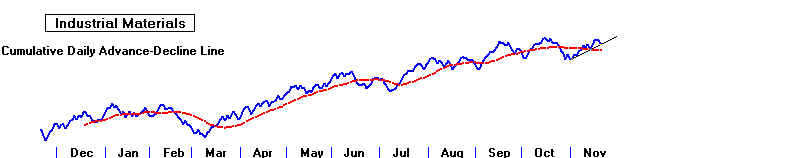
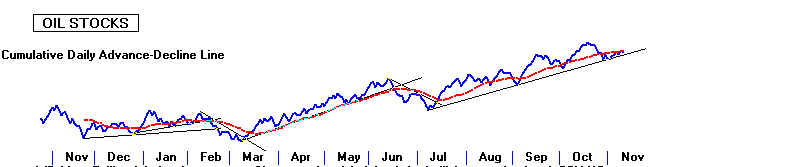
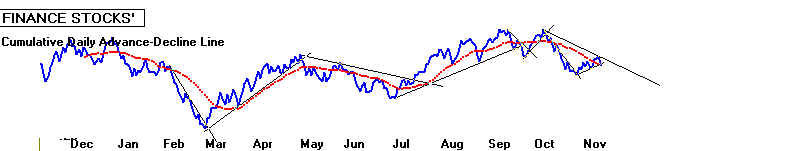
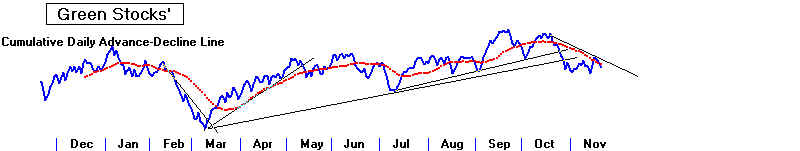
========================================================
11/18/2009 The Bearish Divergences have stopped the rally at the top of
the
channel. Usually once resistance has been found, prices back off and search for
support.
Given
the Peerless Sell S12 and all the bearish breadth and Accumulation Index divergences,
we
have to now be bearish and look for another retreat to the rising 65-day ma of the DJI.
It is
very rare for the DJI to close 3.7% over the 21-day and still show a negative P-Indicator.
At
least, the Accumulation Index has turned slightly positive, one might say. But we
see
distribution tops in a number of stocks. Below is the composite chart of this
sample. The stocks
were
culled by inspecting only stocks whose first symbol-letter was "A",
"B" or "C". They
are
AA, AAV, AAWW, ABB, AGU, ALXN, ANN, APC, APF, ATI, BDC, BZ, CAR, CBRL, CHBT,
CKH,
CLNE, CPHD and CRZO. (New software lets you build charts like this of any group of
stocks
you
wish using Tiger Data.)
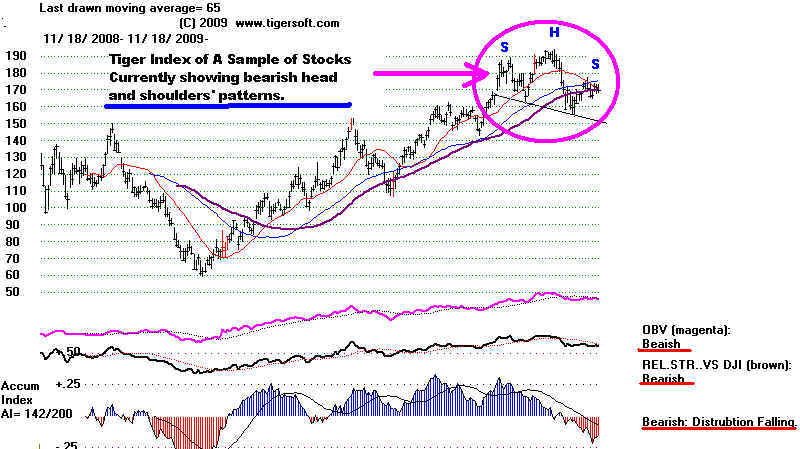
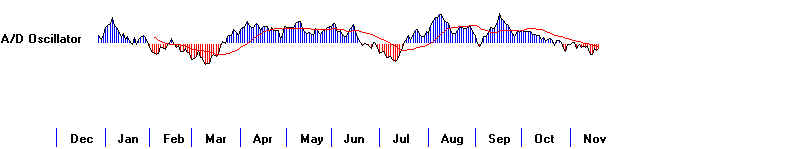
SP-500 A/D LIne And SPY CLosing Power Trend-Breaks Comprise A Good Trading System
I have said
we should wait to see breaks in the NYSE A/D Line uptrend, a break in the SP-500
A/D Line
and breaks in the Closing Power uptrends. When we had the Sell S12 signal a month
ago, I
showed the historical basis for waiting a Sell S12 to be clinched by a broken NYSE A/D
Line
uptrend.
The charts below show why we should wait for breaks in the the SP-500 A/D Line
and the
SPY's Closing Power trendlines. In both cases, using these indicators' gains exceed
what the
Peerless Buys and Sells would have produced using Peerless straight-away.. So,
waiting for
this additional evidence of a Sell is supported by the evidence. That should not
offer much
comfort to bulls now, however, since we are but one bad breadth day away from a
sell using
the SP-500 A/D Line. And a break in the Closing Power uptrend could occur if
the is a
very weak closing, far below the opening, tomorrow.
Take some
profits for now.

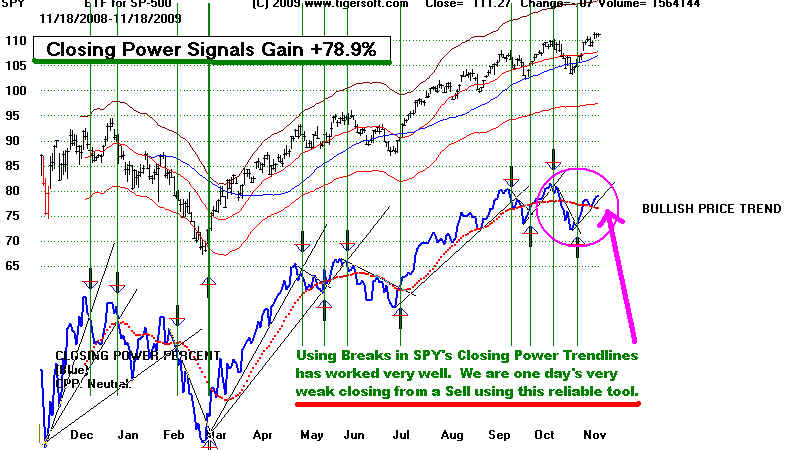
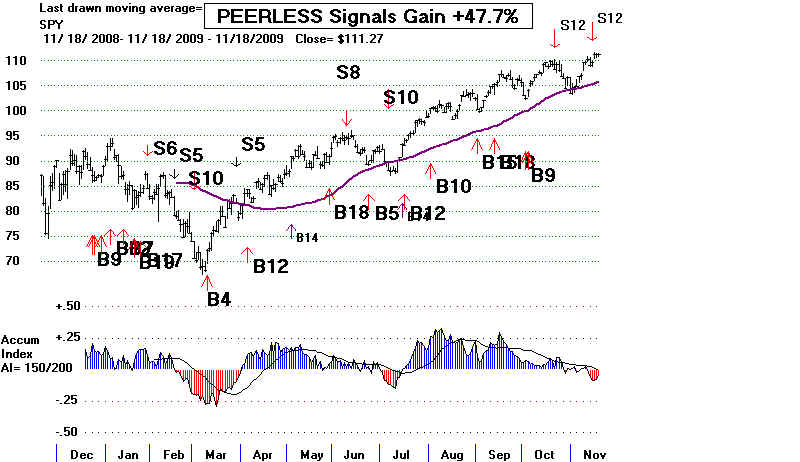
=================================================================================
11/17/2009
Watch The Dollar And You Will
Know What The US Markets Are Doing.
The Dollar and the DJIA have been mirror image of each other since March.
This is clearly not
a healthy
long-term situation. It is a result of the Fed's decision to provide a massive
infusion
of liquidity into
banks by accepting dubious toxic collateral and charging 1/4% yearly interest.
With a guarantee
that they they will be protected from failure, the banks are speculating in the
stock market as
never before. This is exactly what the Depression era Glass Steagal separation
of commercial and
investment banks sought to prevent. Bernanke denies there is another bubble.
He denies that
reinstatement of Glass Steagal is necessary to prevent fraud, deception,
bankruptcies and
excessive concentration of power. I thought this was one of the clear lessons
of the 1930s and
2008. But there is no public investigation. No calling in of experts. Bernanke
knows better, he
thinks. Time will tell. My own thinking is that his policies will be overtaken
by
the negative
consequences of a severely weak currency by March next year, if the public outrage
does not boil
over before then at his shameless currying favor of the very criminals that caused
last year's
maelstrom. Meanwhile, let's see if the DJI can work its way sidewise through
the
bearish
divergences we now see. Without much more volume, a big rally from here through the
overhead suppy of
stock seems unlikely. But a big decline of more than 7% to the lower band
also seems
unlikely at this time of year.
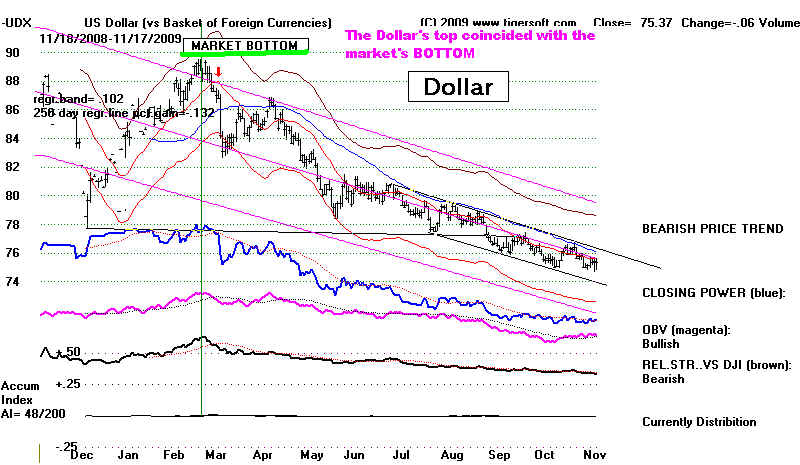
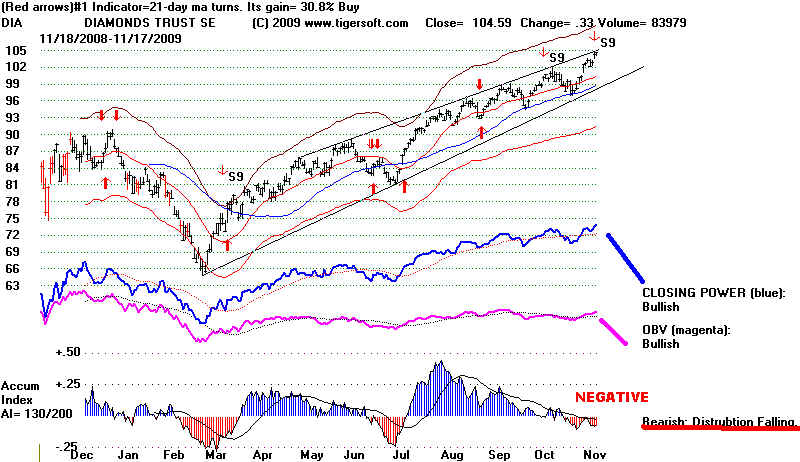
The SELL S12 may still work. Weak and Negative Internals with the
DJI 4% over the
21-day ma and at resistance are clearly bearish signs. Meanwhile, the FED is doing
all it can to
make the market go higher to give retirement account owners renewed confidence,
encourage
companiues to hire again and bring banks the trading profits they must need to
become more
independently solvent. While US stocks are rising because of the low interest
rate environment,
the biggest beneficiaries are foreign ETFs, Chinese stocks and Gold. We will
want to watch for
signs that these key leaders are faltering. Not only would that mean the uptrend
is not
sustainable, it would also suggest a rally in the Dollar owing to a move upwards by US
interest rates.
===== BEST PERFORMING FOREIGN ETF SINCE MARCH BOTTOM -============
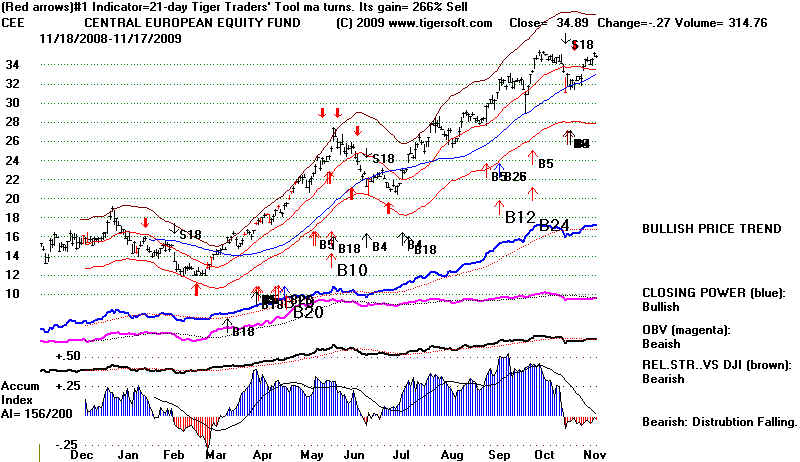
===== FOREIGN ETFS HAVE BEEN THE BIG WINNERS -============
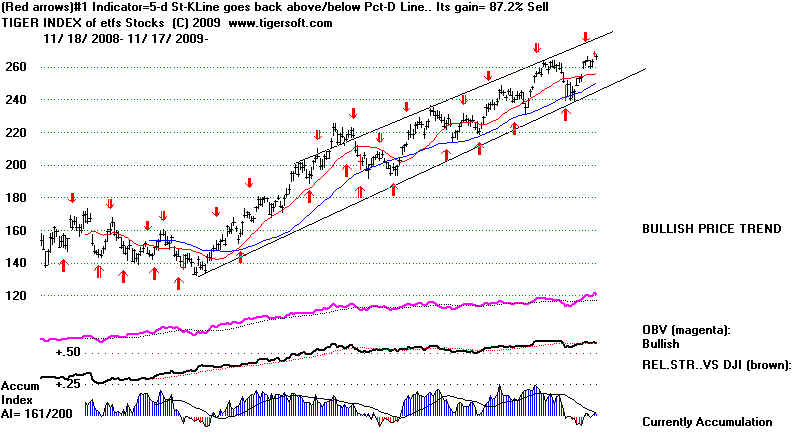
============= CHINESE STOCKS
ARE UP THE MOST AMONG FOREIGN ETFS.============
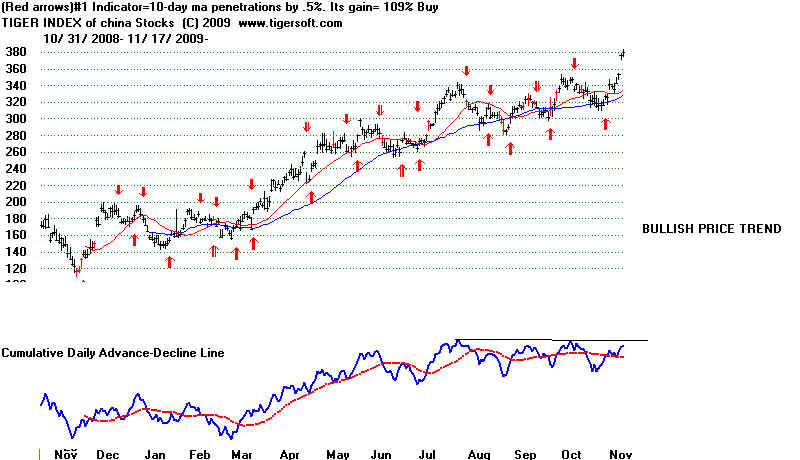
The weakening
internals of the general market are reflected in the big performance variances.
Low priced
stocks, finance stocks and homebuilding stocks have clearly been lagging when we
compare
performances over the last 65 trading days, about a quarter of a year. Once way to
see this is to
look at the relative performace of the Fidelity Sector funds we orovide data for.
The table below
shows the best and worst performing Fidelity Sector funds over the last 65
trading says.
It also shows the stocks that make up the top 10 holdings of these funds.
Tiger
now permits users
to readily graph these groups from the A-Z data. These graphs show how
strong the
computer group is, how gold stocks are following gold's lead and breaking out,
but oil stocks
are lagging a bit and show negative Accumulation. Meanwhile, the bank and
housing groups
are the worst performers, despite the FED's trillions to them. That scares me.
If they can't fo
better with all this largesse, what will they do when it is withdrawn?
BEST PERFORMING FIDELITY SECTOR FUNDS OVER LAST 65 TRADING DAYS
FIDELITY FUND
PCt Gain BIGGEST HOLDINGS
----------------------------------------------------------------------------------------------------------------------------------------------------------------------
Gold
FSAGX
+33%
ABX, GG, GLD, AU, AEM,
MEM, KGC. GOLD, AUY
Energy FSESX
+25%
SLB RIG WFT NOV HAL SII
BJS NE ATW OII
Multimedia
FBMPX +22%
DIS TWX CMCSA TWC
KMDIA OMC NWSA DTV CMCSK
Natural Resouces FNARX +22%
OXY SWN SU SLB MRO HK
APC CNQ CHK FCX
Energy FSENX
+22%
OXY SLB SWN CHK RIG WFT
APC MRO NE
Computer FDCPX
+20%
AAPL HPQ DELL EMC IBM
STX MU HTCH WDC AMD
Software FSCSX
+20%
MSFT GOOG ORCL CTSH ACN
ADBE BMC V EBAY NUAN
Technology FSPTX
+20%
AAPL MSFT GOOG SCO INTC
HPQ ORCL BMC RHT MU
WORST PERFORMING FIDELITY SECTOR FUNDS OVER LAST 65 TRADING DAYS
FIDELITY FUND
PCt Gain
----------------------------------------------------------------------------------------------------------------------------------------------------------------------
Insurance
FSPCX
+10%
Health Care
FSPHX Health Care +9%
Medical
FSMEX Medical
+7%
Banking
FSRBX +6%
Housing
FSHOX +5%
Home
Finance FSVLX +2%
Utilites
FSUTX +2%
Biotech
FBIOX +2%
Tentative Conclusion:
Tops are made by
different groups at different points of time. Speculative low priced stocks
appear to have
their six months in the sun and now profits are being taken.

A sharp sell off
now by Finance Stocks from their now falling 65-day ma would be bearish
for the market,
but it might also merely get the FED to just loan them still more trillions
and pump up the
market more.
FINANCE STOCKS'
INDEX IS GOUNG NOWHERE.

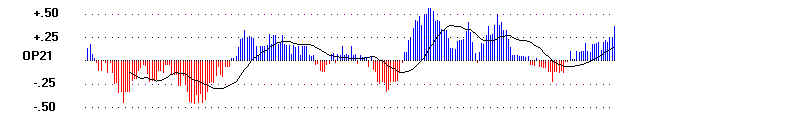
At some point, the steep uptrends will end for tech, software and computer stocks.
That would
be
significant. They are the leaders. So we will want to watch these groups and
their A/D Lines.
I think we
should be concerned that these stocks' composite Accumulation Index is negative.
Energy
stocks are similarly up a lot, but now also showing negative Accumulation index radings.
This too is
a warning. .
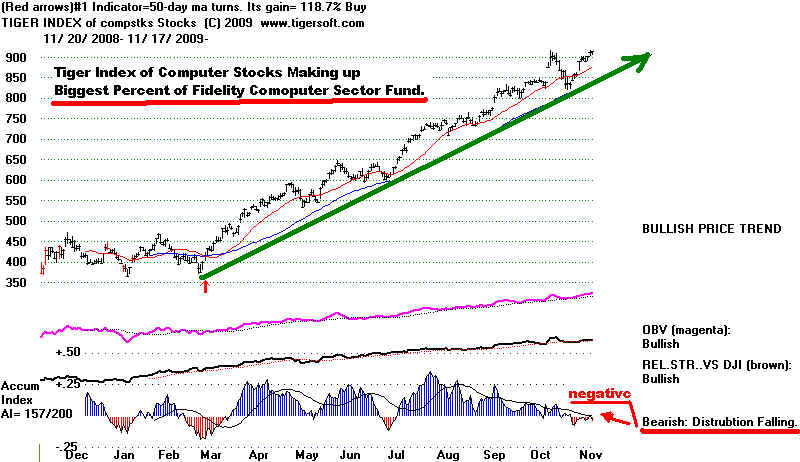
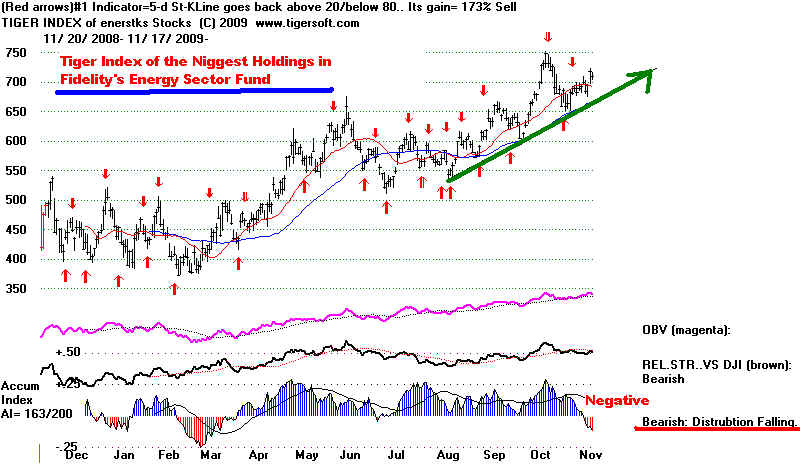
=======================================================
11/16/2009 The SELL S12 May Still Work Out.
The Resistance at TheTop of The
Price Channel Remains.
But, We Should Be Hedged, and Probably with A Bullish Bias until
The CLosing Power Uptrends
Are Violated. That is What Our Stocks' Hotline Is.
After 28 years of watching
these Peerless charts unfold I have learned to trust them, but also know
their limits. 80% of
the time the signals work very well. But there are some that do not. So, it
is best to use a set of
indicators and tools. The Tiger Closing Power has proven its importance, but
it, too, can be wrong if
public speculation is too wild, as it was in 1999 and 2000. Seasonality is
also a key. Not counting 2009, since 1928, only 12% of the
Peerless sell signals from mid-October to
mid December are unprofitable.
Even the NYSE A/D Line can be
wrong. It lagged thoughout 1999, yet the DJI and NASDAQ rose
and rose. It is still
uptrending. A break in it would more than ratify and confirm the Sell S12.
But today's NYSE breadth was
superb and repeats the bullish pattern since March wherein
excellent breadth trumps
mediocre trading volume. See that the A/D Line's own head and shoulders
pattern has been bullishly
aborted.
The Fed, or course,
ultimately has the most to say about the market. If we we can figure out
what Bernanke intends, we
have a huge advatange. In recent HOTLINES I have reasoned that
he will do his best to keep
rates low until after the holiday buying period. Only China could
stop him. But they want
Americans to buy Chinese goods and so will not rock the heavily loaded
boat of US national solvency.
The Sell S12 from Peerless is
being pushed aside by the growing sense that Bernanke will not raise
rates until next year and the
realization that stocks are a better hedge against inflation than sitting on
cash. So, money
managers are being forced to chase. Of course, the rally is seen as false, having
been built with the
essentially free Trillions of Dollars provided the biggest banks. But just as
Goldman
Sachs rose and rose this
year, despite its well justified, sinister reputation, so, too, the market now is
rising despite the widespread
perception that the buying is artificial and the economic recovery is not real.
There us a key lesson here.
It is a big mistake to confuse the stock market's movements with
norms like fairness and
justice. In no way, is it democratic. The turth is we are far better served
by thinking of the market as
being mainly manipuled to fool the vast majority. By such reasoning,
it should keep climbing the
wall of worry that the advance is just a hollow bank specualtors' bubble.
Professionals are now buying,
despite this fear. They are the key now. We see their buying in how
the Tiger CLosing Power is
rising for the DJI and SPY. Even the Closing Power for the QQQQ and
IWM are no longer falling.
That in itself is a buy. Their recent CLosing Power downtrends
have been bullishly broken
above.
The public and foreign buyers have
been pushing up prices above the previous day's close for two
months, judging from the fact
that the (blue) Opening Power for the DIA has not dipped below its 21-
day ma since early September.
Since professional buyers in the US take their large positions during
the day, we can watch Closing
Power to see what they are doing. Since November 9th, the (green)
Closing Power has been above
its 21-day ma.
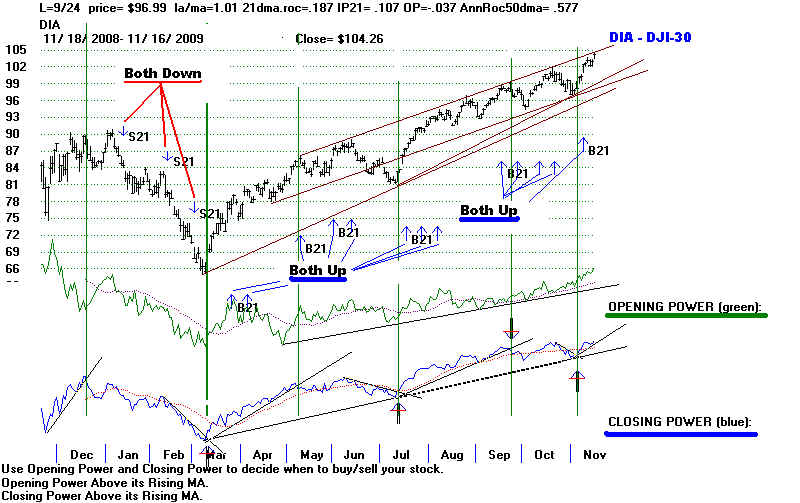
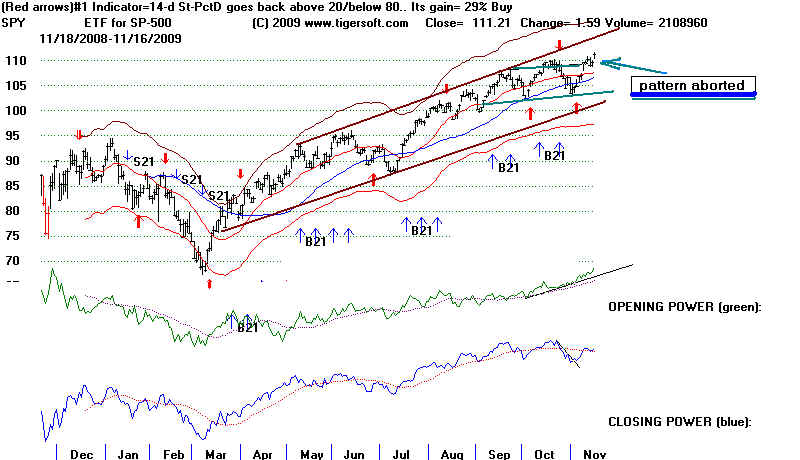
Now we are in the bullish
situation when BOTH the public and professionals, in general, are bullish.
That's when prices rise most.
We can see this also in the steeply declining NYSE Red Down Volume.
This is shown in the DJIA
chart. This is a situation I have commented on frequently.
Prices have reached the top
of their price-resistance line. That may still offer resistance. But,
the apexes of prices on the
right shoulders of head and shoulders' patterns have been exceeded.
Our belief is that this
destroys the bearishness of the pattern and prices rise because of short-covering.
See this in IWM and QQQQ
below.
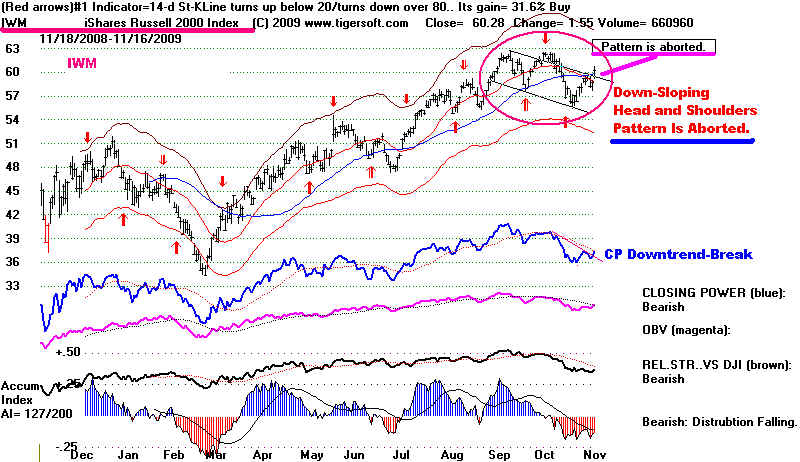
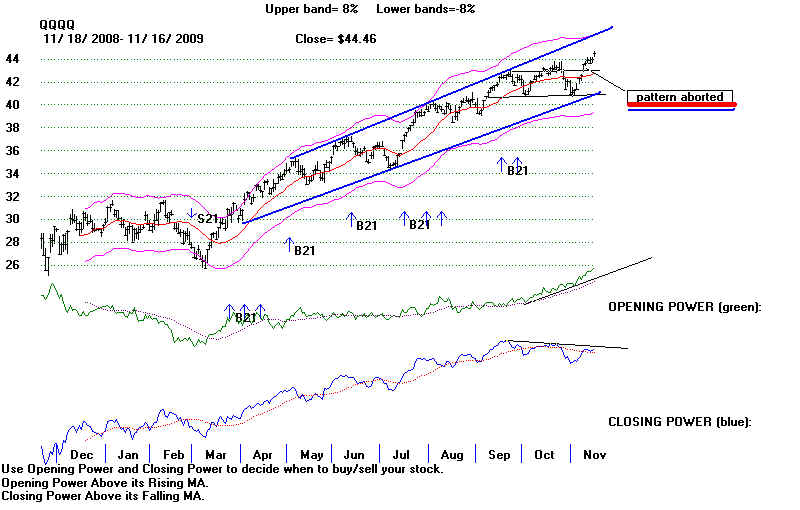
==============================================================
11/13/2009 Friday brought a new Sell S12 from Peerless. The divergences
are getting
bigger. WIll The
current Fed Bubble burst and will the rally snap? Somethng will have to happen
to cause that. An
acceleration downward by the Dollar would unsettle the financial markets.
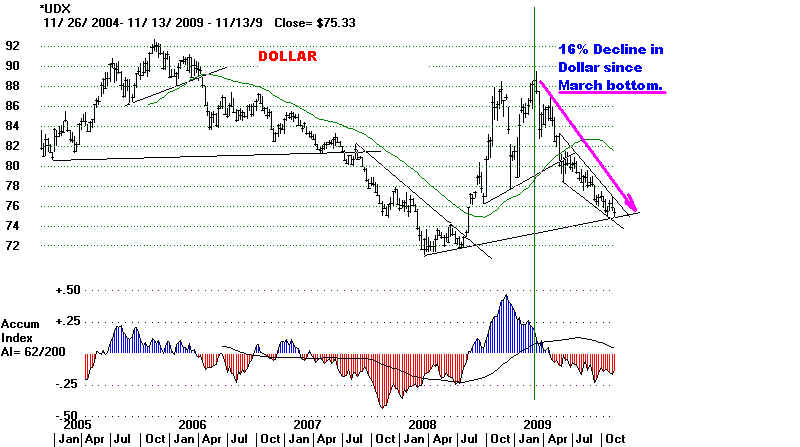
Technically, a break in the
uptrending NYSE trendline would be the most important bearish development.
(See chart above).
The FED has put all our eggs in
Wall Street bankers' hands and hoped for an economic recovery,
believing that a rally, however
artificial, will restore business confidence and get the middle class to spend
again, as they see their retirement
funds steadily rising. But banks are not using the bailout trillions to
make new loans, even though that
was the pretext given to justify the bailouts, Meanwhile, the ranks of the
middle class are falling sharply,
as jobs and homes disappear. The race is on. If there is no recovery,
the stock bubble will surely burst.
For now, the FED ignores public outrage, because they are
buffered by Obama, Geithner,
Summers and Barny Frank.
As much as I would like Peerless to
work, I'd also like to see the economy get stronger somehow
and I can see that the general
stock market may well hold up until next year. The uptrends of
foreign ETFs and China are not in
jeopardy, yet.
I'm not sure a decline will be
allowed, especially before the Christmas retail season. The good retail
season will not save the economic
revovery, but a bad season for merchants would be deadly.
This the Fed knows.
Obama is in China. But it's not clear what China is willing to do to change the
picture. They do not want the
Dollar to weaken dramatically because of all the US government debt
they hold. A much lower
Dollar will make put Chinese goods at a price disadvatage. So, what will
change the picture of an artificial
rally? I can see how the DJI and other highs caps will keep scratching
out more gains. Perhaps, the
real economy will get stronger. But then why have seconday stock indexes
like IWM (Russell-2000), Value Line
and Low Prices stocks topped out and bearishly showing falling A/D "
LInes and CLosing Powers? The
chart below shows that Emplyment and Recruiting stocks are weak
and forming a bearish head and
shoulders pattern. We will watch this chart for the next week closely.
A move above its right shoulder
apex will be bullish. A penetration of the falling neckline will be bearish.
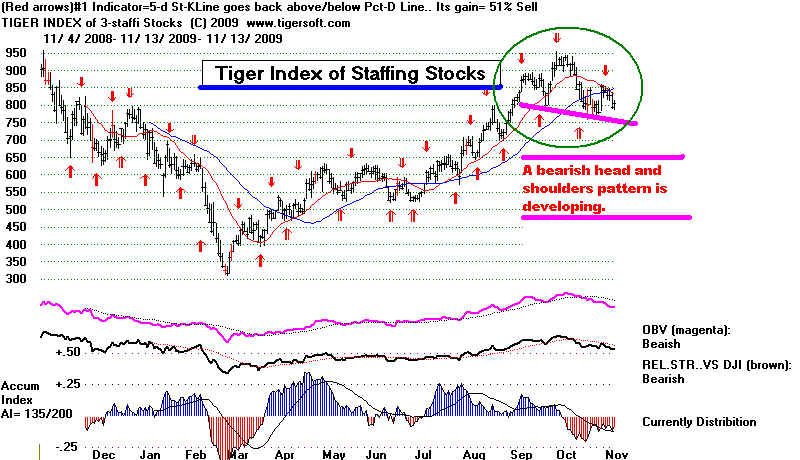
I would stay short ETFS that
represent the Russell-2000 and hold the highest Accumulation stocks we can find.

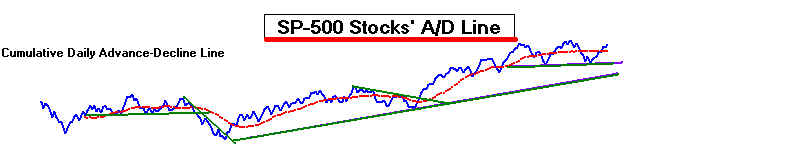
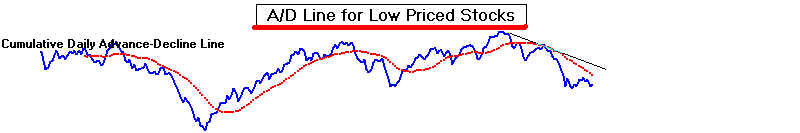
The DJI is just below the
resistance at the upper 3.5% band and the top of its rising wedge.
10355 would represent a 50%
retracement of what the DJI lost between the 2007 peak and
and the 2009 bottom. With
volume so low, it would be surprising to see the DJI move past 10400.
The OPCT is higher than it
The internal strength indicators are
weakening, as as the DJI rallies. Not only is the
P-Indicator negative, now the current
Accum. Index ("IP21") is too. As the DJI makes
new highs, the very broad based Value
Line and IWM (ETF for Russell-2000) are forming
what look like bearish head and shoulders
patterns in the making. Their Adv-Decline Lines
are already pointing down. But
money is still flowing into higher capitalization stocks. The
A/D Line for the DJI-30 and SP-500 are
still rising. But that money is decreasing, facing more
and more distribution and dependent upon
public and foreign buying overseas and at the
opening.
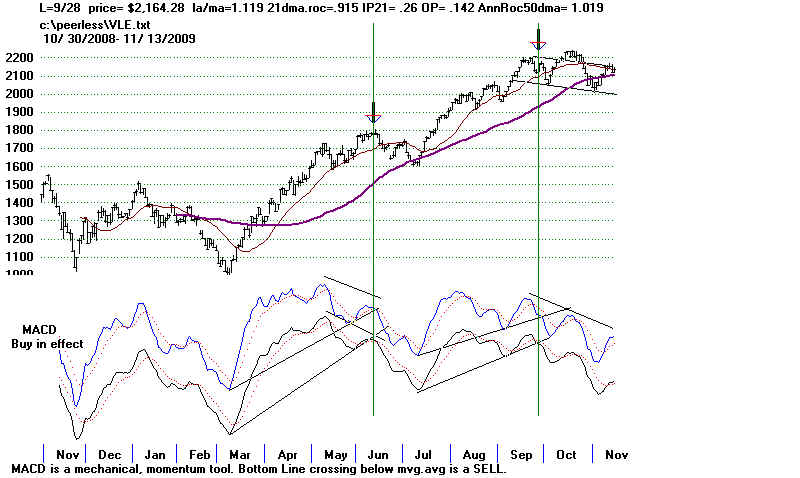
Russell-2000
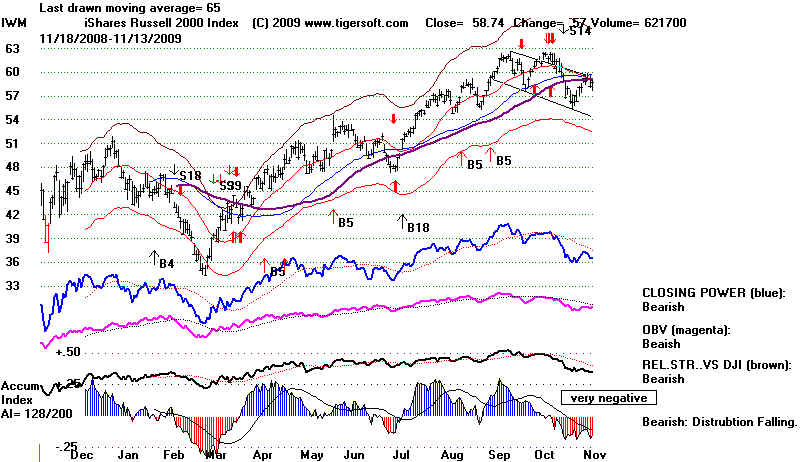
QQQQ
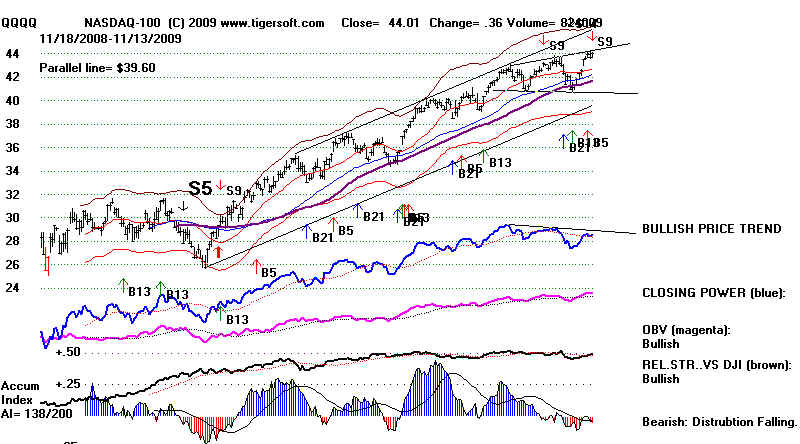
SP-500
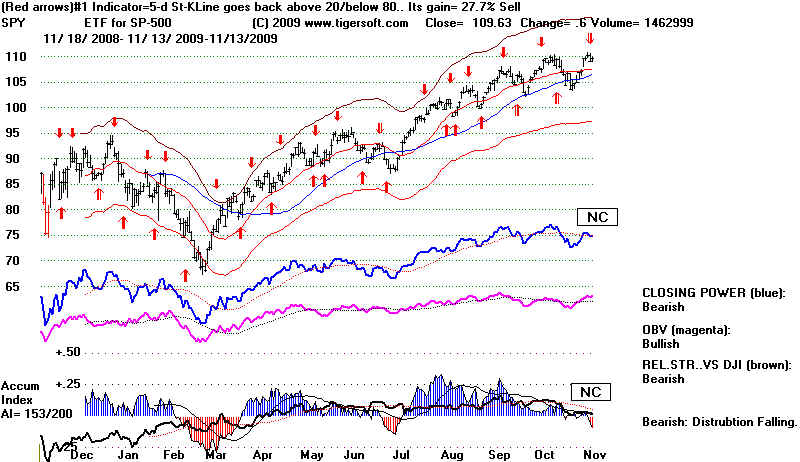
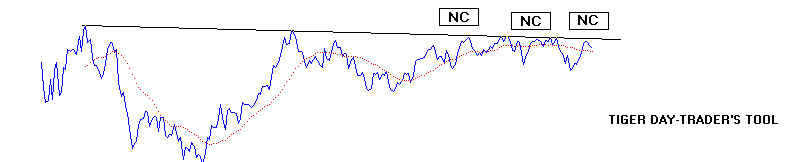
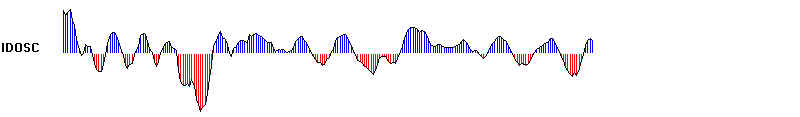
A/D Line for SP-500
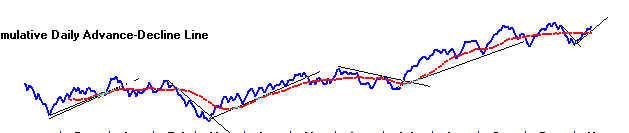
=======================================================
11/12/2009
There many bearish breadth and volume divergences, The Peerless system used
until the June 2008 has given a major
Sell S9 today.
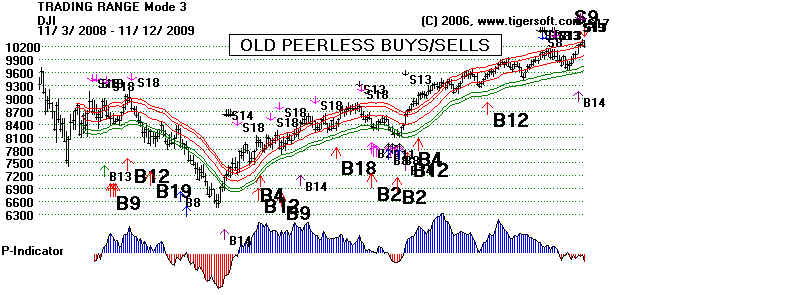
I think we
have to take seriously new short-term sell signals. Of the four short-term
systems I have suggested, the optimized
short-term systems for the SPY and QQQQ
gave SELLs today, as did the 10-day Stochastic
on the DJI. Note, however that the
Closing Powers are still rising as is the IDOSC
for the DJI and SPY. This secondary stock
weakness should be enough to justify doing some
selling and buying some Short ETFs
on the Russell-2000. The SELLs are much
more pronounced for the broadest indexes.
See how much greater is the weakness we
see now in the NASDAQ, QQQQ, low-priced
stocks and the Russell-2000 (IWM) than in DJI
or the SP-500. This what happens when
big money gets nervous about how extended the
rally is. See these broad-based indexes
below.
I know only a little
about Elliot wave theory, I admit. But if this is a bear market rally
in what will be a much bigger move down, thenI
see two distictive waves up. And that
is what a bear market rally is apt to produce.
On the other hand, a third wave up and
a surpassing the 50% retracement level at 10400
would argue that we are seeing a
bull market that will extend much further up.
The technicals now argue for the first view.
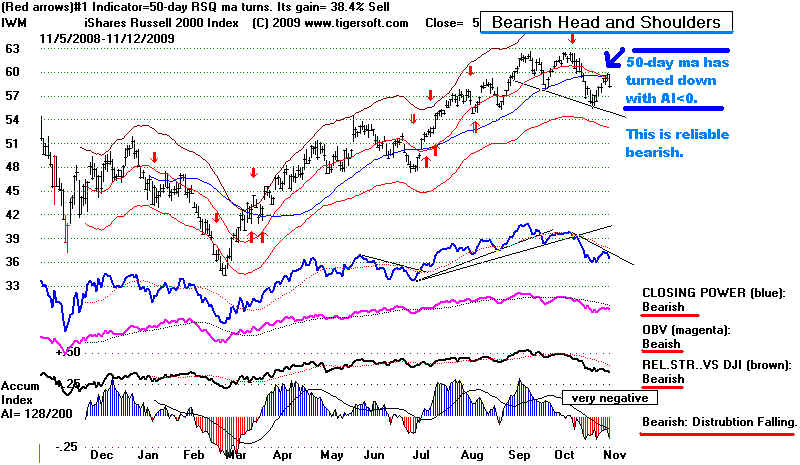
RWM - A SHort ETF on the Russell-2000. Its fluctuations are supposed to
correspond to the inverse of
the daily performance of the Russell 2000 index.
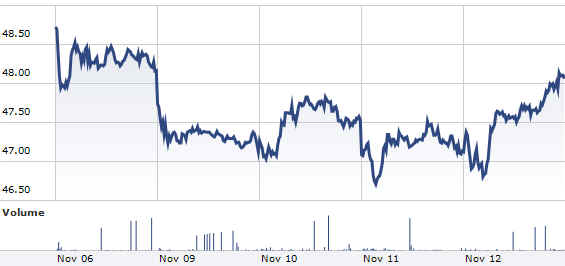
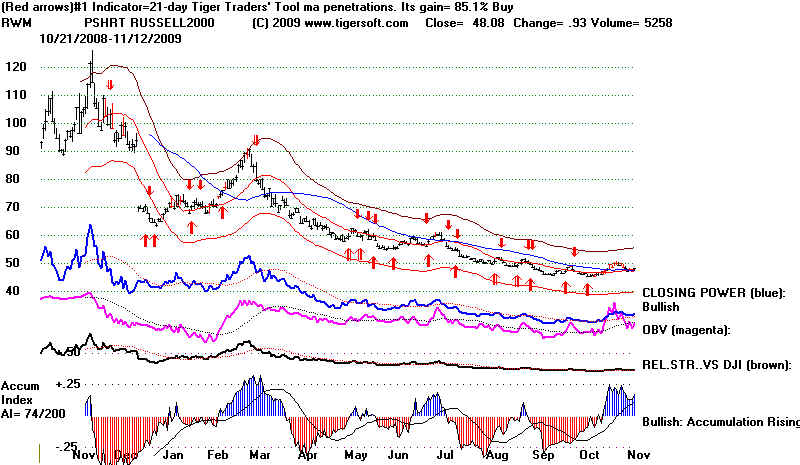
The
Dollar rallied today and Gold fell. That seems to be what drops the stock
market these days. It would be surprising
for the Treasury and Fed not to try to ramp
up the Dollar and discourage easy speculation
against the Dollar. It could do that
for two weeks and still leave interest rates
unchanged for the holiday season. Perhaps,
they will work with other Central Banks and the
Chinese to do this.
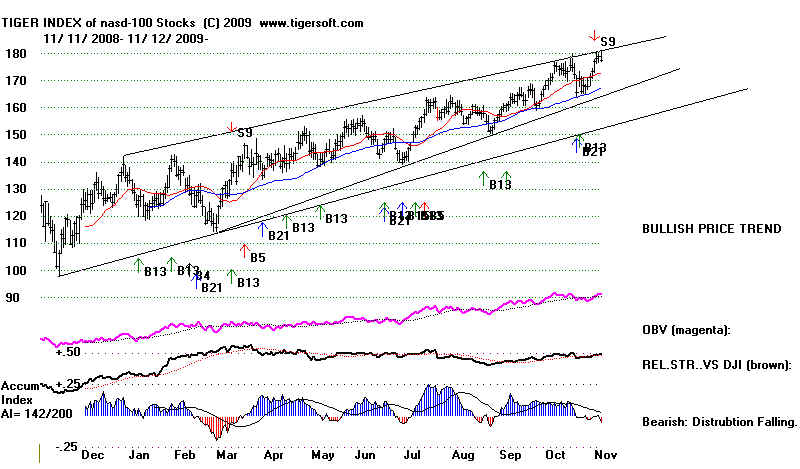
LOW-PRICED STOCKS' INDEX
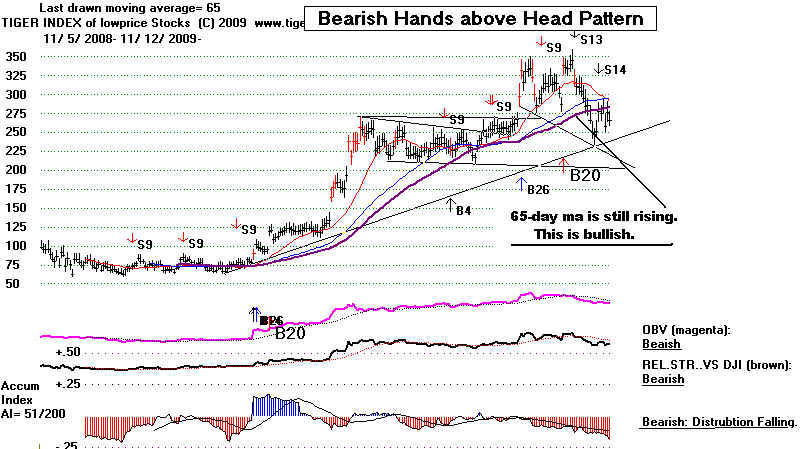
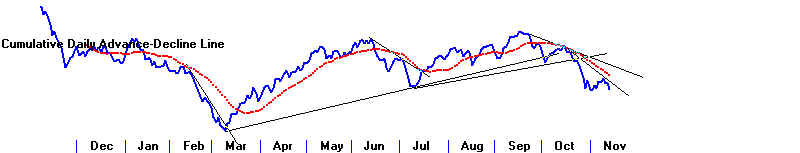
NC
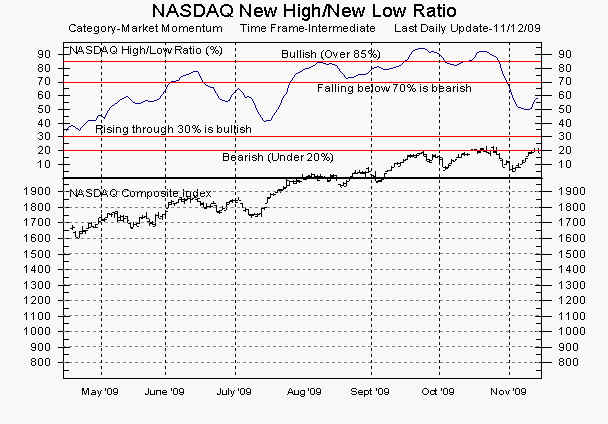
Source:
http://tal.marketgauge.com
======================================================
11/11/2009 Peerless Sell S12 Is Operative. Upper Band Reached
with Negative P-Indicator. The Short-Term Indicators
Are Still Rising.
But with Six Straight Up Days for DJIA, Some
Profit-Taking Is Likely.
Foreign stock markets should next pause. Resistance has been reached
and internals
are much lower than they were the last
time current price levels were reached. Without
a boost from foreign markets, the DJI is
also apt to fall back. Recently it has run ahead
of the other US market indexes.
This is often bearish.
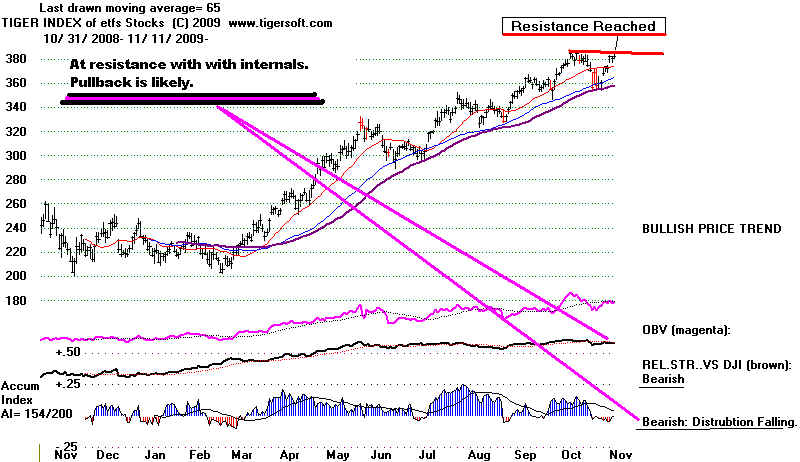
Staffing Stocks
show a bearish head and shoulders pattern. We will want to see if they
exceed their right shoulder to abort this
bearish pattern. Below is the TigerSoft Index of
15 Hiring Stocks.
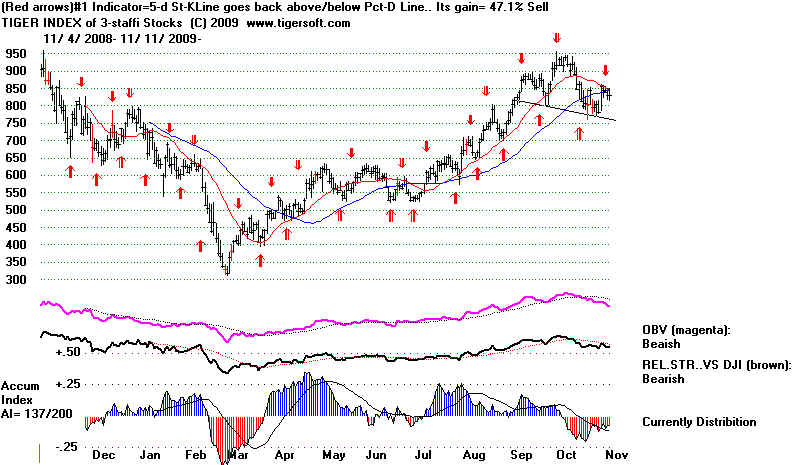
Taking a larger view, we have to note that it is normally bearish
that"
(1) the DJI has now reached the upper
band with the P-Indicator negative;
(2) that it has almost reached the rising
resistance line in the DJI's bearish
rising wedge pattern;
(3) that a steep rise in gold, as we now
see, often leads to sharp decline;
(4) that it has now retraced nearly
50% of what it lost between the peak of 2007
and the low in 2009 - a frequent point of
reversal;
(5) and that we already have a Peerless
Sell S12.
I opined last night that we should probbaly wait
for the short term indicators
to tell us when this rally is over and then expect
another testing of the rising A/D
Line uptrend. And if that uptrend-line is
broken, watch out below! I think this
is still reasonable advise, given the Fed's clear
intent to prop up the market
during the critical retail season ahead.
The FED and the Treasury will continue try to prop
up the market based on their
belief that a rising stock market will produce a
business turn-around. Maybe,
it will. Unemployment tends to keep falling 7 months
to a year after a market
bottom. So, another bad set of data about
unemployment should not be
taken a proof positive that they are wrong.
More of a threat
to the market immediately comes from Senator Chris Dodd (D)
who would force the FED to make public which banks get its
trillions in credit
for toxic assets. Wall Street wants to be coddled.
Take away their special
treatment and they will be "cry-babies" and drop
the market in protect... Dodd
has populist support but is not likely to overcome Obama's,
Geithner's and Barney
Frank's opposition. We can watch Goldman Sachs
rising stock to get a sense if such
legislation has any serious chance. If the stock
holds up, Dodd's effort will appear to
be a symbolic effort to appear critical of Wall Street for
his re-election efforts in 2010.
The hypocrisy in his behavior just has to be noted.
He played an important role in
curbing regulation of home loans and allowing Fannie Mae,
Freddie Mac and Bank
Of America to make unsafe loans. In return, he got
special treatment from Country Wide
in his own loans's rates. TigerSoft Blogs about Dodd: Sweetheart Bill for
Mortgage Lenders
and BAC.
Lies
about foreknowledge AIG bonues.
The biggest
threat to the rally, I would say, comes from the probability of
more big bank failures. These banks' stock charts look
awful. I would be surprised
if they escape full bankrutcy and government takeover. The
bank charts below
are of
ABK (.8), 11/10/2009 - warns it may file for
bankruptcy.
ADVNA(.105), - filed
for bankruptcy 11/9/2009
AMFI (.4), -
GFIG (4.92), lower quarterly earnings...
IBCP (.74), Michigan bank... Chap 11
KEY (5.76),
MBI (3.75), Bankruptcy soon.
PVTB (10.2) Downgraded
to neutral JPM.
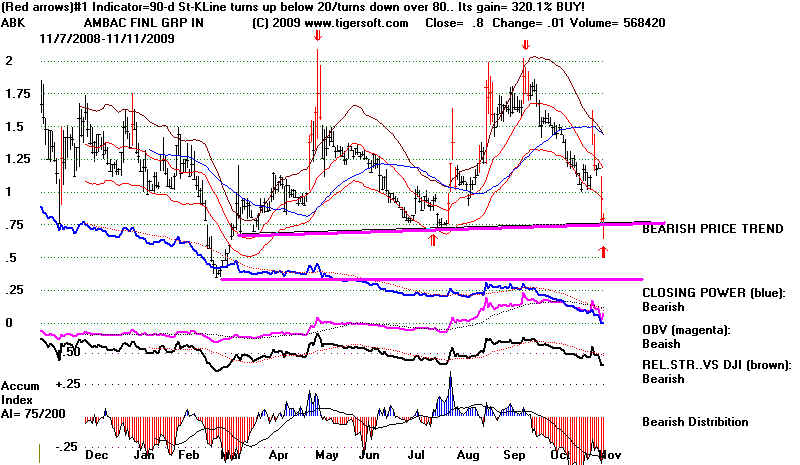
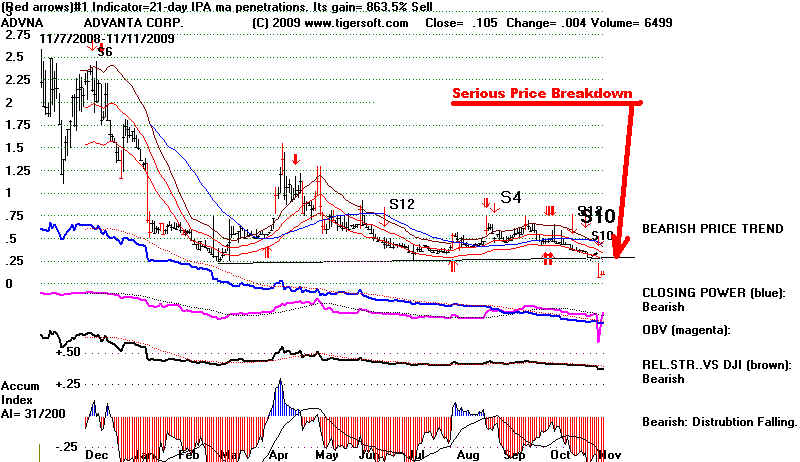
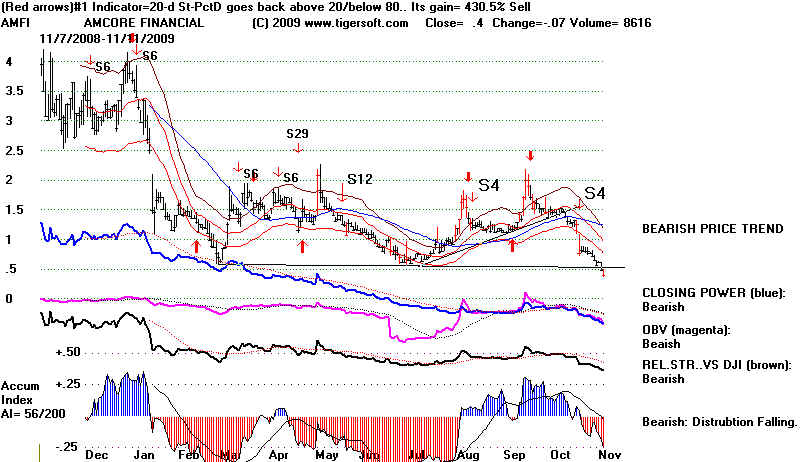
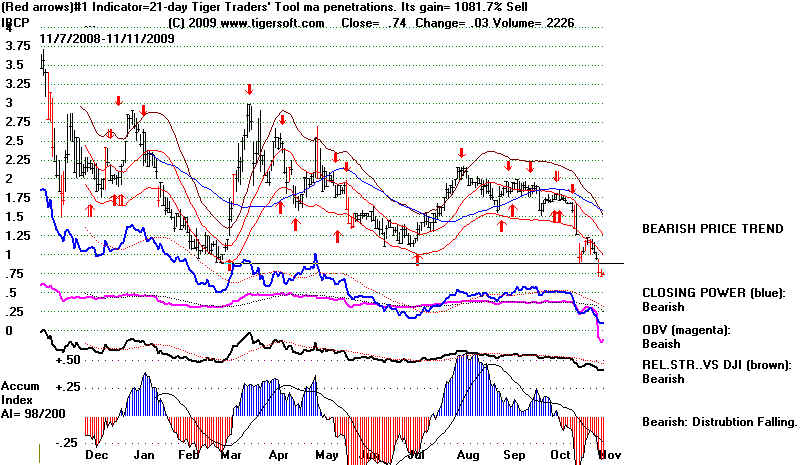
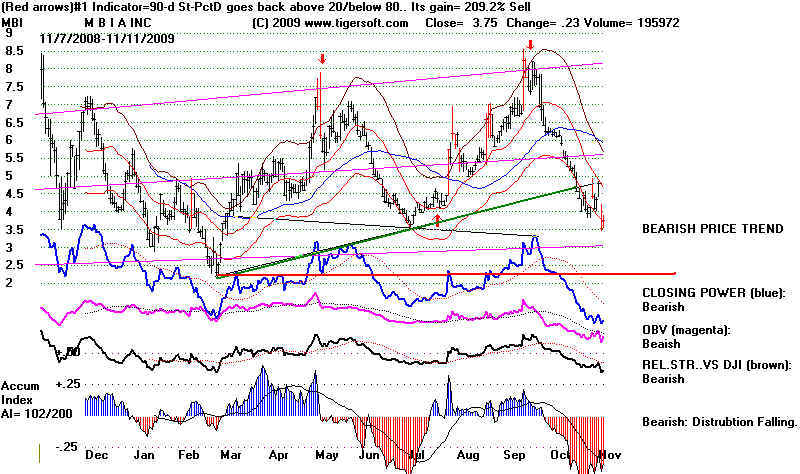
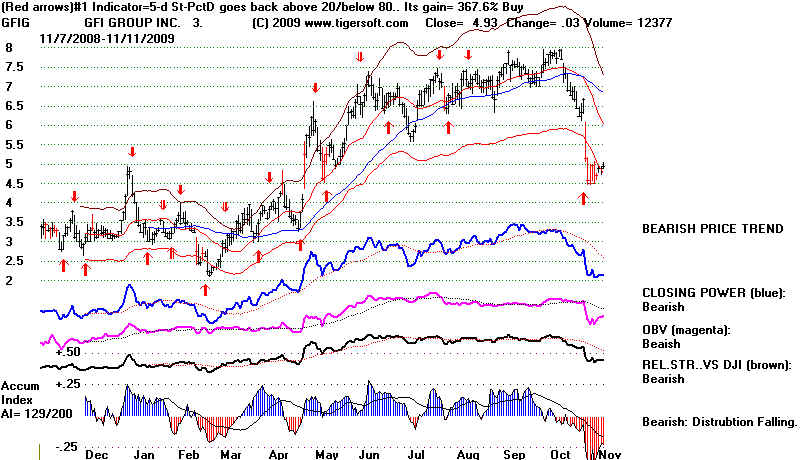
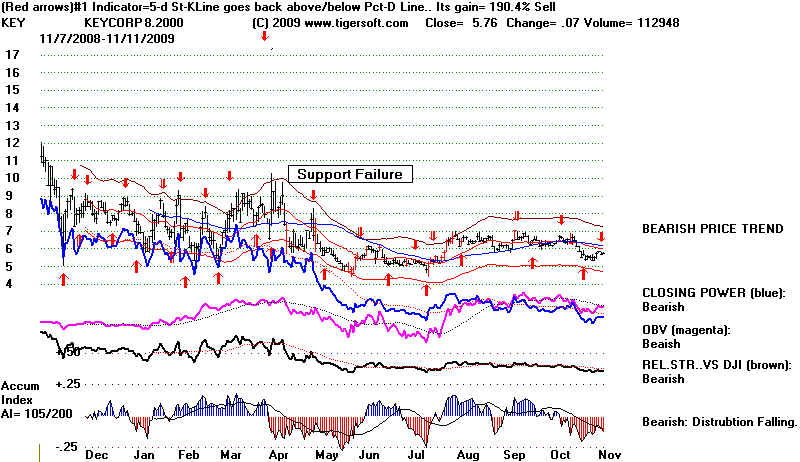
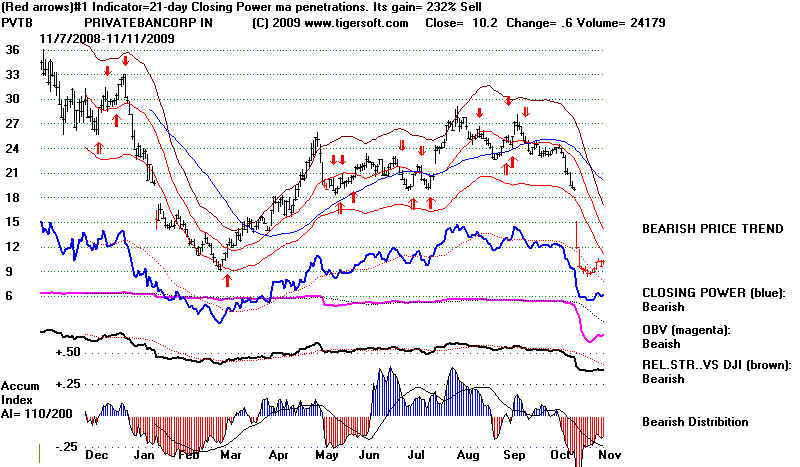
=========================================================================================
11/10/2009 Peerless Sell S12 Is Operative.
But Fighting The FED Is Not A Good Idea.
Use Our
Short-Term Trading Tools To Judge When This Rally Is Over.
Why is the DJI
rallying against the Sell S12 Peerless? The simple answer is that the signal was
premature for
Gold, Foreign ETFs, the DJIA and the SP-500. A 5%, or even an 8% paper loss
can occur, though
this is rare. The Sell S12 has not yet been proven invalid for the QQQQ
or lower priced
stocks. With Gold soaring, I would expect the present rally to end badly.
Over and over,
steep rises in Gold bring bear markets. Look back at the period 1976-1980.
Gold quadrupled
under the Democrat Carter then. But look at all the bear markets that
also occurred:
1977, October 1978 "Mini Massacre", October 1979 "Mini Massacre"
and Bunker Hunt
fiasco in 1980. Then a bear market followed in 1981-1982. As I showed
last night, years
that end in "0" usually do badly.
Still the
rally may continue still longer. Never before has the FED pumped so much money
into banks.
The margin by which this is true is massive. This new bubble seems inevitable,
as the FED
gambles that it will lead to a Main Street recovery before the market bubble breaks..
 http://www.marketoracle.co.uk/Article13574.html
Why is there no
new Sell S9 with the P-Indicator negative at the upper band? This is because
in November, our
S9s need also to show a negative divergence from the Accumulation Index and
the DJI needs to
be still more above the 21-day ma. Since 1929, the only November S9s previously
occurred in 1980.
There were two in the year, The DJI was then 4.2% over the 21-day ma and
showed a current
Accumulation Index value of -.10 and -.065. So, to get a new Peerless sell
on this rally we
will need to see the Accumulation Index drop more than .10 from its current levels.
And so, a narrowing rally continues. After all,
Goldman Sachs people have a lot of money to buy
things
with! Has the FED and Treasury made $3 trillion available to banks on
condition
they buy and not sell? Is an economic turn-around just ahead for Main Street?
Is this
just a reflex pullback to the point of breakdown in the DJIA, around 10,800?
Time may
answer these questions. Right now our job is figure out how we will know when the
present
rally is over. This seems the right question; this has become a trading
market as
we work further and further out along the DJIA's narrowing rising wedge pattern.
And with a
Sell S12 extant, the next decline might break the key A/D Line for the
NYSE.
This rising A/D Line has lastrf 8 months. That makes its integrity very
important.
We have very good
short-term trading tools. Use them. We have played the rally. That has
been
better than being
stubbornly short. Now watch for signs of a reversal downward. In particular,
watch for:
1) The CLosing Power of the main ETFs breaking their recent uptrend-lines.
See QQQQ below. DIA SPY IWM
2) The red K-Line of the 10-Day Stochastic on the DJI breaking below the blue
10-day Pct D. See DJI below
3) The optimized red Sell Signals on the ETFs switching from Buy to Sell.
4) The Chaiken IDOSC for the DJI reversing direction. See DJI below.
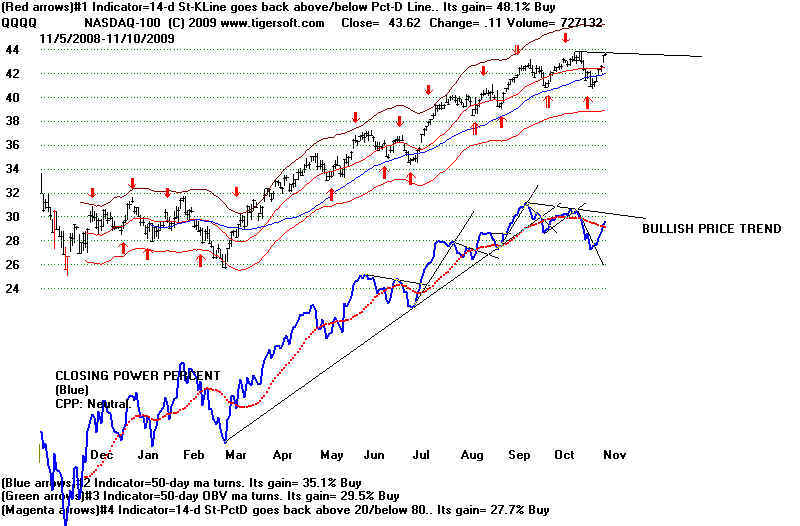
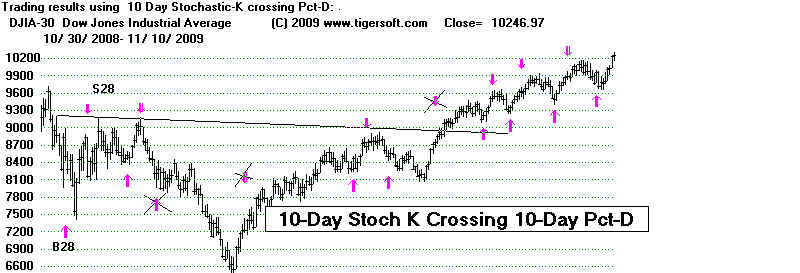
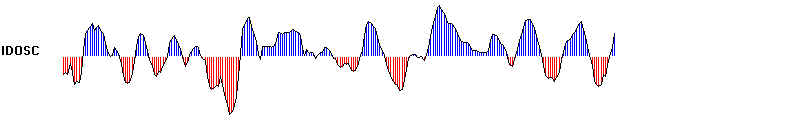
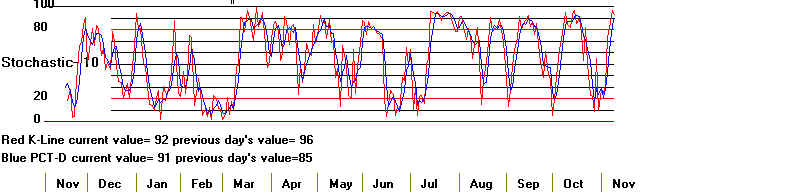
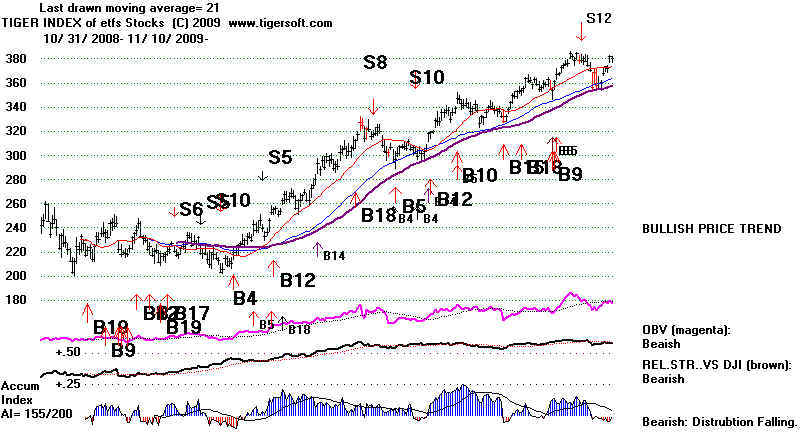
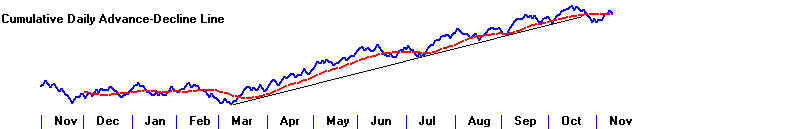
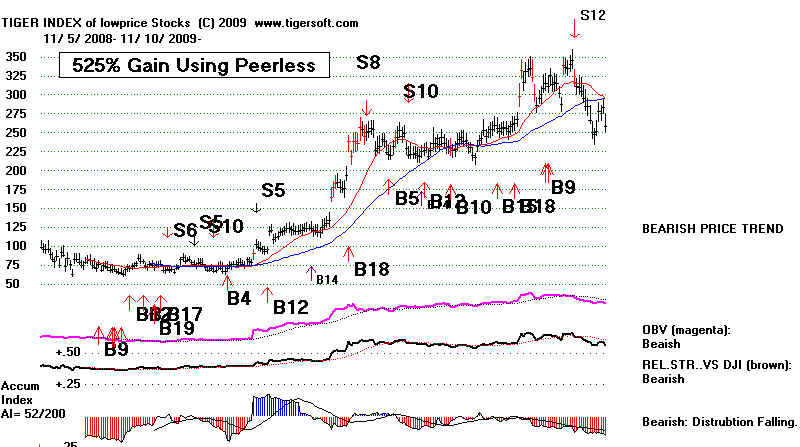
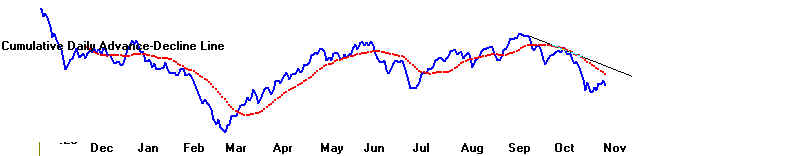
===================================================================
11/9/2009 Peerless Sell S12. Bearish Head and Shoulders Patterns' Apexes
Bullishly Exceeded.
This is bullish
but the rally must continue, as the moves above the apexes have so far been only marginal.
Peerless Losses
Can Occasionally Be 5%, even 7%. It's Best To Use More Than Peerless.
More and more
this looks like a market out of the 1970s when there was high unemployment and
a weak Dollar and
rising Gold prices. The difference now is that interest rates are so low, they can
only change by
rising. Next year, 2010, will likely be problematic. Buying and holding in
1900, 1910, 1920,
1930, 1940, 1960,
1970, 1990 and 2000 would gave been costly and/or highly nerve-wracking. `1950
and 1980 were the
exceptions, but these featured the Korean War Sell-off and the Bunker Hunt melt-down.
Using Peerless to
trade would have worked out much better than buying and holding.
The rising
resistance line in the DJI's rising wedge pattern crosses about 10,350. It would be
surprising
to see the DJI
exceed that without much more volume. I take the recent rally to be a continuation
of the uptrend
within this rising wedge. Another retreat back below 10000 likely unless volume
increases.
Breadth, judging
from the P-Indicator turning negative, is weakening. That will limit the rally,
though
it will focus
more and more hot, high-performance money into fewer and fewer stocks making new highs.
A break in the
well-tested 8 month uptrend would be quite bearish. Watch the A/D Line
closely.
Wait for the
CLosing Power in your favorite to break its uptrend to Sell. The 10-Day Stochastic
and IDOSC (not
shown here) are still rising. Their turning down will be a short-term sell.
Internals are
still low despite the DJI's reaching 2.9% over its 21-day ma. In fact, the
P-Indicator stands
at a -31.
If these conditions had been present a month ago, there would have been a Sell S9.
But the
back-testing has
shown the need to take into account the ordinary bullishness of the period form the
third week of
November to the end of December. Peerless makes it harder for S9s to be produced
from October 20th
to December 31st. Peerless Sell signals are still possible between now and the
end of the year.
They are just not as reliable or profitable.
Peerless Sell Signals in November and December 1929-2009
Signal
Number of
Occurrences Avg. Gain
Percent That Were Profitably Traded
if Short Sales Were Taken on The Signal
and Closed Out on The Next Peerless Buy
----------------------------------------------------------------------------------------------------------------------------------------------------------------
S1
2
4.9% 100%
S4
1
11.8% 100%
S5
5
0.6%
40%
S6
4
1.1%
50%
S8
2
2.1%
50%
S9
8
5.5%
100%
S10
2
1.5%
50%
S12
12
2.8%
67%
As I state in the
HOTLINE introduction above, our predictions are not solely reliant upon the
Peerless
Buys/Sells. We usually try also to consider
(1) Seasonality -
From 1966 to the present, the DJI rises 59% of the time over the next week,
72% of the time over the next month
80% of the time over the next two months.
(2) the actions of the FED -
See recent comments about why Fed keeps rates low before and during holiday period.
August 18,
2007 Federal Reserve Discount
Rate Changes and Their Effect of Stock Prices: 1965-2007
January 29, 2008 Interest Rate Cuts Won't Fix What Ails The American Economy..
(3) Chart Patterns - Now we are
watching the moves by important indexes' price above the right shoulders
of their head and shoulders' apexes. This is bullish.
See NASDAQ, QQQQ, IWM, SPY, SLV.
(4) Closing Power Ttrends. The breaking of CP down-trends is a Buy.
(5) NYSE A/D Line. The breaking of A/D Line down-trends is a Buy.
(6) Yearly Optimized Buys and Sells. The tops of the TigerSoft charts show this.
(7) Moving Averages. Bounces up from a rising 50-day/65-day ma should be traded to
the upside..
NYSE New HIghs reached 160 today,
There were no new 52-week lows on the NYSE. The NASDAQ
was not so onesided. But there were still 80 new highs. Our Stocks' Hotline
has only one ETF
posiiton, GLD, which we have been long for some time. Enough stocks meet our
Explosive Super
Stocks' criteria to make our long to short ration among stocks to be 3:1. If you are
using our Elite
Stock Professional Service, look at the stocks that qualify.
They are saved into AUGB1224 and ELITSTKS data downloads/ We want to see all Bullish
notes
on the right side of the chart, an AI/200 score above 140, a current AI value (IP21) above
+.25
and Closing Power making a new high. A new price breakout on red high volume above
flat or nearly flat resistance is brings an augmented B24 if there has previously been a
bulge
of Accumulatin above +.50 .
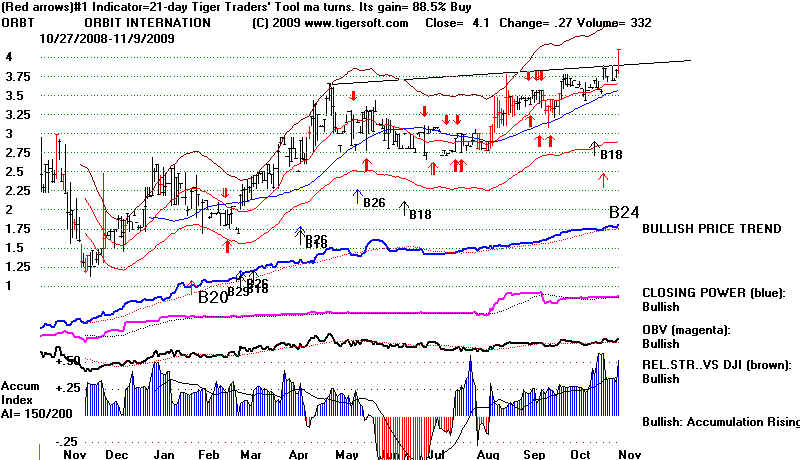
Looking Ahead: 8 of the 10 years ending in "0"
since 1900 have been
down. In the exceptions
there were steep
intra-year declines.
Performance of The DJIA In Years Ending in "0"
DJIA at end
DJIA at end of
of year.
year ending in "0"
-----------------------------
-------------------------------
1909 99
1910 81
1919 109
1920 72
1929 244
1930 170
1939 151
1940 131
1949 201
1950 240
1959 679
1960 616
1969 809
540 low 1970 839
1979 825
770 low
1980 964
1989 2753
2380 low 1990 2634
1999 11497
2000 10787
2009
============================================================================================
11/8/2009 Peerless Sell S12. Watch The Emerging Head
and Shoulders.
A Move Past Right
Shoulders' Apexes Will Be Bullish. But Breaks
below Necklines Will Be
Bearish.
It Seems The FED Will
Keep Interest Rates Low Until January.
So, buy More Gold
(GLD).
The
seasonality is not so great for the next two weeks. In checking back older data, I
see declines
in the period 1915-1941
in 2/3 of the cases where the DJI was already in a rising trend. At the
beginning of the 4th
week of the month, it improves considerably. Seasonality did not work
in September and
October. It would probably to better to simply watch how the chart patterns
now resolve themselves.
The DJI is in a bearish
rising wedge pattern. Volume is expected to and is declining. More volume
is needed to move the
DJI past 10400 by very much. Good breadth has been the saving grace
for the post March
rally. The more gradual NYSE A/D Line uptrend is still intact, but the steep
and well-tested trend
upwards by it has been broken.
Gold ETFs are our
favorite group now. Gold stocks should breakout soon. Newmont is likely
finally to get past 50
again. That will set up a target of 62. Foreign ETFs are on the verge of
getting past their
resistance. See chart. This is what a weak Dollar brings.
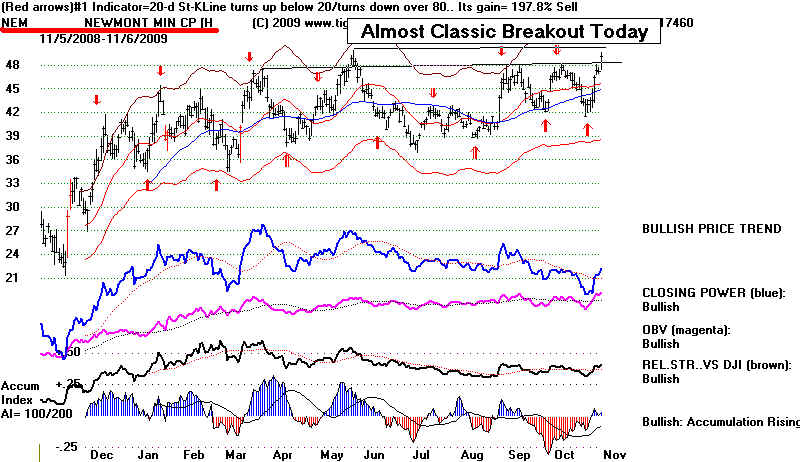
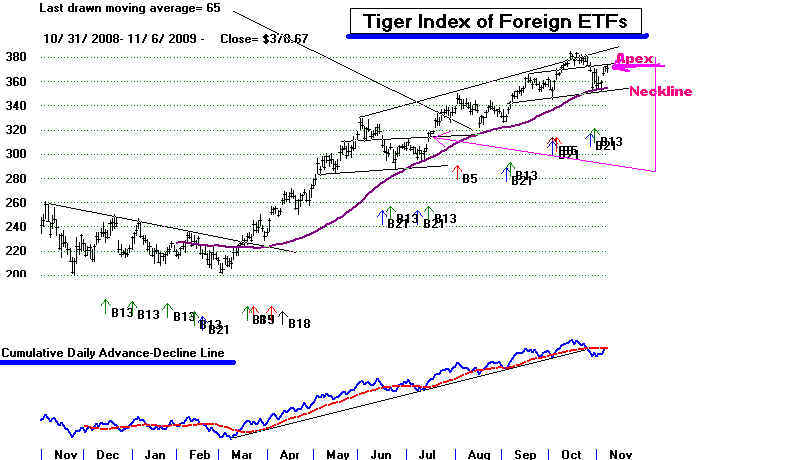
It is bullish that key
averages, like the DIA (DJIA) and SPY (SP-500) have readily bounced up from
their rising 65-day ma.
But we see a head and shoulders pattern in the the QQQQ, Value Line, XLY
Finance Stocks and
Russell-2000 (IWM). This provides us an excellent way to play the market.
Above the apexes of the
right shoulder will be bullish. Below the neckline will be decidely bearish.
Retail stocks (RTH) are doing well now. They are sometimes
among the last groups to top out.
We can watch XLY's
developing head and shoulers pattern unfold to our advantage. .
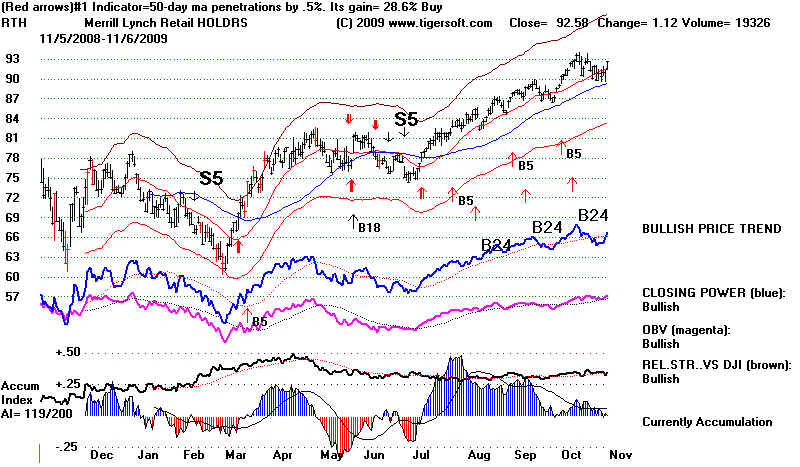
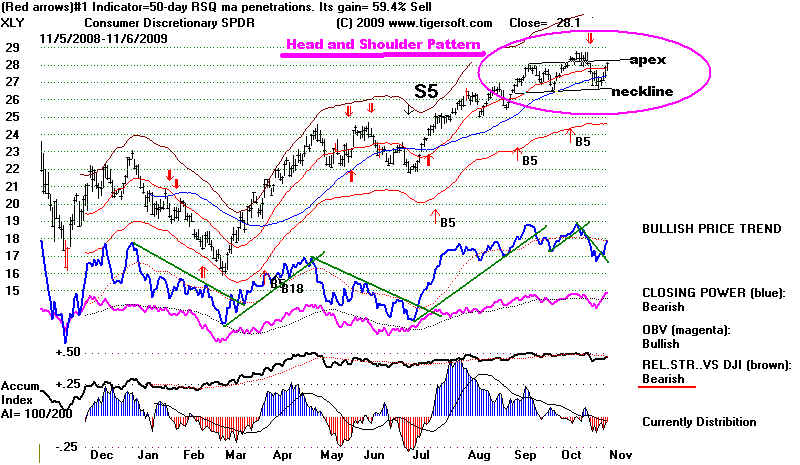
Realize that tops are
usually made gradually, as more and more groups stop making new highs.
That has already
happened with low priced stocks, but bigger tech stocks
are generally doing
well, as the weak Dollar is helping their sales. Their strength and
Gold's are pretty good signs
that traders do not
expect the Fed to rais einterest rates until after the coming Holiday season.
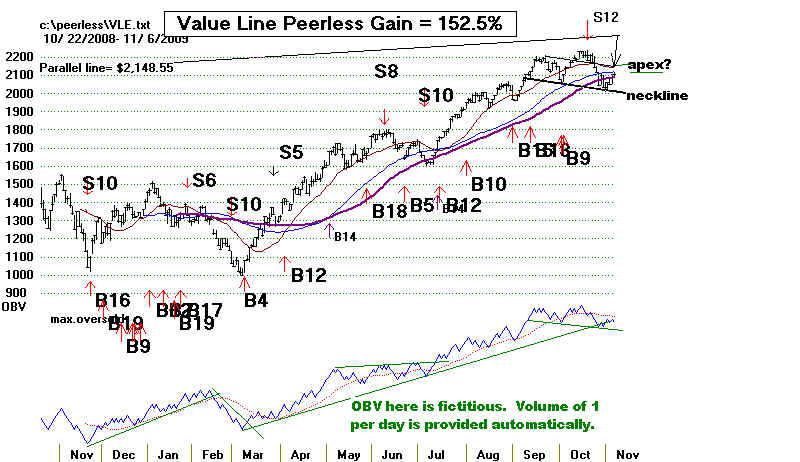
The Sell S12 at 10000 should
make us nervous, because so much of the rally was fueled by banks
buying with money the
Fed has given them at nearly 0%. But is there going to be a change in
Fed policies with
unemployment now officially at 10.2% and with the key retail season just ahead?
No. Not likely.
More strength in Gold
is expected based on technicals. That puts pressure on the Dollar and that
may make the Fed change
their mind early next year about keeping rates so low.. Since the
market looks ahead, we
may see a 12% decline early next year, or perhaps very soon if prices
turn down sharply this
coming week. For this watch to see if prices fall back from the apexes on
this page or whether
they shoot past the apex resistance levels. I said last week that what happens
next depends on and can
be predicted by watching to see whether the QQQQ gets past the apex
of its potential right
shoulder. I would say watch all the indexes here for the same thing.
The QQQQ
surpassing 43.05 would be bullish.
But a breaking below 42.80 would be bearish.
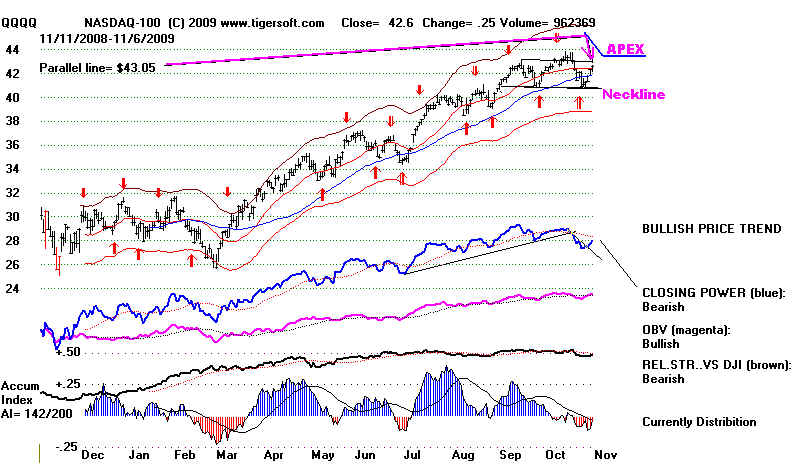
Retailing and Credit Card Stocks Are Looking Up. Traders do not expect a rise in
interest
rates until
January. That would explain strength in Gold and
Visa, Master Card, American
Express..
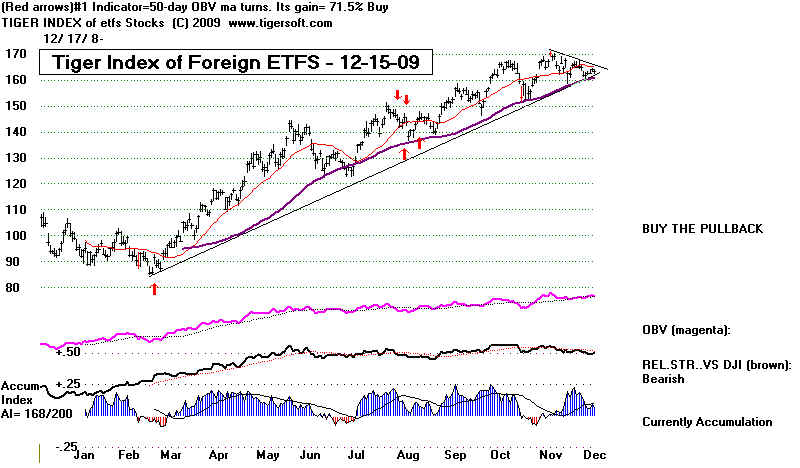
11/5/2009 Sell S12... Closing Power Down-Trendlines Were Broken for
Short-Term Buys.
The 5% Range in
the DJI Is Narrowing. The Rising Wedge Pattern Seen Now in the DJI and the
head and shoulder
patterns seen in the QQQQ, IWM, Dilver and Oil stocks are not a good signs,
though it will
take weakness and a break below the neckline supports to confirm the patterns'
weakness.
Will The Bullish Seasonality and more FED loans to banks be able to hold the market up
till next year?
So, long as the well-tested more gradual uptrending NYSE A/D Line is not broken,
I would say the
market is OK. But the upside looks quite limited. December weakness in 2007
shows that there
are no guarantees that the market will not decline in December.
As the market
rallies up from the 65-day ma, it is led now by Gold (not gold stocks) and foreign
ETFs. These
are shown in their charts below. Their strength is a reflection of fears that
Bernanke
and the Federal
Reserve are going to continue to keep interest rates for banks at almost 0 and
are willing to
allow the US Dollar to weaken further. Bank stocks do, as a whole, show lots of
red Distribution.
But they did not break their neckline-support on the recent decline. Such a
breakdown
would be bearish.
At some point, Bernanke will not be able to successfully defend his throwing
trillions
down the bank rat-hole. Too harsh? The latest reports still show NO evidence that
banks have used
their TARP and
FED subsidies/bail outs to make any more commercial and small business loans
than they did six
months ago! Will the zombie monopoly banks much longer be allowed to use this money
more for trading
than making loans? That political vulnerability lies behind the heavy red
Distribution
in Finance
Stocks.
10/25/2008 So When Will Banks Give
Loans? - NYTimes.com
1/26/2009 Lending Drops
at Big U.S. Banks - WSJ.com
According to data compiled by Bloomberg,
banks made
syndicated loans
of $79.6 billion during the first quarter
of 2009. But over the same period in 2008, U.S. banks $203.2
billion loans – a 61% difference from year-to-year.
In the first quarter of 2007. In that three-month period,
the U.S. issued $446.4 billion in loans.
8/13/2009 "Tight-fisted" Banks Not
Making Small Business Loans
10/15/2009 - Trading
keeps Citigroup, others in the black.
"The bad news is that they're not making loans to consumers
and businesses," said market analyst Edward Yardeni. "That
could come back to bite them because these trading gains will
only last so long."
10/21/2009 Small Businesses Still
Not Getting Loans
Small
business loans are "too much trouble."
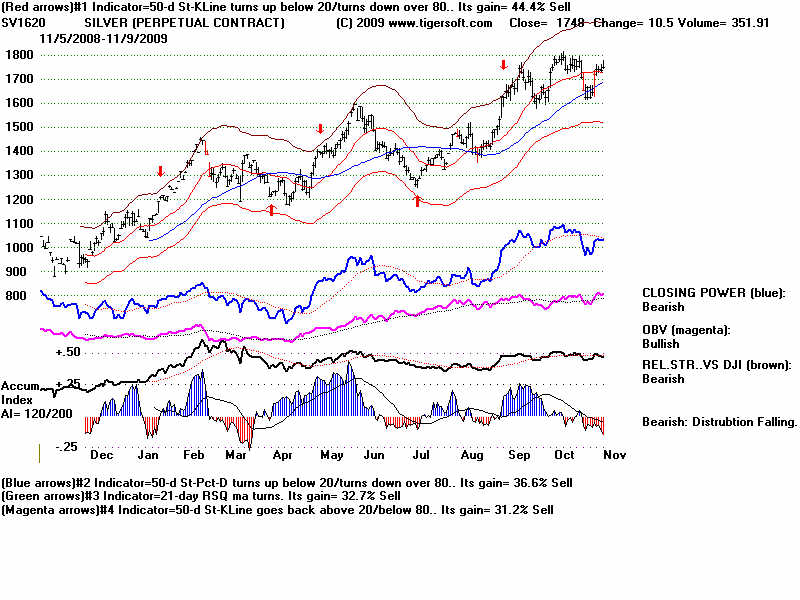
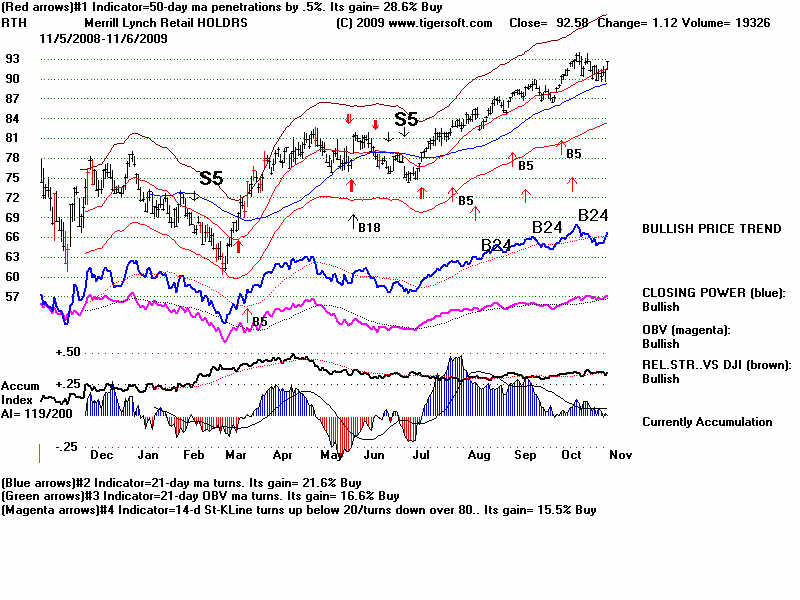
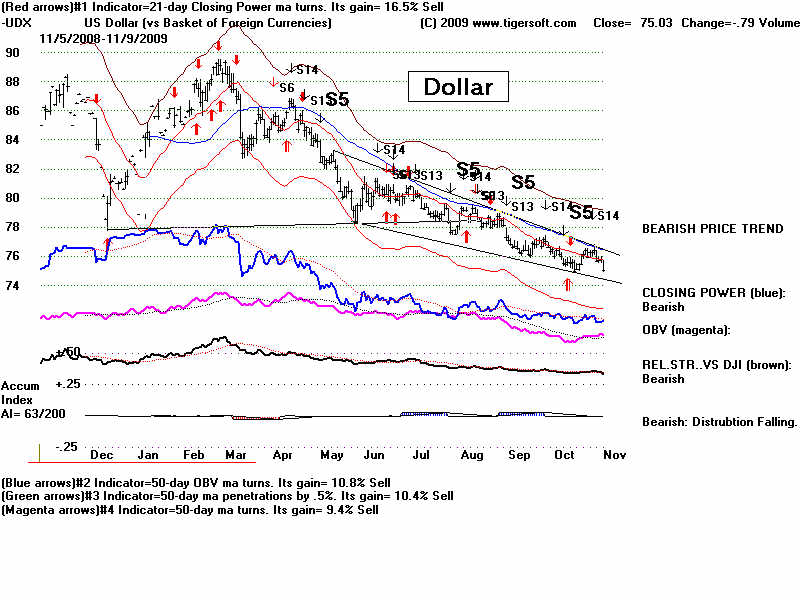
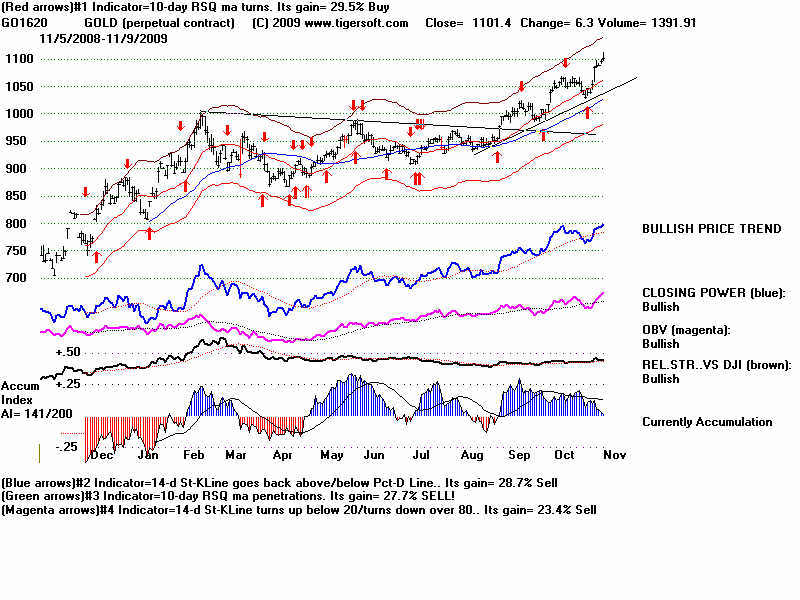
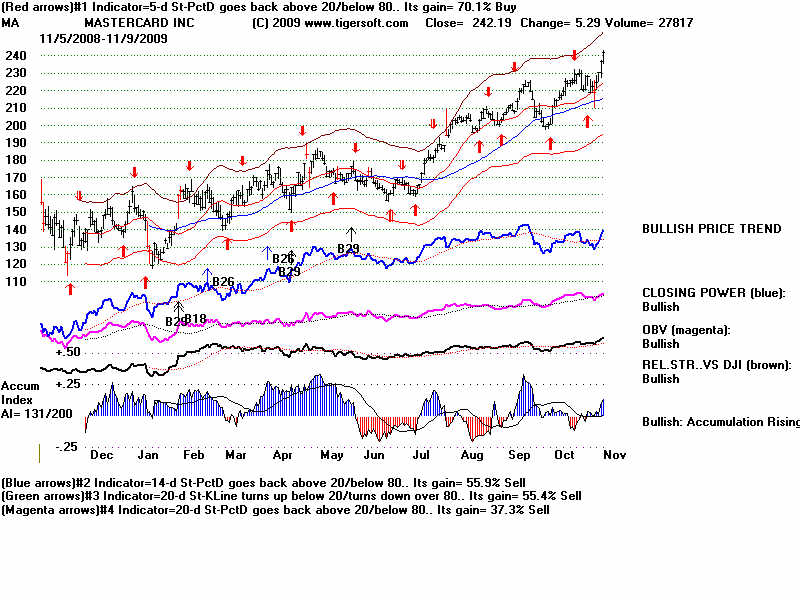
WHY ARE FINANCE STOCKS SUFFERING FROM SO MUCH DISTRIBUTION?
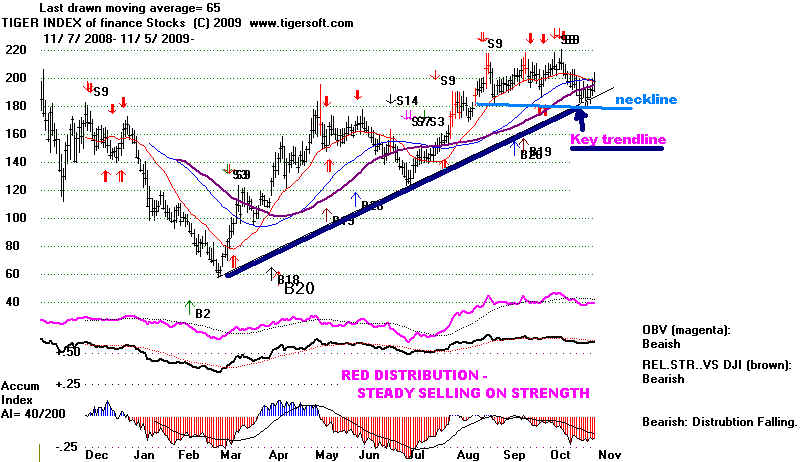
GOLD is at an all-time HIGH! In this condition, I would only take
the optimum BUYS.
I would disregard
the SELLs. Gold strength is apt to continue. I project a minimum upside target
for GLD of 130!
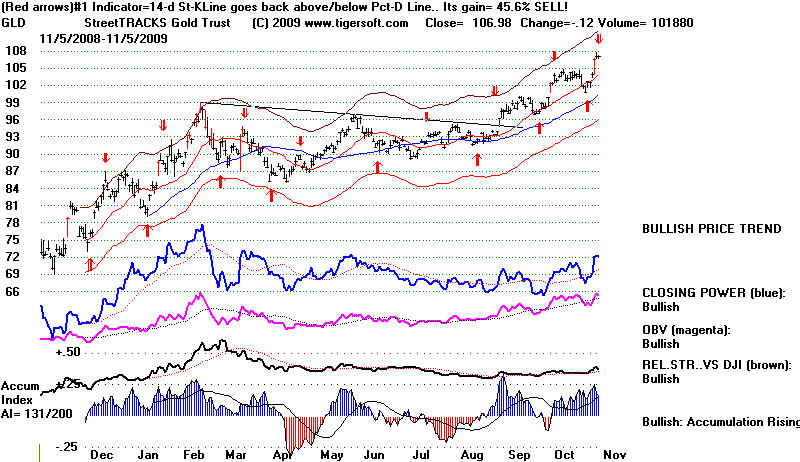
Foreign ETFs have jumped up nicely off the rising 65-day ma. Not shown here, I would
BUY
ILF, the ETF that represents 40 leading Latin America stocks.
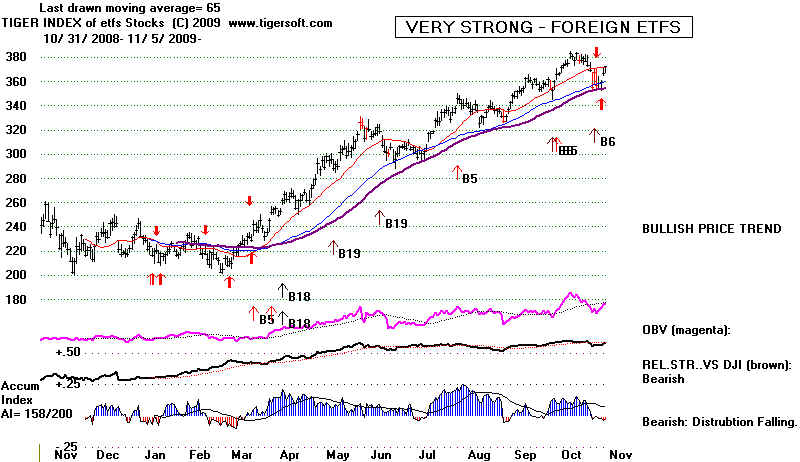
With the DJI in a narrowing, rising wedge pattern,
so that moves are apt to be limited until
there
is a resolution, this seems a good market to use short-term tools. The chart below shows
recent value of using a 10-day Stochastic, the Chaiken IDOSC, the partial chart regression
channel
and
the rising 50-65-day ma. Rising wedge price patterns usually bring significant
breakdowns
below
support.
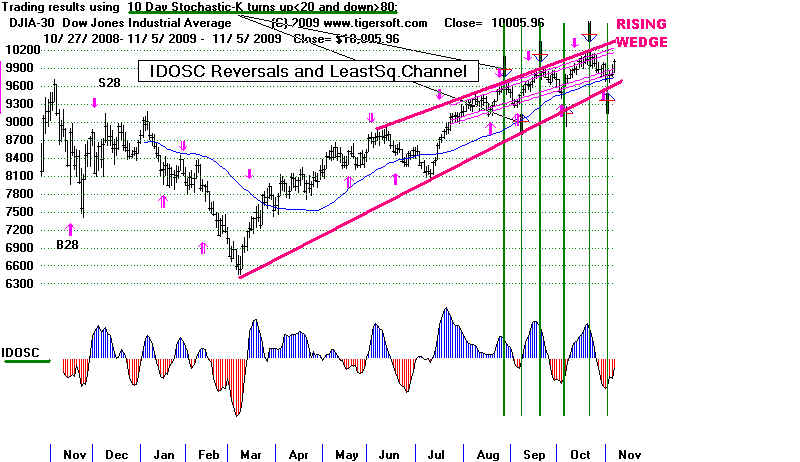
The
scenario I set forth for a NASDAQ-100 rally
up from a neckline creating a potential head and shoulders
pattern has unfolded. I discussed the reasons for closing out aggressive short
positions two days
ago. That reasoning still seems sound.
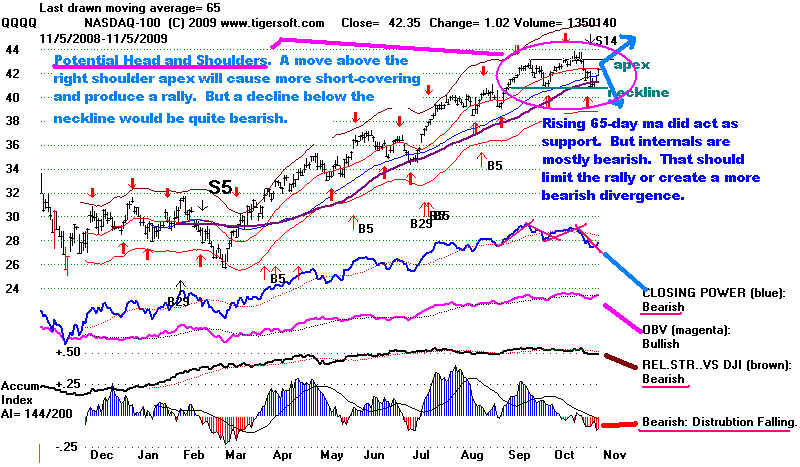
The chart of the broad Russell-2000 shows a down-sloping head and shoulders pattern
forming. This is a warning that breadth is weakening. However, at the end of
the year
this is less bearish a development, as it owes to trading with taxes in mind.
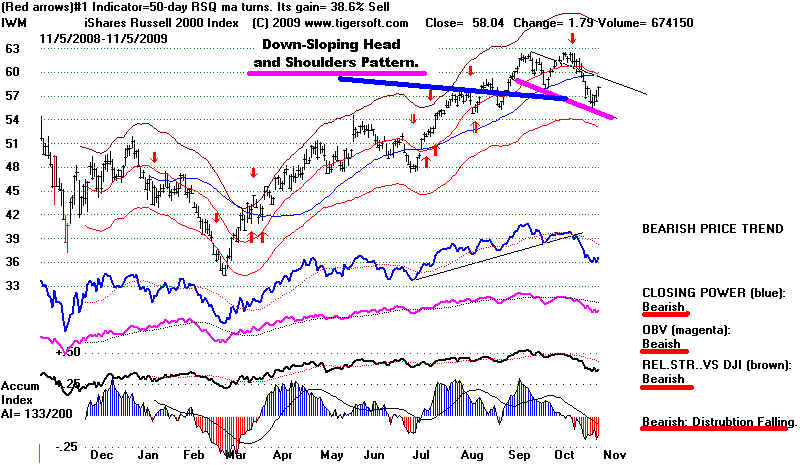
=============================================================================================
11/4/2009 Sell S12...
Closing Power Down-Trendlines Are
Still Intact.
The DJI's lower band at
9500, 300 points lower, still seems a reasonable target for this unusually
well-defined and
controlled downtrend. The regularity of the DJI's decline with parallel, falling
support and resistance
lines suggests professional control and manipulation.
THe late sell-off
Suggests this, too. So, it may spill over to Thursday
and Friday, as the key
Peerless internal strength indicators did slip a little today. The P-Indicator and
the Accumulation Index
both turned negative. That makes a Buy B9 at the lower band less likely.
But we just have to wait and see. A clear break in the downtrends of DIA's, QQQQ's
and SPY's
CLosing Power
downtrends would be bullish enough to suggest another challenge of 10,000 on the DJIA.
But note
that the Opening Power is rising for the DIA (the DJI's ETF) while its CLosing Power
is falling.
Bearishly
that means that the public and foreigners are much more bullish than professionals in the
US are.
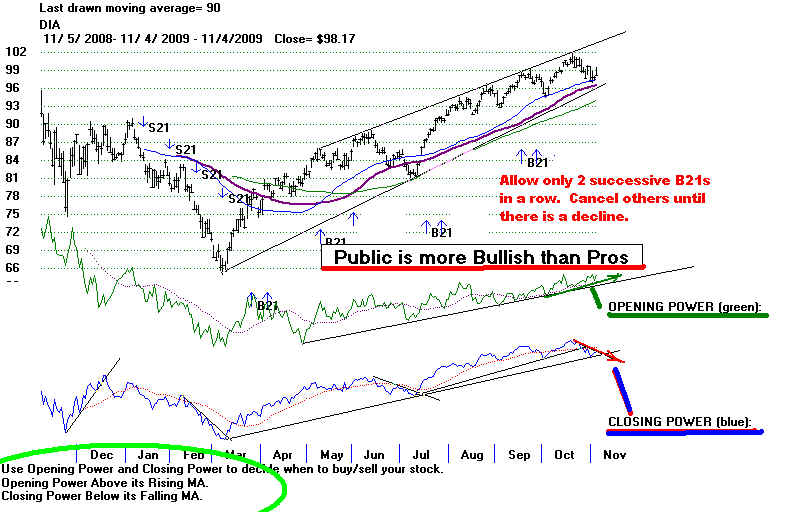
The sense that the
Dollar still is very weak is the over-riding force that is guiding GLD higher
and higher into
all-time higher territory where the path of least resistance is UP. SLV, which
responds more to
industrial demand, is now at the apex of a right shouler in what may be a head and
shoulders pattern.
Watch SLV. A decline would mean that the bearish economic conditions are
are more powerful than
the speculative inflationa-fearing forces.
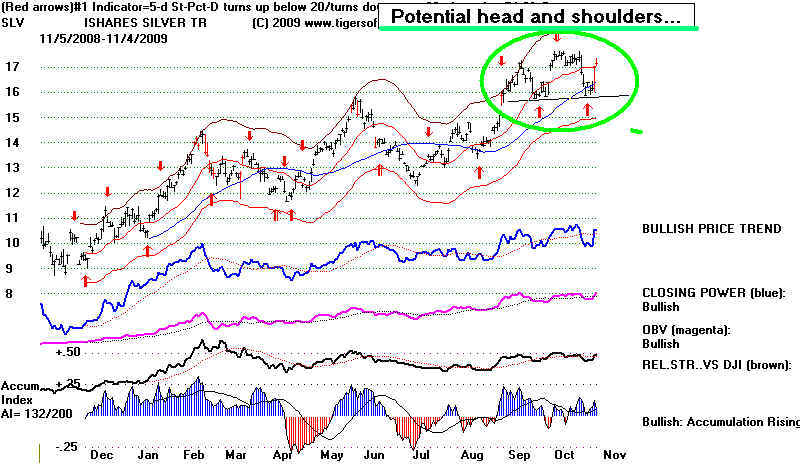
Foreign ETFs are
acting stronger than the DJIA. The US is a profoundly weak link in the international
financial system.
Where once it led the world out of economic slow-downs, now it is a heavy weight
holding back the
recovery. That so much money is wasted on foreign wars and bases only
underscores the
lack of American political leadership when budget deficits are so colossal.
Does the
political system
work well enough to fix what ails America now? The public pessimism that America
is heading in the
wrong direction hurts investor confidence and makes 10000 seem more and more
like a top what
amounts to a little more than a 50% correction in a larger bear market. True or not,
investing in gold
and oil stocks is reminiscent of the 1970s, a period of violent swings up and
also down.
We want ot be looking for buys in foreign ETFs, too. More on this soon.
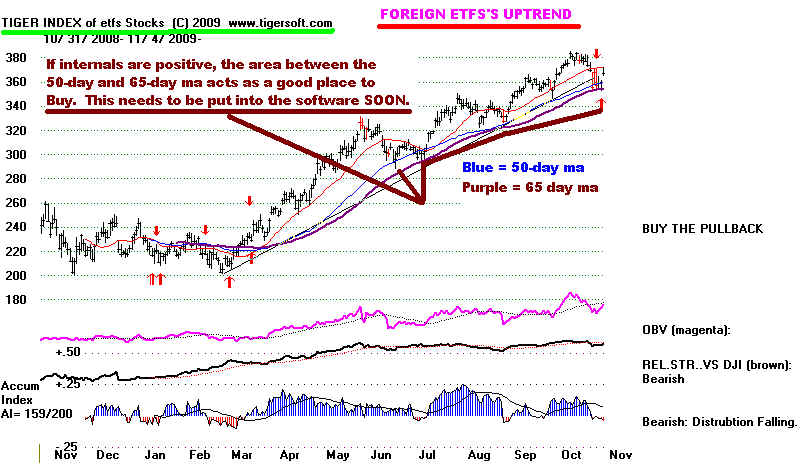
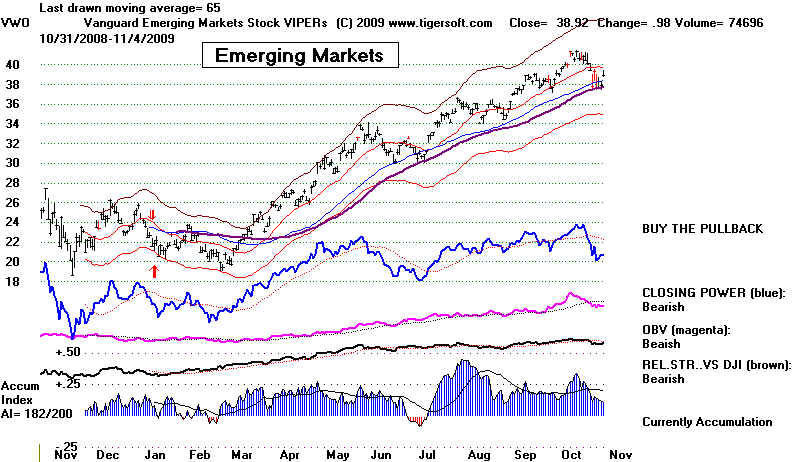
Let's use
the concept of looking for buys on breaks slightly below the rising 50-day ma, so long as
prices stay
above the 65-day ma and there are positive internals/ This seems a viable strategy
with
the bullish
seasonality of the last six weeks of the year nearing.
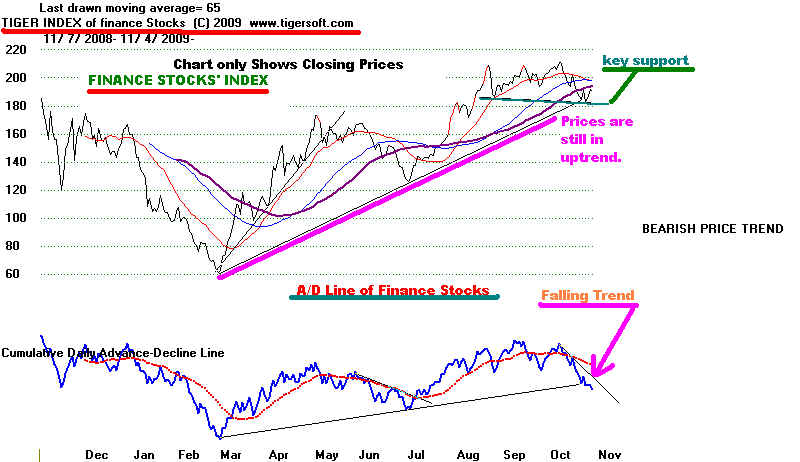
I thnk it
is bearish for speculators that the A/D Line for the FInance Stocks that make our Tiger
Index
for this
group is declining, just as is the A/D Line for our Index of 300 Low Priced Stocks.
Our Stocks
Hotline
remains short a number of weak stocks that led the market down here, are below their
key 65 day
ma and show very negative Accumulation Index and falling CLosing Power readings.
============================================================================================
===================================================================================
11/3/2009 Sell S12 Still
Stands. The Closing Powers for the major markets'
ETFS are still
declining.
But note that a strong
move up by the major indexes from the opening to the close tomorrow
would likely bullishly
break their downtrends. Look also at the A/D Line uptrend on the NYSE.
A move up tomorrow will
suggest that uptrend will hold. And since it can be used as a nearby failsafe
to sell, some traders
will probably use a rebound tomorrow to buy. The risk (a break down below
the nearby A/D Line
uptrend) seems much less than the potential (a rally back to 10,000 on the
DJI).
In my view, short-term
traders should jump in and buy if there is a strong close tomorrow. The risk
seems limited.
Here's why: Since the P-Indicator now is only a mildly negative -49 and the current
Accumulation Index is a
positive +.038, we will likely get a Buy B9 on any decline to the 3% lower
band at 9500.
Given this and the high volatility of the leveraged SHORT ETFs, I am going to suggest
selling
them on our Stocks
HOTLINE.
There is still some chance that the DJI will break below
the lower band, but we should
expect the FED to do
all they can to allay fears that interest rates will be raised much.
We are, after all,
almost at the beginning of the biggest shopping period of the year.
A rise in interest
rates would seem a very dumb move now when they are emphasizing
recovery rather than
worrying about the Dollar's decline. The sharp rise in Gold today tells me that
traders accept at face
value Bernanke's assurances that the Fed will not be raising interest
rates. Gold, GLD,
in particular, and ANV have been posted here as the best ways I know
to trade the very
bullish breakout by Gold over 1000. As I showed a month ago, a technical
MINIMUM target of 1300
was setup by the breakout above GLDs inverted head and shoulders
pattern when it
surpassed 199. Low priced oil stocks should be looked at for Buys. They
are hedges against
inflation.
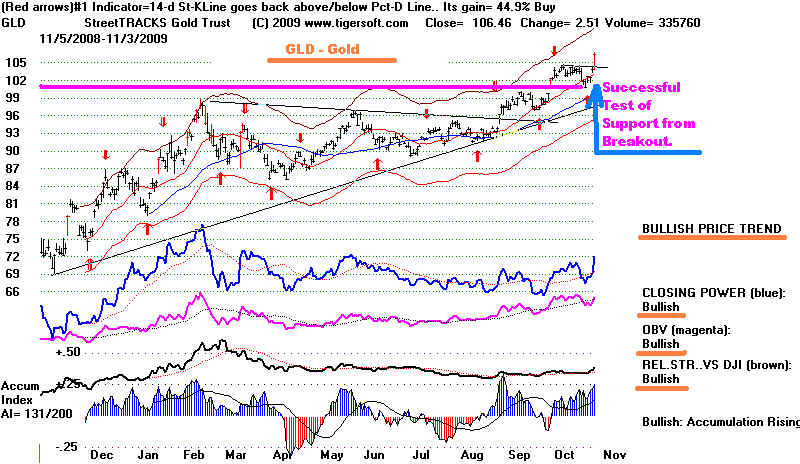
The new Tiger Index of
258 bond funds traded on the NYSE shows that they are at a key
support level.
Again, I would be surprised if the FED is not aware of this.
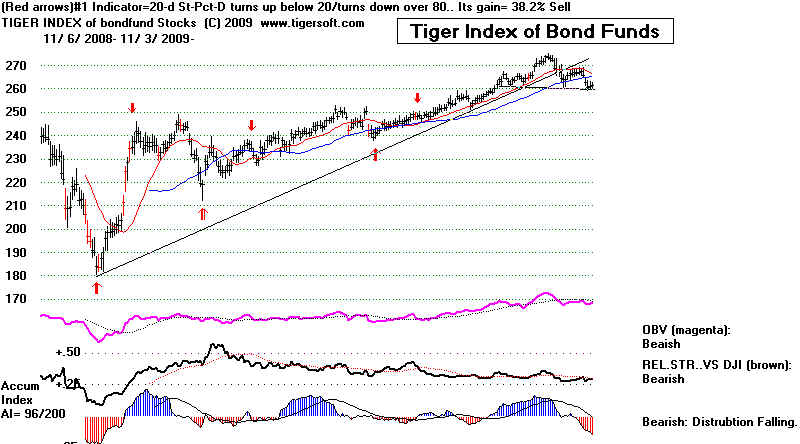
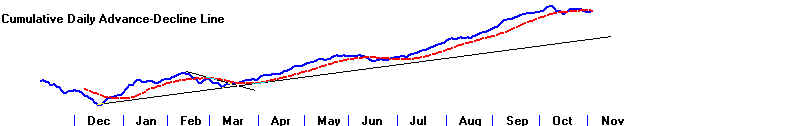
Market Seasonality will
soon enter the very bullish period from around the 15th of November
to early January 2010.
Though the next 10 trading days have usually been bearish, the odds
now of the DJI being
higher in a month are 64.1% and 79.5% after two months out, when we
use the Tiger program
to look out from a specific date for all the years since 1965. Past bullish
seasonality does not
guarantee a rally now, of course. But it is a factor, so much so it will be
very hard for Peerless to
give a Sell signal unless divergences are much greater than now.
Three scenarios should
be posited when a price pattern develops such as we now see in the
QQQQ. Scenerio A
(red in the chart below) would have the DJI drop very soon below the 40-42
support.
Scenarios B and C (green or magenta) would have the DJI rally to a peak that is
about the same distance
above the neckline shown as the peak six weeks ago. A move above
the right shoulder in
the then developing head and shoulders would be short-term bullish.
But a low volume rally
with heavy red Distribution would likely bring a sharp sell-off that breaks the
neckline, as soon as it
becomes apparent that the right shoulder cannot be exceeded.
========================= 3 Scenarios for QQQQ =========================
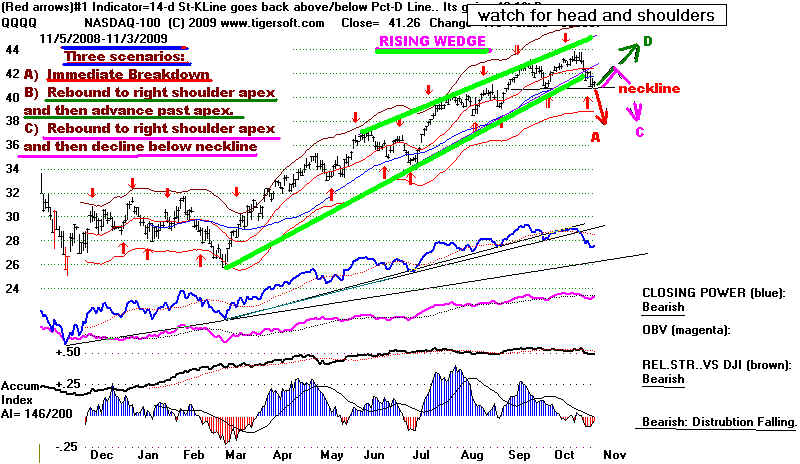
HYT - Looks Like A Good Stock To Buy
HYT is rebounding up from the support of from its rising 50-day ma.
BlackRock Corporate High Yield Fund V, Inc. is a close ended fixed income mutual fund. The
fund invests zz
in the
fixed income securities of companies operating across diversified sectors high yield bonds
that
are rated
in the lower rating categories of the established rating services (Ba or lower by Moody's
Investors
Service,
Inc., or BB or lower by Standard & Poor's Corporation).
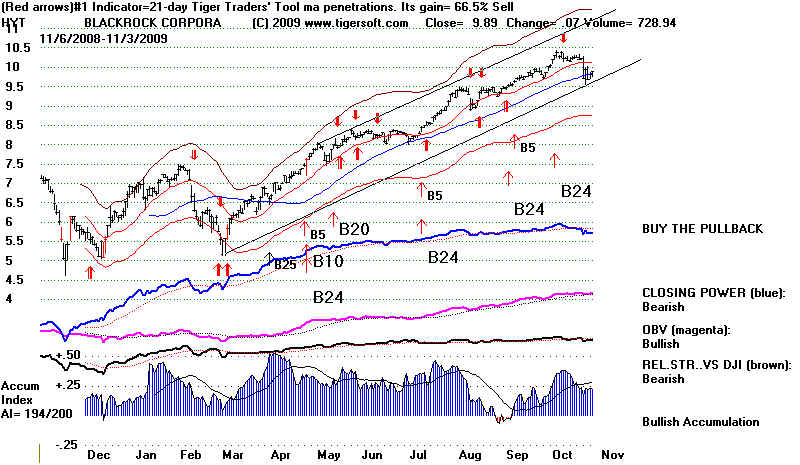
-==================================================================================
11/2/2009 Sell S12 Still Stands. Note Declining
Closing Powers for ETFS
and weak bank stocks like BAC
and hedge fund GS. Rumor has it that GS is even shorting
their own stock. It has
a long history of high volatilitu. Our stocks' hotline is long
only gold and a gold stock,
ANV (AI/200=159). There are still some high Accumulatio
stocks that are above their
rising 50-day ma, like HYT and HYV. I would hold these.
There is a 50% chance of a
good bounce off the lower band, 3% below today's DJI close.
After all, seasonality is
very bullish in late November and December. And if you want to
bet on a recovery, just below
is BITS. It shows a perfect positive score of 200 in its AI/200
readings. In fact, its
Accumulation Index has been positive every day for the last 12 months.
It sure looks like a Buy!
Even in 2001 and 2002, a few stocks like this rose. And when the
market turned up, they often
jumped a lot. We'll watch it here because of all the positive
Accumulation.
---- Very Bullish Accumulation ---
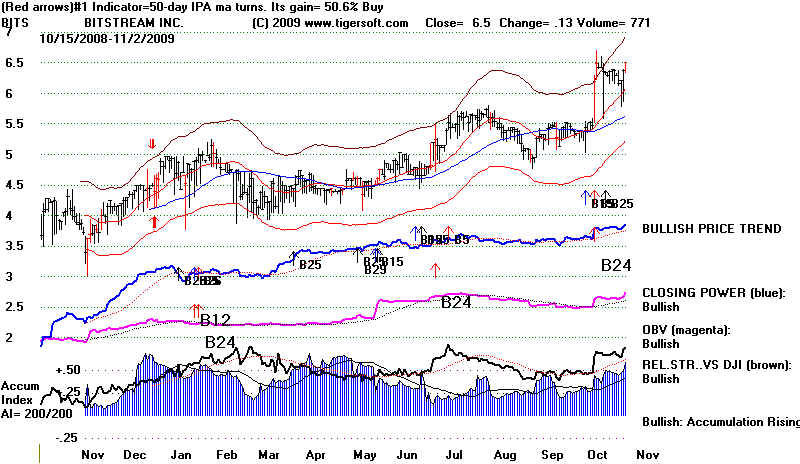
---- Very Bearish Looking BAC ---
Note
the red Buy should not be used after such a breakdown
especially when the stock shows so much Red Distribution
and is below its 50-day ma.
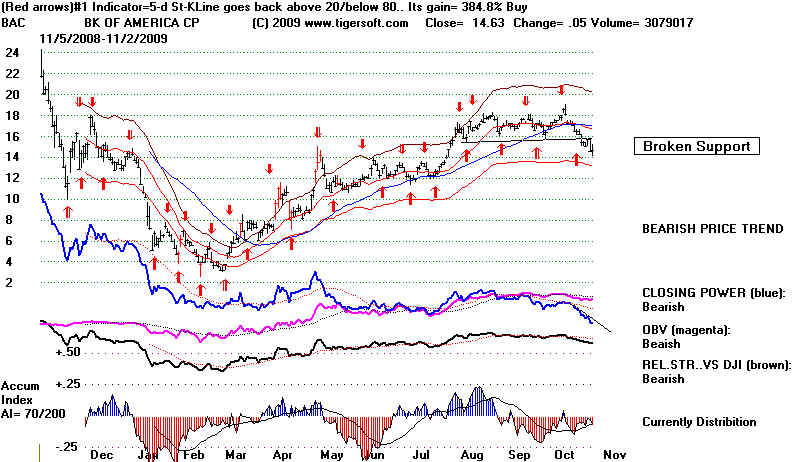
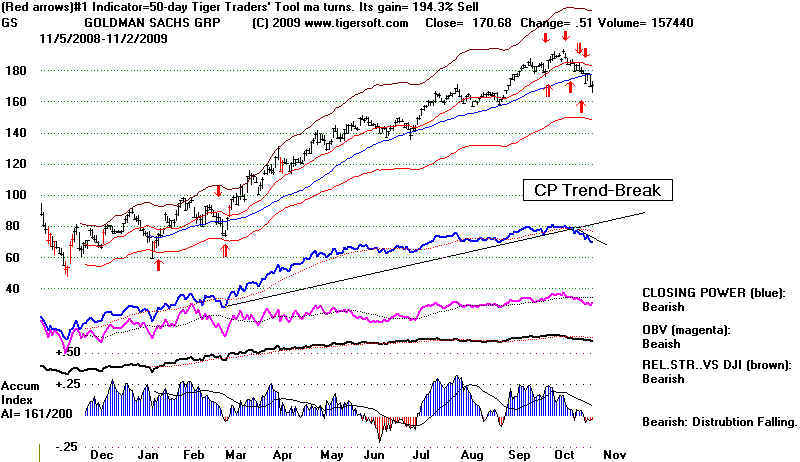
-----------------------------------------------------------------------------------------------------------------------------------------------------
10/30/2009 Sell S12 Operating.
Expect Lower Band at 9400 To Be Tested by DJIA.
It is a
bad sign when a promising rally's (like Turday's) is oblitterated the next day with a
bigger decline.
That is what happened Friday as the DJI fell
250 with a 10% increase in volume, bad breadth
and downside volume that was nearly 20x up
volume. It would be surprising for this not to spill
over to Monday. The lower band at 9528,
140 points lower would normally be expected to be support.
In 10 of the 21 cases where there was an
independent S12 in a rising market, the DJI fell below the
lower band before there was a new Peerless Buy.
But in several of these cases, the DJI rallied up
from the first tagging of the lower band and
did not fall below it for at east one month. So, my conclusion
is to wait and see what happens. Our
Stocks' Hotline holds long only gold and some leveraged bearish
ETFs for the general market. We are also
short a number of stocks. My reasoning has been explained in
the HOTLINEs of last week. I wrote
a lengthy Blog setting out the bearish case. You can see it
at http://www.tigersoft.com/SampleNightlyHotline/index.html
The breaks in the A/D Line uptrends
I take to be very significant. It
looks like the plug has been pulle don the rally in low-priced stocks.
Tiger Index of Low Priced Stocks: 2008-2009
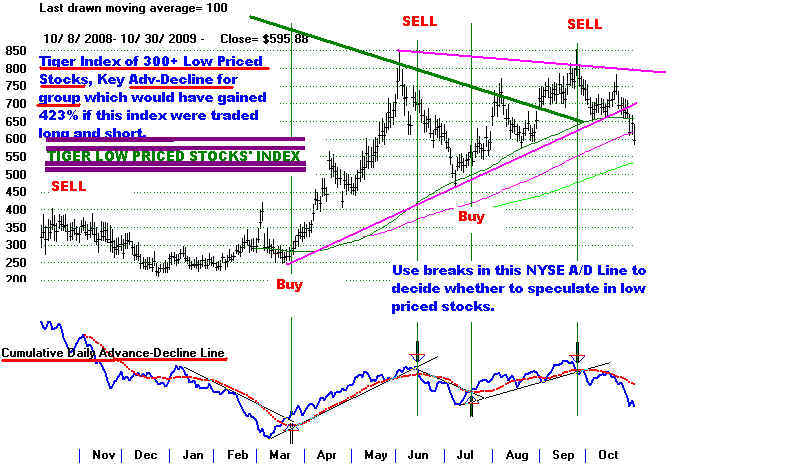
Finance Stocks, despite all the money given them at low rates approaching 0%, are still in
deep trouble,
judging from the steady red Dsitribution see
when finance stocks are plotted as an index with TigerSoft.
Their A/D Line trend is also point lower.
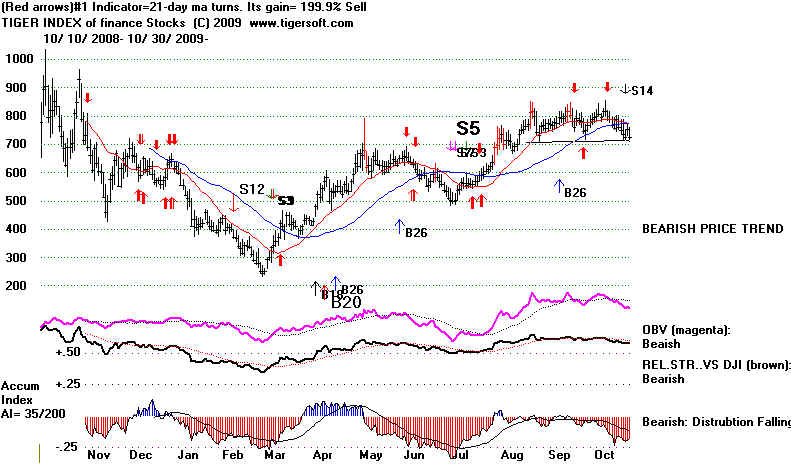
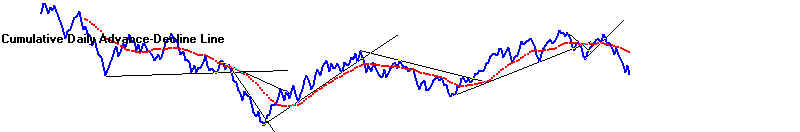
I did come across the graph below showing just how much liquidity the FED has provided
banks. It is much more than we have ever
seen. Such Fed infusions also took place from October
1999 to January 2000 (laying the basis for an
even bigger internet bubble and bust) and again
after the September terrorist attack on New
York (which resulted in a 7 month bear market rally
that ended in April 2002 and was followed by a
deep decline until March 2003. "Up
until the day
Lehman Brothers collapsed in September of last
year, it took the Fed a
total 5,012 days — 13 years
and 8 months — to double the cash currency
and reserves in the coffers of U.S. banks. In contrast,
after the Lehman Brothers collapse, it
took Bernanke’s Fed
only 112 days to double the size of
U.S. bank reserves. He accelerated the pace of
bank reserve expansion by a factor of 45 to 1."
http://www.marketoracle.co.uk/Article13574.html
I
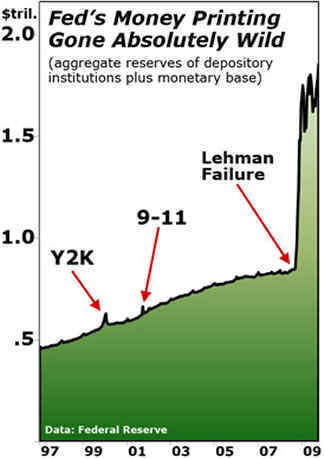
==================================================================================
10/28/2009 Sell S12 Operating.
Technical Bounce. QQQQ Is Still below Resistance of Its 21-Day.
I probably should have awaited for the DJI and QQQQ to break
their 50-day ma
before becoming to Haloweenish last night. The fact is that
though volume has been weak and
the S12 shows distribution, breadth has been constructive,
There was no Sell S9 signal.
And it is possible if the P-Indicator does not deteriorate much, we may
get a Buy B9 in a week
or two. None can occur for two weeks after a Sell S12.
I came across an
interetsing chart today. It shows that the 6 month advance in
the DJI is the highest of any new bull market on the lowest and most
negative volume.
Breadth has saved the rally thus far. Perhaps, it will still.
The shallower uptrend
of the NYSE has not yet been violated. The creator of the chart below states that
"if you think of
volume as fuel for any sustainable market rally,
then we’ve been
running
on fumes for a few months."
6 Month Gain and 6 Month Change in Volume
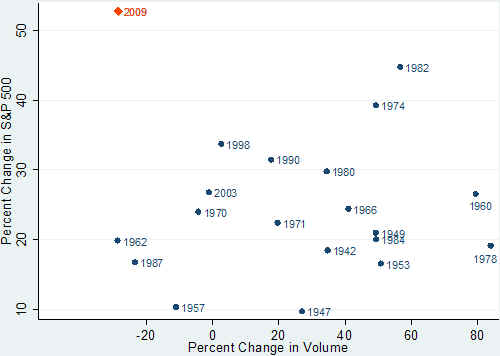
http://www.tradersnarrative.com/volume-mirage-biggest-rally-powered-by-least-volume-3024.html
The DJI rebounded 100 today as it turned up from a little above its rising
50-day ma.
The ratio yesterday of NYSE advances to declines was 1 to 9.
Today's ratio was 4.8 to 1.
Volume was lower than yesterday. The QQQQ (chart below) was
typical of the long general market
ETFs. After four staight down days, it rose today and gave
a red optimized Stochastic Buy based
on the short-term 14-day Stochastic. The bounce occurred
just where one might look for
one, up from the rising 50-day ma. How far will it advance.
It is still below the resistance
of its now flat red 21-day ma. Most important, all
its key internals are rated "negative' by
the Tiger program. I
QQQQ Internals:
1. The Blue Closing Power is below its falling 21-day
ma.
2. The Magenta OBV is below its falling 21-day ma.
3. The Brown Relative Strength Quotient is below its
falling 21-day ma.
4. The Accumulation Index is Red (negative) and below
its fall 21-dma.
5. The Tiger Dat Traders' Tool is below its falling
21-dma.
Gold (GLD) rembounded from
the 100 breakout point. The Dollar Fell back from its falling 50-day ma
I would say GLD is at a good buy point again. See the chart
below.
DJI rebounds like we saw
today from a rising 50-day ma are normal. But they do not mean
a big recovery. Below are the historical cases most resembling the
current S12. I have posted in
immediately below what the DJI did after the S12 upon first reaching the
rising 50-day ma. Brief
bounces do occur. But they are meaningless from an intermediate-term
perspective because the
lower band was always soon hit.
6 Previous Cases: Short-Term Bounces after S12 with NNC from OPCT: 1929-2009
8/24/38
1. DJI rose from 137.10 on 8/29/1938 to a peak of 143.10 on 9/7/1938 and then
fell to 130.20 on 9/27/1938
7/11/1968 2. DJI broke rising
50-day ma on 7/23/1968 and fell to 869.65 on 8/9/1968
4/1/1981 3. DJI broke rising 50-day ma
on 5/2/981 (979.11) and fell to 963.44 on 5/11/1981
1/6/1983 4
DJI broke rising 50-dma on 1/24/1983 (1030.17), got a new Buy B9 and
moved up above upper band.
1/6/1984 5. DJI hesitated at
rising 50-dma on 1/12/1983 (1270.10) and a week later broken down to 1134.21 on 2/22/1934
12/8/2000
6. DJI rose
from rising 50-dma on 12/11/2001 (10729), rallied 2% in two days and then fell to 10318
and lower band on 12/20/2000 from which it again rallied to the upper band.
QQQQ - Stochastic Buy at rising (blue) 50-dma.
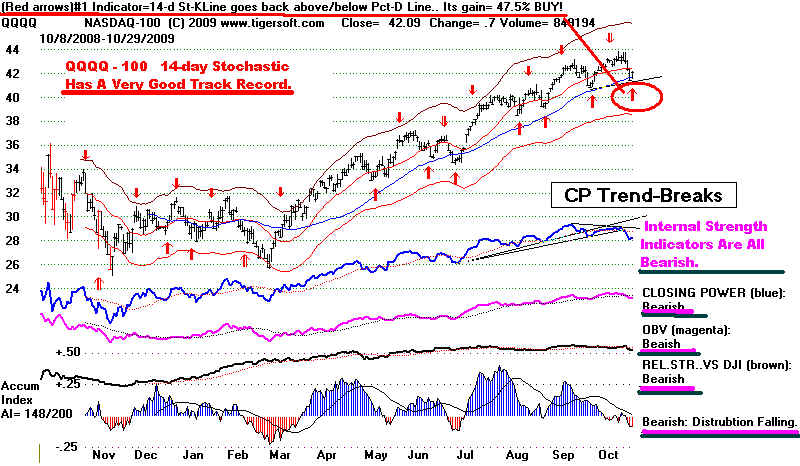
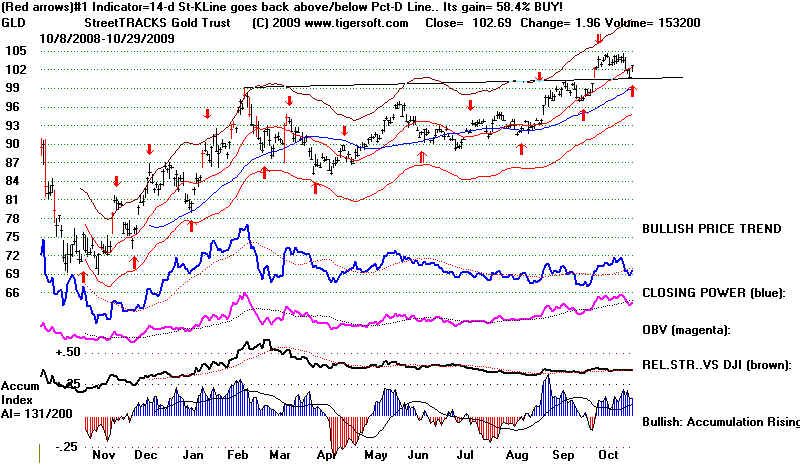
10/29/2009 House Speaker Pelosi said she would now only push
for a much weakened public
option that would not go into effect for more than 3 years. Her version, which Obama
applauded,
would require everyone to get such private insurance, except the poor. They will
have
the option of subscribing to a subsidized public insurance . The very rich will have
an extra tax of 5.4%
to pay for the health care subsidy of the very poor. Gone is a public option
for all Americans in
which the government sets rates as in Medicaire. Somehow, medical insurance
companies
will be regulated. The profitability of health insurance companies is not to
go past a certain point.
It is not clear what will prevent health insurance companies from paying their execs
billions
or using tax deductible miillions to bribe Congress in the form of campaign contributions
and use of jets, etc. Nothing would limit the health insurance companies from
deducting as a
legitimate expense their spending millions fighting public health care on TV. As it
stands,
a very small handful of companies will be splitting up what now amounts to 16% of the
total
US GNP ($14 trillion).
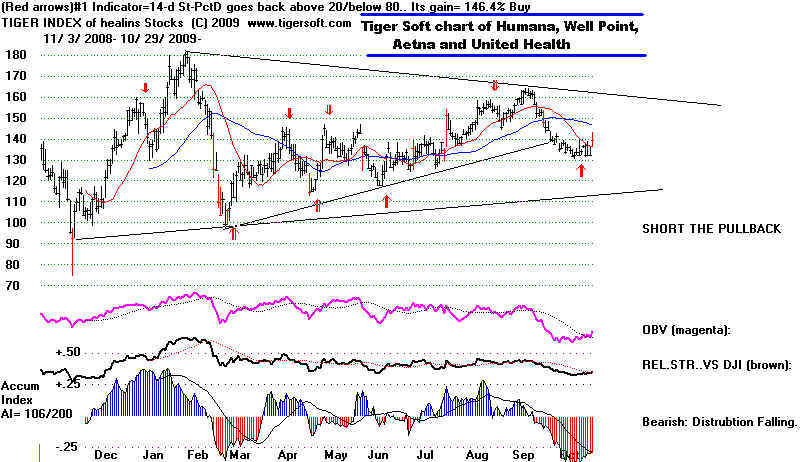
================================================================================
10/28/2009
Sell S12 Operating. Bankers' Pump and Dump.
The lower
band at 9500 is the first downside target for the DJIA. Today's DOW closing
below the support of its 21-day ma
invites such a test after the SELL S12. As I showed
yesterday, a deeper decline is more
typical after a bull market S12 with negative OPCT
readings on the last peak.
Confirming that prognosis, the DJI fell 120 today and the rest
of the market dropped even harder.
Downside volume on the NYSE was 10 times
Upside volume. It's been six months
since the number of NYSE advancers was this
low. The number of new lows on the
NYSE was only 11 and on the NASDAQ was only 33.
So, at this stage, what is happening is
that a great many stocks are viciously and quickly
breaking down below their 50-day ma.
They are slicing through this usual support as though
it was non-existent. And, in fact,
it may not be. That is what happens in a classic "pump and
dump". The stock is mostly
dumped on the way down to investors who think that they
are gtting a bargain.
Dumping like this is dangerous.
It reminds me of the classic "Pump and Dump" manipulation.
This time it is being done by the
likes of Goldman Sachs. JP Mortgan and Bank of America.
So, not only did these banks
"steal" (in my opinion, that is the only word that applies) trillions
from the general public with the
help of Paulson, Geitner and Bernanke, now they are
dumping the over-priced stocks they
recklessly bid up onto the very same people who bailed them
out. What gratitude! No
wonder Glass-Steagall forbad commercial banks for 80 uears from
being investment banks and
brokerages. If I am right, when the whole story comes out about
this "Bankers' Pump and
Dump", buy the stock in the company that makes pitch-forks!
 Reading about Pump, Dump and Bankers:
Coming
Soon: More Scandals. Dec. 1, 2005
Criminal Environment Is Created by US Government
Jan. 12, 2005.
Does
Goldman Manipulate The Stock Market?
About that stock
manipulation software Goldman Sachs owns ...
Manipulation
is rife on stock markets « melange
Goldman
Sachs Market Manipulation Dominance at Risk by Theft
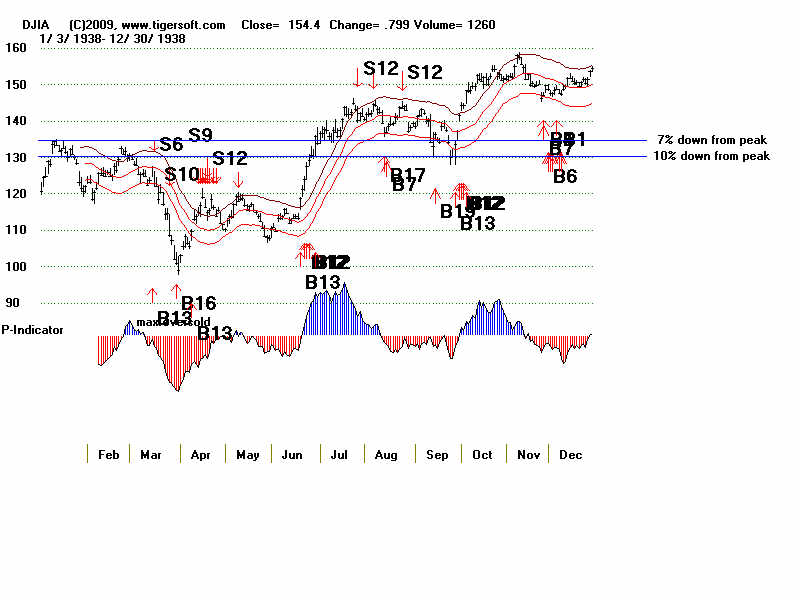
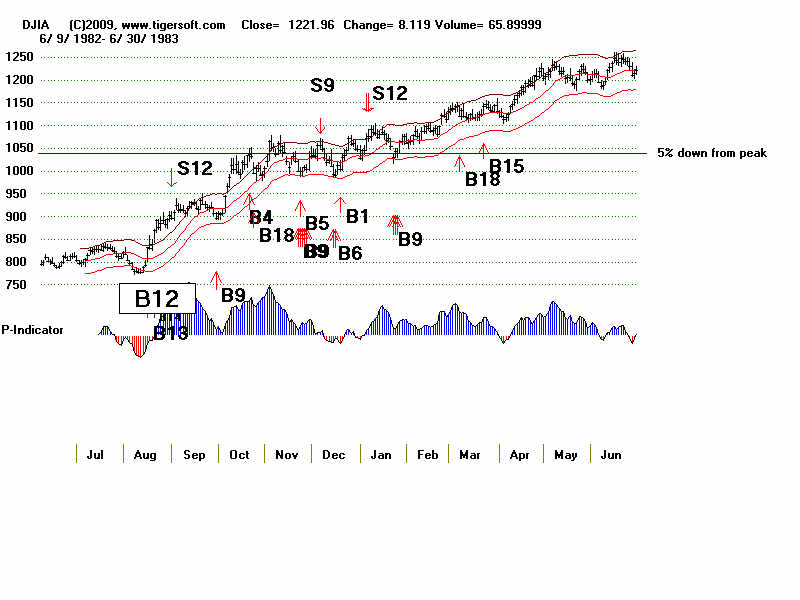
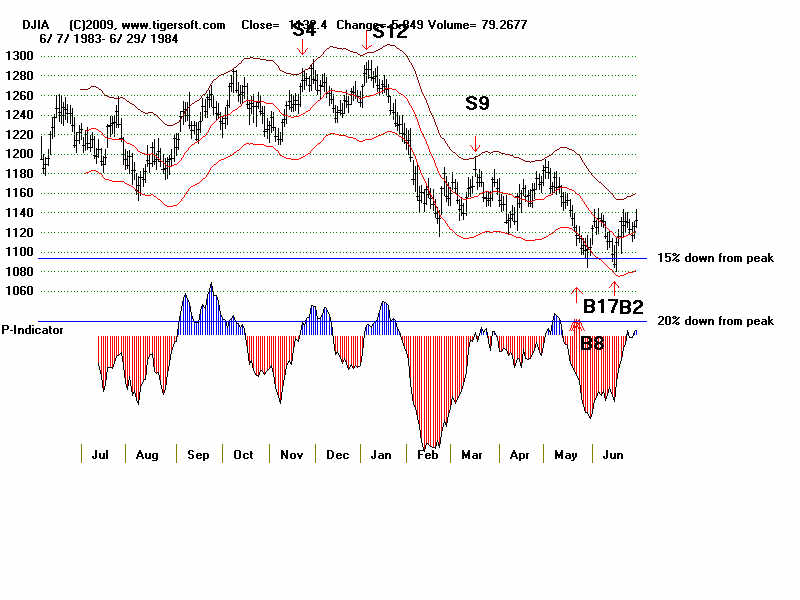
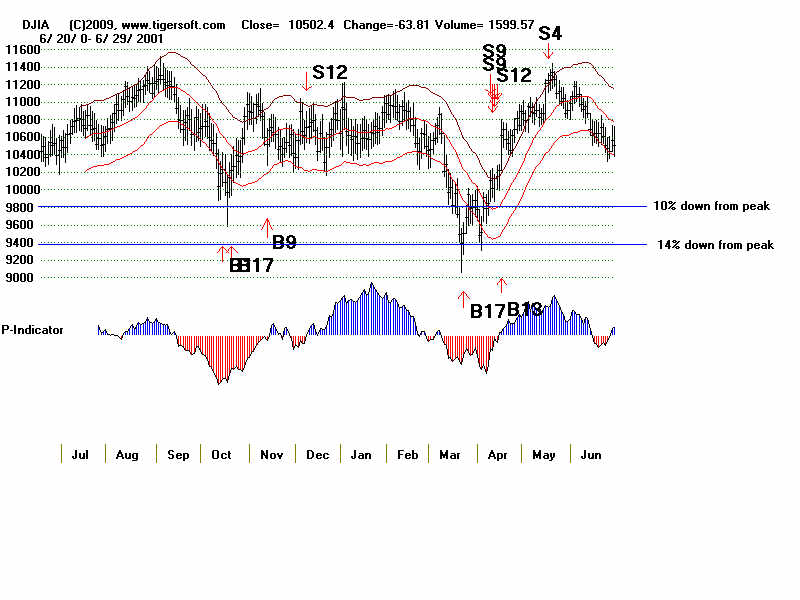
THE RISKS OF HOLDING SEEM QUITE HIGH
Technically, the rapid falling below the
50-day ma on very high volume is a clear warning.
Normally, it can be taken as just a
warning unless the stock's Accumulation
Index readings are negative. Then
it must be taken as a SELL, especially when
market conditions look artificial and
over-extended, as now. I think the low volume rallies
and the NYSE own statistics show that the
advance has been pushed up artificially by
banks with public funds. But just
given how far the market has risen, how there has not
been a double-bottom and the history of
the type of Sell S12s we just had, I believe such breaks
in particular stocks make then necessary
and reasonable Sells. There is too much risk not to sell.
A closing below their 65-day ma is more
emphatically a Sell. Use that if you want to be surer.
I think that is what is coming.
If selling
is too hard emotionally to do or because you want profits to be postponed for tax
purposes, then buy some of the leveraged
ETF puts I mentioned last night. This is the approach
I have taken on our Stocks' Hotline.
I want to show some typical NASDAQ-100
stocks back in 2002 after the 7 month's uptrending
A/D Line then was broken. See how
quickly these stocks caved in when the NYSE Advance-
Decline-Line was broken then. So
far, only the steeper Advance-Decline Line has been broken.
But with prices and the A/D Line up so
much and so over-extended, it is usually best to employ
the steeper uptrend.
FIRST, NOTE THE BREAK IN THE A/D LINE UPTREND WAS ON
5/22/2002
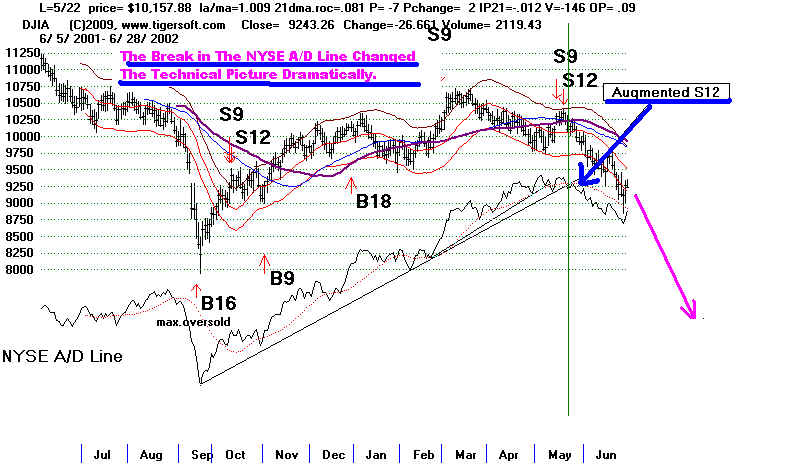
SECOND, SEE HOW THESE STOCKS COLLAPSED
AFTER 5/22/2002.
Not shown here, QQQQ
fell from 31.40 to a low of 20 five months later.
AAPLE fell from 12 to 7 in 3-4 MONTHS
ADOBE FELL FROM 18 to 9...
CSCO FELL FROM 16 to 9.
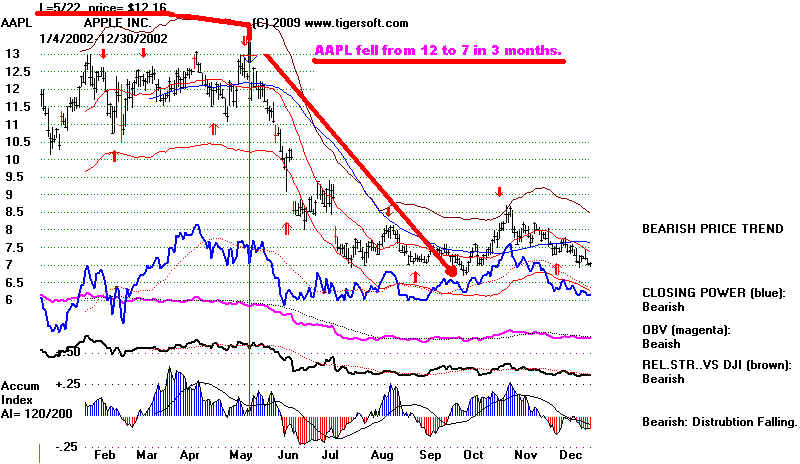
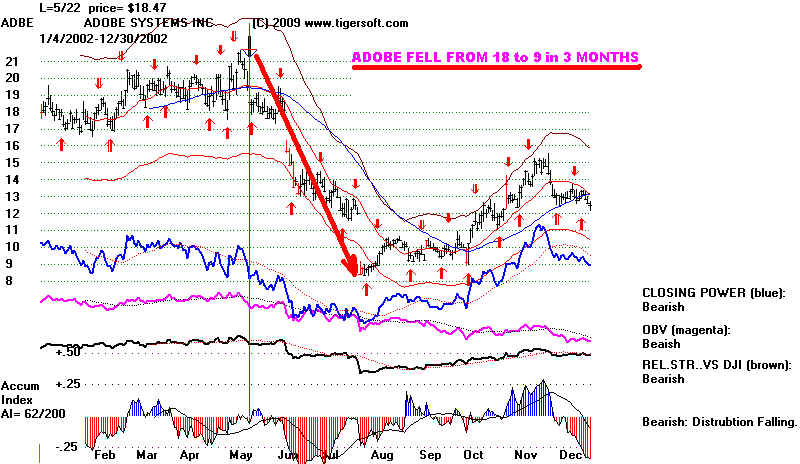
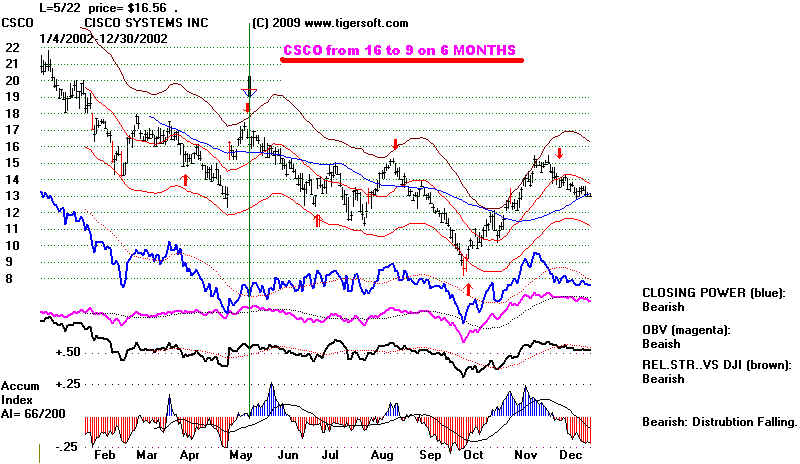
====================================================================================
10/27/2009
The Peerless Current Sell S12 is made more bearish by the fact that as the
Sell S12 was occurring, the OPCT was
negative. Since 1928, there have only been six cases
of an independent Sell S12 with a
negative OPCT while the DJI had been in a sustained
uptrend and was above a rising 65-day
ma. The average decline was 12.7%. If you are
bullish still, it is important that the
DJI now NOT drop below the lower 3.5%-4.0% lower
band. We can hope that the
bullish period after the third week of November prevents a
bigger decline, for the sake of all those
that are already jobless.
The research I did tonight on the HOTLINE suggests a
13% decline in the DJI if past
volatility applies. This past year's
volatility has been twice to three times greater. We do not want
to be in stocks that will eventually sell
off as confidence erodes. In additon to selling thinner
stocks that have run up a long ways, look
at the ETFs that allow aggressive leveraged short
selling, Two criteria can be used:
1) high levels of Accumulation and 2) the surpassing the 50-day
ma. TigerSoft Data permits
downloading the large number of leveraged short ETFs.
Here are the ones that look the most
interesting as purchases, either to hedge portfolios
or to be aggressively short: RWM
47.86, SBB 42.37, EFZ 60.16 - IP21= + .34 and
EWV 52.74 and SSG 24.28
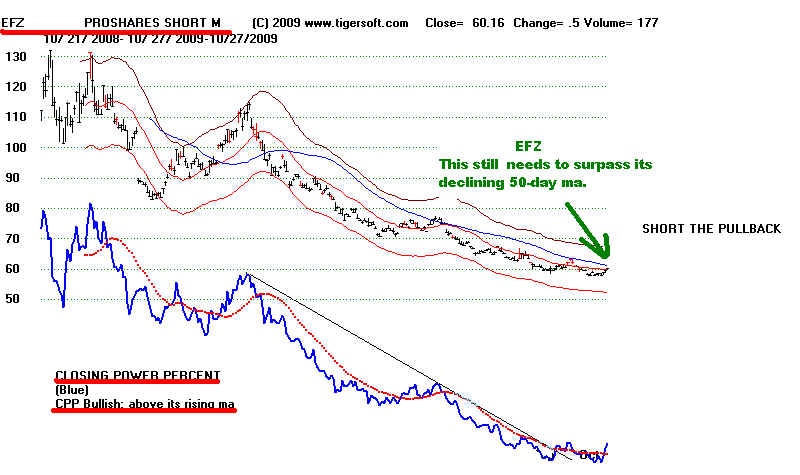
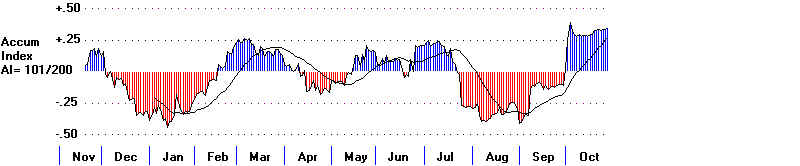
SELL S12s' Statistics
Cases since 1928 Most Resembling Current Sell S12 with negative OPCT.
.
Formula:
(On-Balance-Volume Pct = 21 days' OBV/Volume for 21 days)
Cases Most Resembling Current S12 with
negative OPCT.
Here they
are:
Outcome:
1.
8/24/38 143.50
Fell immediately, reaching 129.90 below lower band a month
later. OP= -.174
10% decline.
2.
7/11/1968 922.82 Fell immediately, reaching 870.37 and lower band 3 weeks
later. OP= -.008
10% decline.
3.
4/1/1981 1014.14 Rose to 1024.05 and fell to the lower band in a month,
963.33 -.052
This started the 1981-1982 bear market.
20% decline.
4.
1/6/1983
1070.92 Rose to 1083.79 and fell to
the lower band in 3 weeks, 1030.17 -.134
6% decline.
5.
1/6/1984 1286.64 Immediately declined below lower band to 1134.63 on
2/23/1984 OP= -.154
16% decline.
6.
12/8/2000 10712.91 Fell immediately to lower band, 10487.29, on 12/21/2000
and then below lower band to 9389.48, on 3/22/2000 OP= -.156
14% decline.
Rallies
after, and paper losses from, these Sell S12s occurred only in 2 of the 6 cases and were
by less than 1.5%. In these
cases, no clinching is needed apparently. What is more to the point
now is that in 5 of 6 cases the DJI
eventually fell substantially below the lower band.
The lower band support is very important. You can see this in the 1981
chart below.
1981 Sell S12
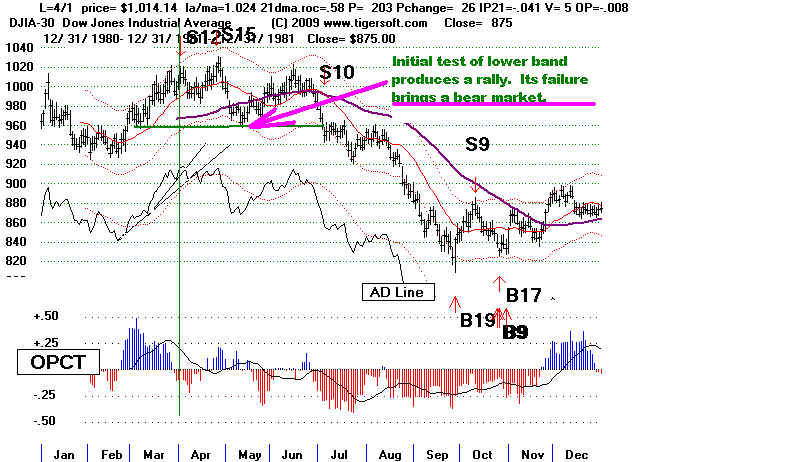
Completed
S12 Statistics: 1928-2009
Rising Markets:(above 65-dma): S12s with
no Nearby S4,S6, S9
------------------------------------------------------------------------------------
6/12/35 117.1
Reversal loss -8.7% OP= +.072 Avoided using A/D
Line trend-break clinching.
6/24/35 120.
Reversal loss -6.1% OP= +.067 Avoided using A/D
Line trend-break clinching.
7/27/38 140.20
fell directly to 136.90 and lower band. OP= +.014
8/5/38
144.50 fell directly to 136.90 and lower band. OP= +.028
1. 8/24/38
143.50 Fell immediately, reaching 129.90
below lower band a month later. OP= -.174
-----------------------
3/16/1967 868.49
fell directly to 842.43 .025 lower band in 3 weeks. OP= +.017
4/21/1967 883.18
Rallied to 899.89 and fell slightly below lower band in a
month, 899.89. OP= +.179
---------------------------
9/14/1967 929.44 Rallied to
937.18 and fell below lower band in 6 weeks to
850. OP= +.109
-------------------
1/9/1968 908.29
Rallied to 900.24 and fell below lower band in 19
weeks to 825. OP= +.158
-----------------------
2. 7/11/1968
922.82 Fell immediately, reaching 870.37 and
lower band 3 weeks later. OP= -.008
10/21/1975 846.82 Rallied
to 860.67 and then fell slightly below lower band, 793.80, on
9/30/75 .OP= +.125
---------------------------------
7/17/1978
839.05 Fell only to 21-dma immedately and then
rallied OP= +.051
(9/11/1978 907.74
Declined to lower
band at 857.16 in 7 trading days and rallied OP= +.187
and one months later fell below the lower band without a new Buy.
---------------------- )
3. 4/1/1981
1014.14 Rose to 1024.05
and fell to the lower band in a month, 963.33 -.052
and two months later fell below the lower band without a new Buy.
----------------------
4.
1/6/1983 1070.92 Rose
to 1083.79 and fell to the lower band in 3 weeks, 1030.17 -.134
5. 1/6/1984
1286.64 Immediately declined below lower
band to 1134.63 on 2/23/1984 OP= -.154
--------------------
10/7/1997 8178.31 Immediately declined below lower band to 7161.15 on 10/27/1997 OP= +.118
-----------------------
6/18/1999 10855.55
DJI rallied to 11300 in 2 months before falling to 10019.71 on 10/15/1999 OP= +.046
The DJI fell below the lower band four months later and there was no intervening Buy.
----------------------------
7/17/2000 10804.27 Fell immediately to 10511.17 on 7/28/2000,
then rallied to 11259.87 on 9/7/2000 and
then fell to 9975.02 on 10/18/2000
OP= +.193 and OP= +.12 on 2nd S12 two days later.
6.
12/8/2000 10712.91 Fell immediately to
lower band, 10487.29, on 12/21/2000
and then far below lower band to 9389.48, on 3/22/2000 OP= -.156
------------------------
10/15/2009 10062.94 (Dial
Data corrected data) OP= -.07
10/21/2009 9949.36 (Dial Data
uncorrected data) OP= -.208
===================================================================================
10/26/2009 Sell S12 Clinched....Be Wary of Trap-Door Declines
We have an
"Isolated Sell 12" in a rising market. How bearish are these?
We have to also
consider
the values of the OPct. At the time of the recent Sell S12 on 10/21/2009, the OPCT
was -.20.
and IP21=.004. It will take some effort to put all the data together. This
will appear
in the next
day. Early returns suggest the S12 and a negative Opct are a reliably bearish
combination. While there is always a chance for a recovery now that the DJI is back
to its
21-day ma,
S12s usually produce deeper declines, especially when the volume indicators
are
bearish, too.
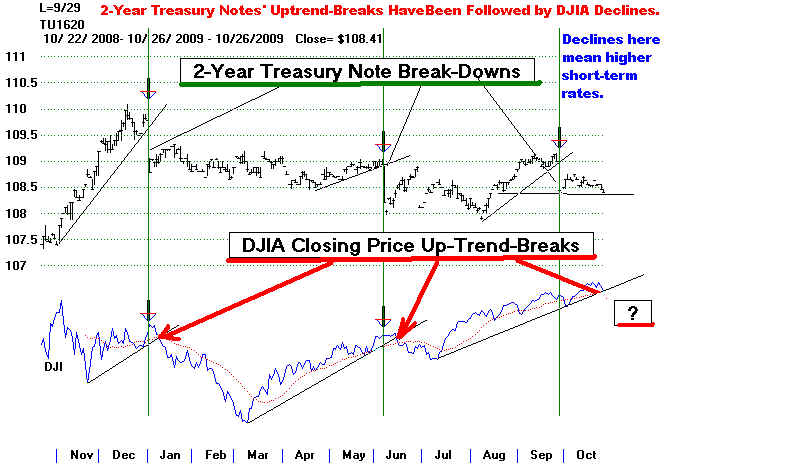
Watch the Dollar.
If it rises and breaks its downtrend, it probably means that the FED will
raise
interest rates a point or two. Banks might then sell the stocks they speculated with
so cheaply
at tax payer expense, rather than make loans. Such expectations go a long way
in
explaining the mix of profit-taking, shorting and the the faltering breadth on the NYSE.
The same
message is being signalled by the way some gold and silver stocks now show
unusually
high distribution and are now falling. See NEM and SSRI. There was a reason they could
not make
new highs when the Gold ETF did. If a stock can't make
a new high with
such
background fan-fare, it usually has to decline to recharge. I remind you that
advances
by gold are
very often followed by a swooning stock market.
Another
thing to watch is how well stocks that show a lot of Blue Accumulation
do as their
prices fall to the key 50-day ma. If many of these stocks sell off like
NWK just did, wouldn't this suggest that big money is very
skittish. And that would
not be a
good sign. They probably fear that a deeper retest of the lows will be needed.
Indeed,
"V" bottoms are relatively scarce.
Price Pot-Holes Point To Problems in The Market
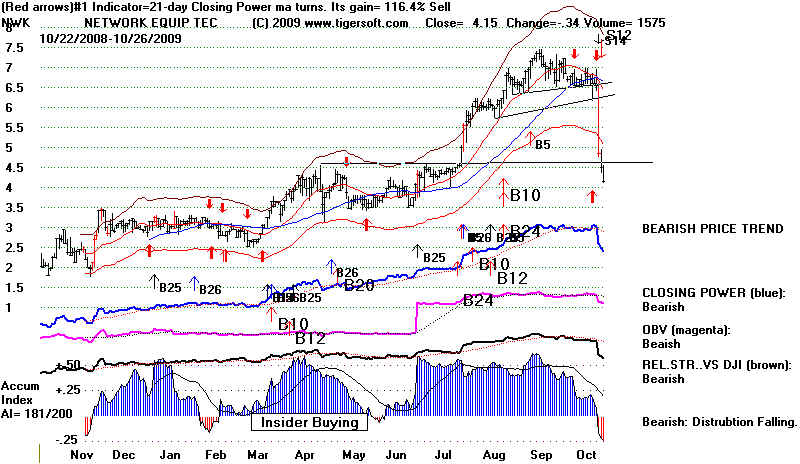
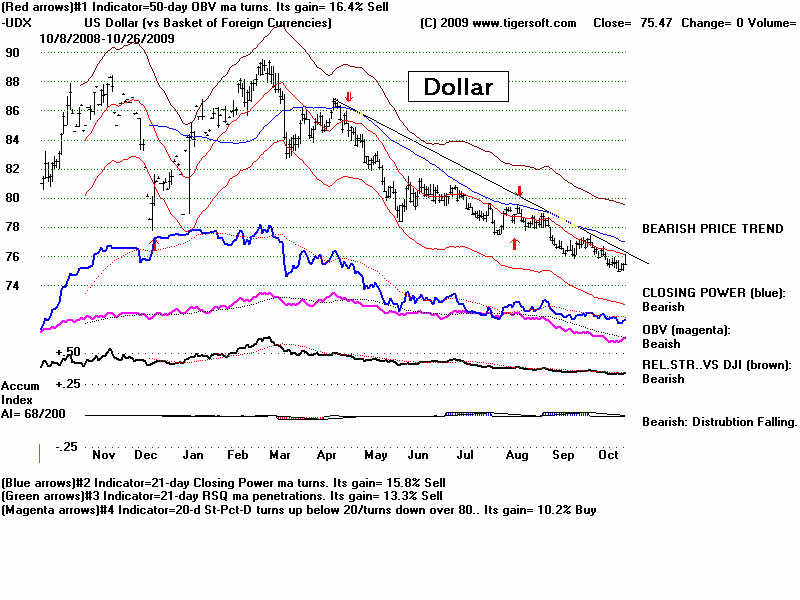
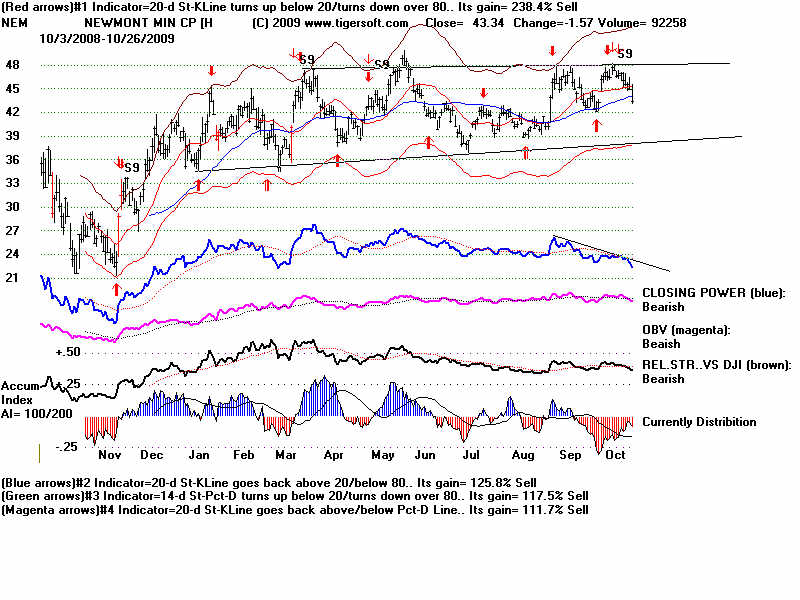
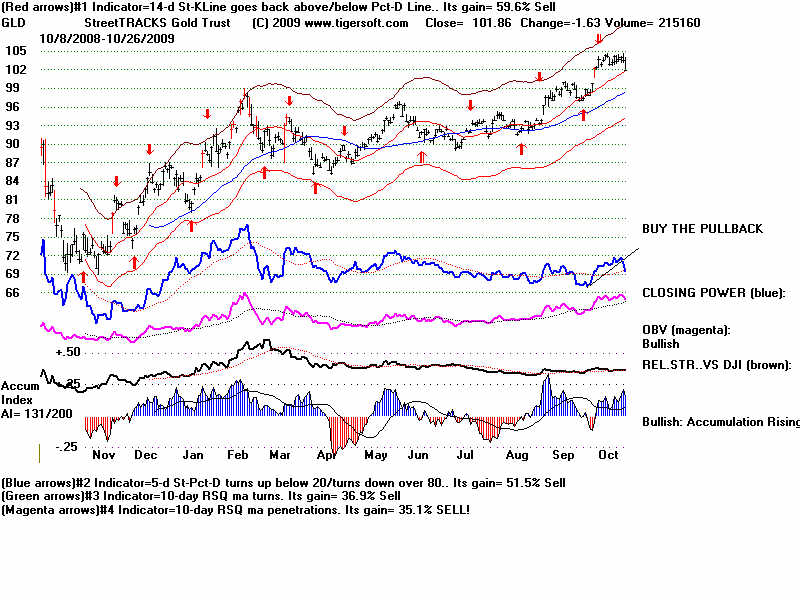
| Serious Break Downs In High Accumulation Stocks Are Worrisome. If these high Accumulation stocks don't hold up, is big money getting nervous again. Were these stocks just pumped up only to be dumped on the unspuspecting public on the way down. Here are some high Accumulation stocks to watch that have broken their 50-day ma: AMCS, ATRI, ATSI, BAMM, CAVM, CRED, MEDQ, SMRT Some interesting shorts are AAI, ARQL, ASFI, AYR, BAC, CAL. CSFG, LNET, SMRT 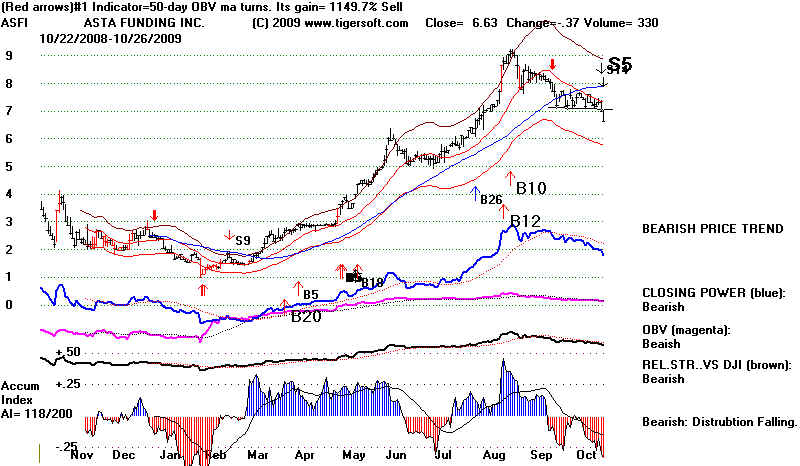  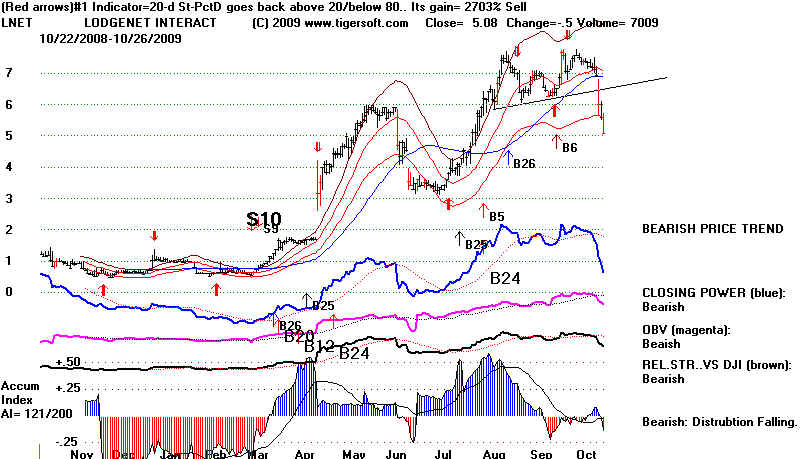 |
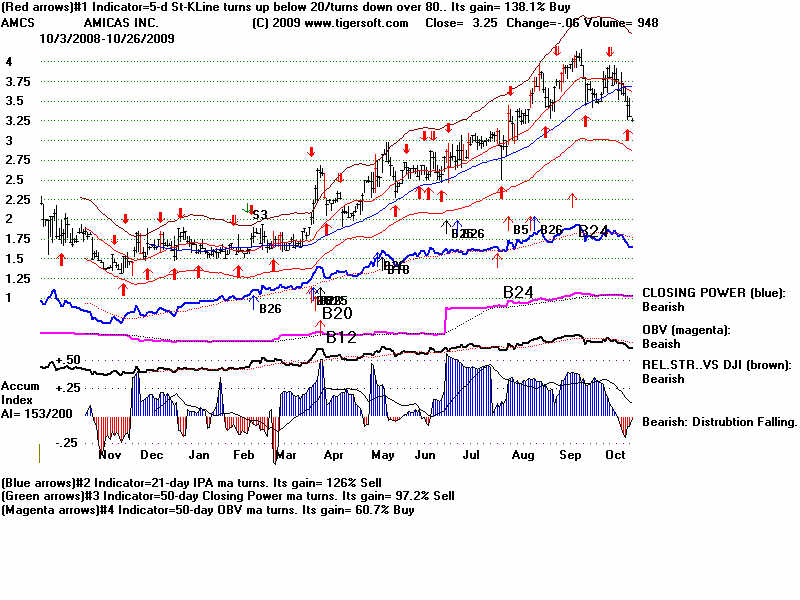
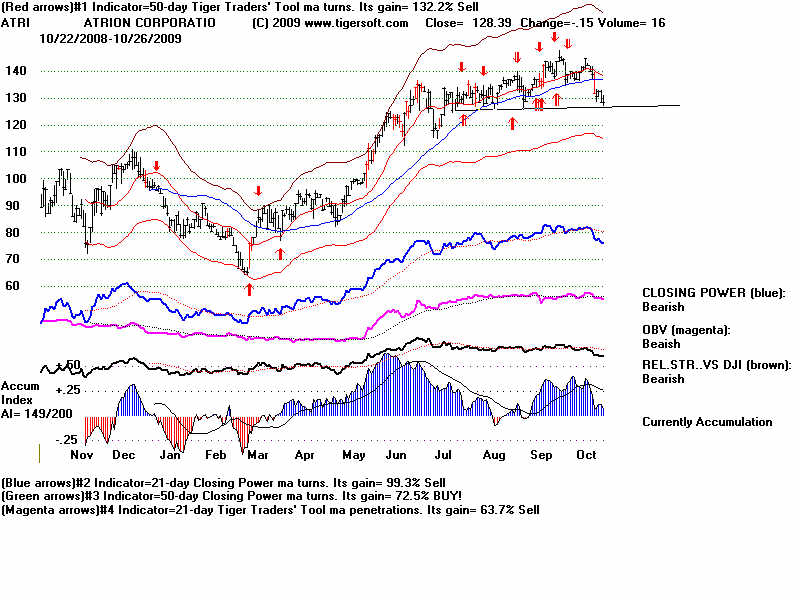
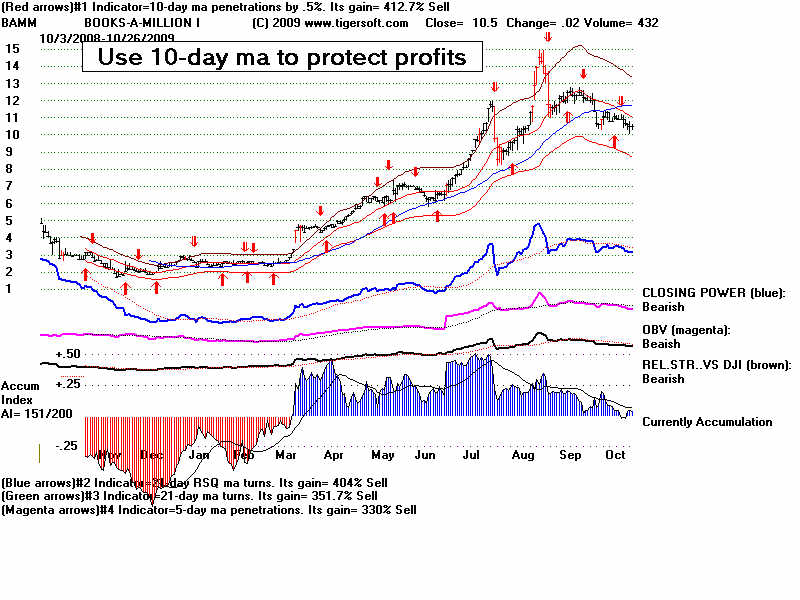
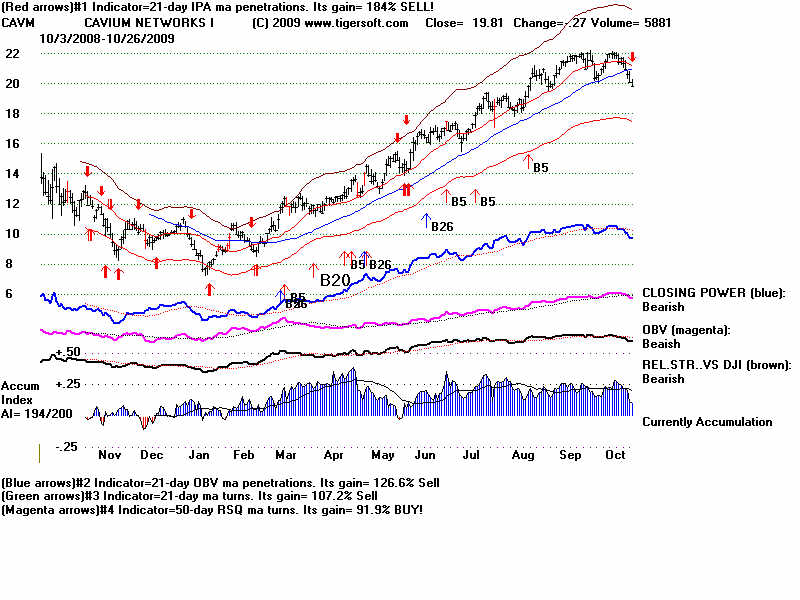
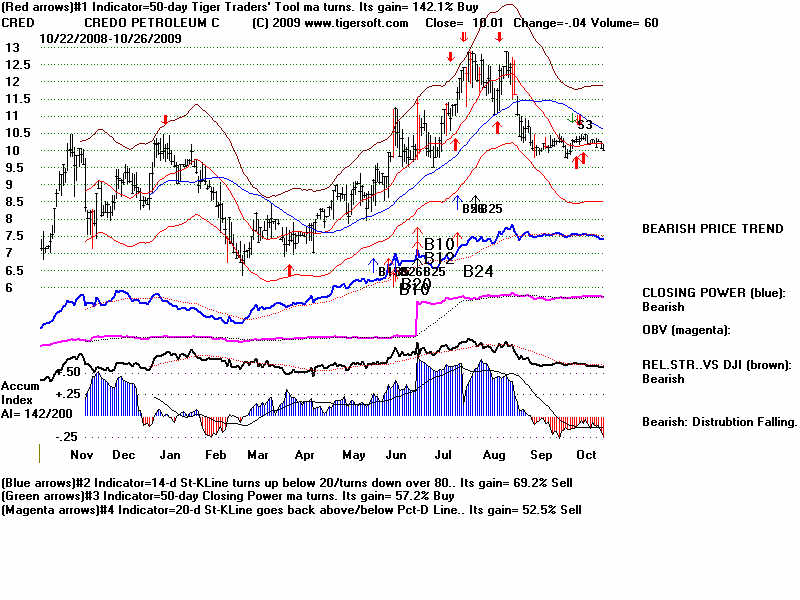
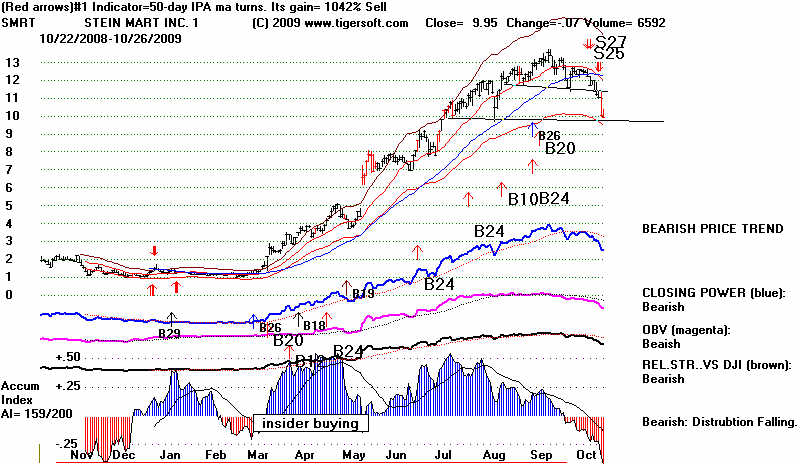
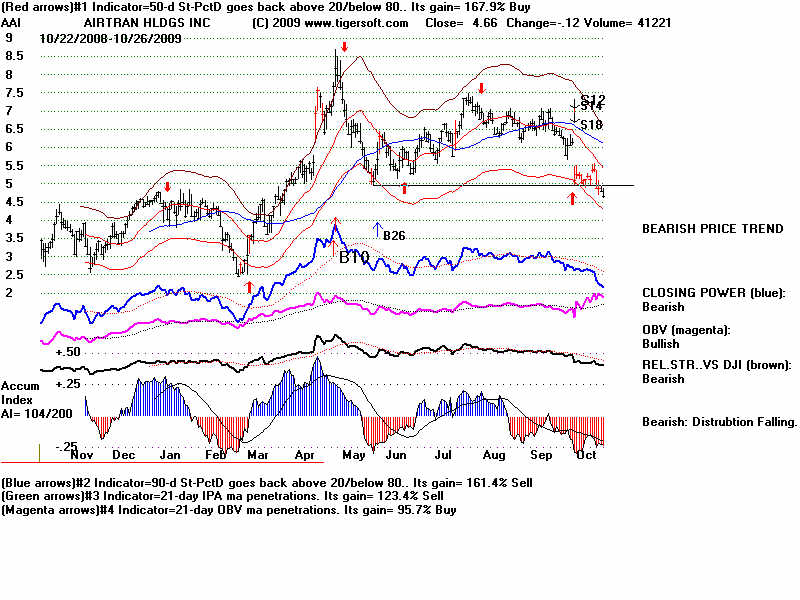
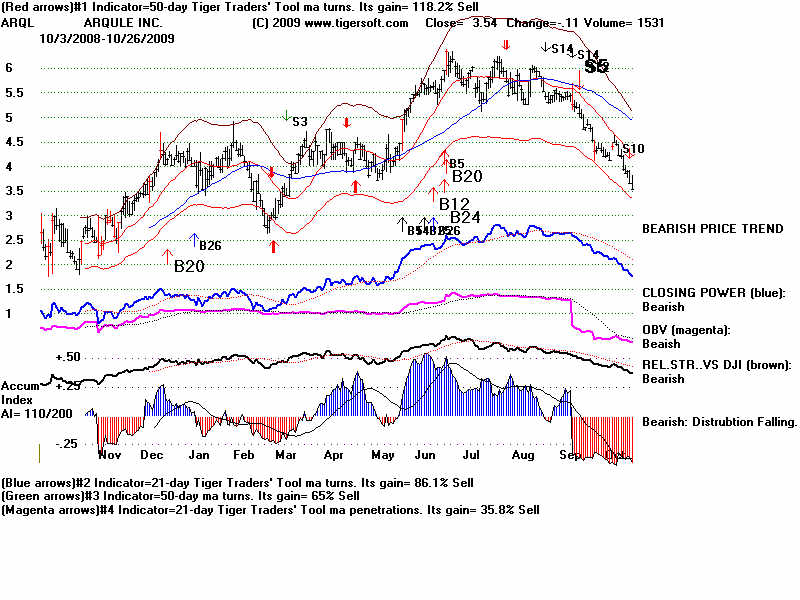
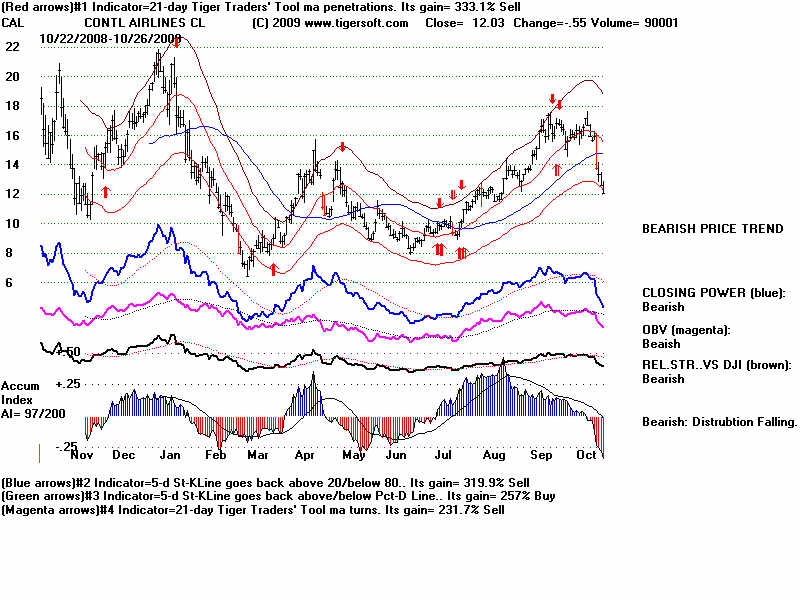
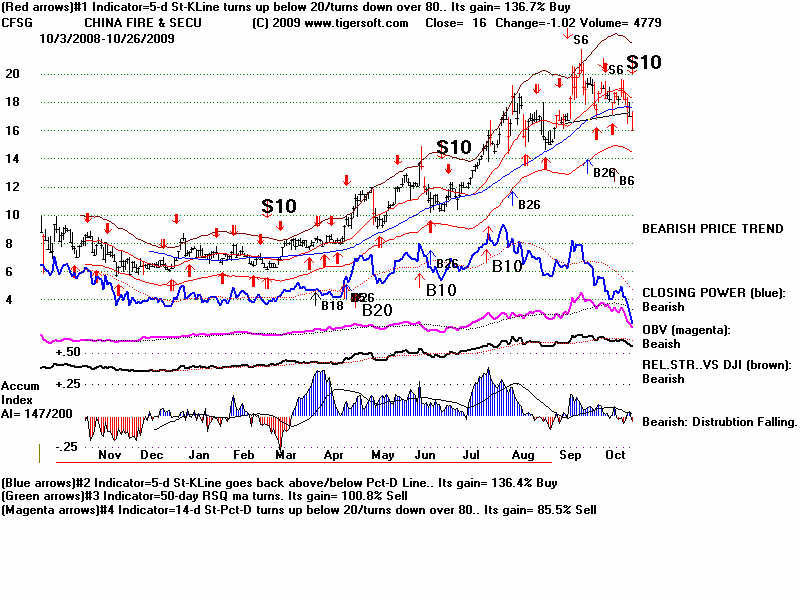
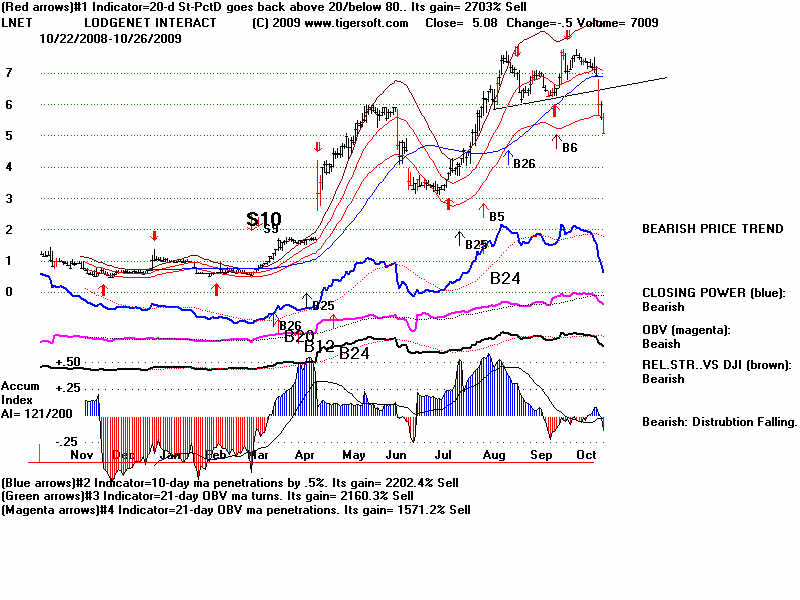
S12 Statistics
Rising
Markets:(above 65-dma): S12s with no Near-By S4,S6, S9
------------------------------------------------------------------------------------
6/12/35 117.1
Reversal loss -8.7% OP= +.072 Avoided using A/D
Line trend-break clinching.
6/24/35 120.
Reversal loss -6.1% OP= +.067 Avoided using A/D
Line trend-break clinching.
7/27/38 140.20
fell directly to 136.90 and lower band. OP= +.014
8/5/38
144.50 fell directly to 136.90 and lower band. OP= +.028
8/24/38
143.50 fell immediately, reaching 129.90 below
lower band a month later. OP= -.174
3/16/1967 868.49
fell directly to 842.43 .025 lower band in 3 weeks. OP= +.017
4/21/1967 883.18
Rallied to 899.89 and fell below lower band in a month,
899.89. OP= +.179
9/14/1967 929.44 Rallied to
937.18 and fell below lower band in 6 weeks to
850. OP= +.109
1/9/1968 908.29
Rallied to 900.24 and fell below lower band in 19
weeks to 825. OP= +.158
7/11/1968 922.82 Fell immediately, reaching 870.37 below lower band 3 weeks later.
OP= -.008
10/21/1975 846.82 Rallied
to 860.67 and then fell slightly below lower band, 793.80, on
9/30/75 .OP= +.125
7/17/1978
839.05 Fell only to 21-dma immedately and then
rallied OP= +.051
9/11/1978 907.74
Declined to lower
band at 857.16 in 7 trading days and rallied OP= +.187
4/1/1981 1014.14
Rose to 1024.05 and fell to the lower band in a month, 963.33 -.052
1/6/1983 1070.92
Rose to 1083.79 and fell to the lower band in 3 weeks, 1030.17 -.134
1/6/1984 1286.64
Immediately declined below lower band to
1134.63 on 2/23/1984 OP= -.154
10/7/1997 8178.31 Immediately declined below lower band to 7161.15 on 10/27/1997 OP= +.118
6/18/1999 10855.55
DJI rallied to 11300 in 2 months before falling to 10019.71 on 10/15/1999 OP= +.046
7/17/2000 10804.27 Fell immediately to 10511.17 on 7/28/2000,
then rallied to 11259.87 on 9/7/2000 and
then fell to 9975.02 on 10/18/2000
OP= +.193 and OP= +.12 on 2nd S12 two days later.
12/8/2000 10712.91 Fell immediately to lower band, 10487.29, on 12/21/2000
and then to 9389.48, on 3/22/2000 OP= -.156
10/15/2009 10062.94 (Dial
Data corrected data) OP= -.07
10/21/2009 9949.36 (Dial Data
uncorrected data) OP= -.208
Falling Markets
(below 65-dma): S12s with no Near-By S9, S6
------------------------------------------------------------------------------------
12/5/1929
251.50 .... peaked 4 days later at 260 and fell to 230.90 on
12/20/1929 OP= -.108
7/15/1930 233.80 ...peaked 2 weeks later at 240.80 and fell below lower band to 217.20 on 8/12/1930
OP= -.304
10/26/1931
106.49 immediately declined to lower band
at 100.70 on 10/29/1931 OP= -.159
7/20/1932
LOSS = - 9.7% OP= -.126
12/15/1932 61.20 immediately declined to lower band at 56 OP= -.005
3/20/1933
LOSS = -7.3% OP= .134
11/14/1933
95.50 ...peaked at 101 and fell to lower
band at 95.30 on 12/20/1934 OP= +.172
12/1/1933
98.90 ...peaked at 101 and fell to
lower band at 95.30 on 12/20/1934 OP= +.095
12/14/1933
101.4 ...peaked at 102 and fell to lower band at
95.30 on 12/20/1934 OP= +.061
10/16/1969 838.77 ...Rallied to
860 and fell below the lower band in 2 months, 12/17/69,
769.93 OP= -.094
1/2/74
855.32 Rallied to 800 and then fell below
lower band to 803.90 on 2/11/1974 OP= -.074
10/18/1974
654.88 Rallied to
675 and fell below the lower band in 7 weeks, 12/6/74,
577.60 OP=
-.145
8/8/2002
8712.02 Rallied immediately to 9053.64 on 8/22/2002
and then fell below lower band, 7286.27, on
10/9/2002 97. OP= -.254
1/6/2003
8773.57 Rallied immediately to 8842.62 and then fell below lower band, 7524.06, on 3/11/2003. OP= -.046
Special Case: Rebounding to Falling 65-dma
----------------------------------------------
6/1/1936 152.80 LOSS fell to 21-dma at 150 and
then rallied past resistance of 65-dma. OP= +.239
6/12/1936 153.70 LOSS fell to
21-dma at 150 and then rallied past resistance of 65-dma. OP=
+.096
6/25/1936 158.60 LOSS fell to 21-dma at
150 and then rallied past resistance of 65-dma. OP=
+.164
11/20/1997 7826.61
Rallied immediately to 8149.13 and then fell to lower band,
7660.13, on 12/24/1997. OP= +.167
4/5/2004 10558.37 DJI fell immediately to lower band, 9906.91, on 5/17/2004
OP= -.131
6/30/2006 11150.22 DJI fell
immediately to lower band, 9906.91, on 7/14/2006 OP= -.215
===================================================================================
10/23/2009 WATCH THE
A/D LINE OF THE NYSE.
The excellent breadth has kept the 7 month 2009 rally going long beyond where a simple
study of daily
volume might have thought possible, so low was the volume on much of the rally s
since March.
But now we should ask: "What will happen if the good breadth ends?" The
growing investor
optimism and the
stock market's direction and apparent safety may change rather sharply. To see this,
I suggest looking
at the reversal upon the occurrence of a clinched Sell S12 in early 2002. The break
in
the long NYSE A/D
Line uptrend was the light switch! That was also when interest rates were
kept artificially
low after the 9/11 attack. Of course, 2002 saw the run-up to a new war. Had
Bush,
Cheney or the CIA
Director been of a different mind, my guess is the 2002 DJI decline would have
been much more
shallow.
2002 Top and Clinched Sell S12.
The new Peerless Sell S12 has not been clinched. Since 1929, there were 4 failures
to
bring declines in
the 16 Peerless Sell S12s when market circumstances were passingly similar
to the present.
I said last time that waiting for the signal to be "clinched"
reduces the number
of failed S12 to
3 in 15 cases and often produced a better signal if the DJI did rally. Using the
clinching rule
sacrifices little unless you are trading index options when premiums often expand
and contract
considerably within each day depending on how strong or weak the market looks
at that point.
The internals of
the market are NOT so bearish now to make me think the current Sell S12
will bring more
than a 7% decline in the DJI from 10000, if a decline does follow. Keep in mind
that the period
from the third week of November to the end of December is the most bullish
seasonal period
in the year. In addition, we just do not see bearish technicals and head and
shoulder top
patterns in the individual DJI-30 stocks. Not many of them look very
bearish at this
stage. See the charts of the weakest DJI-30
stocks, as of Friday.
THE WEAKEST DJI STOCKS ILLUSTRATE WHY SHORTING MAY NOT
PRODUCE BIG GAINS NOW.

Shorting a stock above a rising 65-day is risky, because of how
often a stock rebounds on declines to the zone between the rising
50-day ma and rising 65-day ma, even when internals are weak,

Shorting those with confirmed weakness on a decline below the
50-day ma with a falling 65-day ma is ideal. VZ is the closest to
this ideal but it would seem to have lots of support at 26-27,
so there is little gain potential.
S9=Negative Non-Confirmation of a stock at new high with negative Accum. Indexin last 2 months. Symbol S9* Red All Falling Below Falling Below Falling
Distr. Indicators Closing Power 50-dma 50-dma 65-dma 65-dma
-----------------------------------------------------------------------------------
AA yes yes yes no no no no
BAC yes yes yes yes yes yes no
CSCO yes yes yes no no no no
DD yes yes yes no no no no
GE no yes Bearish yes yes no no no
HD no no Bearish Yes yes no yes no
INTC yes yes mixed Yes no no no no
KFT no no Bullish no no yes yes yes
MCD yes yes mixed no no no no no
MMM yes yes Bullish no no no no no
T yes yes Bearish yes yes no yes no
VZ no Yes Bearish yes yes yes yes yes
|
                  10% Decline.  A 10% decline did occur in the summer of 1975 after a 7 month advance off a severe
             bear market bottom.  Another reason for consider a decline to 9000 possible is simply that the
             FED may change its collective mind and raise interest rates sooner than Bernanke has said, to try to
             shore up the Dollar which is down about 20% since March.  Also, a cessation in the overt, blatant
             government's coddling of the biggest banks with trillions from the Treasury and the Federal Reserve
             is now being talked about more fervently on TV than ever before. The public's distrust of both political
             paries in this matter is serious.   One of the political parties will surely see the opportunity here.
             As a result, bank and housing stocks, as well as low priced stocks are showing the most weakness,
             along with certain telecommunications' stocks in  DJIA like VZ and T.

                    The uptrend-lines for the A/D of the NASDAQ-100 and SP-500 stocks are still intact.  Friday saw
             huge gains in AMZN and MSFT.  MSFT's jump owed to its launching Windows-7.  This has been
             widely anticipated; so, many professionals sold into the public buying.  This is what MSFT's new Tiger
             "S9" is saying.   Often it is a sign of danger when a few stocks make very splashy gains.  But I would rather
             see high priced stocks making these big gains than low priced stocks.  The public tends to
             avoid high priced stocks, though AAPL and AMZN are exceptions.   Below is the 1975 chart.  Like now,
             there were non-confirmations by OBV and the Cumulative Inverted Traders's Index.  The IDOSC
             was much weaker.  The break in the A/D Line then did not follow a Sell S12, though.

                                 Summer 1975 10% Decline Was Predicted by Volume Non-Conformations,
                           then Steep A/D Line Trend-Break followed by Breaks in 50-Day and 65-day MAs
                           and Break in more gradual, well-tested A/D Line Uptrend.
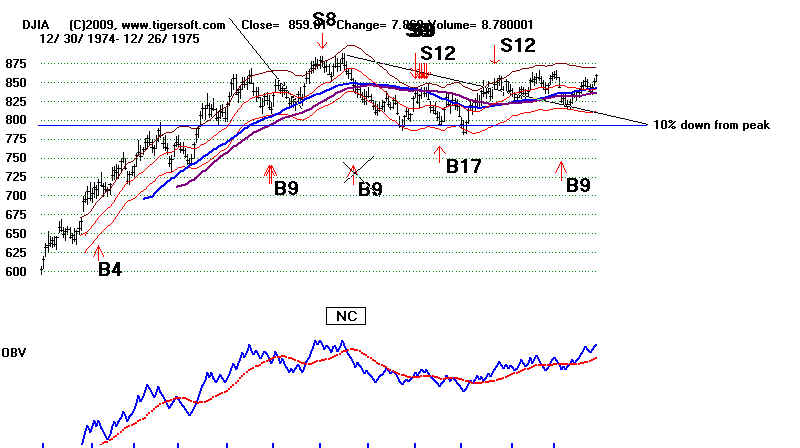
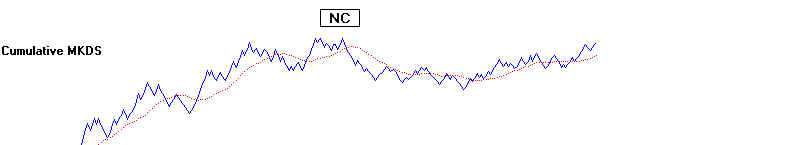
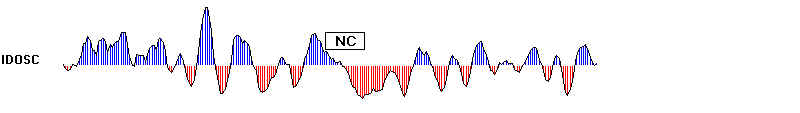
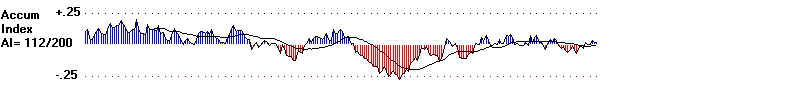
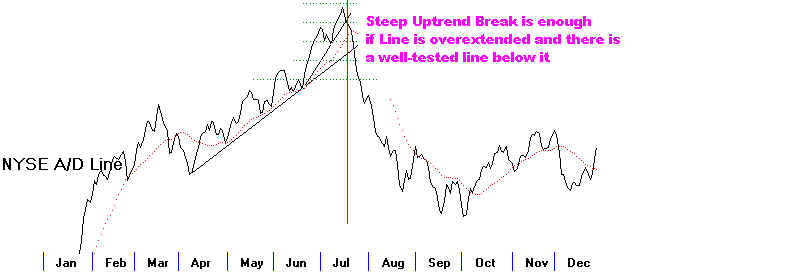
Conclusion -
WATCH THE A/D LINE OF THE NYSE MONDAY and TUESDAY.
NYSE's A/D Line still uptrending but on verge
of trend-break.
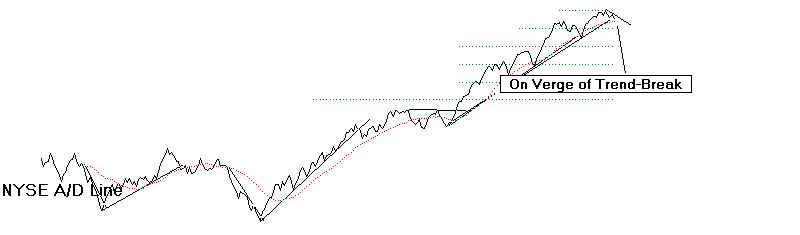
OIL
STOCKs' A/D Line still uptrending
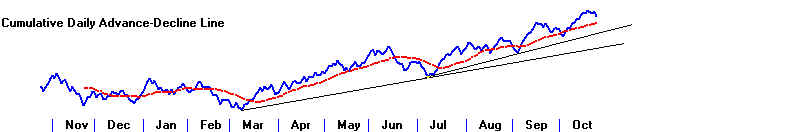
GOLD and SILVER STOCKs' A/D Line still uptrending
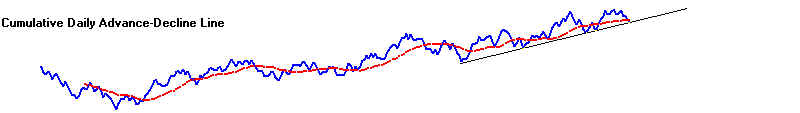
SP-500 A/D Line still uptrending
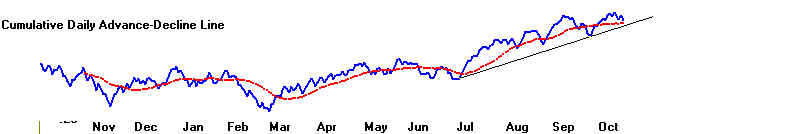
FINANCE STOCKS' A/D Line still uptrending
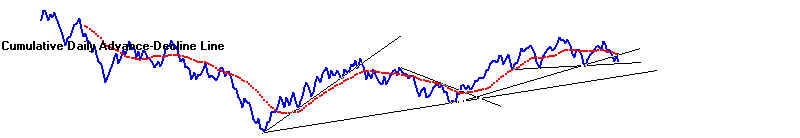
LOW PRICED STOCKS' A/D Line IS DOWNTRENDING.
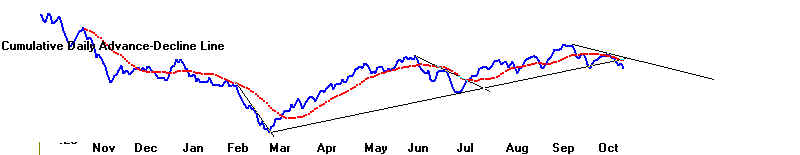
======================================================================
10/22/2009 Wait for A
"Clinched" S12
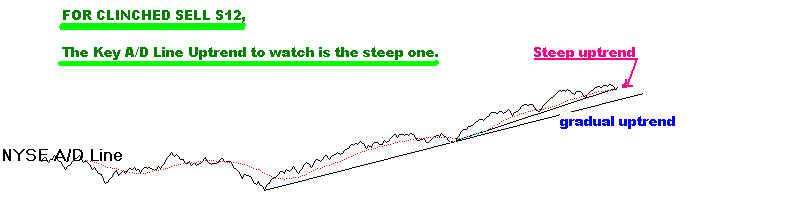
The DJI's against the Peerless
S12 is not so atypical. From 1929 to 2009 there
were 15 cases
that might be loosely compared to the current market environment. They
are shown below.
The conclusion I reach is that we must see the A/D Line uptrend break
before expecting
the DJI to decline. Waiting for the A/D Line ot break its uptrend would
never have meant
a bigger loss selling short the DJIA on the S12. It would have prevent
the moss in June
1986. In several cases it would have meant selling at or very close to the
top, instead of
prematurely: 1930, 1966 and 1998. Waiting for the A/D Line would have not
meant shorting
more than 2% down from the Sell S12. When the clinching takes place,
we will go short the
weakest of the major market ETFs. Right now that is IWM.
Short-term traders can still, if they are nimble, buy and
trade horizontal breakouts:
See TMI, RDCM, LZ, LOOP, KVN, IGTE, ECTX. CRMT and ACF for ideas.
PEERLESS S12s - 1928-2009
S12s after 4 Months' Rally of 20% above A DJIA Bottom: 16 cases - 1930-2009
"IL" - immediate loss. In 6 cases the DJIA rose against
the Sell S12.
Click on the year to see the chart.
IL
1930 S12 (March -275) DJI rallied to 292
A/D Line break was a month later and DJI then
fell in two weeks to 252.
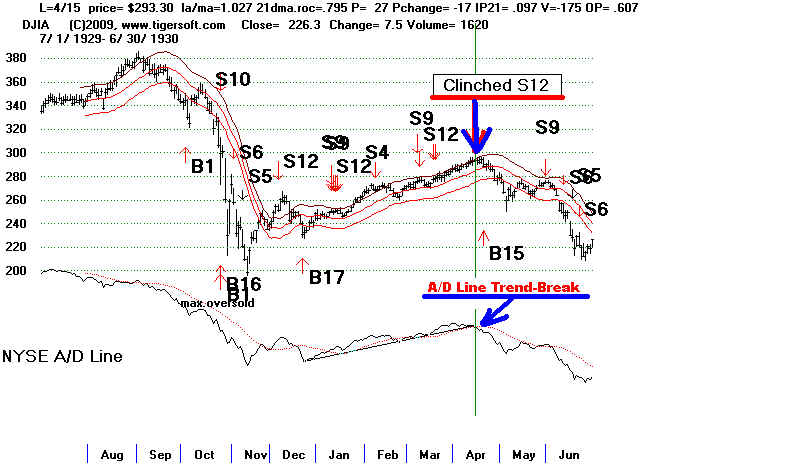
1932 S12 (August - 76.2) DJI almost immediately declined 65 in 2 weeks.
A/D Line break was a day later.
1933 S12 5(June - 102.7) DJI immediately declined to 86.61
IL
1935
S12 + Loss if short on S12
(DJI-135.5) and rally to 149.
break in NYSE A/D Line 144.70 to
138
1938 S12 in July and August (140) brought declines from upper band to136.5.
Waiting for A/D Line uptrendbreak works
well.
IL
1959
S12 (July 1 - 650.5 ) rose to 680
over next month.
After A/D Line uptrend was broken, the
DJI fell to 618.
1966 S12 (January - 990) DJI went sidewise for a month and then fell to 910.
Waiting for A/D Line uptrend to be
broken worked well.
1967 3 S12s - Each brought a decline ot lower band.
Waiting for A/D Line uptrend to be
broken worked well.
1987 3 S12s
May - DJI Immediately declined to Low Band
Waiting for A/D Line uptrend to be
broken lost 2% on decline to lower band.
IL
June - New Buy signal correctly caused
a small loss as DJI rallied.
Waiting for A/D Line uptrend to be broken would have avoided a bad S12.
October - DJI Immediately declined to
far below Lower Band
Waiting for A/D Line uptrend to be broken lost 2% on decline
far below lower band.
1997 September - DJI immediately decline from 8178 to
7200.
Waiting for A/D Line uptrend to be
broken lost 2% on decline
IL
1998 July - DJI - 9085
- Rallied for a week to 9359 and then fell to 7500
Waiting for A/D Line uptrend to be
broken meant shorting at top.
2002 May - DJI - DJIA fell far below lower band to 7500
Waiting for A/D Line uptrend to be
broken meant shorting 2% lower.
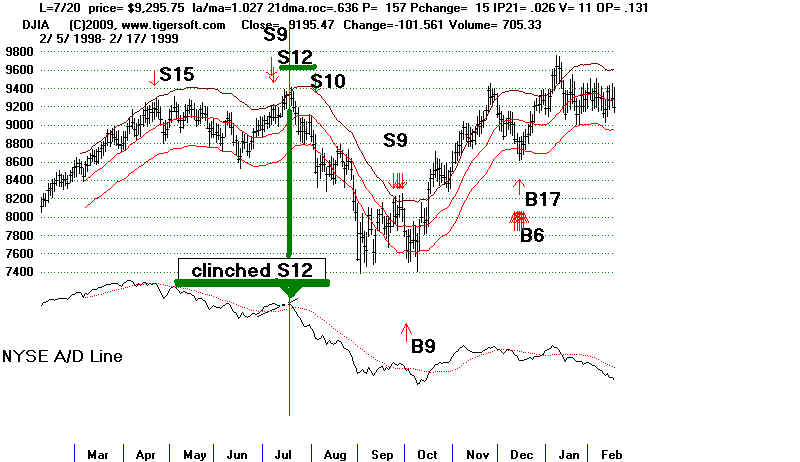
==================================================================================
10/21/2009 NEW PEERLESS SELL S12.
--- SHORT THE STOCHASTIC SELLS WITH WEAK
INTERNALS.
----
A DJI Decline of 6% Would Be Typical for A Peerless Sell S12.
----
Hold The Highest Accumulation Stocks (over 175) and Gold Stocks....
----
Stocks with Steep Closing Power Up Trend-Breaks Ought To Be Sold.
The Dollar remains very weak. Bernanke says interest rates will
not go up
until next year because of the fragility of the economy. But the pressure is
mounting on him to stem the Dollar's decline. Might the Treasury Sell Its Gold?
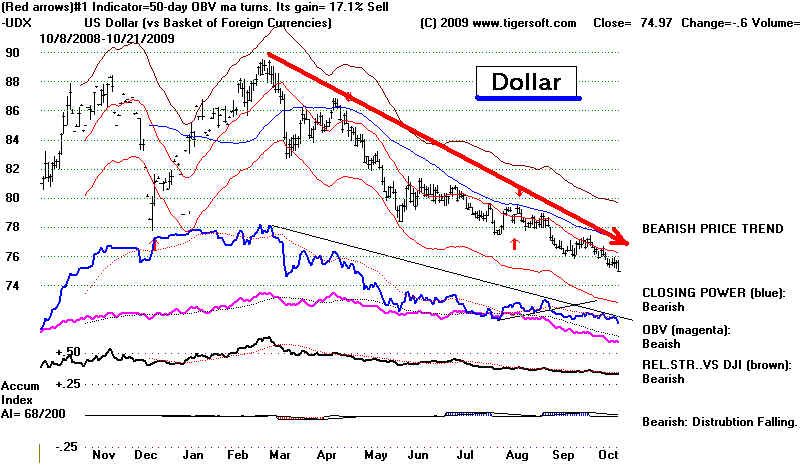
The Worst of Both
Worlds plus Racing Inequalities
One of things that is spooking the market is
the growing fear that there has not been
enough improvement in business on Main Street and none whatsoever in the area of
JOB CREATION.
"It is widely believed that before
companies begin adding full-time workers,
they increase the hours of their part-timers and hire more temporary workers.
So if employment is picking up, the phones should be ringing at staffing companies
including Manpower Inc., Robert Half International Inc., Kelly Services Inc.,
and Monster Worldwide Inc.
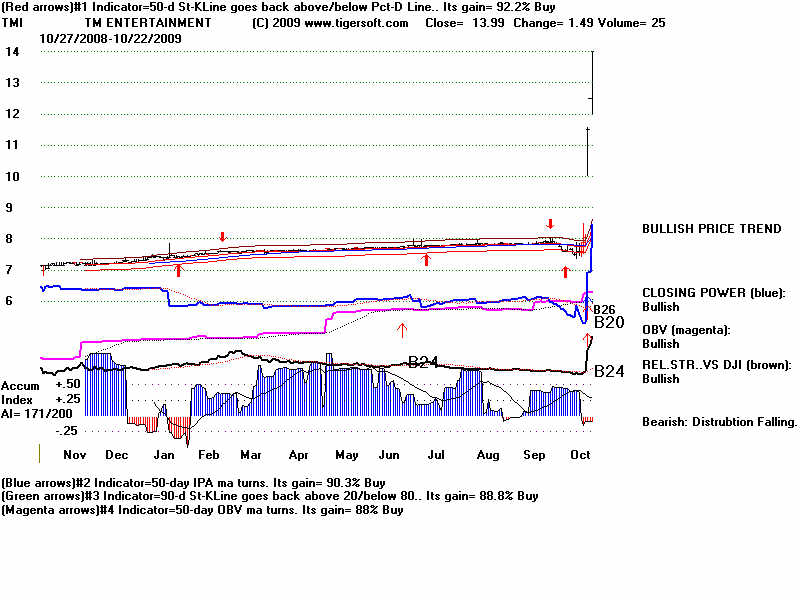
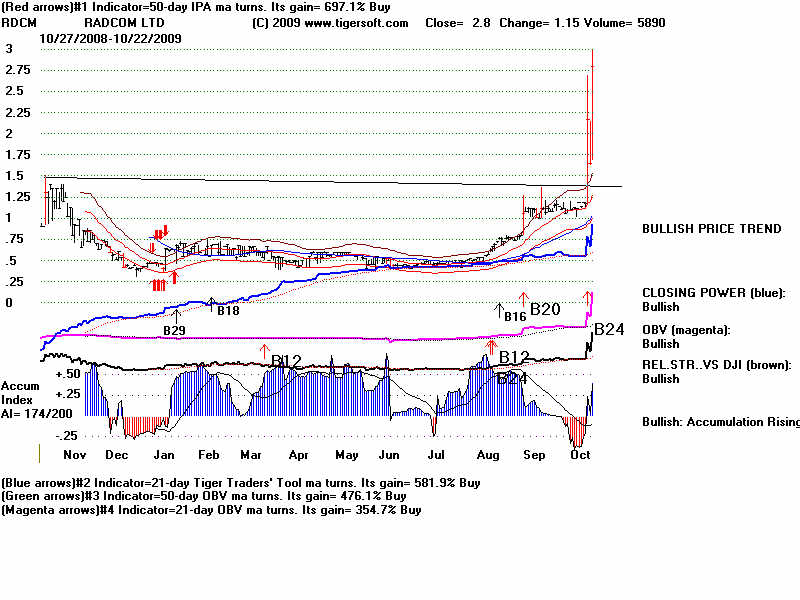
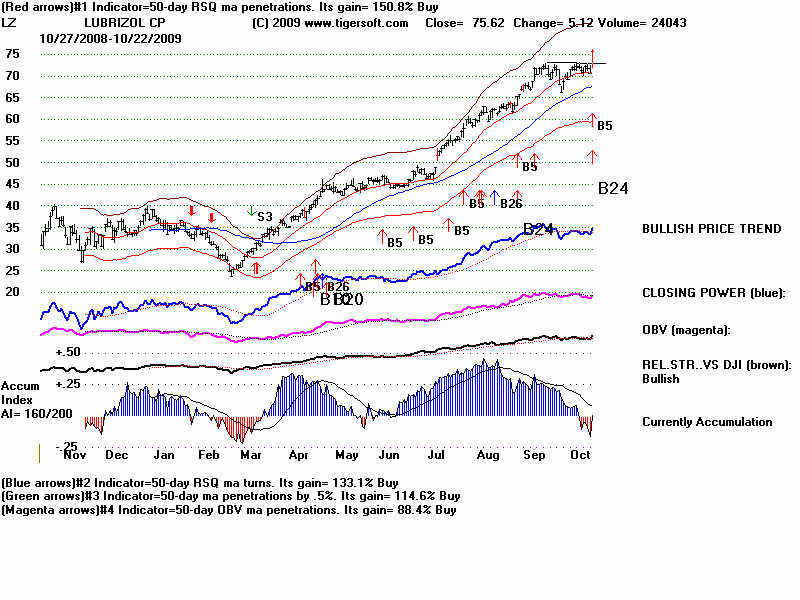
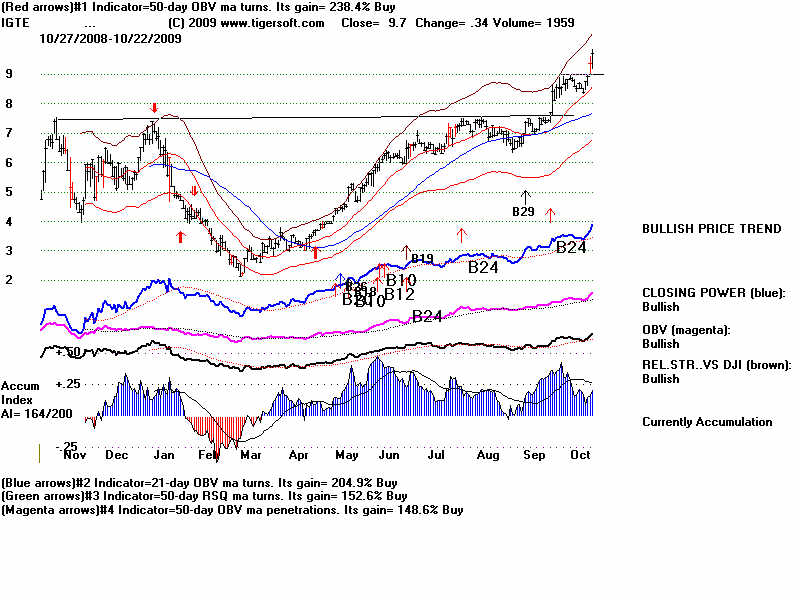
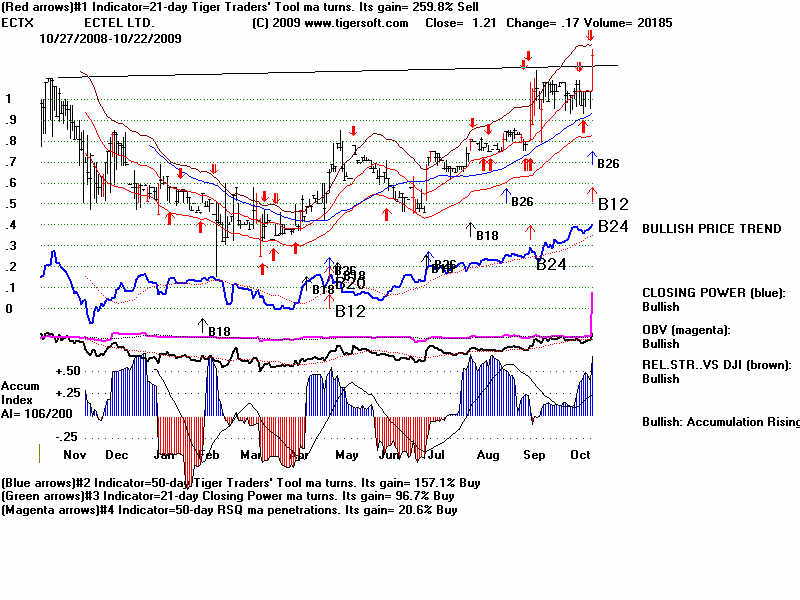
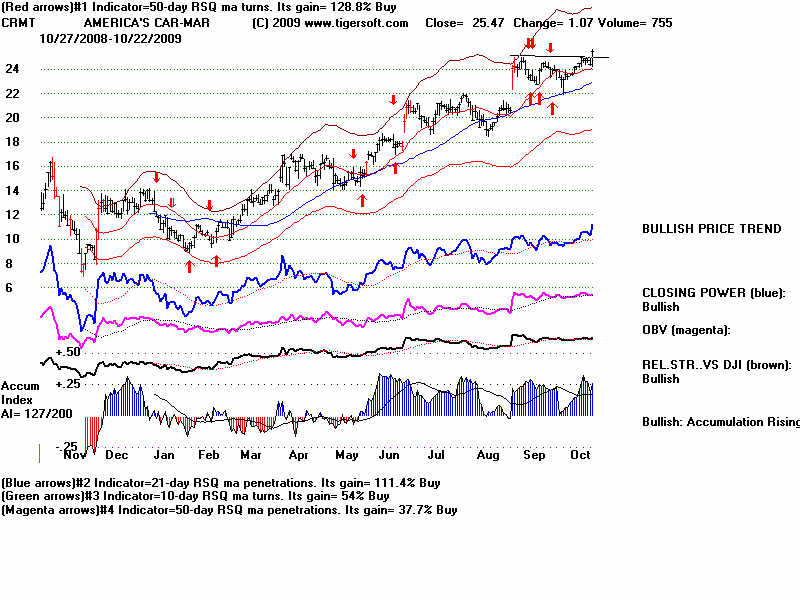
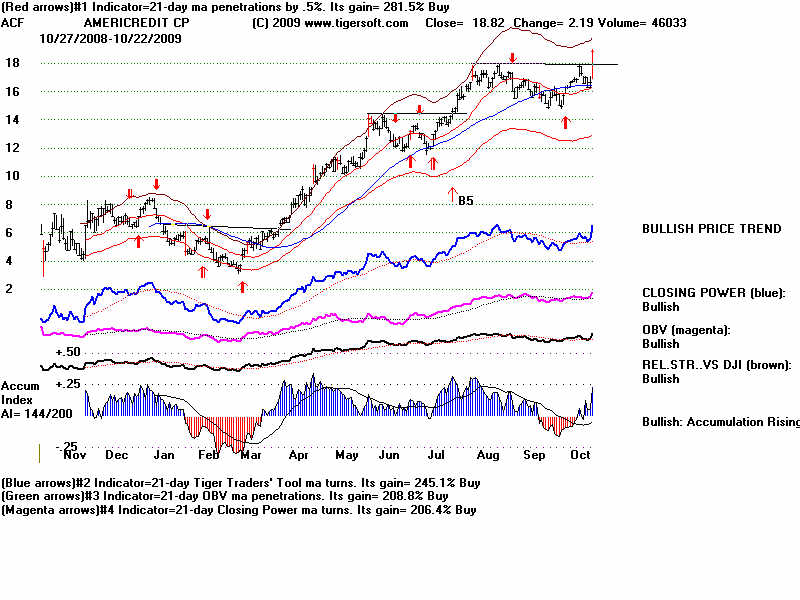
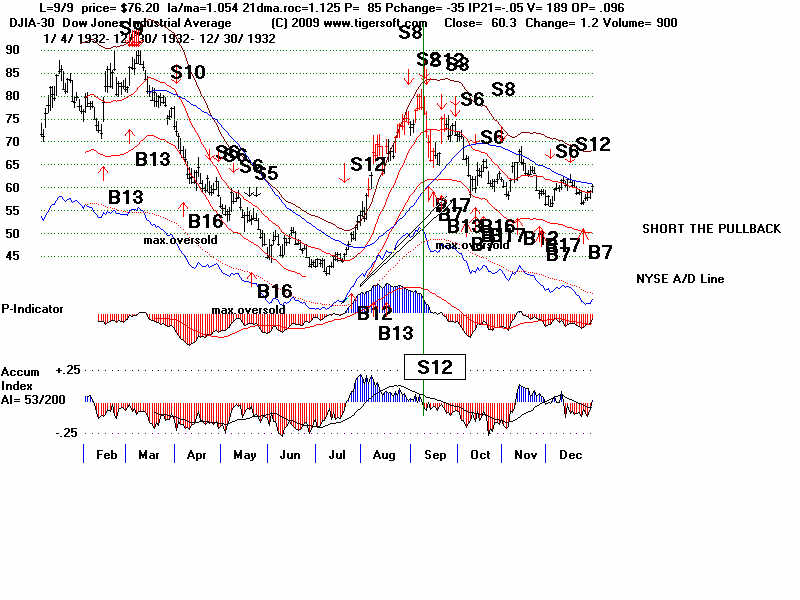
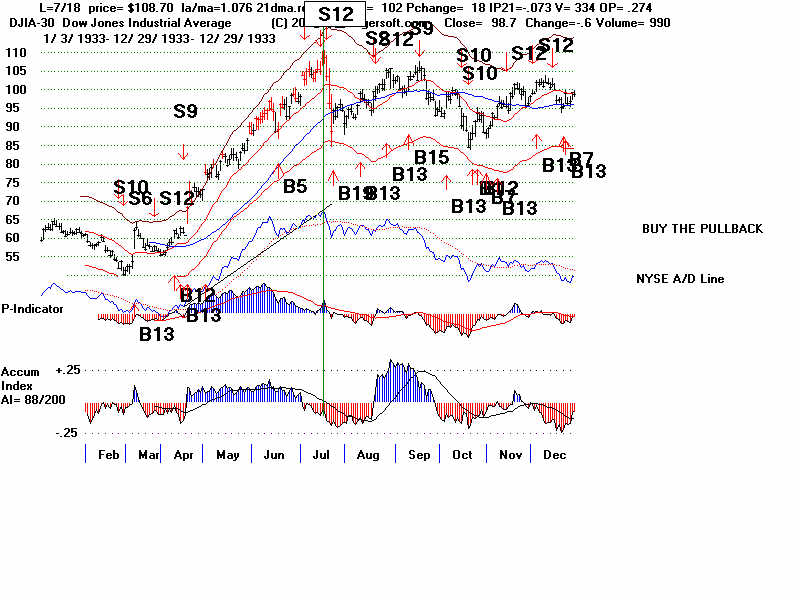
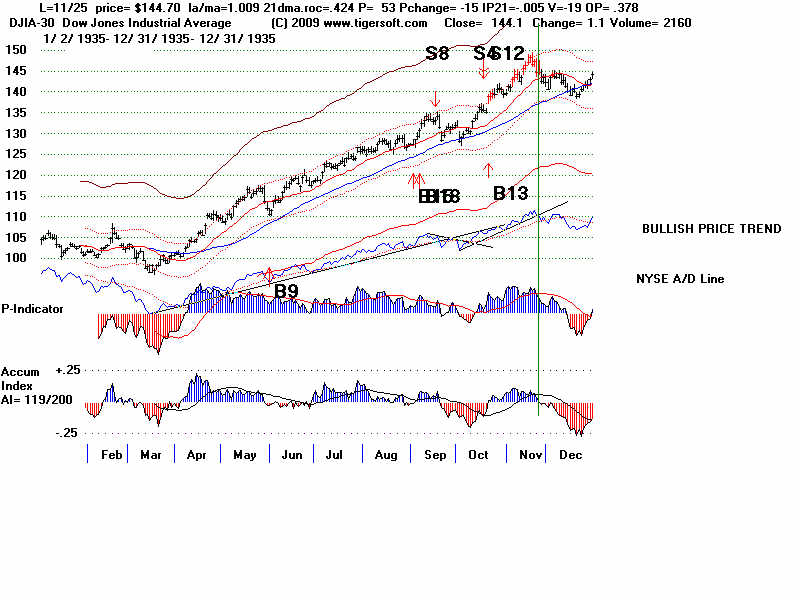
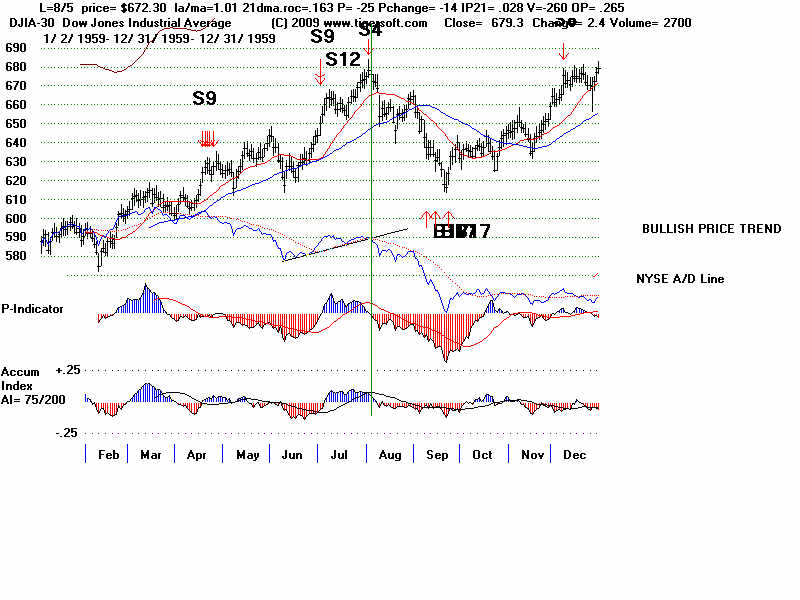
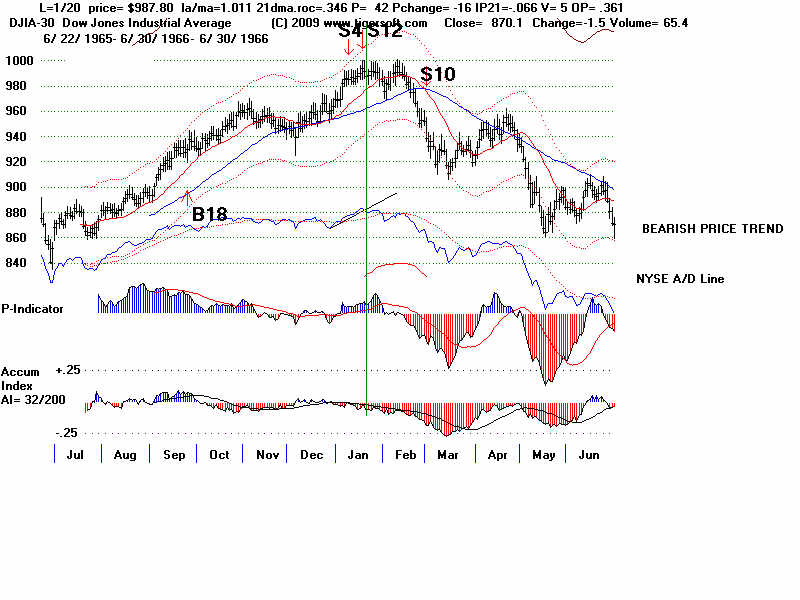
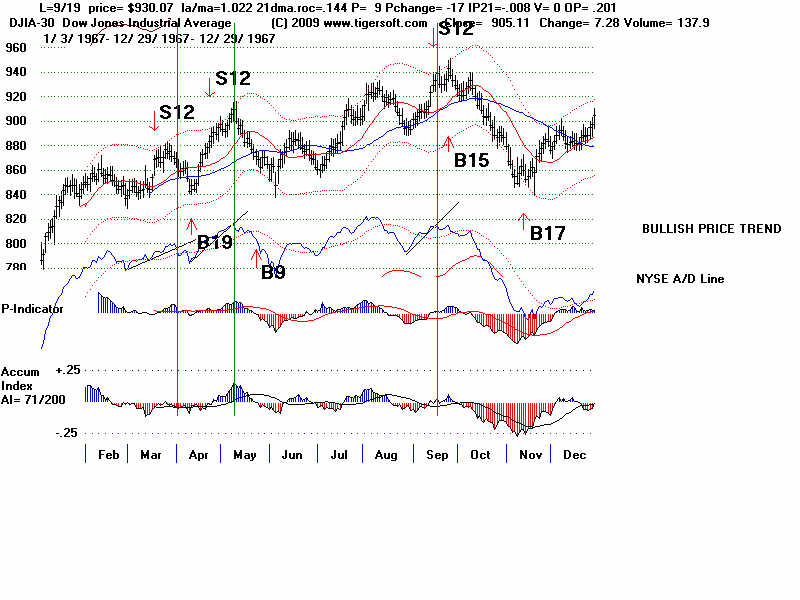
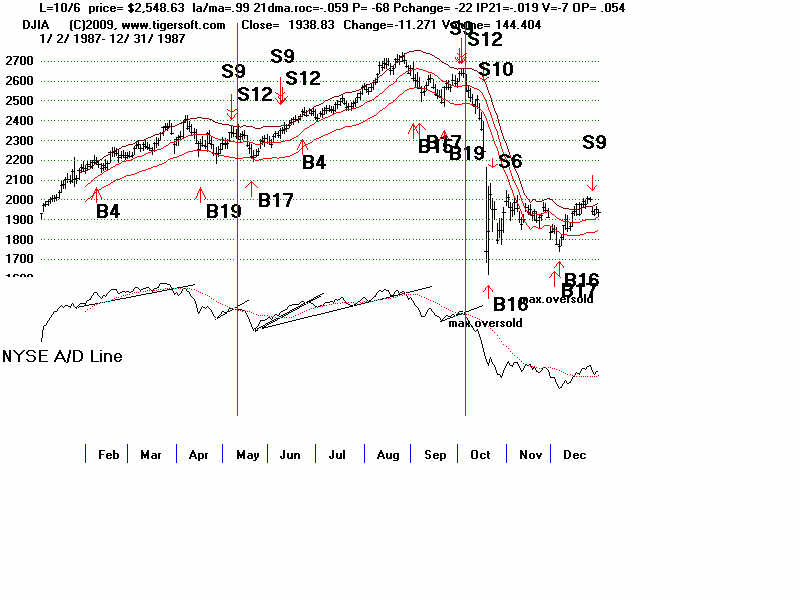
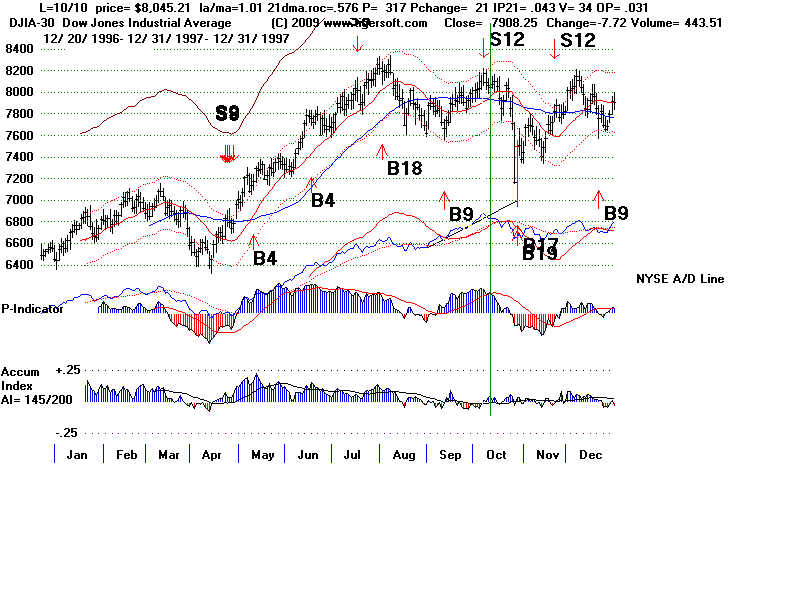
But it just isn't the case. Revenue and earnings are continuing to fall sharply at
Manpower
and Robert Half. In July, Manpower Chief Executive Jeffrey Joerres said the
Milwaukee-based
company hadn't seen any signs of "real recovery." He added that September and
October were
traditionally strong months and would provide a good indication of a job recovery this
year.
And he's still looking" (Source: Wall
Street Journal - 10/21/2009 )
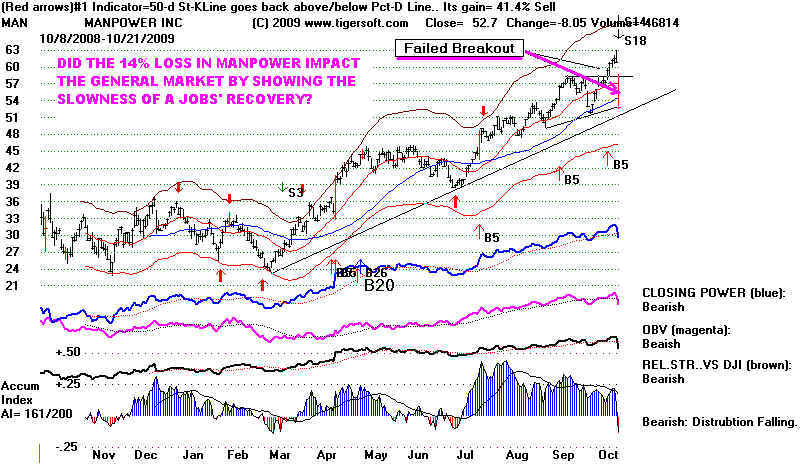
I have shown in a recent Blog that the
rate of unemployment on average takes 7 months
of a rising, recovering stock market before it starts to drop. And sometimes, it
takes a
year.
TigerSoft Blog October 15, 2009 Unemployment Statistics: The Real
Story.
So, a little more patience might be needed, were it not for the continuing pessimism
among people who watch the data most closely.
POVERTY--->DEPRESSION-->POVERTY--->DEPRESSION
Severe inequality explained the disappearance
of consumer demand in the depths
of
the Depression. It was both cause and the effect of the Depression. The
unequal distribution
of
wealth in the US in 2007 was as high as it was it was in 1928.
What can we say positive about an economy that has a real rate of unemployment
of
15% and a rapidly falling currency? That's the situation in the US now. At
least, you
say,
the stock market has been rallying. But for how much lomger? Eerily, what the
DJI
has
achieved is the same percent recovery off the 6450 March bottom that it lost down
at
6450 from the 14160 October 3007 high. Ominously, this pattern, where the recovery's
gain
percentage matched the previous bear market's percent decline, was also present in
1930.
So,
let's look again at the mid 1930 chart, to be sure we are not techncially in a similar
position.
Then
as now, there were Sell S12 signals showing the DJI had reached the upper band
with
the Accumulation Index in negative territory. In other words, insiders and big
holders of stock were so heavily selling into early strength that prices closed near
their
lows, just as they did today. (The charts are at the bottom of this say's
section.)
We
cannot be sure if this will not be another 1930!!
1) If anything, the downside volume is now much higher relative to upside volume
than it was in the last 3 months of the 1930 false rally.
2) Breadth (advances minus declines) is stronger. But we can see from the
1929-1930 chart that once the long (6 month), well-tested A/D Line uptrend was violated,
there
was a wholesale deterioration in all technical indicators.
3) In the 1929-1930 period, red Distribution predominated. That is not true in 2009.
This is a good sign. Bit how much of the buying was done by banks that could borrow
money
for 1/4% from the Fed?
4) Peerless Buy signals based simply on momentum, like the B15, are not to be trusted
if
the long A/D Line uptrend is broken.
The
technicals and internal strength indicators will have to hold up well to get new buy
signals on a decline.
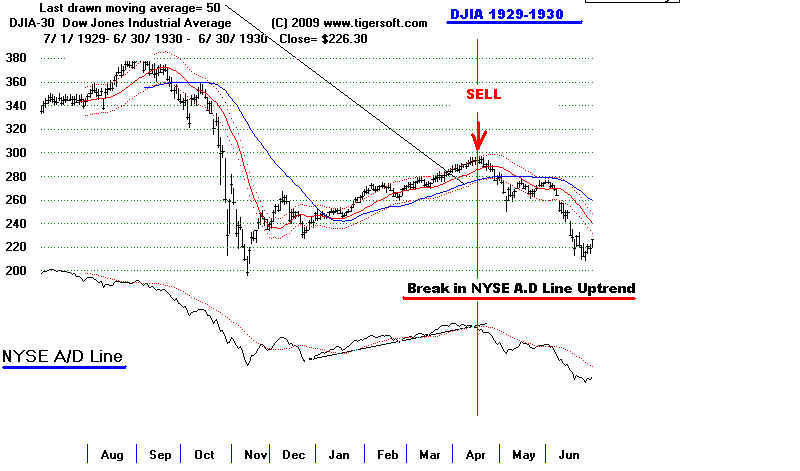
A Decline Was Expected.
That Will Help Bolster The Market.
We should not be too surprised by a sell-off
from the DJIA-10,000 psychological resistance.
A 10% decline to 9200 would actually be constructive. We just ahve to wait and watch
the technical indicators. For now, enjoy the show. Wall Street acts like a
spoiled and
manipulative cry-baby turned adosescent. Since 1982 Wall Street has come to expect
Washington to always indulge and forgive its every whim and greedy indulgence. So,
naturally,
it declines now that Congress is moving to set up a consumer
protection agency overseeing
the
financial world to take up the immense slack left by the industry-captured SEC.
Meawwhile, the US Treasury has been looted by the opportunists who profited from the
trillion
Dollar Iraq War and the Trillion Dollar Bank Bailout. So, there is no money left for
job-intensive,
much needed public works programs to reruild the nation's aging, cracking infrastructure.
Clearly, Obama is not an FDR or a Eisenhower, when it comes to visions of public works'
jobs.
Whereas FDR was long used to dealing with Wall Street as Governor of New York, Obama
seems only to know about making speeches that conceal broken promises. So, America faces
an economic reality far worse than STAGFLATION. We see a middle class in many
areas of
country that is being ravaged by debts, no income and a collapsing dollar. A
majority still
believe in Obama. But that will not last if all his words yield little or nothing.
Sure, as he
is always reminding us in his daily speeches, it is true that he inherited a mess, but his
Treasury
Secretary and the industry-captured Federal Reserve have squandered at least a
trillion on the very fraud merchants and stock manipulators that created the mess.
40 million
Americans lack jobs. Not good paying jobs. Just jobs!.
The Market
Today the DJI's closed 160 points dowm from
the first hour's peak above 10100. Closing at it
lows, as it did today, has a depressing effect on the Tiger Accumulation Index. With
the DJI
having today tagged the 3.5% upper band with the Accumulation Index now at -.023, there
is a negative non-cofirmation in the DJIA, just like the TigerSoft S9s in individual
stocks
we have been mentioning for a week. So, today the technical conditions were met for
a
Peerless S12. Since we have been calling for a decline for the last few trading
days, this
ratifies and reinforces what we have been saying. already.
Gargage in - Garbage out. If we not had problems with Dial Data recently getting
the data needed for Peerless, we probably would have gotten a Sell S12 a few days ago.
Yahoo's data, which we substituted is not always exactly the same. Since 1990, we
have
relied on Dial Data. So, I think it's best to keep using it. When it doesn't
come in properly,
I will more effort to get them to provide it the next day. Here is the DJI chart
using only
DIAL DATA. ((not yet posted...)
What follows is the track record of Peerless S12s since 1942.
Peerless Sell S12s: 1942-2009 Date DJI Gain
------------- ----------- --------
5 / 11 / 1942 99.2 -.07
12 / 6 / 1956 492.7 .046
7 / 1 / 1959 650.2 .019
5 / 18 / 1960 623 -.005
7 / 10 / 1962 586 .012
1 / 18 / 1966 994.2 .22
9 / 15 / 1966 814.3 .069
10 / 26 / 1966 801.11 .014
3 / 16 / 1967 868.49 .024
4 / 21 / 1967 883.18 .014
9 / 14 / 1967 929.44 .075
1 / 9 / 1968 908.29 .078
7 / 11 / 1968 922.82 .048
10 / 16 / 1969 838.77 .075
1 / 2 / 1970 809.7 .042
7 / 15 / 1970 711.66 .006
8 / 23 / 1971 892.38 .083
8 / 31 / 1971 898.07 .088
5 / 22 / 1972 965.31 .056
8 / 3 / 1972 947.7 .027
1 / 12 / 1973 1039.36 .082
7 / 12 / 1973 901.94 .031
1 / 2 / 1974 855.32 .036
2 / 22 / 1974 855.99 .314
6 / 7 / 1974 853.72 .312
10 / 16 / 1974 642.28 .061
10 / 18 / 1974 654.88 .079
8 / 29 / 1975 835.34 .012
10 / 21 / 1975 846.82 .025
3 / 25 / 1976 1002.13 .036
7 / 17 / 1978 839.05 -.057
9 / 11 / 1978 907.74 .088
10 / 10 / 1978 891.63 .072
10 / 11 / 1978 901.42 .082
1 / 17 / 1980 886.57 .123
1 / 2 / 1981 972.78 .035
4 / 1 / 1981 1014.14 .169
1 / 6 / 1983 1070.92 .038
1 / 7 / 1983 1076.07 .043
1 / 6 / 1984 1286.64 .121
5 / 6 / 1987 2342.19 .052
6 / 8 / 1987 2351.64 -.04
10 / 2 / 1987 2640.99 .303
10 / 7 / 1997 8178.31 .083
11 / 20 / 1997 7826.61 .009
7 / 7 / 1998 9085.04 .16
4 / 7 / 1999 10085.3 -.056
6 / 18 / 1999 10855.55 .042
8 / 17 / 1999 11117.07 .064
12 / 17 / 1999 11257.43 .026
7 / 17 / 2000 10804.27 .01
7 / 19 / 2000 10696.08 0
12 / 8 / 2000 10712.91 .113
4 / 10 / 2001 10102.74 -.051
10 / 10 / 2001 9240.86 -.002
5 / 14 / 2002 10298.14 .205
8 / 8 / 2002 8712.02 .046
1 / 6 / 2003 8773.57 .052
4 / 5 / 2004 10558.37 .054
6 / 30 / 2006 11150.22 .031
12 / 6 / 2007 13619.89 .107
==========================================================
Number of trades = 61 Avg. Gain= 6.3%
|
DJIA: 1929-1930 FALSE RALLY
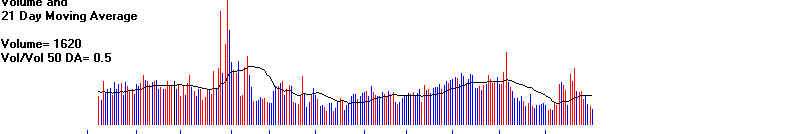
1929-1930 Blue Accumulation was inferior to
the amount of Red Distribution.

---------------------------------------------------------------------------------------------------------------------------