wpe50.jpg (1913 bytes)     TigerSoft News Service   7/26/2010      www.tigersoft.com     
      
                  WHEN SUMMER
                  HEAD AND SHOULDERS
                       PATTERNS FAIL.


   by William Schmidt, Ph.D.  
           
See also http://www.tigersoft.com/PeerInst/HS-SellS10/index.html                                                    
wpe4F.jpg (33251 bytes)  

Tiger Software 
   Helping Investors since 1981
       Make Your Retirement Grow
    Suggestions: 
      
Peerless Stock Market Timing: 1928-1966         
Track Record of Major Peerless Signals
       Earlier Peerless-DJIA charts       
7 Paths To Making 25+%/Yr. Using TigerSoft 

       Index Options            
FOREX trading        
Investing Longer-Term         
Mutual Funds
       Speculative Stocks     
Swing Trading       
Day Trading        
Stock Options          
Commodity Trading
      

      Research on Individual Stocks upon Request:   Composite Seasonality Graph
of Any Stock for $125.
Example of historical research NEM - Newmont Mining.   Order Here.


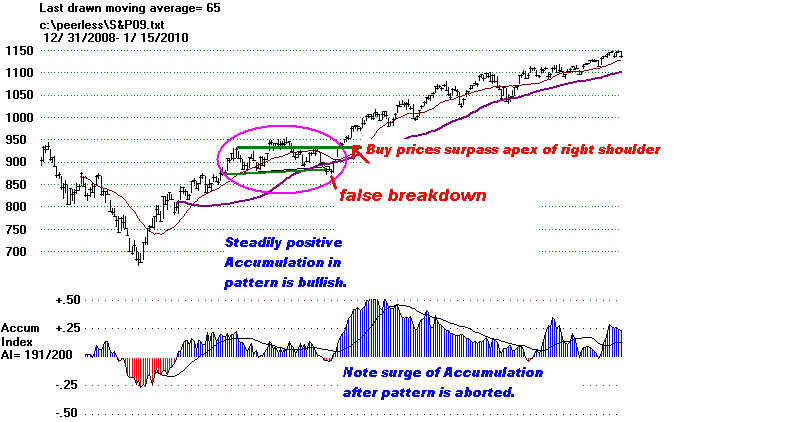
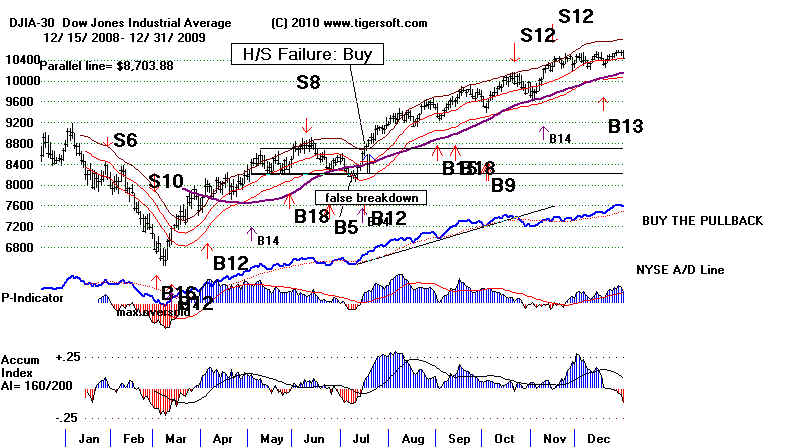
                            WHEN SUMMER
                   HEAD AND SHOULDERS
                       PATTERNS FAIL.


Most traders do not appreciate that a move by the DJI  above the apex of its right shoulder
            is a reliable Buy, especially in Summer, when a seasonal  upswing from June lows is fairly common.
            A lot of advisors tell us to cover short sales then because the head and shoulders pattern thereafter
            has been destroyed.   I would go further than that and say BUY in these cases, but watch the
            internal strength indicators, Peerless signals and the uptrending NYSE A/D Line.
                               
                              Example:   "Technical analysis is not always 100% accurate,
                                                so it is important to always place a stop loss in case the pattern fails.
                                                I would recommend placing a stop loss at a price just above the second
                                                right shoulder. If at any point price moves and closes above the head,
                                                then the pattern has failed.

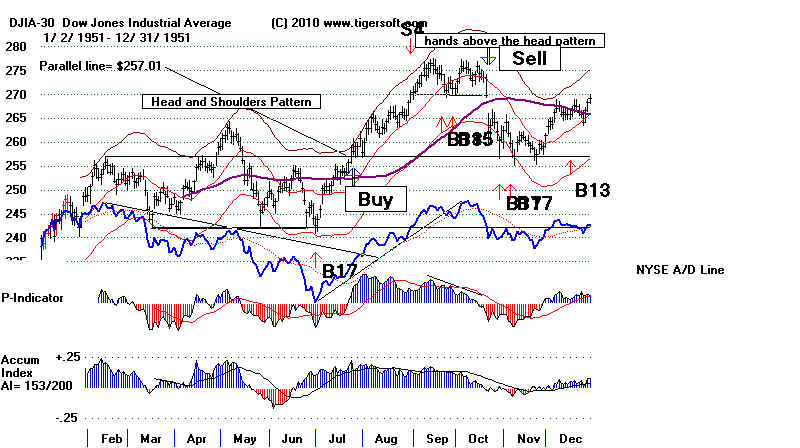
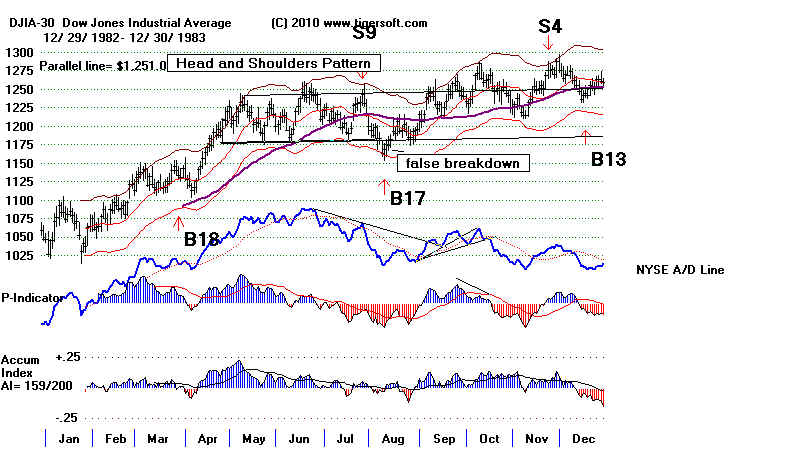
             In the three cases shown below, you can see that the accompanying NYSE A/D Line was always
             weak as the pattern unfolded, but then improved considerably first when the neckline either held
             or only briefly failed and then when the apex of the right shoulder was exceeded.  The general
             market was clearly taking its cue from the DJIA.


                                                          Early Signs The Pattern Will Fail

            Good breadth and a rising A/D Line is a certainly a warning that head and shoulders pattern
             may not work out as the chartists expected.  In July 2009 the A/D Line did not confirm the
            
false breakdown.  Our Short Selling book also tells us to watch for positive Accumulatin Index
             readings.
Consistently positive AI readings on the right shoulder are bullish,  So is a rising OBV Line
             while the pattern is forming.  Look at the SP-500 chart just below for 2009.
You can see these
            factors were all at work in the SP-500 chart working to destroy the pattern.


S&P09AI.BMP (1012854 bytes)
wpe1A5.jpg (11584 bytes)                                                             


                                                       DJIA: 1951, 1983, 2009

 1951
wpe1A2.jpg (66457 bytes)                                       
1983
wpe1A3.jpg (66242 bytes)
2009
wpe1A4.jpg (68466 bytes)


More Reading
          http://www.tradersnarrative.com/does-the-stock-market-owe-us-a-summer-rally-4310.html


Hit Counter