
TigerSoft Freedom News Service 3/26/2010 www.tigersoft.com
Key Characteristics
of Year-Long Bull Markets
by William Schmidt, Ph.D. (Columbia University)
(C) 2010 All rights reserved. Reproducing any part of this page without
giving full acknowledgement is a copyright infringement.
Research on Individual Stocks upon Request:
Composite Seasonality Graph of Any Stock for $125.
Example of historical research NEM - Newmont Mining. Order Here.
See the TigerSoft techniques for find Explosive Super Stocks: Oil Coal
 |
Tiger
Software Helping Investors since 1981
|
|
Key Technical Characteristics
of Year-Long Bull Markets
Not Interrupted by a Decline
of More than 8%
Note the warnings in each of the 19 earlier cases.
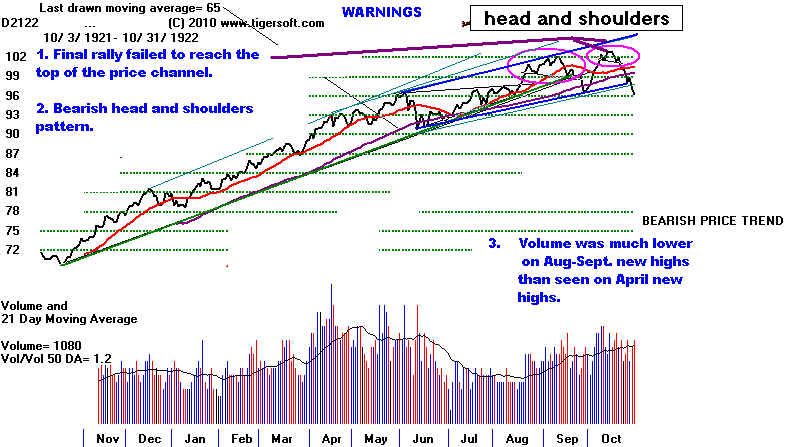
1 Failure to reach top of price channel
1922
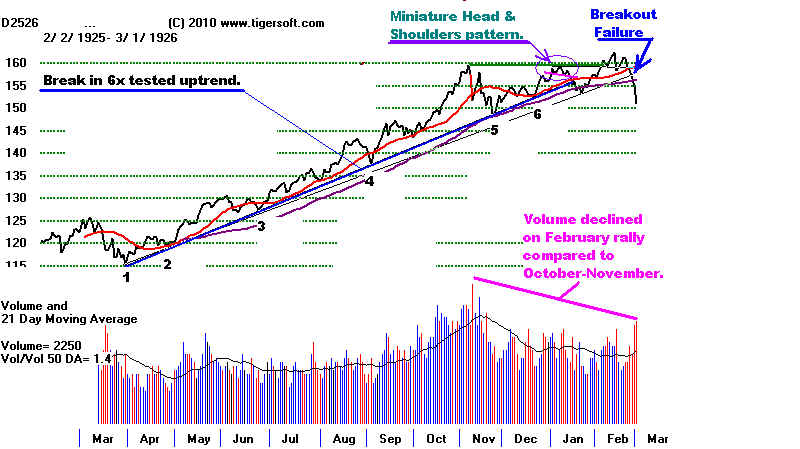
2 Head and Shoulders pattern
1922, 1926, 1943
3 False Horizontal Breakout 1926, 1936
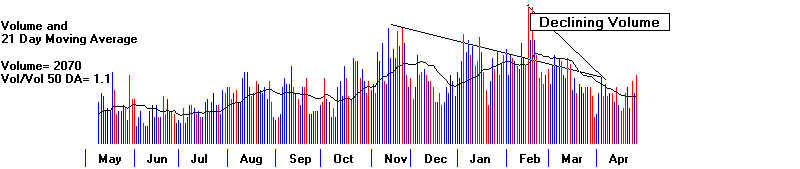
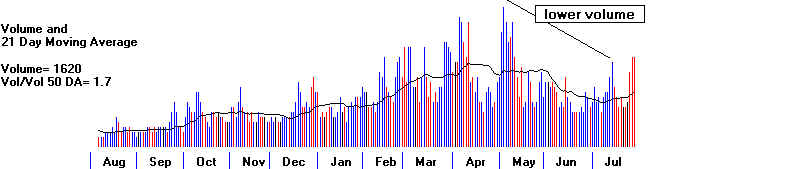
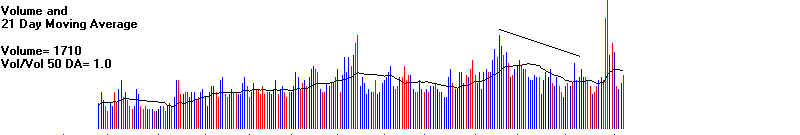
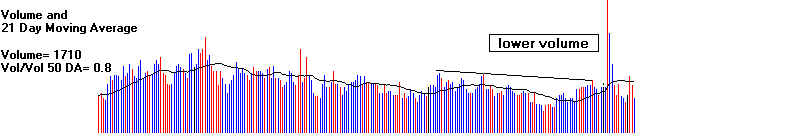
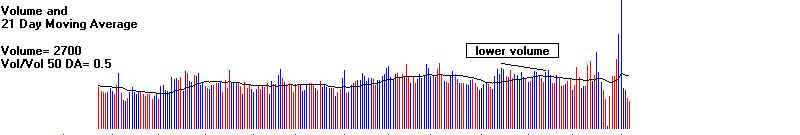
4 Volume was much lower on final rally:
1922, 1926.
1936, 1943
5 Breakdown below 4x or more well-tested
uptrendline:
1922, 1926, 1936,
1943
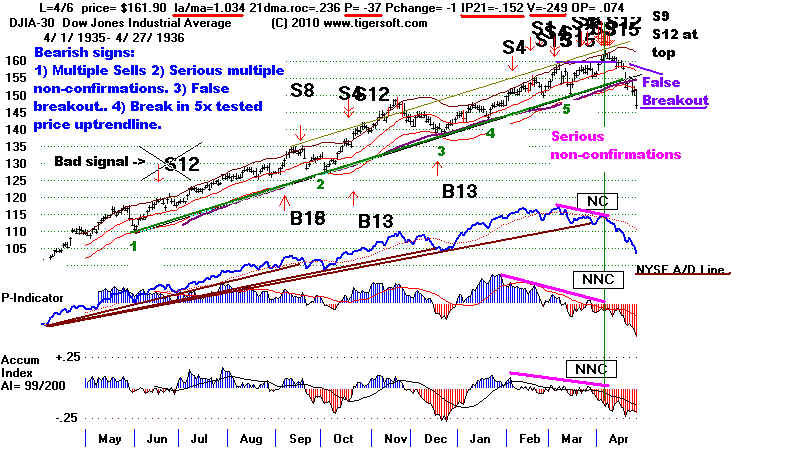
6 Mutiple Peerless Sells 1936
7 Sell S9-S12 1936
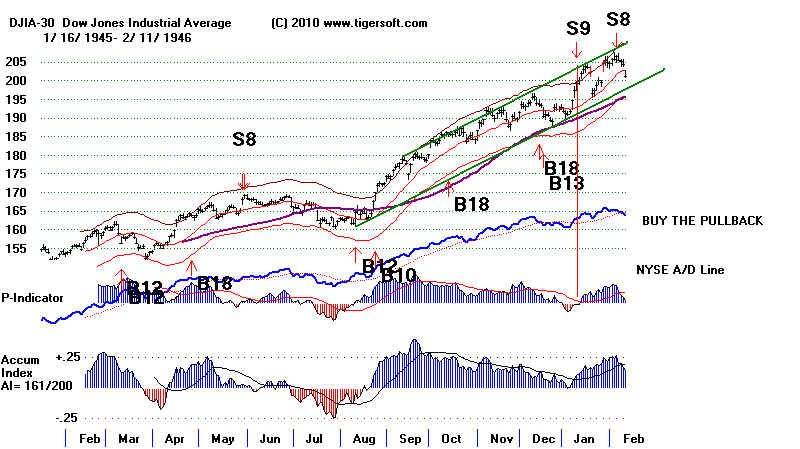
8 Sell S9-S8 1946
9 S9 - 1936, 1943 (six months earlier)
10 S12 - 1936
11 S15 - 1936
1. August 25, 1921 (63.90) to October 17, 1922
(102.60) - Double-Top and 10% decline
Then
marginal new high on March 20, 1923 (105.40) and decline to 88.50 on October 31, 1923.
------------------------------------------------------------------------------------------------------------------------------------------------------
2. May 20, 1924 (88.30) to February
2, 1926 (158.30) - New high failed to bring sustained move
in
and DJI broke support at 153 in February 1926 and fell to its low, down 16% from peak.
October 20, 1926 (146.70) - October 3, 1927 (199.80) under a year...
-----------------------------------------------------------------------------------------------------------------------------------------------------
3. March 15, 1935 (98.20) - April 6, 1936 (161.90) . 12% decline
followed S9/S12.
Chart
with indicators and Peerless Signals
-----------------------------------------------------------------------------------------------------------------------------------------------------
4. April 28, 1942 (92.90) - July
14, 1943 (145.80) - There was no sell signal at
this top.
However,
there was an Sell S9 weeks earlier.
DJI fell 11% to 129.60 on November 30, 1943. 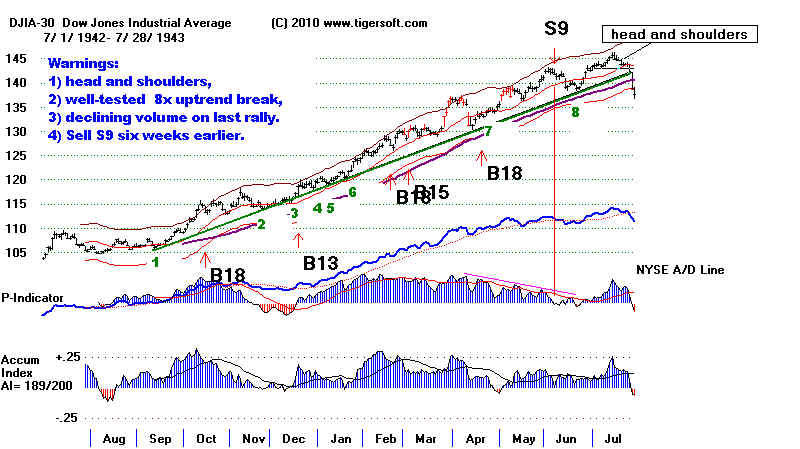
-----------------------------------------------------------------------------------------------------------------------------------------------------
5. April 25. 1944 (135.10) - February 2,
1946 (205.80) - Sell S9 and S8.
DJI fell 10% to 186.00 on February 26, 1946 and recovered to 212.30 before falling
sharply..
-----------------------------------------------------------------------------------------------------------------------------------------------------
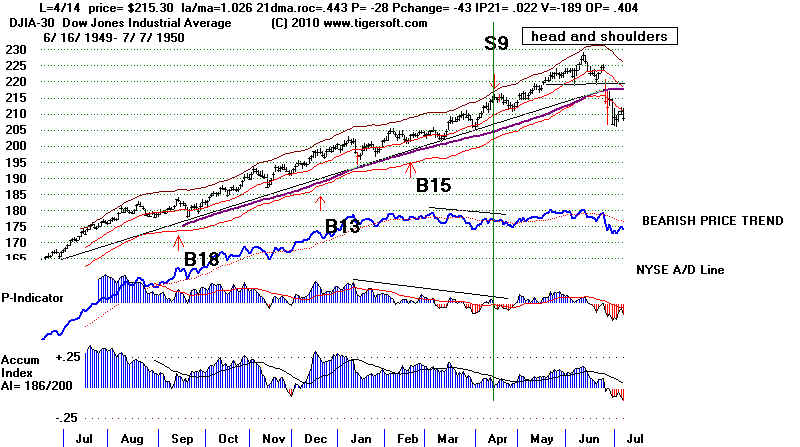
June 14, 1949 (161.90) - June 12, 1950 under a year..
North Korean invasion of South Korea.
Earlier
S9, head and shoulders, break in price uptrend, declining volume on last rally/.
-----------------------------------------------------------------------------------------------------------------------------------------------------
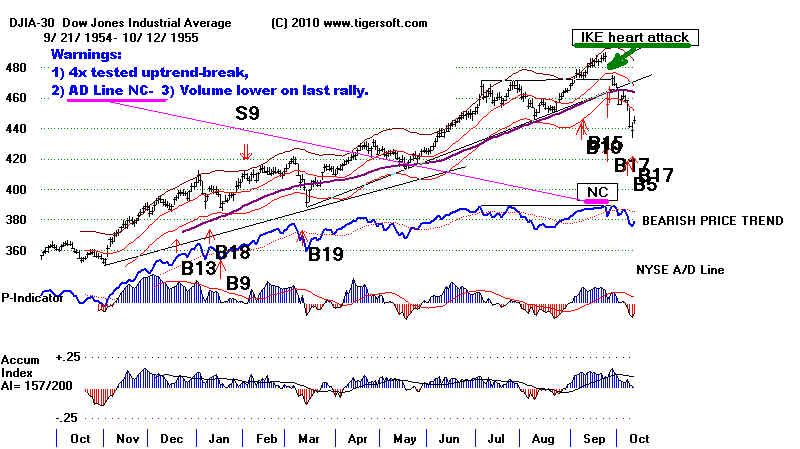
6. September 14,
1953 (255.50) - September 23, 1955 (487.50) - No Sell signal at this top.
Eisenhower heart attack dropped market down 10% to October 11, 1955 (438.60)
-----------------------------------------------------------------------------------------------------------------------------------------------------
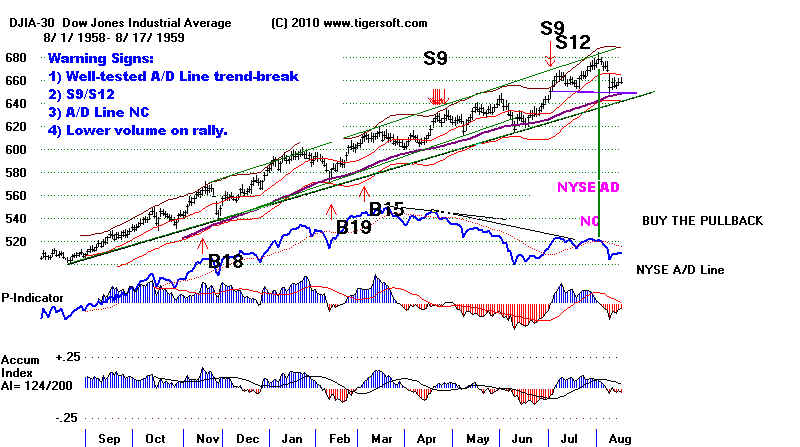
7. October 21, 1957 (423.10) - August 8.
1959 (678.10) There were Sell Signals before at
at the top. DJI fell 9% to 616.50 on September 22, 1959
This was a 22-month rally.
----------------------------------------------------------------------------------------------------------------------------------------------------
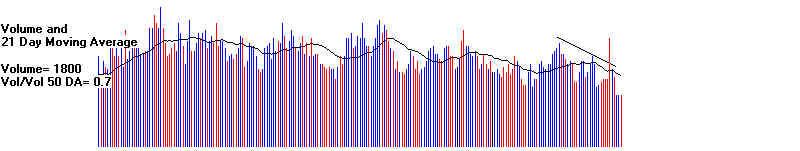
8. October 25, 1960 (566.00) -
November 15, 1961 (734.30). In 1962 a massive head and
shoulders pattern appeared with multiple Sell S10s. The DJI declined 27%
to 535 on June 26, 1962.
Earlier trend-break,
Sell S9 and A/D NC.
----------------------------------------------------------------------------------------------------------------------------------------------------
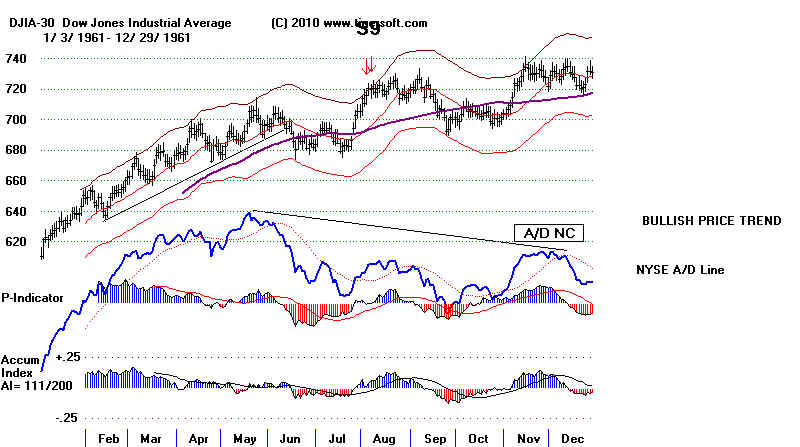
. 9. October 23, 1962 (558.00) - May 14, 1965
(939.60) Sell S8 signal occurred at top
and DJI fell 10%.
Chart with indicators and Peerless Signals of last year.
========================= See online Peerless manual for remaining charts
===================
The
Peerless on-line manual with all the charts from 1915-2010
and
full discussion for each year is offered for $95.
October 7,
1967 (744.32) - September 26, 1967 (937.18) Sell S12 signal
occurred at top
and DJI fell 10%. Under a year...
11. November 24, 1972
(798.63) - January 11, 1973 (1051.70) Sell S9/S12 signal occurred at top
and began deep bear market for 13 months.
Chart with indicators and Peerless Signals
12. August 12, 1982 (776.92) - January 6, 1984
(1286.64) Sell S12 signal occurred at top
and DJI fell 15% to 1086.90 on June 15, 1984.
Chart with indicators and Peerless Signals
13. July 24, 1985 (1086.57) - July 2, 1986
(1909.03)/ Month earlier S2 marked topping area.
DJI fell 9% and formed sidewise trading range.
Chart with indicators and Peerless Signals.
14. January 21, 1988 (1879.31) - October 9, 1989
(2791.41) Sell S9 signal occurred at top
and DJI fell 10% to 2569.26 on October 13, 1989.
15. January 9,
1991 (2470.30) - June 1, 1992 (3413.21) Sell S9 signal occurred a month before
DJI fell slightly more than 8% to 3136.58 on October 9, 1992.
16. October 9, 1992
(3136.58) - January 31, 1994 (3978.36) Sell S4 signal occurred a few days
after top and before DJI fell 10% to 3593.35 on April 4, 1994.
17. November 11, 1994 (3674.63) - March 11, 1997
(7085.16) No signal occurred at this
top. The DJI fell 10% to 6391.69
(April 11, 1997).
18. September 1, 1998 (7827.42) - August 25,
1999 (11326.03) Sell S12 signal occurred at this
top. The DJI fell 12% to 10019.71 (October 15, 1999)
March 11, 2003 (7524.06) - February 11, 2004 (10737.70) Sell S9
signal occurred at this
top. The DJI fell 9% to 10783.08 (October 22, 2004) Under a year...
19. April 20, 2005
(10012.36) - May 10, 2006 (11642.65) Sell S9 signal occurred at this
top. The DJI fell 8% to 10706.14 (June 13, 2007).
20. March 9, 2009 (6547.05) - open (
)
| 1921-1922 |
| 1924-1926 |
| 1935-1936 |
| 1942-1943 |
| 1944-1946 |
| 1953-1955 |
| 1957-1959 |
| 1960-1961 |
| 1962-1965 |
| 1972-1975 |
| 1982-1984 |
| 1985-1986 |
| 1988-1989 |