TigerSoft
News Service 3/27/2010 www.tigersoft.com
TigerSoft
News Service 3/27/2010 www.tigersoft.com BIG PROFITS in INDIAN STOCK MARKET
MADE BY TIGERSOFT'S
PEERLESS STOCK MARKET TIMING
for Period - 1998-2010
TigerSoft's Peerless has had a fine track record in trading the US stock market
since its creation in 1981. What is becoming very clear is that Peerless can be used very
profitably with all foreign ETFs and stocks, too. The world's stock markets move much
more in tandem than ever before. Because of its volatility, the Indian stock market is
particularly appealing to savvy traders. Here we show how advantageously the Indian stock
market may be traded by superimposing the Peerless Buy and Sell signals derived from
the DJIA on two closed end fund that invest exclusively in Indian stocks. These funds are
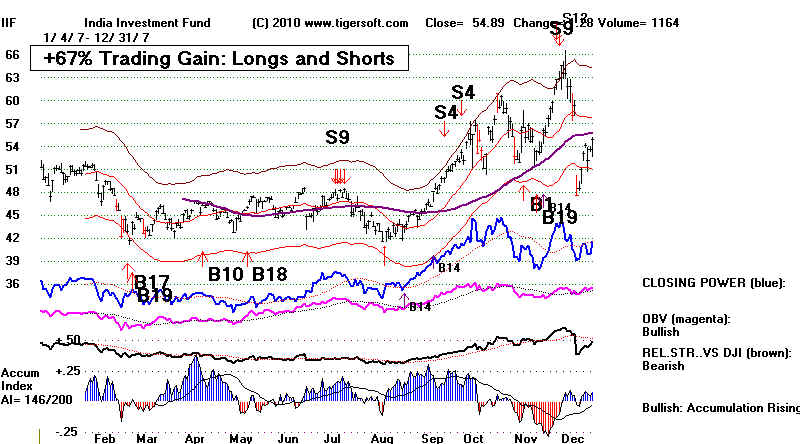
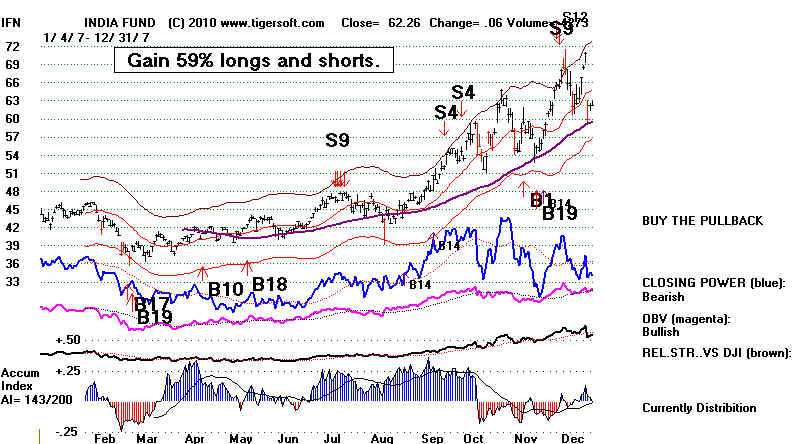
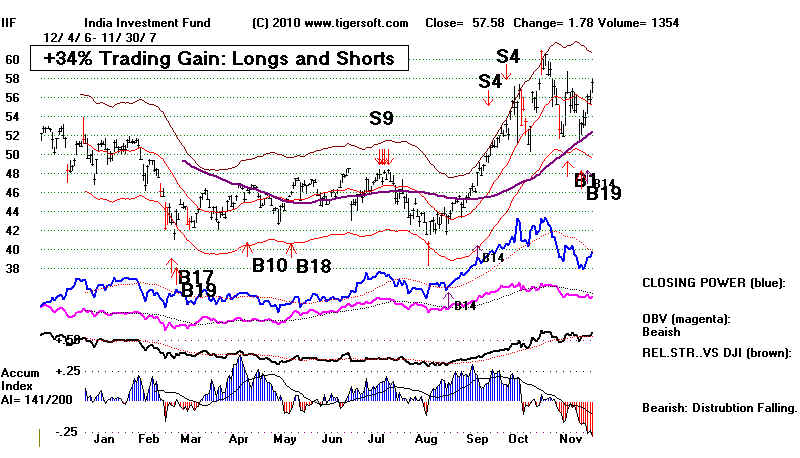
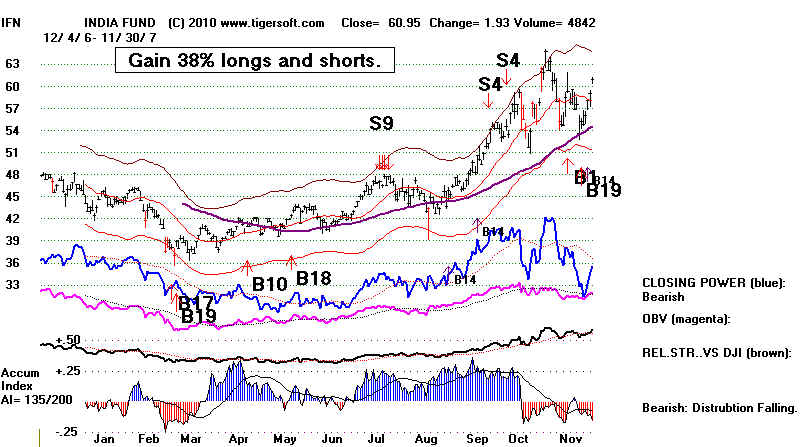
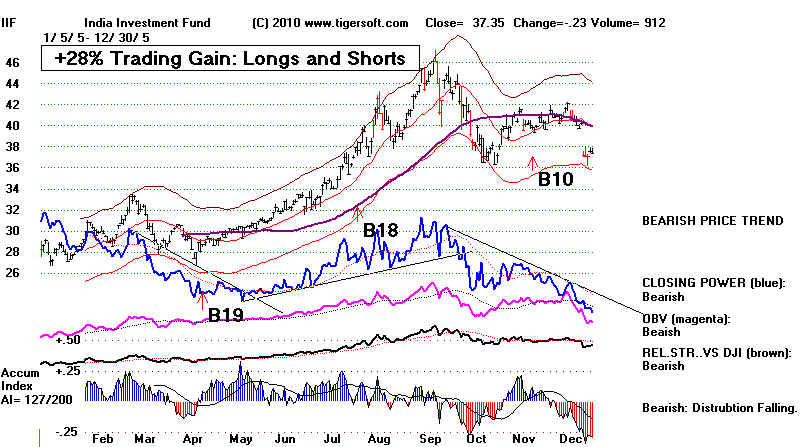
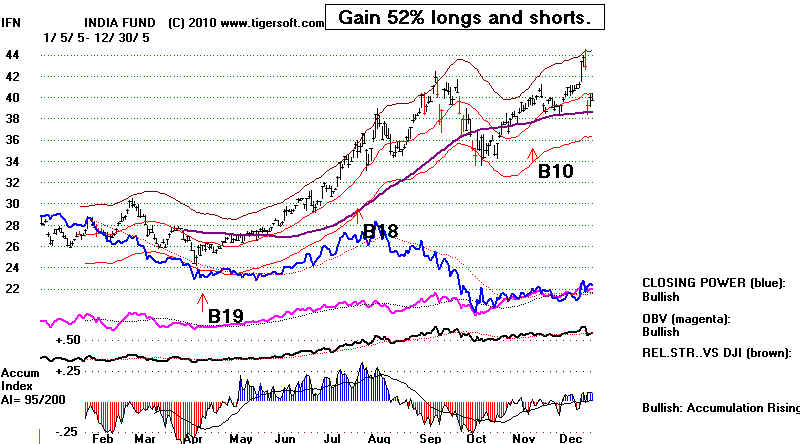
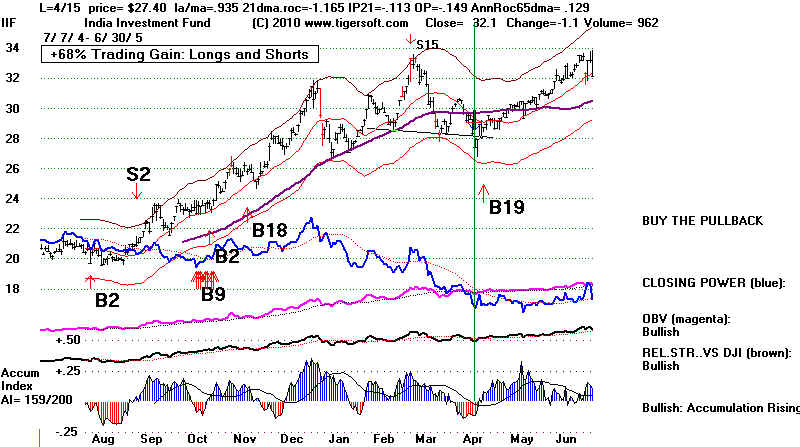
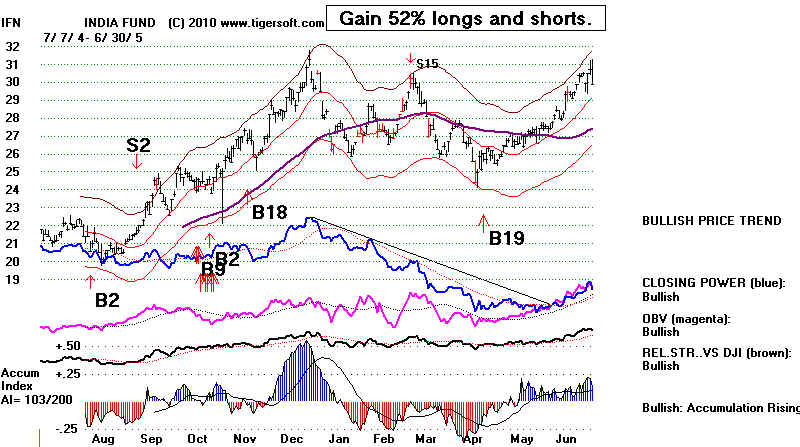
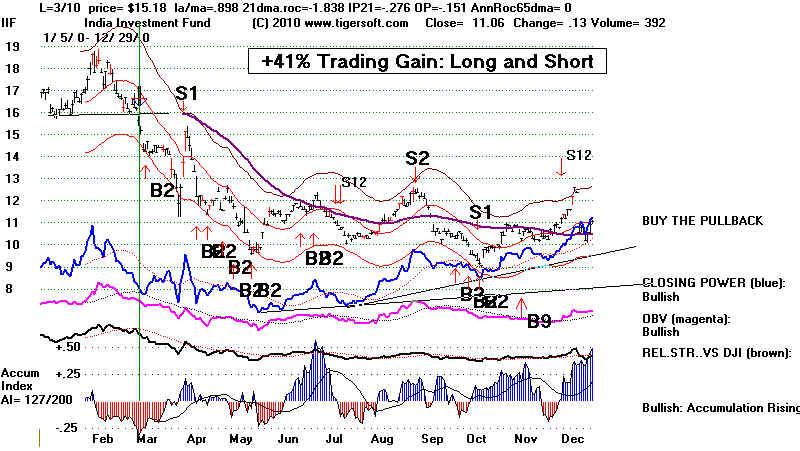
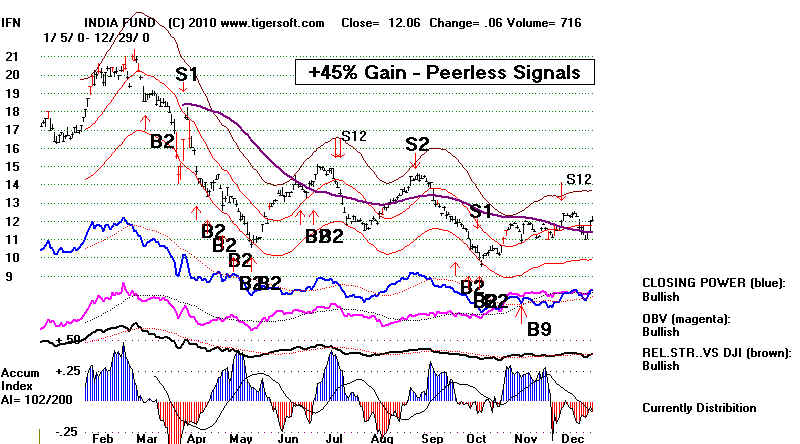
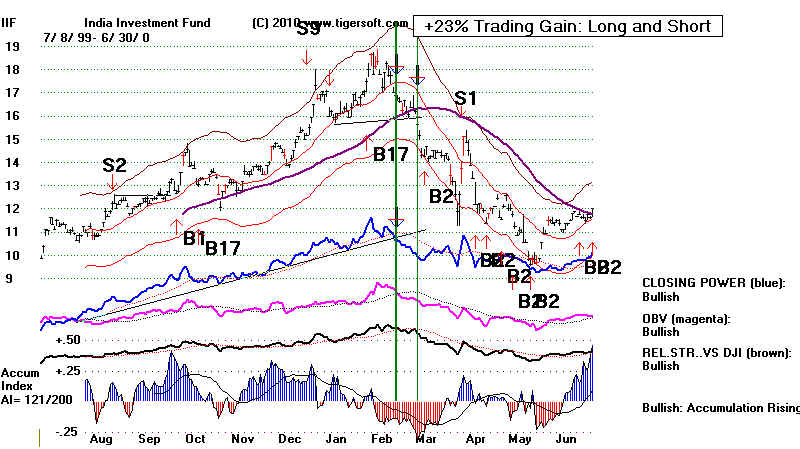
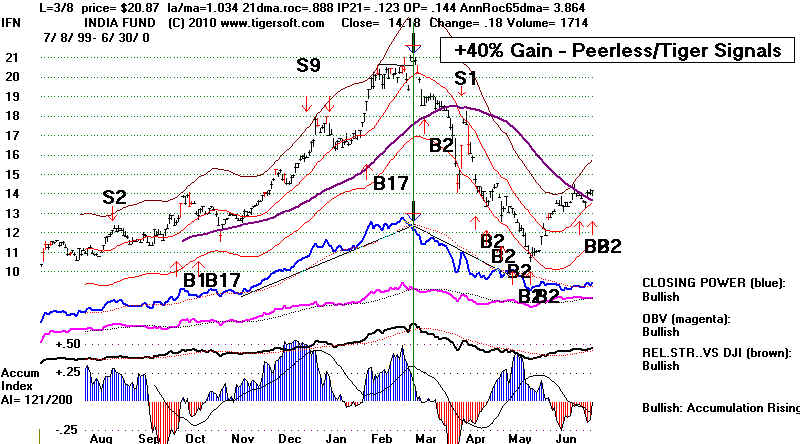
IIF (Morgan Stanley India Investment Fund) and IFN (India Fund).
The yearly trading gains obtained by going long and then short on the Buy and Sell signals,
in turn, since 2005 are remarkable.
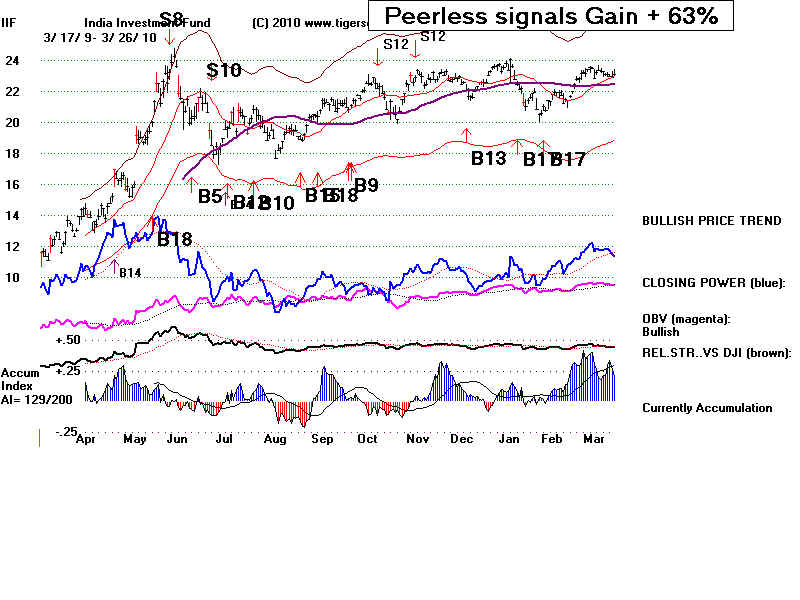
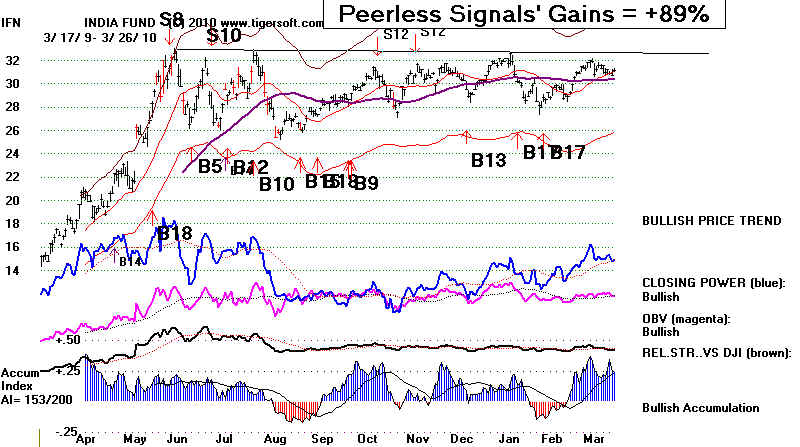
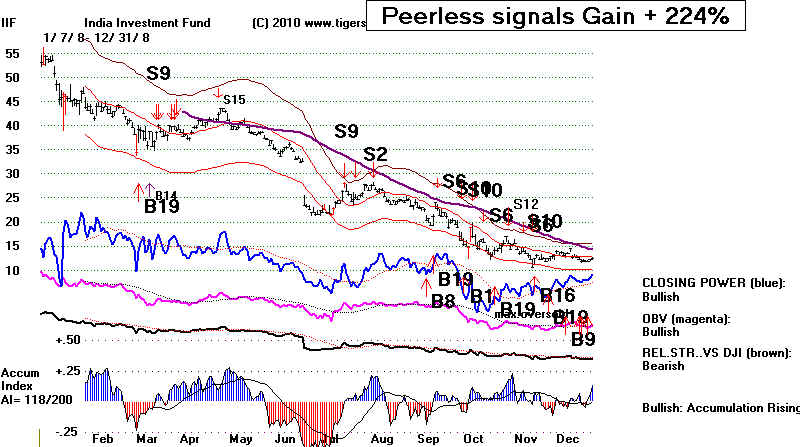
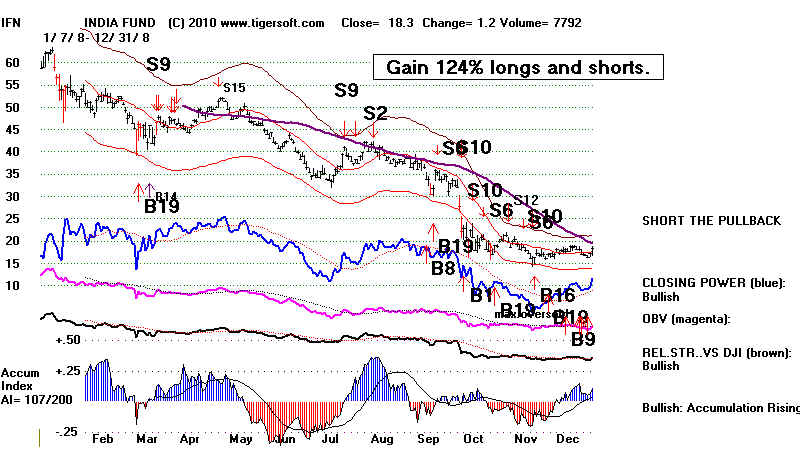
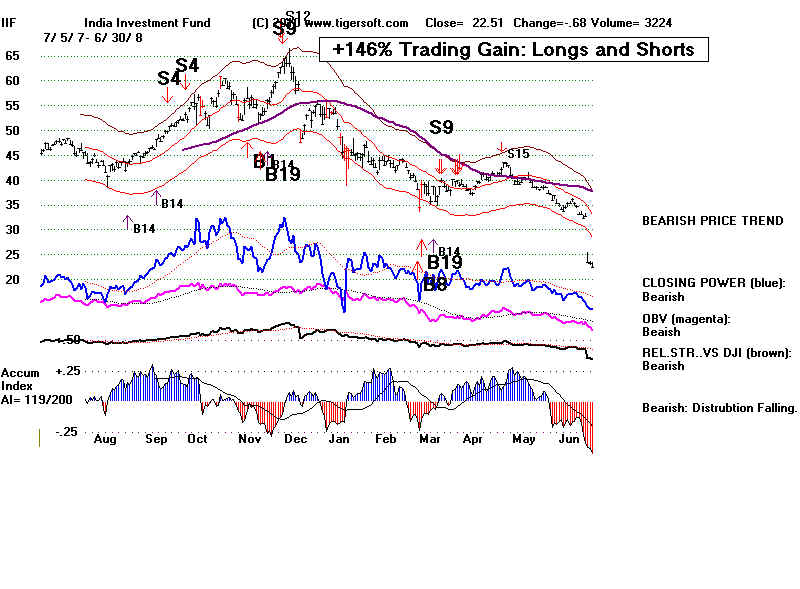
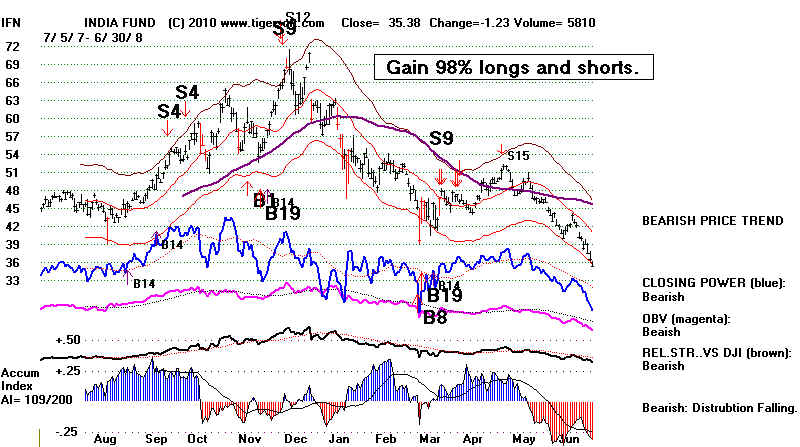
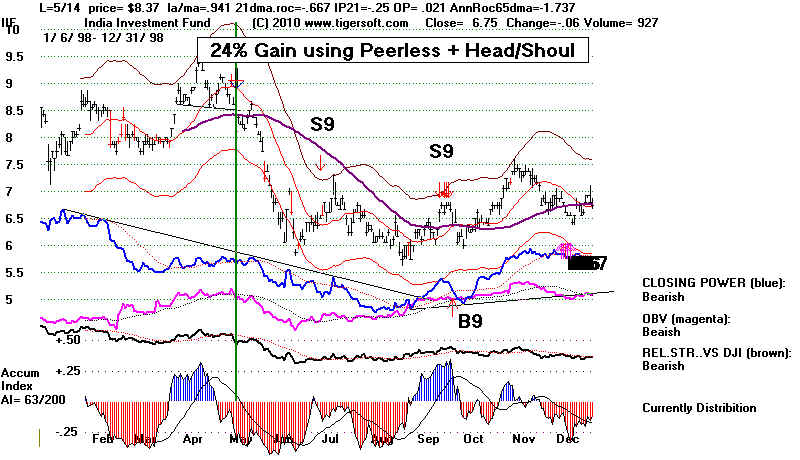
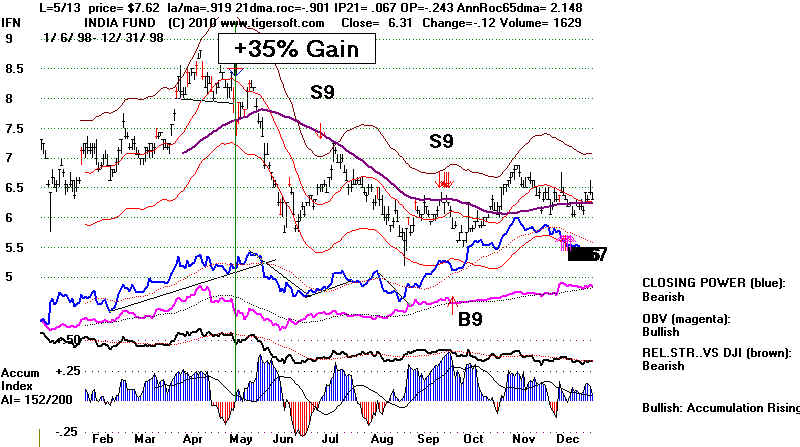
PEERLESS SIGNALS' TRADING GAINS
WITH ETFS INVESTING EXCLUSIVELY IN INDIAN STOCKS.
IIF IIN
------------ ------- ------
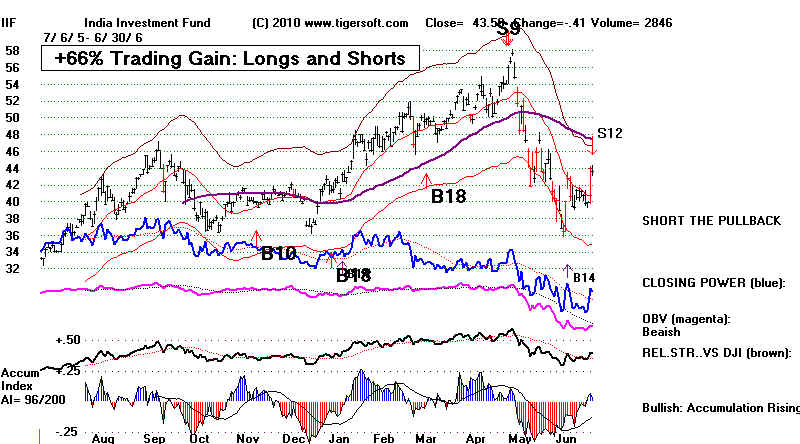
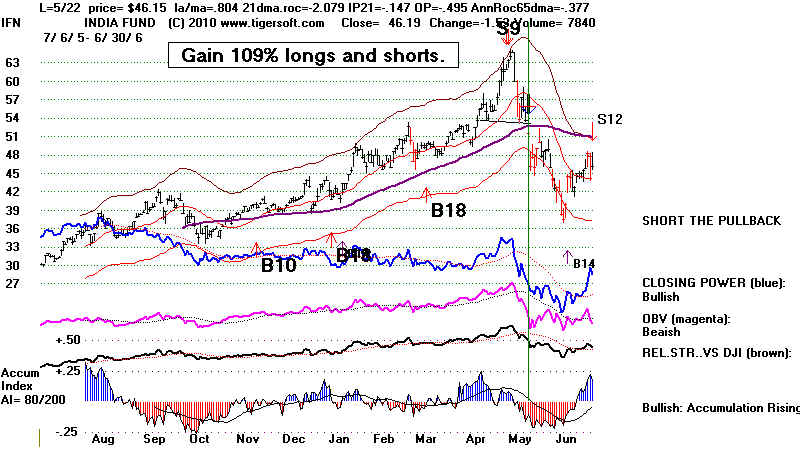
2005-2006 +66% +109%
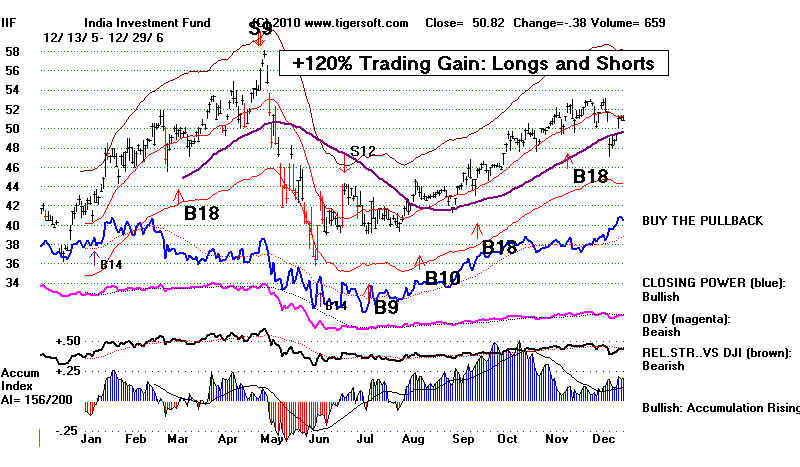
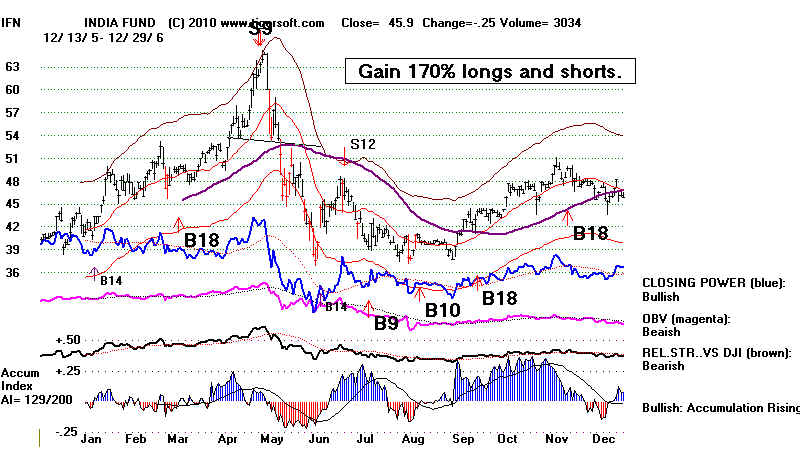
2006 +120% +170%
2006-2007 +34% +38%
2007 +67% +59%
2007-2008| +146% +98%
2008 +224% +124%
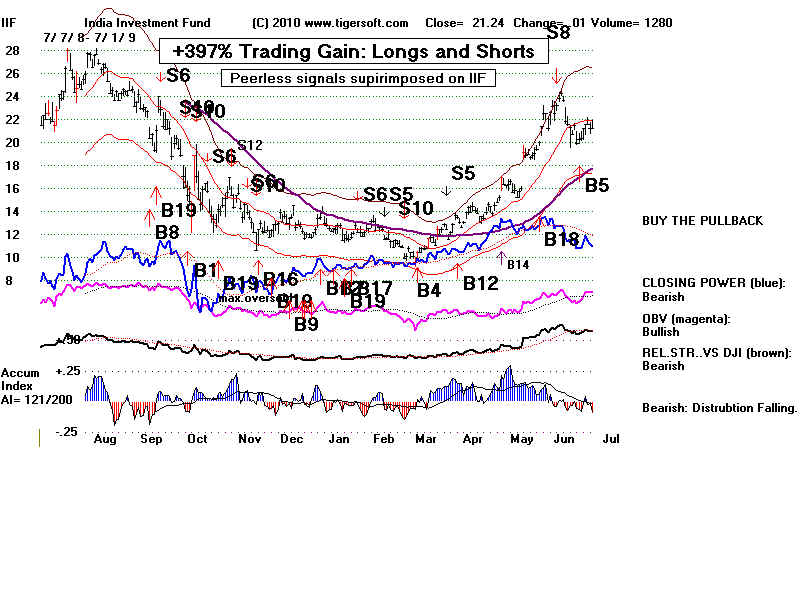
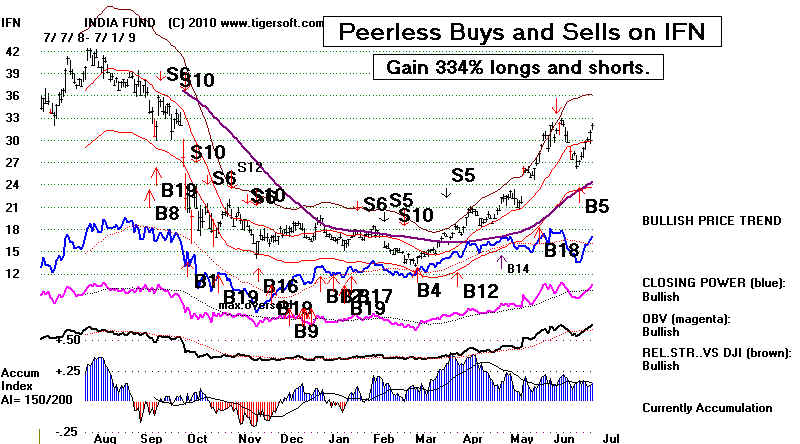
2008-2009 +397% +334%
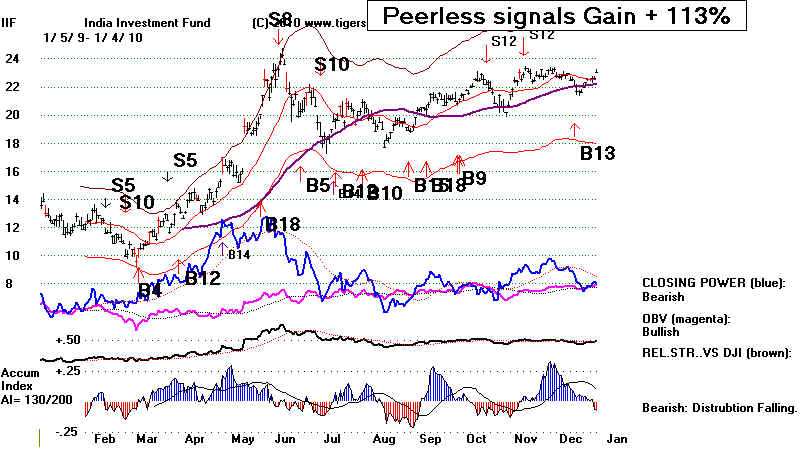
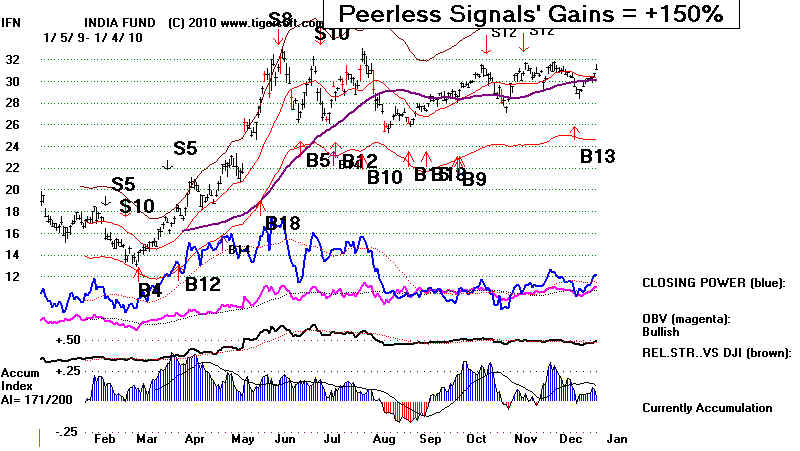
2009 +113% +150%
2009-2010 +63% +89%
As always, we invite all readers of this to contact us. There is no reason that Tiger
users need to defer to the trading advantages of Wall Street insiders. In fact, it is high time
to challenge them. TigerSoft will help you do just that.
by William Schmidt, Ph.D.
william_schmidt@hotmail.com 1-858-283-5900
 |
Tiger
Software Research on Individual Stocks
upon Request, as illustrated here with IIF and IWM:
|
BIG PROFITS in INDIAN STOCK MARKET MADE BY TIGERSOFT'S PEERLESS STOCK MARKET TIMING by William Schmidt, Ph.D. 
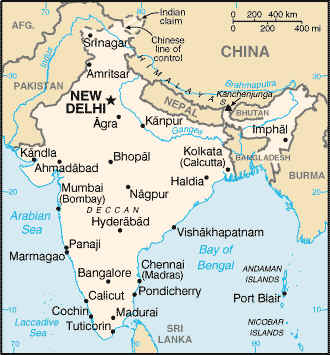
 Mumbai (Bombay) Stock Exchange Mumbai harbor  
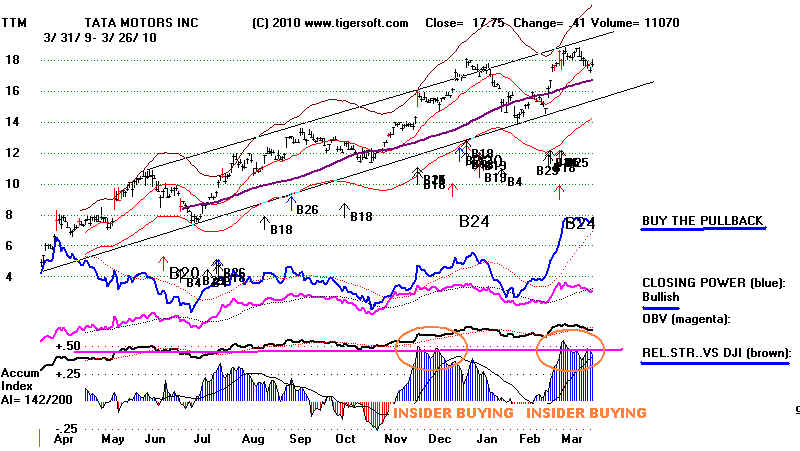
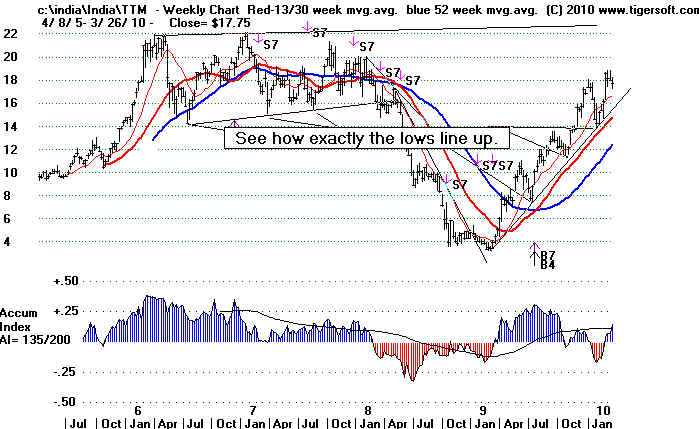
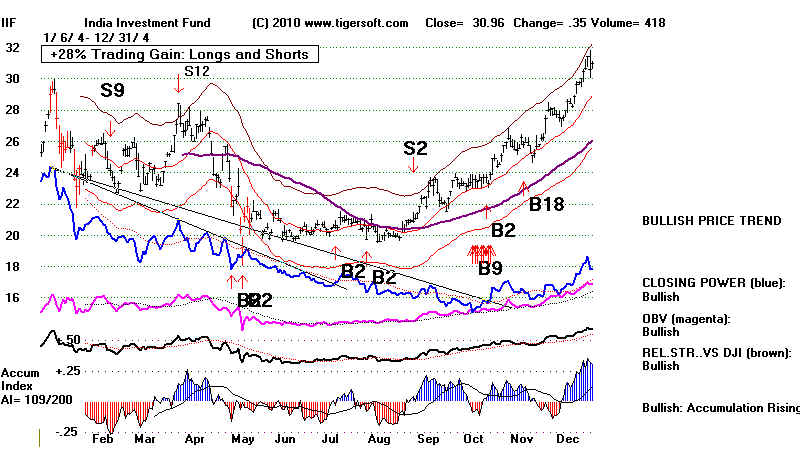
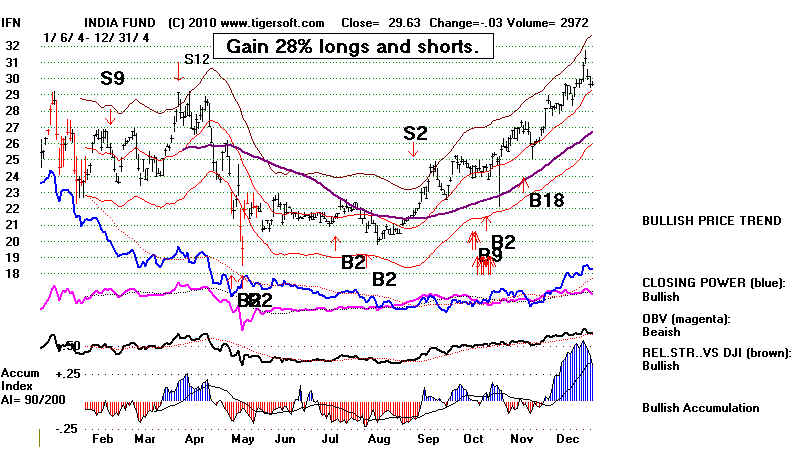
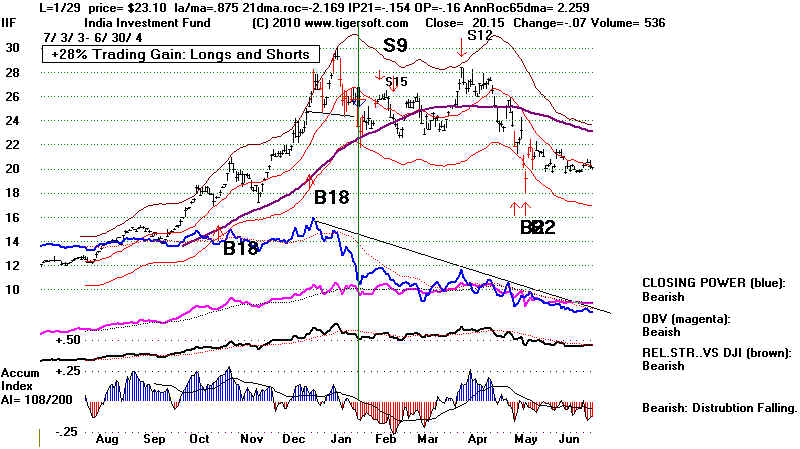
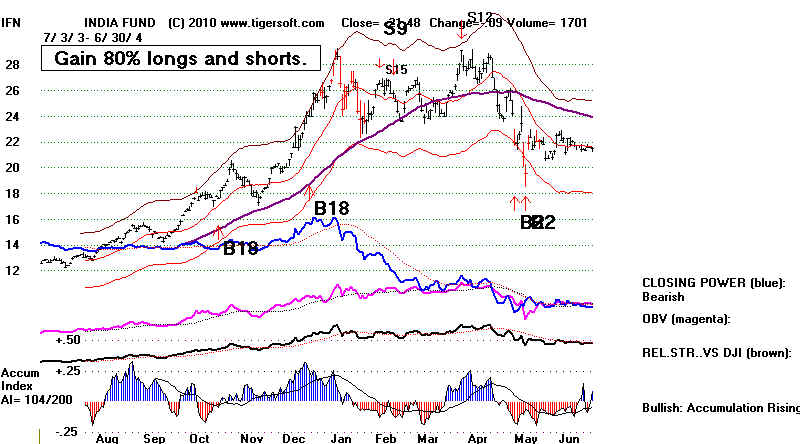
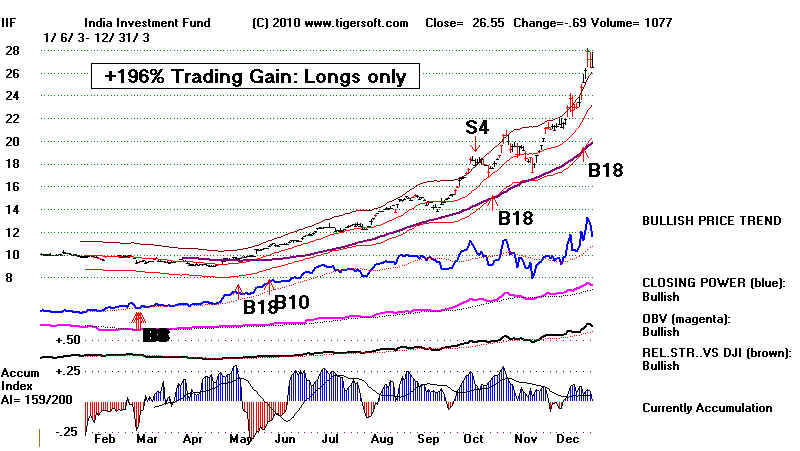
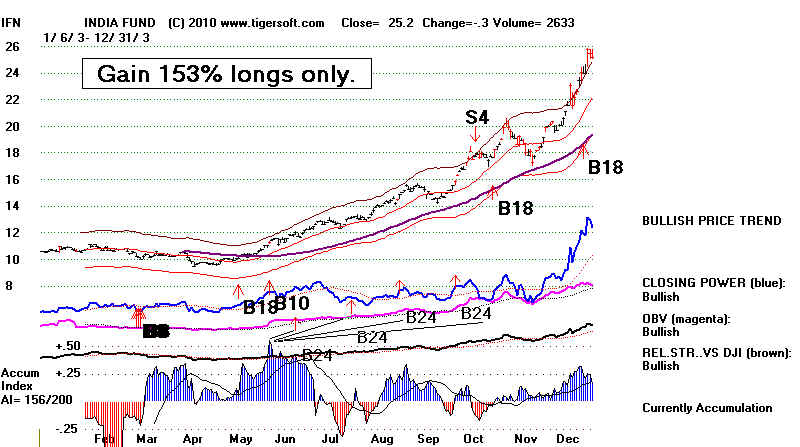
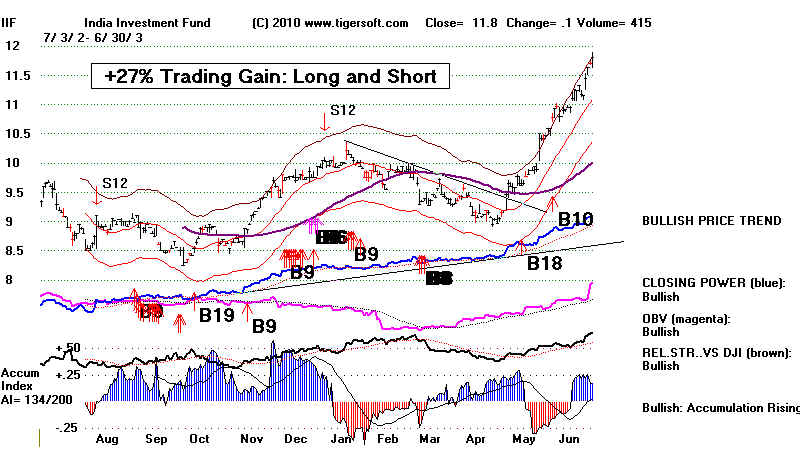
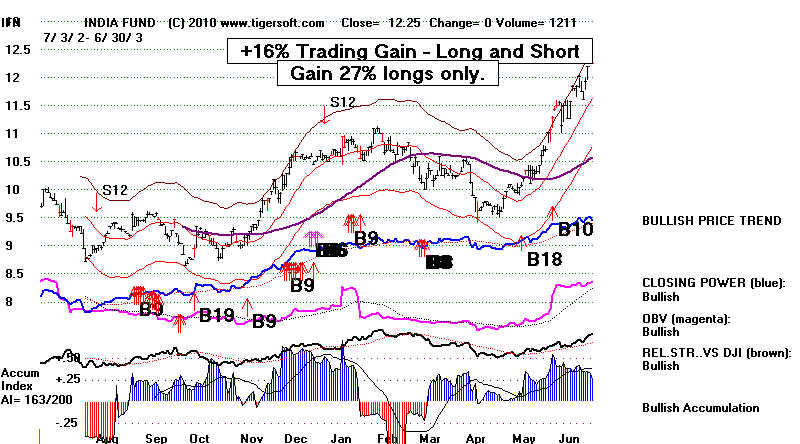
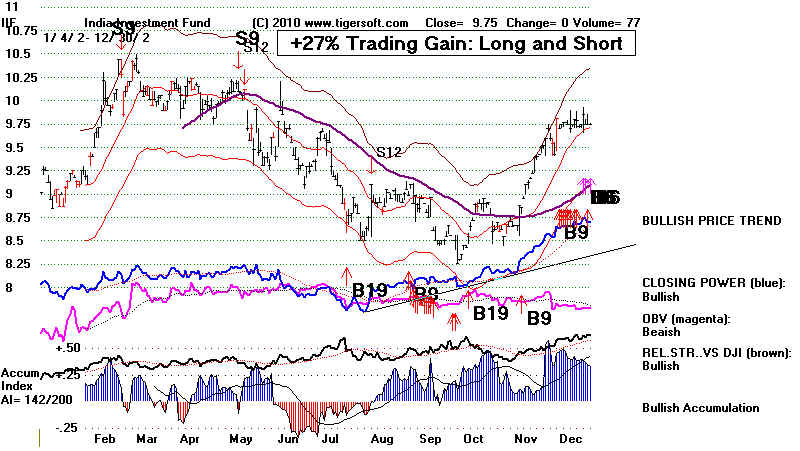
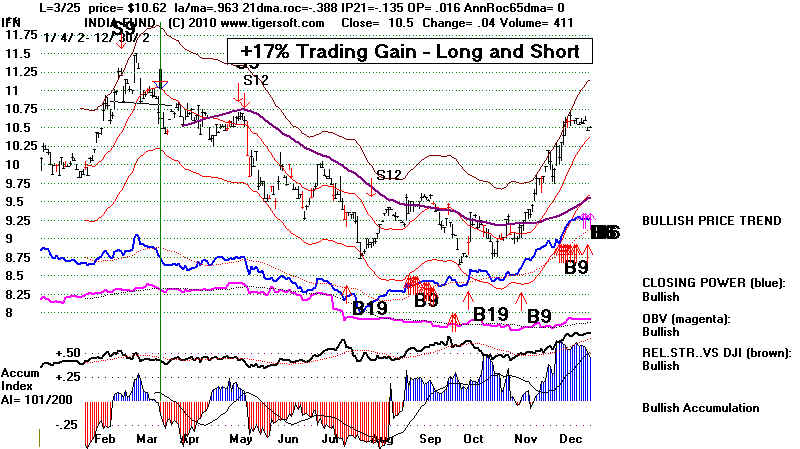
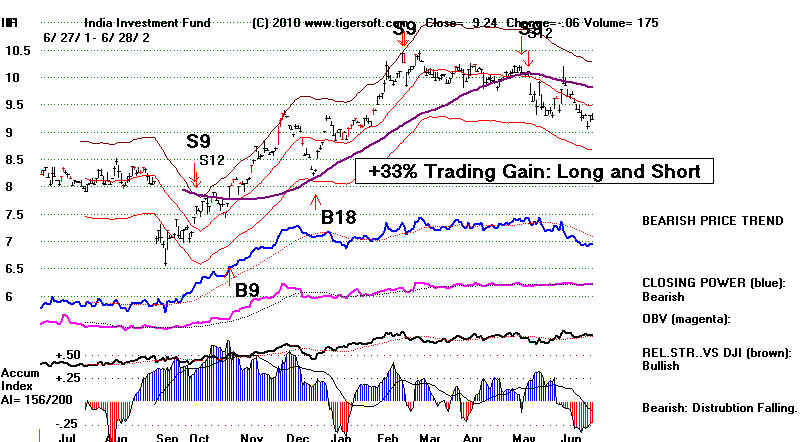
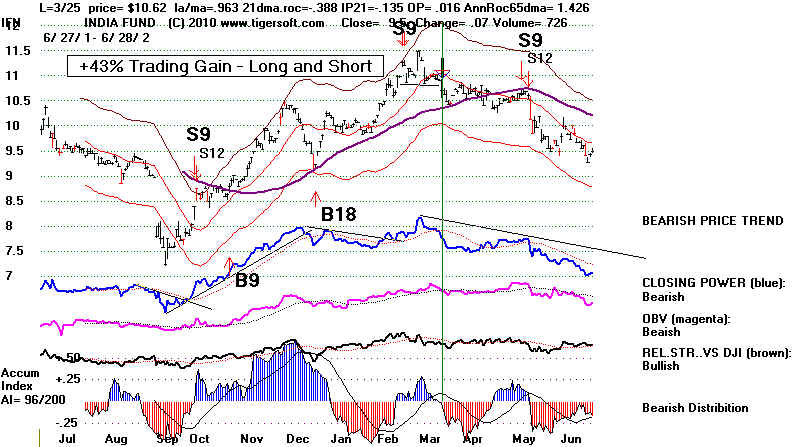
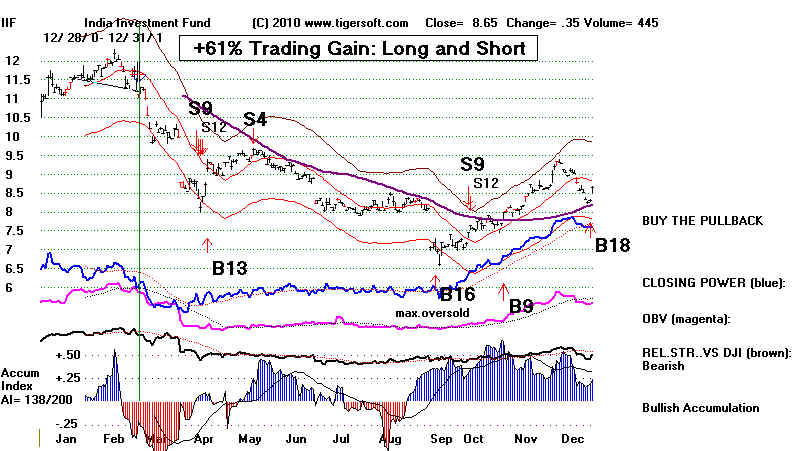
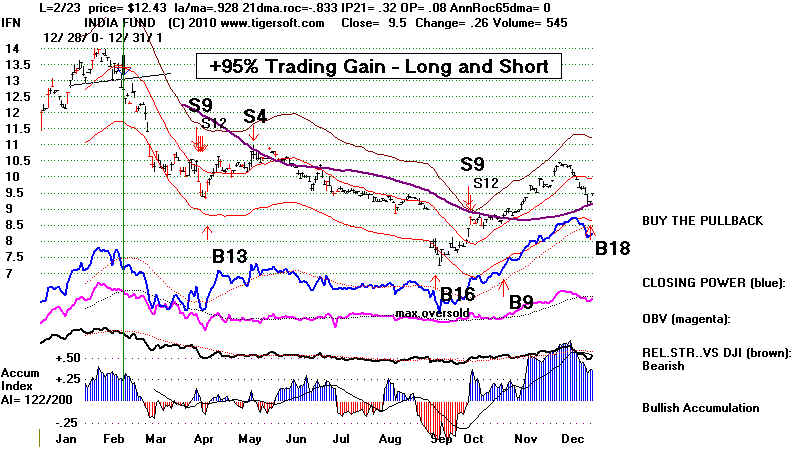
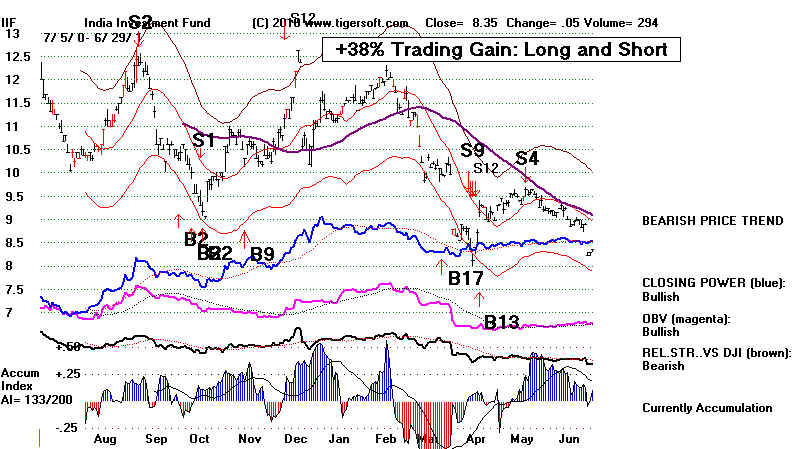
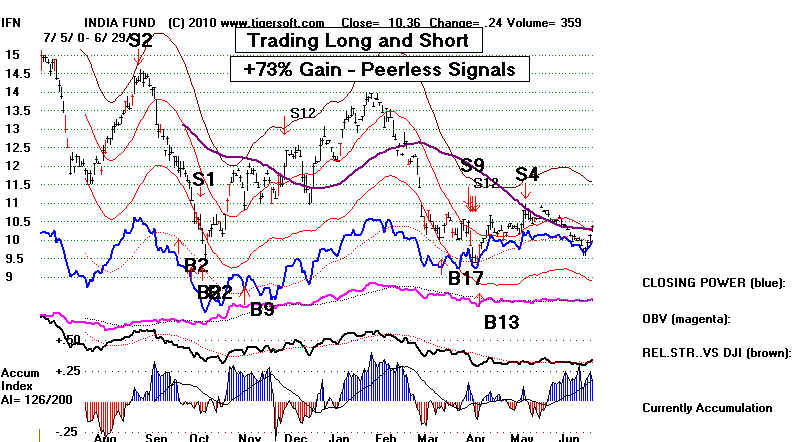
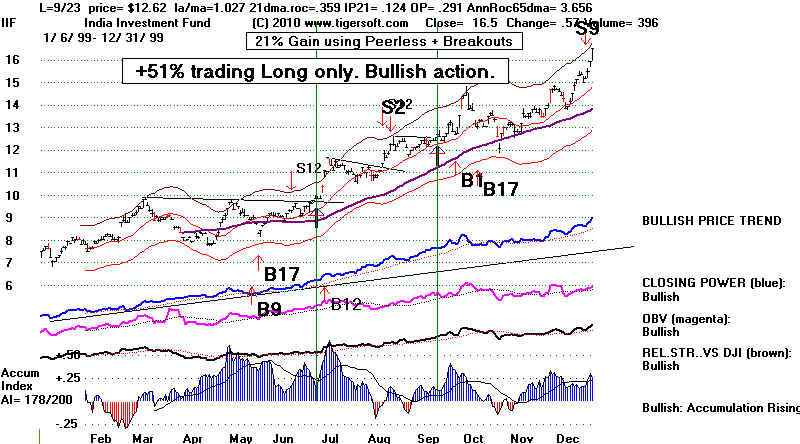
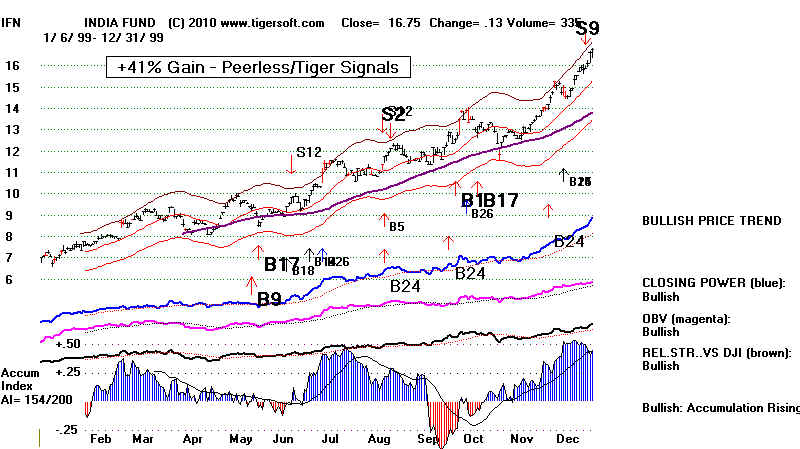
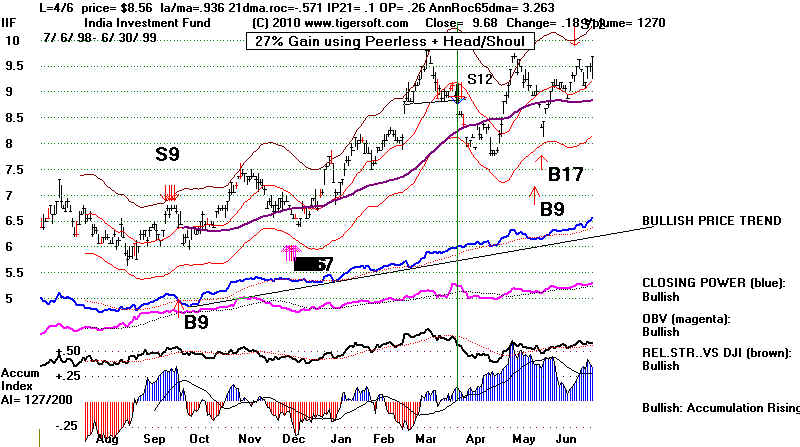
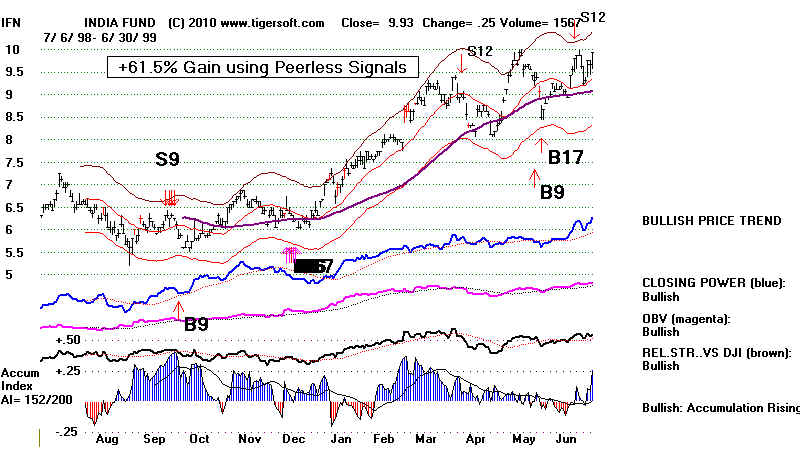
The Indian stock market can be easily traded in the US with two closed end ETFs (exchange traded funds), IIF and IFN. IIF - Traded on the NYSE Morgan Stanley India Investment Fund 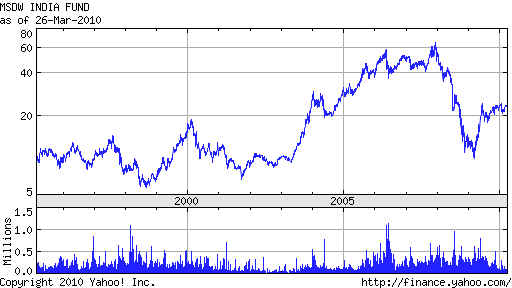 Morgan Stanley India Investment Fund, Inc. is a close ended equity mutual fund launched and managed by Morgan Stanley Investment Management Inc. The fund invests in the public equity markets of India. It invests in stocks of companies operating across diversified sectors. IFN - India Fund - Traded on the NYSE India Fund, Inc. is a close ended equity mutual fund launched by The Blackstone Group. It is managed by Blackstone Asia Advisors L.L.C. The fund invests in public equity markets of India. It seeks to invest in stocks of small-cap, mid-cap and large-cap companies. 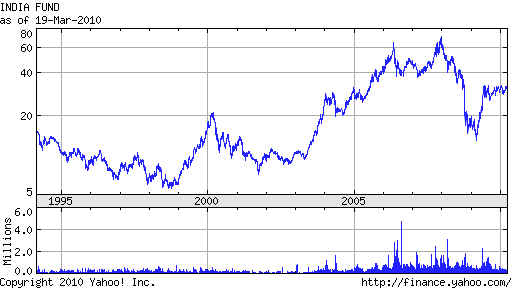 TigerSoft Lets YOU Make Very Big Profits in India's Stock Market. TigerSoft recommends superimposing on the charts of IIF and IFN the DJI-based BUY and SELL signals of the DJIA created by its Peerless Stock Market Timing with both Indian funds. In fact, they have been profitable every year. The success of applying Peerless to foreign ETFs, most sector funds, mutual funds and stocks becomes very apparent with each historical study we or a client does. Its success surely deserves more public attention. Wall Street insiders have been using the concepts of Peerless for years. Peerless works so well because on Indian markets 10000 miles from New York because of how interlinked and interdependent are all the world's economies. India's stock market is thinner and more volatile. For good or ill, when Wall Street catches a cold, India's stock market suffer pneumonia. Peerless lets you tame this market volatility quite easily and automatically. Peerless is our general market timing system. Its real time record since 1981 is unequalled. Now it has been back-tested to 1915. Year IIF IFN 1998-1999 +27% +62% 1999 +51% +41% 1999-2000 +23% +40% 2000 +41% +45% 2000-2001 +38% +73% 2001 +61% +95% 2001-2002 +33% +43% 2002 +27% +17% 2002-2003 +27% +16% 2003 +196% +153% 2003-2004 +28% +80% 2004 +28% +28% 2004-2005 +68% +52% 2005 +28% +52% 2005-2006 +66% +109% 2006 +120% +170% 2006-2007 +34% +38% 2007 +67% +59% 2007-2008| +146% +98% 2008 +224% +124% 2008-2009 +397% +334% 2009 +113% +150% 2009-2010 +63% +89% The Profits from trading Peerless on these Indian ETFs have been increasing over the last three years. This may reflect the increased general market volatility. It may underscore the increased interdependence of the world's economy. And it may suggest that Indian markets are now being rigged by the biggest Wall Street banks and traders as much as the US market is. Here we see the trading results of simply superimposing the Peerless signals on IIF and IFN. TigerSoft programs readily calculate the gains and losses if one were to assume that a traders starts with $10000 and invests fully with each trade whatever sums available in his/her account. Each trade, it is further assumed, costs $40 and the trade is taken - realistically - at the next day's opening price. In a few cases, we have added signals for obviously bearish head and shoulders patterns and flat topped breakouts. The bottom of the chart shows the key TigerSoft indicators. Where they are very strong, one would probably just want to trade on the long side. This is noted in the charts. The charts need 3 months' of data before the signals can be posted. For this reason we show two charts per year. It should be added that TigerSoft also lets you rank, flag and chart individual Indian stocks, if you have the data. Our software's ascii file structure may receive ascii data in other formats using a program we offer. Here is a promising Indian ADR that show high levels of insider buying. This is indicated to us by virtue of the Accumulation Index surpassing a key threshold in the software. Major Buy signals would confirm these bulges of Accumulation. See www.tigersoft.com for a fuller discussion of how we find and measure insider buying, not just by corporate insiders but their Wall Street associates. It would be surprising, given Wall Street behavior generally, for the large purchases by the closed end funds not be front-run by Wall Street insiders. Too harsh? There seems little evidence that Wall Street can or should be trusted. You will be better served to use the extensively back-tested Tiger and Peerless methodologies.
|
|||||||||||||||||||||||||
| |