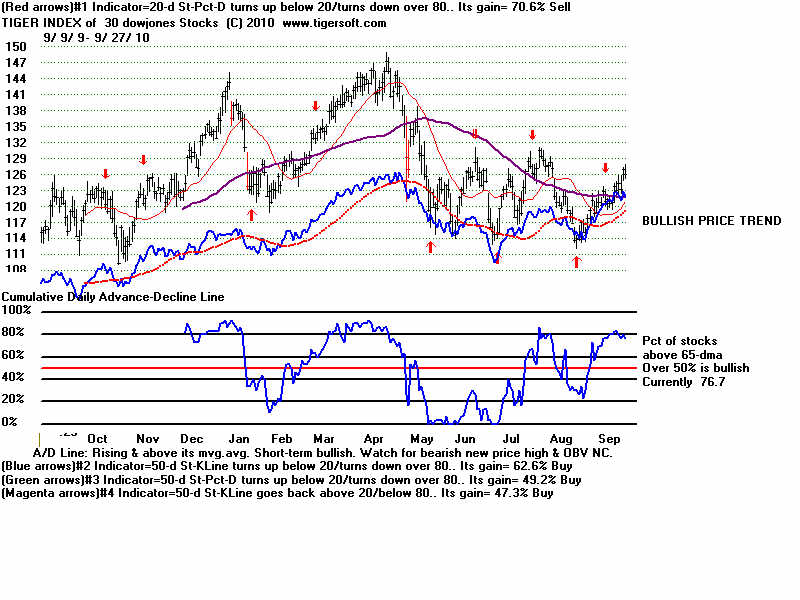
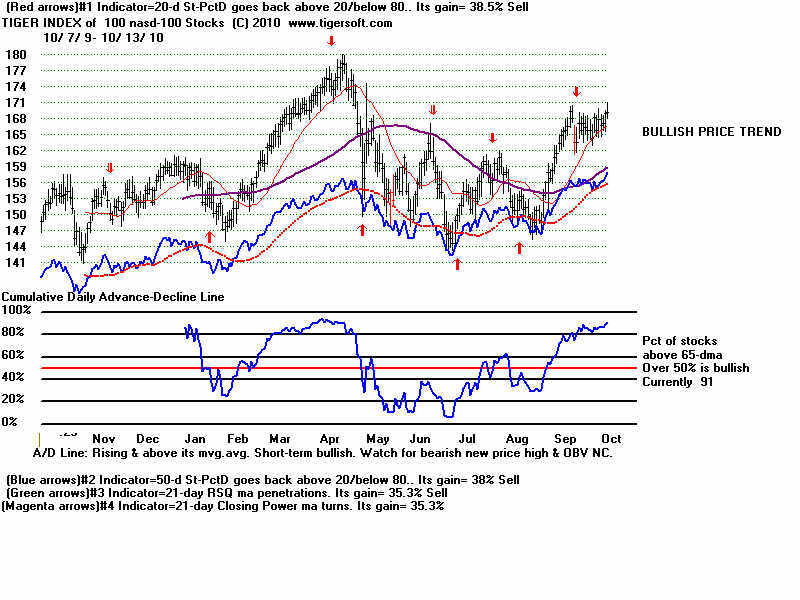
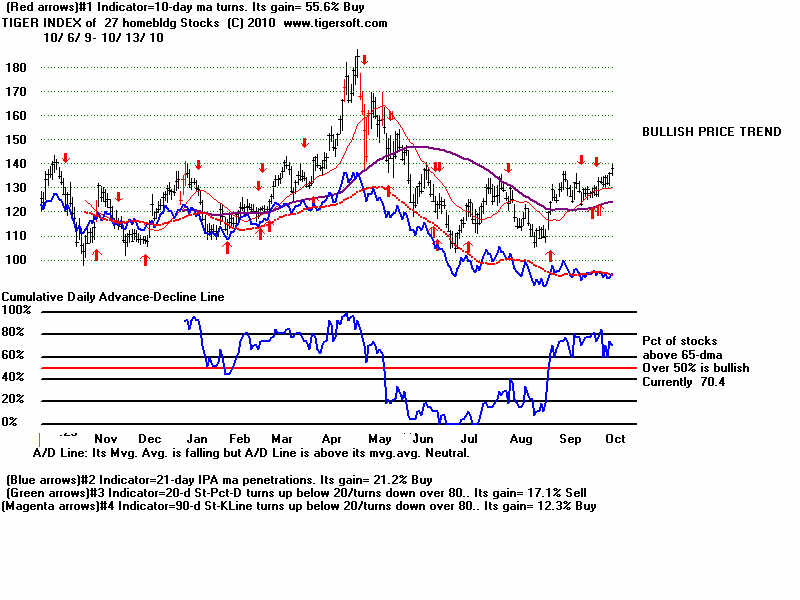
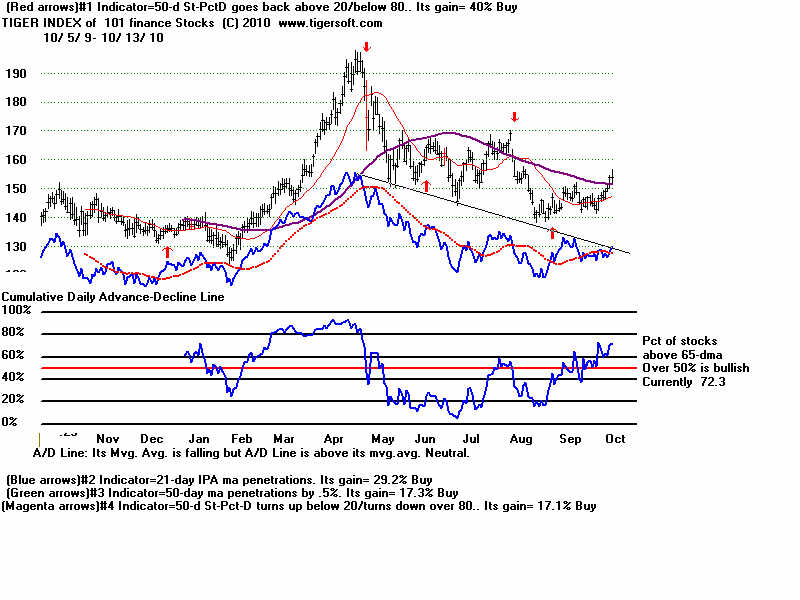
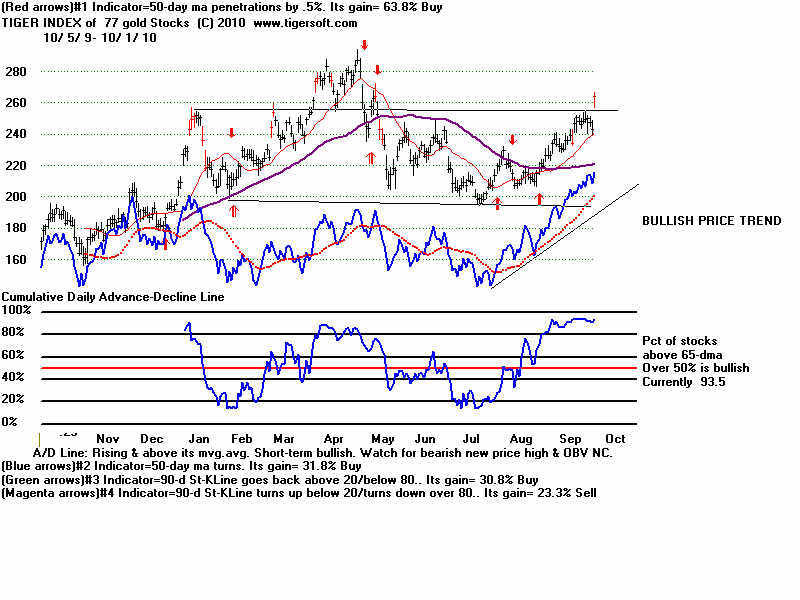
10/13/2010 PEERLESS REMAINS ON A BUY.
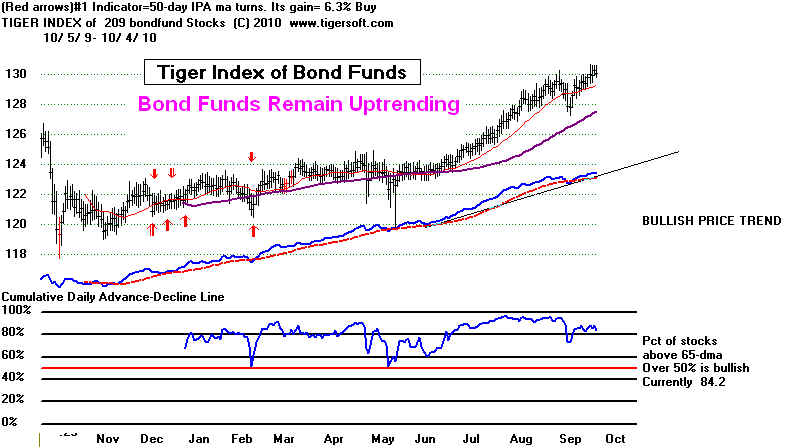
Stick with the uptrend. It is supported
by rising CLosing Powers for the major market
ETFs, A/D Lines and Peerless.
Look at how strong foreign ETFs are. This
is a direct result of the falling Dollar
and the Fed's low interest rate policies.
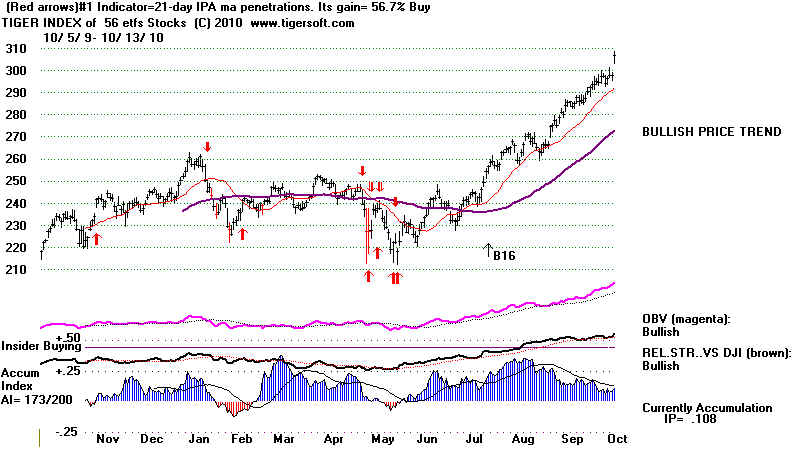
Foreign ETFs with high current Accumulation
levels (IP21) above .41 comprise 4 of the
top 6 ETFs. They are EWO, INP. PGJ and
CEE. High IP21 is one of the most important
factors to use in screening stocks to buy.
Foreign ETFs keep running to new highs.
Bernanke's weak Low Interest Rate/
Weak Dollar policies are clearly causing a lot
of big money to leave the US or go into
precious metals' stocks. These factors do
not help reduce unemployment in the US.
To do that the FED will need to make the Dollar
fall much further, so that American
exports become competitive. It is this
prospect plus the normal "Performance" rush into a
new hyperbolic speculative sector that makes
gold and silver still look very bullish.
Once this genie is out of the bottle, it cannot
be quickly or easily stopped.
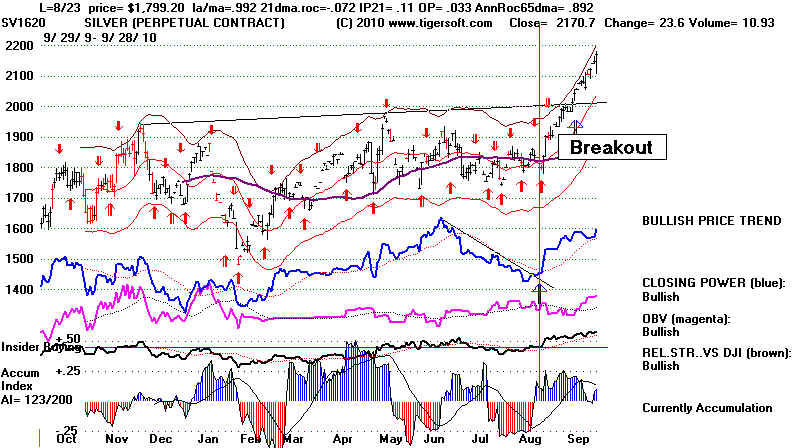
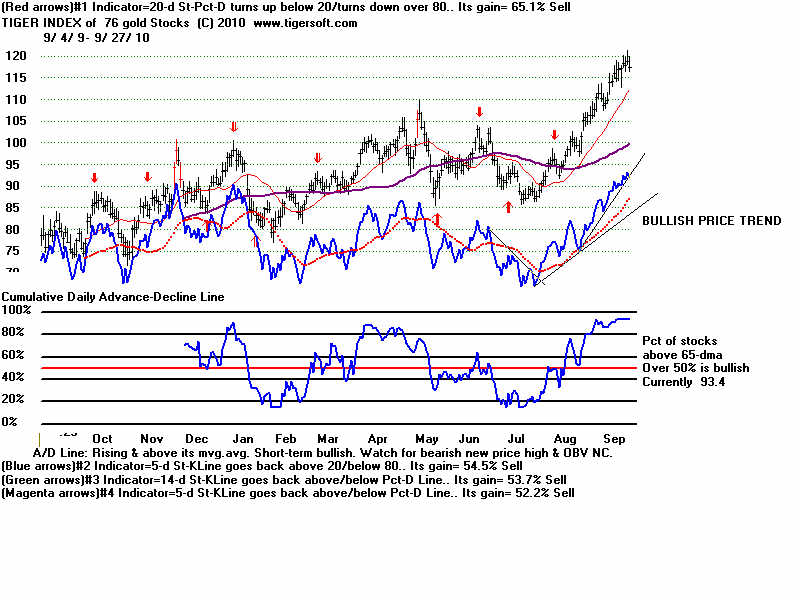
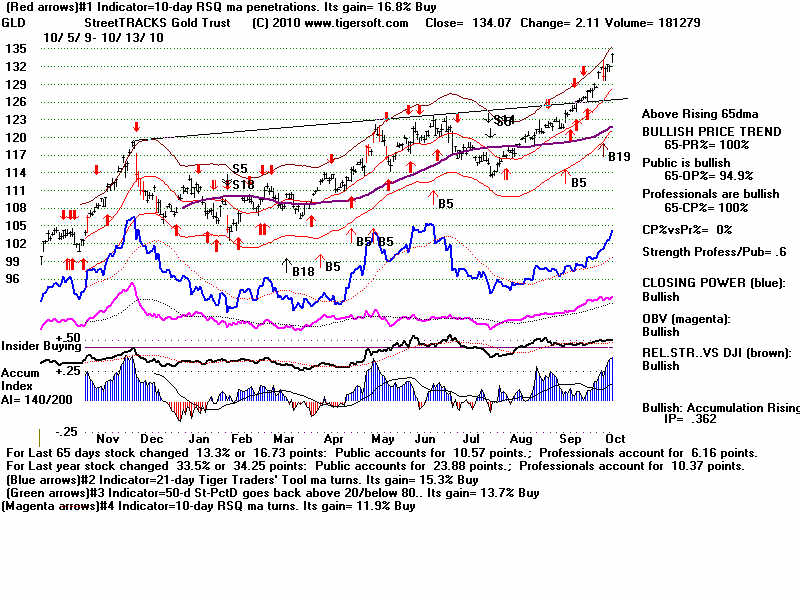
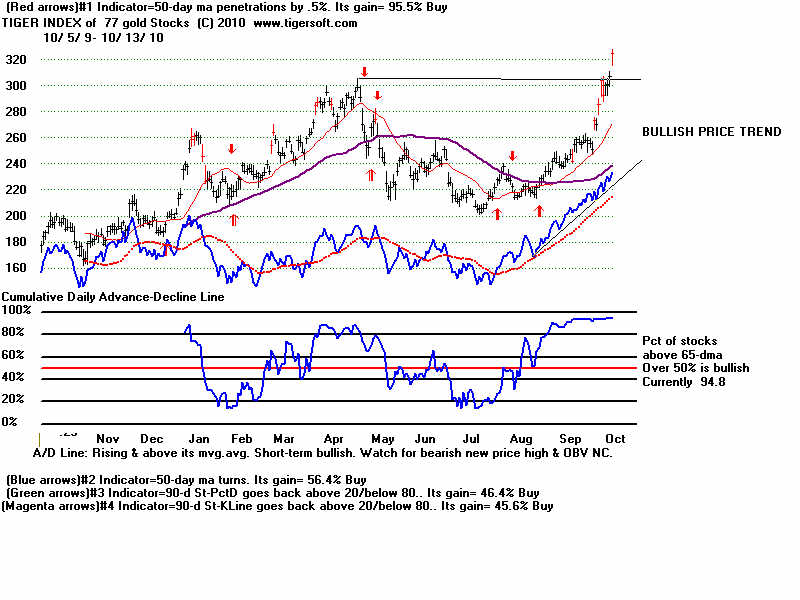
Our General Gold/Silver made a new high
breakout today on confirming red high
volume. I expect higher prices, but buy
selectively, using the screens below.
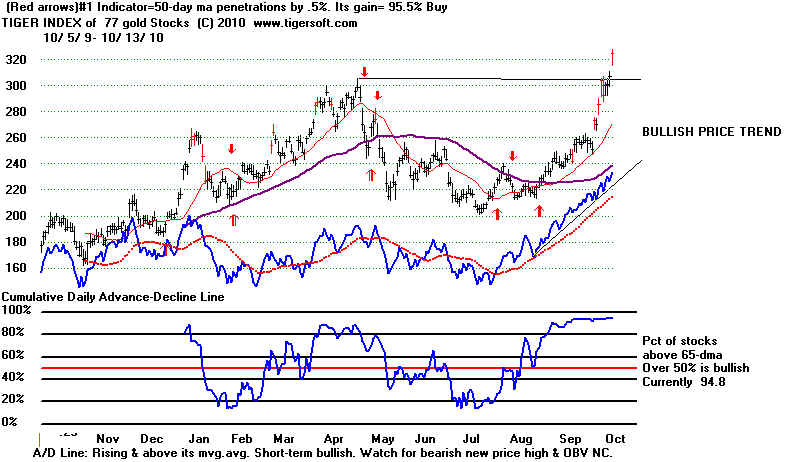
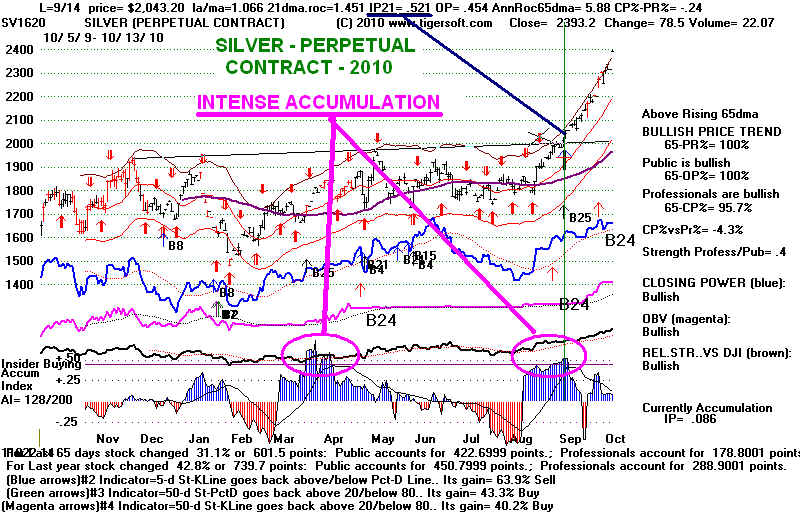
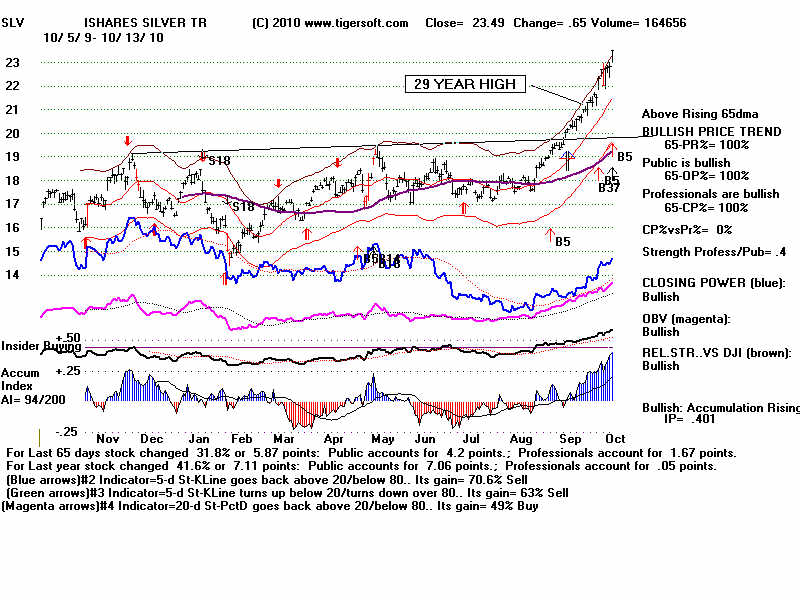
Gold/Silver stocks
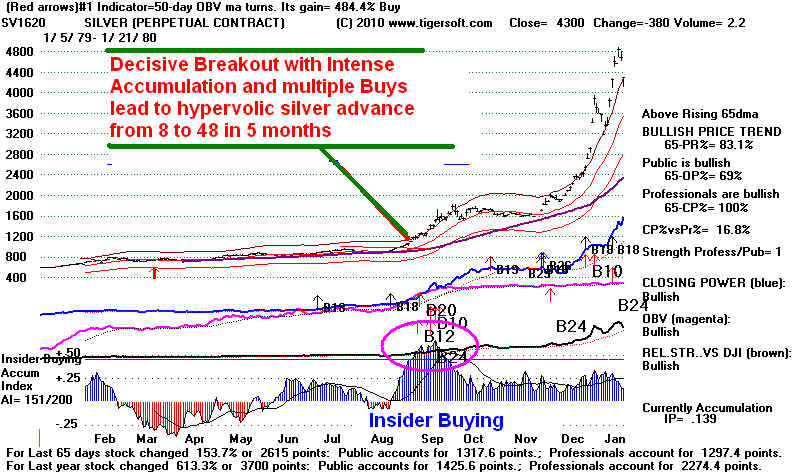
were the day's biggest gainers. Silver's breakout above
21 to a 29 year high was accompanied by high
Accumulation. The Accumulation Index
was not quite as high as in the second half of
1979 as silver began its dramatic 6 month rise
from 8 to 48, but it did reach the +.46 levels
I have set out as a sign of "insider buying".
Further nelow are the perpetual contracts for
Silver 1979-1980, Silver 2010 and Gold 2010.
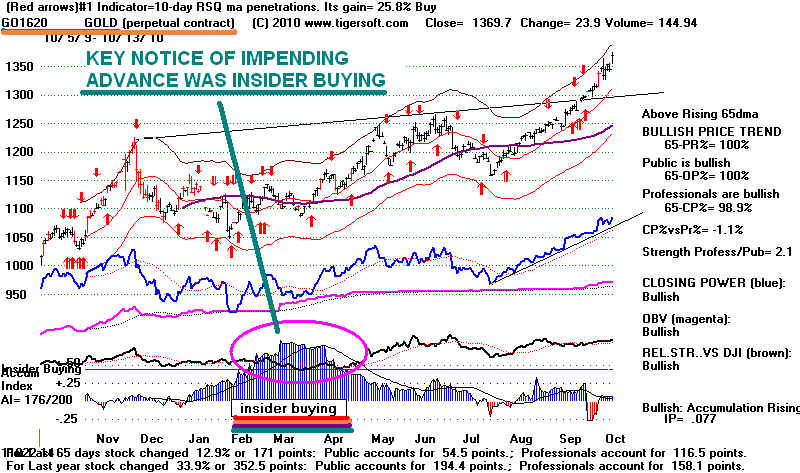
Note the huge bulge of Accumulation in the
perpetual contract of Gold at its bottom in 2010.
In both the SIlver cases it was the huge
vertical bulge of Accumulation that was the key to
spoting the start of the moves in 1979 and
2010. A long period of high (blue) Accumulation
was not present in 1979 or 2010. Gold's
Perpetual Commodity contract showed showed a
huge bulge of Accumulation right at the bottom.
The AI/200 level back in February and
March 2010 were not particularly noteworthy.
What
Gold Stocks to Buy
If we accept the premise that Gold and Silver
are in a major bull market that may last
another three or four months, at a minimum and
that is what the lesson of Silver in
1979-1980 suggests is a reasonable assumption,
then the Silver and Gold charts below
would also suggest that very high levels of
Accumulation are good ways of picking
the best Gold and Silver stocks.
TigerSoft gives us a nummber of ways of ranking
a universe of stocks like we see
in our current download of 71 gold and silver
stocks, ETFs and perpetual contracts.
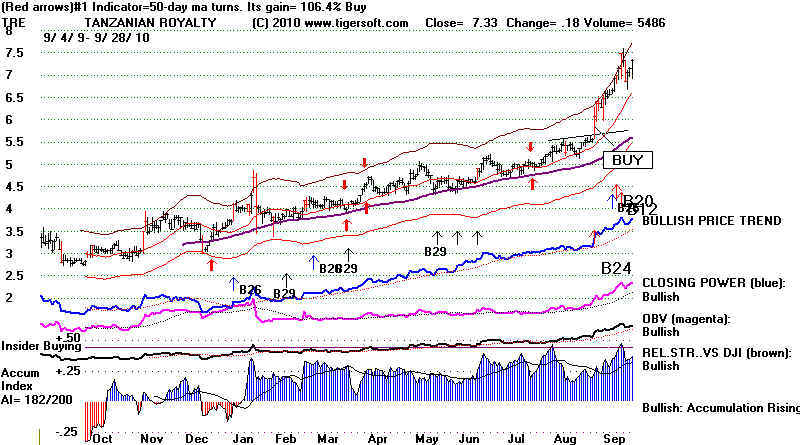
Using simply the Tiger's "Most
Bullish" Power Ranking, we would select TRE, CUM-T,
GORO and Gold (GLD).
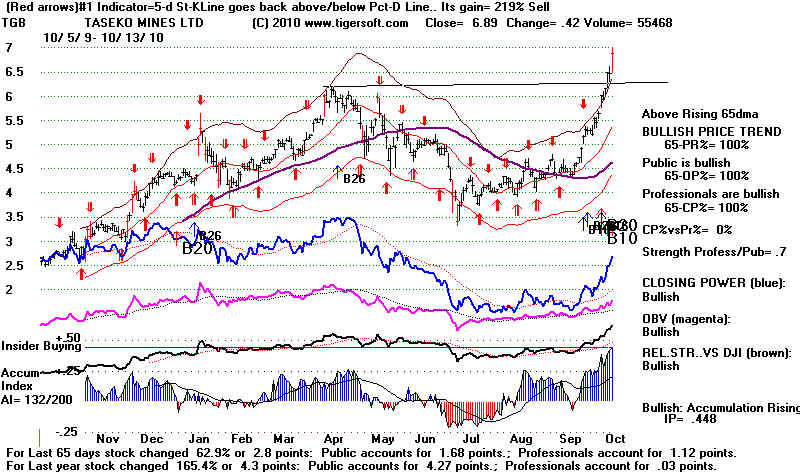
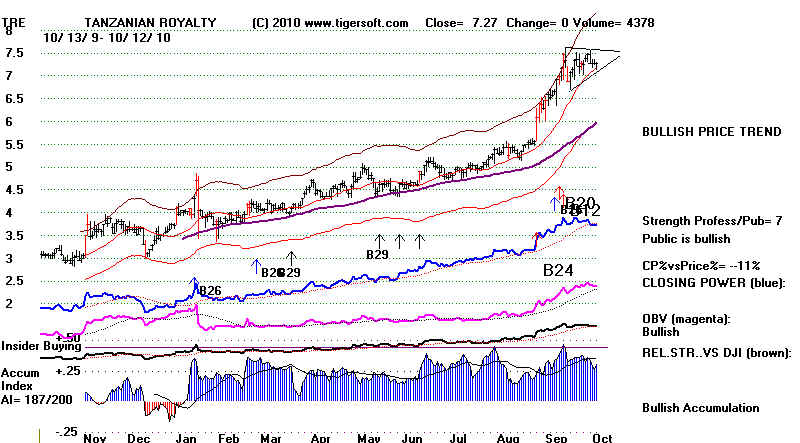
The detailed survey below concludes that we
should also buy TGB. Below is the chart of
TGB. We especially like fresh new highs
on red high volume which show current
Accumulation Index readings above +.40.
Interestingly, TGB does not show up among the
top "Bullish" stocks because its
AI/200 score is only 132. I would discount completely
the red optimized Stochastic Sell because of
the breakout and very high Accumulation.
Professionals have not been buyers, judging
from how the blue CLosing Power
has lagged, but they are clearly getting aboard
now.
Rankings
Using TigerSoft Screens:
The simplest scan is the price change ranking since
the current rally began, from the
end of August. This uses the
"first-out-of-the-gate principle. Some have compared
Gold and SIlver's rise with the launching of
the big bull market in August 1982.
If true, this principle should work well again.
1. Gold/Silver
Vehicles: Ranked by Pct.Gain over the Last 30 trading days
Green
shows stocks with a current Accum. level above .23.
Only
those that meet this criteria in the top 5 are shown as RED.
In
this case, PINK means very bullish. RVMIF is eliminated if
we
add the requirement that the CP% be above 90% (Closing Power
more
than 90% of the way from its 65 day low to its high.)
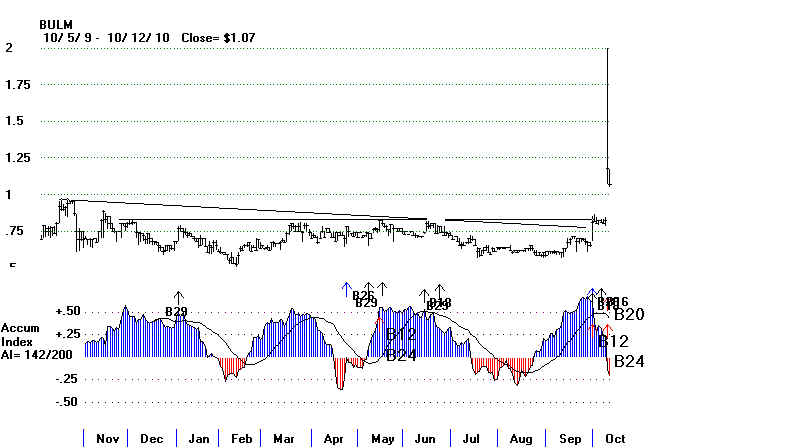
Close
Pct Gain AI/200 IP21 65-Day CP% 12-momth high Closing
BULM 1.19
105%
141
-.17 100%
Yes
RVMIF .493
72%
106
.26 88.2%
No
This
also shows a bullish rank divergence -
Its
OBV% and IPA$ rankings are higher
than
its Pr% ranking over the last 21 days.
AZC 4.09
69%
114
.15
97.3%
Yes
CUM-T
4.8 69%
192
.07
98.5%
Yes
GORO
24.4 64%
174
.22
82.8%
YES
GRZ
1.49
63%
103
.19 24.8%
No
ANO 1.4
61%
134
.25 73.6%
No
AXU 6.56
61%
134
.25 100%
Yes
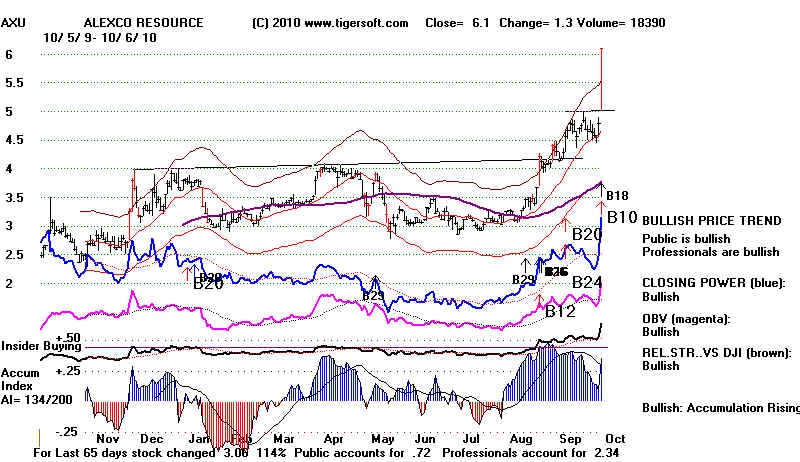
Note
high Accum bulge in Aug-Sept.
This
marks it as a special stock.
BAA 2.99
59%
75
.04 20.2%
No
TGB 6.89
56%
132 .45
100%
Yes
Note curent high Accum bulge.
This
marks it as a special stock.
2. Gold/Silver Vehicles: Ranked by Accumulation
Index (200 days)
The very highest AI/200 stocks have lots of big buyers
underneath current
prices
and are on the BUY lists of big Funds. If we use an AI/200 score of 140 or
above
to show this, we see that 3 of the 5 best performing Gold and Silver
stocks
since August 30th showed an AI/200 score of 140 or above:
Close
Pct Gain AI/200 IP21 65-Day CP% 12-momth high Closing
===>
BULM 1.19
105% 141 -.17 100%
Yes
RVMIF .493
72%
106
.26 88.2%
No
This
also shows a bullish rank divergence -
Its
OBV% and IPA$ rankings are higher
than
its Pr% ranking over the last 21 days.
AZC 4.09
69%
114
.15
97.3%
Yes
===>
CUM-T 4.8
69%
192
.07
98.5%
Yes
===>
GORO 24.4 64%
174
.22
82.8%
YES
Green shows stocks with highest Accum. Index scores.
Only
those that meet this criteria in the top 5 are shown as RED.
In
this case, PINK means very bullish.
Close
AI/200 IP21
CUM-T 4.8
192
.07 We found out about this only recently.
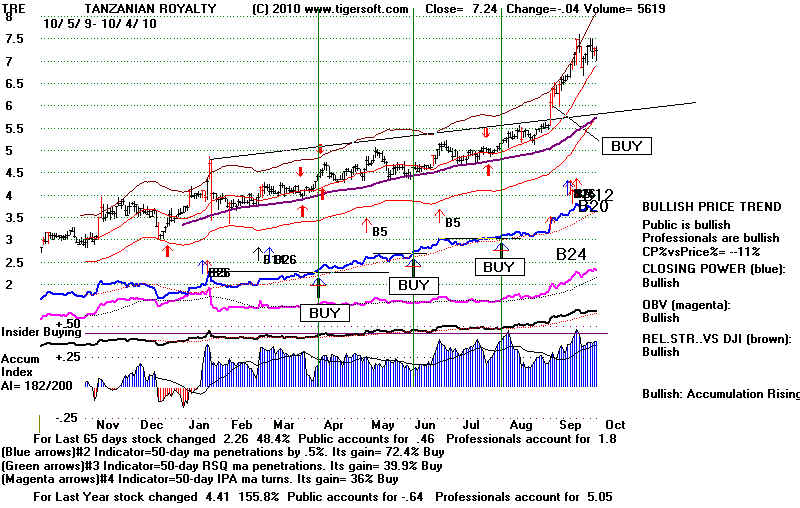
TRE
7.39
188 .34 We have recommended this since it was 5.
GO1620
1369.7 176 .08 Perpetual Conract for
Gold...We have recommended GLD
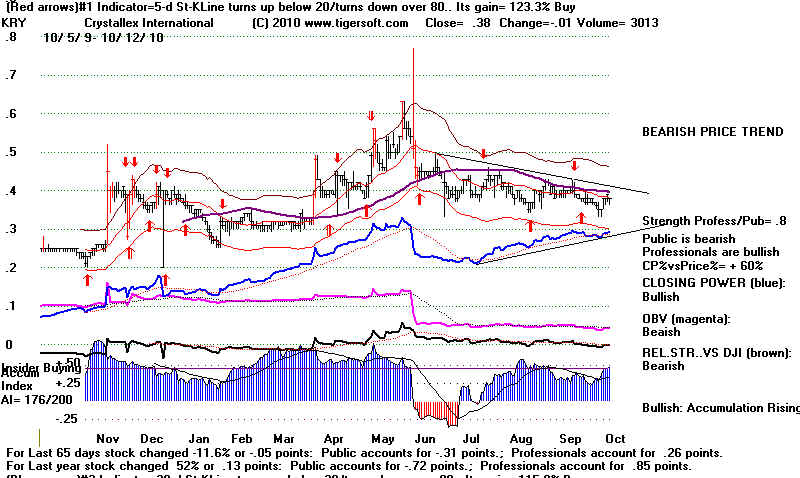
KRY
.38
176 .08 Too
low priced.
GORO
24.4 176
.22 This looks very good.
MMG
.623
172 .17
CQP
20.5
159 .20
PAL 4.64
150 .24
AU
48.12
146 .23
MVG
8.15
142 .19
3. Gold/Silver Vehicles: Ranked by Highest
Current Accumulation (IP21)
Green shows stocks with highest Accum. Index scores.
Only
those that in the top 5 that are at 12 month highs and
show
a 65-Day Closing Power Pct above 85% are shown
in
PINK, which means very bullish.
Close
AI/200 IP21 65-Day CP%
12-momth high
TGB 6.69 132
.45
100%
Yes
KRY
.38 176
.44
94%
No
SLV 23.45 94
.40
100%
Yes
GLD 134.07 140
.36
100%
Yes
TRE
7.39 188
.34
73.5%
7.6 would be a breakout.
ANO
1.49 110 .33
73.6%
No
BVN
50.88 91 .33
100%
Yes
Looks good!
HL
6.93 90
.26
97.1%
No
Bulges
of Accumulation at Important Launching Points
for
Big Advances by Silver and Gold
Silver 1979-1980
 |
Silver 2010
 |
Gold 2010
 |
====================================================================================
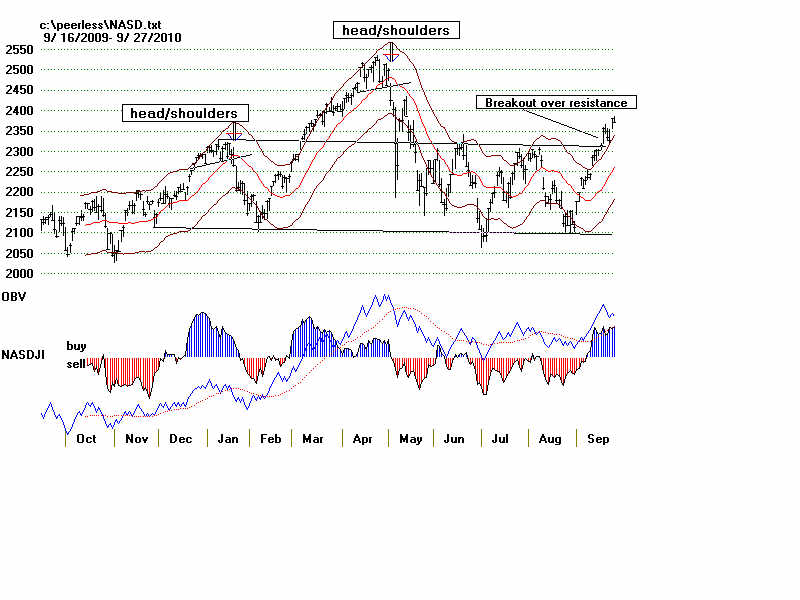
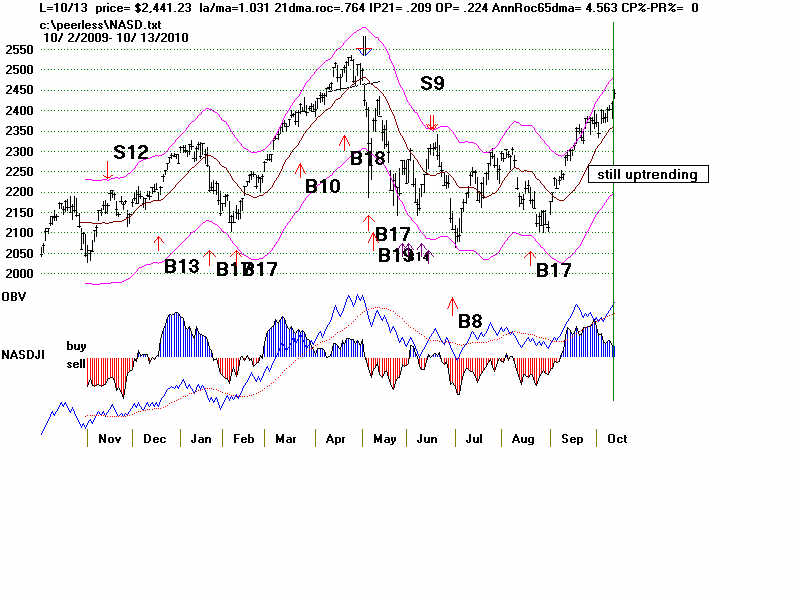
10/12/2010 PEERLESS REMAINS ON A BUY.
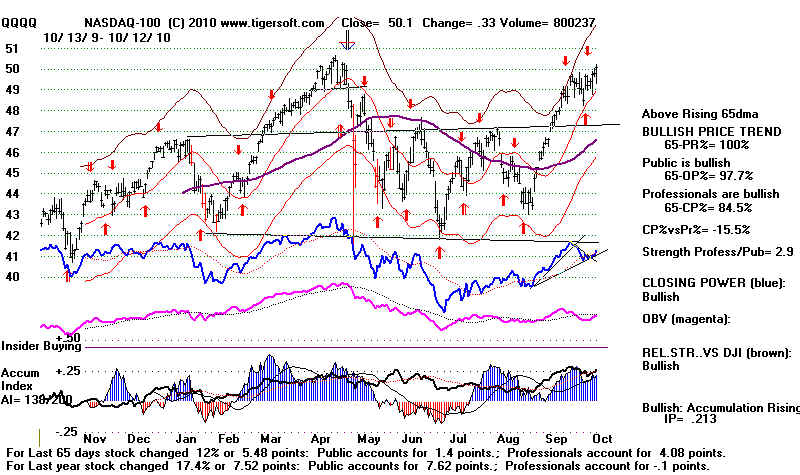
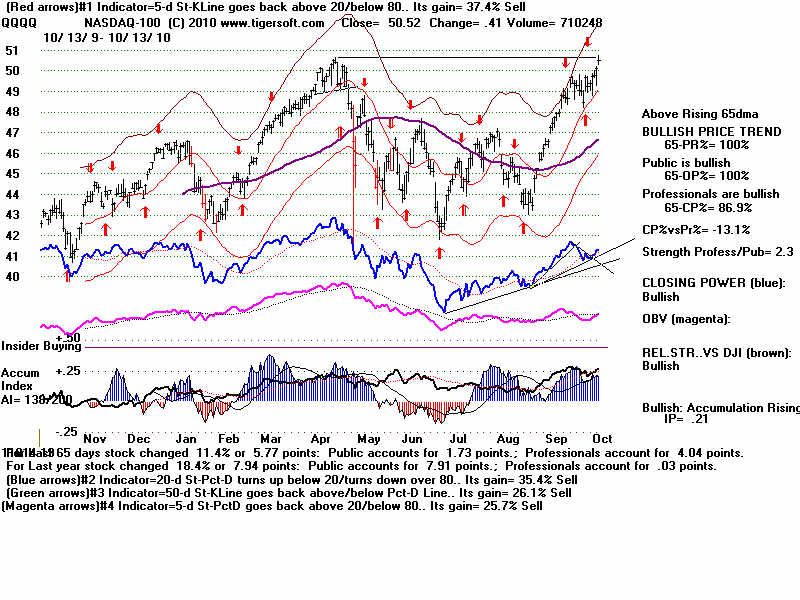
The NASDAQ jumped nicely up today. The ratio of
new highs to new lows
on the NYSE was 99 to 1. The
NASDAQ's is still a bullish 72 to 16. Having a good
number of new highs means that breakouts are
extending their gains. This
keeps the momentum players busy with the long side.
I certainly do not want
them to capture the downside as they did in 2008.
The CLosing Power's trend
for the QQQQ reflects much of their sentiment.
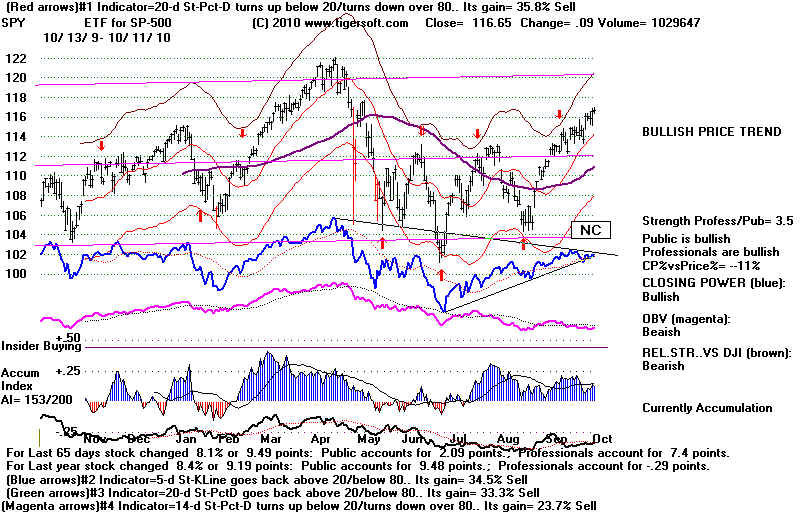
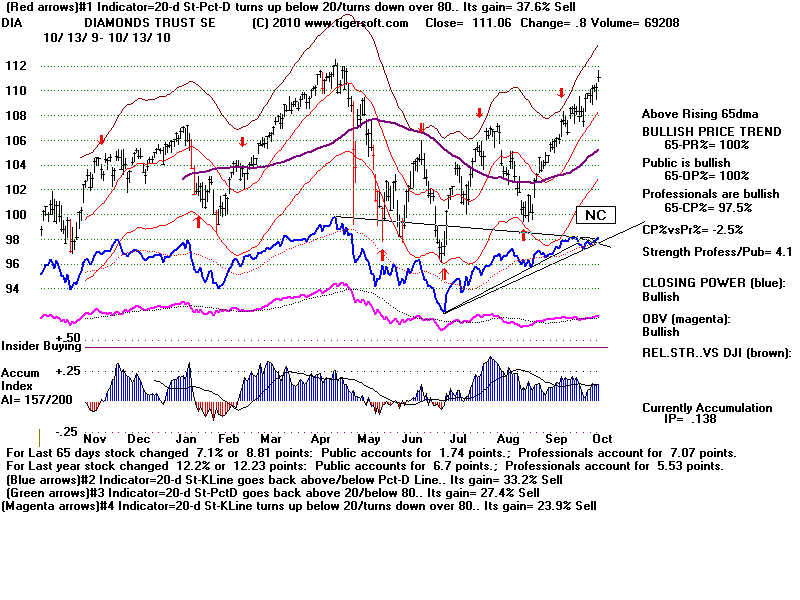
In the chart below, you can
see that the blue Closing Power has not confirmed the
recovery high. The statistics
on the right show that while prices are making a
65-day high, the 65day CP% is
only 84.5%. CP is only 84.5% of the way up from
its 65-day low to its high. This
yields a CP%vs Pr% bearish divergence of 15.5%.
A trend-break in the rising
CP is more reliably bearish after a such a divergence
or non-confirmation.
The good news is that both the Public and
Professionals are pushing prices
higher. This often yields very good returns
until the Professionals change their
minds and shift to net selling.
True, the DJI is losing momentum. But this is
not enough to get me to predict a 5% decline,
though, since all the Closing Powers are still
rising along with Openings.
The low interest rates that have fueled the September
rally may be in jeopardy.
A problem is developing with Bernanke's low interest
rates. The weak Dollar is
contributing, to a degree, to the sharp rise in food
commodities. Exports of
wheat and corn are made easier. Foes of
Bernanke's low interest rate policies
will use these numbers to show the costliness of
inflation. He will be hard pressed
to show that increased manufacturing exports
occasioned by the weak Dollar
have, so far, created enough new jobs to outweigh the
costs to consumers in
high food and fuel prices. Professionals may
see that the FED could become divided
if these price trends continue and gather steam,
especially if they start to make oil
prices rise as they did in th first half of 2008.
Bernanke's low interest rate policies
may lose critical support and he might even be
outvoted.
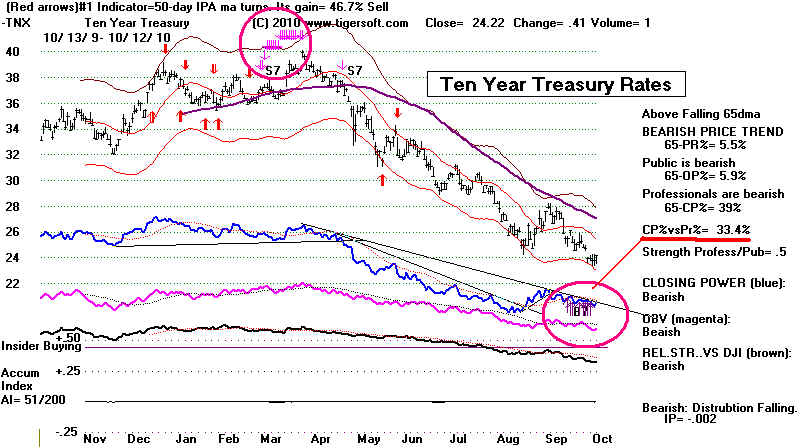
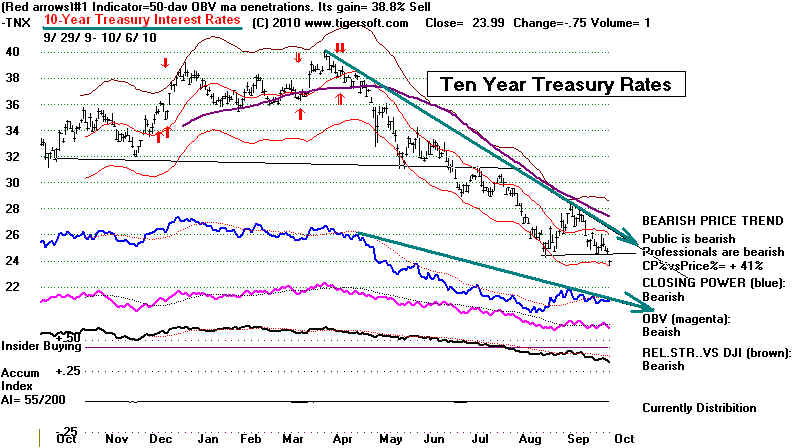
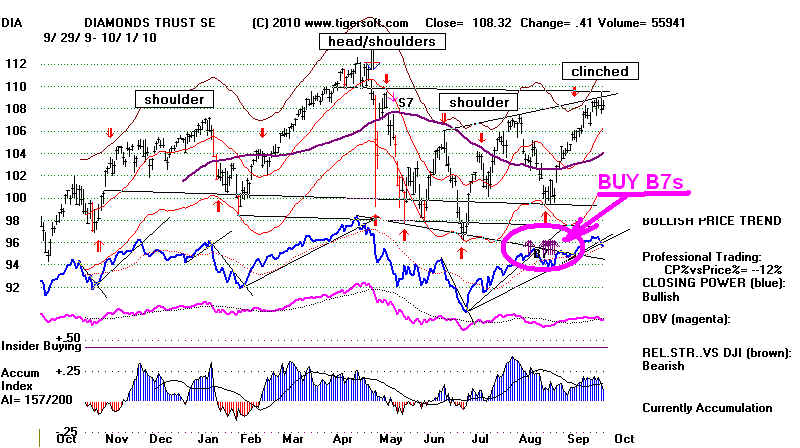
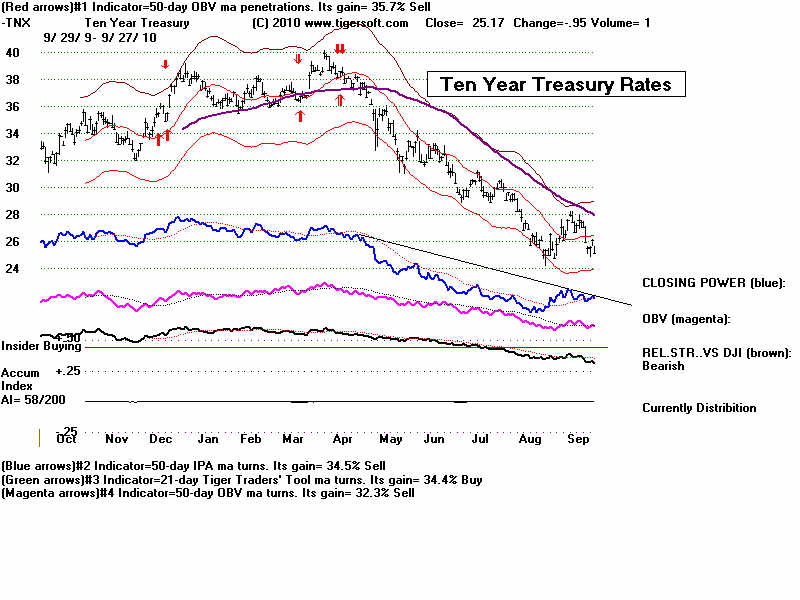
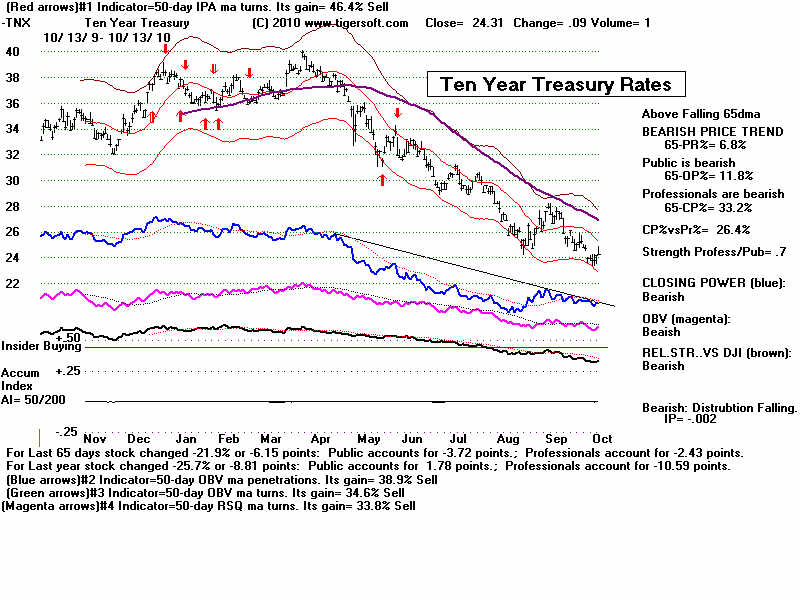
As a result, the Rates on the 10-Year Treasuries may
be bottoming. The Tiger CLosing
Power (CP) did not confirm the recent decline to new
lows. CP was enough off its 65-day
lows as Treasury interest rates made a new low to
bring a series of new Buy B7s. This
has not stopped the rises in
Gold and Silver. The highest Accumulation Gold and Silver
stocks
continue to advance or hold up best.
Look at the jump in low priced BULM
yesterday. Will KRY be next?
 |
 |
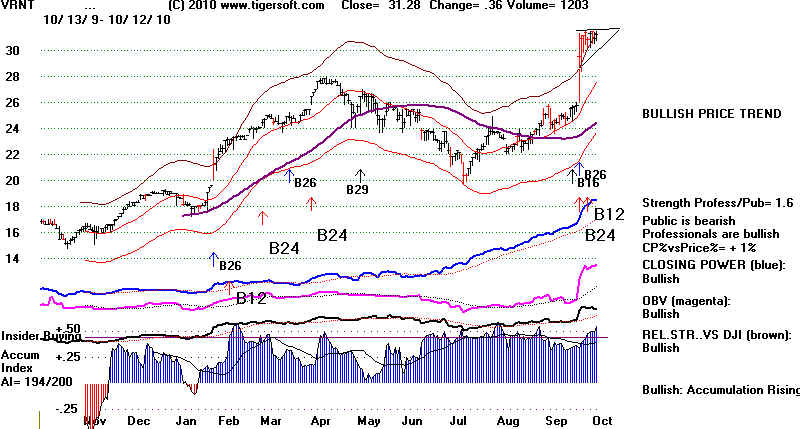
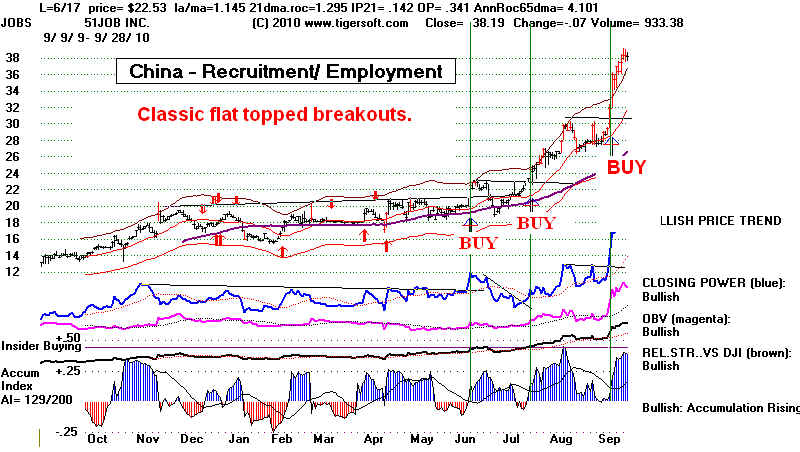
At this stage, short-term traders should get ready
for some blow-off upwards moves
in stocks that have flat topped hesitation patterns
following big run-ups if they
breakout above their flat tops. See the charts
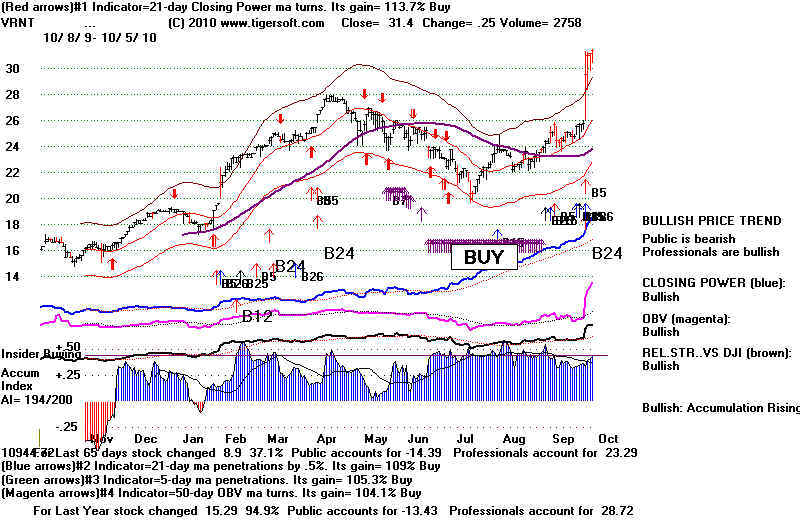
of VRNT and TRE.
Traders Should Get Ready To Buy Breakouts
in Very Strong Stocks with Flat Tops.
Buying TRE and VRNT when prices surpass the recent highs
has a very good
chance to bring a steep rise that comes close to matching
the gains that preceeded
the pause.
====================================================================================
10/11/2010 PEERLESS REMAINS ON A BUY.
The DJI is running into the heavier resistance area above
11000. Internals are still
quite positive. The Closing Powers for the ETFs have
not broken their uptrends.
At this point in October, we can start to see some upside
daylight and stop worrying
about an October collapse. The next three trading
days after October 11th have fallen
51.3% of the time, but the DJI is higher a month from now
59% of the time going back
to 1965. If there is a retreat, look for the decline
to stop at the DJIA's 65-day ma now at 10500.
A break in the uptrending SPY Closing Power should set off
a 4% decline to 112 and
the 65-dma. That CP trendbreak should not be assumed.
We just have to wait for it
to occur.
The boost given the market by the weak Dollar may disappear
for a few days.
The Dollar's Closing Power broke its steep down-trendline.
Food prices popped upwards
today. That will put more pressure on Bernanke
to consider the inflationary
consequences of his low interest rate policy.
Corn rose 5% today. It has risen from
a low of 325 in June to 556 now. Live cattle
jumped 3.3% today. But they did close
at their lows. Gold is weaker this morning.
The bigger Gold Stocks have been pulling
back even as Gold rose. So far, the decline in
NEM, for example is within normal
parameters. See the Blog I wrote tonight about Gold Stocks' Moving Out of Step
with Gold,
itself. We will want to start working with Relative Strength bands. (Some
more experimenting with these bands is needed, before
the software is released for
them. )
The DJI-30 stocks look firm with the exception of
BAC. IBM, up +.81, continues to give
its heavily weighted strength to the DJIA. The
higher priced DJI stocks are the leaders.
This is what often propels the market towards
the end of a surge. But until we see
divergences between prices and breadth, I think
we have to bet on higher prices.
Momentum traders can still find many more
strong stocks than weak stocks to look at .
There were 191 MAXCP stocks, i.e. Closing Power
made 12 month highs in last two days
and 37 MINCP stocks, that had Closing Power
make new lows... The ratio of NASDAQ
new highs to new lows is 59 to 15, much less
than the 121 to 1 ratio on the NYSE,
but enough to show the direction is still
probably up. The Bullish list from MAXCP holds
the same stocks mentioned frequently: GAS, EPD,
TUR 75.46 + 1.01 (ETF for Turkey).
TTM 27.23 +.54 (Tata Motors), NXTM and IFN and
IIF - India Funds. I am still weighting
for VRNT to breakout past its flat resistance
at 31.6. ABV - 133.33 +.67 and
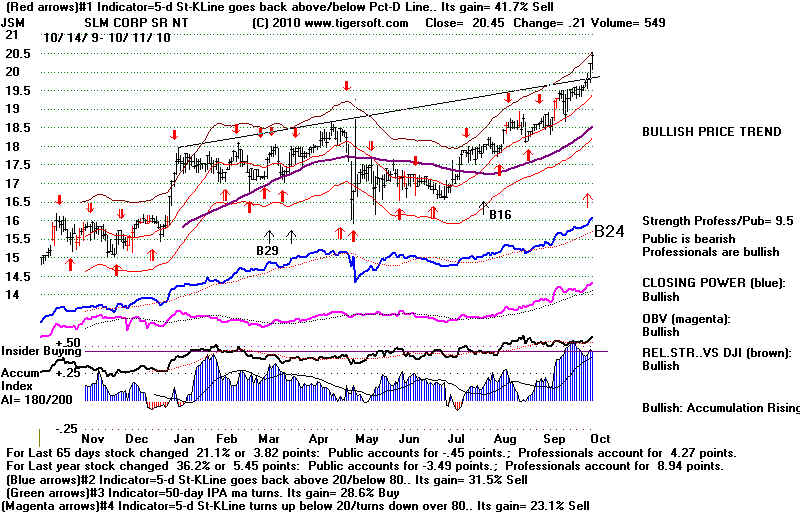
a new stock JSM 20.45 which profits from
student loans.
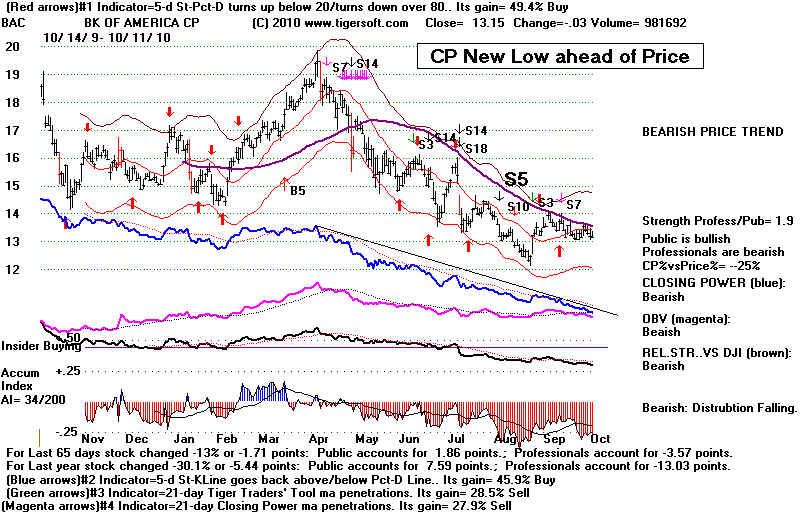
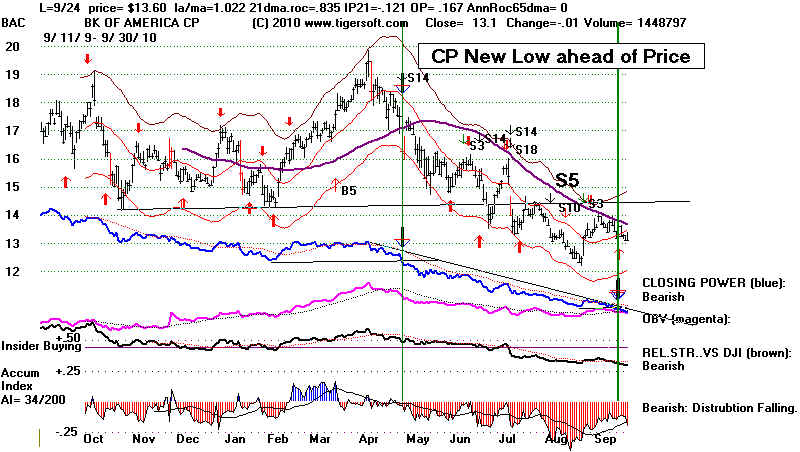
BAC remains a good short sale. Mounting
criticism of big banks for fraudulently
selling mortgages without proper paper work
will, no doubt, grow bigger as the Election
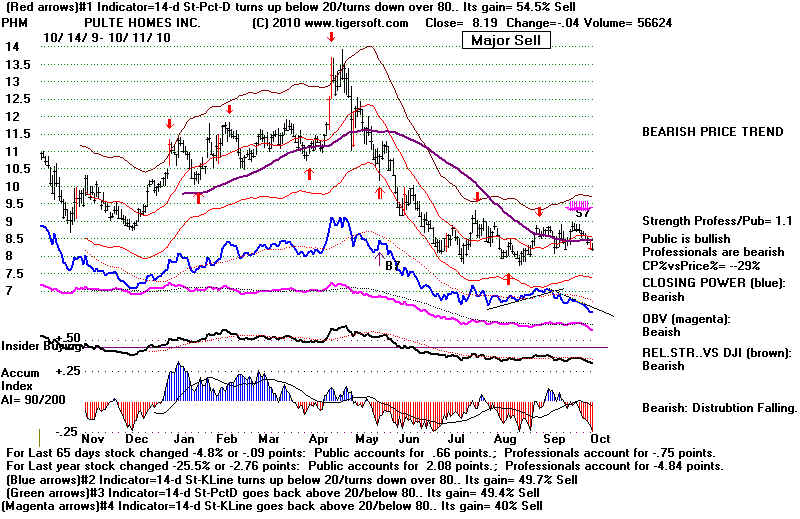
nears. PHM also shows significant red
distribution combined with CLosing Power
new lows. See Janet
Tavakoli's recent comments in Washington Post.
."This is the biggest fraud in the history of
capital markets..."
BAC and PHM
===================================================================================
10/8/2010 11006 la/ma=1.024 21-dmaROC=
+.656 P= 357 IP21=+.134 V= +48 OP= .283
PEERLESS REMAINS ON A BUY.
The NYSE
A/D Line keeps rising courtesy of Bernanke's low interest rate policy.
Critics
and bears want of the inflation these policies will cause
down the road. But with real
unemployment 17% and no plausible, much less practical,
alternative from either political
party, I don't see what will change the FED until after the
Election. Meanwhile, enjoy the ride.
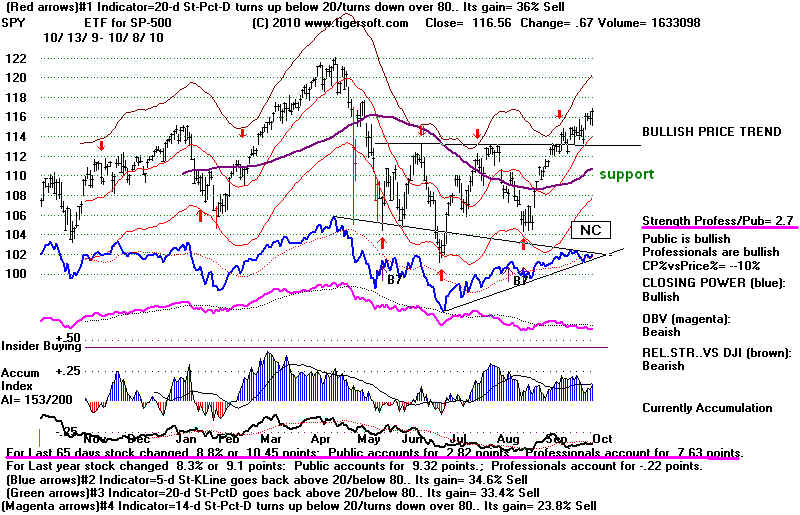
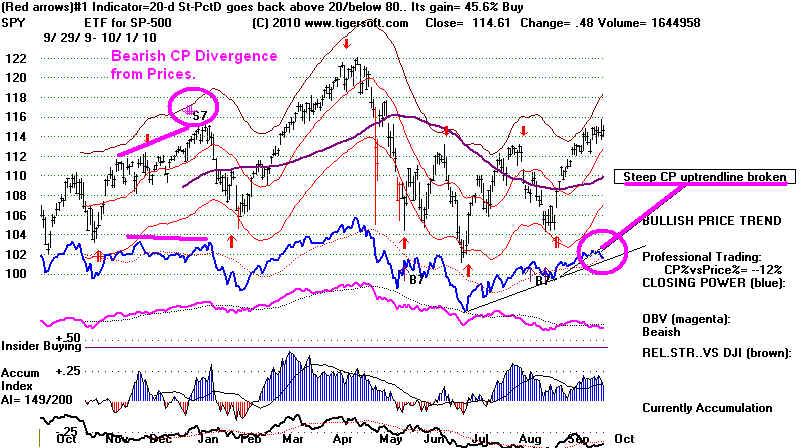
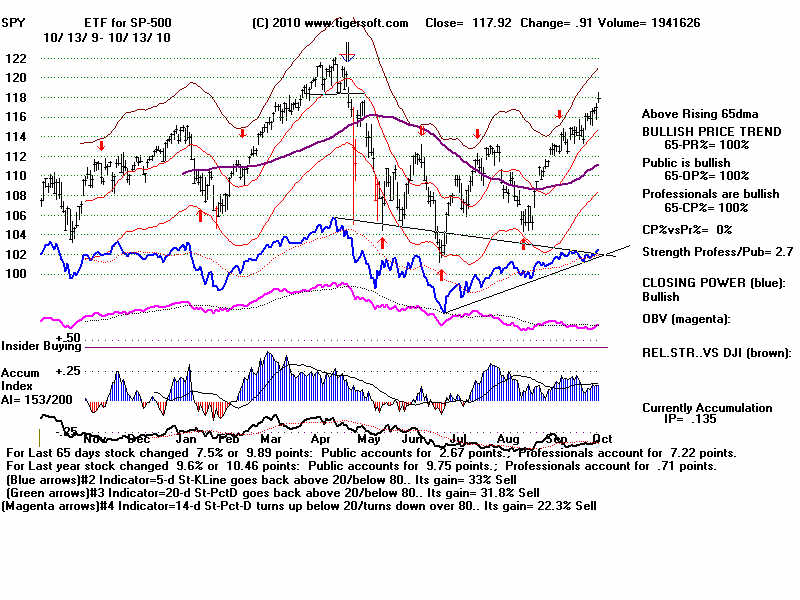
SPY does show an automatic red Sell signal. The
Closing Power has not confirmed
the recent advance. That makes any clear break in the
uptrend-line of SPY's Closing Power
a reliable short-term Sell. Another
relevant Closing Power principle is to become wary
when a Closing Power uptrend is broken in stocks or ETFs
that have both Opening and
Closing Power rising and are over-extended. Watch SPY
closely. A break in its CP uptrend
would likely bring a decline to its rising 65-day ma.
I do find encouragement when looking
at the new TigerSoft SPY chart. It shows that
Professionals' buying after the Opening
is 2.7 times more important than the gains occurring
overnight at the Openings.
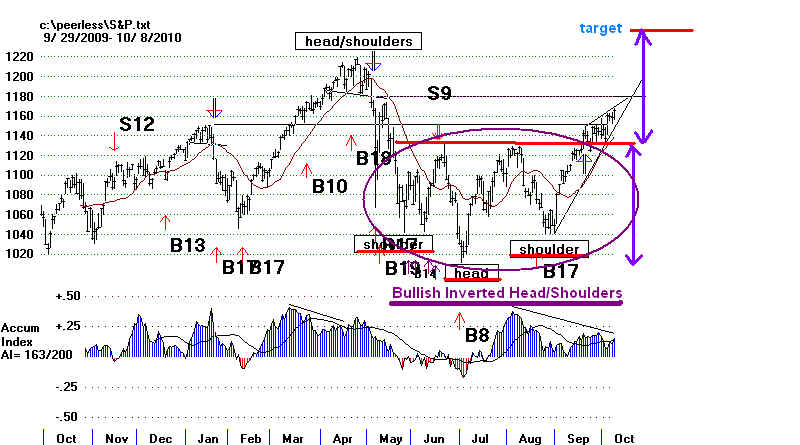
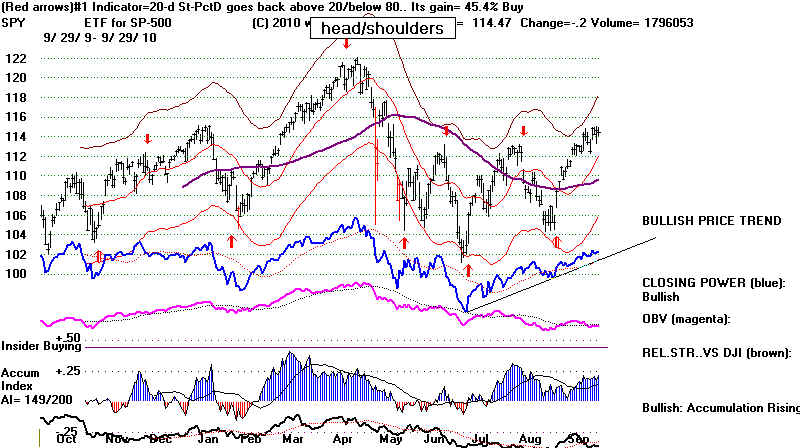
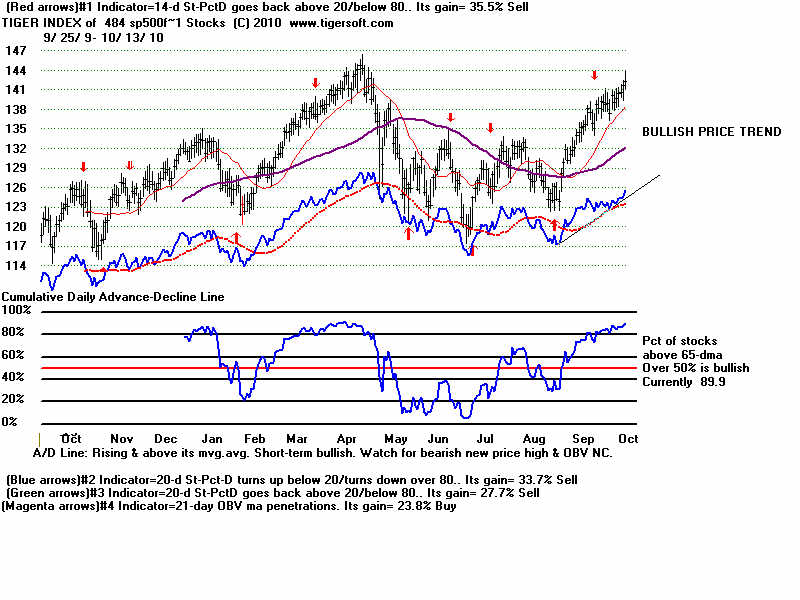
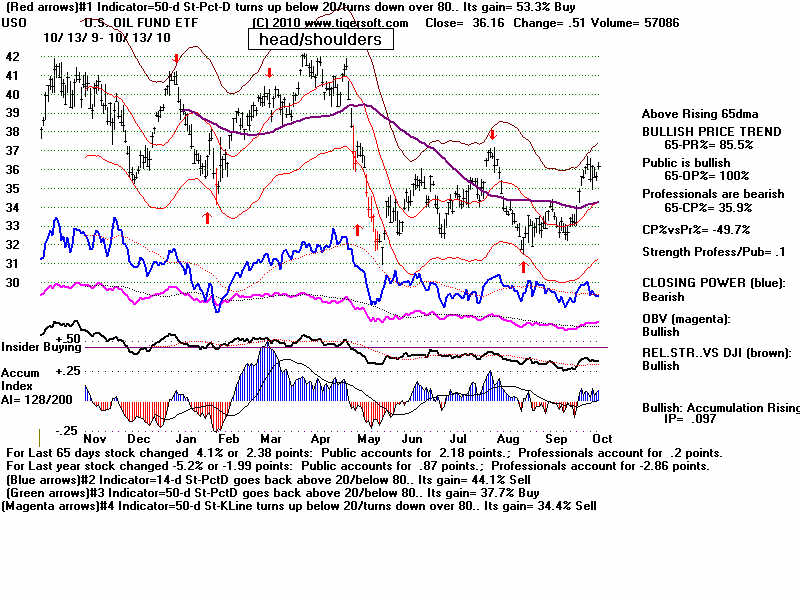
Some chartists point out the inverted head and shoulders
pattern in the SP-500 that
has been completed. The height of the pattern before
the breakout usually tells you
the minimum number of points upwards prices can run
once the necklne resistance is
exceeded. If true, we should expect the SP-500 to
make a new high above its 1220 April
peak. Such patterns usually see a big increase in
volume. Technicians now must
accept that a lot of volume in index Stocks is occurring
off the NYSE, which makes
our SP-500 charts suspect.
Inverted Head/Shoulders in SP-500
More Bullish Stocks Than Bearish Looking Ones.
This is clearly a market of stocks. Foreign ETFs and Gold stocks
are clearly favored
by the weak Dollar brought on by low interest rates and the
FED's buying of Treasury bills.
173 MAXCP
Stocks 95 NASDAQ New Highs
vs 39 MINCP and 11 NASDAQ
New Lows
Bullish MAXCP
GAS - Nicor NH AI/200=195
EPD - AI/200=195 IP21>.25
TUR - Turkey ETF AI/200=186 IP21>.40
TTM - Tata Motors - three bulges of intense Accum (insider buying)
IF - India Fund - Classic Sell B7 (Bullish CP Divergence) and intense Accum. (Classic)
NXRM - NXStage - Strength Profess/Public - +219!
IIF - Morgan Stanley India - Classic Buy B7 (
Bullish CP Divergence) and intense Accum. (Classic)
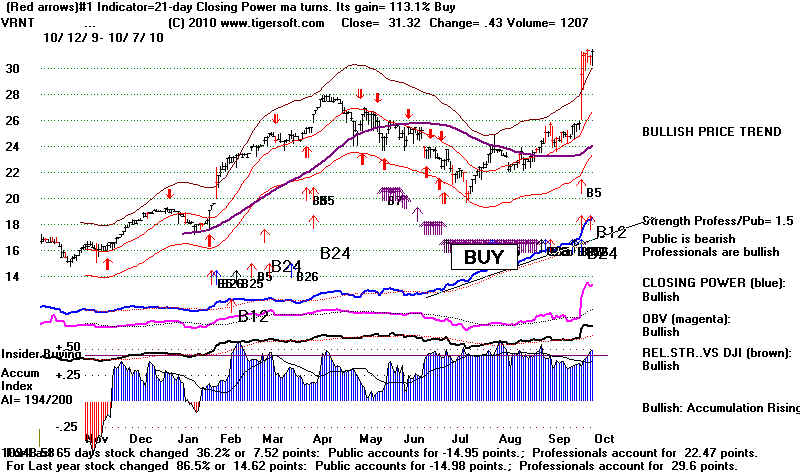
VRNT - frequently mentioned classic - Now Buy B12.
Classic Buy B7 (Bullish CP Divergence) and intense Accum. (Classic)
IGR - Price far behind internals.
ABV - 132.66 +2.72 Strength Profess/Public - +7.3
DEP - Duncan Energy AI/200=174 IP21>.40
TEG - Integrys Energy - Bulges of insider buying. Strength Profess/Public - +6.2
Bullish GOLD
TRE 7.28 AI/200=185 Wait for break in CP downtrend to Buy.
CUM-T 4.36 NH AI/200=192 Public buying is more important than
professional buying.
GORO 22.58 NH AI/200=174
IVN 24.56 +.83 CP is now downtrending.
ANV 26.56 +.05 CP is now downtrending.
AXU 5.95 +.11 AI bulge and breakout in hot group prodiced 25% gain this week.
Bearish MINCP IP21 (Current AI) <.20:
BAC falling back fromn 65-dma,
VXX 15.44 -.77 (Vix Short-Term Volilatility Index) AI/200=29
,
CFFN,
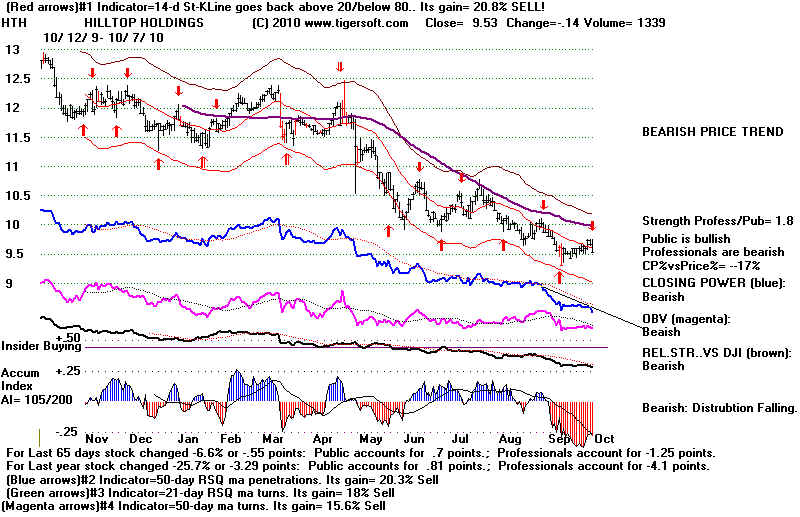
PHM 8.23 -.11 CP%-Pr% = -32 Recent Sell S7s and breaking of 65-dma -
Pulte Home
HTH
==================================================================================
PEERLESS REMAINS ON A BUY. Market Awaits Jobs Report.
High Priced DJI Stocks
and Very Low Interest Rates Should Prevent A Big Decline
until after the November Election.
The 10%+ rally since August 31 is starting to struggle.
Breadth deteriorated
for the second day. Even the precious metals were hit with profit-taking. The SPY
and DIA recovery highs were not
confirmed by the Closing Power making new highs.
That makes the uptrends of the CLosing Power lines more
important. A break in
in these CP uptrends would be bearish and further confirm
the red Sell signals on
these charts. A 4% decline would take DJIA back to
the expected support of its
rising 65-dma. The Closing Power for the QQQQ is downtrending already. Often
short-term tops develop when the DJI goes nearly flat for
five or six days in a row.
Let's see if it "flat-lines" a few more days, as
it did on 6/29/2009 when it produced
a Sell S8 which dropped the DJI back to the lower band.
The DJI has actually held up well given AXP's 4 point
decline this week as anti-trust
charges are levelled against it. CAT is the highest
AI/200 stock in the DJI and a
high priced DJI stock, thereby having relatively
heavy weighting. Its Closing Power
is only in a minor downtrend. CVX at 83.52 is another
heavily weighted stock in the
DJI. Both the Public and Professionals are
buying and there was an intense bulge
of Accumulation in it in August. These are
bullish signs and argue against a bigger decline..
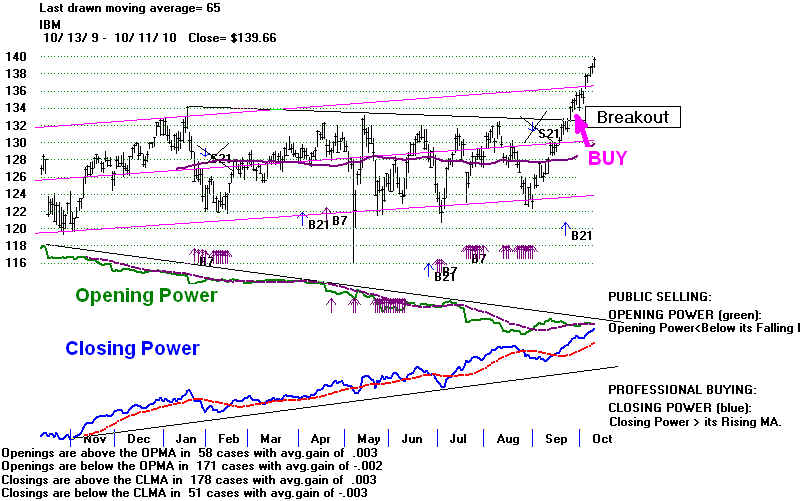
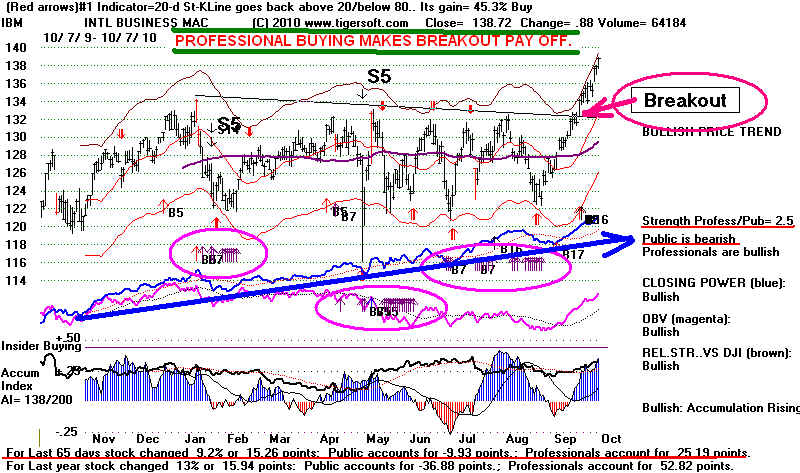
The real strength in the DJI is coming from the
recent breakout in IBM. The November
calls we recommended are looking very good.
Professionals are heavy buyers. The
Public does not believe the rally. IBM at
138.72 has 10 times the weight in the DJI
of very weak BAC at 13.31. You can see how the
way the DJIA is weighted as well
as its makeup - defensive blue chips that pay
dividends - that allows it to keep on rallying
even as other indexes start to falter. Late in
an intermediate-term rally, the best
of the high priced DJIA stocks tend to do well.
IBM below has a minimum priced
target of 146, based on the width of its pattern
before the breakout (134-121 or 13)
added to the point of breakout (133).
Breadth is still bullish and we have no Peerless
sell. That suggests any decline
over the next two weeks will be shallow and
short-lived. Fighting the FED has
been unprofitable and frustrating for short sellers
of the major market indexes
for most of the last year and a half. I think
that we can safely predict the FED will do all
it can to hold the market up until the election is
past. The NYSE ratio of NYSE highs
to new lows Thursday was still a bullish 86 to 3.
The NASDAQ is not so bullish
but it is a solid 42 to 9. A way to see how
professionals judge the market now is
simply to compare the 112 stocks in the MAXCP list
tonight with the 53 in the
MINCP list.
10/7/2010
MAXCP - Bullish Stocks - IP21>.25:
EPD, TCLP, PGP, NXTM, VRNT, SJI, IGR, QPSA, AVF, OKS,
LCAPA, JSM, DEP, FFC, SNP, ELE
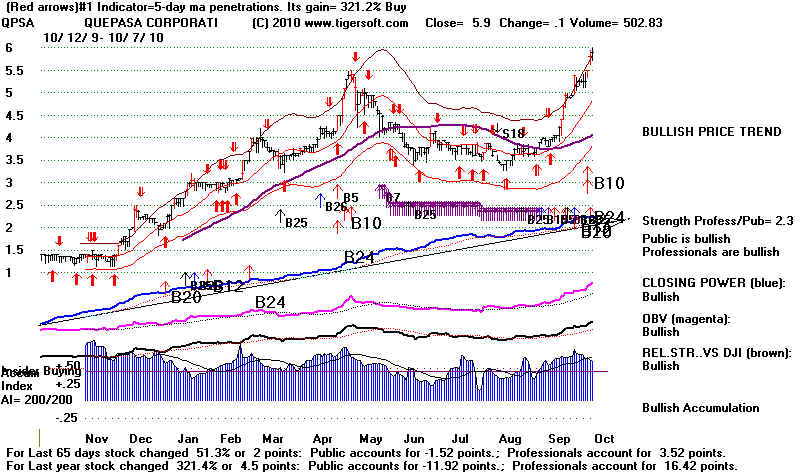
The highest current Accumulation Index stocks from
this list are VRNT and QPSA.
Readers will remember QPSA as that odd little stock
at $1.50 that has such ridiculously
high levels of Accumulation. Click here to see
its chart at the end of 2009.
QPSA is thin and on the pink sheets, so buy just a
little with limits. VRNT still looks very
good and is apt to be resistant to a general market
decline. Notice the new Buy B7s.
They show where Closing Power is much closer or at
its 65-day ma while price
is still lagging, but should play catch up and make
new highs. On the right side
of the charts, you see a value for "Strength Profess/Public". This shows how much
of the change in price over the last 65 days owes to
higher closes from openings
(Professional Closing Power) versus overnight changes
in price (Public Opening Power).
A rato higher than 2.0 shows Professionals are
dominant.
A ratio under 1 shows the public is heavily in the
market. Openings are holding or
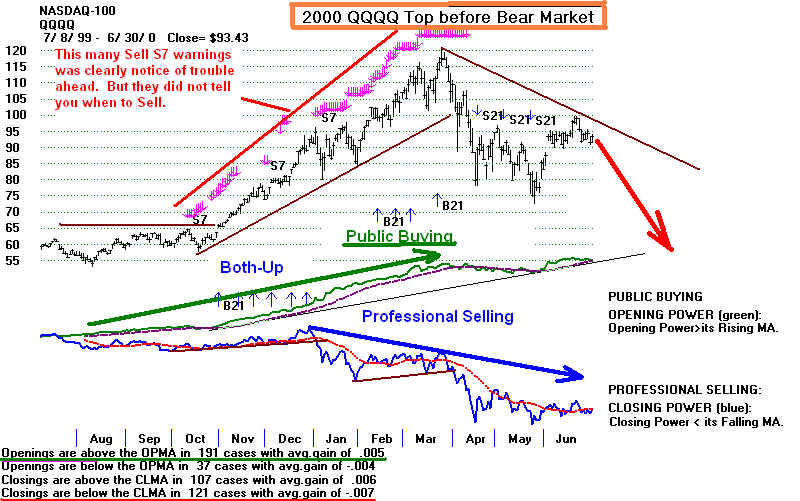
pushing prices up. At the top in 2000, March 24, the CP%-Pr% value was -.49.
At the end of the period shown in this chart
Professionals were bear and the Public
was Bullish, yet the "Strength Profess/Public" value was 6.4, which showed Professionals
were dominant and the CLosing Power downtrend should
be heeded. By contrast
at the end of December 1999, the "Strength Profess/Public" value was only .3. The
public (openings) accounted for 23.61 of the 30.6
points gain over the previous 65 days.
In this environment, it was best to play the rally
still on the long side, despite the Sell
S7 warnings. If this example here can be
generalized from, then we should respect
the uptrends of Silver (SLV)
now, where the the "Strength
Profess/Public" value is
also .3. Higher openings are likely to keep the
rallying going, though a break in the
Closing Power uptrend will cool the rally off some.
GLD is driven even more by higher
openings. Its "Strength Profess/Public" value is .1 Less than 10% of GLD's
advance
occurs after the Openings. Foreigners and the
US public buying at the opening account
for 90% of the 13.86 points advance over the last
65-days.
===> As long as the CLosing Power is rising, in a
stock dominated by Professionals and
showing heavy Accumulation, I think that we can be
bullish. The very high blue
Accumulation at the bottom shows (usually smart)
insider buying, prpsective
buying on future weakness as a cushion and a
tightening hold by insiders of the float
of the stock. The new TigerSoft is now available for subscribers to the Tiger ESP Page.
If you bought the software in the last 3 months,
I will send you an email this weekend
where you can get this update. Others
who want it, should contact me and we will work
something out. Documentation will be posted
this weekend, too.
 |
 |
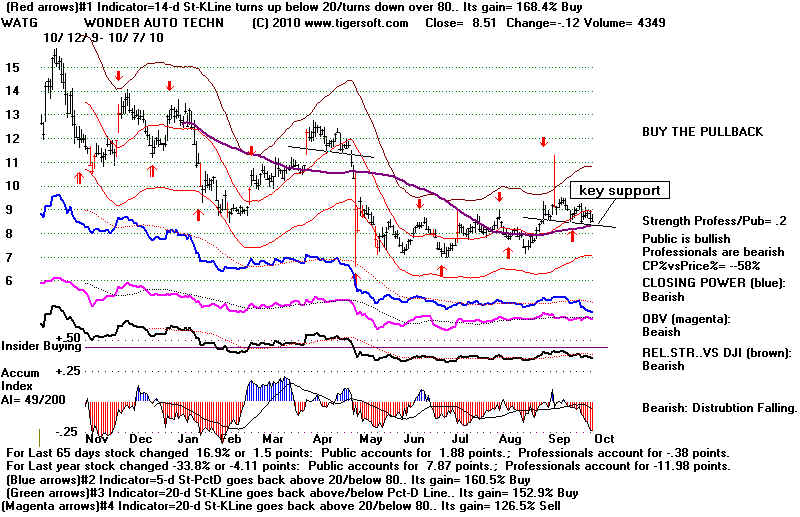
MINCP - Bullish Stocks - IP21< -.20:
BAC,
MON, WATG, CFFN, EUP, HTH
 |
 |
___________________________________________________________________________________
___________________________________________________________________________________
HOTLINE 10/6/2010 Peerless Remains on a
Buy. Gold and Silver Are Running!
The FED's Policy of Low Interest Rates Should Last Past The
November Election.
We will have to watch for signs of inflation that might bring a
change by the FED.
I will post the chart of Food Commodities more and more often.
See it at the bottom
of this night's hotline. Stay long GLD and SLV.
These are better plays now, I think, than
the major market ETFs.
The market still seems favorable for trading on the long side.
The ratio of NASDAQ
new highs to new lows is still a relatively bullish 49 to 10,
even as NASDAQ declined.
This is because its prices are still uptrending. There were 189
MAXCP (bullish) stocks
and only 31 MINCP (bearish) stocks.
Watch the Closing Power recoveries among the ETFs: DIA, QQQQ and SPY.
If they falter and turn down, Professional selling will resume
and the Sell signals
on the ETFs will likely play out with a shallow 4% or so,
decline. A bigger decline does not
seem likely, because we have no Peerless Sell and because the
internal strength indicators
are still quite positive.
New
research: when a stock makes much more
of its gain over the last 65 days from higher
openings than higher closes, respect the strength of public
buying if a new yearly
high is made above a flat top. Cover any short sales.
Traders can even go long.
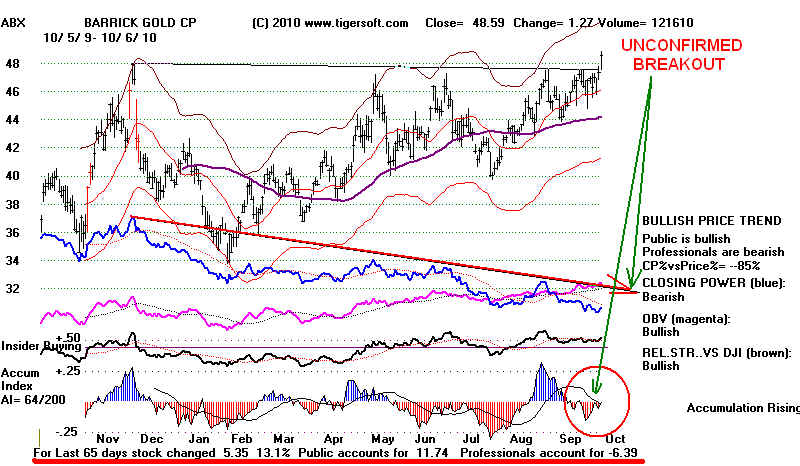
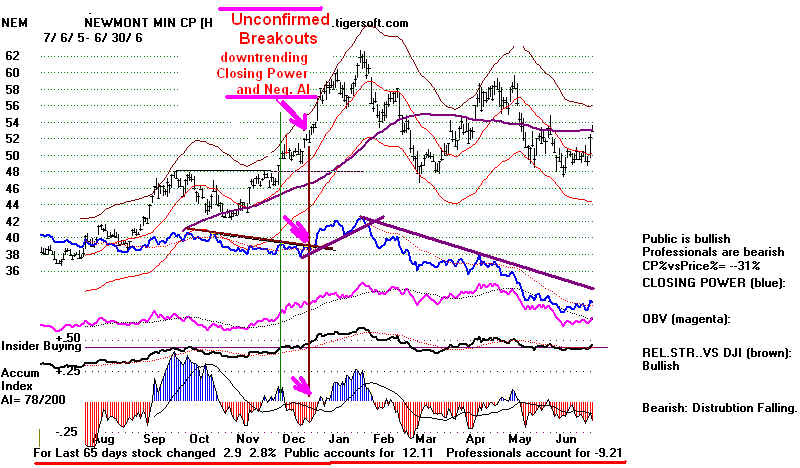
Compare ABX today with NEM back in 2005. The new
software release will post a message
at the bottom of the charts to this effect in such cases.
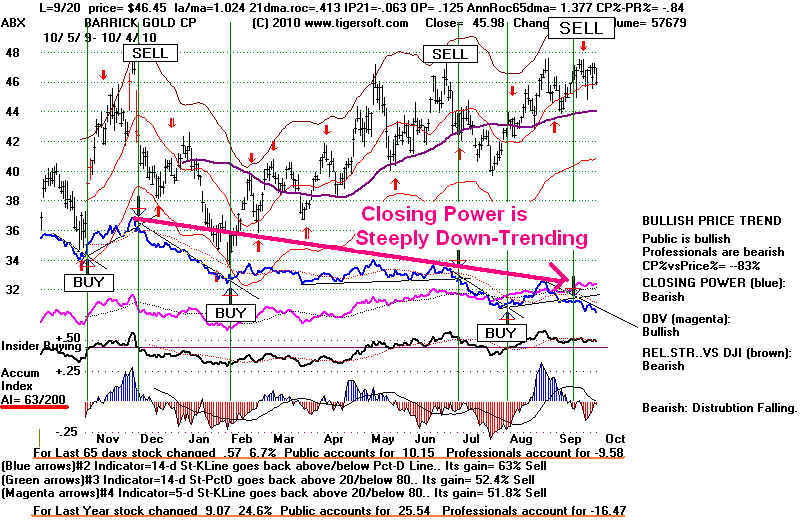
Watch ABX - Flat Topped Price-Breakout with Very
Negative Accumulation
and Steeply Declinng Closing Power
|
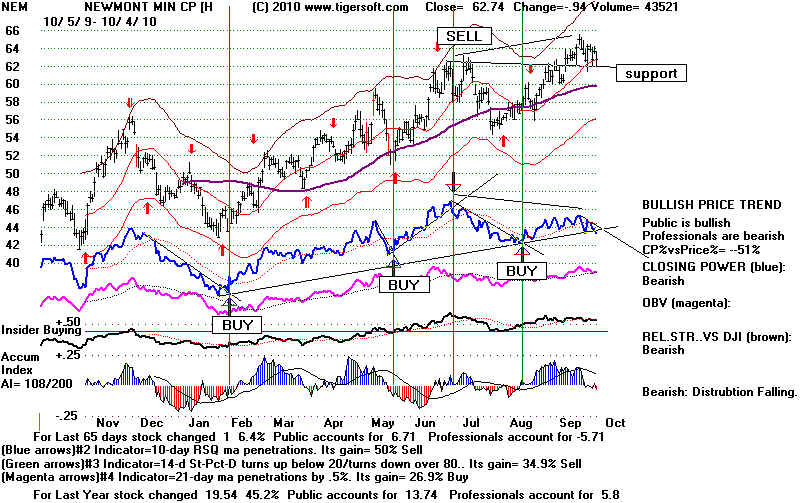
NEM Rose 20% after Unconfirmed Flat Topped
Breakout in December 2005.
 |
How much can the market decline with interest rates this low and
falling?
So far, the answer is not much. The real risk is that
inflationary pressures will build
to a point where only a dramatic rise in interest rates will cool
them. But that is down
the road a ways, after the November 4th Election certainly.
Right now the 17%
unofficial unemployment must be dealt with and not be allowed to
worsen.
So, Bernanke and FED continue aggessively to push up the
stock market by buying Treasury
bonds and forcing interest rates down to
new lows today. This especially boosts
Gold, Silver
and foreign ETFs. They are making new highs.
The FED policies certainly
give a chance for the Gold bugs to shout about "currency
debasing" and government
defaults. But, in truth, there is little doubt that if it
wanted to, the FED could quickly
boost the Dollar. The governments of Argentina and Weimar
Germany had long lost
that power at the time their currencies fell apart.
See my Blog about Argentina.
Tiger Blog - 11/29/2007 - Vital Lessons for US from
Argentina's Currency Collapse of 2002...
HOT TRADES
Watch for more exciting moves, especially from
those stocks that show intense
Accumulation and then make new highs. This comes about
because of how
traders focus on stocks that move the most, because of short
covering as new highs
are made and because advances are easier with stocks more tightly
held, a result of
recent intense Accumulation. See such Gold/Silver charts at this link and just below.
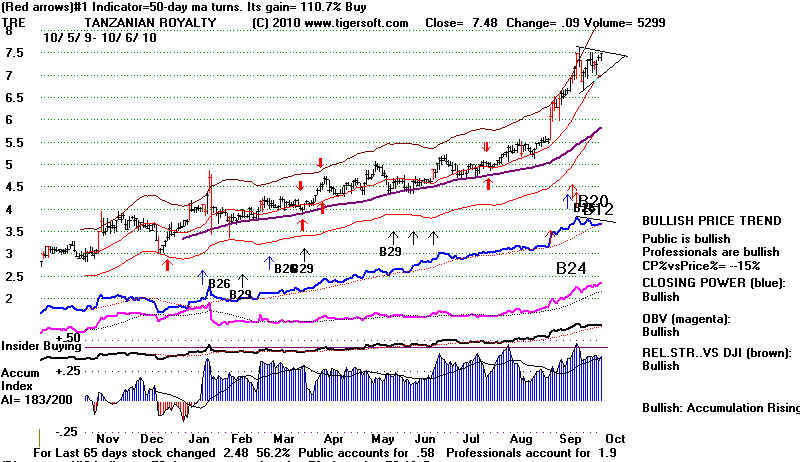
Traders should note that TRE would seem to be preparing for a
breakout run something
like we saw today in AXU's 26% one day jump.
BREAKOUT AFTER INTENSE
ACCUMULATION
IN HOT INDUSTRY GROUP
 |
 |
10/6/2010 HOTLINE continued
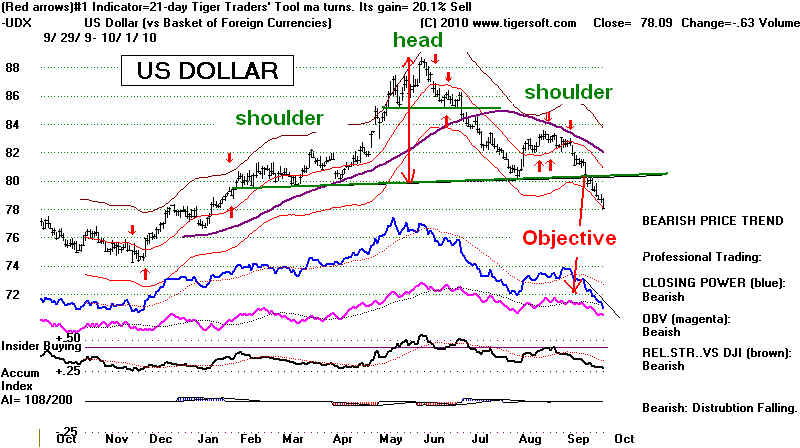
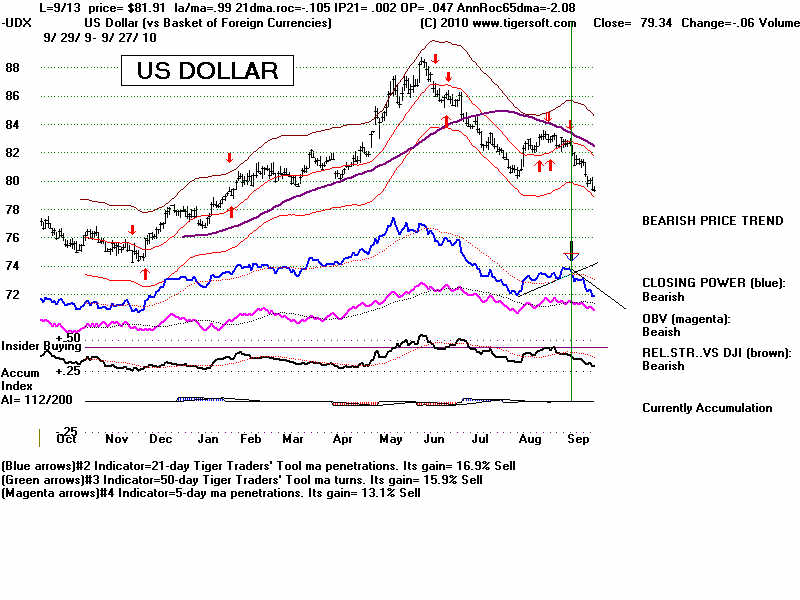
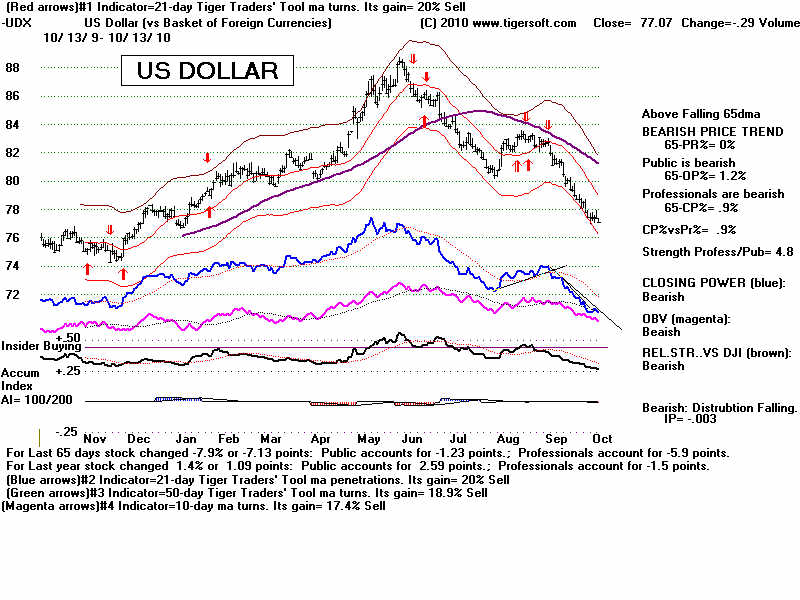
The Dollar (77)
dropped further today, on it way down to 73, at a minimum, I think,
based on its completed head and shoulder pattern's objective.
Bernanke's cheap Dollar/
Low Interest strategy has not been challenged much by Democrats
or Republicans.
I think this is because neither party has a politically viable
alternative to risking much
higher unemployment. Bernanke's approach is considered
necessary to prevent
a Depression. Meanwhile, it helps Wall Street and
Retirement Accounts..
The weak Dollar has many consequences,
some good and some bad. Like all
government policies, it favors some groups and hurts others.
Exports will be favored
and US wages will become more competitive if the trend continues.
Debtors will pay back
Creditors with devalued money. US banks will have trouble
if the Dollar is used less as a
reserve currency. Only if there are much bigger swings in
the the Dollar will it work a hardship
international trade because of the added uncertainty volatility
imposes.
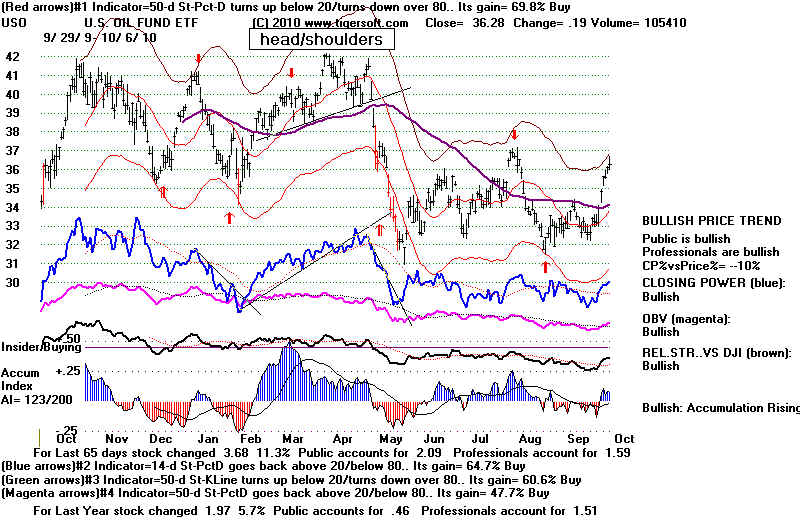
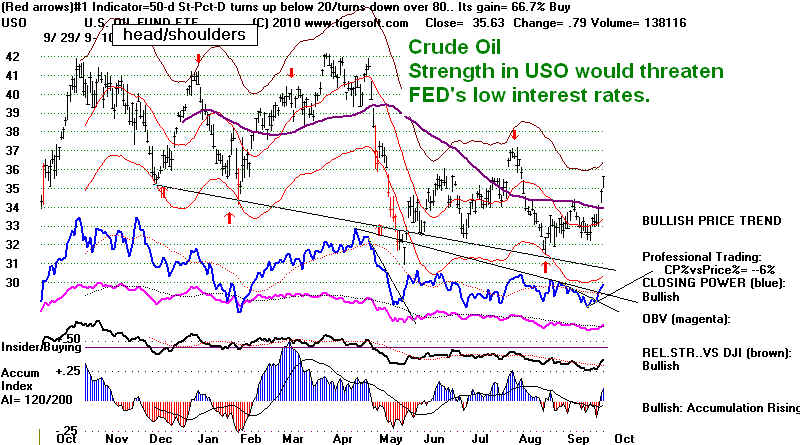
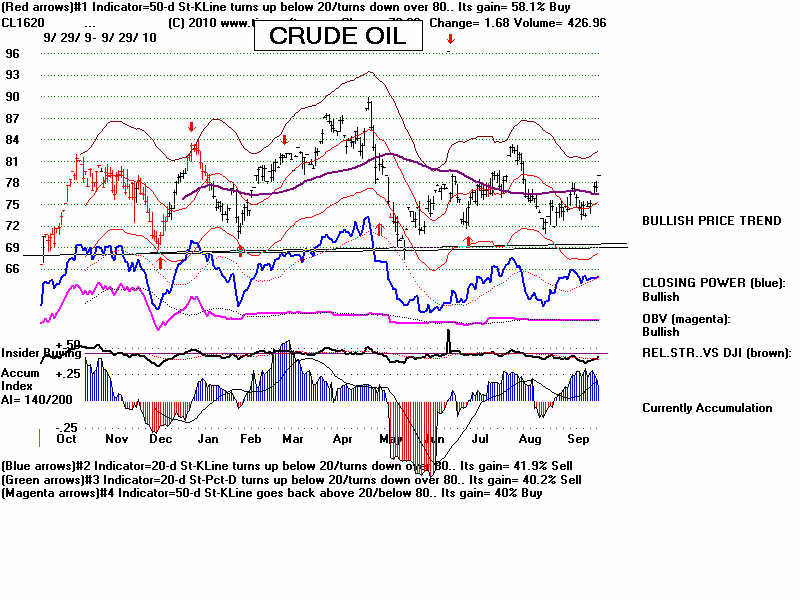
Remembering $5.00/gal fas prices, a
big jump in Crude Oil surely is real threat if OPEC
starts to use its power. Oil is rising now, but it is still
10% down from its 12 month highs.
This would seem to give the FED more time to continue to keep
rates low. US demand
for oil is still not robust because of the weak economic climate.
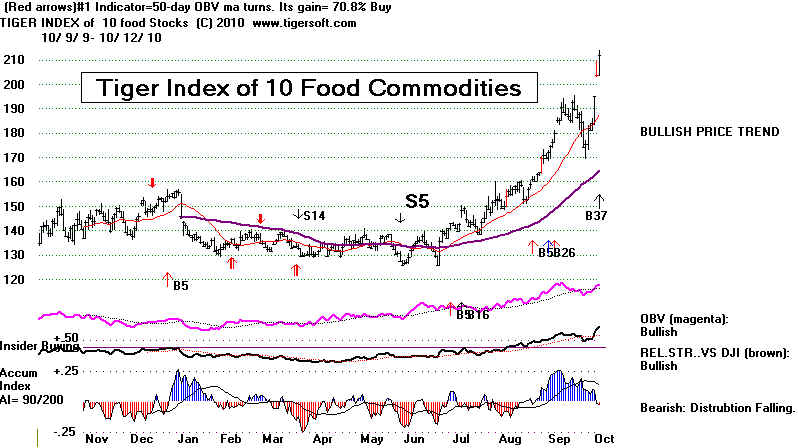
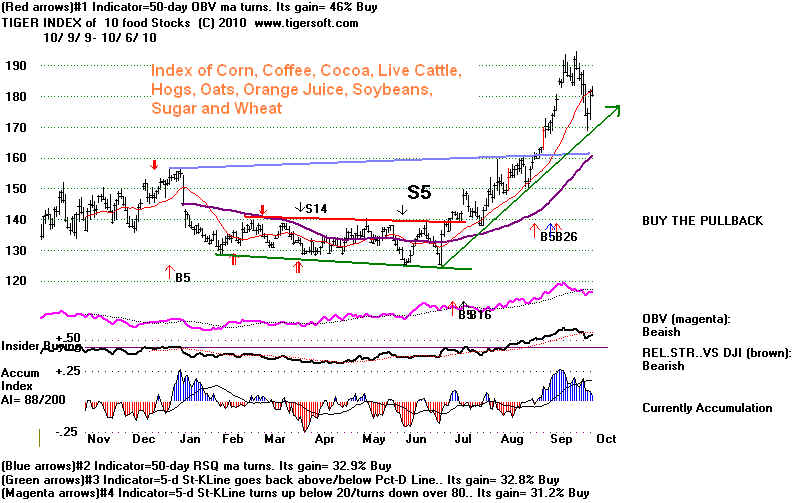
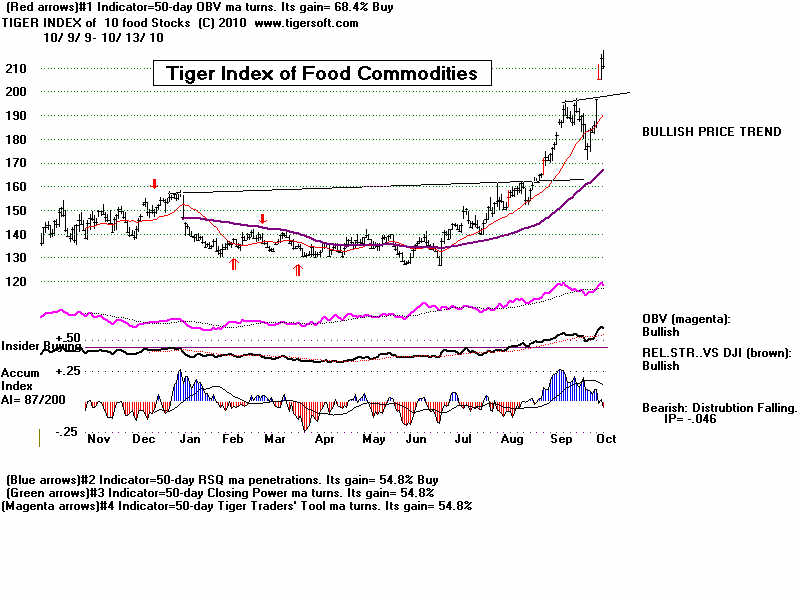
On the other hand, the
Tiger Index of food commodities show a 50% advance since June.
It takes a while before
this upswing gets translated into higher prices at the grocery
store. When consumers
become aware of this, there will be much more public and
political resistance to the
FED's low interest rates. This is not likely to be bought
up until after the November election.
USO - CRUDE OIL
TIGER INDEX OF 10 FOOD COMMODITIES
CORN (C_1620) COFFEE
(CC1620) COCOA (CO1620)
LIVE CATTLE (LC1620)
HOGS (LH1620)
OATS (O_1620) ORANGE JUICE (OJ1620)
SOYBEANS (S_1620)
SUGAR (SU1620)
WHEAT (W_1620) (Download these from Tiger Data page COMMOD.)
---------------------------------------------------------------------------------------------------------------------------------------------------
HOTLINE 10/5/2010
Peerless Remains on a Buy. Today we got a new short-term
Buy on the QQQQ from TigerSoft.
The CLosing Powers turned up sharply today from their 21-day ma
on the DIA, SPY and
QQQQ, casting doubt on their trend-breaks Friday. Breadth
was good. With 1900 more
up than down on the NYSE, its A/D Line made another new high
ahead of prices. Also
bullish, on the NYSE, there were 200 new 52-week highs and only 1
new low. On the
NASDAQ, the numbers were 128 new highs and 5 new lows. This
is too strong a market
to be short SPY or the DIA even for short-term traders....
Cover them.
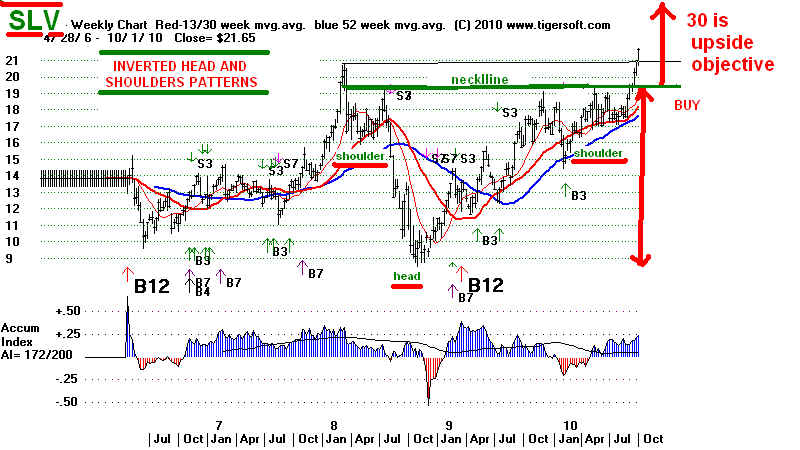
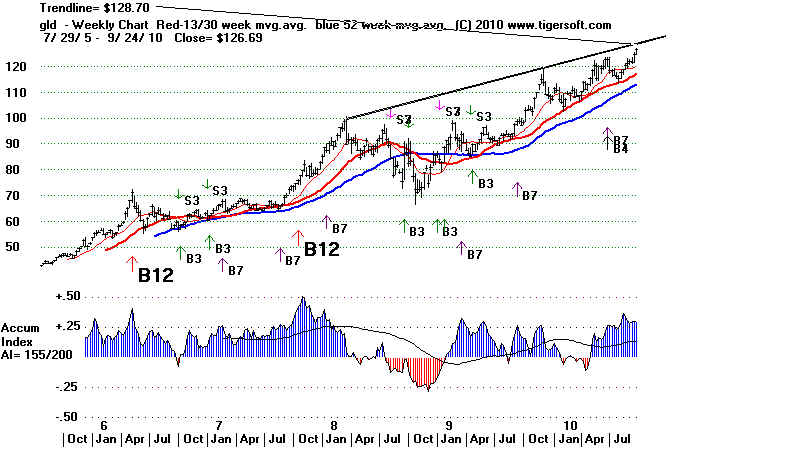
GLD and SLV should be bought. Their runs are reminiscent of the
Fall of 1979.
Gold rose 600% with the Democrats in office from 1977-1981.
Silver zoomed from
under 8 to 48 between 1979 and February 1980. Pullbacks now
may be non-existent.
Do not underestimate the Gold-Bug feeding frenzy that can move up
these hedges
against a weak Dollar.
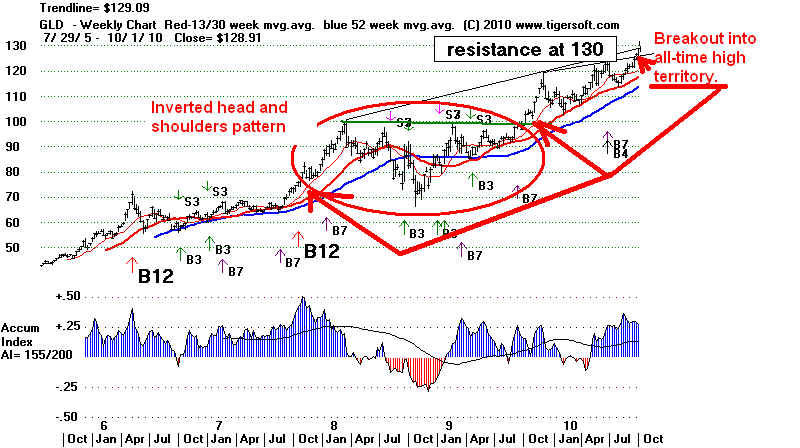
SLV (the ETF for Silver has completed a bullish inverted head and
shoulders pattern
and now has a minimum upside objective of 29-30. One should compare
the inverted
head and shoulders pattern just completed by SLV (silver) with
the same pattern
made by GLD as it broke out past 100.
Gold is running in all-time high territory, where the path of
least resistance is up. Compare this
with the markets of 1996-1999, as they surged higher and higher
into all-time high
territory. Silver and Gold have a history, like most
commodities, of going hyperbolic to
the upside.
See - September 29, 2010 SILVER is shining.
28 YEAR HIGH Invites Comparisons with 1978-1980.
March 6, 2008 Silver's
Potential 1979-1980 TigerSoft Chart of Silver.
WEEKLY SILVER
WEEKLY GOLD
Bernanke reiterated for the upteenth time his determination
to keep interest
rates very low until such time as there is a broad economic
recovery in the US.
He should have added "or until such time as the
inflationary effects of a weak Dollar
create too much political headwind". The
Dollar continued to fall today, making foreign
and Gold stocks look very attractive.
The Dollar seems on its way
down 5 more points from 78, having completed its
head and shoulders pattern. Gold
and Silver are roaring upwards. Gold is in all-time
high territiory above all apparent resistance lines and
running freely. Silver has made
a 28 year high and has no real resistance until 25 is
reached. Both are recommended.
Using the Power Ranker's "BULLISH" screen
with Gold and Silver stocks over $4,
we get the following stocks for consideration:
Close AI/200 IP21 Remarks
TRE
7.39
182 .33 A move past 7.6 would likely start
another advance. 7 is support.
CP is making a NH. Buy at 7 or
7.6 stop.
CUM-T 4.15 192
.082 Running. Public buying is important here.
CP is not making a NH.
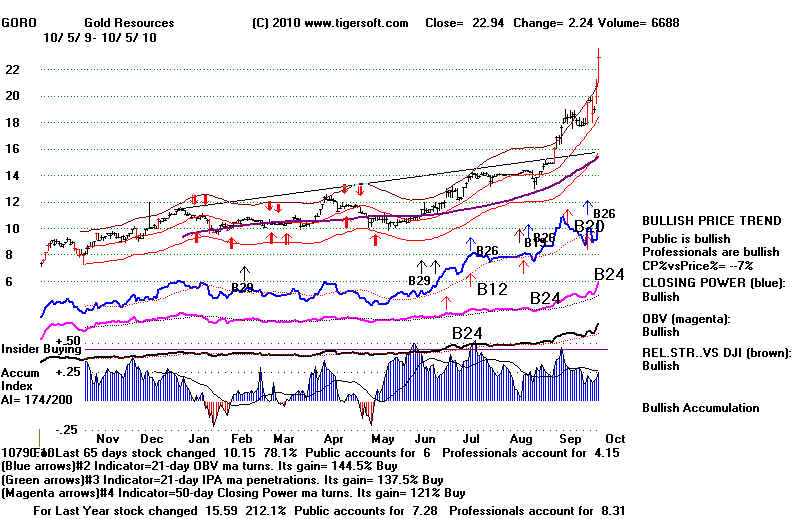
GORO
22.94 174 .25 Running wildly up. I wish we had added this to our data
base earlier.
Chasing this is too risky. Better
to buy it on a 10% pullback.
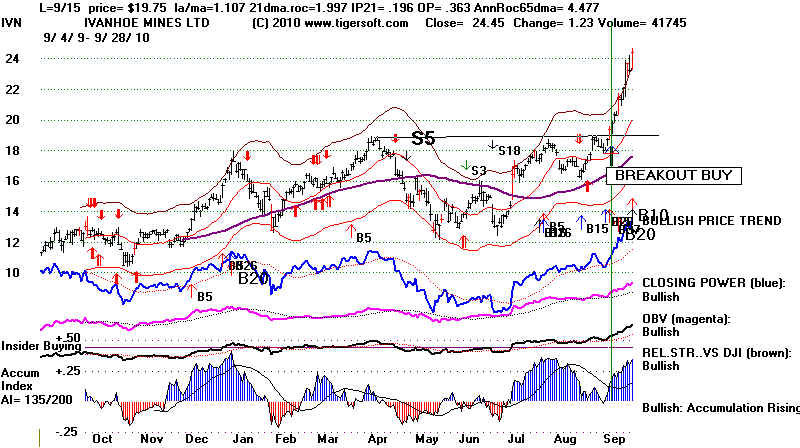
IVN 24.46 135
.256 Professionals are responsible for 70% of the advance
for last 3 mo.
Buy at 23.25
FR-T
7.24 121 .246
Professionals are pushing this higher.
The last high was confirmed by Closing Power. BUY.
DGP
38.24 117 .161 This is
double-leveraged Gold. It rose 64% for the last year.
GLD rose 31.2% over same time period. Buy DGP.
MVG 7.92 139
.218 Buy on move past 8.3 or if CP makes new high.
Using the Power
Ranker's "BULLISH" screen with Foreign ETFs' stocks whose
Closing Power is making a new high and the current Accum.
is above .18, we get the
following stocks for consideration:
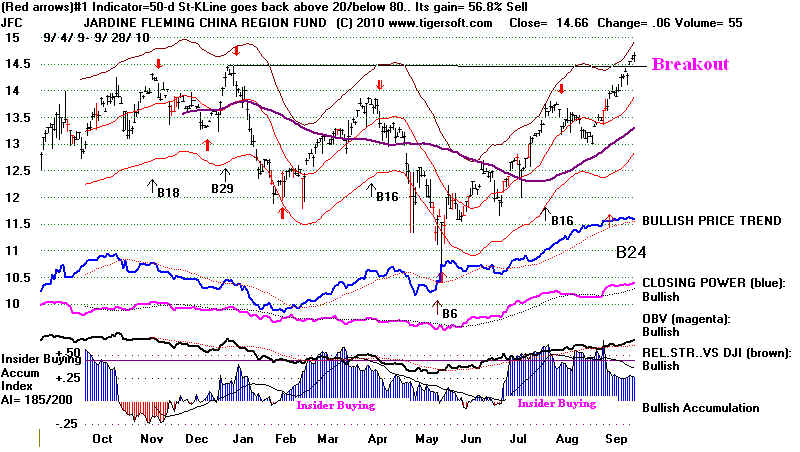
JFC
14.93 186 .262
China - Buy.
IFN 37.97
174 .185 India
Fund Confirmed breakout Buy
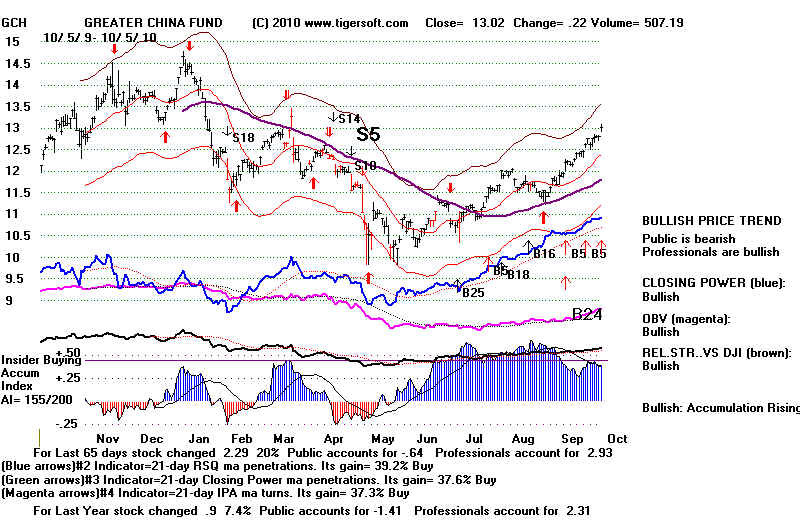
GCH
13.02 155 .395
Greater China Fund. Buy
BULLISH MAXCP STOCKS (Each looks like trading buys.)
NTCT 21.45 + .64
EPD 40.31 + .08
FSIV 111.5 +5.61 trading breakout.
RVBD 48.52 +.49
NXTM 20 +.65
VRNT 31.4 +.25
Most of the charts of
the stocks above can be see on this link.
===================================================================================
10/4/2010 HOTLINE No
Peerless Sell Signal Yet.
The
NYSE A/D Line has confirmed the advance, but the P- and Accum. Indicators did
not.
The Peerless internal strength indicators remain
positive. This means the market is
probably far too strong to suffer a big October decline.
The clinched TigerSoft
short-term Sell signals do predict a decline, however. Watch
the CLosing Power downtrends now in SPY,
QQQQ and DIA. They need to be
broken
in order for us to become short-term bullish.
Professional Selling has started in earnest. The CLosing Power uptrends
have been violated for SPY, DIA and QQQQ, thereby
"clinching" their current automatic
Sells. Except for precious metals and a few
stocks very much in the public eye like
APPL, the last few months' market has been dominated
by professionals. If they do change
their mind, and they are not known for loyalty to a
trend, then we are apt to see a decline
back to the rising 65-day ma in the DJI now at 46.
That would mean a 5% DJI decline.
Since Republicans are expected to do well in the
Congressional Elections, I would think
a rally into the Election Day on November 4th would
start from the next low.
Who Are The Buyers? How Much Do They Matter?
The Public has not been in the market
much. I say this because the Openings which are
much more likely to be traded by the public and
overseas investors than professionals
presently account for only 1.9 points in the DIA's
gain of 9.84 over the last 65 days, while
the trading from the Opening to the Close accounts
for 7.94 of the 9.84 rise. The last 3 months
show a significantly higher ratio of Professional
(post Opening) buying relative to the gain
in this time than their gain over the last year when
Professional buying amounted to
4.57 points in the DIA's gain, while Openings brought
5.56 points, more than half of the
whole gain. When Professionals are net buyers,
we usually stay bullish. But they
can switch sides quickly.
Clinched Sell Signals Using Breaks in Closing Power Uptrends
DIA is ETF for DJIA
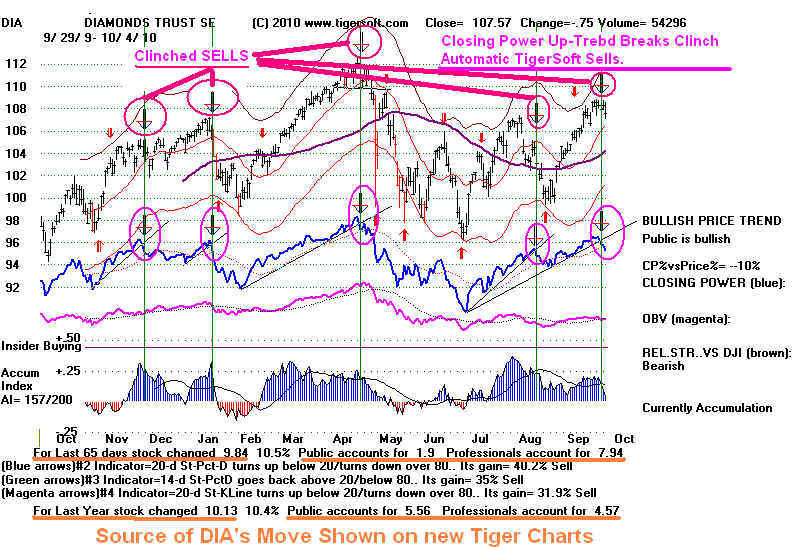
Since September
16th, professionals have been net flat the DIA, while the Public has become
net buyers. That is now worrisome. The
Public is more apt to be wrong in cases like this
when both the Opening and CLosing Power have been
rising. That is why we counsel
Selling "Both Up" (rising Opening and
CLosing Power) stocks and ETFs when their
CLosing Power uptrends are broke, especially after a
non-conifrmation....
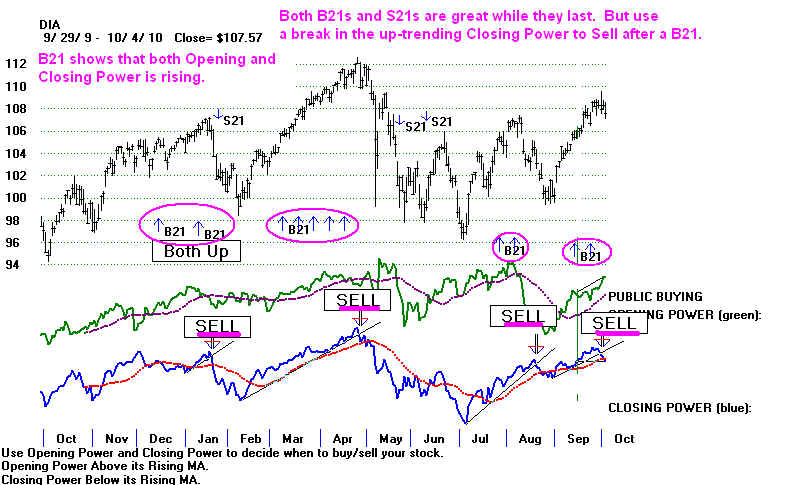
See the DIA chart
below. The "B21"s show the "Both Up" condition. The "Both
Down" condition is shown by S21s. Right
now. Openings are showing a pattern of
being very much higher than the Closings the night
before. If this pattern continues,
we are apt to see higher openings and lower closings
until Professionals decide to
buy again. For now, we are short-term bearish.
New features on
TIgerSoft charts will be released in a few days. More details will
be provided.
Without a
Peerless Sell signal we cannot predict a decline even to the lower band.
The low interest rate environment should prevent a decline
of more than 5%, barring
unforeseen bearish international events. Food and
fuel prices are not rising so much
yet as to force the FED to change their policies.
Only the steepest NYSE A/D Line has
been violated. We did not see CP non-confirmations
for DIA, SPY or QQQQ.
WHAT TO DO?
Short-term traders should short DIA or
SPY. Take profits in stocks that have risen
more than 20% above support, especially if their steep
Closing Power uptrends
are violated and their AI/200 score is below 180.
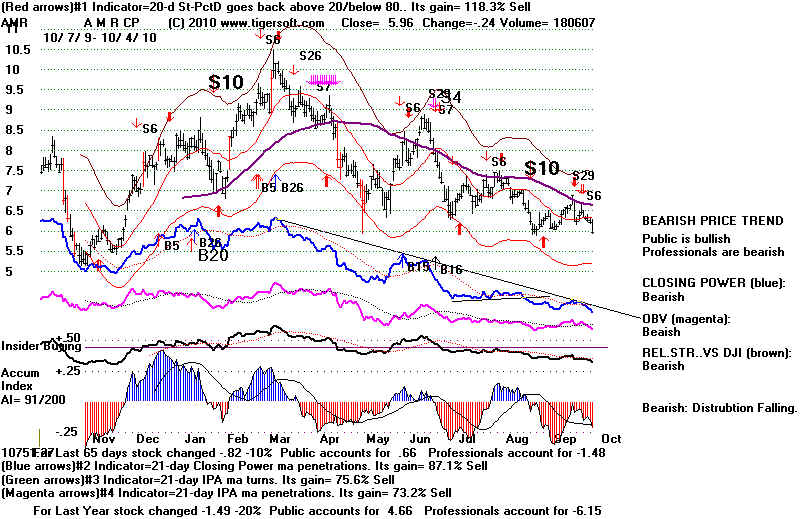
Here are some of the "bearish"
MINCP (80) stocks tonight. They should make good
short sales as long as their Closing
Power is falling: MTC, CX, TNE,
CFFN, ALNY, CBEH and AMR (below).
Gold stock ABX looks like a good Sell Short. Its Closing Power is making new lows
and it shows
stead red Distribution. We wil cover it when CLosing Power
breaks its downtrend.
See how much stronger are the internals of NEM at
the bottom. In
turn, it is not as strong as TRE.
PUBLIC SUPPORT CAN BOOST AND HOLD A STOCK UP,
BUT
| IT IS BEST TO
BUY WHEN CLOSING POWER DOWNTRENDS ARE BROKEN
OR STOCKS WHOSE CLOSING POWER HAS BEEN VERY STRONG.
Gold and Silver stocks in 2010 illustrate these principles.
Many Gold and Silver stocks made the biggest part of their moves overnight
this past year. But atfter after a
strong opening, they typically declined to the close.
Atypical behavior was significant,
however, When they did go up after the openings,
they got their best gains. You can
see this in the aftermath of their CLosing Power
downtrend-breaks.
Gold Stocks
NEM Points
Gained Gain At Opening Gain At Close
65-days
2.53
6.94
-4.41
1 year
20.48
13.93
6.55
ABX
65-days
2.01
10.32
-8.31
1 year
10.01
25.75
-15.65
AEM
65-days
10.4
10.14
0.26
1 year
4.72
20.68
-15.96
ANV (Good gainer)
65-days
7.0
5.92
1.08
1 year
17.9
5.1
12.8
TRE (Good gainer)
65-days
2.27
.52
1.75
1 year
4.45
-.63
5.08
Silver Stocks
PAAS
65-days
4.11
4.2
-.09
1 year
7.47
11.54
-4.07
SSRI
65-days
2.52
2.31
.21
1 year
-0.05
.25
-.30
SLW
65-days
6.67
6.44
.23
1 year
14.12
15.0
-.88
=================================================================================
10/1/2010
PEERLESS REMAINS ON A
BUY. The FED's Low Interest Policy Is Not Challenged
Yet by Rising Food or Oil Prices despite The Weak
Dollar. But Professionals Are Taking
Profits in DIA, SPY and QQQQ. We should expect
a minor 3%-4% retreat. See below
how the steep Closing Power uptrendline has been
violated, thereby clinching the
automatic red Sell. The red signals are based
on the best trading system our TigerSoft
program can quickly find from among 60 different
systems. It has gained 45.6% for
the last year buying and selling short. These
clinched signals offer tactics within
the extensively back-tested and intermediate-term
Peerless system's signals.
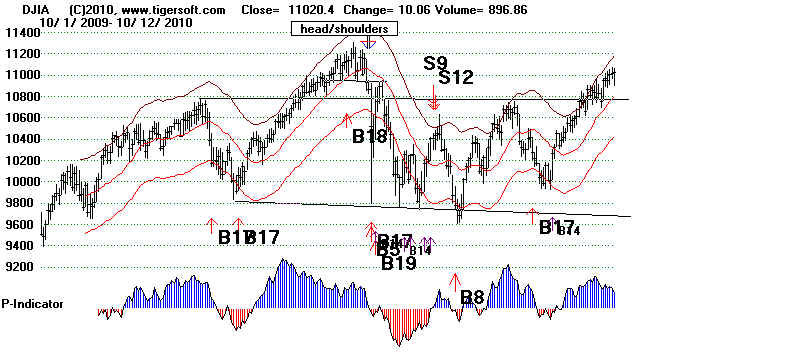
See how the head and shoulders pattern has been
bullishly aborted by the DJI'a
advance past 10750. The A/D Line for the
NYSE is still rising. Low interest rates
are working their bullish effect on the market,
even now 18 months after the
March 2009 bottom. The FED seems
determined to keep interest rates low, buying
if necessary, Treasury instruments with money
they can print. That has sent the Dollar
down below a bearish looking head and shoulders
pattern, neckline and using
classical technical analysis, sets up a target
near 72. Another drop of 8% by the
Dollar would certainly boost foreign ETFs, Gold and Silver. Most food commodities
are not looking strong enough to pose
inflationary pressures. That reduces the likelihood
of a coup within the FED against Bernanle's
leadersip. We will have to watch Crude Oil.
A move by USO to new highs might scare the FED
into reconsidering their policies.
That seems some time away, for now. So,
the Fed policies should continue and
keep the market from falling much this October,
even though we see clinched short-term
sell signals on the QQQQ,
SPY and DIA. The clinching has
occured because their
Closing Powers have broken their uptrends.
CLosing Power Divergence Signals
We have
seen that most of the time and with most investent vehicles the trend
of Closing
Power acts as a powerful predictor of future prices. Price changes due
strong or
weak openings tend to be deceptive. We can measure the degree to
which
Closing Power is bullishly or bearishly diverging from price using the
following
formula:
CP Divergence = CP% - Pr% for N
days,
where N = a time period (normally 65) and i = any day
and
CP% = (Closing Power (i) - Closing Power low for N Days back from day i)
----------------------------------------------------------------------------------------------------
Closing Power high for N days back from day i - CLosing Power low for N days back from day
I.)
Pr% = (Price(i) - lowest price for N days back from day I)
----------------------------------------------------------------------------------------------------
(Price high for N days back from day i
- Price low for N days back from day I.)
If we make a Buy B7 occur when the 65-day CP Divergence is above .35 from prices for their
65-day range, and cause a Sell S7 occur when the 65-day CP Divergence from Prices is below
-.35,
we see B7s in August on the chart for DIA below. Here
is a link to SPY charts showing key
B7 and S7 signals since 1999. These signals
are meant to be alerts to developing opportunities, so long
as professionals remain or become dominant and Opening changes in prices are not wildly
up or down from the previous day's close. When the Public is in the market, openings
range
widely from the previus day's close and the S7s are very pemature.
=====================================================================================
9/30/2010 PEERLESS REMAINS ON A BUY. The Intermediate-Term
Must
Still
Be Considered To Be Up.
But,
the steep uptrendlines of the QQQQ, SPY and DIA have been violated.
A minor
pullback therefore seems likely. As the DJI has reached the resistance of
the point
of breakdown in April, I think we have to expect a decline, probably
only to
just below the rising 21-day ma. That would mean support is expected
on DIA at
106, SPY at 112 and QQQQ at 47.5.
The facts
remain Peerless is still on a Buy and Octobers usually produce additional
rallies
after strong Septembers unless we get a major Sell. In these curcumstances,
I would
just wait for a pullback to Buy SPY or QQQQ.
Bullish
MAXCP stocks showing extreme bullish Closing Power divergences
usually
rise further. A good many of them turn out to be buy-outs.
See How To Spot A Stock about To
Get A Takeover Bid
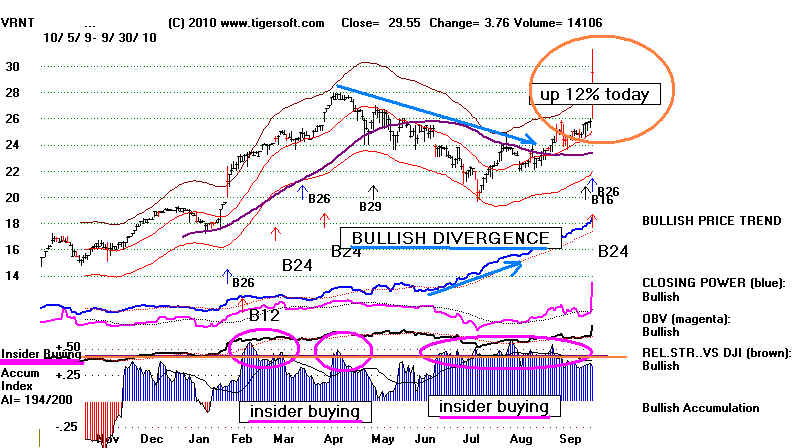
VRNT
illustrates what we look for. It was up more than 12% today.
http://www.verint.com VRNT has been shown here recently, precisely because it
had the key
characteristics of heavy insider buying and a bullish divergence between
price and
Closing Power.
Insider Buying + Professional Buying Bullish
Divergence
===> Predictable & Profitable Advance
Some
bullish MAXCP stocks with a current Accumulation Index are:
HYT
11.55 IP21=.34 (Current Accumulation Index value)
TTF
13.83 .35
VRNT
29.55 .34
FFC 16.87
.34
OKS
74.92 .43
NTAP
49.75 .37
VSAT
41.11 .31
This weekend I hope to inveil a new indicator
showing the 65-day divergence
between
CLosing Power and Prices.
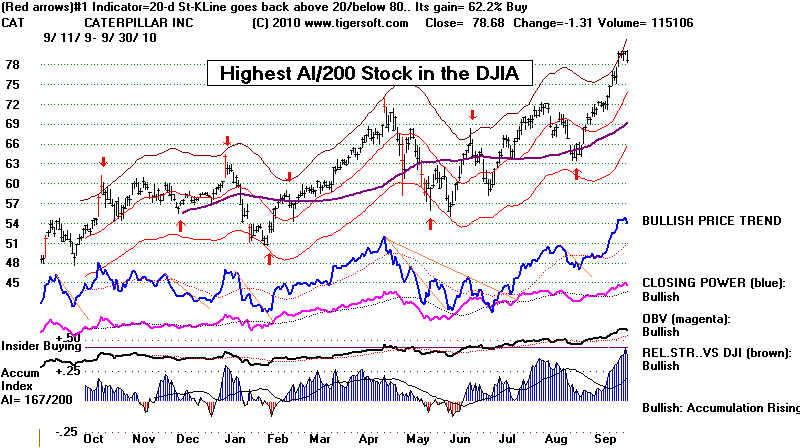
CAT is the
highest AI/200 stock in the DJIA. These can reliably be traded on
the long
side with each break in the Closing Power downtrend. Earth movers
are in big
demand as public works programs grow worldwide. Caterpillar's
stock is
responsible for 40 percent of the Dow's climb since the beginning of
the year.
http://www.cat.com
82 is the resistance from
earlier highs.
If you want
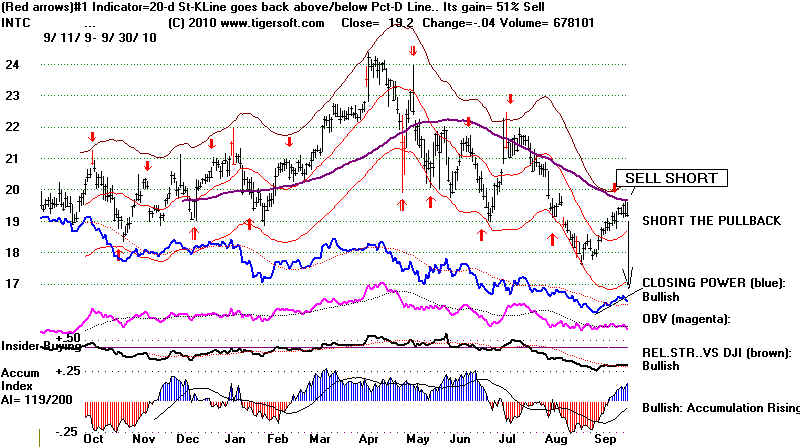
to hedge with short sales in the DJI, consider BAC and INTC.
Their
CLosing Powers are very weak; BAC shows red Distribution
and both
are falling back below declining 65-da mvg.avgs.
 |
 |
| |
-------------------------------------------------------------------------------------------------------------------------------------------------------
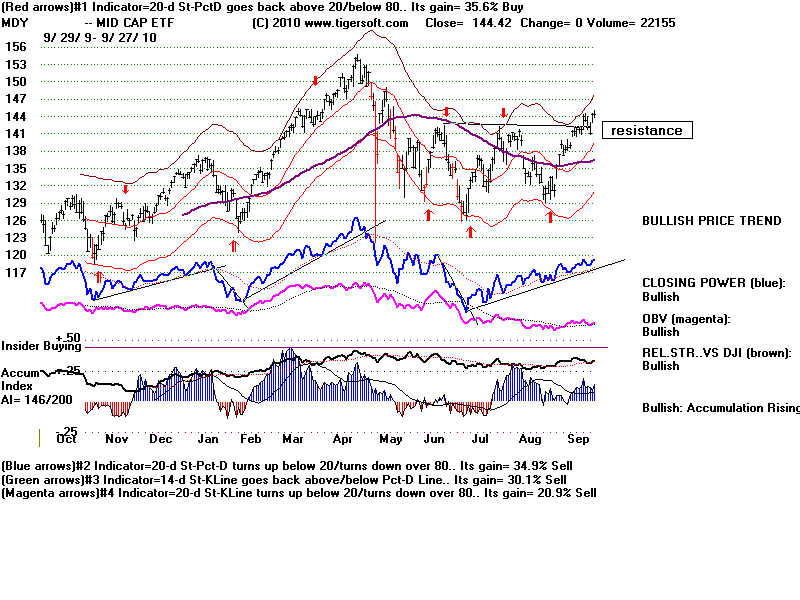
9/29/2010
PEERLESS REMAINS ON A BUY. The Market Rallys because It Foresees Gridlock.
The ratio of new highs to new lows bullishly remained over 10:1, on the NYSE (107:5)
and on the NASDAQ
(67:7). MAXCP stocks numbered 262 while MINCP stocks show
only 26 today,
Among the bullish MAXCP stocks, NTCT rose and shows an IP21
greater than +.50
and a recent Buy B12; TUR (Turkey ETF) has bullishly broken its rising
resistance line;
TTM (Tata Motors) has bullishly broken its rising resistance line;
AZO (Autozone
230.56 +2.36) and NXTM (19.4 +.32). These are the best momentum
plays now.
If you like trading range stocks, use the STOCH5 stocks, and know that
93 are on Buys
and 153 are on Sells. I would still use trend-breaks in CLosing Power
to clinch any new
Sells, like EPAY, MIR, PAG and SID. Significantly, the Tiger Index
of these Trading
stocks shows them to be on the verge of a bullish breakout and
77% of them are
now above their 65-day ma.
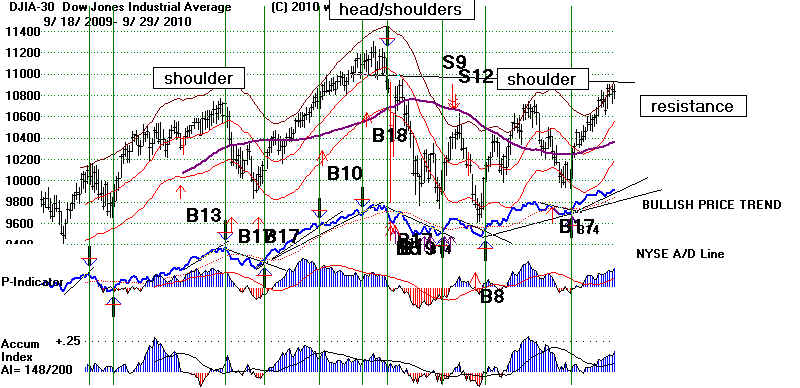
Today the DJI did fall back a little from the neckline from the head/shoulders pattern
of April.
But we still have no Peerless Sell, the NYSE A/D Line is rising and the
Closing Powers
for the ETFs are
still rising. I have shown that historically strong Septembers are very likely
to be followed by
a very good October. The weakness in the Dollar has made US
stocks look cheap
to foreigners; at the same time, the record low interest rates
are forcing US
investors out of money markets and CDs and into stocks.
While Gold and foreign ETFs are
very strong, Crude Oil is not. And as long, as Crude Oil
does not breakout
and accelerate up, I would bet that the FED will stick to its low
interest
rate policies and continue to buy Treasuries with money it
creates/prints. That view is
consistent with
the continuing strength in the bond market and utilities.
There is some dissent
within the Fed about its buying US Treasuries, but most
political
economists see that necessary, so long as Democrats and Republicans neither
lead nor get
along well enough to govern. In my opinion, the Fed is now the main
barrier
preventing another market melt-down and Depression. Some inflation
is infinitely
better than a Depression. I think the Dollar will not collapse. There is
simply no
alternative to it presently in international trade.
The Gridlock Rally
Frozen, standstill, grid-locked government seems to lie ahead. The stock
market may be
celebrating this likely political scenario before the November
Election.
The reality and cost of political gridlock are not yet factored into the
market.
Will the US Constitution permit real and new economic leadership?
The truth is that
the "checks in balances" in the US Constitution and the undemocratic
Senate have
always worked against most new economic leadership and change.
Federalist Paper
author Alexander Hamilton's distrust of
Democracy is particularly clear.
Democratic change
would have been much easier to achieve in a parliamentary system.
But the founding
fathers replaced the Declaration of Independence's phrase "life,
liberty and the
pursuit of happiness" with "life, liberty and property". I
complain
about the
Senate's plutocratic ways. But the Senate's rule by 60% instead of a
simple majority
simply reflects the deliberately non-democratic character of the US
Constitution.
Republicans are right. We have a Republic where wealth was always
supposed to be
protected and treated specially. Checks and balances and the Senate's
undemocratic
makeup and 6-year terms were designed by James
Madison to prevent quick
changes
that might threaten the power and privileges of the wealthy. If you believe
as I do that too
much wealth in the hands of the few is a danger now to the economy
and the stock
market, just as it was in 1907 and 1929, then the Fed and Bernanke
are doing the
only thing they can to try to prevent another Depression, namely -
print lots of
money. Since the FED's cheap money policies in a Severe Recession go seem
to boost the
stock market while doing little to bring about fulll employment, it may be
that four to six
more years of very high unemployment may be necessary to create
the anger and
impatience needed to allow a much stronger political leader to come
to power in
Washington, in the vein of Teddy Roosevelt or Franklin Roosevelt.
DJIA and Peerless Signals/A/D Line Trend-Breaks
 SPY (SP-500 ETF)
|
 TigerSoft and Peerless Daily Hotline