TigerSoft New Service
10/11/2010
TigerSoft New Service
10/11/2010 Make Money. Use TigerSoft To Track Key Insider Buying and Selling in All Your Stocks
www.tigersoft.com PO Box 9491 - San Diego, CA 92169 - 858-273-5900 - william_schmidt @hotmail.com
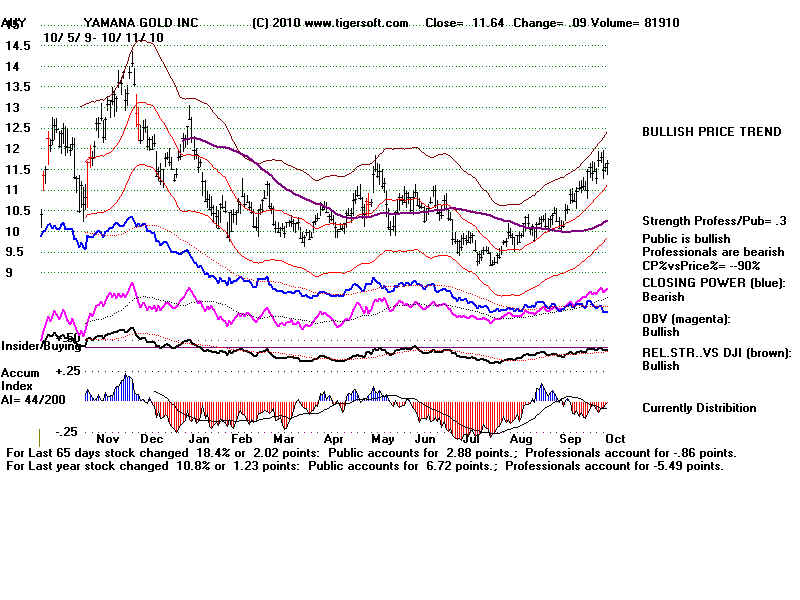
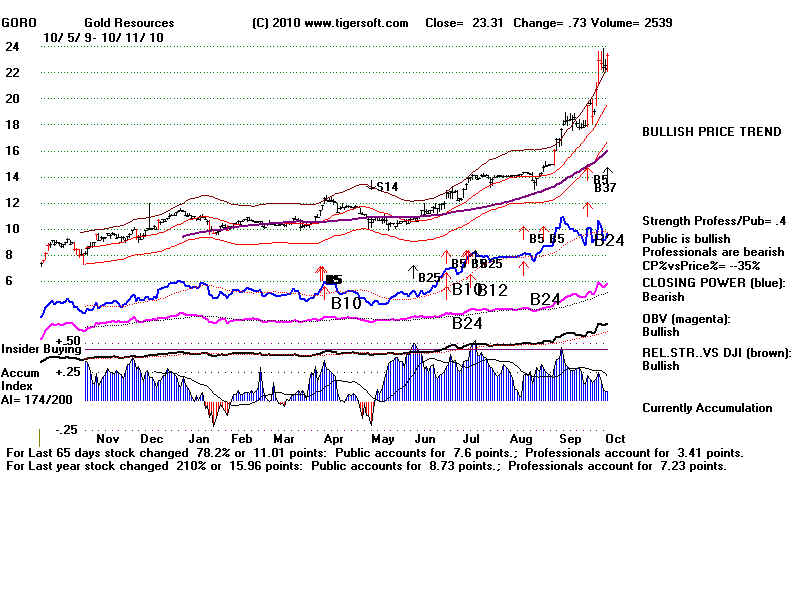
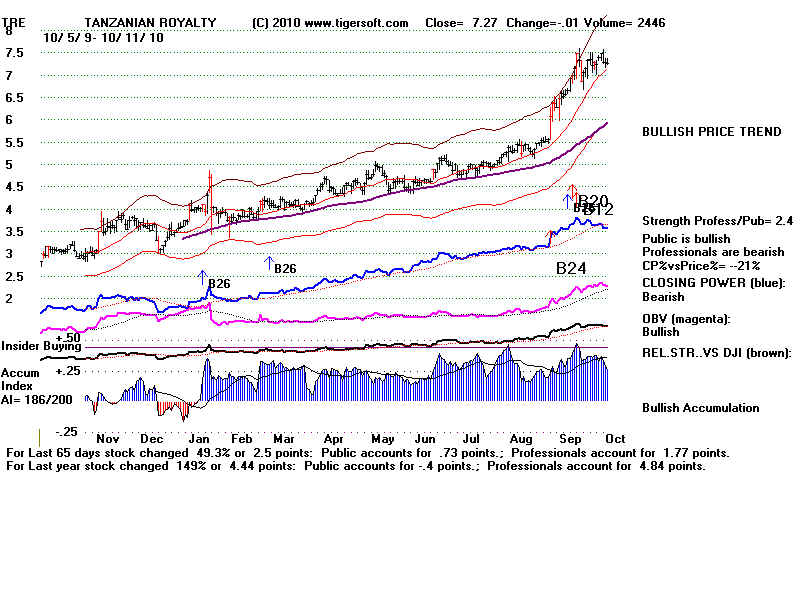
is a domestic gold stock without the threat of nationalization.
We found and recommended it at $10. Billionaire George Soros
was buying it at the time.
2009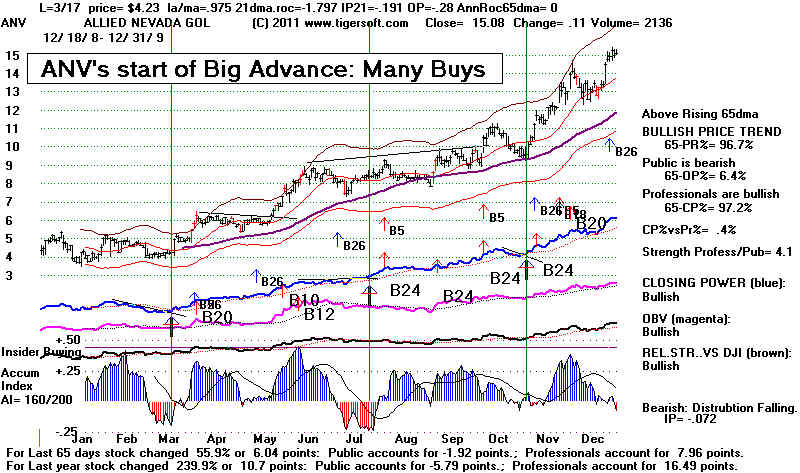 |
2010 |
2011 |
What Does It Mean When Gold
Stocks
Lag
Rising Gold Prices?
by William Schmidt, Ph.D. of
www.tigersoft.com (C) 2010 All Rights Reserved.
Insider and
Professional Buying Distinguishes The Best Gold Stocks
from The Worst.
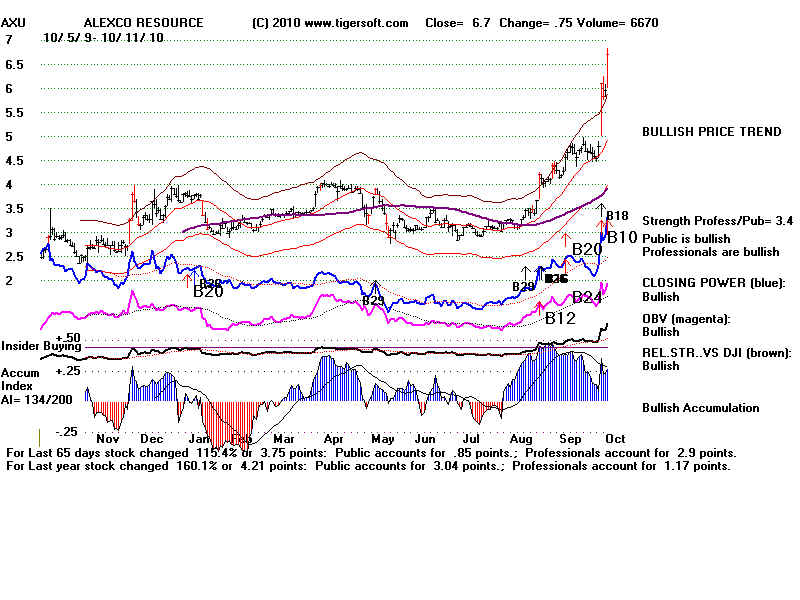
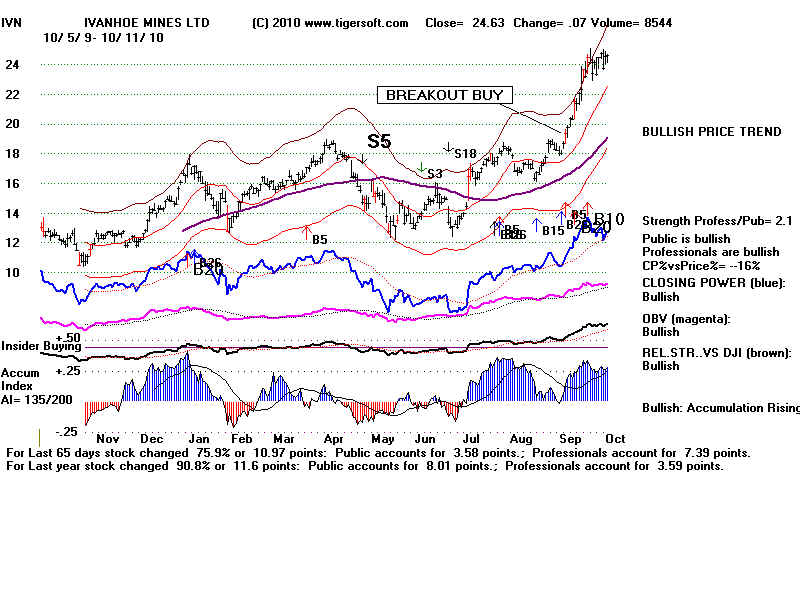
The very best
performing Gold stocks all have one unique characteristic. They show insider buying
as TigerSoft measures it. In addition, in the
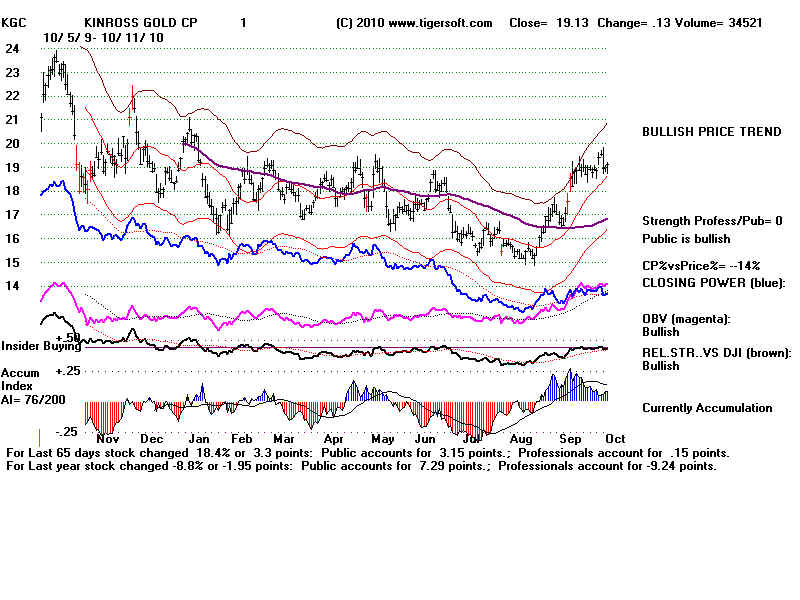
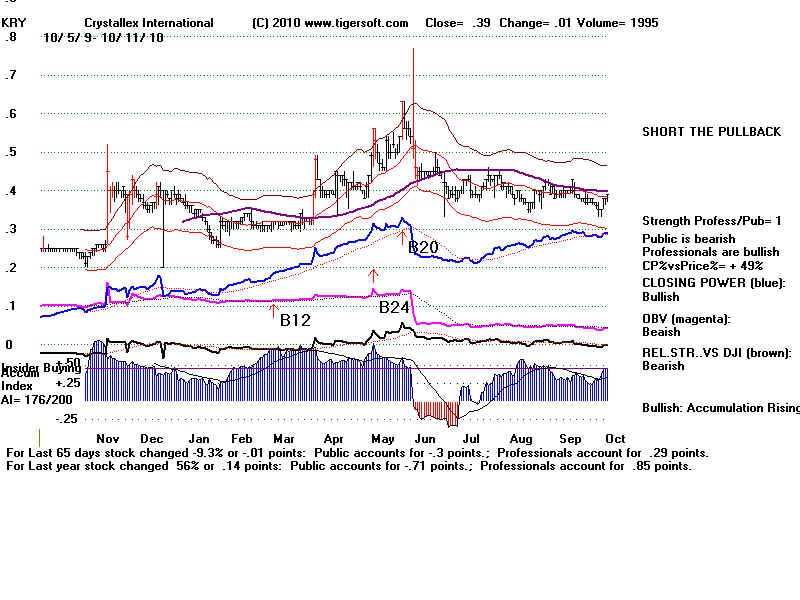
very worst performing gold and silver stocks, Professional
Selling becomes more powerful and pronounced than
Public Buying. Tiger's Closing Power falls
faster than Tiger's Opening Power rises. In
these ways, the best and worst gold stocks were and are easily
distinguished. Go to the bottom of this page to
see the best and the worst.
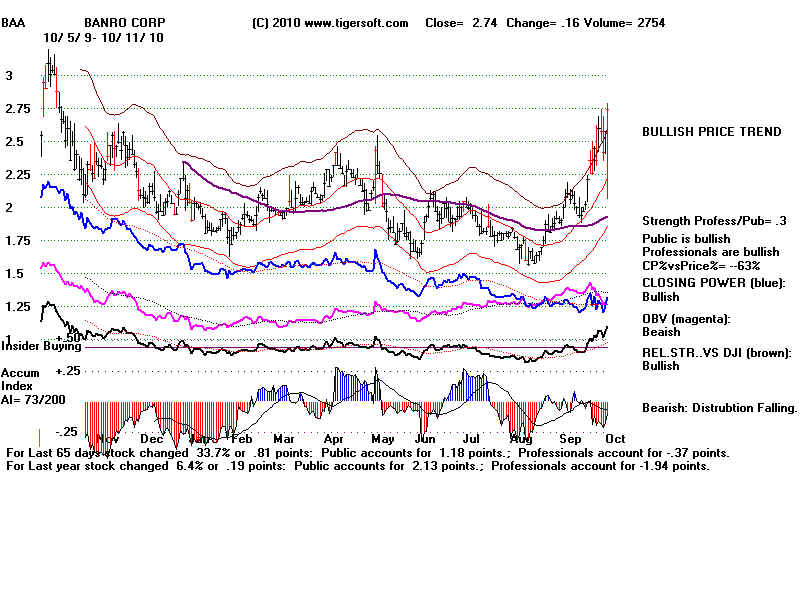
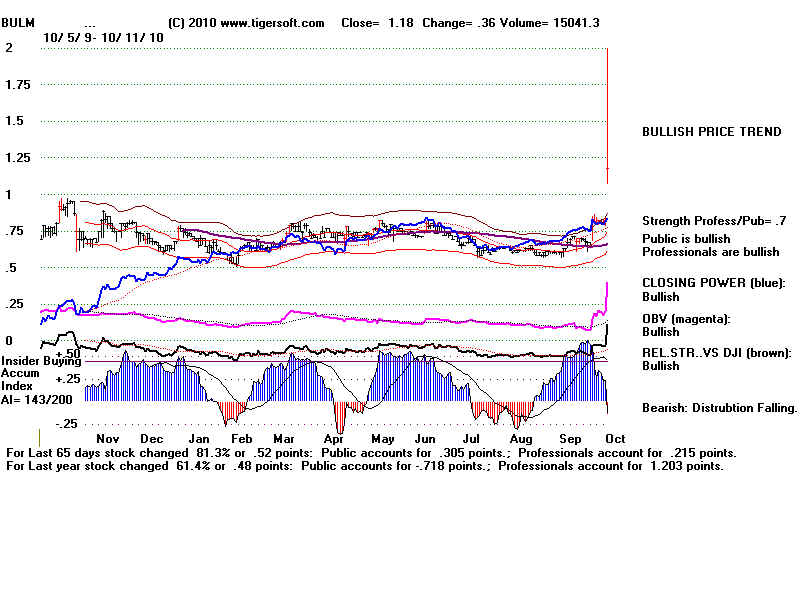
Very High Accumulation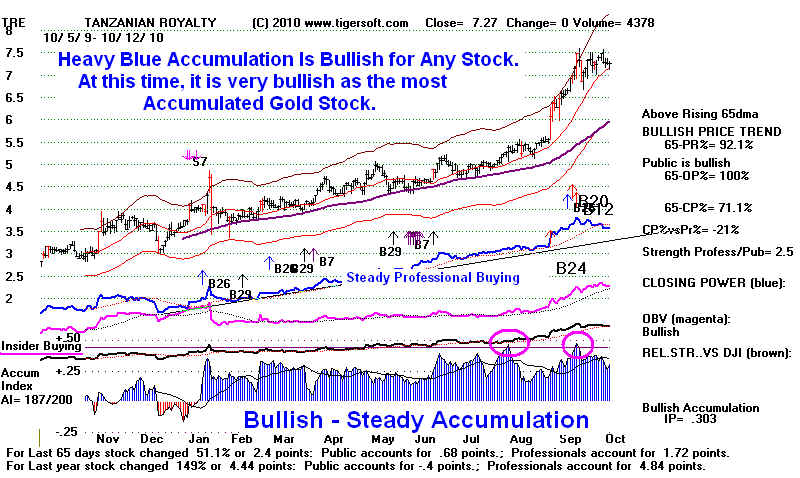 |
Low Accumulation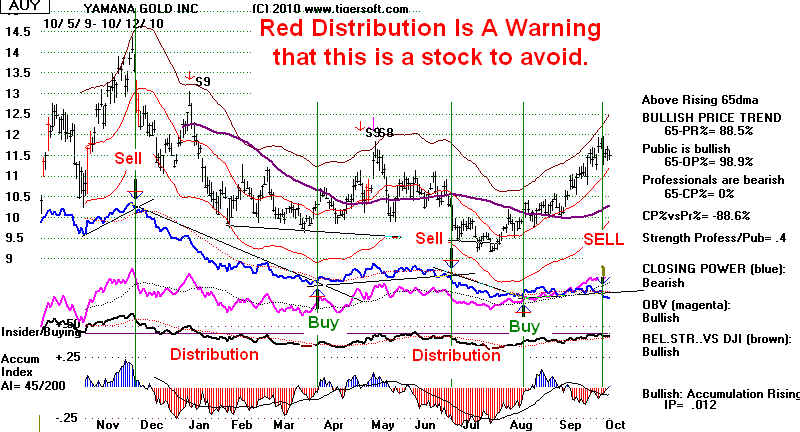 |

Lagging Gold and Silver Stocks
Why is Gold making new highs while some gold stocks are lagging? One might simply
think that because the costs of production are assumed to be fairly constant, a big rise in
prices would almost all go to the bottom line and make for much bigger profits. While things
are more complicated and each mining company is different, in general, rising fuel, labor, environmental
amd bribing costs are much in evidence while, at the same time, the mined ore is of lower
and lower quality and the mines must go deeper and deeper into the earth.
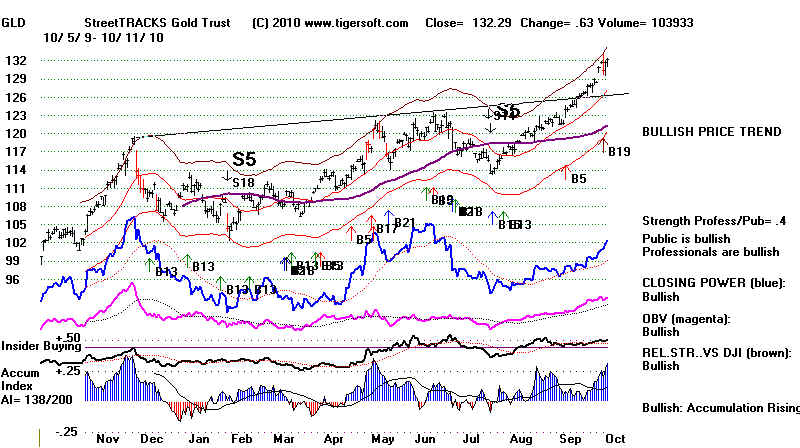
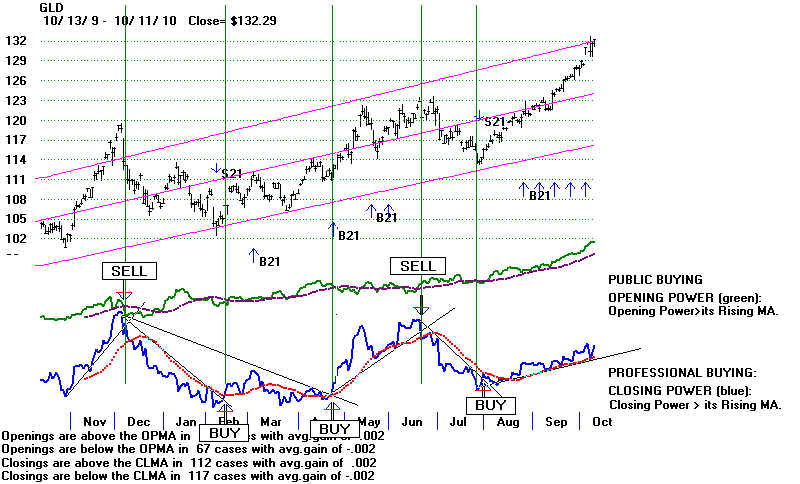
First, here is the chart of GLD, the ETF for Gold. It is above its rising resistance line and
running in all-time high territory. The Public and the Professionals are "Bullish". All the
intenral strength indicators are rated "bullish". Not shown here, the SLV chart looks
just as good, if not more so.
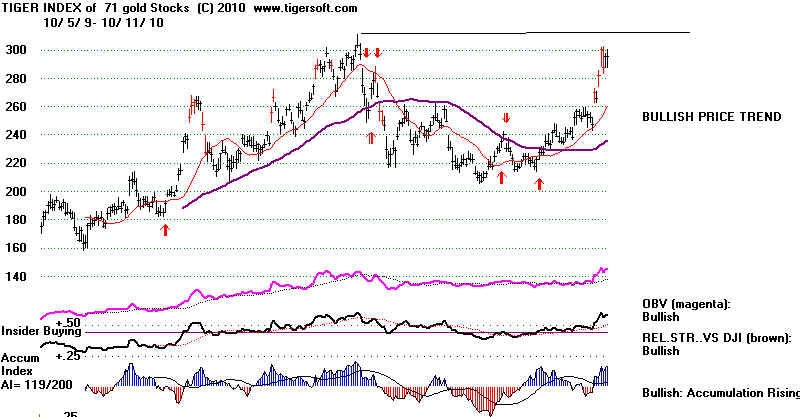
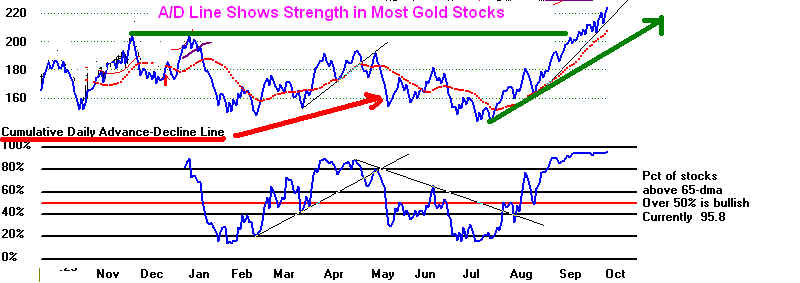
Second, here is the Tiger Index chart for 71 Gold and Silver stocks. It has recently been strong,
but is not making new highs. This index is weighted by volume. Some of the biggest gold
stocks are lagging. Some smaller, more leveraged mining stocks are generally doing very well, judging
from the fact that the Line showing the Gold Stocks' Advances minus Declines is making new highs.
Gold stocks are much more volatile than gold or its ETF, GLD. The smaller the gold stocks,
the more volatility. Even the biggest Gold Stocks like ABX and NEM rise and fall faster than gold.
In part, this is because they must use leverage, as when they launch new mines that take years
to bring on line. If gold prices fall appreciably after they have committed to investing in new operations,
their stocks fall more quickly than Gold, since the mining stocks can lose millions and millions when
the expected break-even price of Gold is broken below. Knowing this, Gold mining companies
hedge by trading Gold futures and locking in what look like favorable prices. If Gold prices rise far
above the prices they have locked in with their hedging, their stocks will lag Gold on the upside.
That may be true for some of the biggest, more conservative Gold stocks.
Gold mining shares have added volatility because each mine has its own problems and potentials.
Underground mines can flood in the Spring (Idaho silver mines) or have electrical power problems
(as in South Africa). Nationalization is a threat in less stable countries. TigerSoft helps here. Example:
Insider and Professional selling can be seen in NEM in 2006 before its Central Asian mines were expropriated.
As gold prices rise, populist politicians will surely want a larger share of the revenues, when they see the
extraordinary profits that sharply higher gold prices bring foreign companies. As lesser developed countries
see their incomes rise, natives of these host country start to appreciate the environmental dangers of gold mining.
The costs of improving mine safety and reducing dangerous ground-water and environmental contamination
from gold mines are always rising. So, does the cost of bribing politicians.
See "THE ENVIRONMENTAL COSTS OF GOLD MINING ARE VERY HIGH."
http://www.tigersoftware.com/TigerBlogs/02142008/index.html
The conclusion is that Gold Stocks must always rise and fall at rates different than Gold Prices.
Watch The Insiders and Professionals To See When To Sell
And all this leaves out, the ways in which Gold stocks are manipulated by market makers, specialists
professional touts, as well as big hedge-funds. The Pros have insider information and they take the pulse
of the market every day. NEM's biggest drops have come after steady selling on strength by insiders. We
register this when we see lengthy periods of negative (RED) distribution from our own TigerSoft
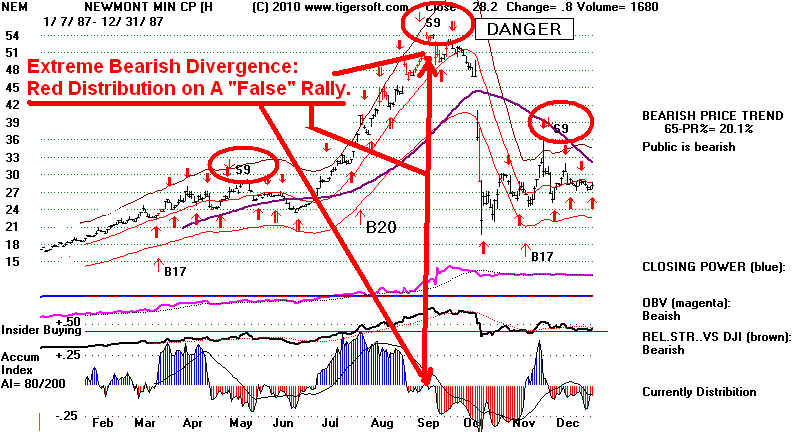
Accumulation Index, especially as the stock makes "false" highs. Major Sell S9s from TigerSoft
(not our Peerless S9s) gave ample warning of trouble. See the S9s of October 1987 and 2007.
SELL S9s from TigerSoft Forwarned of 1987 and 2008 Declines.
WATCH THE PROS TO SEE WHEN TO BUY
Insiders know best. Always look at Tiger's invention, the Tiger Accumulation Index.
Lengthy and intense Blue Accumulation shows that insiders expect much higher prices.
Months of Red distribution is a warning that insiders know some reason to sell. Usually
that is what we should do.
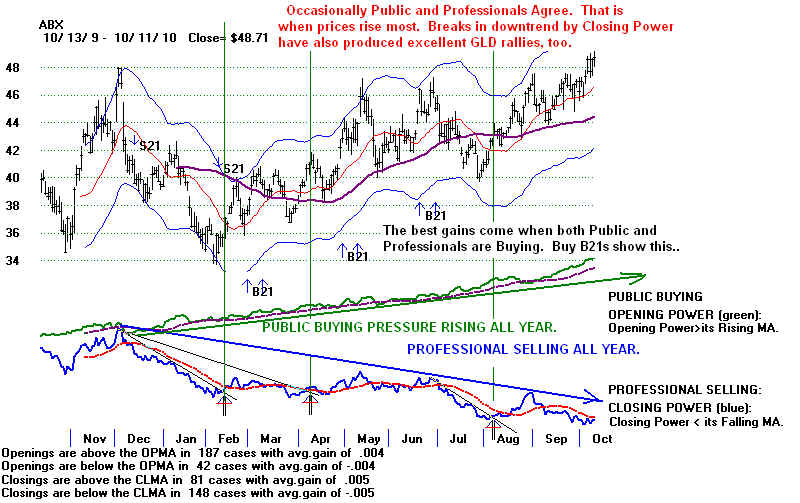
We also watch for times when Professionals turn bullish and when both Opening (Public Buying)
and Closing Power (Professionals) are rising. These two cases bring the best gains, especially
where there is heavy Blue Accumulation. The B21s show when both Professionals and the
Public are bullish. The vertical lines in the chart of GLD below show when there were trend-breaks
in our key Closing Power indicator.
In 2008, a huge general financial market liquidity collapse occurred. Everything declined, even Gold bullion.
NEM fell a relatively small 60% from its 2007 peak. Smaller mining stocks lost 75% or more. Hedge funds
had to raise money any way they could. You can see in the links below how the TigerSoft tools helped spot
the heavy insider and Professional selling that signalled the collapse.
October 18. 2008 The Rise and Fall of Commodities' Hedge Funds
Pump and Dump - Oil, Silver, Gold, Corn, Wheat - It's All The Same.
Systemic Failures: The "Free Market" Is Too Expensive.
Causes of the Crash of 2008.
September 4, 2008
How To Trade Silver (SLV) and Silver Stocks ( PAAS and SSRI ) More ProfitablyOverseas and Public Buying Can Outweigh Professional Selling
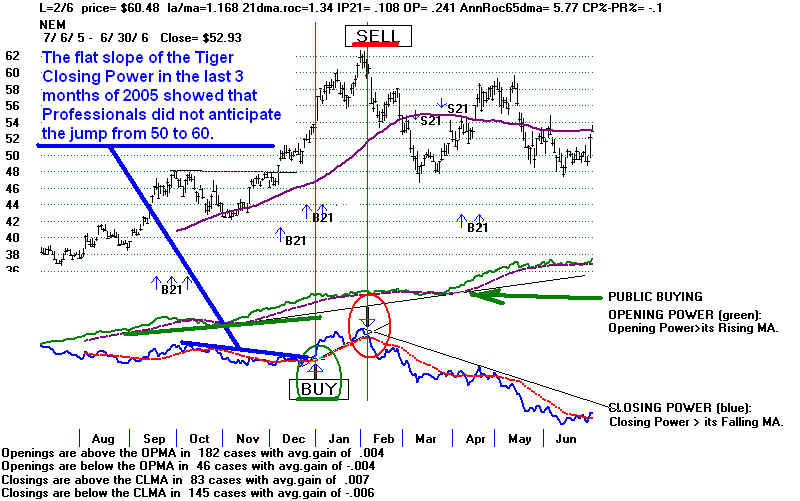
The Public is, by no means, always wrong. Public and overseas buying can overcome professional selling
in the short-run. What usually happens in this case is that professionals do not stubbornly demand that prices
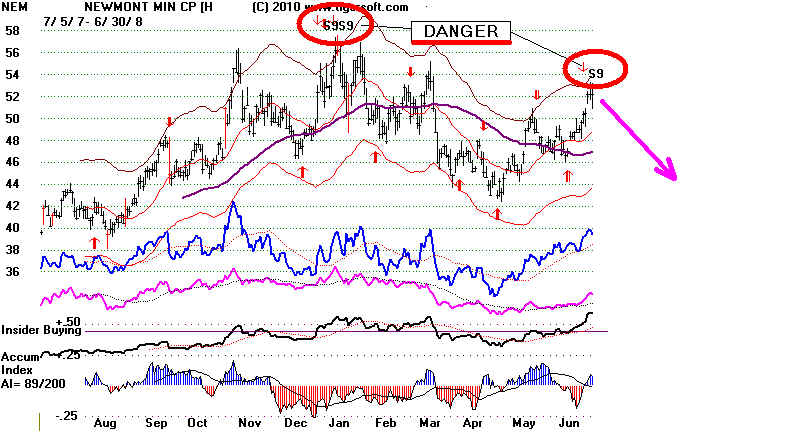
fall below their SALE prices. Instead, they buy aggressively. They did this in January 2006 when they
realized that they had been wrong about NEM's next big move. Unlike the Public, as measured by Opening
Power, they became sellers after the stock peaked at 61. That is where the blue Closing Power uptrend
was violated. Whereas the Public kept buying all the dips, Professionals were net sellers. The pros were
proven right this time, as the stock remained soft and later in 2006 broke down to 40.
Our job at TigerSoft is to discern what Professionals are doing with Gold stocks. Their behavior is
very different than overseas buyers or members of the public. They are usually correct, but not if
they fight powerful waves of public speculation. Right now the price moves of ABX (the world's biggest
gold mining company) and NEM (the second biggest) are dominated by PUBLIC buying overnight.
Professionals are much more cautious. We readily see this in the TigerSoft charts for ABX and NEM.
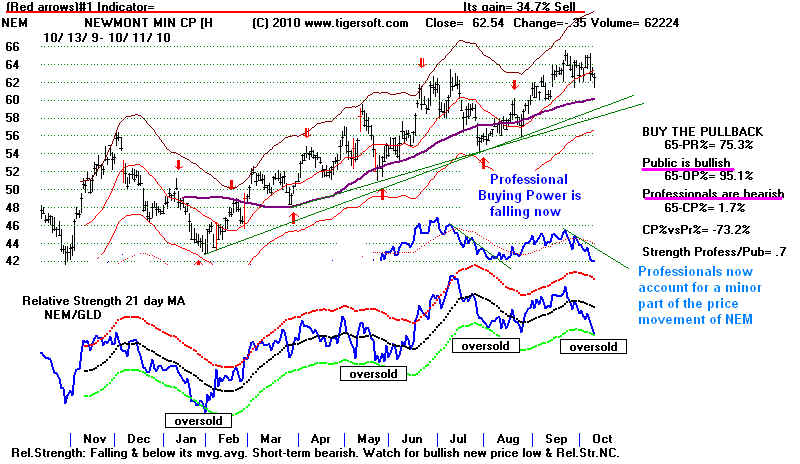
RELATIVE STRENGTH OF NEM versus GLD (See the third chart below)
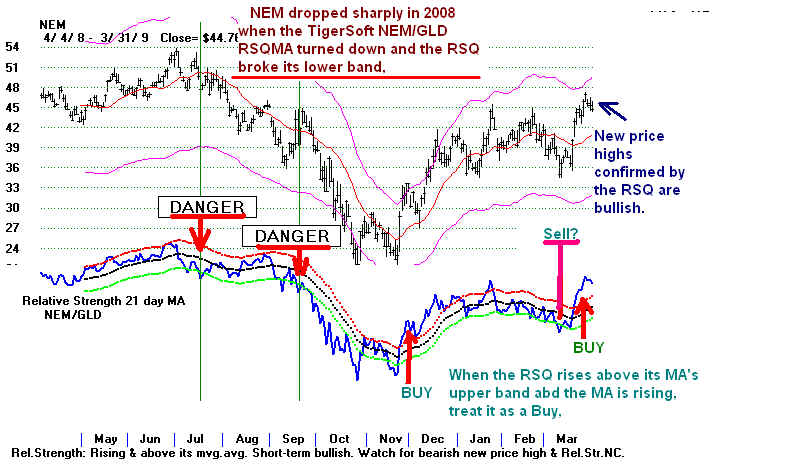
Is the current weakness of the NEM compared to Gold (GLD) a warning that there may be a bigger
decline? A simple and effective approach is to compare the prices of NEM and GLD with what TigerSoft
calls its Relative Strength Quotient (RSQ). This simply plots the daily price - quotient of NEM/GLD. Moving
averages and percentage bands are used. When the RSQ-MA turns down with the RSQ below its
lower band, we should be very cautious. As long as the RSQ lower band hold and the RSQ-MA does
not turn down, the odds favor a good rally by NEM after the RSQ lower band has been reached. You
can see this in the NEM charts of 2008-2009, 2009 and 2009-2010.
NEM and The TigerSoft NEM/GLD RSQ in 2008-2009
NEM and The TigerSoft NEM/GLD RSQ in 2009
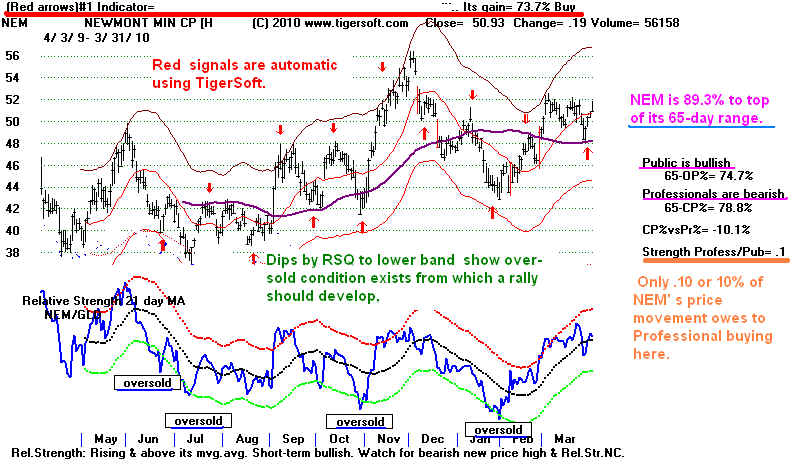
NEM and The TigerSoft NEM/GLD RSQ in 2009-2010
The NEM RSQ is at its lower band and the RSQ MA is still rising. That suggests a rally should
take place unless the RSQMA (moving average) turns down. The most bullish development
will be for Professionals to change their ,ind and start buying. That will take a break in the
downtrend of the recent blue Closing Power downtrend. This is a distinct possibility, given
the strength in Gold in 2010 at this time and NEM's recent all-time high breakout past
the 62-63 resistance.
When TigerSoft's Accumulation Index at the bottom of a chart shows
high and steady Blue Accumulation, it means INSIDER BUYING. The
opposite is INSIDER SELLING.
Compare the levels of Accumulation at the bottom of each chart.