 TigerSoft and Peerless Daily Hotline TigerSoft and Peerless Daily Hotline 
(C) 2010 William Schmidt, Ph.D. www.tigersoft.com
All rights strictly reserved.
===> The
HOTLINE ADDRESS CHANGES TUESDAY NIGHT.
LOOK FOR ITS NEW IP ADDRESS FROM US Monday.
===> Order form to Renew On-Line,
"Nightly Peerless/TigerSoft Hotline " ($298)
TigerBlogs for Hotline Subscribers
Overnight Market
Action:
Bloomberg Futures around
the world before the US Markets open.
CNN Futures before the Opening in NY
24-hour Spot Chart - Gold
24-hour Spot
Chart - Silver Dollar and Currencies
Daily NYSE and NASDAQ New Highs.
| CURRENT
STATUS: KEY ETFs, Signals. Closing Power and A/D Line Trend
9/27/2010
Closing Power:Opening Power
UU = Both up. (initially reliably bullish)
DD = Both down (initially
reliably bearish)
UD = Opening Power up, Closing Power Down (bearish)
DU = Opening Power Down, Closing
Power Up (bullish)
Blue = Bullish Red = Bearish
Click Index Symbol Automatic
Closing Power
Pct of Stks over Opening Power
To See Graph
Signal
Trend
over 65-dma Closing Power
---------------------------------------------------------------------------------------------------------------------------------------
.
DIA
Red
Sell CP is rising
UU Bullish
DJIA-TGR-Index Red
Sell A/D Line broke uptrend
77% (-no change)
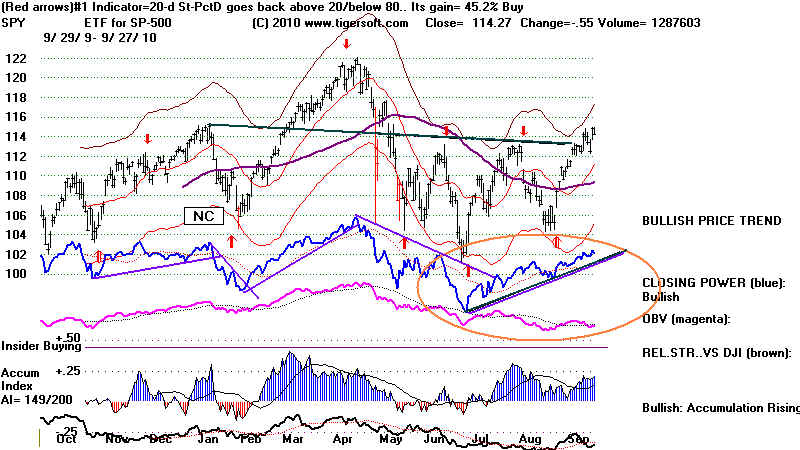
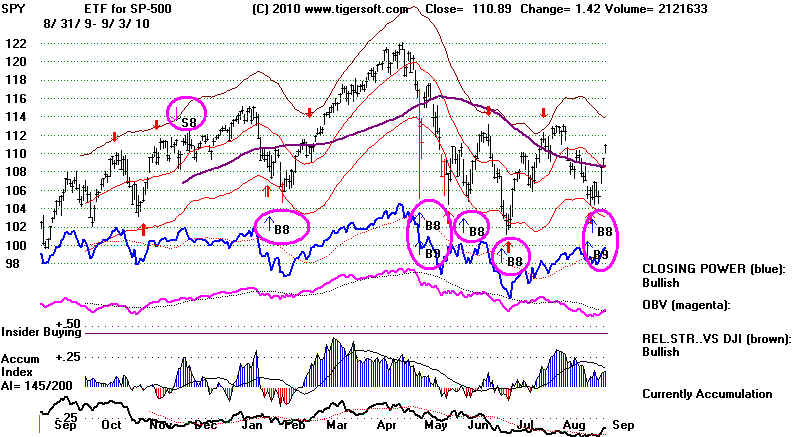
SPY
Red Buy CP is rising
UU Bullish
SPY-TGR-Index Red Sell A/D Line uptrend has been broken. 82% (-2%)
QQQQ
Red Sell CP is rising.
UU
Bullish
QQQQ-TGR-Index
Red Sell
A/D is rising.
83% (-4%)
QQQQ-10-TGR-Index Red Buy At Rising A/D Line
60%
(-no change)
Russell-2000 IWM Red Buy
CP is rising.
UU Bullish
Foreign ETFs
Red Buy A/D Line uptrending.NH 100% (no change)
Home
Building
Red Sell
A/D Line broke uptrend
78% (+4%)
Finance
Red Buy A/D Line
downtrending
49% (-9%)
5 buys / 6
sells 6 buys 5 sells 10 buys -
1 sells
> NASDAQ 2369 -12 la/ma=1.047 (over-bought)
NASDJI positive AI (IP21)
=.25 >21-dma
> MDY Midcaps Red
Buy CP is at its rising trendline. UU
Bullish
> GOLD STOCKS Red Sell AI-NNC-Stock S9 A/D Line rising. SLV
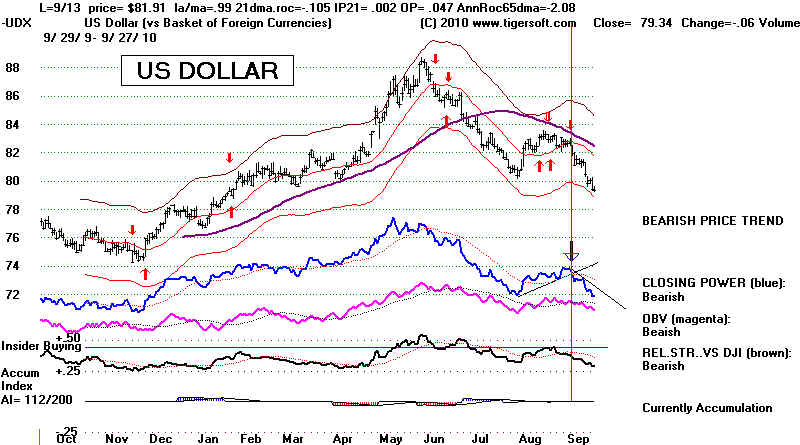
> DOLLAR Weak Red Sell CP downtrending.
> TEN YR INTEREST RATES Red Sell (LOWER RATES) CP downtrending. |
9/27/2010 Peerless
Remains on A Buy.
The
DJI's last hour 60 point sell off comes after a rise of 8% in September, one of the best
on record. The CLosing
Powers for the DIA, QQQQ, SPY and IWM are still rising.
Until the Closing Power
uptrends are broken, only a shallow retreat can be called for here.
Foreign
ETFs are very strong because an economic recovery is taking place outside the
US. The weak Dollar
will help US companies make sales overseas. The FED shows
no signs of preferring a
strong Dollar to keeping interest rates low and using its printing
presses to buy Treasury
bills. Fighting the FED is not advisable. However, Gold
and Silver are
falling sharply overseas
right now. That could mean interest rates are going to turn up.
That would be bearish. But,
as of the close on Monday, interest rates and the Dollar
are in
falling trends and that is bullish for stocks.
WARNING FOR SHORT TERM TRADERS
If the Closing Powers are
violated tomorrow, the rally may start to unravel enough for a decline
that would take the DJIA back
to its lower band or the more important support at
10000.
1)
Extra downside volatility is definitely a factor this year.
2) Dullness and low volume
after a rally in the major market ETFs is often bearish.
3) Once resistance has been
established in a trading range, prices usually have to fall
to the basic support zone.
That would mean a decline to 10000.
4) Last
Friday, we did see the third A/D NC (non-confirmation of a price new high) and/or
a Peerless Sell S13 on the present
rally. Three such instances wasenough to bring a decline
to the lower band on the last
three run-ups to the upper band,
ONLY
A SHALLOW DECLINE
Fortunately, a steep October
retreat is not likely without a Peerless Sell. If we did get a Sell S9
or S12, a big October decline
would then have to be predicted, because of the sell-offs of 1978, 1979,
1987, 1989, 1994 and 1997.
But presently the P-Indicator and V-Indicator are very positive.
Another technical condition
that is missing is a non-confirmation (NC) by the Clowing Power
of an SPY new high.
These are common at more important tops.
A strong September usually
means an up-October. Since 1929, when Septembers saw
the DJI rally with a rising
A/D Line, the market was much more likely to advance in
October than fall by very
much. There were 20 cases when the DJI rose, at least, until
October 26th, after a strong
September, when the DJIA and the NYSE A/D Line both rose.
There were only 3 cases of
steep declines in this situation below the lower band in
October. In additon,
there were just 2 cases where the DJI did fall, but only to the lower band.
Note also the 4 cases, in
which the DJI fell in October to a low half way between the 21-day ma
and the lower band
(1954, 1970, 1983 and 2009 after a rising September.
If we are take as significant
only the declines down to at least the lower band in October,
then we see just 5 cases.
This suggests the odds are 19 to 5 against a significant October
decline given September's
strength. This should make us trust Peerless if we are intermediate-term
traders. Short-term traders should, however, become bearish if the Closing Power
uptends are
broken.

==============================================================
9/24/2010 Peerless Remains on A Buy.
The DJI jumped 198 on Friday
on rising volume. The head and shoulders pattern that has
been scaring traders since June has
now become too distorted by the September rally to
be tenable. That should bring
more short covering. Though the recovery high was not confirmed
by the NYSE making its own high,
the internal strength indicators are too strong to give a
Peerless Sell. There were
exactly 2000 more up than on the NYSE. There were a bullish
124 on the NYSE and only 4 lows and
on the NASDAQ there were 100 new highs and only
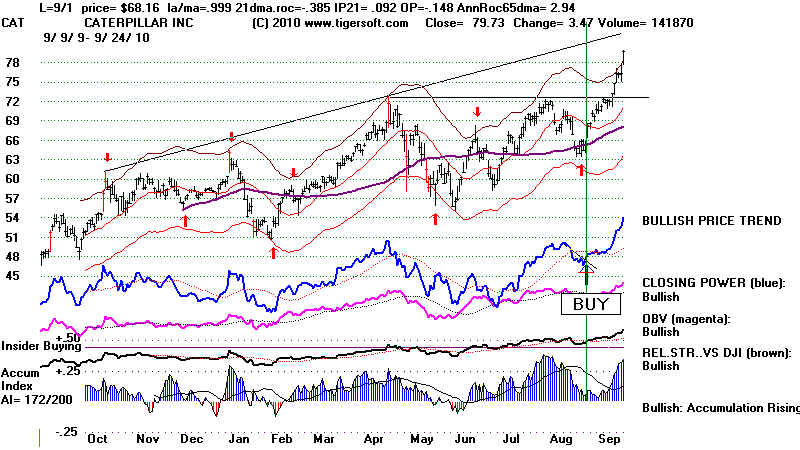
12 new lows. CAT, the highest AI/200 stock in the DJI-30, was its biggest gainer, up
4%.
IBM has been building a base just
below 134 for nine months. Its recent bulge of Accumulation
and CP confirmed breakout on Friday
should move up nicely from here, making 135 October Calls
appealing.
CAT (highest AI/200 stock in DJIA) and IBM (breaking out)

Bank/financial
stocks, like BAC, MBI and LM did particularly well. But much more
impressive, no less than 87% of the
NASDAQ-100 stocks are above their 65 day ma. With
both the Opening and Closing Power
bullishly rising for the DIA, QQQQ,
SPY, MDY and IWM,
it seems likely that their
March-April peaks will be reached. True, the SPY, now at 114.82, must
surpass 118, the broken
neckline-support in the quick March-April head and shoulders
pattern. As we approach the
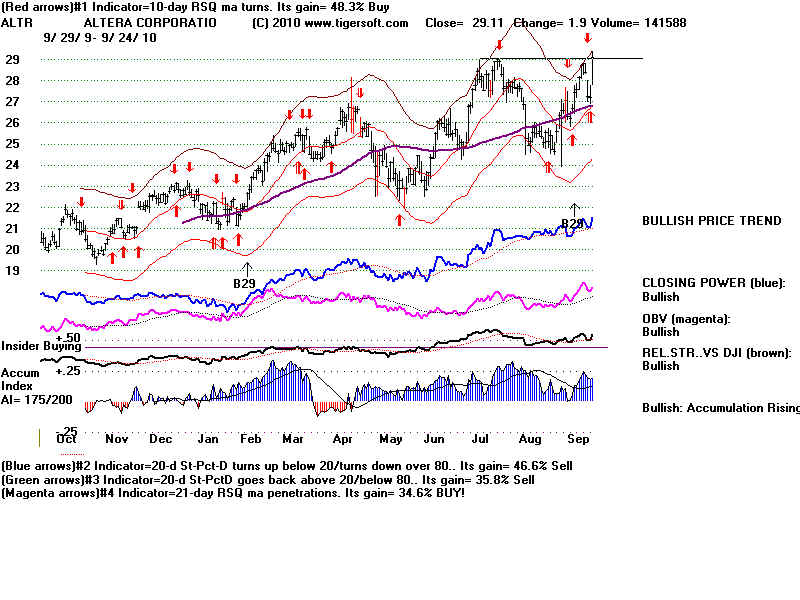
end of the 3rd quarter,
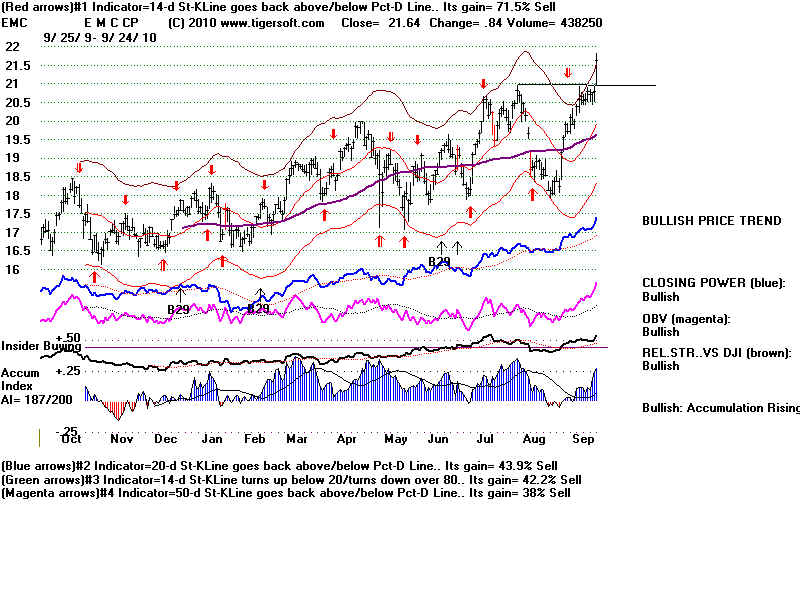
Tiger Tahiti system traders should
appreciate the high AI/200 score of ALTR in the
NASDAQ-100 and EMC (AI/200=187) in
SP-500. Both are in the process of making
bullish flat topped breakouts.
ALTR
 |
EMC
 |
Foreign ETFs are the
strongest sector, as hot
money flees the weakening Dollar. Their strength
begs the question of how much a tax
cut for the very wealthy will help American businesses.
With all the political backbone of
a one-celled protazoa, the Democrats have postponed
a vote on this important issue
until after the Election.
CHN - China Fund shows
intense insider buying in July and August and displays
a Closing Power maming 12 months
highs. GCH - Greater China looks equally impressive.
IFN recovered nicely on Friday.
You can see in its chart how a Closing Power new high
in June was the tip-off that there
would be a substantial run here.
====================================================================================
9/23/2010 Peerless
Remains on A Buy.
THE CUMUL. NYSE A/D LINE HAS NOT REGISTERED A BEARISH DIVERGENCE
ON THIS ADVANCE. IN 23 MARKET TOPS SINCE 1929 A BEARISH A/D
LINE
NON-CONFIRMATION (NC) OCCURRED ALONG WITH A PEERLESS SELL. IN ONLY
FOUR CASES, WERE THERE IMPORTANT TOPS WITHOUT AN A/D LINE
NC AT THE TOP. AND EACH OF THESE HAD A PEERLESS SELL. SO, THE
ABSENCE OF A PEERLESS SELL AND AN A/D LINE NC SHOULD MAKE US
DOUBT THAT A SEVERE DECLINE IS ABOUT TO OCCUR.
IF THE CLOSING POWER UPTREND-LINES ARE BROKEN, WE WOULD
HAVE TO BELIEVE THAT THE DJI'S MARGINAL BREAKOUT AT 10800 WOULD
THEN SEEM TO HAVE FAILED. IN THAT CASE, HAVING TESTED AND SUCCUMBED
TO THE CLEAR RESISTANCE AT 10750, GIVEN THE FLAT TRADING RANGE,
THE DJI WOULD THEN PROBABLY NOT TO FIND MANY BIDS UNTIL IT HAS
AGAIN TESTED THE BASIC SUPPORT AT 10000. SUCH ARE THE DICTATES OF
CLEAR, FLAT TRADING RANGES. THE MIDDLE OF THE RANGE AT THE 21-DAY MA
OR THE 65-DAY MA TYPICALLY HAS MUCH LESS SIGNIFICANCE IN A FLAT
TRADING RANGE. THEY WORK BETTER IN TRENDING MARKETS.
THE STEEP A/D LINE UPTREND HAS NOW BEEN VIOLATED. THE LESS
STEEP SECONDARY A/D LINE UPTREND WILL PROBABLY BE VIOLATED IF
WE CONSIDER THE SIMILAR EARLIER A/D LINE UPTREND-BREAKS THIS
PAST YEAR.
It's pretty easy now to paint the bearish
case: 1) October often brings the scariest declines
and that month's trading lies little more
than a week ahead; 2) the Dollar is in big trouble
and there could be a rush to sell
American Treasury instruments, whixh would drive up
interest rates; 3) US unemployment is
already starting to double-dip. 4) The massive
head and shoulders pattern will surely
bring a big break downwards, 5) Gold's steep rise
always brings a bear market, just to name
a few points.
The solid case can be made, no doubt, for
a bad market break. However, from my vantage point,
we would normally expect a major Peerless
Sell before such a decline. And there just has not
been one. Breadth, the ratio of
advances to declines on the NYSE, has been too bullish.
Very low interest rates has done what
it's supposed to do.
Bear markets almost always begin
after there has been a significant bearish divergence
between the DJI and the NYSE A/D
Line. In other words, market tops since 1928 - which
is when the breadth data starts -
almost always occur when the DJI makes a new high that
is not confirmed by the NYSE A/D
Line mking a new high. And making it still easier for us,
major Peerless Sells and bearish A/D Line divergences call all the
other major tops:
1929, 1930, 1937, 1939, 1946, 1948,
1957, 1959, 1961-1962, 1966, 1968-69, 1973, 1978, 1979,
1980, 1981, 1984, 1987, 1989, 1990,
1998, 2000 and 2007. There were 23 such cases.
See
the 23 charts here.
.
By contrast, there are only 4
exceptions:
1) Jan 1977 (We do see
an S8),
2) Jan 1994 (Here there was
an S4.) 10% decline
3) Sept 1997 (An S12 here.)
4) March 2002 (Earlier S9)
See the 4 charts here.
STOCKS TO BUY AND SELL SHORT
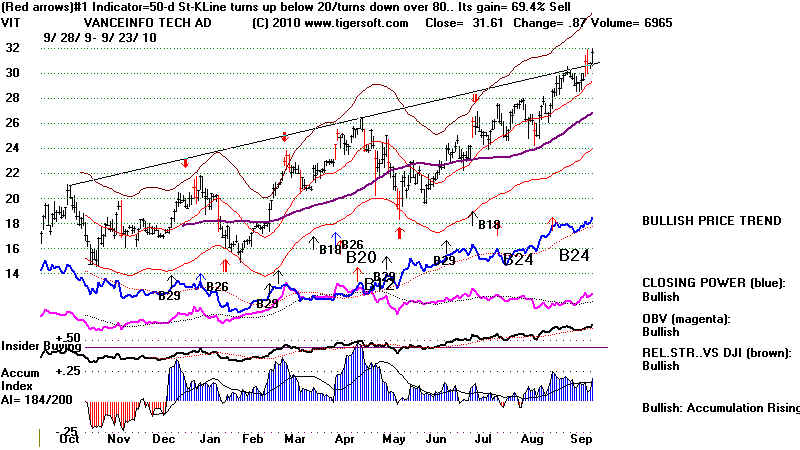
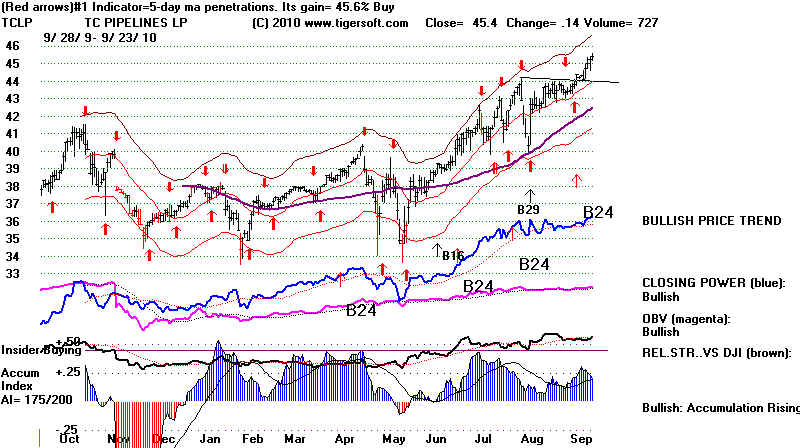
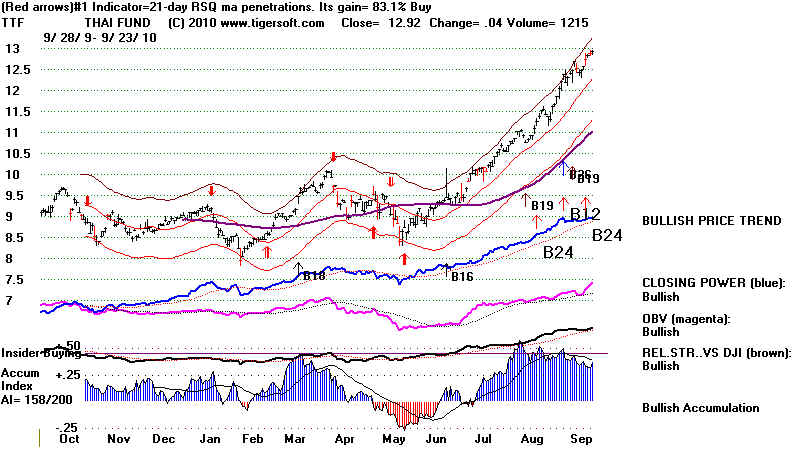
There were 183 MAXCP stocks
tonight, showing that professionals were still very bullish on them.
The most bullish of these with both Opening and Closing Power rising
(UU) were:
AAP, MNRO (Munro Muffler),
EMC. AZO (AutoZone), NXTM, VIT, TCLP, TTF (Thai Fund)
There were 54 MINCP stocks tonight,
showing that professionals were still very bearish on them.
The most bearish of these with both Opening and Closing Power falling
(DD) were:
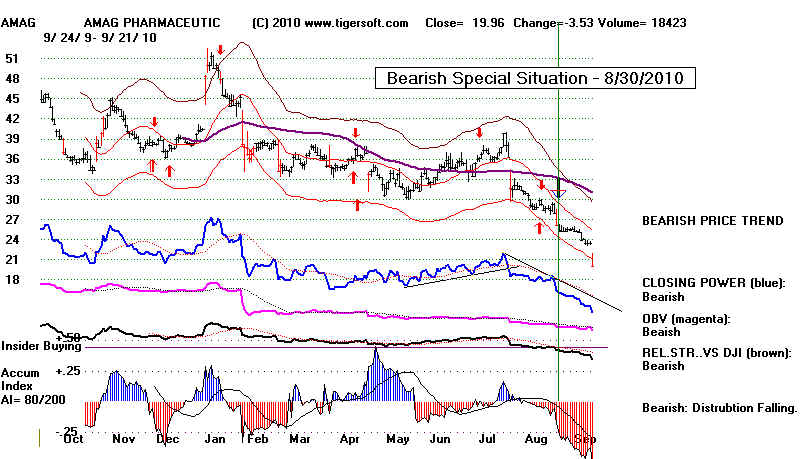
AMAG 18.89 -1.17 and CGA (8.36
-.26). A rising Opening Power will most likely not prevent
the other "bearish" heavy
distribution MINCP stocks from declining further:
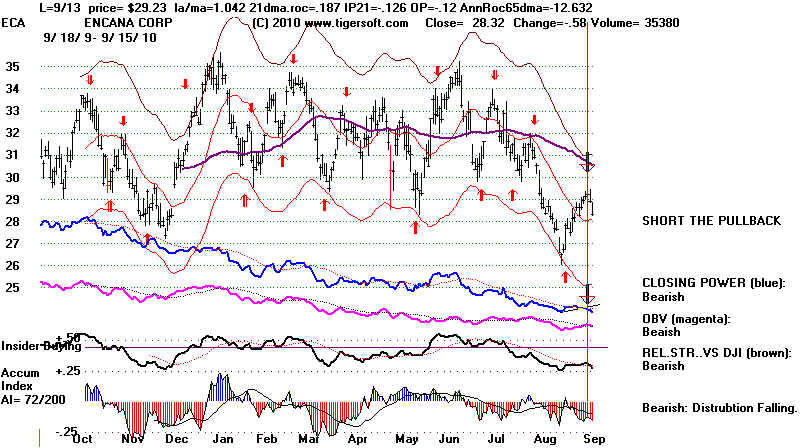
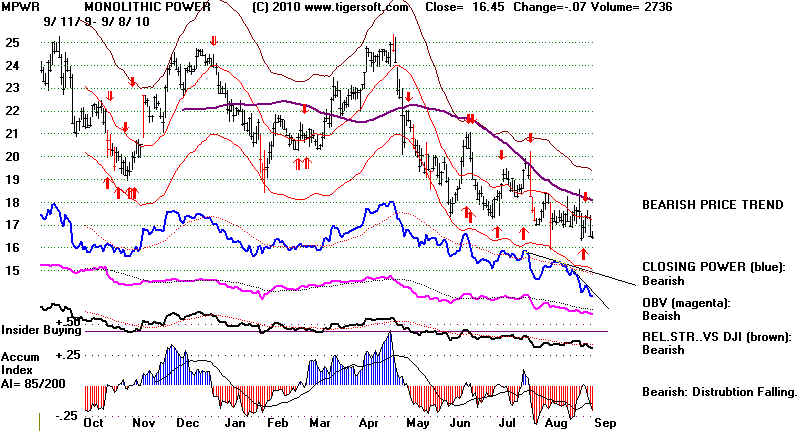
BAC, MPWR, ECA, CFFN, PBCT,
PNFP, BYD,
GOLD AND SILVER NEW HIGHS ARE BULLISH FOR PRECIOUS METALS
====================================================================================
9/22/2010 Peerless Remains on A Buy.
There were some shifts today in the
markets but the DJI's trend is still up. Both the Opening
and Closing Power are still rising
for each of the major market ETFs. This shows a strong uptrend.
Supplemental, added an hour into trading as a response to an email:
A market collapse in October some think is a possiibiity. I do not
see it without a major Peerless Sell. That would take everything down.
In a Congressional Election year that only happened in 1930, 1978, 1994
and those were after clear major Peerless sell signals. The high unemployment
released today still means the FED will keep interest rates low and so the cost of owning
gold
(where no dividend is paid) is low. Central banks raise interest rates to protect
their country's currency. The FED cannot safely do that now with such high unemployment.
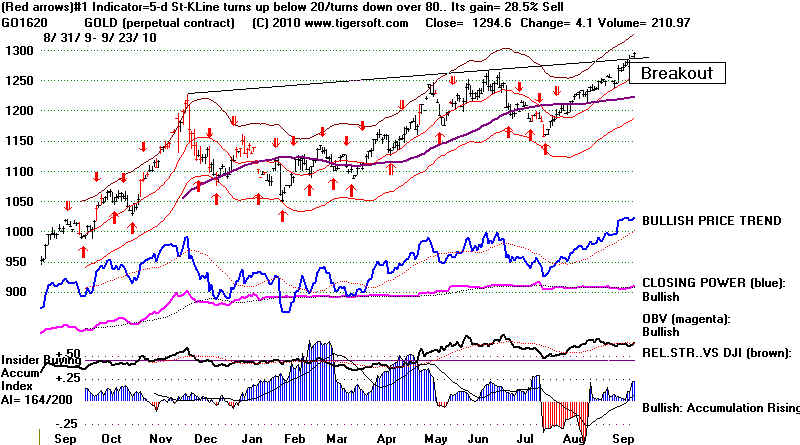
GOLD STOCKS ARE RUNNING
Gold stocks were the biggest
gainers today. The biggest, NEM, has broken out above very well-tested
resistance that goes back to 2005.
This must be assumed to be very bullish.
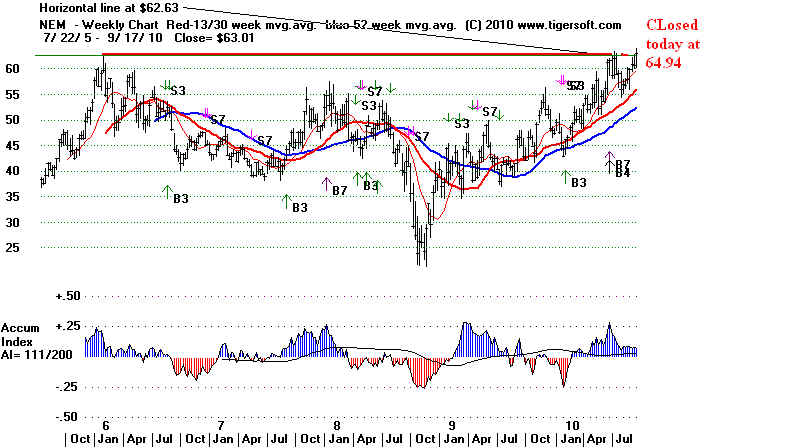
NEM is the mother ship. http://www.newmont.com It has gold mines in
United States, Australia,
Peru, Indonesia, Ghana, Canada, New
Zealand, and Mexico. The Closing Power for NEM is
lagging, but the all-time high
breakout is technically more important AND both its Opening
and Closing Power are now rising.
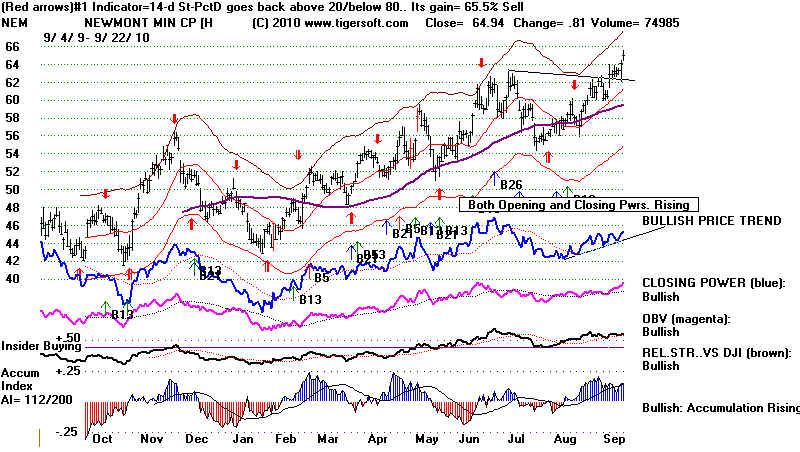
A steep rise in NEM and Gold
usually spell trouble for the equity markets because
the weakness they signify for the Dollar usually bringa the Fed to raise interest rates.
Presently interest
rates are falling and so is the Dollar. Volcker raised rates to 20% in 1980.
The result was the 1981-1982 bear
market. The Fed and Treasury have not agreed to
a public inventory of US Gold
supplies. This does not inspire confidence. On the other hand,
a weak Dollar helps creditors (pay
back loans in cheaper Dollars) and might help US manufacturing
get started again as imports become
more expensive. The big banks want a stable Dollar
because they want foreigners to
keep their deposits here and in dollar denominated assets.
The declining Dollar has also
caused US investors to put their money in overseas ETFs.
GOLD
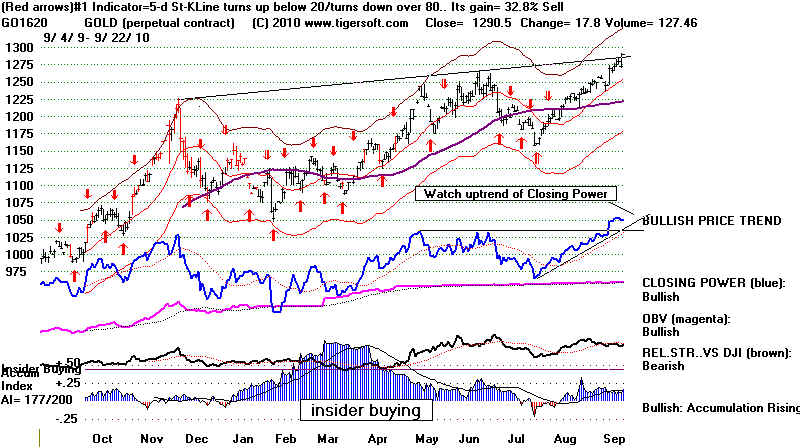
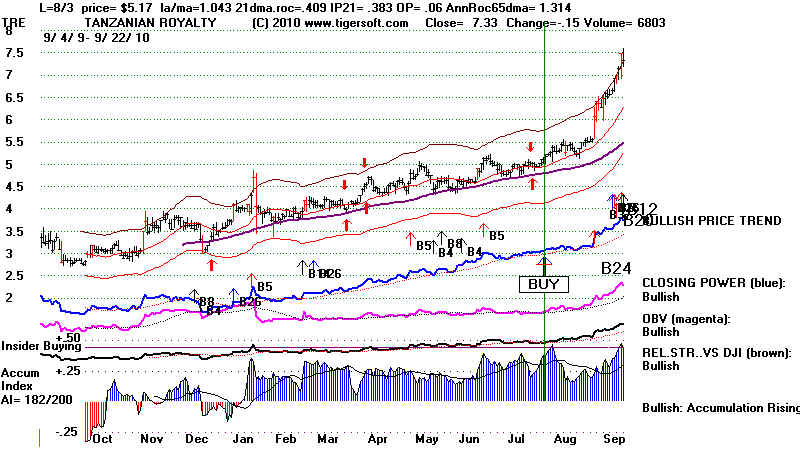
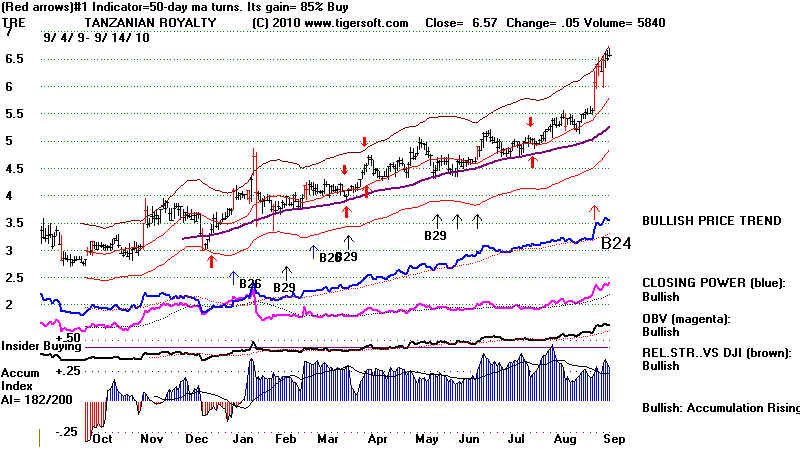
Gold and silver stocks are
following NEM's lead. The most bullish Gold stocks with a Closing Power
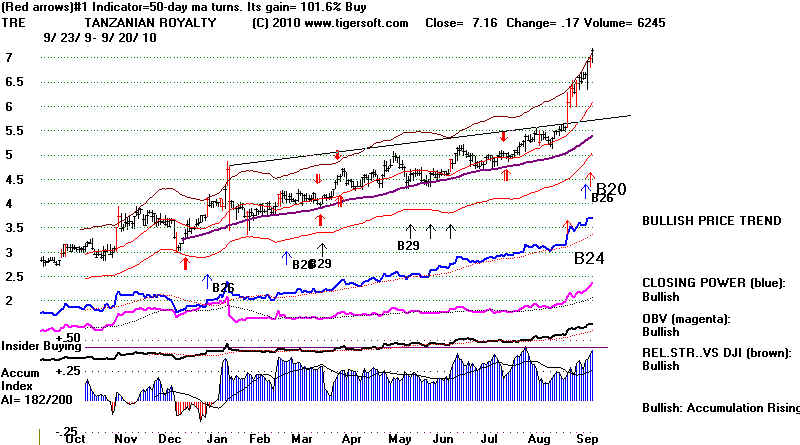
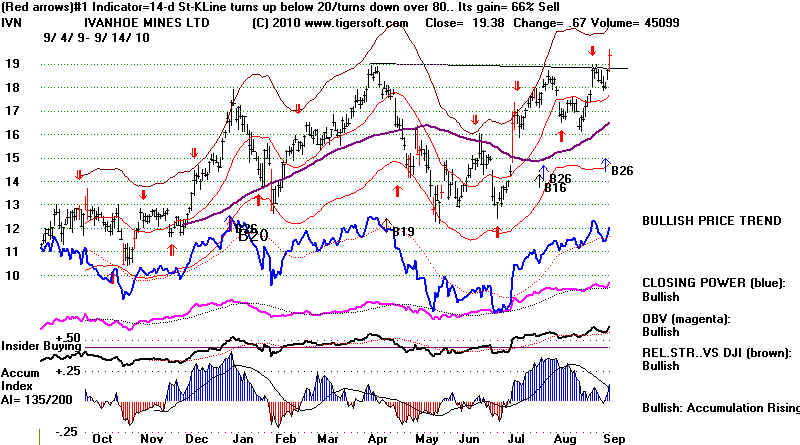
making new highs are TRE and IVN. As long as their
Closing Powers are rising, they can still be
bought and held. Of course,
these are not new recommendations, but this is probably the best
group to own now. Silver,
being used so much more for industrial purposes, is probably going to
lag gold for a while longer, until
there is more of an economic recovery.
TRE 7.33 -.15 and up nearly 50%
since we first recommended it here in July when it crossed back
above $5 with a Closing Power
making new highs and showing heavy insider buying.
Tanzanian Royalty Exploration Corporation, an exploration stage company,
engages in the acquisition
and exploration of natural resource
properties. It primarily involves in the exploration of gold properties,
with a focus on exploring for gold
properties in Tanzania Though up a lot, TRE's internals are
superb: heavy insider and steady
Professional buying.
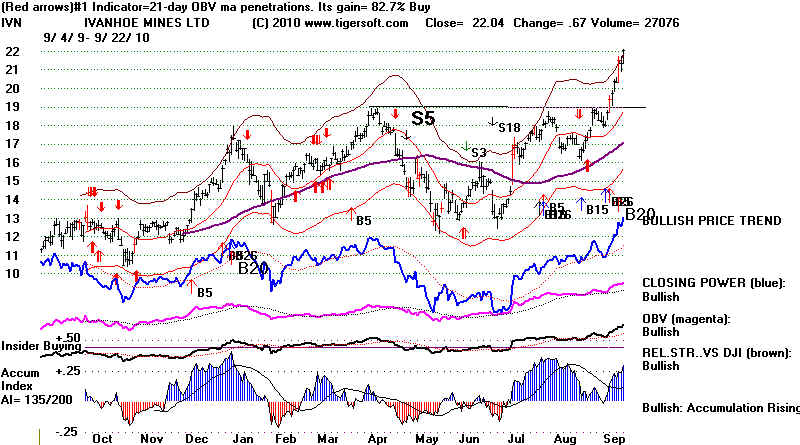
IVN 22.04
Ivanhoe Mines Ltd., through its subsidiaries, operates as
a mineral exploration and development company.
The company?s principal mineral
resource property is the Oyu Tolgoi copper and gold mine development
project located in southern
Mongolia. It also holds interests in the Ovoot Tolgoi Coal project located in
Mongolia; the Cloncurry project in
Queensland, Australia for the exploration and development of
molybdenum, rhenium, copper, gold,
and uranium; and the Kyzyl gold project located in Kazakhstan.
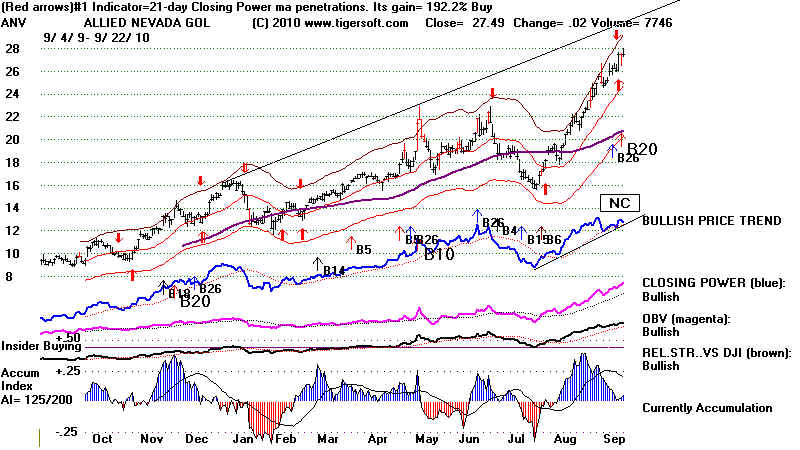
ANV 27.49 - runs only US gold
mines.
Allied Nevada Gold Corp., together with
its subsidiaries, engages in the evaluation, acquisition, exploration,
and advancement of gold exploration and
development projects in the State of Nevada. It principally
operates the Hycroft Mine, an open pit,
heap leach gold mine containing silver as a byproduct of the gold recovery
process located in Nevada.
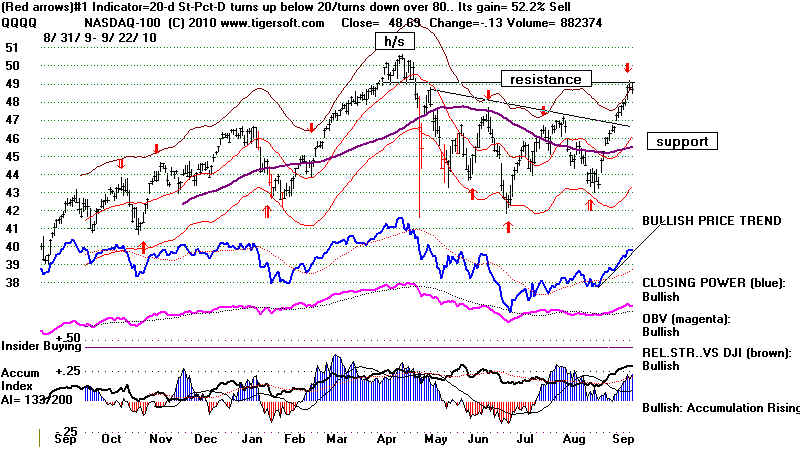
A handful of QQQQ stocks were sold off today on high volume. We will
watch to see if the NASDAQ
fails its recent breakout above the 2300
resistance. That would confirm an intermediate-term retreat
to its rising 65-day ma.
ADBE 26.67 -6.27
ADSK 31.66 -1.41 ALTR 27.25 -1.15 BIIB 54.86 -3.37
The QQQQ's Closing Power is still rising.
So, too, is its A/D Line/ Violation of these would
likely bring a decline back to 47 on the
QQQQ
To hedge with some short sales consider,
as usual, the most "bearish" MINCP stocks.
A handful of
Finance stocks also would seem to be candidates for short sale trades.
---------------------------------------------------------------------------------------------------------------------------
9/21/2010 Peerless Remains on A Buy.
Breadth did weaken today. There were a
whopping 863 more down than up on the NYSE despite
the DJI's 7 point advance. This is a big daily
divergence. It is clearly bearish. It is the second daily A/D
divergence on the current advance, where the
DJI rose from the previous day but there were more
stocks down than up. On September 16th,
the DJI rose 22 but there were 465 more down than up.
Weakening breadth is often based on a sense
that interest rates may go back up. Today, the
FED put on hold any further lowering of rates
despite the continuing high unemployment.
Bearish daily A/D divergences from the DJI not
on successive days tend to accumulate to the point
where there sufficient bearishness has
accumulated and an intermediate-term decline starts. This
can take some time. In 1929, 1937 and
1959, 1972-73 and 1999-2000, the A/D Line lagged a rising DJI
for more than 6 months. The divergence
here seems significant by comparison. Usually we get a
Sell S9 as the top is made. Often
multiple sets of S9s.
Minor breadth divergences do bring short-term
and intermediare-term declines. To this end,
in the original Peerless book of 1981, I talked
of minor divergences between the DJI and the
P-Indicator. I suggested watching for
minor non-confirmations. A practical rule of thumb is
to take as significant for trading purposes the
following. Watch for 50-day new highs by the DJI
where the P-Indicator is less than half of what
it was on the previous peak. A decline back to the
just below the 21-day ma is called for when
this happens. In this vein, on 8/4/2010 the P-Indicator
peaked at 714. Today on a new DJI high, it
stood only at 362. This is still more than half of its
previous peak, but not by much.
Another way to see a top coming is to watch
volume indicators, especially the V-Indicator.
The old Peerless S13s are useful here.
S13s are based on the V-Indicator being negative with
the DJI above the 2.7% band. These
Sell S13s have been classified simply as warning signals.
But we can count the daily A/D Line
non-confirmations coupled with multiple old Sell S13s
(warning signals). Four of these proved
to be correctly bearish signs of the tops in April, June
and July-August. We have had 3 so far on
this rally. So, I would still give the market more chance to
advance.
APRIL (4)
2/22/2010 10383.38 Old Sell S13
3/25/2010 10841.21 DJI up 5 but 1828 decliners and only 1269 advancers
4/15/2010 11144.57 (TOP) DJI up 21 but 1549 decliners
and 1449 advancers
4/19/2010 11092.05 DJI up 74 but 1735 decliners and 1343 advancers.
JUNE (5)
6/16/2010 10409.46 Old Sell S13
6/16/2010 10409.46 DJI up 5 but 1825 decliners and only 1270 advancers
6/17/2010 11434.17 Old Sell S13
6/17/2010 11434.17 DJI up 25 but 1545 decliners and 1525 advancers
6/18/2010 10450.64 (TOP)
JULY-AUGUST (4)
7/13/2010 10363.02 Old Sell S13
7/14/2010 10366.72 DJI up 4 but 1666 decliners and only 1366 advancers
7/22/2010 10322.30 Old Sell S13
8/9/2010 10698.75 (TOP) Old Sell S13
SEPTEMBER (3)
9/16/2010 10594.83 Old Sell S13
9/16/2010 10594.83 DJI up 22 but 1828 decliners and only 1269 advancers
9/21/2010 10761.03 DJI up 7 but 1942 decliners and only 1079 advancers.
The Closing Powers for the major market ETFs
are all still rising. In fact, the Opening Powers
are, too. This is a bullish combination.
The NASDAQ has broken clearly out above the right
shoulder resistance. The DJI has
marginally. The SP-500 has also made a 3 month high, but is
still below the apex (1149) of its left
shoulder in December. That still may pose some resistence,
but with the breakouts, the path of least
resistance should be up for more stocks.
MAXCP stocks numbered 249 while MINCP stocks
showed only 39. The very strongest stocks
tend to go up the most in the last stages of
their rally. Here is a sample of the BULLISH
MAXCP stocks
Some of the BEARISH MINCP stocks are
getting much weaker. Hedging with short sales in
these is safe, as long as you are willing
to cover a short if the CLosing Power breaks its downtrend.
 |
===============================================================
9/20/2010 Peerless Remains on A Buy.
The Closing Powers for the major market ETFs
are all still rising. In fact, the Opening Powers
are, too. This is a bullish combination.
The NASDAQ has broken clearly out above the right
shoulder resistance. The DJI has
marginally. The SP-500 has also made a 3 month high, but is
still below the apex (1149) of its left
shoulder in December. That still may pose some resistence,
but with the breakouts, the path of least
resistance should be up for more stocks. I would
cover most short sales if the Closing Power
downtrends are broken.
NASDAQ Buy B10
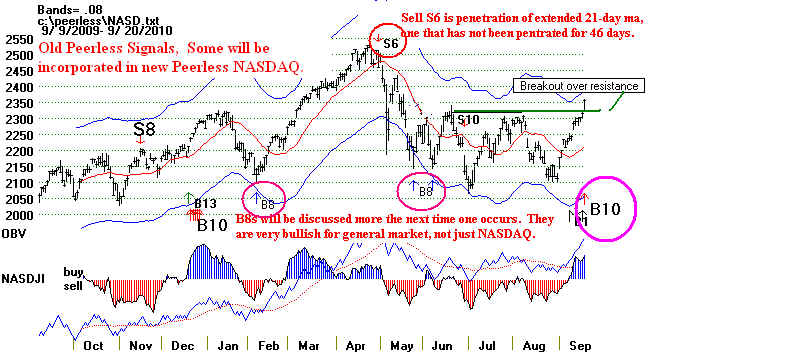
At the bottom of this
section is updated research on the type of breakout we saw today
with the NASDAQ. It shows that 11 of 13 old Peerless NASDAQ-Buy B10s - as
occurred today -
would have been profitably traded using current
Peerless Sells, penetrations of extended
21 and 65-day ma and head and shoulders
patterns. The gain would for such NASDAQ B10s
with the current
Accumulation Index (IP21) above +.15 would have been +7.6%. The next version
of Peerless to be released will have these and some
other NASDAQ signals in it. We do have to
be wary of false breakouts. But the history of these
signals is clearly bullish.
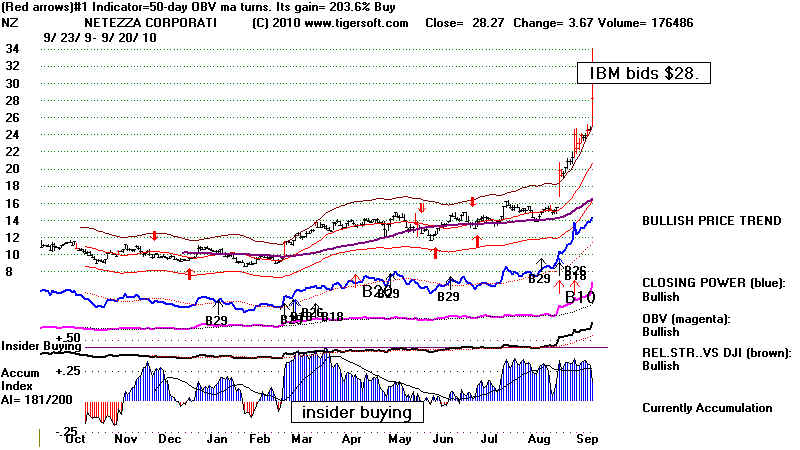
Internet security stocks remain the leaders.
Today IBM offered $28 for NZ, but stock
traded significantly above that level, as
though there would be a higher offer forthcoming.
The advance has taken up a number of more
speculative stocks, as well as the usual dividend plays.
There were 319 MAXCP stocks. These are
stocks with their C;osing Power making new highs,
thereby showing very strong professional
buying. By contrast, the number of MINCP stocks
has dropped to 45. On the NYSE,
there were 204 more New Highs and only 2 New Lows.
Bullishly, there were 118 NASDAQ New
Highs and only 10 New Lows. As long as their Closing
powers are rising, the BULLISH CP stocks
should do very well.
BULLISH MAXCP STOCKS (not dividend plays):
PSMT 29.08 +.35 AI/200=189.
consumer warehouse clubs i
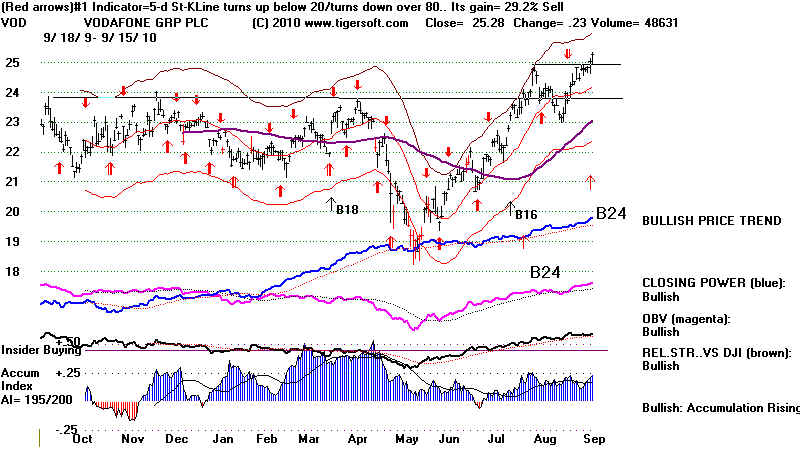
VOD 25.77 +.49 AI/200=195
mobile communications
VMW 87.43 +2.62
virtualization infrastructure software
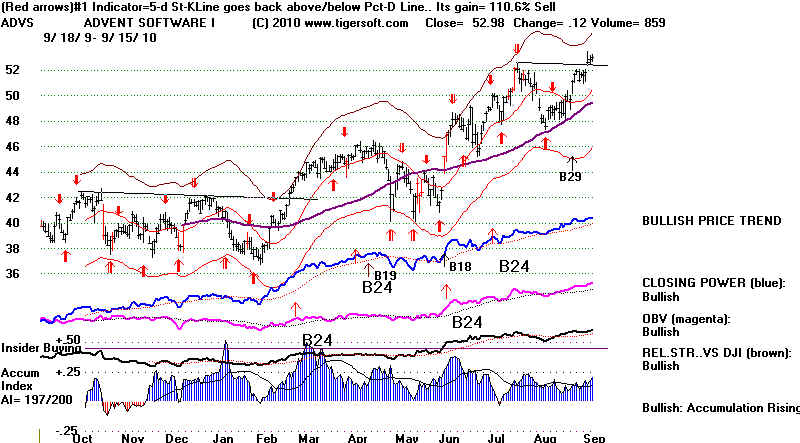
ADVS 53.58 +.98 AI/200=197
software and services that automate work flows
TRE 7.16 +.17 AI/200=182
gold/copper
FFIV 104.64 +3.66 AI/200=169
technology that optimizes the delivery of network-based applications, incl. security
AAP 59.16 + 1.01 AI/200=180
retailer of automotive aftermarket parts
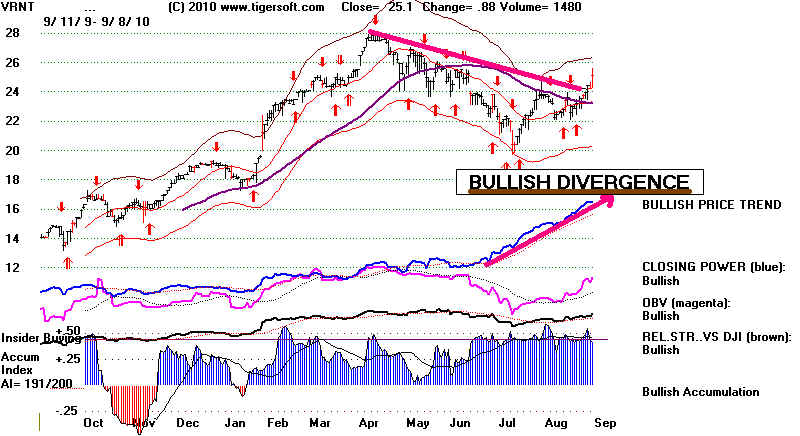
VRNT 25.05 AI/200=194
actionable intelligence solutions and value-added services worldwide
INTU 45.52 +.64 AI/200=169
raxes and financial management software
NR 9.42 +.44 AI/200=173 waste
disposal, and well site preparation products and services
WTR 20.78 +.30 AI/200=168
operates regulated utilities that provide water or wastewater services i
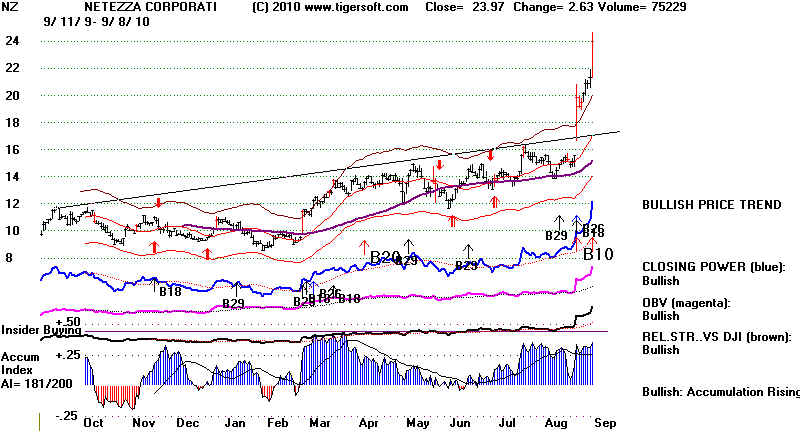
NZ 28.27 +3.67 AI/200 = 181
analytic and monitoring appliances to enterprises, etc.
NTCT 19.58 + 1.12 network
performance management solutions worldwide

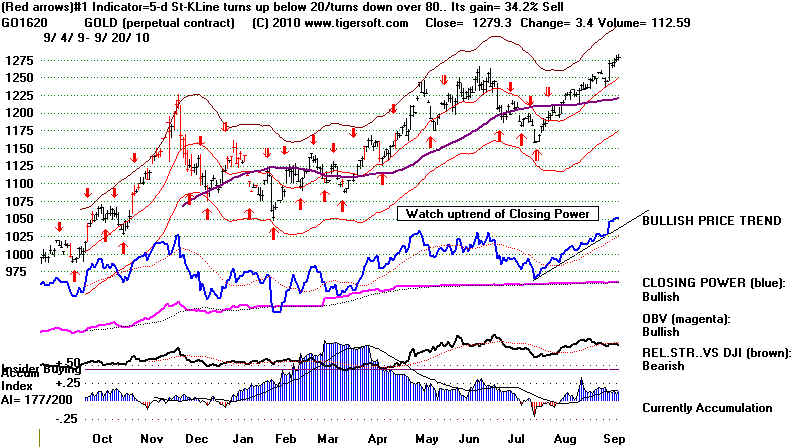
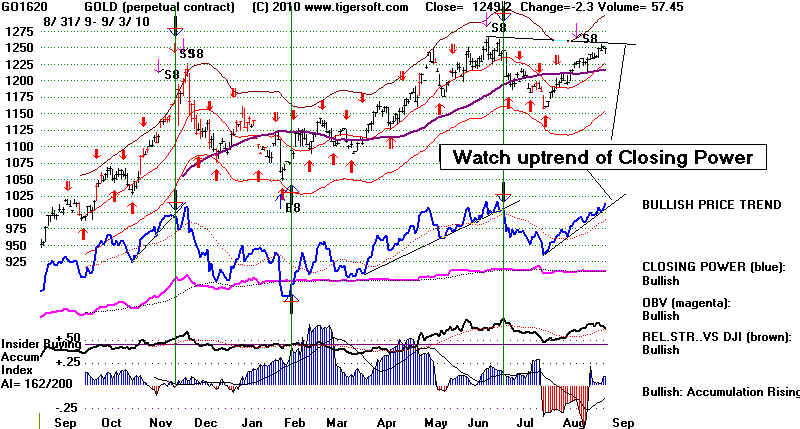
GOLD Should Go Higher. Minimum Upside Target Remains 1300
See GOLD's Breakout
Past 1000/ounce into All-Time High Territory Invites Comparisons
with 1970s. October 6, 2009
Low Priced Gold Stocks are getting lots of hot money interest, even though
some of the biggest Gold
stocks have not achieved breakouts and others
like ASA and GOLD show heavy distribution on their
new highs. Let's watch the higher
priced stocks for bullish breakouts, ABX 46.45 (Nov high of 48),
AU 44.07(Nov high of 48) and NEM 63.27 (64
recently).
Below
are the strongest Gold stocks. As long as their CLosing Powers are rising,
they will be good speculations in this market
environment with Gold having a
high minimum target and the last quarter of the year
tending to be bullish for it.
 |
 |
 |
Why The Shorts Are Covering...
When a bearish-looking head and
shoulders' pattern is aborted by a close clearly above the
right shoulder's apex's resistance, the
market usually spurts forward as shorts cover. That started
today, set off, as it was, by the
government's accouncement that "the recession has ended"/
For whom, one might ask. This is a
jobless recovery, if ever there was one in the US. And
the market's decline ended 17 months ago.
Still, there is no question that overseas stock
markets
are doing very well. Another internet/security stock, NZ, was bid for today by a
Dow-30 stock. (IBM). I mentioned
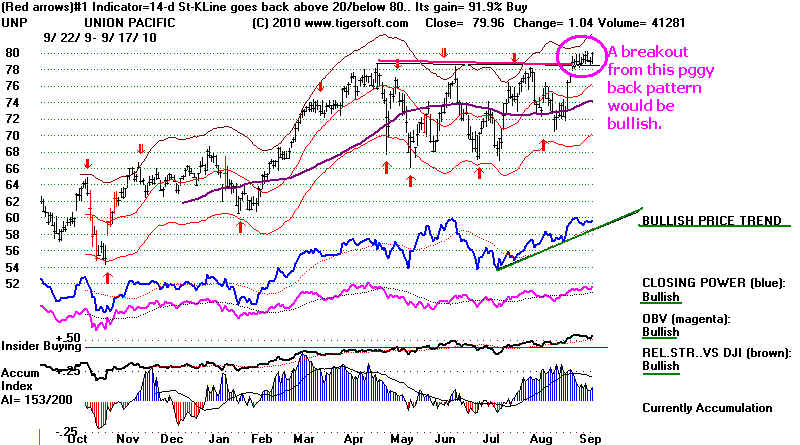
UNP last night as a wellwether. It moved up, but has not made
a confirmed breakout. Other
railroads are also approaching breakouts, but have not succeeded
yet. (CP, CSX, KSU, NSC). The old
Dow Theory would say that today's breakout was not
confirmed by the rails.
i
NASDAQ Strength Usually Shows Healthy
Speculative Interest and Is Bullish
This will have be finished tomorrow.
The old Peerless (pre-2008) have a Buy B10 on the NASDAQ
breakout today,. Even though
this is not part of the
present Peerless programs we can see usefully look back at all the cases
of such Buy B10s and get a
sense of the importance of the breakout today.
Old Peerless NASDAQ B10's are
breakouts above 4x tested resistance. The average
gain on 9 trades between 1986
and 2002 was 7.8% at time of next NASDAQ Sell.
7 of these 8 trades were
profitable. The gains from these B10s between 2002 and 2006
will be posted tomorrow.
Below are the gains in the last 4 years.
Gains of B10s with Old Peerless on NASDAQ.
CL/MA NASDJI IP21 Gain
--------------------------------------------------------------------------------------------------------------------------------------
7/16/1987
1.015 Negative 0 +3.5%
Reversed by Peerless S9 on DJI on 10/1/87.
Note NASDAQ Sell Signals in Old Peerless that will have to be incorporated
in a new Peerless for NASDAQ.
Sell S2 - Penetration of 65-dma by -.5% for first time in 65-days.Not a short sale.
Sell S6 - Penetration of 21-dma by -.5% for first time in 46-days.Not a short sale.
Date
NASDAQ CL/MA NASDJI
IP21 Gain Next
Sell
----------- -------------
---------- ------------ ------- -------
----------------------------------------------------------------------------
1. 6/9/88 384.60
1.034
Negative .322 +2.8% Peerless Sell S1 on
7/6/88 with NASDAQ at 395.45
2. 8/3/89 456.93
1.018 Negative
.412 +4.9% Peerless Sell S9 on 10/4/89 with NASDAQ at 479.32
3. 5/17/90 445.74
1.039 Negative .198
+3.7% Peerless Sell S9 on 7/2/90 with NASDAQ at
462.04
4. 9/14/92 594.21
1.043 Positive
.309 +12.-% Old NASDAQ
Sell S2 on 2/16/83 with NASDAQ at 665.39.
+33% Peerless Sell S9 on 2/3/94 with NASDAQ at 797.79
NASDAQ fell to 565.21 right after this Buy signal and then revered powerfully up
after completing a 5-month lomg inverted head/shoulders bottom.
5. 10/22/92 597.12 1.031
Positive .299 +11.4%
Old NASDAQ Sell S2 on 2/16/83 with NASDAQ at 665.39.
+32% Peerless Sell S9 on 2/3/94 with NASDAQ at 797.79
6. 11/27/96 1287.32 1.027
Negative .358 -5.8%
Peerless Sell S9 on 4/22/97 with NASDAQ at 797.79
Much better would not to have a gain turn into a
loss and to have sold
on simultaneous penetration of 4x tested uptrendline - pentration of 65-dma
with NASDJI negative and IP21= -.056. This would have meant a gain of
+2.0%.
7. 6/30/99 2685.64 1.063
Positive .255 -0.5%
Peerless Sell S12 on
6/18/99 with NASDAQ at 2671.24
8. 11/1/99 2967.64 1.05
Positive .185
+33.8% Peerless Sell S9 on 12/28/99 with NASDAQ
at 3972.11
9. 12/29/2003 2006.48
1.042 Negative
.233 +4.1%
Peerless Sell S15 on 2/11/04 with NASDAQ at 2089.66.
10 11/10/05 2196.68
1.032 Positive .282 +6.6%
Peerless Sell S15 on 5/5/06 with NASDAQ at 2342.57
11. 3/29/2006 2337.78 1.018
Negative .091 +0.2%
Peerless Sell S15 on 5/5/06 with NASDAQ at 2342.57
NASDAQ completed head/shoulders on 5/11/2006 at 2276.70)
12 9/12/2006 2215.82
1.026 Positive .271 +9.9% Peerless Sell S9
on 1/5/07 with NASDAQ at 2435.
13 1/11/2007 2485.85
1.02 Negative .068 +8.0% Peerless Sell S9 on DJIA at 2712.29 on
7/17/2007
This was initially a false breakout as NASDAQ fell
back to 2350 before advancing.
14 4/25/2007 2547.89 1.028 Negative .30
+6.5% Peerless Sell S9 on DJIA at 2712.29 on
7/17/2007
15 4/24/2008 2428.92
1.031 Negative .15 +2.1%
Peerless Sell S15 on DJIA at 2480.71 on 5/1/2008
NASDAQ H/S neckline violation at 2394.01 on 7/17/2007.
Two warnings here: IP21 (Current AI) was under.151 and NASDAQ B10 was trying
to reverse operative S9s.)
> 11/16/2009 - There was a
simultaneous B10/S8 from old NASDAQ system here. So signals are nullified.
16 12/21/2009 2237.66 1.025
.194 +10.0% Reversed on 4/30/2010 by NASDAQ-Sell S6
Completed NASDAQ Head/Shoulders pattern
9/20/2010 2355.83 1.064 Positive
.273
Open
------------------------------------------------------------------------------------------------------------------------------------------------
13 CASES of NASDAQ B10s with IP21>,15.
Avg. Gain - 7.6% using Peerless Sells, NASDAQ S2s, S6s
and completed head and shouldrs patterns.
11 of 13 were profitable since 1987 when data starts
being available. .
===================================================================================
9/17/2010 Peerless Remains on A Buy. Short-Term Red Sells appeared
on Friday's QQQQ and SPY charts.
The Closing Powers for these are still rising. Until
the CLosing Power uptrends are broken or
we get a Peerless Sell, I would not sell these
or the DIA short. I would take more
profits in some of the most bullish stocks (Bullish MAXCP)
when their CLosing Power uptrends are
violated.
Indian, Chinese and
Emerging Markets remain strong, as do the internet-security
stocks.
. Watch bellwether Union Pacific for a bullish breakout
above a piggy back flat resistance. The
overseas markets are now lifting the US market
and economy, even if big banks won't make
loans to lots of American companies and
individuals.
The ratios of new highs to new lows on the NYSE is still bullish,
greater than 10:1. It is 141:11.
The NASDAQ's is much less bullish or
problematic. On Friday there were 57 new
highs
but also 21 new lows. The quality of the
new highs is of concern here. Our Tiger Data page shows
205 new highs, but only 60 are in the confirmed
new highs (NHCONF) set. Among the stocks
traded best with short-term stochastics
(STOCH5), there are 73 still on buys and buy 173 on sells.
A short-term pullback from resistance seems
likely. We will watch the internals of the market
if it pulls back to its 21-day ma to see if
this will be support. Usually without a Peerless Sell or
a head and shoulders top, declines are shallow
and brief.
BIOTECHS
The biotechs making new highs are of interest
as trades, as I explain below, even though their
strength may show traders are favoring biotechs
selectively. Only 3 of the 6 biotechs are making
confirmed new highs. That is a bearish
sign. We want to see a higher percentage of confirmed new highs.
ALKS Looks like a Sell. Red Sell, Negative current AI (IP21), CP
nearer new lows than new highs.
ATRC - thin but B10 B12 B20 and B24
CBLI - looks like a Sell. Red Sell, Negative current AI (IP21), CP
nearer new lows than new highs.
EXAS - high volume NH is not confirmed by IP21>.25 or Closing Power
making a new high.
ISLN - a runaway super stock. Illustrates TigerSoft's ideal in many ways.
SVNT -
Recent B10 B12 B20. CP is not yet at a new high.
Professionals mau have been surprised here.
MERGER MANIAs - A SIGN OF CORPORATE EXCESS AT A TOP?
The NASDAQ and QQQQ have been
out-performing the DJI since 9/3/2010. This is the
same day that the QQQQ closed back
above its 65-day ma and its Rel Strength Quotient Line
(QQQQ/DJI) broke its downtrend.
Where dividend plays were dominant, there has developed
among traders a keen sense of the
potential in take-over plays, especially in internet security
stocks. It is said that the big
corporations are gobbling up smaller companies with earnings
to make up for their own limited growth
and lack of willingness to invest directly in or expland their
core businesses. Perhaps. A
merger mania of sorts has clearly developed in a narrow group of
technology stocks. It really
started with the buy-out of McAfee (MFE) on August 19.
Tiger Insider Trading charts show when
such talk is heating up. There is some evidence
this takeover mania may spread to
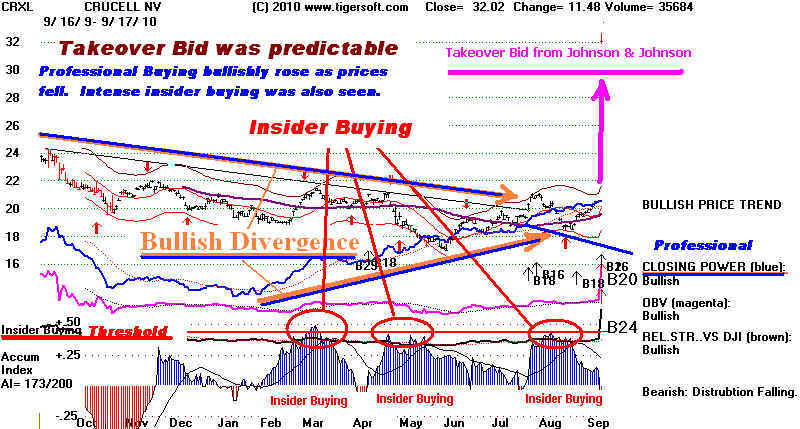
biotechs. European CRXL jumped 55% on Friday on
Johnson and Johnson's bid.
How To Spot A Stock
about To Get A Takeover Bid
Will Biotechs Be The Next Big
Play for Take-Overs?
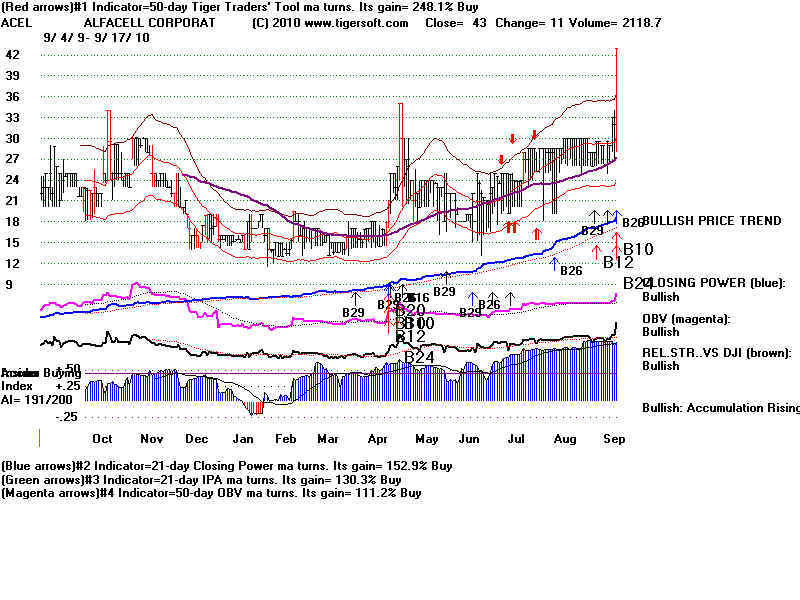
PENNY STOCK ACEL IS MOST
INTERESTING.
I searched our Biotechs for the stock
that most looks like the CRXL chart above, a classic
case of a buyout. ACEL seems the closest
parallel. I have multiplied the price data for ACEL
by 100 using the old Tiger program's EDIT
feature to let you better see its chart. I will
do this each night in the BIOTECH data.
As you can see, everything is great about ACEL,
except the fact that it is a penny stock that
is moving up late in the stock market's bullish cycle.
ACEL is now known as Tamir. Its website's announcements do look interesting. (I do not
own any of this stock. I do not know
anyone personally who owns it. And no one has paid
me to promote this stock.) This is apparently a pink sheet's stock. Yahoo Finance
does not cover it yet. You can get quotes
here:
http://quotes.nasdaq.com/asp/SummaryQuote.asp?symbol=ACEL&selected=ACEL
ACEL's Prices below are Pennies/Share.
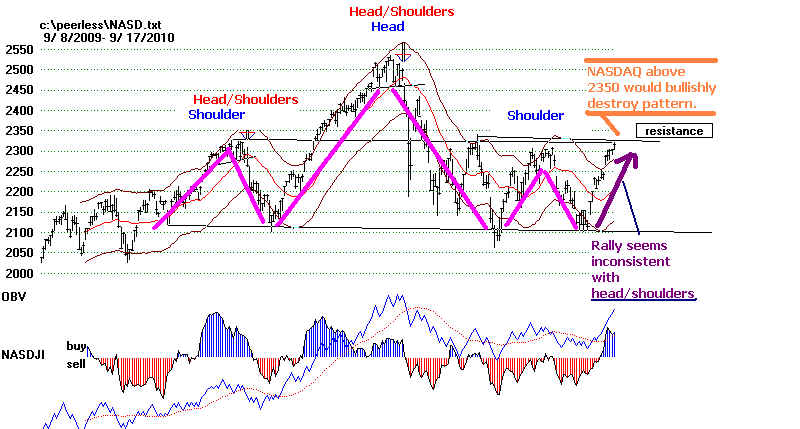
NASDAQ. "NASDJI" and Peerless
A NASDAQ move past 2350 would be very
bullish. It would destroy the head and shoulders
pattern even more conclusively than the
last rally. While the last two week's rally is inconsistent
with a symmetrical head and shoulders
pattern, there are many cases where there is not equality
in size or duration between the trading on left
side of the head with that on the right. So, the
NASDAQ's asymmetrical chart does not preclude a
decline. NASDAQ head/shoulders patterns
are actually uncommon. Tops in the
NASDAQ are best spotted with Peerless
Sell signals on the DJI and a NASDAQ "NASDJI" reading
that is negative at the time of the
Peerless Sell or down at least 70% from its
recent highs. More on this tomorrow.
NASDAQ
NASDAQ Tops since 1988
(Users choose:
Peercomm + Charts + Short-Term Indexes + User Choice + NASD89 -example)
10/10/1989 top before 15% decline. Perfect Peerless S9
on DJIA. NH but NASDJI was negative.
7/16/1990 top before 30% decline. Perfect
Peerless S9 on DJIA. NH but NASDJI was negative.
2/12/1990 top before 15% decline. Perfect
Peerless S9 on DJIA. NH but NASDJI was negative.
2/3/1994 top before 13% decline. Perfect
Peerless S4 on DJIA. NH but NASDJI was negative.
5/29/1994 top before 18% decline. Perfect
Peerless S1 on DJIA. NH but NASDJI down 75% from high.
10/7/1997 top before 13% decline. Peerless
S12s on DJIA. NH but NASDJI down 75% from high.
7/21/1998 top before 32% decline. Peerless
S9 on DJIA a week before.
Waiting for NASDJI to fall 75% from its high would have meant selling at 1881.
NASDAQ
did not bottom out until 1400.
7/16/1999 top before 13% decline. A Peerless S12 a month earlier but prices
rose from 2600 to 2864,
Waiting for NASDJI to fall 75% from its high would have meant selling at 2684.
NASDAQ
did not bottom out until 2490 two weeks later.
3/10/2000 top before 37% 2 mo. decline. No Peerless SELLon DJIA.
NH but NASDJI down 20% from high.
Waiting for NASDJI to fall 75% from its high would have meant selling at 4798.
NASDAQ
did not bottom out until 3100.
In the 2000-2003 NASDAQ bear market, selling short when NASDJI turned negative would have
worked fine.
Confirming this with negative readings from AI would have given more confidence in
short-selling.
>6/14/2001 NASDAQ Continuation Head/Shoulders at 2044. NASDAQ fell to 1420 low
in September.
1/21/2004 top before 13% decline. Peerless S9 on DJIA came two weeks later.
Waiting for NASDJI to fall 75%
from its high would have meant selling at 2014. NASDAQ did not bottom out until 1877
in May.
6/30/2004 top before 14% decline. No Peerless Sell on DJIA. Waiting for
NASDJI to fall 75% from its high
would have meant selling earlier on 6/14/2004 at 1970. NASDAQ did not bottom out
until 1752 in August.
1/3/2005 top before 13% decline. Perfect
Peerless Sell S8 on DJIA. NASDJI and NASDAQ AI were negative.
4/20/2006 top before 14% decline. Peerless Sell S9 on DJIA two weeks later. NASDJI was negative with S9.
Selling when NASDJI fell 75% from its recent high would have meant selling at 2330 on
April 25.
NASDAQ fell to 2100 in July.
7/19/2007 top before 12% decline. Perfect
Peerless Sell S9 on DJIA. NASDJI
was down 70% from its high.
10/5/2007 top before SEVERE decline. Peerless
Sell S4 on DJIA on 10/5/2007. NASDJI was negative when
S4 occurred. NASDAQ did rise 3 weeks long and show very
positive NASDJI, as it had in 2000.
|
==================================================================================
9/16/2010 Peerless Remains on A Buy. Short-term
Buys out-number Sells
above 7 to 4. MAXCP
Stocks Outnumber MINCP Syocks 5:1.
The Closing Powers and A/D Lines for the DJI, SP-500 and QQQQ are still
rising. This is
impressive since these
indexes have reached their resistance levels and seasonality
since 1965 is 67% bearish for
the DJIA over the next two weeks.
But, I have to note that
the A/D Line for the DJI failed to confirm the present advance today.
Though the DJI rose 22,
there were 475 more down than up on the NYSE. A/D Line
Non-Confirmations (NC) are
one of the most common characteristics seen at major tops.
In 20 of 25 cases of major
tops, This type of divergence nearly always sets up over a week
or more and is visually very
apparent if a big sell-off is in the offing. Look at my
study of all the major tops
since 1928,
http://www.tigersoftware.com/TigerBlogs/Sept-11-2010/index.html
The old Peerless did generate
a Sell S13 today. It works only 56% of the time
profitably from 1966 to 2000.
It occurs anytime the A/D Line did not
confirm a DJI new high.
This is designated as a AD-NC. I have tested this condition
tonight coupled with the DJI
being at least 2.85% over the 21-day ma, with the
IP21 at least -.072 and the
P-Indicator above +100 - which are all true conditions now.
The results show such a
signal is problematic since 1987. This is as far back as I
have tested it tonight.
While it improves the present 2010 Peerless system in 6 cases,
it is not as good in 7
cases. In 6 cases, it was significantly premature as a Sell.
As a result, these trades
were graded as "BAD" in the listing of its signals at the bottom
of today's hotline.
NYSE A/D Line NCs as MARKET PREDICTORS
WHAT TO DO.
If the A/D Line continues to
not confirm DJI advances it will certainly eventually set up a
bearish divergence. But
anyone looking at our back data will see that the A/D Line
can diverge for some time
before there is a big decline. The longer the divergence
lasts, usually the bigger the
subsequent decline. In such an advance, the
stocks that are still rising,
often go up the most in this environment. Hot performance
money is focusing on fewer
and fewer stocks.
In sum, I think
intermediate-term Peerless users should be long the major ETFs,
especially since both their
Opening and Closing Powers are now rising (a blow-off
bullish condition)
Short-term traders should probably be out of the DIA because
it gave a short-term red
Sell. The BOTHUP condition for QQQQ and SPY can be traded
on the long side, provided
you are quick and will sell if the CLosing Power uptrendlines
are broken.
BULLISH, BOTHUP MAXCP STOCKS
My preferred way to trade
this market, however, remains being long some of the
"BULLISH" MAXCP
stocks. These will have their Closing Powers making new highs
and show lots of blue
Accumulation. To hedge sell short some of the "BEARISH"
MINCP stocks.
BULLISH MAXCP STOCKS (205) on Red Buys with Current
AI>.25
Traders should also be
working with BOTHUP MAXCP stocks
like AKAM 52.26+.72 and TMRK 10.13 + .12.
CPV 25.68 +.43 dividend play.
AET 24.91 +.17 dividend
play.
TRE - Tanzanian Royalty
6.92 +.27 Above upper band and running as Gold/Copper stock.
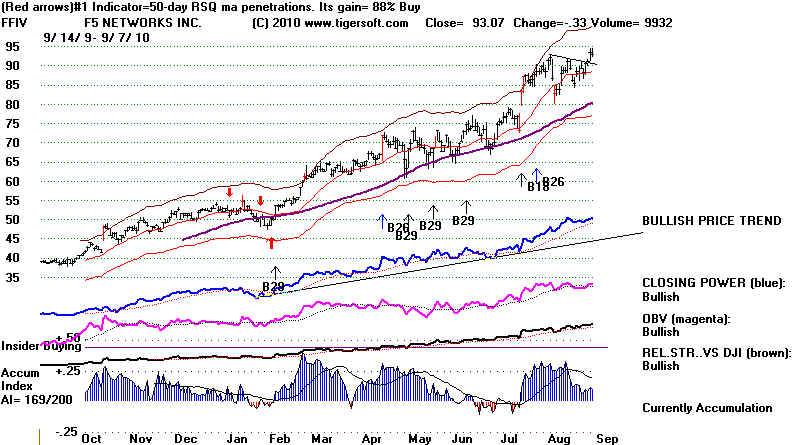
FFIV - FS Networks.
This has not fallen below 65-da ma since February.
In hot internet security field.
GED - 25.56 +.24
dividend play.
NZ - 24.47 +.52
In hot internet security field.
DXB - 24.6 +.17
dividend play.
NTR - 9.47 +.17
NTCT 18.09
-.08 In hot internet security field.
BEARISH MINCP STOCKS (40) on Red Sells
ALJ 5.37 -.07
ECA 29.26 -.06
CFFN 24.99 -.20
PBCT 13.03 -.11
MGM 10.24 -.22
MKKD 5.93 -.13
AMAG 23.37 -.62
SHOULD A NEW A/D NC SELL BE USED?
HERE ARE RESULTS SINCE 1987
In 6 cases, it was significantly premature as a Sell and has been graded
as
"BAD" in red. In only one case,
would this signal have given a profitable new
set of trades.BAD 6/25/1987 2451.05 DJI rose to 2621 in August. There was a B4 that could
have cancelled this signal. No present signal here.
BAD        8/18/1989  2712.63 immediate pullback to 21-day ma and then rally
           to upper band at 2799 in early October where a better S0 occurred.
BAD        7/13/1995  4727.48 immedate pullback to 21-day ma and then rally above
           upper band.  No present signal here.
SLIGHT IMPROVEMENT 2/23/1996  5630.49 immedate pullback to 21-day ma and
           then rally above upper band in second half of 1996. Present system
           gave Sell on 2/27/96 at 5549.
GOOD, NEW  7/24/1997  8116.93 immediate rally to 8220 and then DJI decline
           below lower band to 7803. NOTE: There was no sell signal presently.
SLIGHT IMPROVEMENT     7/14/1998  9245.54 immediate decline of 20%.
          NOTE: There was an earlier sell S9/S12 signal presently at 9085.
GOOD,NEW   11/19/1998 9056.05 immediate rally to 9374.26 and then decline to
           8695.60 a month later.  There was no sell signal presently.
BETTER     7/12/1999  11200.98 immediate decline to 10655 and lower band in 3 weeks.
           Current system gives a Sell S12 on 10856.
BAD        11/16/1999 10932 immediate rally to 11722.87 and then decline to 9800.
           Present signals did better here giving a Sell S9 at 11476.
SIMILAR    1/9/2003   8776  immediate decline to 7600 in two months. Present program
           gave S12 at same top.
BAD        12/16/2004 10130 immediate rally to 10694 amd then decline to 10063.
           Present Peerless signals did a better job here giving S8 at 10854 on
           12/28/2004.
BAD        4/26/2007  13105 immediate rally to 14000 three months later.
           Present Peerless signals did a better job here giving S9 at 13972 on
           7/17/2007.
NOT AS GOOD  9/21/2007  13820 immediate rally to 14165 and then decline to 12600.
           Present Peerless signals did a better job here giving S4 at 14066 on
           10/5/2007.
SIMILAR    6/5/2009   8763 immediate decline to lower band at 6323 in 3 weeks.
           Present program gave a simultaneous S8.
BETTER     10/15/2009 10063 immediate decline to rising 21-day ma and then rally.
           Present program gave a Sell S8 at 9949.
--------------------------------------------------------------------------------
 15 cases  7 instances gave bad trading results,
|
==============================================================
9/15/2010 Peerless Remains on A Buy
but DJI and other indexes
are at resistance. With volume low, the DIA on a Sell and the
bearish seasonaility ahead for the next two weeks, take some
profits. Because the Closing Powers are in uptrends for the
ETFs, no short-term short-sales are recommended. Intermediate-
term investors should wait for a Peerless Sell of a break in the
NYSE uptrendline.
Reviewing the "BULLISH" MAXCP (205) stocks comes up
with these
stocks showing heavy BLUE Accumulation and a
CLosing Power
that is leading prices to new highs.
Reviewing the "BEARISH" MINCP (43)
stocks comes up with these
stocks showing heavy RED distribution and a
CLosing Power
that is leading prices towards new
lows.
=============================================================
9/14/2010 Peerless Remains on A
Buy.
The
DIA has given a 20-day Stochastic Sell today. This is the optimum trading system
for the last year for the DIA. As it has
gained +52.5% buying and selling short, it should
respected I think by traders. Peerless is
intermediate-term. The Red Down-Arrow represents
a short-term Sell. In this situation,
I would look for the DIA to retreat only a little. BOTH
Opening and CLosing Powers are still rising.
Shorter-term, traders who want to go short the
DIA should wait, at least for the Red 20-day
Stochastic Down-Arrow Sell to be clinched by
having the Closing Power uptrend be violated.
This sacrifices little usually and makes for a
higher rate of successful trades. See rules for this
here.
If the DJI moves past
10700, the head and shoulders pattern will be largely destroyed and
that will force considerable short-covering.
The rising A/D Line is certainly bullish, but the low
trading volume, low level of the Tiger
Accumulation Index on the rally and the September-
October seasonality remains bearish.
The DJI has risen only 33% of the time since 1965
over the next two weeks. It rises only
48.7% of the time over the next month in this period.
If Gold keeps rallying, it will put pressure on
the Dollar and thereby add to inflationary fears that
central bankers and the FED always have.
The Dollar fell sharply today and completed a
bearish continuation head and shoulders.
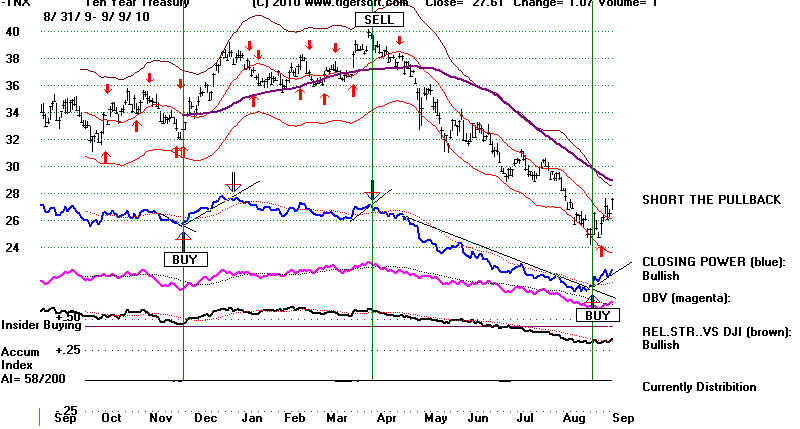
Its Closing Power has bearishly broken its uptrend.
For now interest rates are falling. But
continued eakness in the Dollar and strength in Gold
and Japanese Yen will pose problems for the
FED, low interest rates and the stock market rally..
See notes above. DIA is now
on a short-term Sell. Although
Peerless is still on a Buy, we have
to be concerned about Gold
rising steeply, as this is usually
bearish for the general market
AND the big splashy jumps in some
of the internet security stocks.
This shows an emotional extreme and
an over-bought condition
developing.
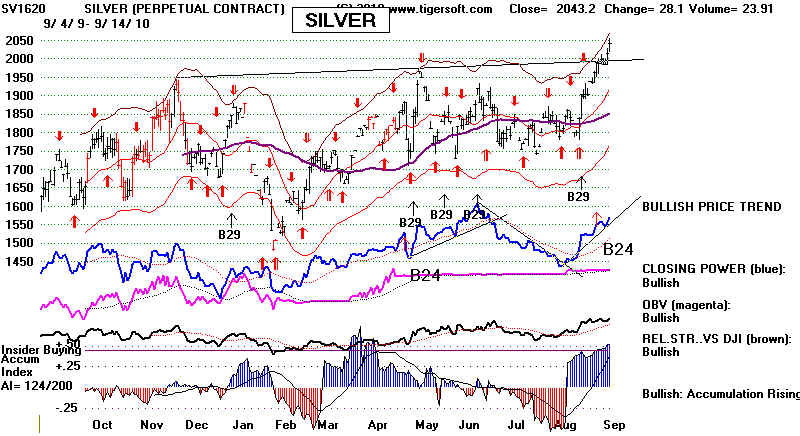
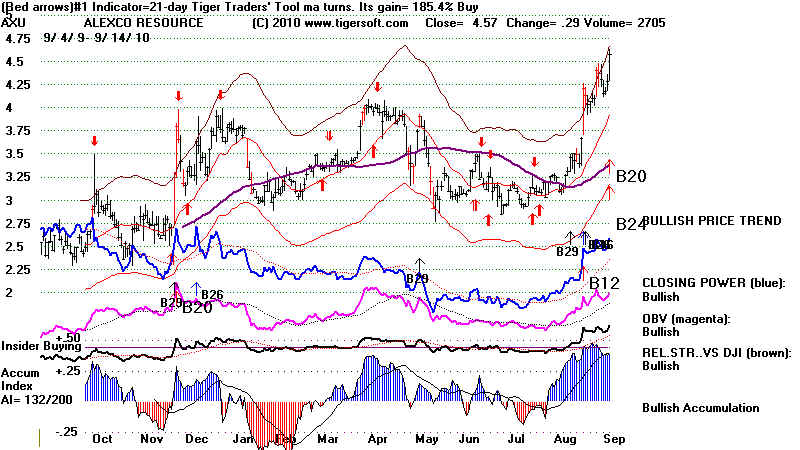
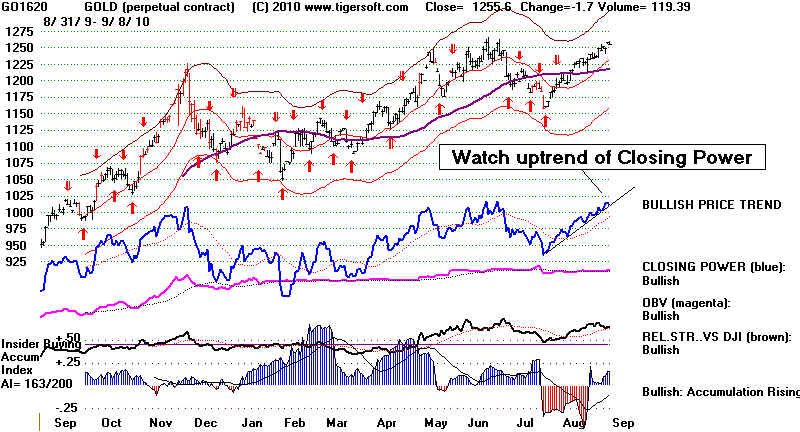
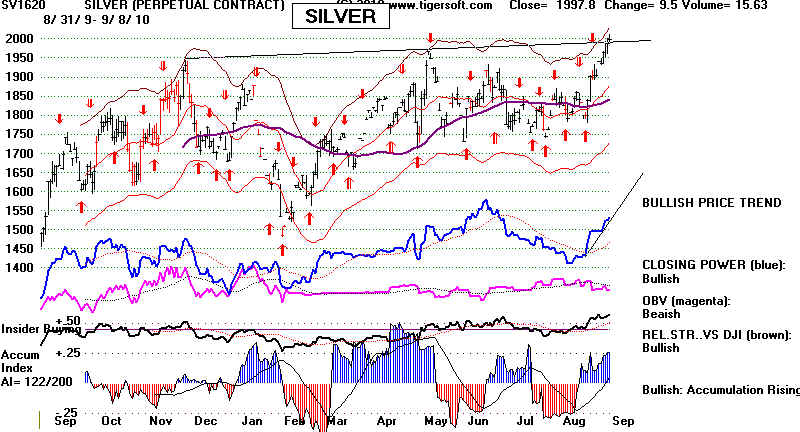
Gold and Silver - Important New Highs
Gold Shows More Accumulation and Professional Buying.
GLD, SLV, TRE, NEM, IVN and AXU are
likely to move much higher.
The minimum upside target for GLD
is 130. Precious metals
often become hyperbolic as the
public starts buying. Each of
these and the silver stocks (PAAS
and SSRI) have BOTH
a rising OPENING and CLOSING Power.
This often leads to
big advances.


Make Money from Merger Manias
http://www.tigersoft.com/HOW-TO-SPOT-A-BUYOUT/index.htm
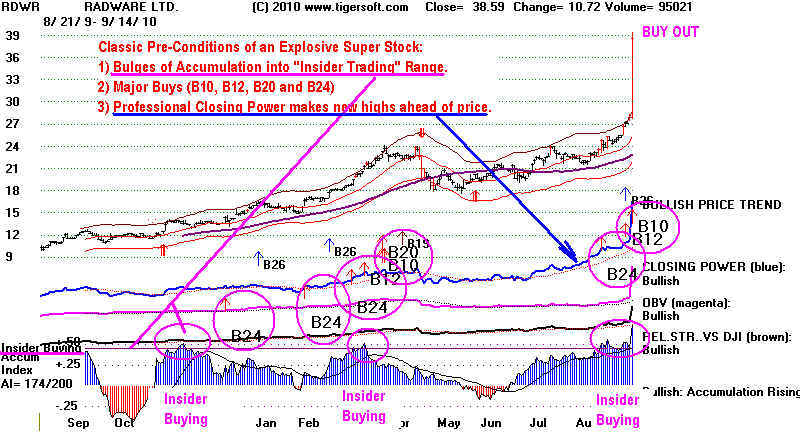
9/14/2010 Example -
IBM
or HP to Buy Radware: Report at TheStreet.com(Tues, Sep 14)
Previously Recommended RDWR + 25% Today.
===============================================================
9/13/2010 Peerless Remains on
A Buy. CLosing Powers Are Still
Rising and the QQQQ, SPY, DIA and IWM Are
on Still on Buys. With
their OPening Powers still rising, too,
the strength shown has
to be respected. Tiger's NASDAQ's
relative strength "NASDJI"
Indicator has turned positive, showing
the NASDAQ is outperforming
the DJI. IWM is too strong to hold
short, even as a hedge.
Watch to see if more of the High Techs
we mentioned are bid
for as a buy-out, like ARST was today by
HPQ...The bearish head and
shoulders pattern appears to breaking
down as the A/D Line
lifts prices to the edge of a breakout
past 10650.
The DJI is approaching the 10650
resistance we have mentioned.
Will there be a reversal? The DJI
closed 2.7% over the 21-day ma
with the current Accumulation Index
(IP21) only standing at +.041.
This shows distribution. In a
rising market, this combination would
have only minor significance. But
if we are still in a trading range,
and that is what the multiple head and
shoulders patterns warn,
and the low volume and bearish
seasonality also suggest, then we
should soon see a regular Peerless Sell
signal and a reversal
downwards. But we have no Peerless
sell yet.
The lastest statistics on Insider Buying
and Selling show this
is not a rally for long-term investors:
"According to Bloomberg,
for the week ended September 10,
corporate insiders bought $0.5MM in shares in 4 different companies. This was
offset by sales of $332MM in 72 different companies, a ratio of 651 of sellers to
buyers."
(Source.)
The rallly
today has been attributed to
(1) Warren
Buffet's bullishness (which cynics would say is what one would expect him to say
on behalf
of his own investments),
(2) HP's
bid for ArcSight
and
(3)
bankers giving themselves 9 years to get financially sound. Finance Stocks Chart
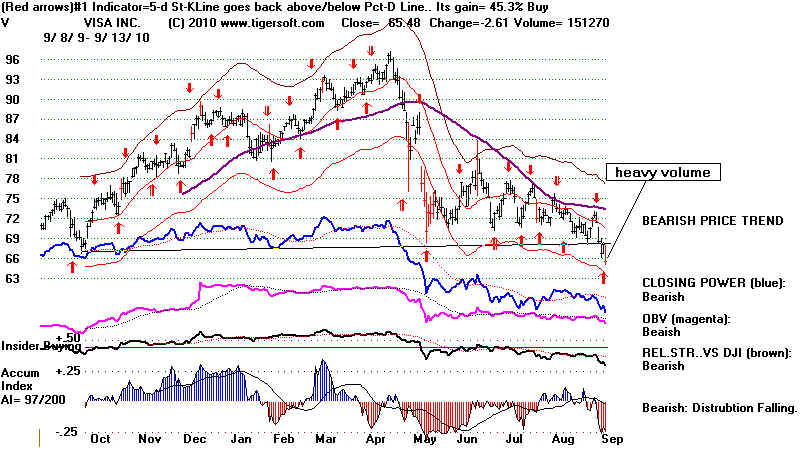
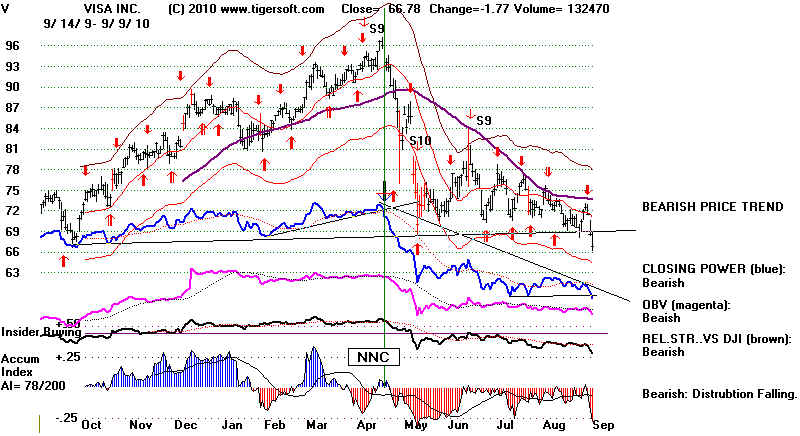
This
ignores the new 12-month low made today by weak-looking Visa (V)
What is
missing most in the discussion is the evidence that many of the world market's are
advancing
strongly and multinationals are going along for the ride. As investors, we have to
see
that we are
in a global market now. American jobs and prosperity are not synonymous with a
rising
stock market. Average Americans are not superfluous yet, but that's the trend.
The ease
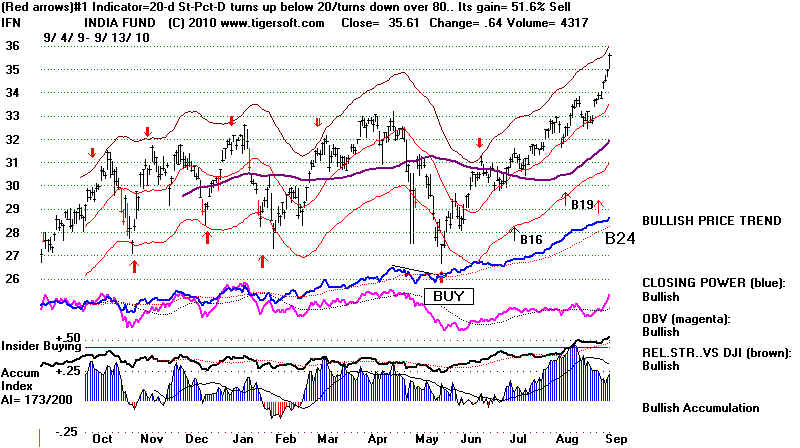
with which
American investors can now bet on the strong Indian market, for example, shows how
global the
markets have become and how and how and why hot money has come to consider America
a
"backwater"now. This is the inevitable result of "free"
international trade, something
which
Clinton, Rubin and now Obama and the University of Chicago "free traders" have
brought
to pass.
A part of me - my stomach - is very happy about globalization. Having grown
up in Ohio
when manufacturing was very big, I lament these loss of jobs now and wish Obama
was not so
dependent upon the thinking of the University of Chicago amd that he would
show some
originality courage, pugnacity and do more to promote jobs here.
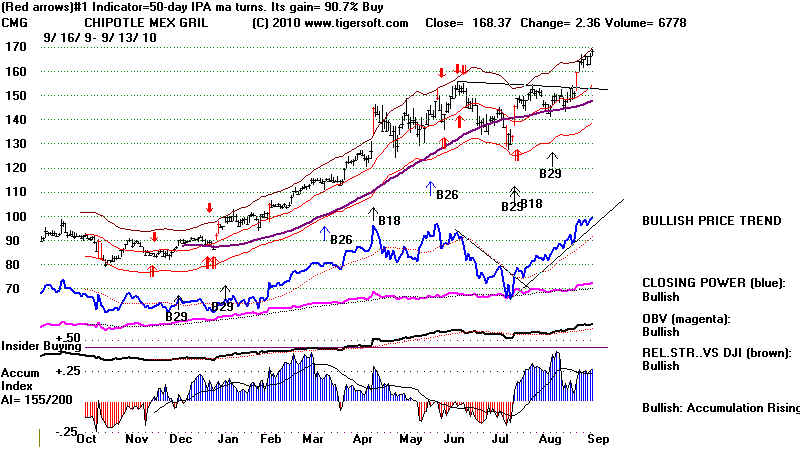
Internationalism does bring some real benefits to American consumers, of course, just like
immigration
does. For example, have any of you tried the spicy chicken at Chipotle's Mexican
Restaurant
(XMG)? Gourmet at fast-food prices. The stock is cooking!
Chipotle's (CMG) Great Food and
Modest Prices.
11/23/2008
An unsolicited
testimonial from a hungry Tiger

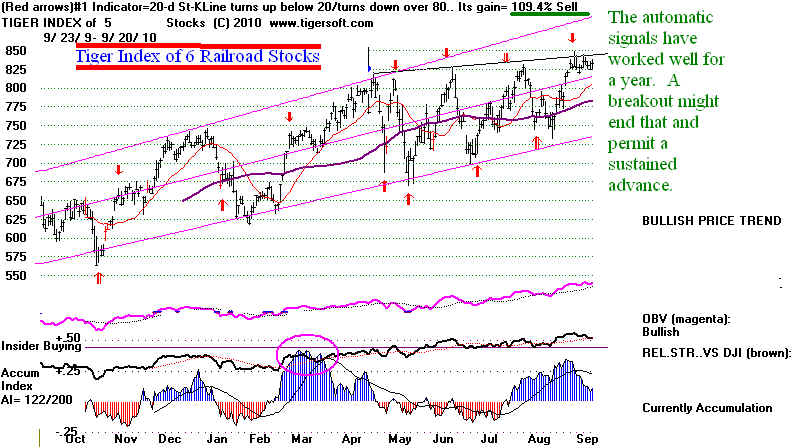
TIGER TRANSPORTATION INDEX
and KEY TRANSORTATION STOCKS
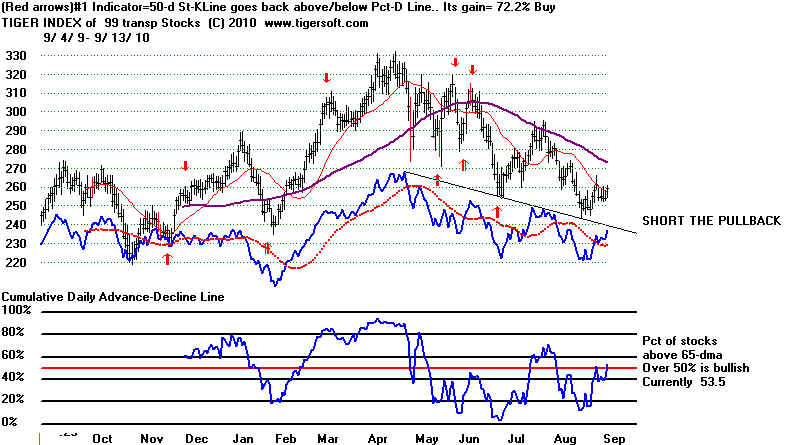
  

BNI's ONLY RR COMPETITOR - UNP

--------------------------------------------------------------------------------------------------------------------------
ATTRACTIVE TRANSPORTATION-INDUSTRY,
CONFIRMED BREAKOUT - BEAV
 |
INTERNET SECURITY STOCK #2 BUYOUT (#1 was MFE)
HP's BID FOR ARST WAS BEHIND ITS RECENT MAJOR TIGER BUYS.
Others in the general area are now distinct takeover possibilities:
ARST, BMC, CTXS, FFIV, MIPS, NTAP, NTCT, RDWR, RHT
and RVBD.
Deal-makers are being fed lots of ammunition now to promote these stocks.
These were picked out here two weeks ago using the "Bullish" screen
of MAXCP stocks.
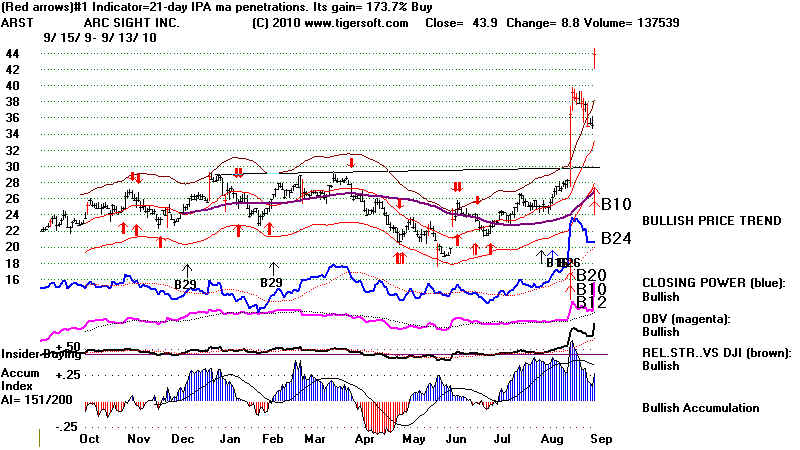 |
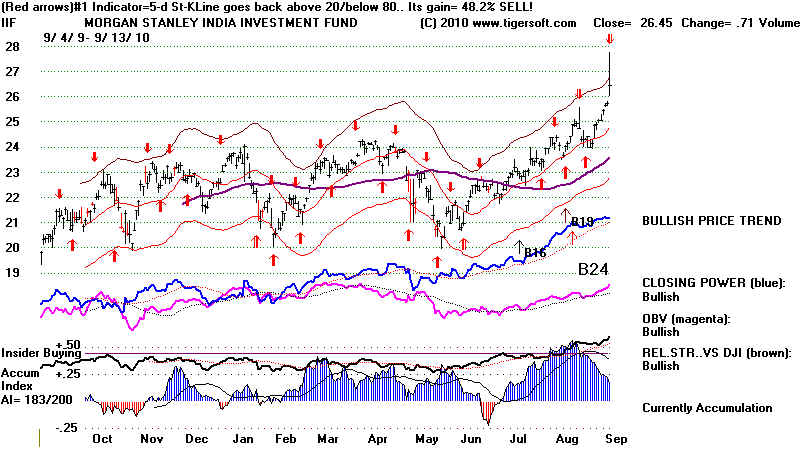
"BULLISH" COUNTRY FUNDS:
INDIA
CHILE
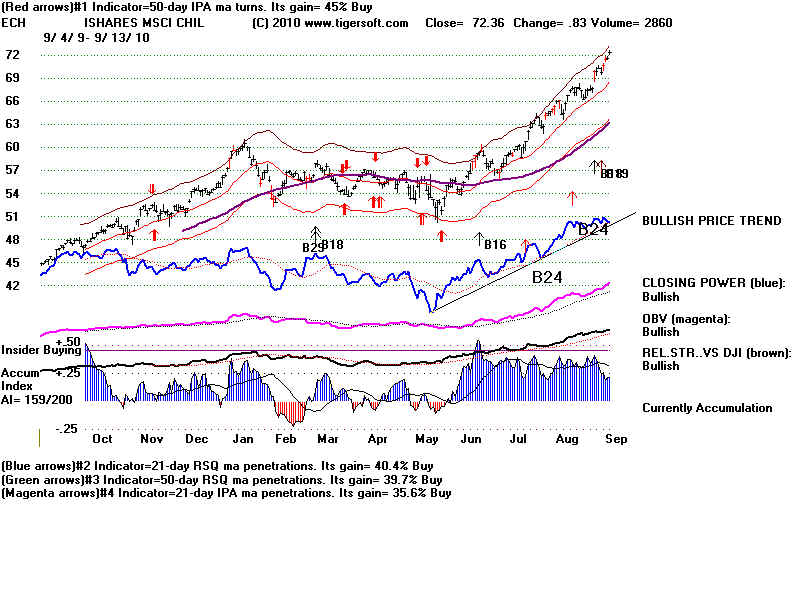 |
============================================================
9/10/2010 Peerless Remains on
A Buy. CLosing Powers Are Still
Rising and the QQQQ, SPY and DIA Are on
Still on Buys. Breadth
Improved Friday. Both the Opening
and CLosing Powers Are
Rising for SPY. This is normally
bullish.
So far on the rally since March 2009, the NYSE A/D
Line has hardly lagged the DJI
at any time
and actually made a new high ahead of prices. In rising this week,
it is
shrugging off the rise in interest rates that has started,
In all
this, the NYSE A/D Line has correctly presaged higher prices, while the lagging
trading
volume has not had its usual bearish effect. Will the DJI and the other indexes
continue to
follow the A/D Line and themselves make new highs? It is highly unusual
for a major
top to occur in these circumstances. Look at the study I have just completed
of all the
major tops since 1928,
http://www.tigersoftware.com/TigerBlogs/Sept-11-2010/index.html
In 20 of
the 24 cases when a major DJIA top was made, the NYSE A/D Line failed to
confirm the
final high. Many times, the divergence was a small one, in that it developed
only in the
last month of the DJI's final rise. Unfortunately, we can't build a Sell
based on
A/D Line NCs. Such non-confirmations are too common to use them alone
to predict
a bear market. But their absence is generally reliably bullish. Looking at
the 4 cases
when the A/D Line confirmed what turned out to be a major final top,
we see head
and shoulders patterns were warnings in 2 two cases. In the third
case, 1969,
Sell S9s were produced on the first rally back towards the final highs.
In the
fourth case, only when the DJI fell more than 12% from its highs, did the
NYSE A/D
Line break down.
The cases
where the A/D Line remained strong were:
5/29/46 Earlier S9 and H&S
12/2/69 S1...later S9
9/21/76 Later S8
5/21/01 Earlier S9 and earlier S12. H&S
I think
this means that we just have to wait for a Peerless Sell at this juncture.
We are long
DIA and some bullish MAXCP stocks and short IWM as well a
handful of
bearish MINCP stocks. That seems to be working. So, stick with
this
scheme.
Tonight's
review of all stocks for the Elite Stock Professional Page could
not find
much to recommend buying. Most of the bullish stocks were dividend
plays which
I fear are very overbought now. VRNT, TRE and RDWR, which
have been
recommended here, do still like holds. Foreign stocks are also
leaders.
New highs with IP21>.25, AI/200>140 and CP at new highs.
ABV - Comp. de Beba - 115.34
ARMH - Arm Holdings ADS - 18.55
ECH - Ishares Chile 71.53
It is on
the short side that I can find a number of new trades from the new bearish
MINCP
stocks:
BEARISH
MINCP STOCKS TO CONSIDER FOR NEW SHORTING:
CFFN 25.25 -.08
COMV 6.2 -.27
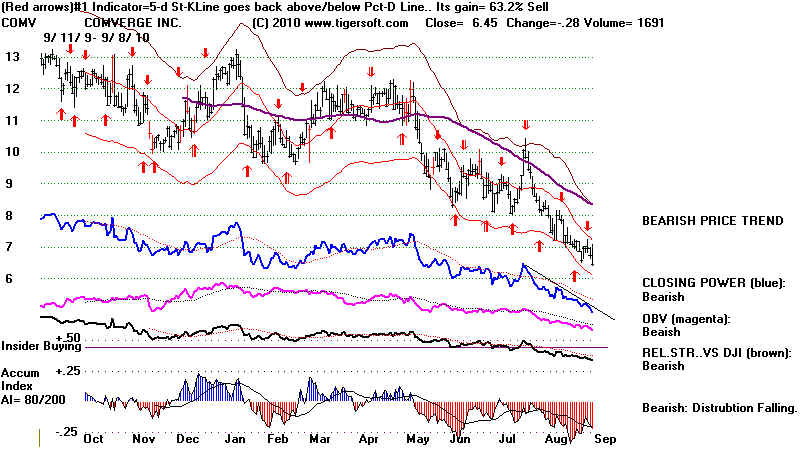
CSKI 6.57 -.23
UNTD 5.15 +.10
CRK 20.9 -.03
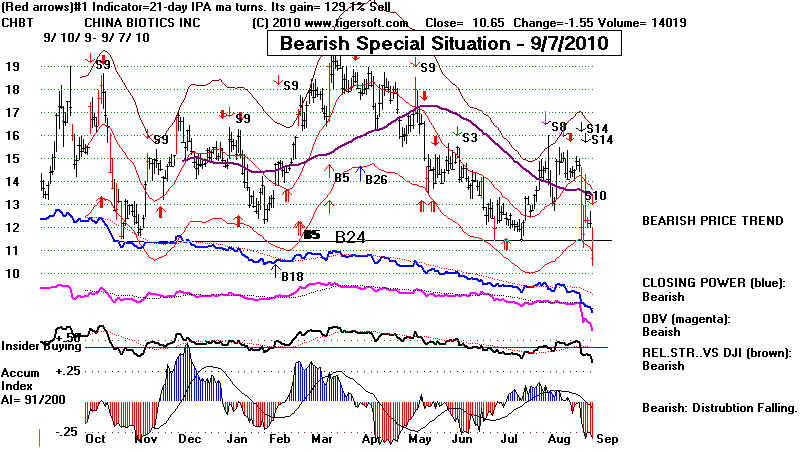
CHBT 10.57 +.50
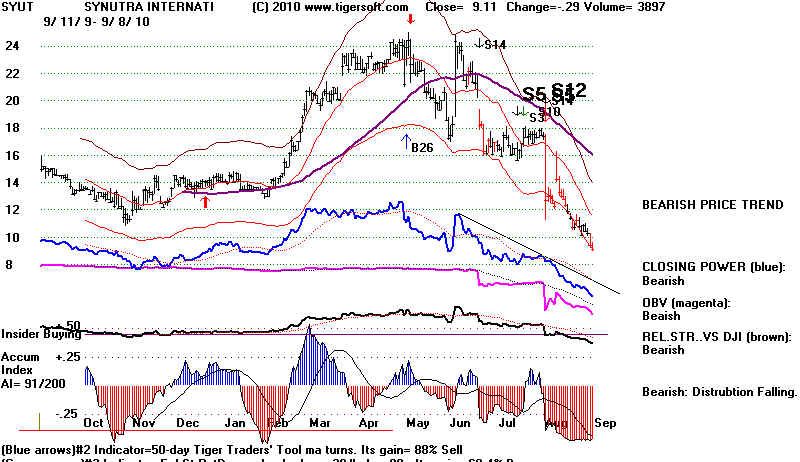
SYUT 9.15 -.16
PNEP 8.67 -.17
SWN 33.37 -.43
AMAG 25.19 -.04
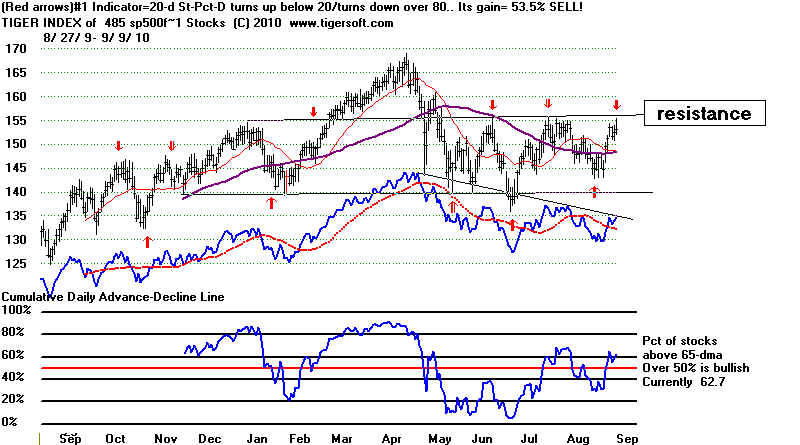
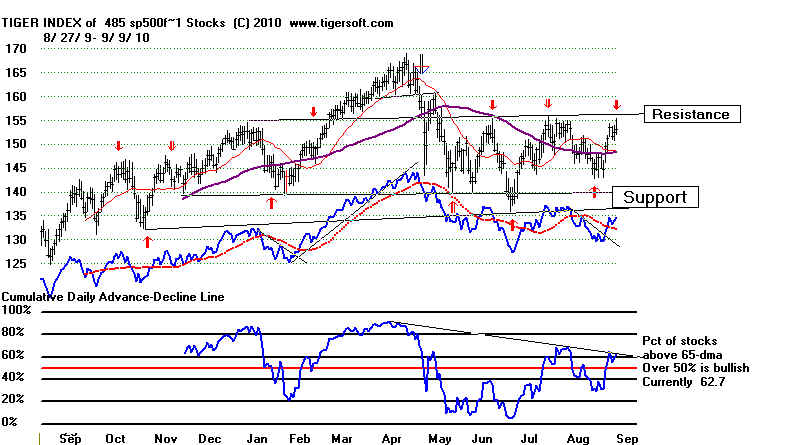
9/10/2010
The major market indexes are close to resistance, especially the SPY and the
Tiger
Index of SP-500 stocks. See their charts just below. This means they are close
to a
high
inflection point, where after an upside breakout, a spirited advance is possible, OR if
there
is a
downward reversal, there will be a sharp sell-off.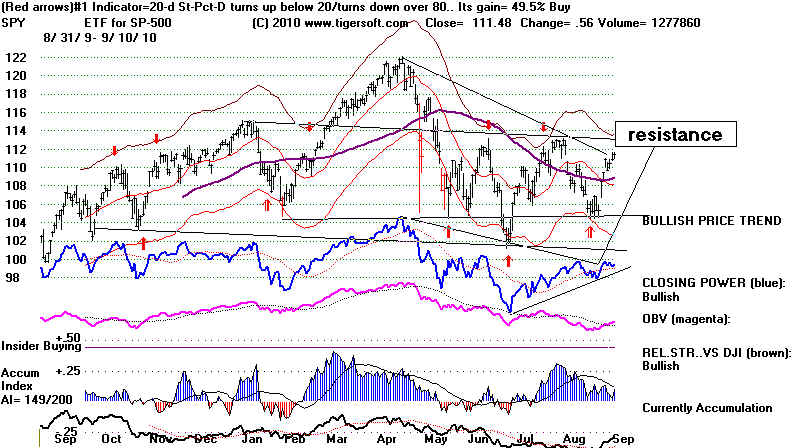
|
============================================================
9/9/2010 Peerless Remains on
A Buy. CLosing Powers Are Still
Rising and the QQQQ,
SPY and DIA Are on Still on Buys.
But, IWM - the Russell-2000 - has given a new Sell, its
Accumulation Index is
negative and another down day will
likely break the
uptrend of its rising Closing Power.
More dangerously, if the DJI were to have its theoretical high spike
up another 100 points
with the internal readings we see today,
we would get a Sell
S12. And now that the K-Lines of the Stochastic-
20 are above 80, we may
get an automatic red sell in the DIA
in the next day or two.
It
has to be bearish that Master Card (MA) and Visa (V) broke to
confirmed 12
month lows today. MA's chart is shown below and
and V's is at the
bottom of this date's hotline further below.
Master Card (MA) Is Breaking Down.

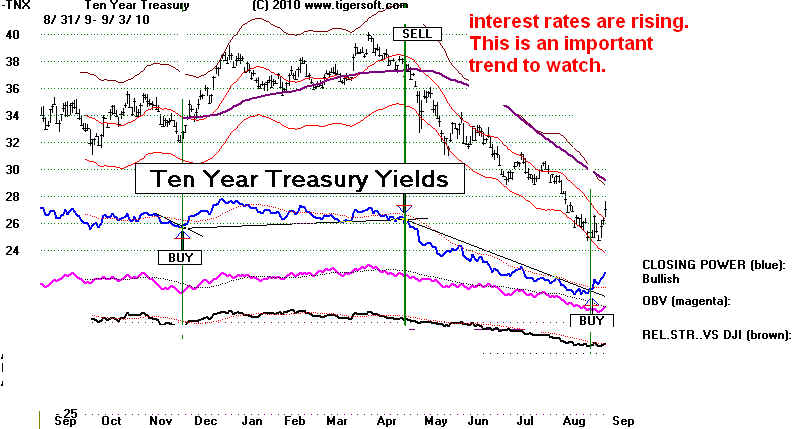
Rising interest rates may be the trigger that sets this off. See the new
red Up-Arrow in the
chart of the 10-Year Treasuries below.
- TNA Ten Year Treasury
Watch to see how the SP-500
stocks behave over the
next few trading days. They
are just below well-tested resistance.
At the same time, we now see a red
Stochastic Sell from the
optimum trading system.
Tiger Index of SP-500 Stocks with A/ D Line
Princeton's Paul
Krugman now believes a new Depression is
all but unavoidable
because Obama will not support a massive
public works program
and by talking about budget balancing
in the middle of a deep
recession he is making the same mistake
that FDR did in 1937.
The A/D Line is much stronger now.
Interest rates are much
lower. But since banks are not making
more loans, will
monetary policy make the difference as
Bernanke and Obama
think and Friedman thought.
Monetary policy is not
only limited by business and consumer
demand, it is also
subject to international forces outside its
control. What
would happen if China starts selling some of its
Treasury bonds to
remind the US that it (China) has the
upper hand when it
comes to its trade and currency policies?
See - my 9/9/2010
comments at
http://www.tigersoftware.com/news_updates_to_tigersoft_blogs_.htm
In the past, Krugman has also been very critical of the
hold the
University of Chicago's
laissez-faire economic thinking has
over Obama, Axelrod and
Emmanuel. This influence lies behind,
for example, Obama's
pointed refusal to say he would veto extension of
Bush tax cuts for
the wealthy. Obama wants to keep the stock market
moving higher. If
the very wealthy are taxed, they will sell stocks.
Unlike FDR who savored advisers with different viewpoints, Obama
has surrounded himself
with very like-minded Chicago school economists.
They all celebrate and
protect the general status quo. They blame government
for the Crashes of
1929-1932, 1937-1938 and 2007-2009. Progressive and
populist critics of
Obama's economic policies do not understand this source
for Obama's rigid
adherence to laissez-faire views on health care, Wall Street banking,
social inequalities and
exorbitant CEO pay. They do not detect the U of Chicago's
dogmatic anti-Keynesian
resistance to the potential role government could play
in creating jobs and
promoting a business revival...
BEARISH MINCP STOCKS
HAWK 7.61 still on a Red Buy.
ALNY 14.16 Distribution, on red Sell...Declining Closing Power. (looks like a short
sale to me.)
KNDL 8.36 On Red Buy, but heavy Distribution and falling CLosing Power.
CFFN 25.33 -.15 Very weak but thin...
COMV 6.47 +.02 Distribution, on red Sell...Declining Closing Power.
Visa (V) 93.61 Serious
breakdown. Sell Short.
==============================================================
HOTLINE
9/8/2010
Peerless Remains on A Buy. CLosing Powers Are Still
Rising. The QQQQ,
SPY and DIA Are on Still on Buys.
You can see the
internals of the market are weakening, other
than the NYSE A/D
Line, whose strength owes to the very low
interest rares.
The NASDAQ shows only 40 new highs and 20
new lows, while the
same numbers are 113 and 7.
The DJI is 1.2% over
the 21-day ma with the P-Indicator at -16 and
Accum. Index is only
+.01. The V-Indicator is -128 and the
OPct is -.104.
Right shoulder apexes in head and shoulders
patterns ordinarily
have low volume. The last two days' volume
is the lowest since
last December. Breadth was good today,
but it did not make up
for Monday's weakness. If the DJI's
hypothetical high was
to jump by 200 points, with no changes
in the internals, we
would get a major Sell. Of course, that
has not occurred yet
and may not, but we should be ready to
reverse to a Sell.
Hedging by being long DIA and and some
of the bullish MAXCP
stocks and short IWM and some of the
bearish MINCP stocks is
recommended.
The multiple head and
shoulders patterns are worrisome,
as is the bearish
September seasonality and Gold's strength
now. A
rally in Gold and Silver often warn of a coming general
market
decline. Both close to making new highs.
Perpetual Contract of
Gold
Perpetual Contract of
Silver
Bullish MAXCP Stocks
VMW +1.3 FFIV +3.59 VRNT +.88 NZ +2.63
Verint Systems Inc. provides actionable intelligence solutions and
value-added services worldwide.
Its solutions capture, distill, and analyze underused information sources, such as voice,
video, and unstructured text.
42 is all-time high.
Netezza Corporation provides data
warehouse, analytic, and monitoring appliances
to enterprises, mid-market companies, and government agencies in the United States
and internationally. It offers TwinFintm and Skimmertm data warehouse products, which
integrate database, server, and storage platforms in purpose-built units to enable queries
and analyses on stored data. 17
was an all-time high.
Bearish MINCP Stocks
COMV
MPWR
SYUT
============================================================
9/7/2010 Peerless Remains on A Buy. CLosing Powers Are Still
Rising. The QQQQ,
SPY and DIA Are on Still on Buys.
The DJI rallies only
43.6% of the time since 1965 over the
next 21 trading days
and in bi-elections years since 1918, the
DJI has risen in 8
Septembers but falled in 23 cases.
It still seems a good
time to be hedged. The IWM (Russell-2000)
has given a Sell.
Sell it short while holding long the DIA, which
remains on a Buy.
The bullish MAXCP stocks that are not dividend
plays should
out-perform the bearish MINCP stocks. A number of
short sale candidates
are shown below from the "bearish" MINCP
stocks
Bullish MAXCP (149)
VMW, VOD, VGR, NZ, EZCH, EW, VRX,
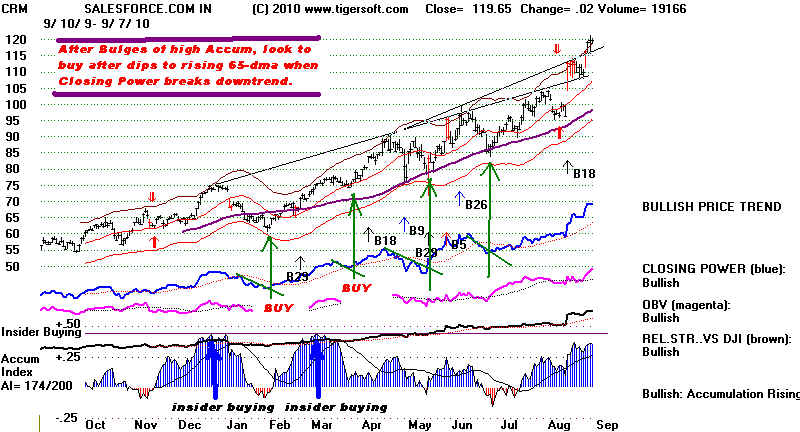
TRE, CRM, FFIV and AZO
Stocks that have not broken their 65-day ma for 7 months have trapped a lot of
shorts and tend to jump with each new high as many are forced to quickly cover.
Bearish MINCP
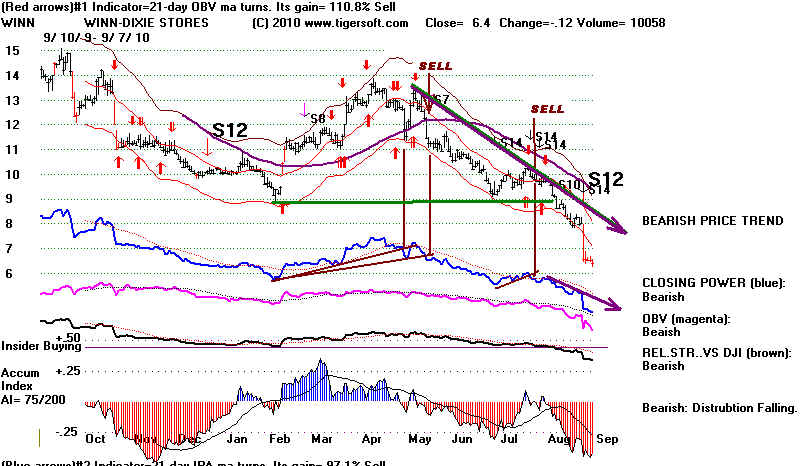
HAWK, BAMM, WINN, CFFN, KNDL, COMV, TKLC,
CSKI, CHBT, ROCM, MPWR, and IVAC

Stochastic Red Sells
among Stochastic-5 Stocks
with Negative
Accumulation and Below 65-dma:
AAON, ATI, ATSG, BCRX, BOOM, CIR, STP. UEPI
and NWPX


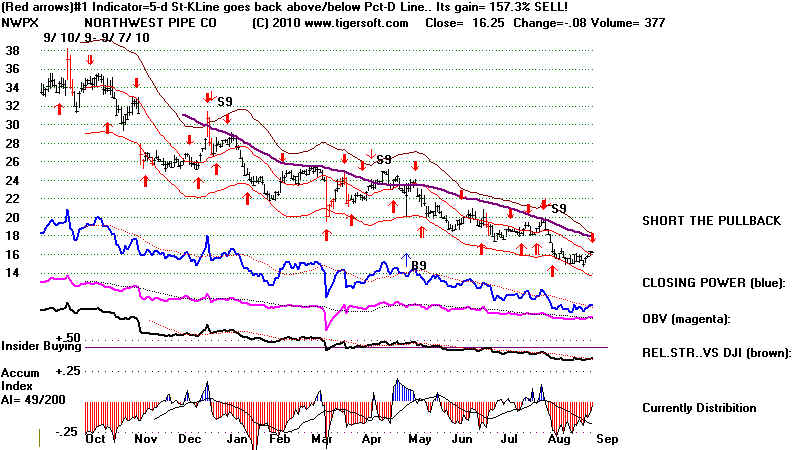
===============================================================
9/3/2010
Rally within Trading Range Towards Resistance
at Upper Band at 10650.
But Volume was pathetic on the rally.
This and Bearishness of
Septembers Are Warnings. Watch
for Breaks in Closing
Powers' Uptrends and A/D Lines' Uptrends.
Hedge with New Short Sales?
Weakness Tuesday Would
Likely Bring Automatic Red Sells
from Many Stocks Traded
Best with 5-Day Stochastics.
New Red Sells in this
group from stocks below their
65-day ma with negative
Accum. Index are: ACOR and HMA.
For potential short
sales, we will be looking at Sell S9s in
individual stocks where
the CLosing Power uptrend is violated.
Rising Rates?
The very good breadth
has again saved the market from
medicore up-day volume
and the bearish head and shoulders
patterns. Since
the good breadth has been based on the
very low interest
rates, we have to ask what would happen if
interest rates start to
rise. Would the Fed do that before
the November Elections?
Volcker raised rates in 1978 and
caused a mini-panic.
Watch rates.
Septembers were bearish in 15 of the 23 years when there
was a Congressional
Election but no Presidential Election.
Octobers are the months
most often to bring a turn-around.
Only 9 of these
Octobers were down. Decembers in these
years bring automatic
Buys on weakness because of the
overwhelming tendency
for a rally from December lows
after mid-term
Elections.
MID-TERM ELECTION YEARS DJIA Performances in September, October, November and December
in Even Numbered Years between Presidential Elections
          last day   Last day  last day  last day  last day   Change in
          in Aug     in Sept      in Oct.   in Nov.     in Dec.     Last 4 Months
       ---------------------------------------------------------------------------------------------------
1918   82.70      84.70        85.50      80.90        82.20      DOWN
1922  100.80     97.10        96.10      94.70        98.20      DOWN
1926  162.50     158.20    150.80     156.60      157.20    DOWN
1930  240.40     204.90    188.10     180.90      164.60    DOWN
1934   92.90      92.50        93.10     102.90       104.00    UP

1938  138.30     141.50    151.70     146.10      154.49    UP
1942  106.20     109.10    113.10     114.50      119.40    UP
1946  189.20     172.40    169.29     169.80      177.20    DOWN  low was on 10/9/1943 at 163
1950  216.90     226.40    225.00     227.60      235.40    UP
1954  335.90     336.50    352.10     386.80      404.40    UP

1958  507.70     532.10    543.20     557.50      583.70     UP
1962  602.90     578.90    589.80     652.60      652.10    UP low was on 10/23/1962 at 558
1966  788.40     774.20    807.10     791.60      785.70   DOWN low was on 10/7/1966 at 744
1970  765.80     760.70    755.60     794.10      838.50   UP low was on 9/22/1970 at 748
1974  656.80     607.90    665.50     618.70      616.20   DOWN  low was on 10/3/1974 at 588

1978  876.62     865.82    792.45     799.03     816.10    UP  low was on 11/14/1978 at 785
 1982  901.31    896.25    990.99     1039        1059       UP
1986   1898       1768       1878        1914        1896        DOWN
1990    2593       2452      2442         2560       2634       UP  low was on 10/11/1990 at 2365
1994    3913       3843      3908         3739       3834      DOWN  low was on 11/23/1994 at 3675

1998    7539       8081      8495         9117       9181      UP   low was on 10/1/1998 at 7633
2002    8737       8664      7592         8397       8896      UP    low was on 10/9/2002 at 7286
2006   11381     11679    12081     12222    12463      UP
------------------------------------------------------------------------------------
                             8 up       14               15         17           14
                         23 down    9                  8           6              9
|
The market will face resistance this coming week
as it rallied towards
its upper band, at 10650 from:
1) now rising interest rates,
2) bearish post Labor Day 21-trading day seasonality (where the
DJIA is up only 43.6%
of the time since 1965),
3) the just barely positive internals (P=+50), IP21=+.066)
and negative volume
readings (V=-119) and (OPct=-.106).
Tagging the upper band
with the present internals would NOT
bring a Peerless Sell,
however. But breadth is likely to weaken
if interest rates
continue to rise. The CLosing Power downtrend
for Interest Rates has
been broken. Of course, interest rates
are still very low.
CDs are under one percent. This forces a lot
of investors to put
money into the market. Bond funds are still
rising, but the long
uptrend is weakening. Utility Stocks, a
beneficiary of low
rates have reached resistance, but 78.5%
of them are above their
65-dma.

B8s, B9s, S8s and
S9s on ETFs Work Well in Trading Ranges.
Use CLosing Power Trends to Clinch These Signals.
Watch Gold's Rising CLosing Power Lines.
I wrote up instructions recently on how
to trade with an emphasis
on the these signals being clinched by
trend-breaks of the Closing
Power. The B8s and S8s occur when a
price move is not confirmed
by OBV, Stochastic-20 and IPA near the
bands. The B9s and S9s
show that there is a positive
non-confirmation or a negative
non-confirmation by the Accumulation
Index. See the write-up
I did at http://tigersoft.com/TigerSoft-Simple-Very-Profitable/Part-2.htm
Look a little
later at these signals on the SPY since 1993 here.
Roaring bull markets with the DJI moving
into new all-time high
territory do not let them work well.
But when multiple head and
shoulders patterns develop as in
2000-2001 and 2007-2008, the
S8s and S9s are very valuable aids to
tell you when uptrends
are over and bigger declines will start.
=============================================================
9/2/2010
Happy Labor Day Weekend.
NYSE A/D Line Downtrend-Break. There were more than
1200 up then down on
the NYSE. With this downtrend-break,
The DJIA should Rally.
There are three levels of resistance:
10400, 10600 and 10800.
My guess is that the upper
3.5% Band at 10661 seem
the best future target. 3.7% is the
optimized upper band.
The Head and Shoulders pattern is
losing its symmetry.
A close above 10400 would destroy
the most recent DJI H/S
pattern. The short-covering that causes
should make the DJI
reach 10600-10750.
Cover
the QQQQ Short sale unless the NASDAQ is very weak at the
opening and hold long DIA.
The QQQQ has broken its downtrend.
That usually means the QQQQ will get past the falling 65-day ma
if the Accumulation Index is positive. The current AI is +.053.
FLASH - The economy lost 54,000 jobs as 114,000
temporary census
positions came to an end. State and local
governments shed
10,000 positions. The jobless rate rose
to 9.6 percent
from 9.5 percent in July. Significance:
There
will most likely
NOT be any change in the FED's very low
interest rates if
they can hold back Gold and the Dollar
does not fall
apart. The Tiger chart of the Dollar, shows it
may weaken.
So, the FED and Treasury may try to make Gold fall.
FLASH - Kabul
Bank run may pose more immediate threat than Afghan Taliban?
(Christian Science Monitor)
"The Kabul Bank is a bedrock for a stable
Afghan society. Its collapse could
spell disaster for the country already battling a resurgent Afghan Taliban."
---> Watch Gold to see if it turns down from here,
which would be
bullish for the market, or breaks above
resistance -
which would be bearish for the market.
Next Week
and Bush Tax Cuts
---> Watch the news on the Bush tax cuts as they
apply to the very wealthy.
After
Labor Day, it will be harder for the DJI to make
gains. The bearish seasonality kicks in then. Tuitions seem to take
a lot of money off the table. The longer days bring less optimism. But
it does look like the Senate and House will back away from their talk
about letting the Bush tax cuts on on the very rich lapse. As the rich
own the vast amount of stock, this would be bullish for the stock market
in the short run. Longer term, it would also mean a more unbalanced budget.
That would probably boost Gold.
The NYSE seems to be back on solid ground. It is
back above its 65-day ma and the ratio of new highs
to new lows today is 97 to 8. On the NASDAQ, the ratio
is a much less robust 37 to 10. The NASDAQ is still below
its falling 65-day ma. The Tiger RELDJI indicator is in
red (bearish) territory.
Work with the rising
Closing Power Lines and Short-Term
Buys now. A much bigger move could be started by a
DJI Advance Past 10800. Close out
Short Sale Hedges
if CLosing Power Downtrend-Lines Are Broken. That means
closing out the QQQQ short now and hold long DIA. I am
impressed that there are 281 MAXCP stocks on Buy and
30 MINCP stocks.
MOST BULLISH MAXCP STOCKS
Dividend Plays: BTZ, LNT, NIO, EDD, EPD, BLW, TEG, MWO, FCFS,
Others: VMW 82.74 +1.17, AAP 56.29 +.81, CRM 119.12 +2.72, ADVS 51.63 +.48
NZ 20.84 + .68, EW 60.42 + 1.48 and EZCH 24.04 +1.44
and TRE 6.08 +.52 TANZANIAN ROYALTY
(recommended here recently)
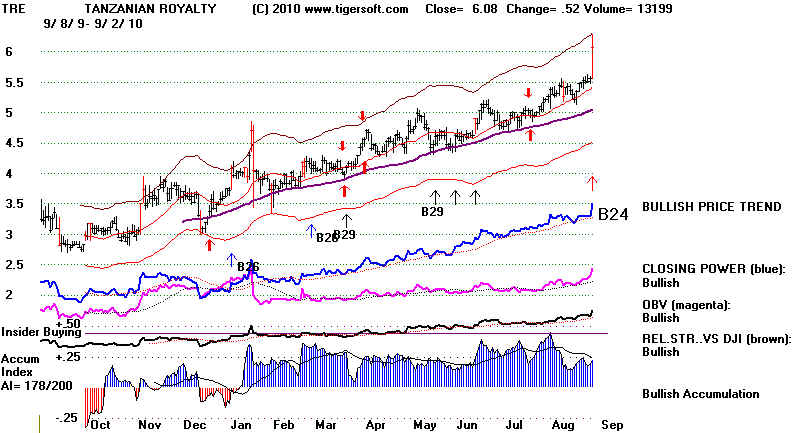
GOLD Knocking on New Highs?
Gold Stocks (below) and Foreign ETFs have been the leaders.
Gold is now at resistance, a high inflection point.
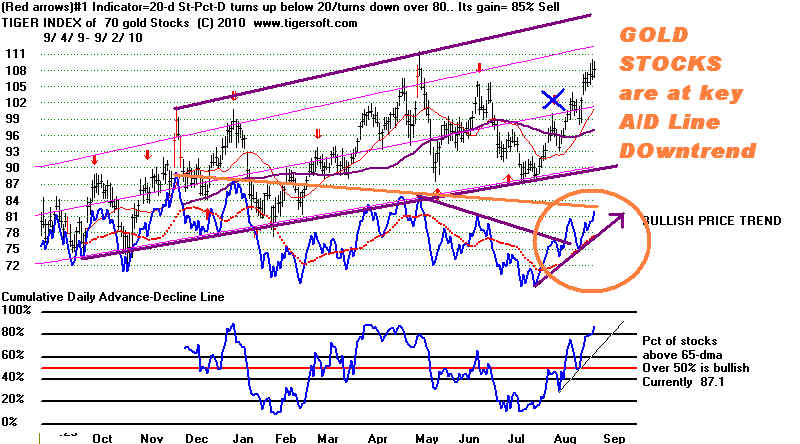
Gold stocks are at their key A/D Line resistance. Often gold stocks
are negatively correlated with the market. If they breakout
it will be bearish for the market, because it means inflation
will be feared by Central Bankers. And that will cause them
to start raising interest rates. If the Gold stocks fall back,
it will be a positive sign for the market as a whole. Gold
stocks declined very significantly between 1995 and 2000
while the stock market was red hot. Importantly, home-builders
rebounded up quite strongly. More than half (63%) of their
number are above their key 65-day ma. As they led the
market down, a rise by them would give boost to confidence.
POLITICAL ECONOMY: The Important of Obama's Choice
to Head The Consumer Protection Financial Agency.
Finance stocks are holding at support. But only 37%
are
above their 65-day ma. That shows weakness still. They
are waiting to see if Elizabeth Warren is made the head of
consumer oversight of banks. Predictably, the bankers' friends in the
Obama Administration (Summers and Geithner) are opposed. Obama
usually listens to them, but we
need to wait and see.

Elizabeth
Warren Banks on Reform
Read this and you will see why Wall Street banks are afraid of this lady.
Obama will make a lot of his backers very upset if he does not make this
appointment. As much as he might wish, he cannot avoid making a decision
here. There will be ripples.
DJIA's A/D Line Down-Trend Is Broken.
See how the A/D Line has risen on NYSE
this year as the DJI
has gone
sidewise. This is normally bullish, though 1977 and
2001 are two
glaring exceptions.
DJI's HEAD AND SHOULDERS
versus RISING A/D LINE.
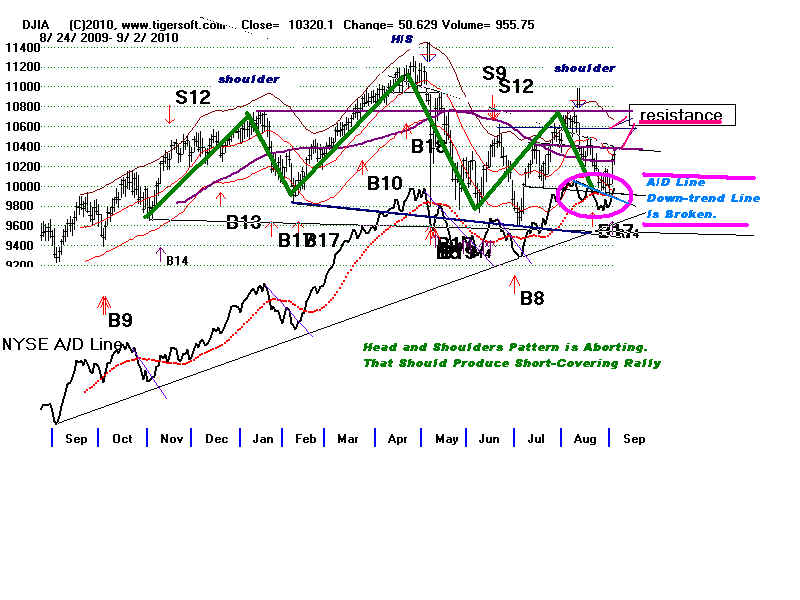
==============================================================
9/1/2010 CURRENT DJIA CHART and PEERLESS SIGNALS
STAY HEDGED ANOTHER DAY.
Good day for the bulls. New Buy B14 because up volume swamped down volume. The
steeper
Closing Power downtrendlines ware all violated to the upside.
We see automatic Buys on the DJIA,
SPY and QQQQ. the symmetry for the DJIA and NASDAQ's
bearish head and shoulders patterns
is starting to be strained. One more good day of good
breadth will void the key NYSE A/D Line's
intermediate-term downtrend and move the DJIA, NASDAQ, SPY, QQQQ
and DIA above their 65-day
ma. Certainly, it is bullish, too, that the Closiing Powers
(representing Professionals) are above
their rising 21-day ma while the Opening Powers (representing
overseas and public buying) are
bearishly below their 21-day ma. Volume also has picked up
as the markets rallied these last two days,
Bullishly, there were 241 stocks in the MAXCP condition, where
the Closing Power is making new 12 month
highs and only 46 in MINCPs where the CLosing Power was making a
12 month low in the last two
days. NHCONF - where the new 12 month highs show a current
Accum Level above +.25 number
60. A week ago, this data file was too few to build.
Foreign ETFs led the rally. Can they sustain a US recovery
with unemployment so high?
Some heavily shorted oversold stocks like BAC. MEE (Massee
Energy) and SCHW (Scwab) did well today..
CAT, the highest AI/200 stock in the DJIA, was the second biggest
gainer, rising 4%.
Rallies are to be expected just before Labor Day. But what
happens afterward is often much more bearish.
Since 1965, the DJI has risen only 43.6% of the time in the month
after September 6th. The
key NYSE A/D Line downtrend has not yet been broken. So,
intermediate-term traders should,
I think, stay hedged another day, long DIA and short QQQQ or,
preferably long some of the most bullish
MAXCP stocks and short the most bearish MINCPs. Do watch the trendlines of the Closing Power.
Violations of these trendlines justify covering short sales and
closing out long positions, most especially
when they are over-extended.
As long as you watch for breaks in the CLosign Power uptrends,
there is not too much risk buying the high
Accumulation/Strong CLosing Power stocks.
The most bullish NHCONF stocks today are
BTZ 13.28 +.12
BlackRock Credit Allocation Income Trust IV
NIO 15.09 +.05 Nuveen Insured Municipal
Opportunity Fund
WEC 56.95 +1.21 Wisconsin Energy dividend
+2.95%
CRM 116.4 +6.52 Salesforce.com http://www.salesforce.com Serves intern. mkt.
NZ 20.16 +.70 Netezza http://www.netezza.com
Serves intern. mkt.
MWO 23.83
+.03 Morgan Stanley Cap Tr V Gtd Cap
BLW 16.93 BlackRock Limited Duration
Income Trust
XEL 22.79
+ .48 Xcel Energy Dividend +4.5%
EW 58.94 +1.37 Edwards Lifesciences
NAD 15.15 +.10
Nuveen Dividend Advantage Municipal Fund
ECH 69.04 +2.19 Chile
...
Recently mentioned here:
MIPS
6.89 +.30 Mips Techn.
RADS 18.83
+.92 Radiant Systems. See 8/30/2010 Hotline below.
RHAT
35.65 +1.1 Red Hat
There are always special situations, too:
BVF - Biovail keeps rising with new B24s.
23.85 +.90
CTRX 60.15 +2.1
VMED 21.91 +1.11
Big CLosing Power Bullish Divergences:
COST and VRNT
DIA is at key 65-dma and approaching 4 month
downtrendline of CLosing Power.
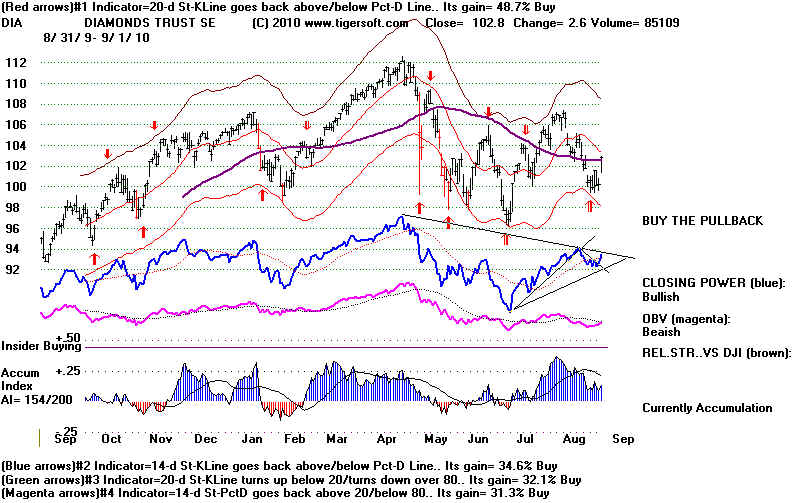
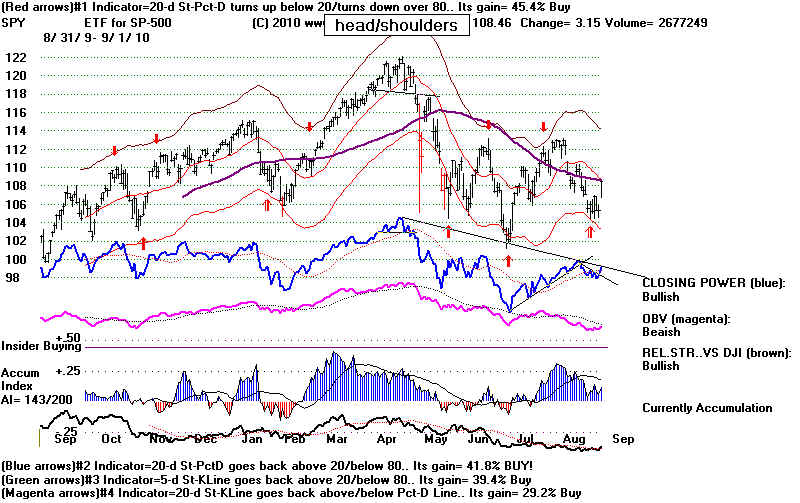

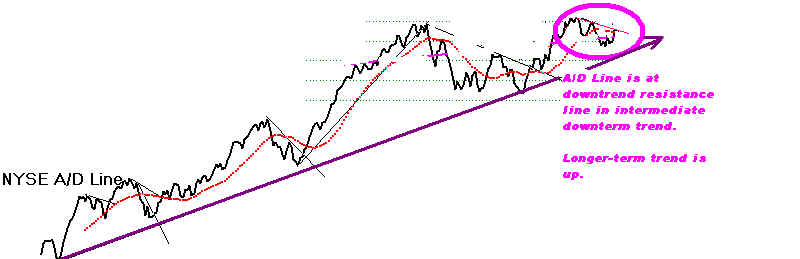
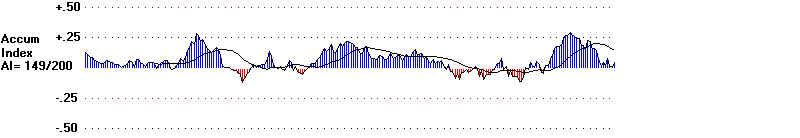

NASDAQ
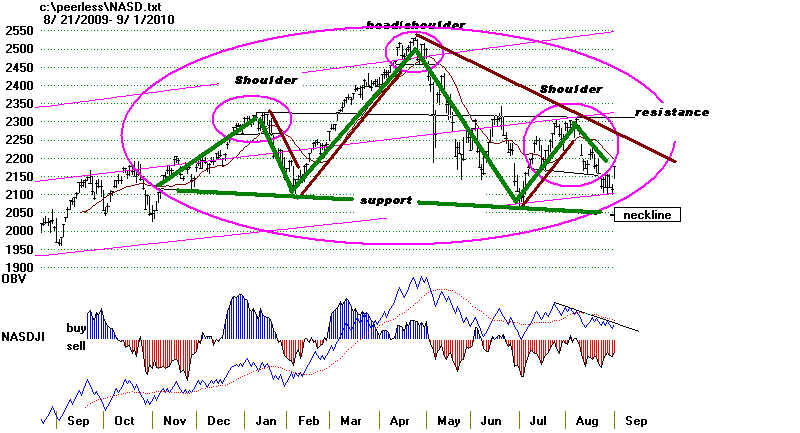
==============================================================
8/31/2010 CURRENT DJIA CHART and PEERLESS SIGNALS
We Remained Hedged: Long DIA and short QQQQ
or as I prefer, long some "Bullish"
MAXCP stocks and short some "Bearish"
MINCP stocks. NEM and TRE should be bought
among the strongest Gold Stocks.
The bearish head and shoulders patterns have not
appeared for nothing. They are bearish omens.
If their necklines give way, a very big decline
seems likely, based on lots of historical parallels.
The levels of Accumulation are dimminishing.
This is a warning that the big buyers are dwindling
and may not be able to hold the marke up if the
necklines are tested. The favorable NYSE advances
and declines data are normally bullish.
But they do not always save the day. I have pointed out
early 1977 and early 2001 as such cases. New
high/low data shows how much weaker the NASDAQ
is now than the NYSE. On the NASDAQ, the
ratio of 12-month highs to lows was a bearish 14 to 85,
but on the NYSE, it was a positive 77 to 45.
I have suggested shorting some of the stocks
whose Closing Power is making new lows that also
show heavy Red distribution. Click
here to see some of the stocks making actual new lows now that
show
great internal weakness, too. Hedging at its best means making money on both ends, as
the
stocks below show.
Recent BULLISH MAXCP Stock
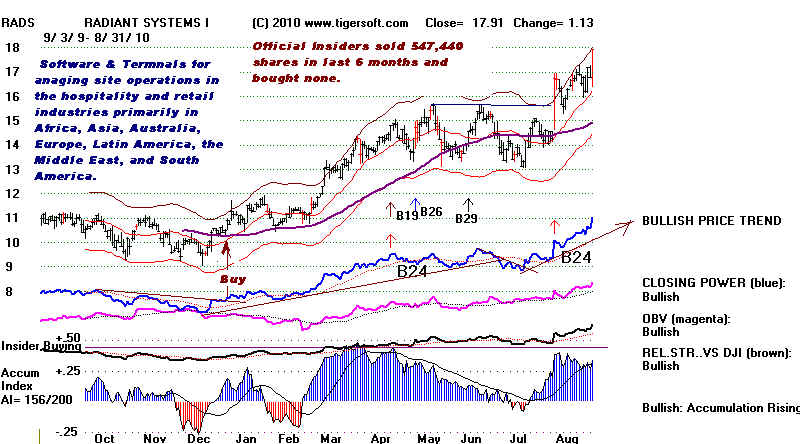
Recent BEARISH MINCP Stock
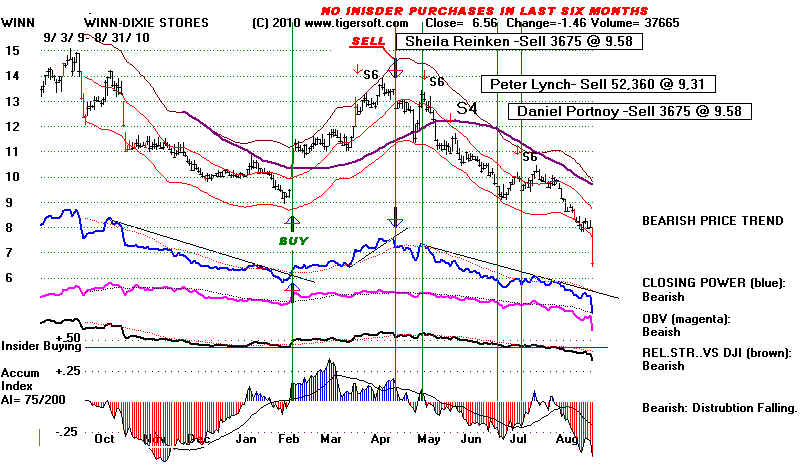
With September, the most bearish month of the year coming up, it is not,
at all clear that the Fed can
hold the market up with low interest
rates in the next few months. Perhaps, internal dissension inside
the FED will force a change in the policy
of very low rates. Perhaps, the Dollar will turn so weak,
the Fed will have to try to protect it by
raising rates back up. These factors are not evident yet, but
Gold is challenging its June highs.
A breakout by it would not be good for the Dollar or the policy
of low interest rates.
GOLD STOCKS TO BUY NOW
I have already recommended TRE here as it went over $5, a
month or so ago, Clearly it is
a very specualtive gold play. But
look how much such stocks can rise.

Speculative ANV has almost tripled in the 18
months since I recommended it here.
(Unfortunately we sold it way too soon at 16.)

BUY
NEM.. Since both Opening and CLosing Power are rising now for NEM, I would
buy it now for this breakout
play and sell it if the Closing Power uptrend is violated.
Watch NEM to see if it can
make a historicclosing breakout over 63.2 It would
defintely be a buy if this
happens. See the weekly and daily charts below. Earnings at
Newmont Mining Corp., the
largest U.S. gold producer, may increase 47 percent to $1.93
billion in 2010, according to
the mean estimate of seven analysts’ forecasts compiled by Bloomberg.
Unfortunately, I have to add
that big advances by NEM have historically been bad signs for the
stock market. See Tiger Blog of
2/1/2008 - http://www.tigersoftware.com/TigerBlogs/02-21-2008/index.html
"Spot General Market
Tops by Noting Newmont Mine's Run-ups."
Newmont Weekly - NEM
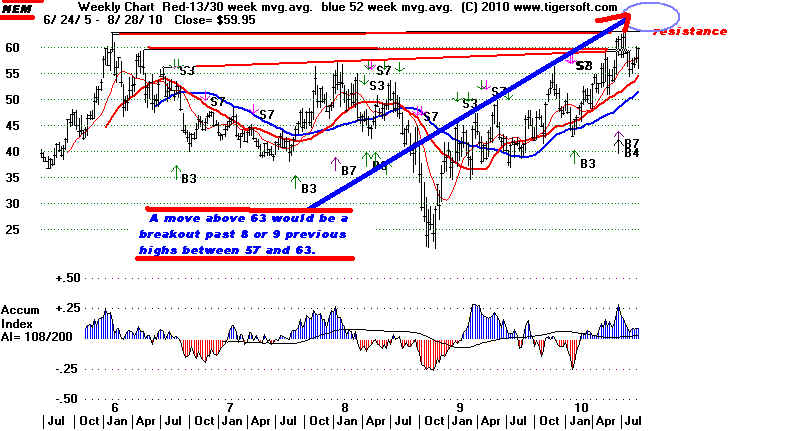 |
Newmont Daily - NEM
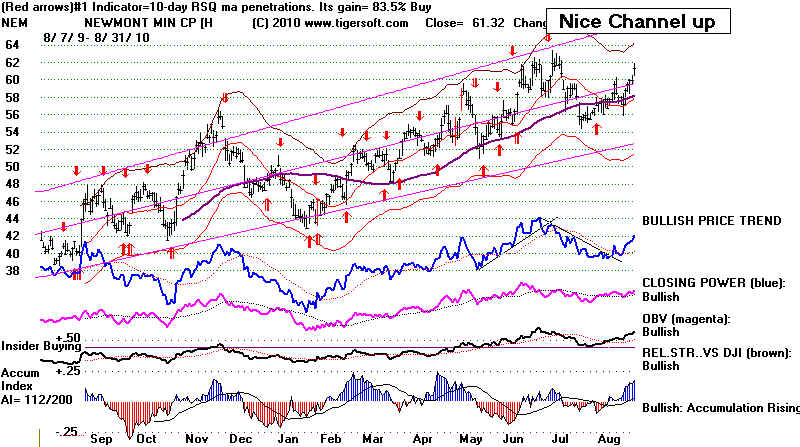
 |
DJIA and NASDAQ
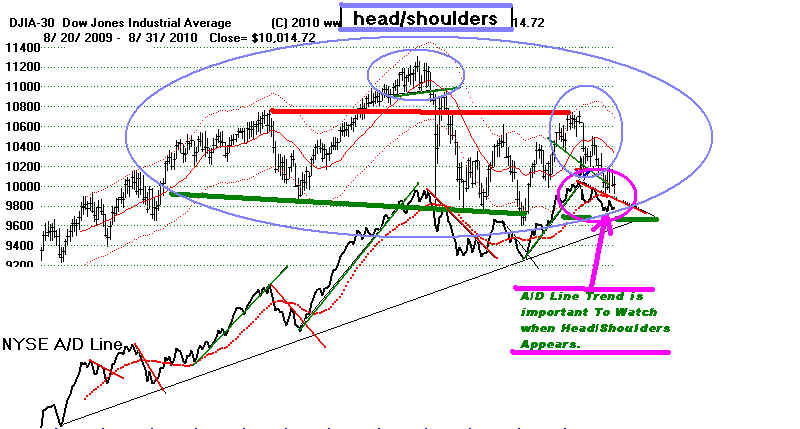

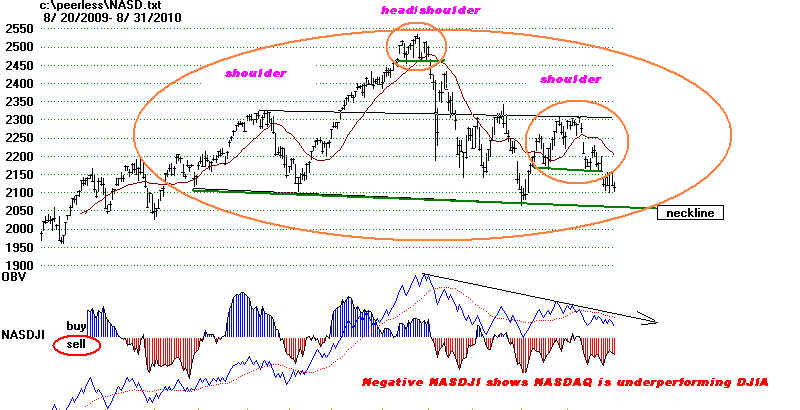
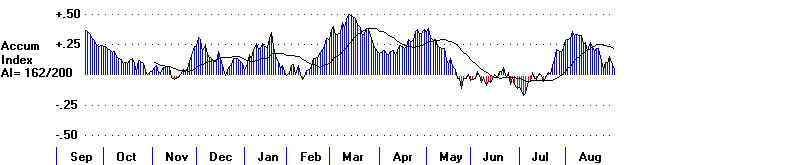
|
| |
-
|
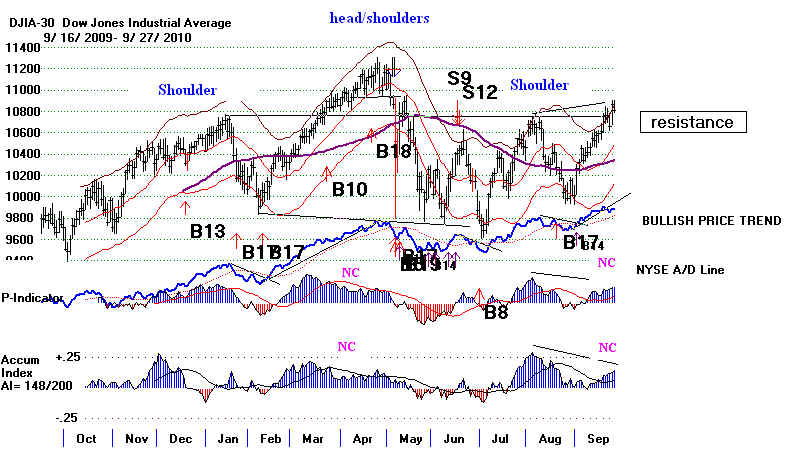
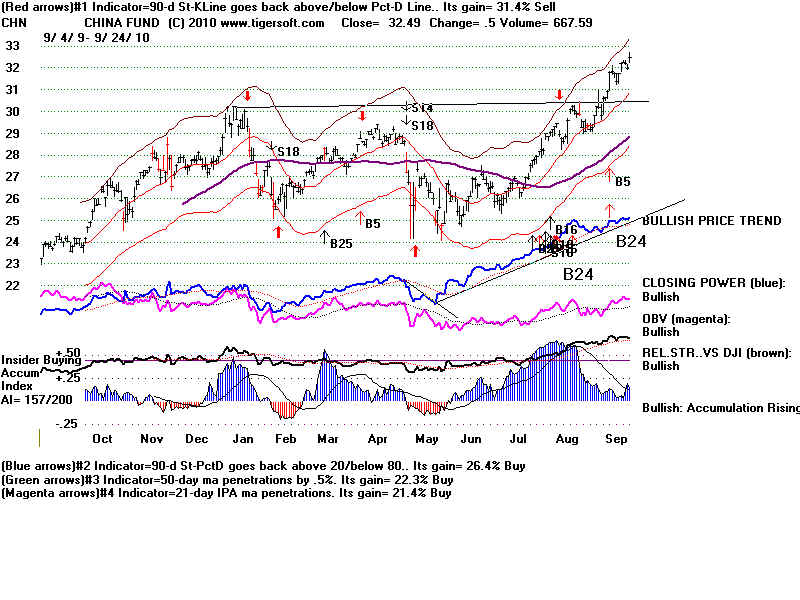
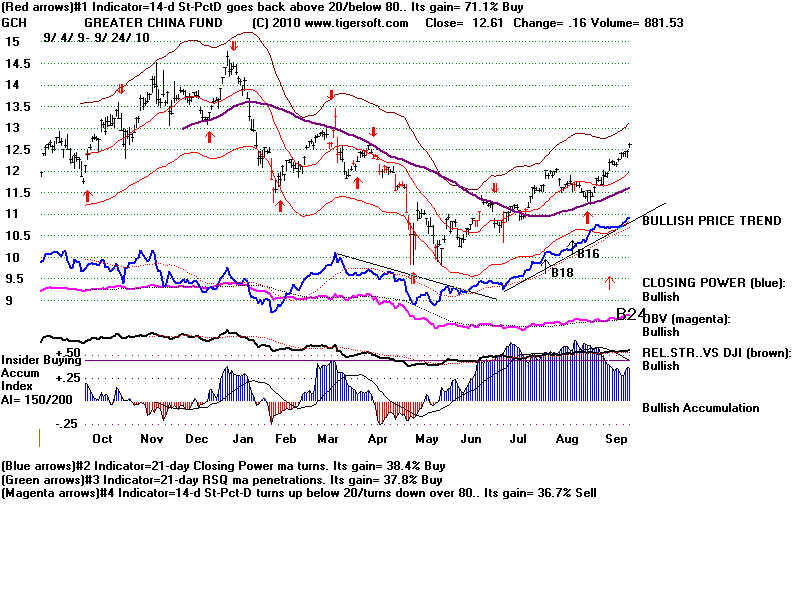
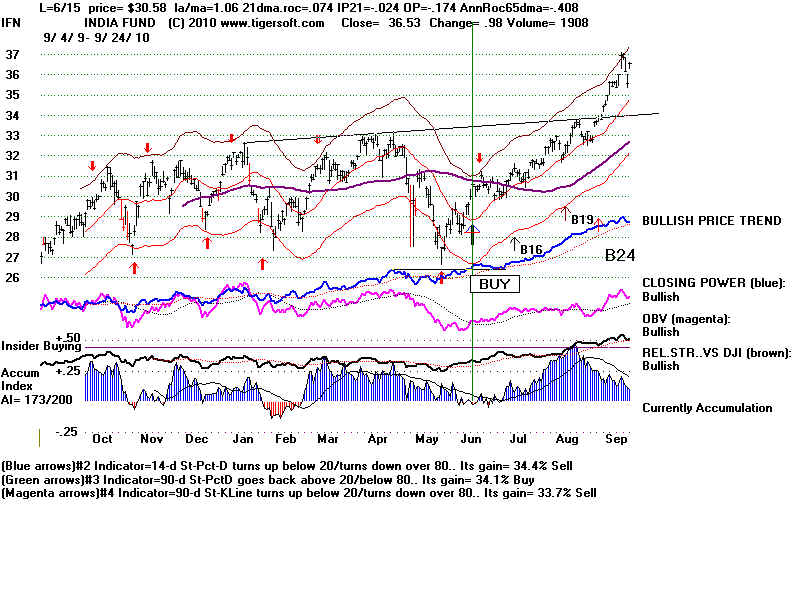
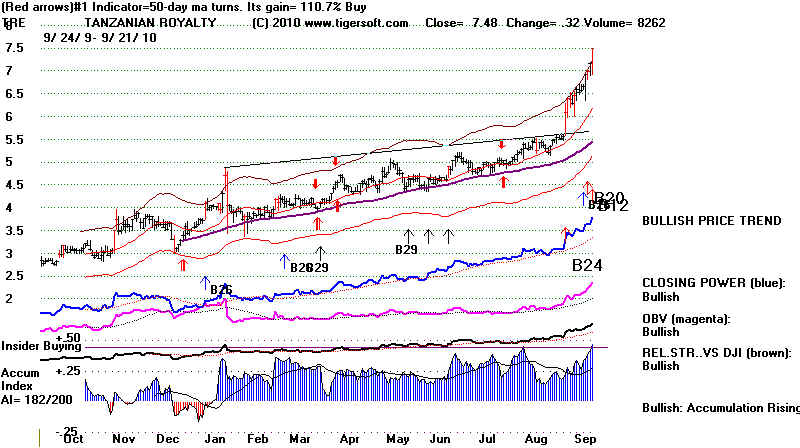

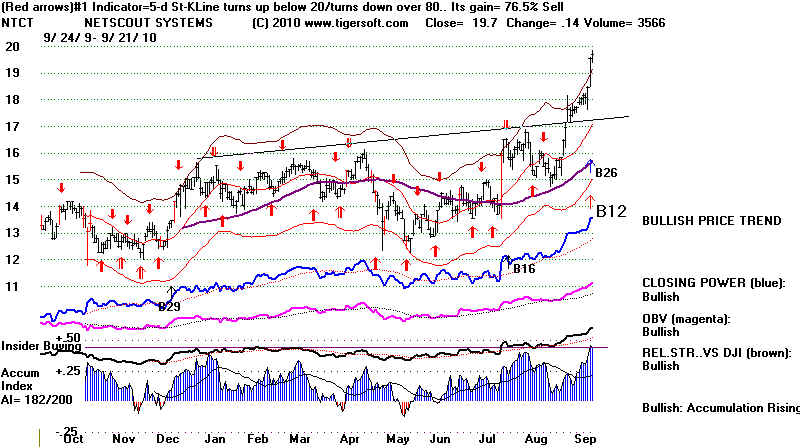


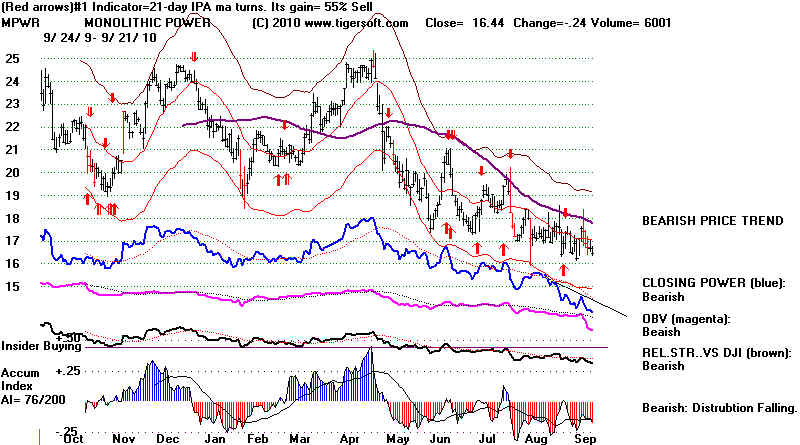
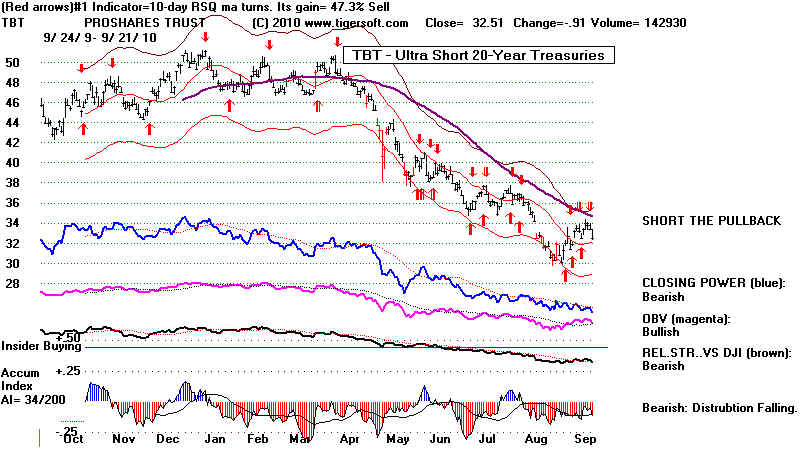
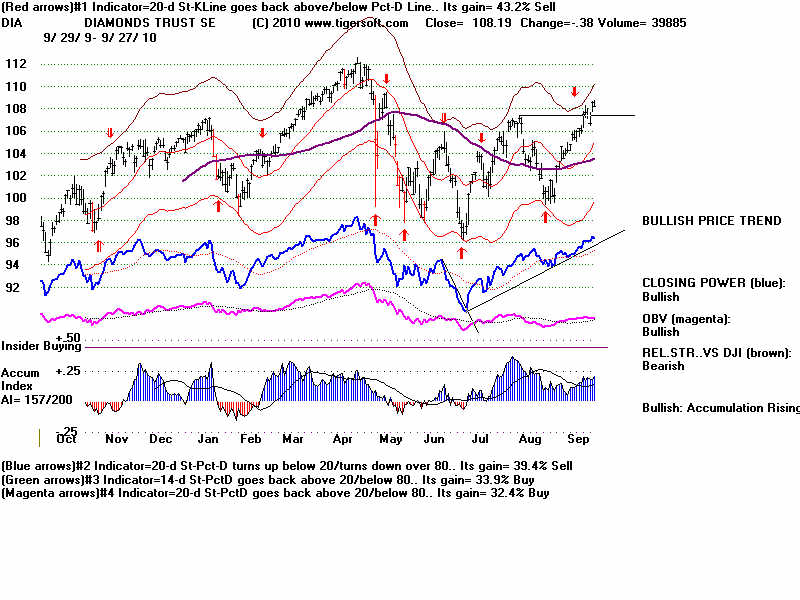
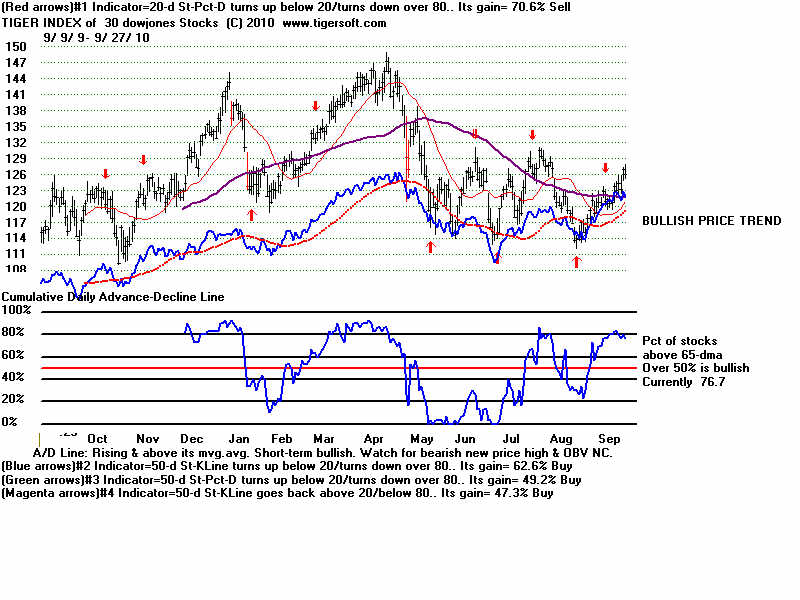
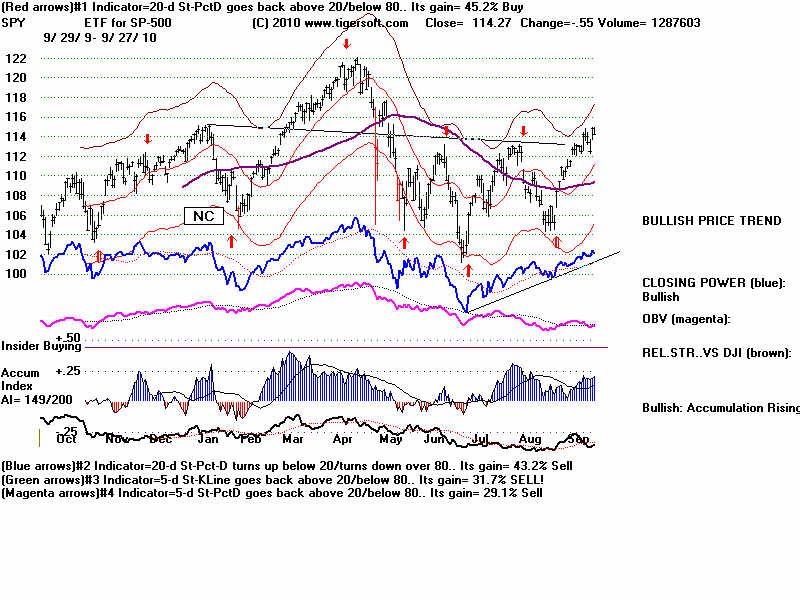
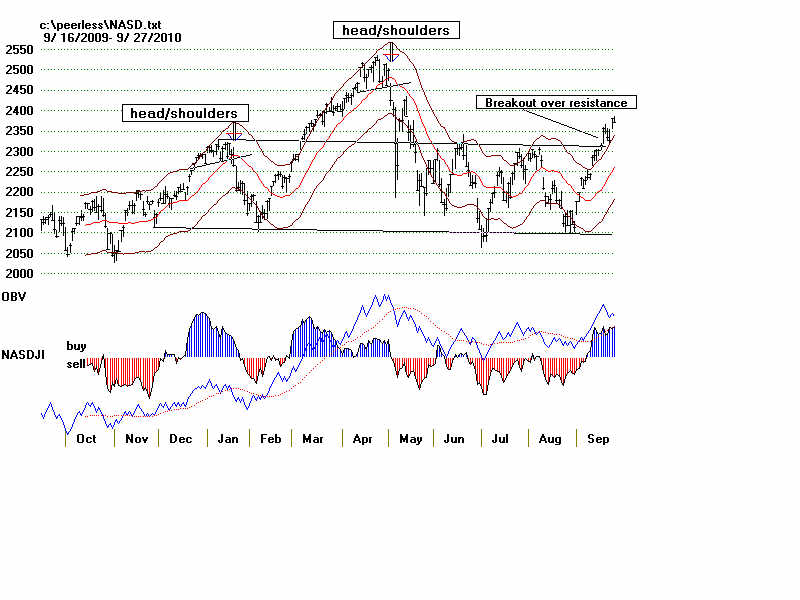
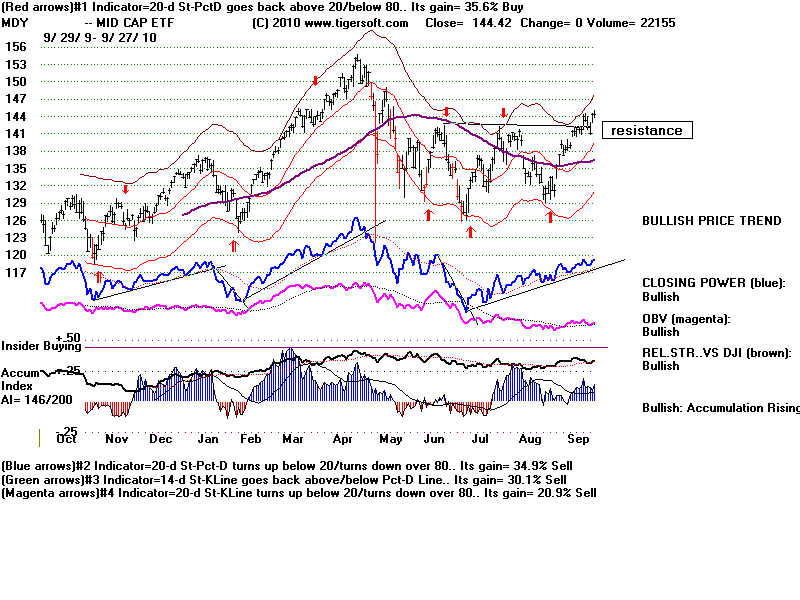
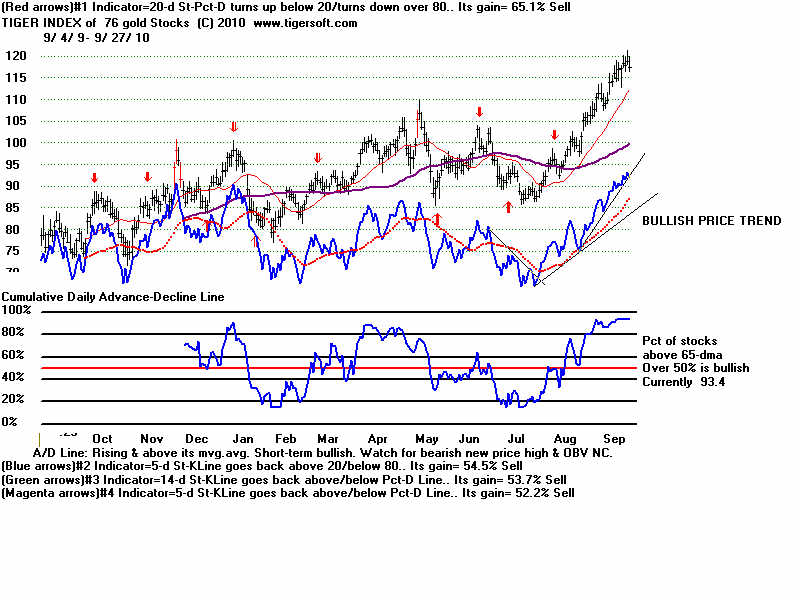
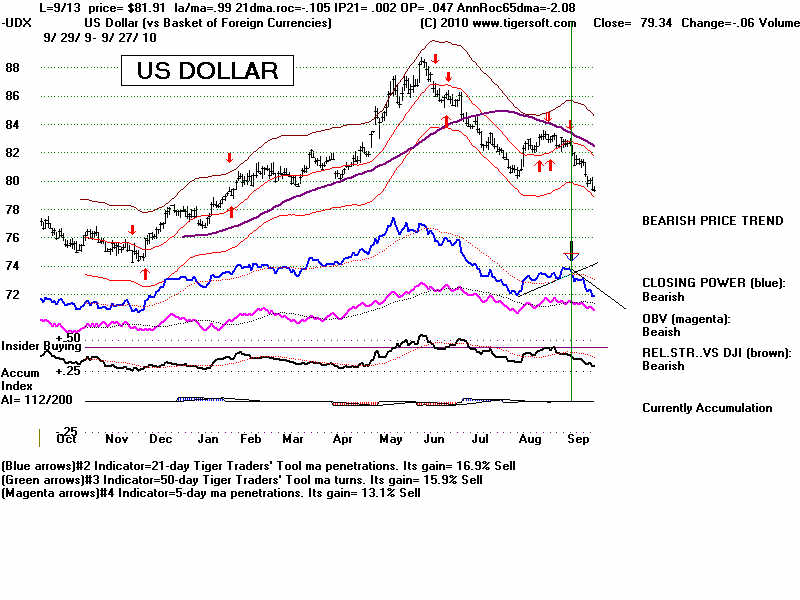
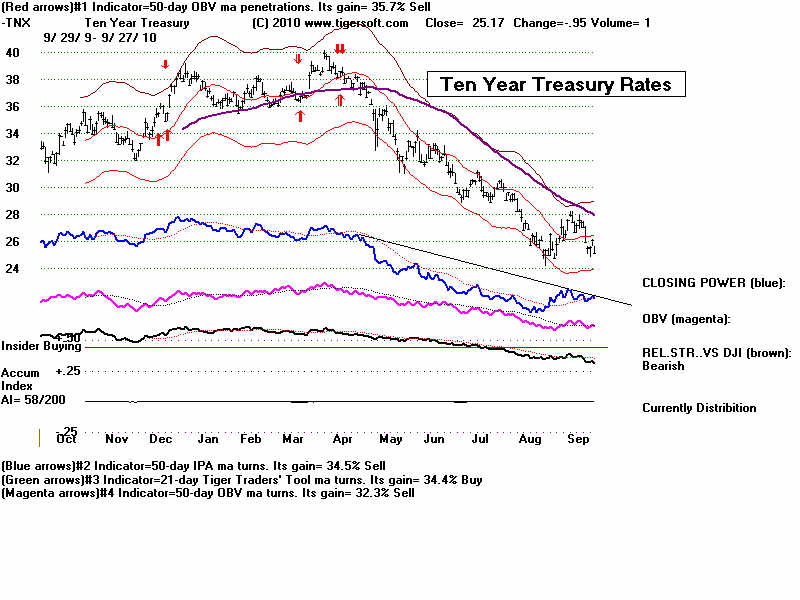
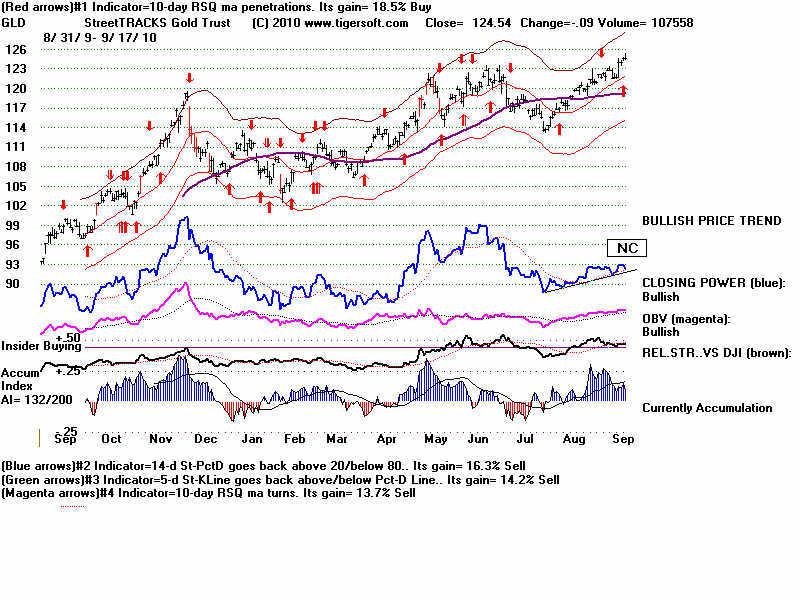