 TigerSoft
News Service 10/31/2008 www.tigersoft.com
TigerSoft
News Service 10/31/2008 www.tigersoft.com Predicting The QQQQ Using TigerSoft's
Opening Power, Closing Power and
Tiger's Day Traders' Tool: 1999-2008.
See also:
Measuring Public versus Professional Buying.
The Six Stages in A Market Cycle.
by William Schmidt, Ph.D. - Creator of TigerSoft
 |
Tiger
Software
Research on Individual Stocks upon Request: Composite Seasonality Graph
|
Predicting The QQQQ Using
TigerSoft's
Opening Power,
Closing Power and
Tiger's Day Traders' Tool: 1999-2008.
by William Schmidt, Ph.D. - Creator of TigerSoft
History teaches us. Presented here are the TigerSoft charts of the QQQQ since 1999,
its inception. Three
charts are shown for each year, moving forward six months at a time.
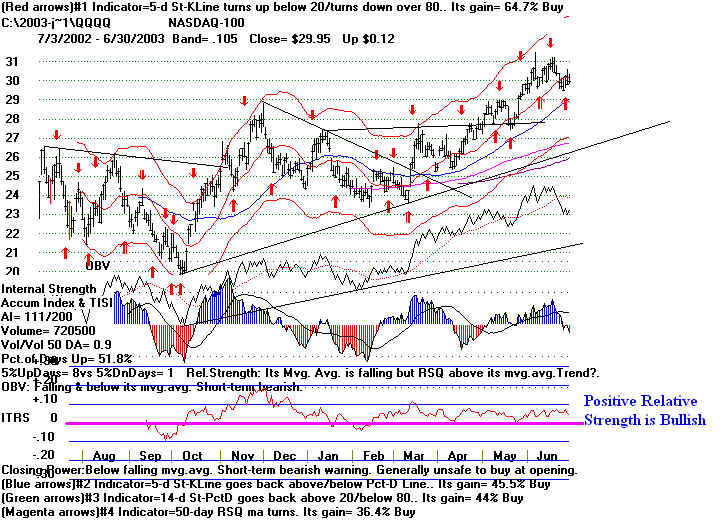
1) the initial TigerSoft chart with optimized
Buys and Sells and showing
Price, OBV, Tiger's Accumulation Index and ITRS, Intermediate-Term
Relative Strength;
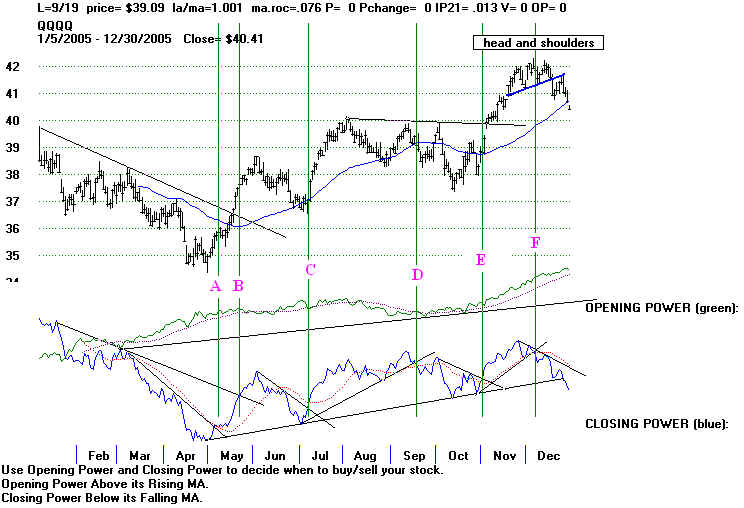
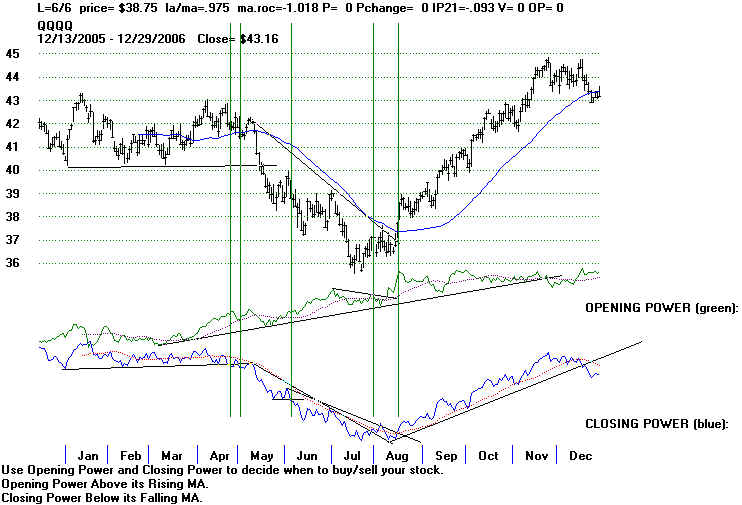
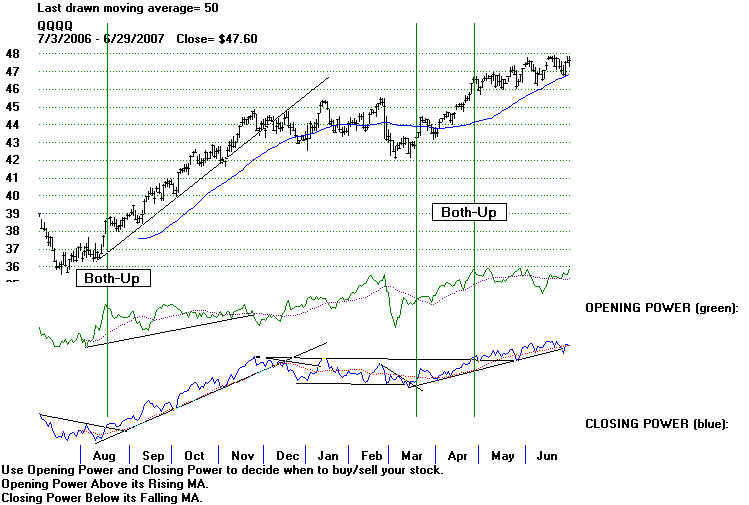
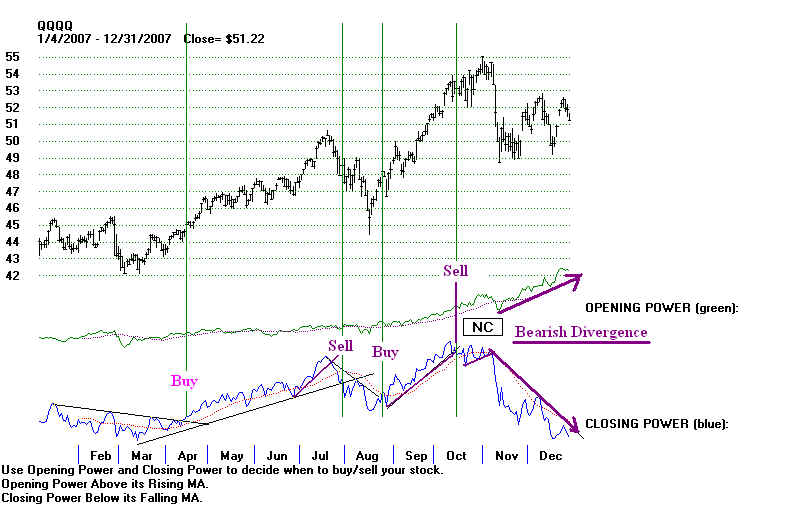
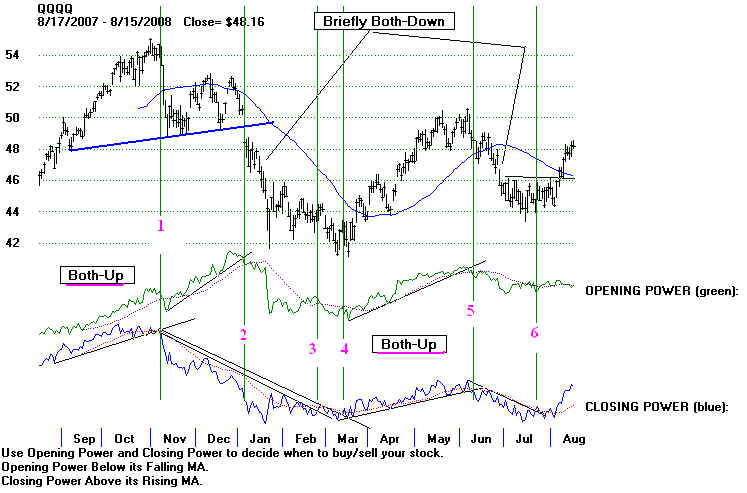
2) the second chart is of TigerSoft's Opening
Power and Closing Power;
3) and the third is Tiger's
Closing Power.
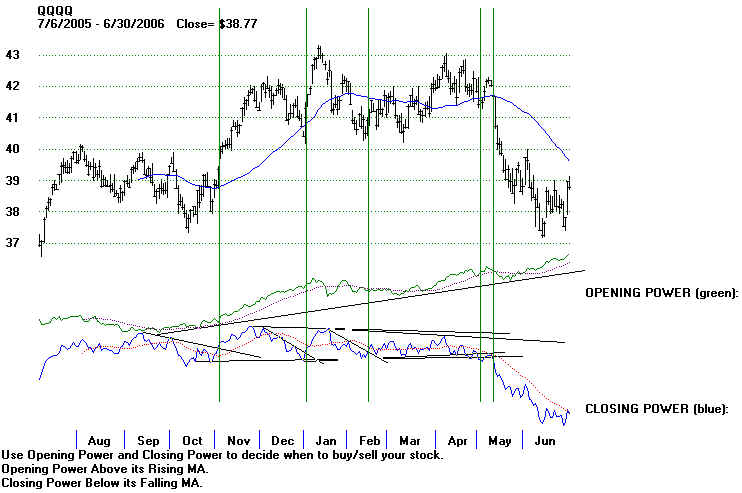
We pay especially close attention to the Opening and Closing
Power charts.
Opening Power is more apt to reflect US public and over-night Asian buying or
selling.
The direction of Opening Power is
very often proven wrong by how the QQQQ moves.
Closing Power more reflects professional buying or selling sentiment. It is more
often proven
correct by what happens to
prices. Its trend-breaks, from down to up and from up to down,
are significant as signs of a
trend-change and traders should watch for them.
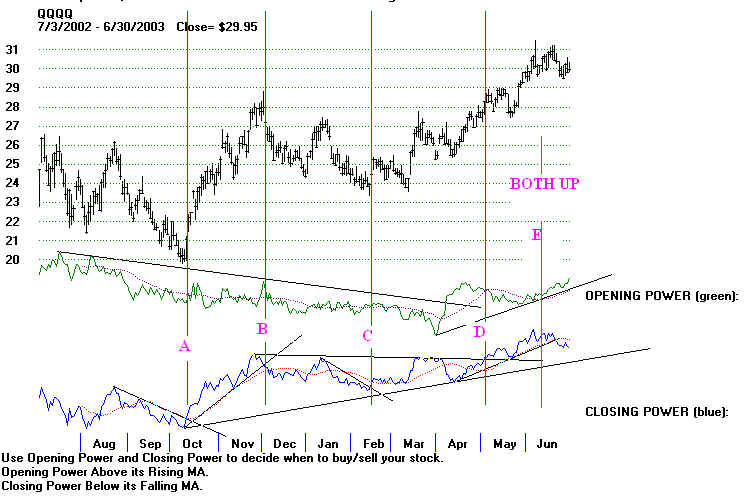
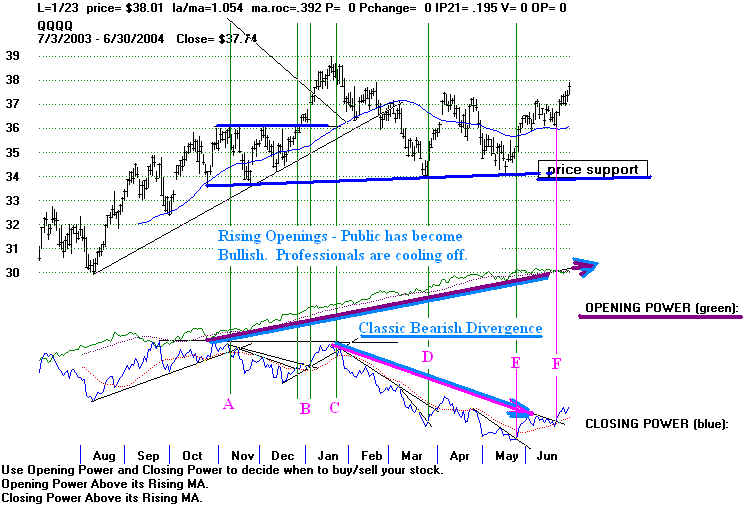
Opening Power and Closing Power often move in different directions. When this
is seen on a chart, it is a divergence.
Bearish divergences show a rising Opening Power and a falling
Closing Power.
Bullish divergences show a falling Opening Power and a rising
Closing Power.
The bullishness or bearishness is
explained by the central idea here, namely that the
public is more likely to be wrong,
as it tends to react emotionally to news that may already be
priced into the market. It
often is reacting simply to the fear and greed that extreme price
changes create and which
experienced professionals anticipate. Moreover, the public tends to
buy or sell at the opening or soon
afterwards, having made a decision overnight or early in the
day, while professionals buy/sell
more carefully, later in the day, especially as they accumulate
or lay-off their larger positions
and have the advantage of watching the market all day long.
These are tendencies, not iron-clad rules. Of course, professionals may decide to
buy
at the opening when they see
that is advantageous, just as non-professionals may finally
awake to the fact that there
has been a long series of higher "false" openings and, accordingly,
they may, for a change,
put in "limit"day orders, rather than pre-opening "market"
orders.
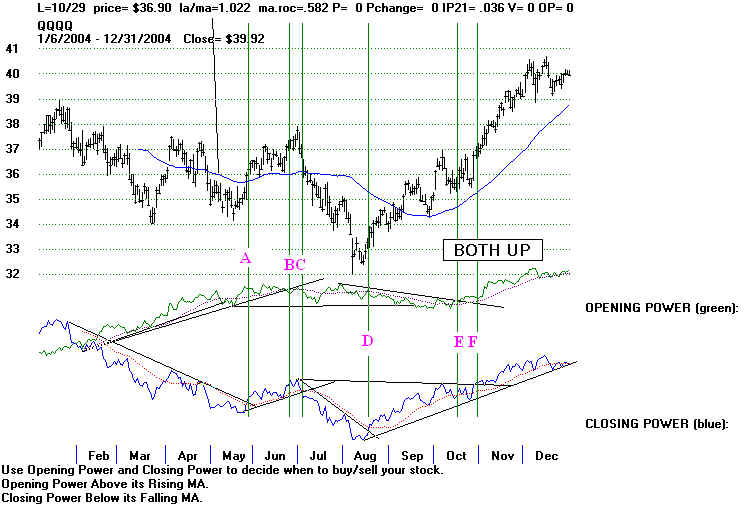
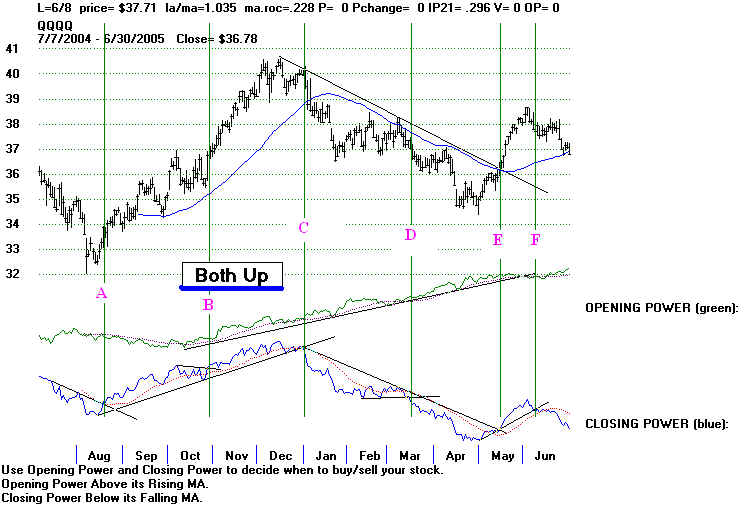
Opening Power and Closing Power may also be moving in the same
direction. This usually
brings on fast and
furious action. "BOTH-UP" and "BOTH-DOWN" are useful conditions to
screen for with the
TigerSoft programs, because this is where the quickest and biggest gains
are seen. When we
see that both Openng Power and Closing Power are newly rising, normally
we should buy. If
the QQQQ is at resistance, it is likely to be penetrated. When we see that
both Openng Power and
Closing Power are newly falling, normally we should sell short. If the
QQQQ is at support,
expect that support to be penetrated. At the same time, we should know that
the BOTH-UP and
BOTH-DOWN conditions are usually short-lived. So, we have to watch for
trendbreaks of the
Closing Power to close out our trading positions.
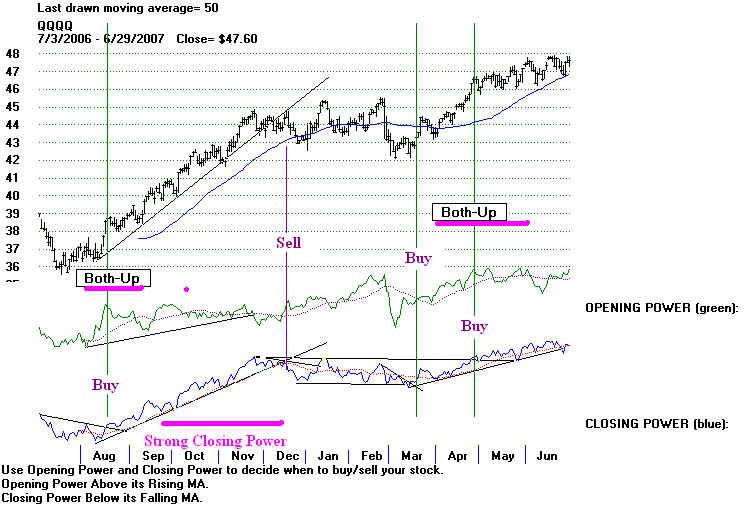
Closing Power Trend-Breaks Are Significant. Trade
the trend of the Closing Power.
Bigger sustained moves
take place when Closing Power is strongly trending. Trend-breaks
of Closing Power are
significant, especially if the Closing Power trendline is well-tested,
has last more than a
month and, even more, if it is horizontal. Opening Power is often
misleading, though it
may show you a pattern for Openings that continues for a while.
Closing Power Can Fail. But This Is Rare.
Professionals are sometimes wrong, but they limit their
losses. That's the sense I make
of the cases where they
have been bearish, judging from a falling Closing Power, but prices
somehow continue to
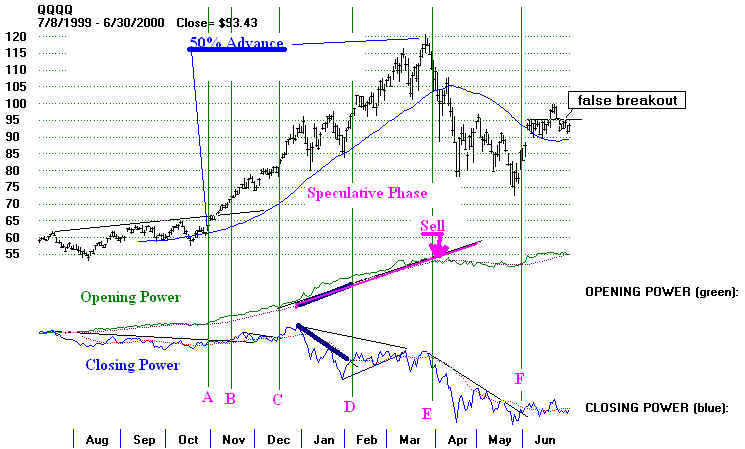
climb because of higher and higher openings. For an example, look at
the QQQQ chart just
below for January 2000. If you find yourself in this position, accept a break
in the downtrend of the
Closing Power as a signal to buy. Later you can use the break in either
the Closing Power or
the Ppening Power to take profits. These phases, where Openings dominate
and over-power weak
closings, are often very speculative and take on the characteristics of
a bubble or a selling
wave that is approaching a final climax. Notice that the QQQQ had risen
more than 50% in only
10 weeks when the Closings turned weak in January 2000. And this was
very near the top of
the internet bubble.
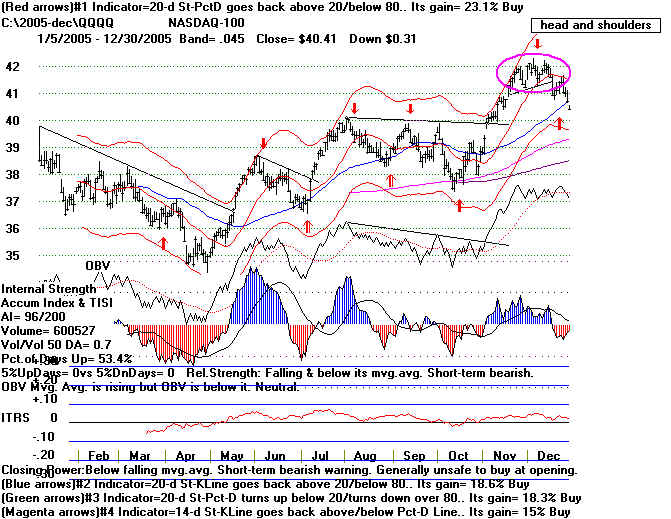
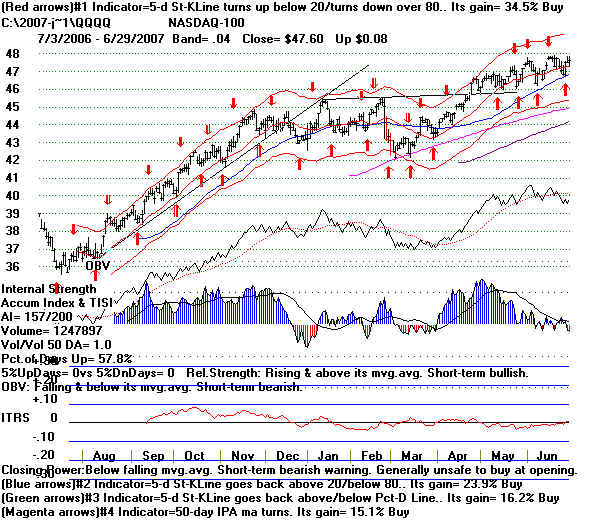
Use TigerSoft's Other Tools, Too.
The more key indicators are pointing up, the more certain you can be of profits
by being "long".
The same thing applies in reverse to identifying profitable short selling
points in time.
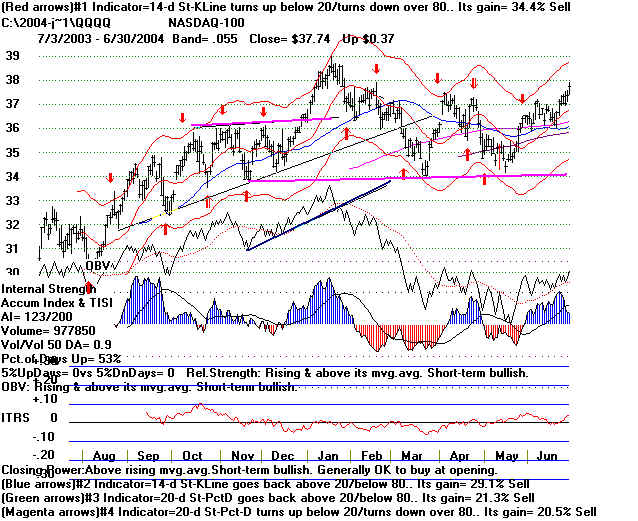
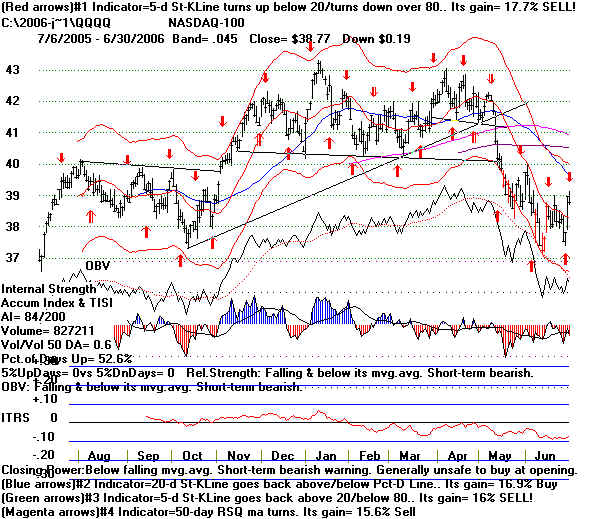
TigerSoft's Accumulation Index
measures a related concept: insider buying or selling.
We want to use all our tools
together. Intense accumulation (readings above +.50) adds bullishness
to a pattern of professional
buying and public selling. Intense distribution (readings below -.25)
adds bearishness to the
pattern of professional selling and public buying. Similarly, a rising
TigerSoft Day Traders' Tool (DT Tool) adds bullishness
to a chart, while its declining trend should
be a warning . Relative strength indicators by ITRS, RSQ or the
NASDAQ's NASDJI
should
also be added to the matrix of technical tools applied, along with Volume, OBV and OPCT for
measuring aggressive buying
power.
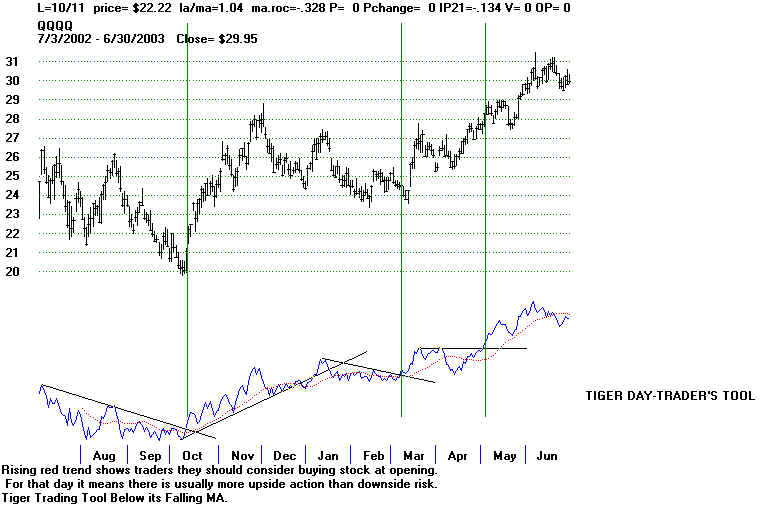
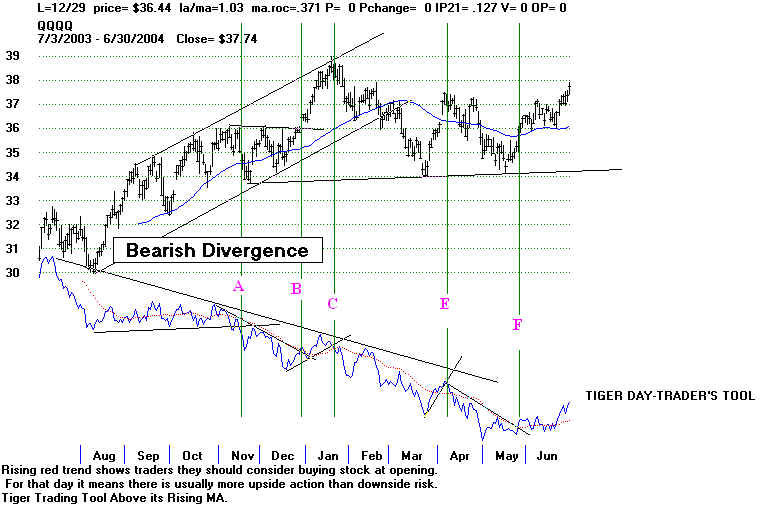
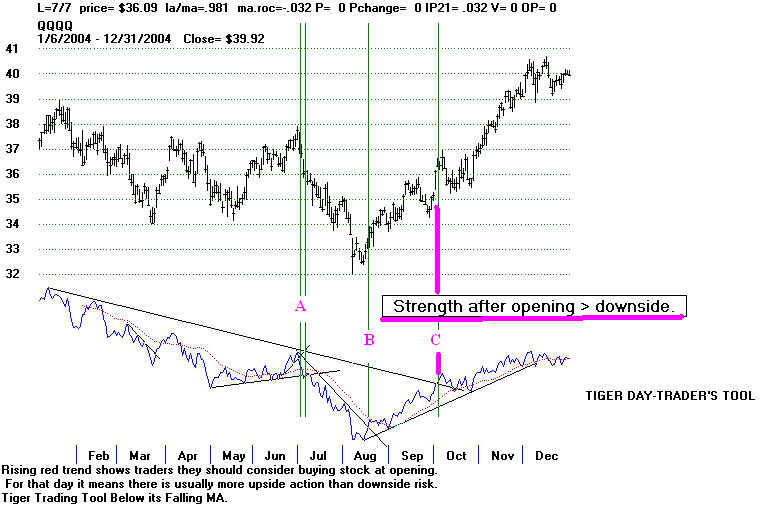
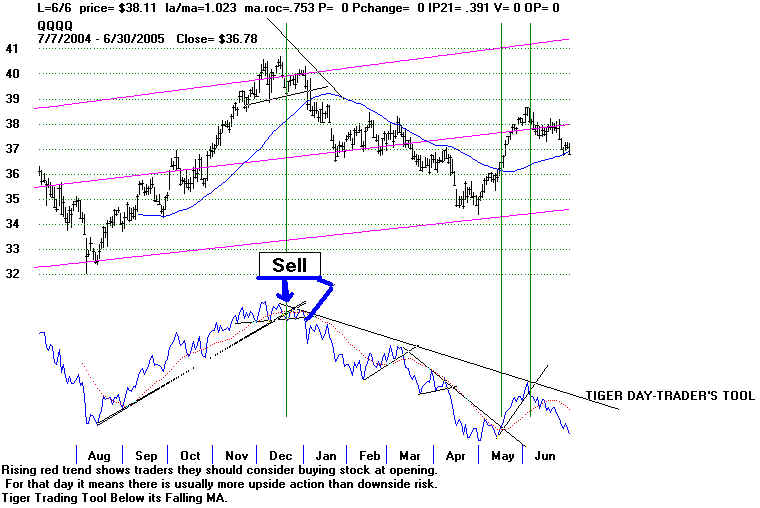
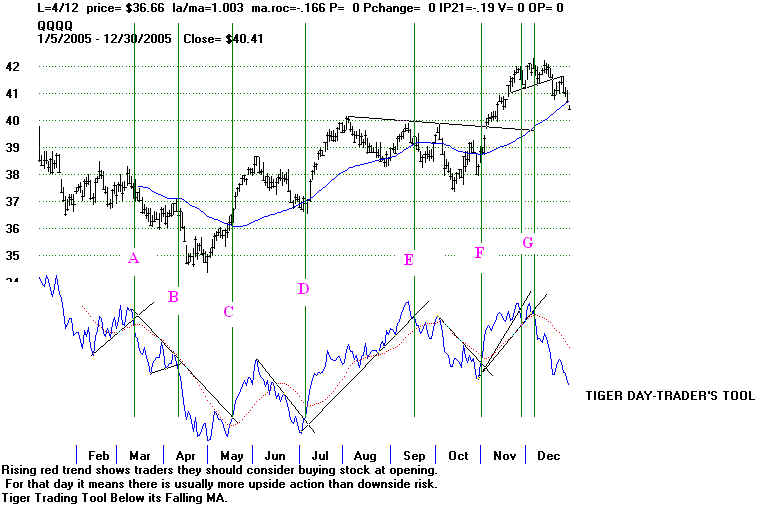
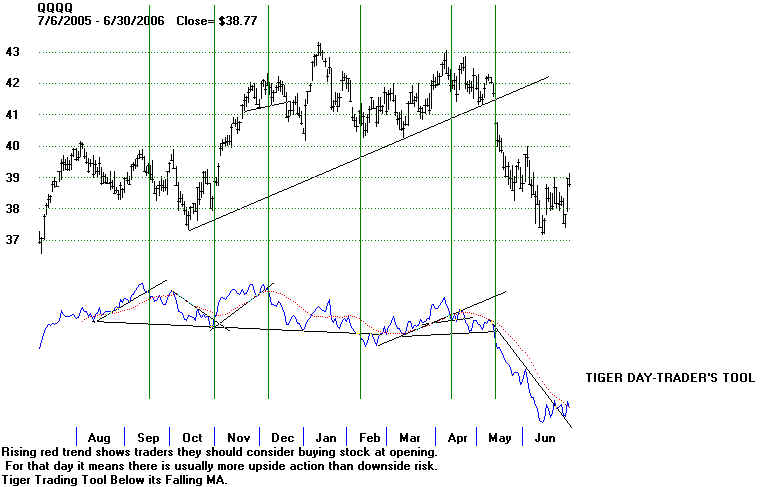
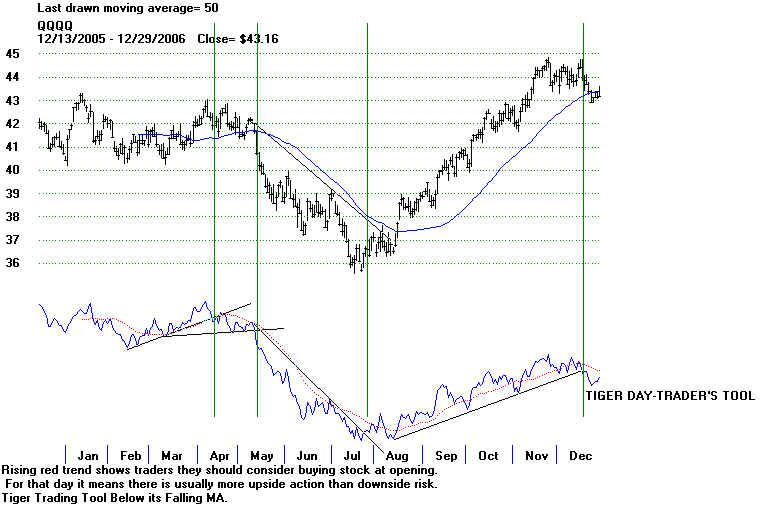
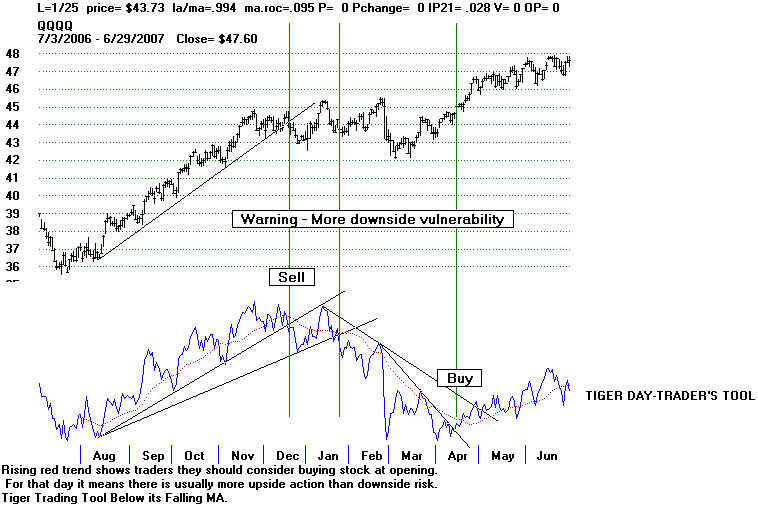
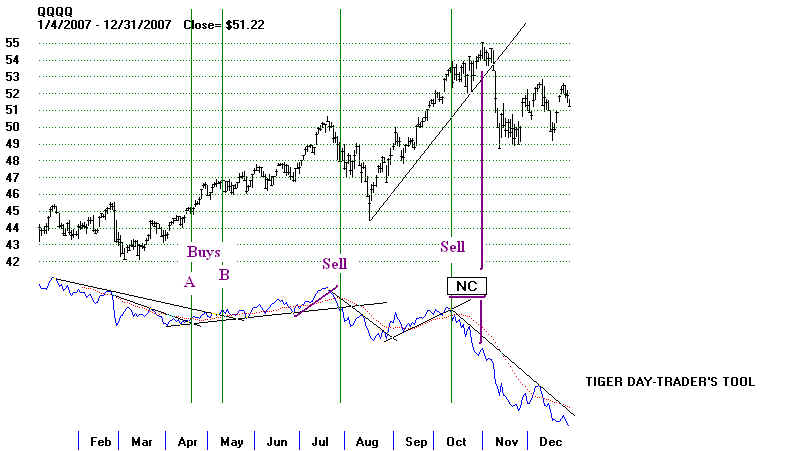
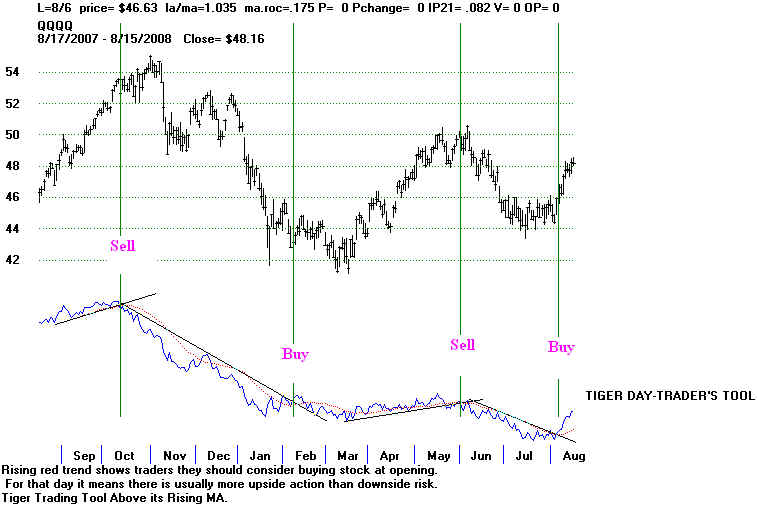
The Tiger Day Traders' Tool can
be very helpful. Watch for QQQQ moves up and
down which are
not confirmed by the Day Traders' Tool. Below you will want to see the charts
for these Day
Traders' Tool divergences from price.
Notable QQQQ Price
and Tiger DT Tool Divergences
1.
January - March 2000 Bull Market Top - Prices were rising and
Tiger DT Tool was falling.
2.
Sept 2000 Top - Tiger DT Tool did not confirm the rally to a 4
month high.
3.
September 2001 bottom in prices was bullishly not confirmed by the
Tiger DT Tool.
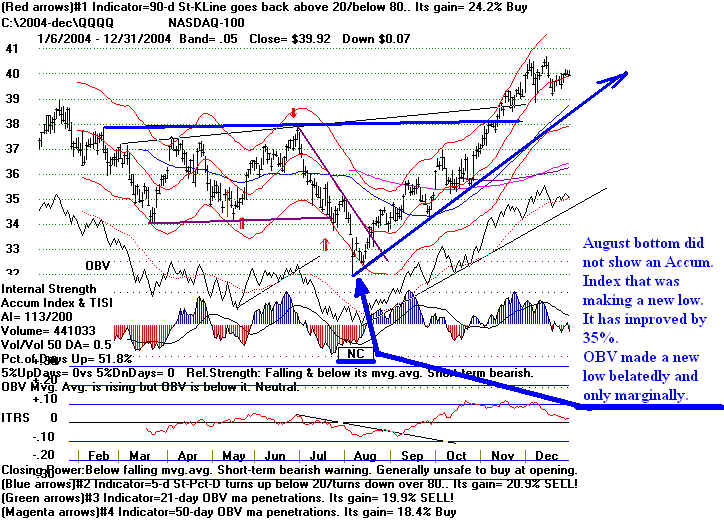
4.
October 2002 bottom was bullishly not confirmed by the Tiger DT Tool
making a new low.
5.
February 2003 4 month low was bullishly not confirmed by the Tiger DT
Tool making a new low.
6.
August 2003 - January 2004 QQQQ advance bearishly saw the Tiger DT Tool
declining.
This was several months' premature, but it proved a correct warning that
2004 would generally decline until the fourth quarter.
7.
December 2006 - QQQQ price high was not confirmed by the Tiger DT Tool. This
was an accurate warning that a top was being made.
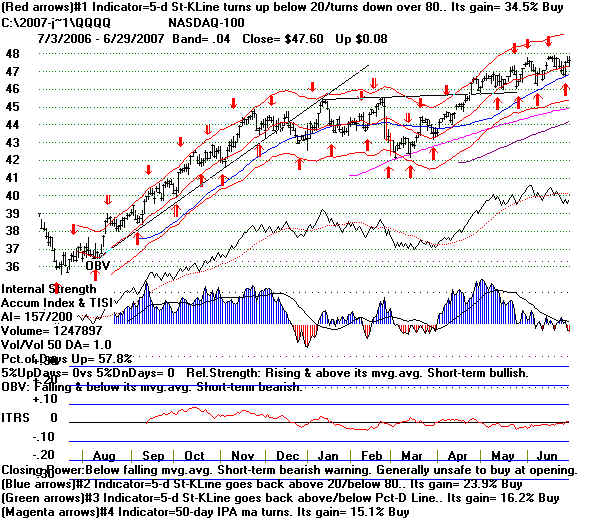
8.
January 2007 - QQQQ price high was not confirmed by the Tiger DT Tool. This
was an accurate warning that a top was being made, but only for 2 months.
9.
June 2007 - QQQQ price high was not confirmed by the Tiger DT Tool. This
was an accurate warning that a top was being made, but only for 2 months.
In a bear market, steep price downtrends often end only briefly when the Day Traders'
Tool breaks its steep decline. If the resulting uptrend for the Day
Traders' Tool is short-lived
and is quickly
broken, get out and sell short again. Use the Peerless DJI system's major
Buys to see when a
recovery is likely to last a much longer time. Once the QQQQ starts
making new yearly
highs, you can profitably trade breaks in the DayTraders' Tool more confidently.
==================================================================================
QQQQ
Bear Market: 5 Years' Weekly Chart
2000-2004
--------------------- QQQQ 1999 - 2004
---------------------------------------------
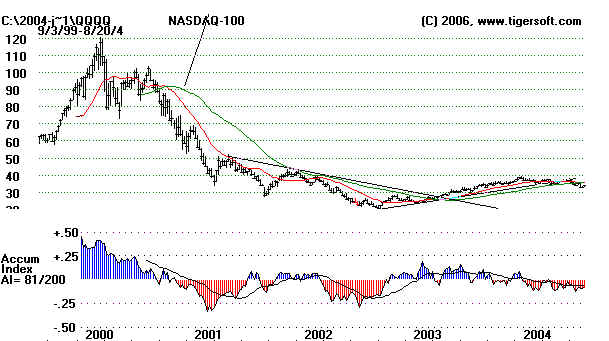
The QQQQ (Nasdaq-100) peaked in March 2000 at 120. By
September 2001, it had fallen to 28.
This was a drop of more than 75%.
The decline ended dramatically and climactically a few weeks
after the attack of 9/11/01.
Notice from the chart above that the QQQQ, and the market more generally,
did not go straightdown to the
September 2001 selling climax. Within this 18 months's 75% decline,
there was a temporary bottom at 75,
in May 2000. This first leg down saw the breaking of the
internet bubble. The next leg down
took prices down 50% more, from 75 to a bottom at 38 in
March 2001. The third leg
down took the QQQQ to 28 in September 2001.
The QQQQ rallied from 28 to 42, about 40% and then stalled out at its declining 52-week
ma.
Thereafter, it fell steadily to a
bottom at 20 in October 2002. All through the long bear market,
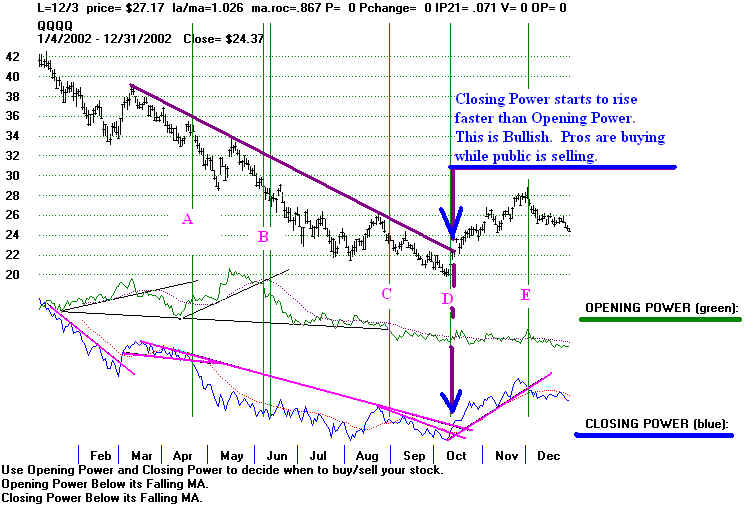
the Opening Power was rising.
I theorize the public kept believing that the decline would soon
be over and was buying all the way
down until May 2002. You can see this in the QQQQ charts for
2000, 2000-2001, 2001 and
2001-2002. Only as the QQQQ was nearing its final bottom did Opening
Power start to fall, showing that
the public was turning bearish. This was exactly the opposite of
what would have brought them
success. Professionals, judging from the mostly falling Closing Power,
remained bearish until October
2002. At that point, they recognized the bottom much more quickly
than the public. Closing
Power turned up smartly. Look at the chart of 2002 just below.
------------------------------------ QQQQ - 2002
-----------------------------------------------------------------
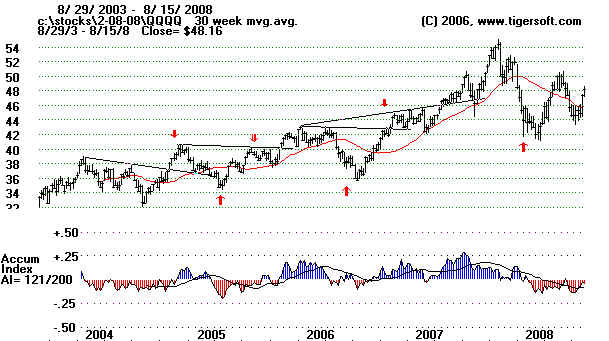
QQQQ - Bull Market - 2003-2007
--------------------- QQQQ 2004 - 2008
---------------------------------------------
Trading Tactics Applied to The QQQQ
Chronlogically.
General
trading tactics for Opening and Closing Power:
1. Closing Power Trend-Breaks Upwards is
Bullish.
More bullish if Opening Power is already rising.
2. Closing Power Trend-Breaks Downwards
is Bearish.
More bearish if Opening Power is already falling.
3. Closing Power Breakouts
above earlier peaks that are nearly flat is Bullish.
More bullish if Opening Power is already rising.
4. Closing Power Breakdowns
below earlier bottoms that are nearly flat is Bearish.
More bearish if Opening Power is already falling.
5. When Closing Power has
been declining for some time, it is very bearish
when Opening Power breaks down.
6.
When Closing Power has been rising for
some time, it is very bullish
when Opening Power breaks out.
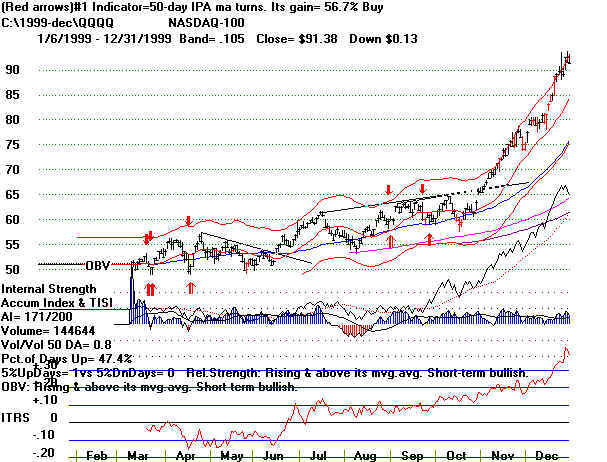
QQQQ 1999
Notes:
June breakout was past a declining resistance line going through 4 earlier peaks.
Note bullish price gap and steady blue Accumulation before it.
October breakout was past a rising resistance line going through 4 earlier peaks.
Note bullish price gap and steady blue Accumulation before it.
The OBV Line confirmed each of the new highs.
50% rise in 3 months
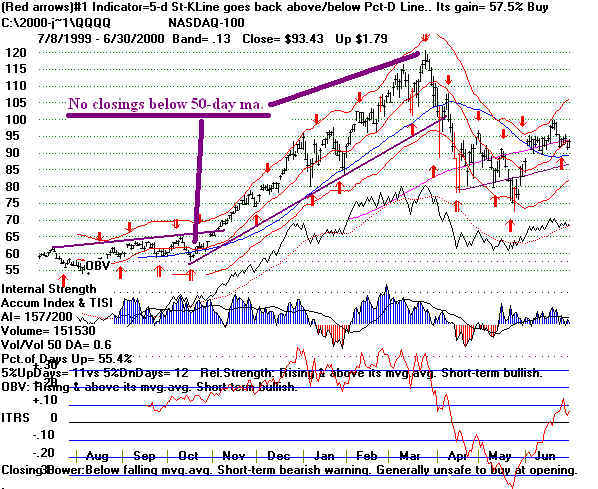
QQQQ 1999-2000 (1)
50% advance...and then QQQQ broke rising (blue) 50-day ma. This was a
suitable place to take profits. The red price bar on this occasion showed
that this was a very high volume down-day. That was a bearish sign.
Having broken the 50-day ma, prices often fall to the zone between the 30-week
ma (purple) and the rising 200-day ma (black). It did so heavy (red) volume.
Volume after this much decline quick decline represents support.
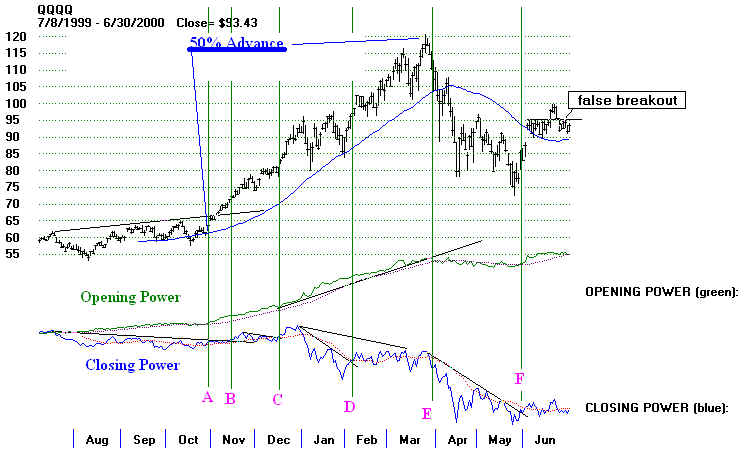
QQQQ 1999-2000 (2)
Notes on Using
Closing Power:
(A) Both Opening and Closing Power are rising. This is often a very
bullish condition
short-term.
(B) Closing Power
breaks out over its flat resistance. Opening Power rising. Bullish.
(C) Closing Power
breaks out over its flat resistance. Opening Power rising. Bullish.
(D) Closing Power
breaks out over its declining resistance line. Opening Power rising.
This is a bullish Bullish conditons,
(E) After 10 week period when
Closing Power was declining and Opening Power was
falling, it is bearish when the Opening Power breaks its uptrendline.
(F) Closing Power surpasses
its downtrendline while Opening Power is flat to rising.
Bullish.
A B C
D
E
F
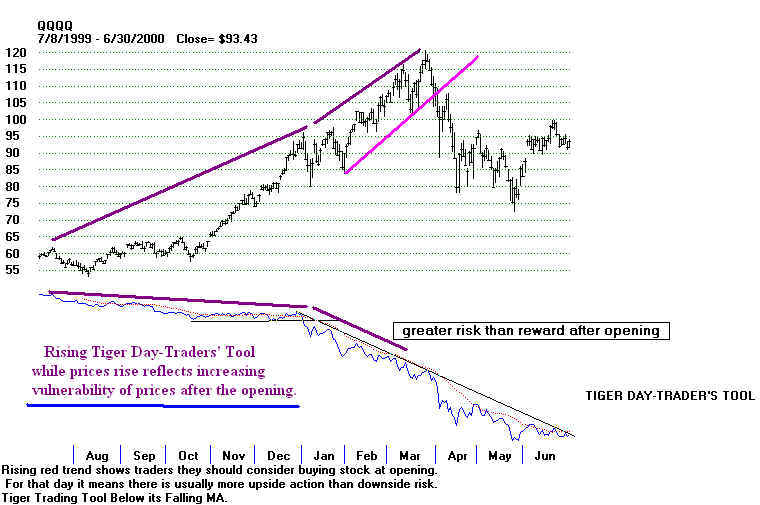
QQQQ 1999-2000 (3)
Prices Doubled from July 1999 to March
2000,
while Tiger Day-Traders' Tool was falling. This was
an early warning of the coming bear market. When
prices top out, they must come down a long ways.
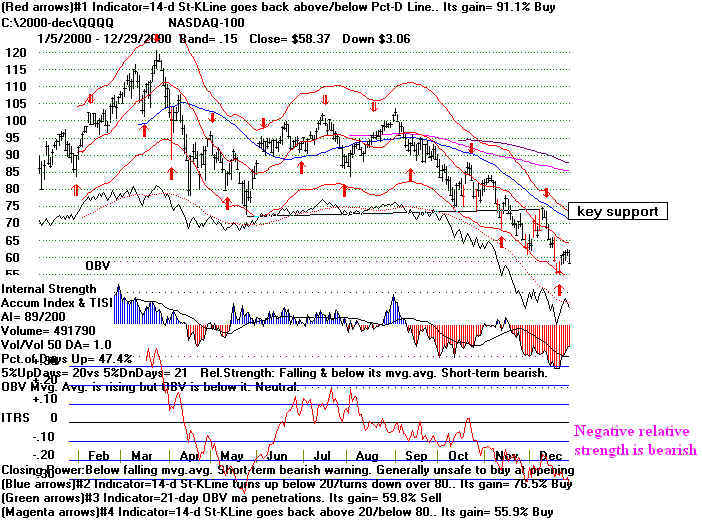
QQQQ 2000 (1)
Traders could have generally judged the trend of the QQQQ
by which side it was on of the blue 50-day ma. September is
the most bearish month. Seeing the QQQQ fail to get past its declining
50-day ma should have been taken as a bearish sign. Note the bearish
November breakdown below the well tested support at 74. The worsening
OBV and Accumulation Index confirmed the decline.
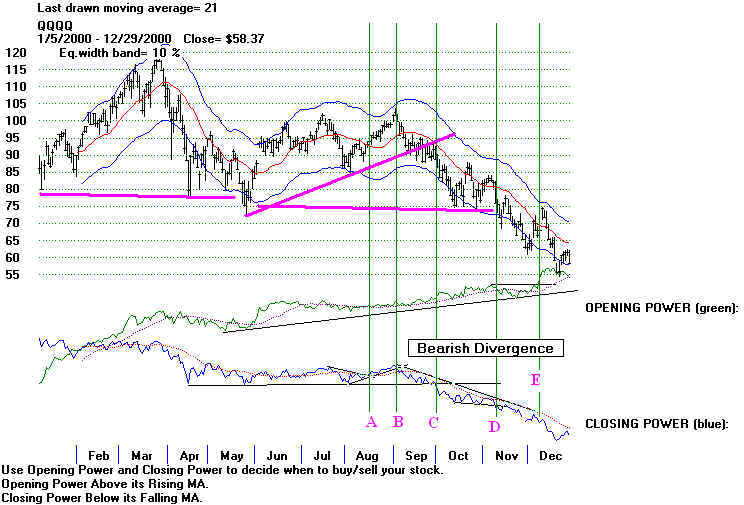
QQQQ
2000 (2)
Note how in April 2000, both Opening and Closing Power are falling.
This is quite bearish. This
condition is called "BOTH-DOWN".
From Septmber to December, the
Opening Power is rising while the Closing Power is
falling. This is a bearish
phenomenon after a long advance.
It is a "Bearish Divergence".
To be significant
divergences should last more an a month or six weeks. With this rule,
it is bearish that there
were no "Bullish Divergenes."
(A) Closing Power surpasses its
downtrendline while Opening Power is flat to rising.
Bullish.
(B) Closing Power
breaks its uptrend. Opening Power is flat. Bearsh.
(C) Closing Power
breaks down below its flat support. Thought Opening Power
is rising, Closing Power proved correct. Bearish. Consider bearish context.
(D) Closing Power
breaks down. Bearish.
(E) Opening Power
upside breakout in context of declining Closing Power is
misleading. Bearishly Closing Power rules.
A B C
D E
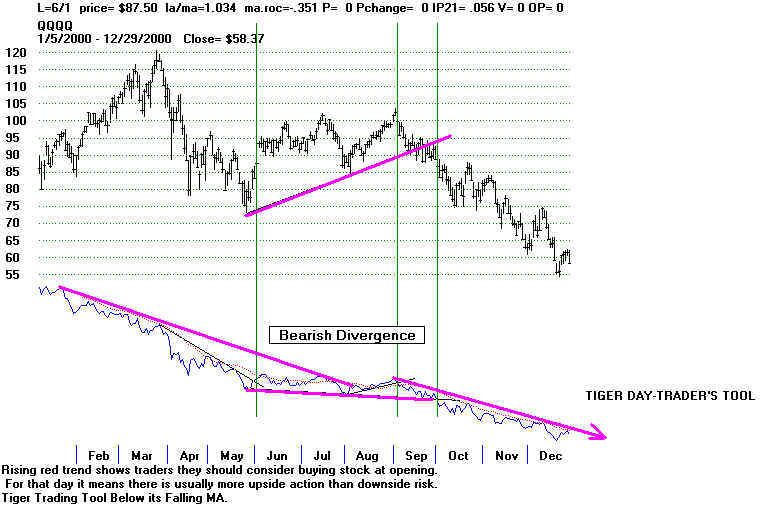
Notes:
A - Break in long declining trend
for Tiger Day Traders' Tool was bullish.
B - Break in rising trend for Day Traders' Tool was bearish.
C - Break to new lows by Day Traders' Tool after hesitation is bearish.
QQQQ 2000 (3)
A
B C
| QQQQ 2000--2001 (1) Notes - When a strong trend develops, it pays to respect the blue 50-day ma. Above it is bullish. Below it is bearish. The trend of the Accumulation Index and the OBV Line should also be watched. The worsening red Accumulation Index readings were clear signs that the downtrend was being confirmed. Watch the ITRS. It was negative for almost the entire year in the chart below. Its turning negative offered additional good points to sell short. The bearish head and shoulders pattern from April to June 2001 was a distinct warning, 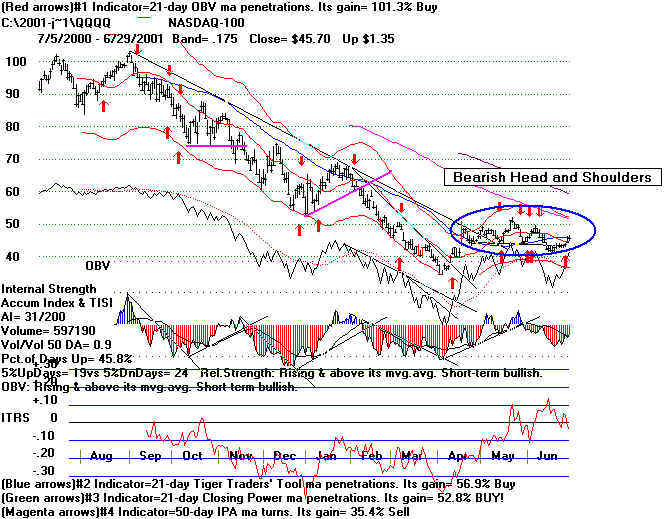 QQQQ 2000--2001 (2) Notes A) Break-out above downtrendline by the Opening Power has only short-term significance. It should tell traders to expect a some higher openings for a few days. B) Steep Closing Power downtrendline was broken bringing a rally to the resistance of the falling 50-day ma. C) Breakdown below rising Closing Power uptrendline was bearish and a renewed Sell signal, especially as it occurred after an unsuccesful effort to get past the falling 50-day ma. D) Both Opening and Closing Power are declining. Very bearish. E) Break-out above Closing Power's downtrendline with Opening Power rising is bullish. A B C D E 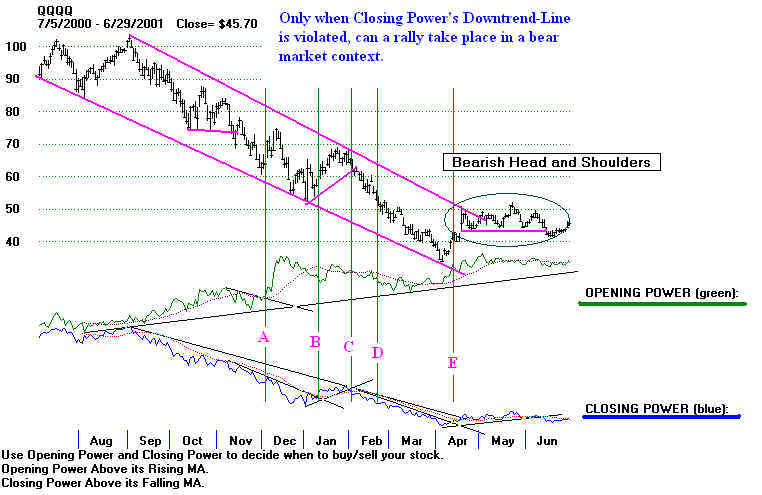 Breakdowns of Tiger Traders' Tool to new lows and below rising uptrends are bearish when the market is topping out or in a steadily falling trend. See A, B and D.. A B C D QQQQ 2000--2001 (3) 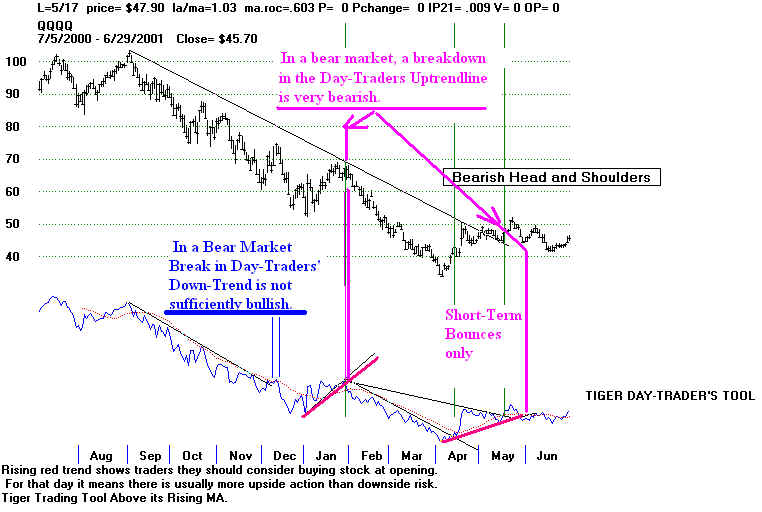
The continuation head and shoulders patterns should have been taken a a sign of further weakness ahead. You can even anticipate these patterns and sell short on the apex of the right shoulder or at the red 21-day ma. QQQQ 2001 (1) 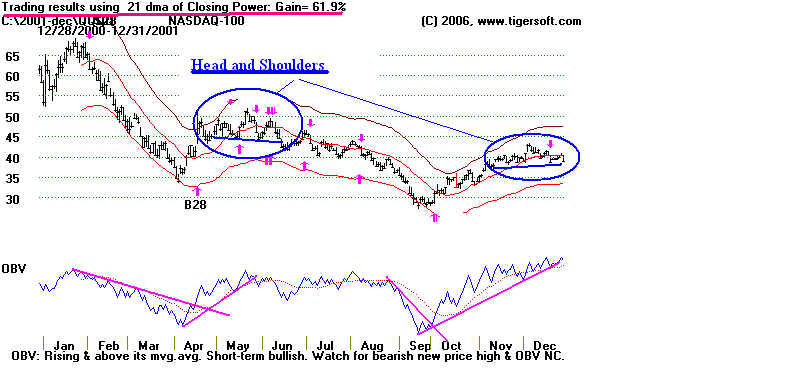   QQQQ 2001 (2) Compare the trendbreaks in the Closing Power with the red Buys and Sells of the Closing Power of its 21-day ma. The red signals based on Closing Power garnered a profit of 61.9% over the year 2001. Its trend breaks are usually better. A B C D E F 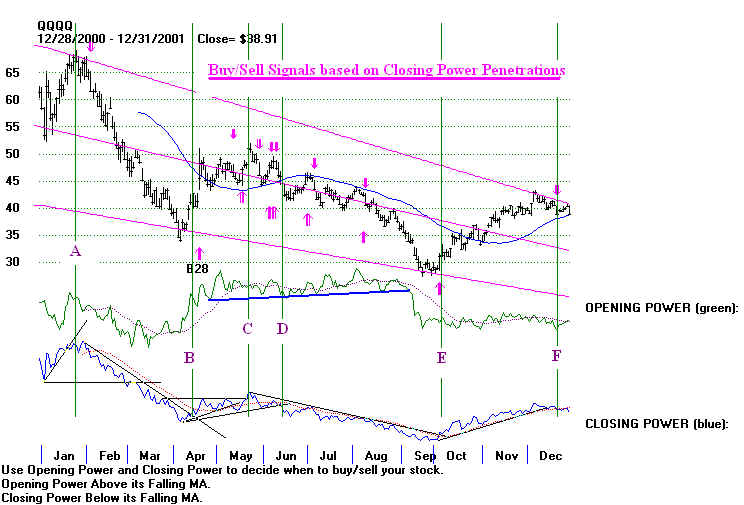 Compare the breaks in the trendlines for the Tiger Traders' Tool with Closing Power signals and penetrations just above. Steep price downtrends often end when the Day Traders' Tool breaks its steep decline. QQQQ 2001 (3) 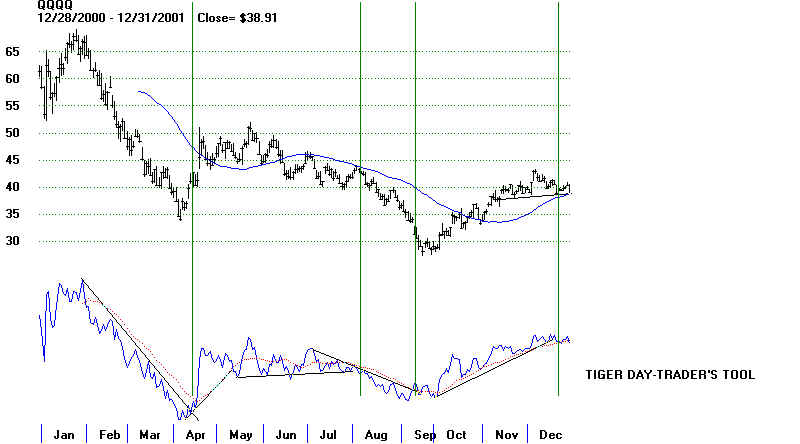 QQQQ 2001--2002 (1) 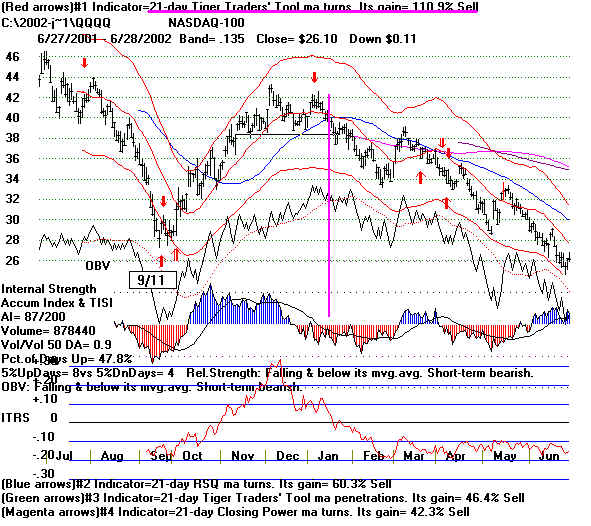 QQQQ 2001--2002 (2) 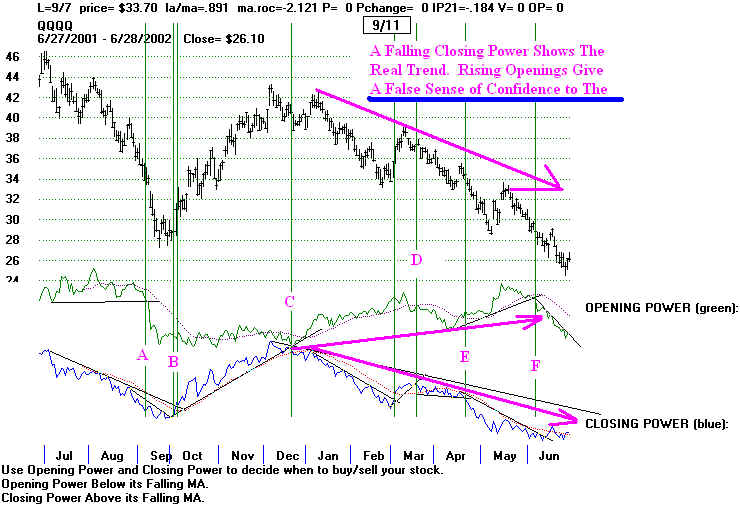 QQQQ 2001--2002 (3) 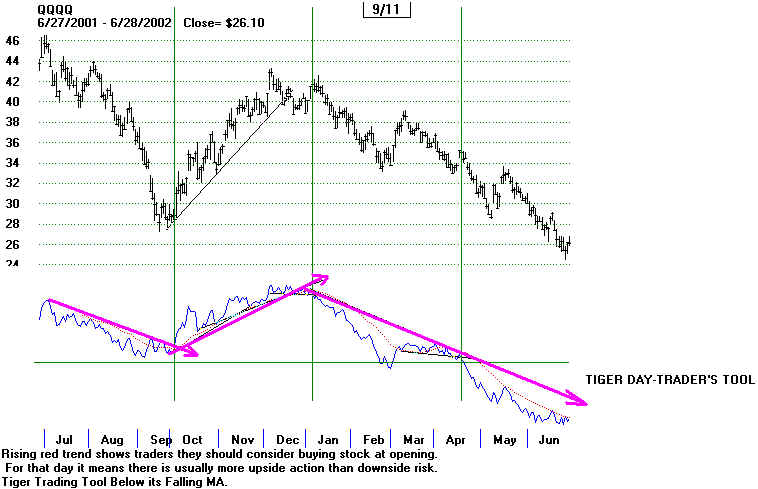 |
| QQQQ 2002 (1) 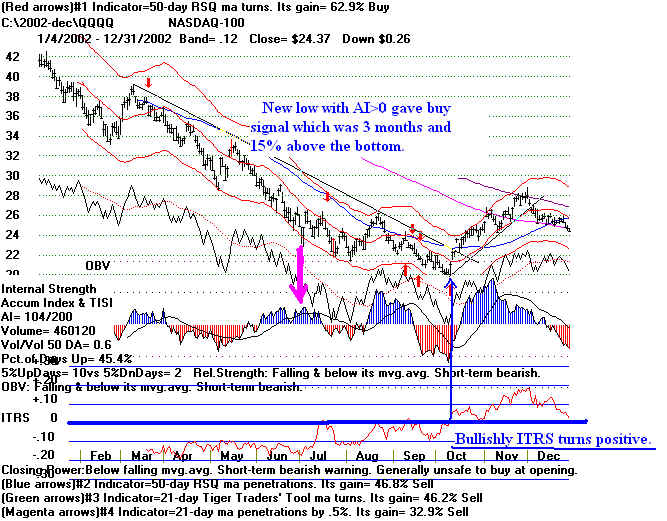 QQQQ 2002 (2) QQQQ 2002 (3) 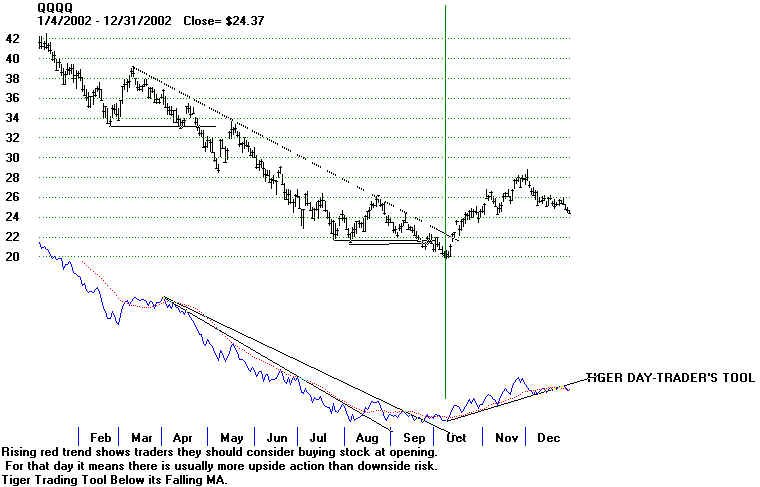 |
|
QQQQ 2002-2003 (1) 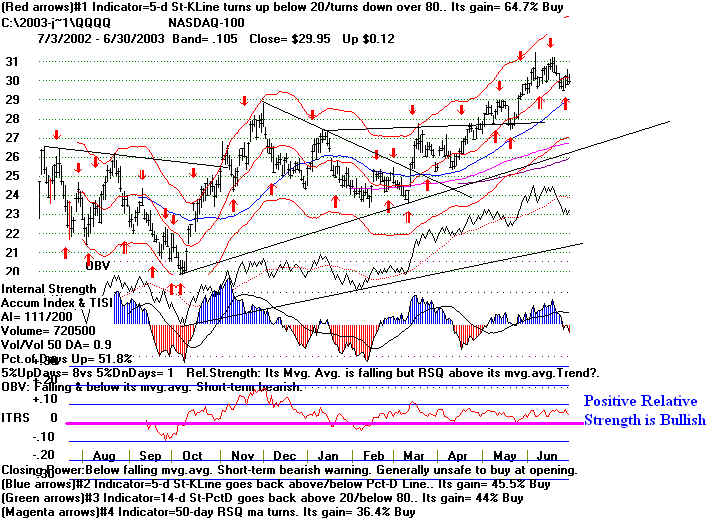 QQQQ 2002-2003 (2) 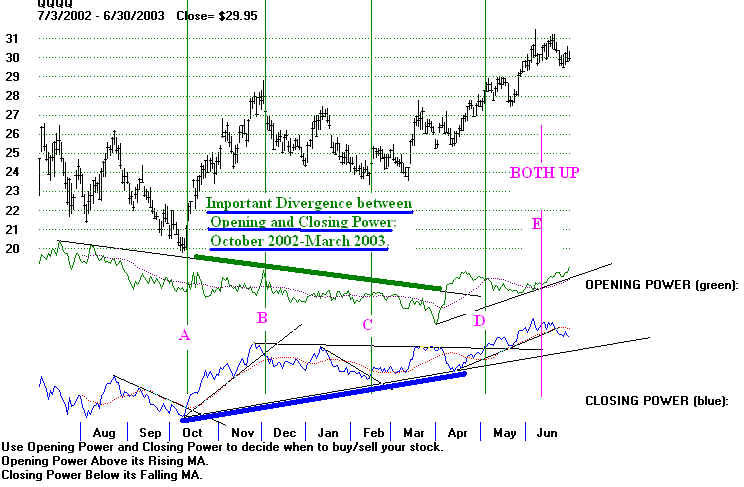 QQQQ 2002-2003 (3) 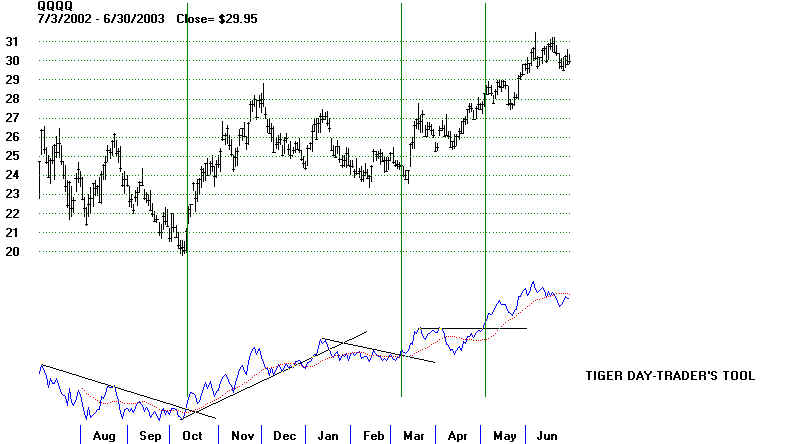 |
QQQQ 2003 (2)
QQQQ 2003 (3)
QQQQ
2003-2004 (1)
QQQQ 2003-2004 (2)
QQQQ 2003-2004 (3)
QQQQ 2004 (1)
QQQQ 2004 (2)
QQQQ 2004 (3)
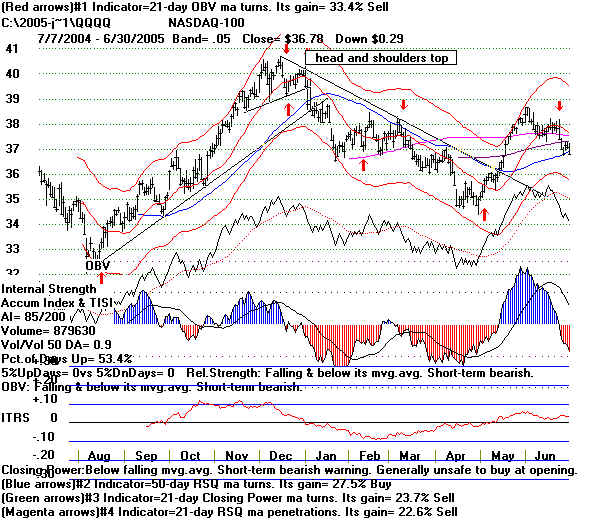
QQQQ 2004-2005 (1)
QQQQ 2004-2005 (2)
QQQQ 2004-2005 (3)
QQQQ 2005 (1)
QQQQ 2005 (2)
QQQQ 2005 (3)
QQQQ 2005 -2006 (1)
QQQQ 2005 -2006 (2)
See the mildly bearish divergence from November 2005 to April 2006.
QQQQ 2005 -2006 (3)
QQQQ 2006 (1)
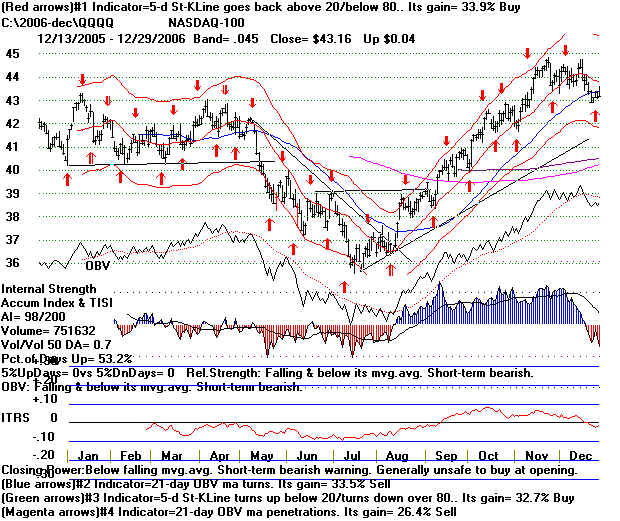
QQQQ 2006 (2) Bearish Divergence is seem from April 2006 to
Augusat 2006.
QQQQ 2006 (3)
QQQQ 2006-2007 (1)
QQQQ 2006-2007 (2)
QQQQ 2006-2007 (3)
QQQQ 2006 -2007 (1)
QQQQ 2006 - 2007 (2)
QQQQ 2006-2007 (3)

QQQQ 2007 (1)
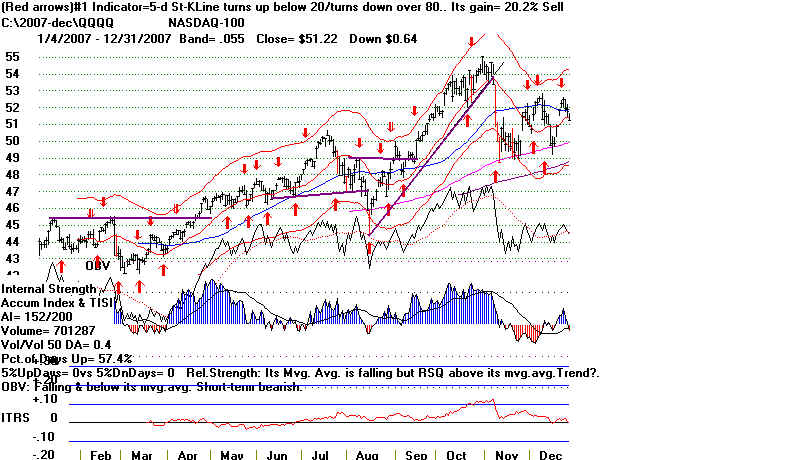
QQQQ 2007 (2)
QQQQ 2007 (3)
The October new high was not matched by a new high by the Tiger
Day Traders' Tool.
NH not confirmed
QQQQ 2007 -2008(1)
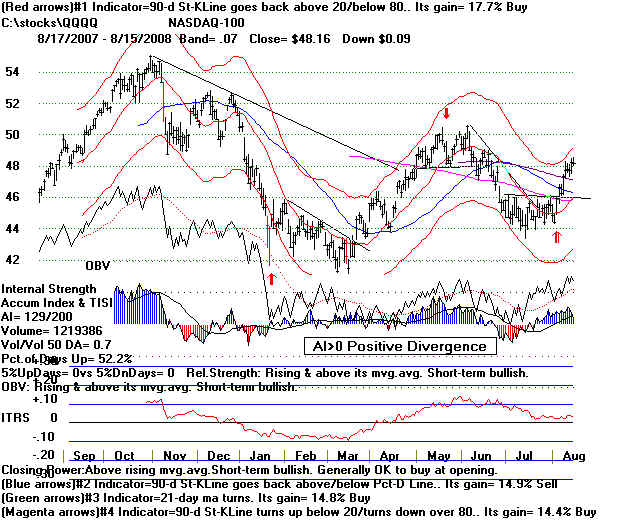
QQQQ 2007 -2008(2)
Just as the peak in October 2007 did not see an Closing Power
new high, the March bottom dod not see a Closing Power new low there,
Watch for these divergences and then take the trend-breaks of the
Closing Power to take trading positions.
QQQQ 2007 -2008(3)
| QQQQ - 2008 - through October 30, 2008 TigerSoft Opening and Closing Power The trend-changes of the TigerSoft Closing Power keep you in position to profit most from the market trends. The trends that last a month or more and that are well-tested usually bring the biggest price moves. The breakdown in September below the Closing Power's horizontal support proved especially significant. Watch closely for these. Don't be afraid to take a modest loss. It will often prevent a huge hit!. 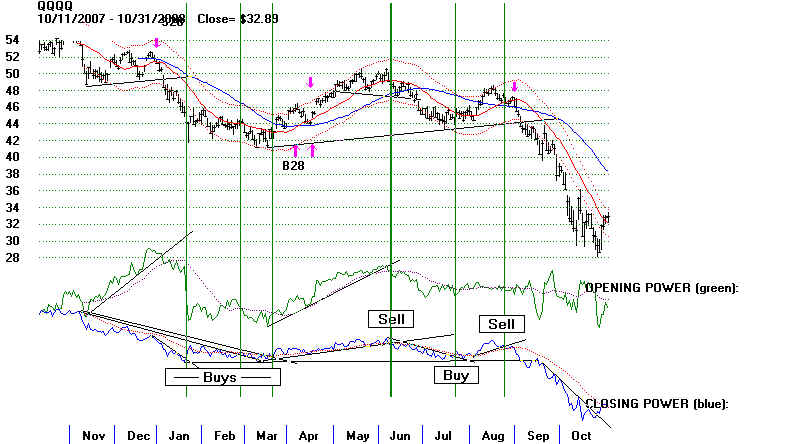 TigerSoft Day Traders' Tool 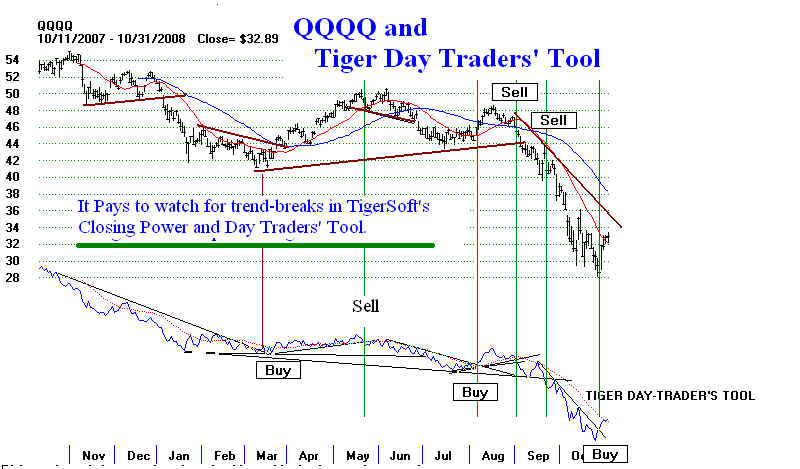 |