TigerSoft
News Service 7/31/2009 www.tigersoft.com
TigerSoft
News Service 7/31/2009 www.tigersoft.com
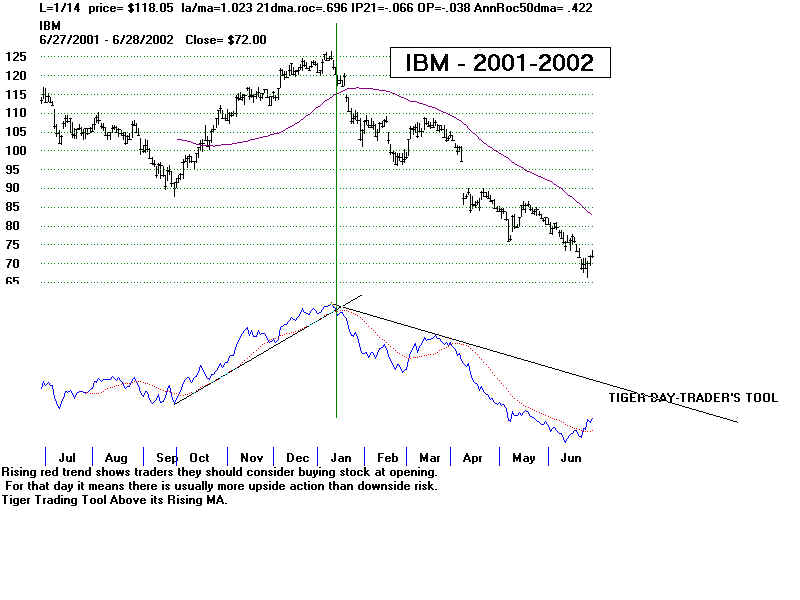
TigerSoft's "Day Traders Tool"
and IBM:
1999-2009
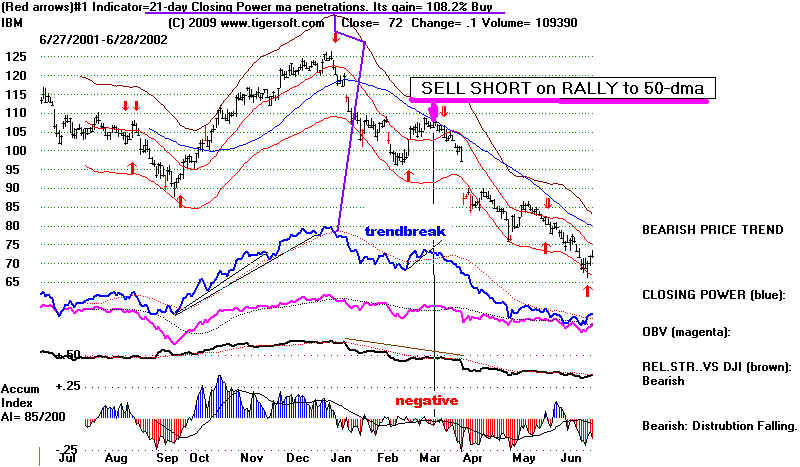
Tiger's Day Trading Tool is primarily meant to assist
day
traders, so that they can appreciate whether there is more
upside or
downside potential after the opening. Past trends
in it tend
to continue.
Just
as Closing Power was originally designed for day
traders,
but is very helpful to intermediate-term investors,
so, too, is
the Tiger Day Traders Tool.
I
would rate the Tiger Accumulation Index as the most
important
internal strength indicator. After that, I would
put the
Closing Power Tool, Relative Strength and OBV
and then
the Day Traders Tool.
Price
patterns and trends are the most important.
Look
for divergences betwen prices and the Tiger Day Traders
tool.
They may continue for a few months. But eventually,
prices
go in the direction portended by the TTT.
Breaks
in a TTT or price downtrend after a bullish divergence
by it
from falling prices bring good rallies to play.
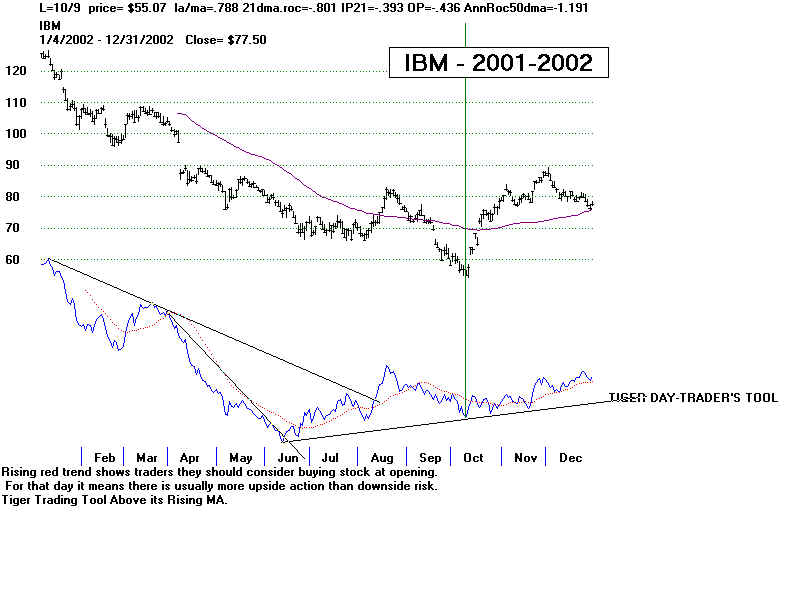
October
2001 - 100 to 125 in 10 weeks
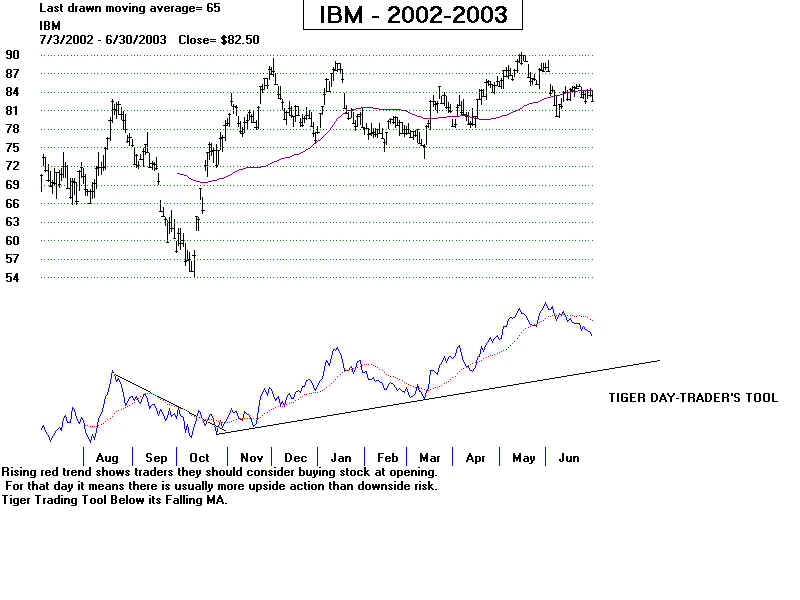
October
2002 - 70 to 87 in 8 weeks
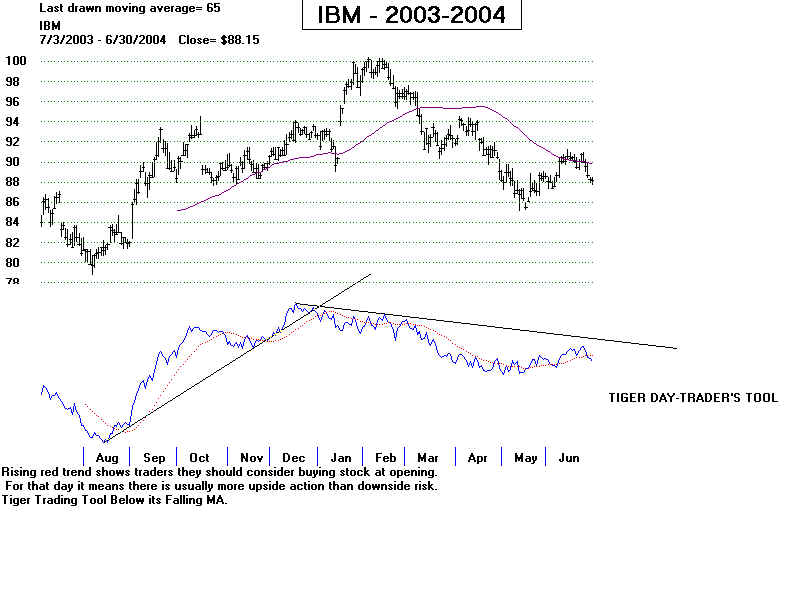
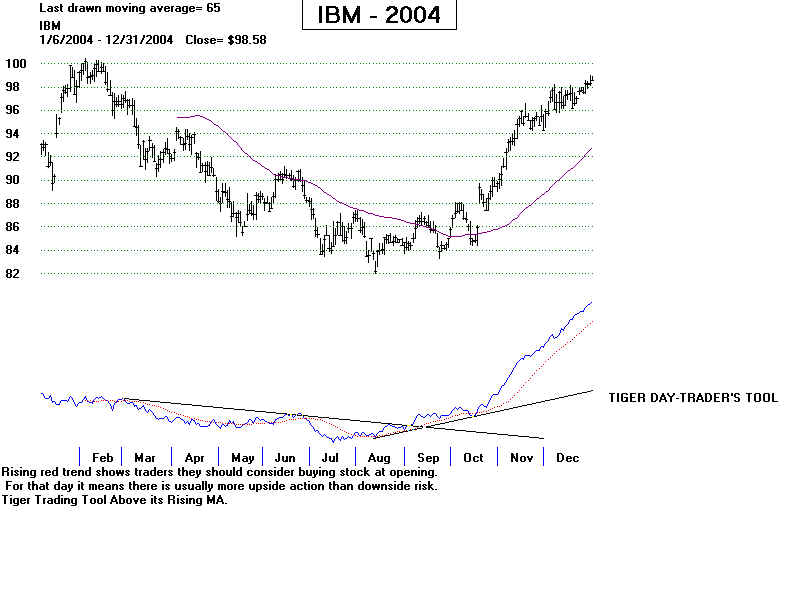
August
2004 - 86 to 99 in 4 months.
August
2006 - 76 to 114 in 14 months.
Breaks
in a TTT uptrend after a bearish divergence
by it
from rising prices bring declines to play short.
September
1999 - 120 to 90 in 6 weeks.
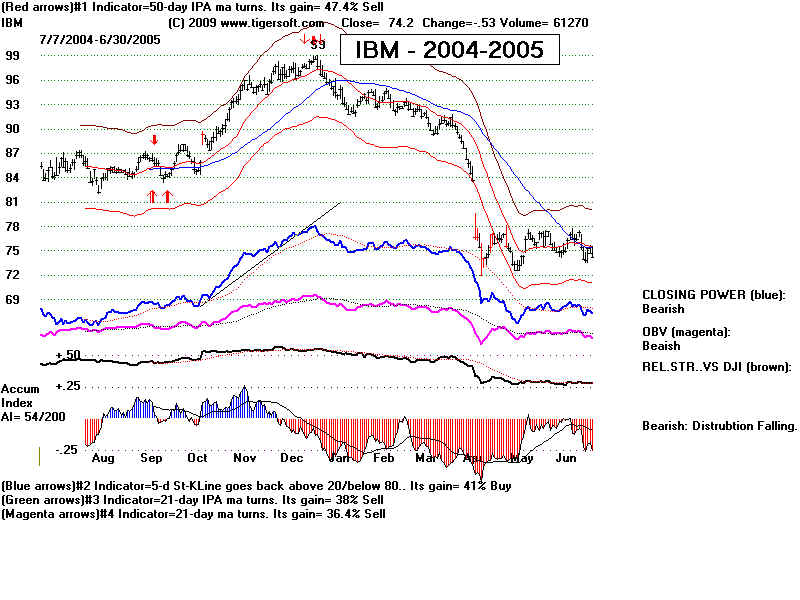
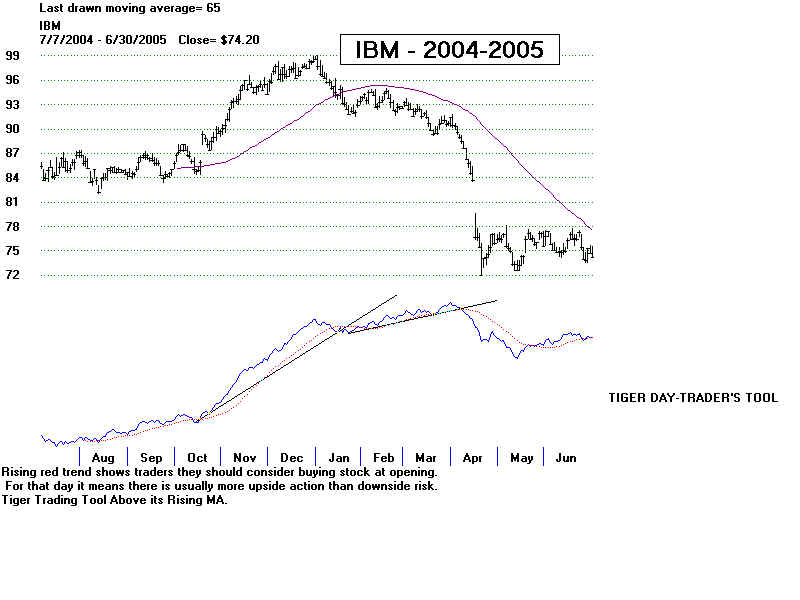
February
2004 - 97 to 74 in 3 months,
Confirmed
trends should continue until other divergences
of a
head and shoulders pattern occur.
by William Schmidt, Ph.D.
(Columbia University)
 |
Tiger
Software
|
|
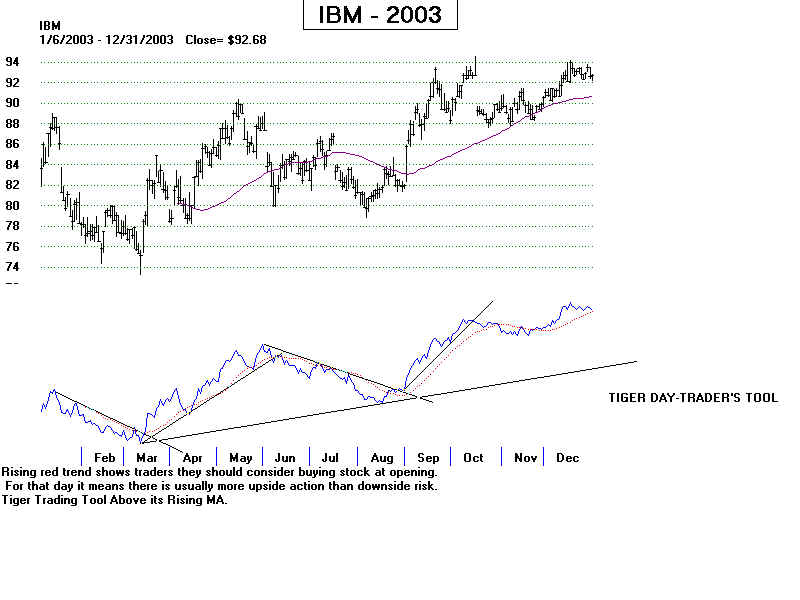
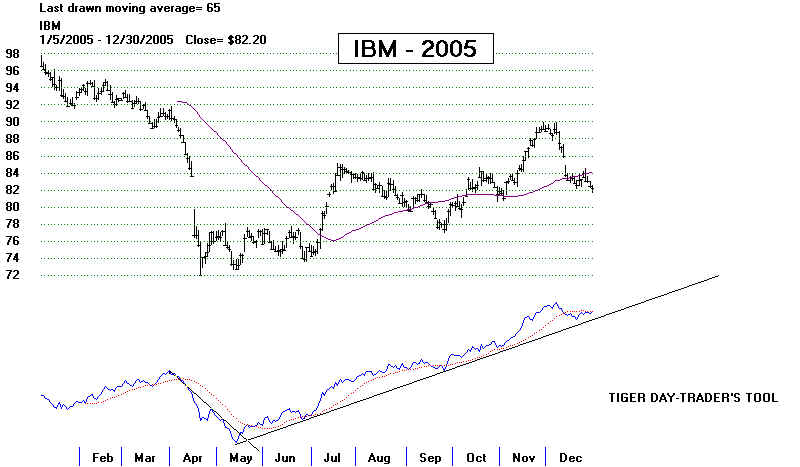
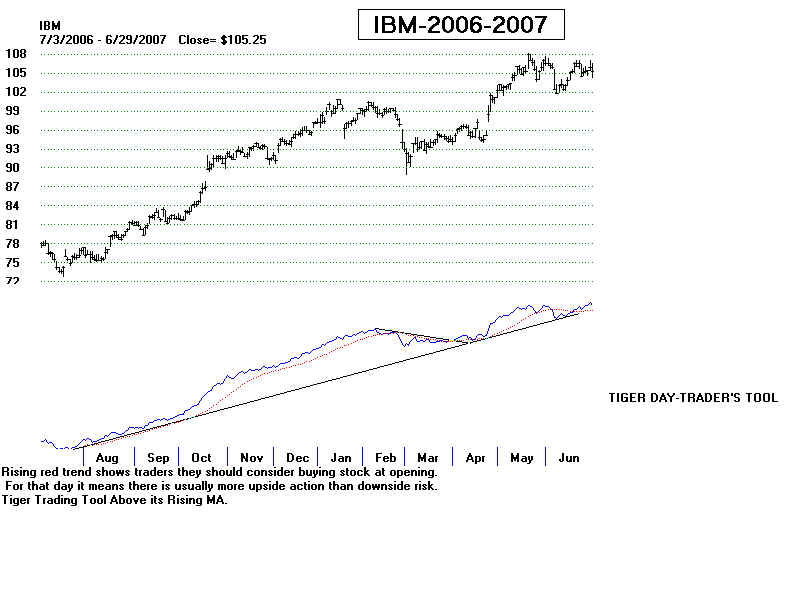
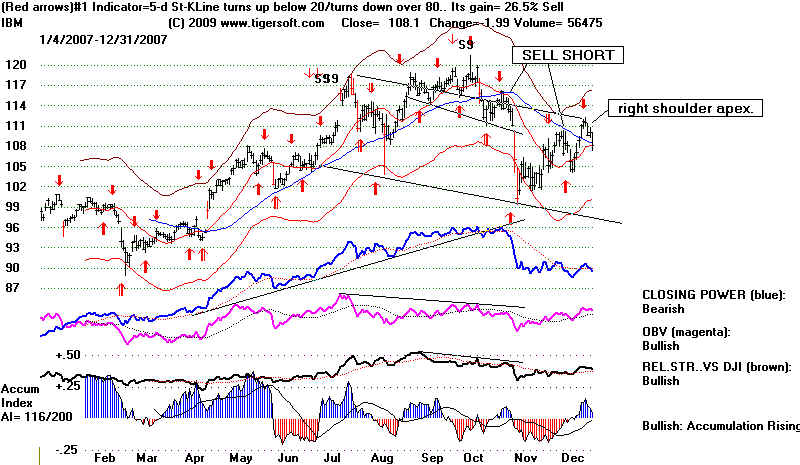
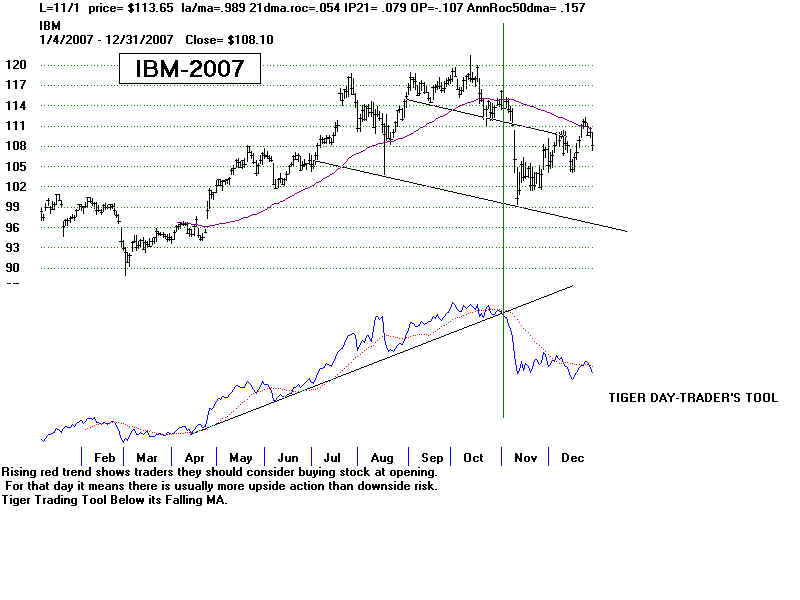
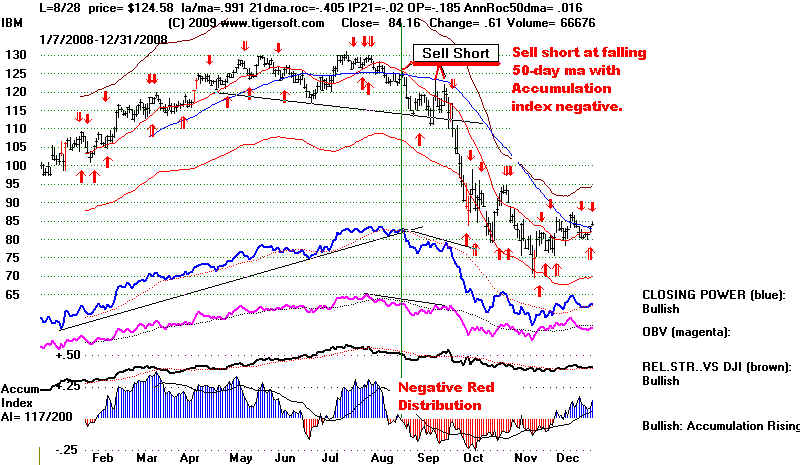
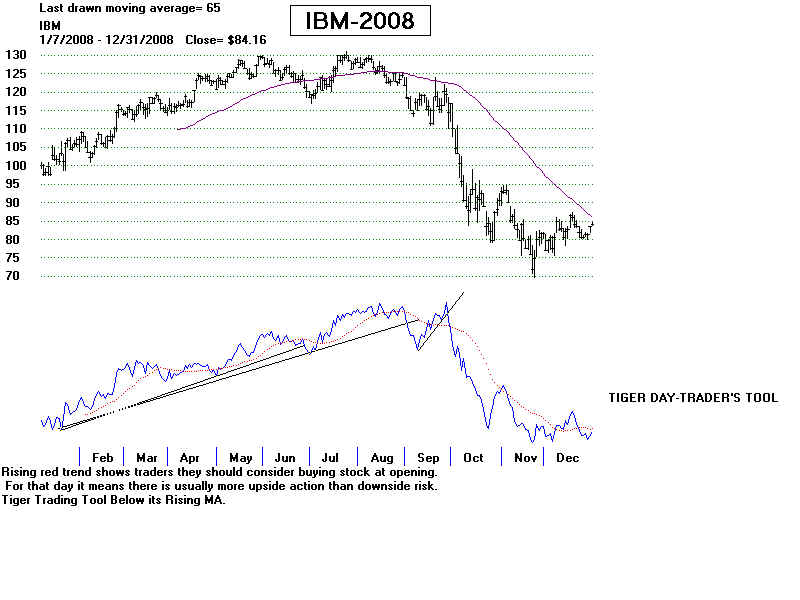
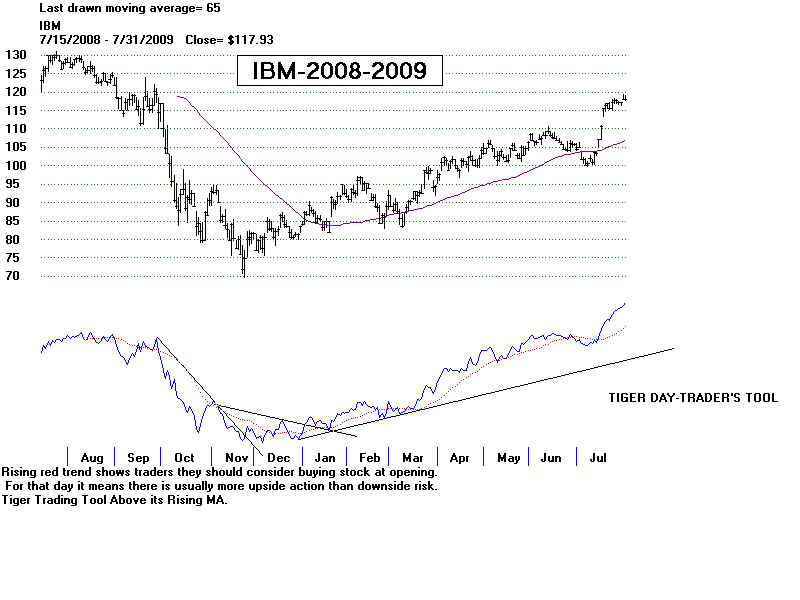
Research on Individual Stocks upon Request: Includes Composite Seasonality Graph of Any Stock for $125. Example of historical research NEM - Newmont Mining. Order Here. ======================================================== IBM: 1999-2009 Bearish TTT Weak TTT rally. 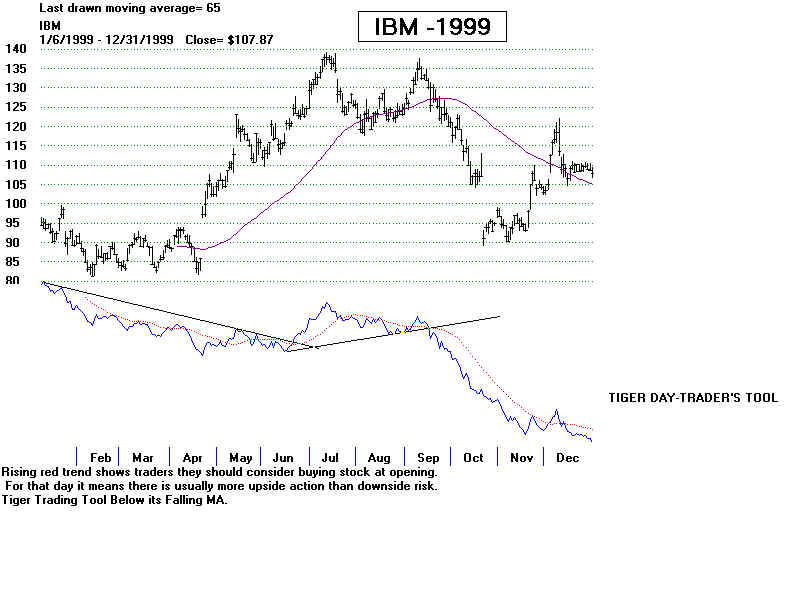
Rally suspect. TTT trying to bottom. 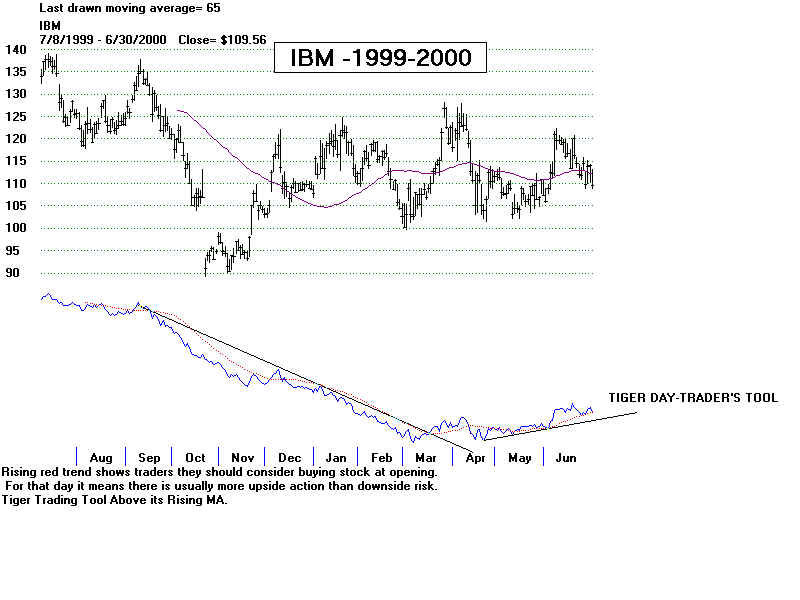 Given past bearish divergences, when TTT up-trend ends, SELL SHORT in SEPT. 2000. 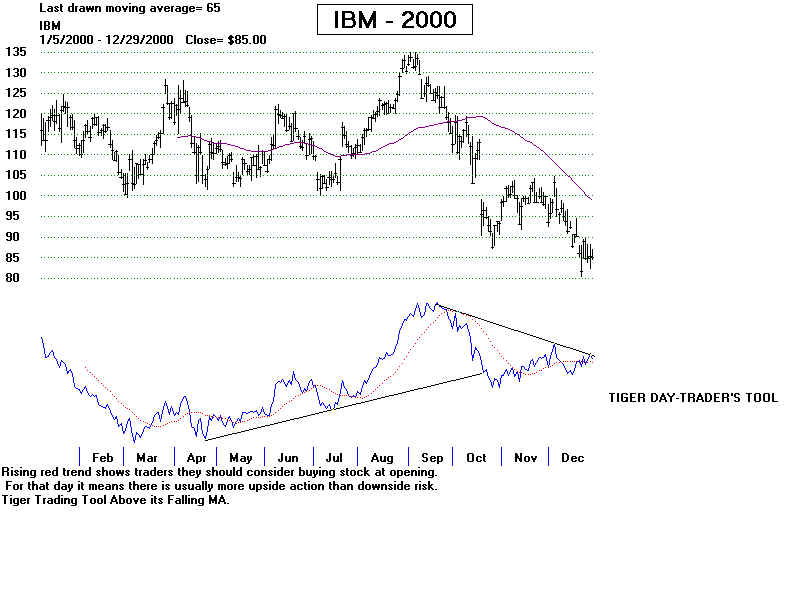
Break
in TTT uptrend brings sell-off
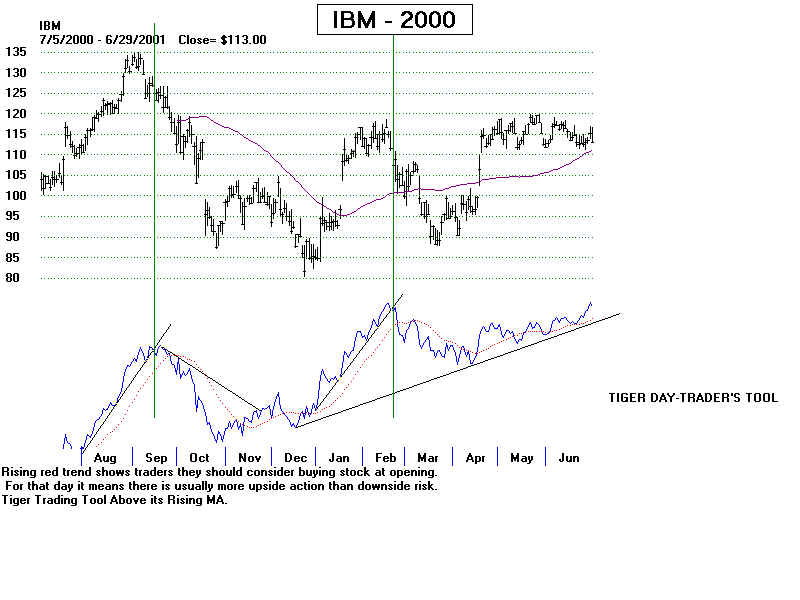
Gradual TTT uptrend matches gradual rise in prices.
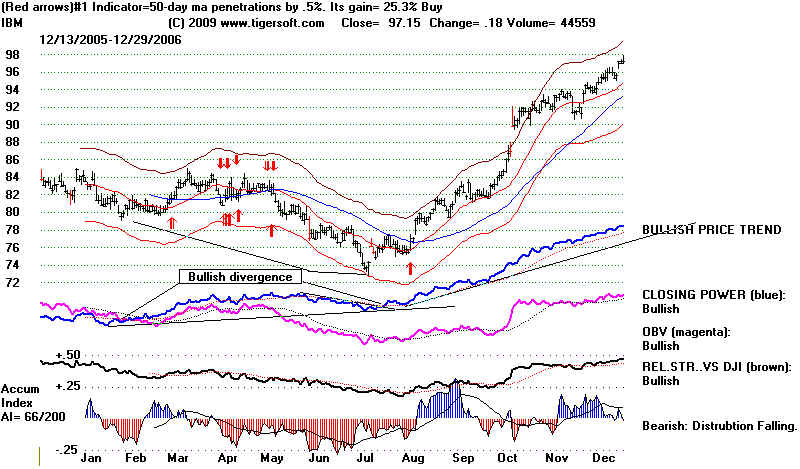
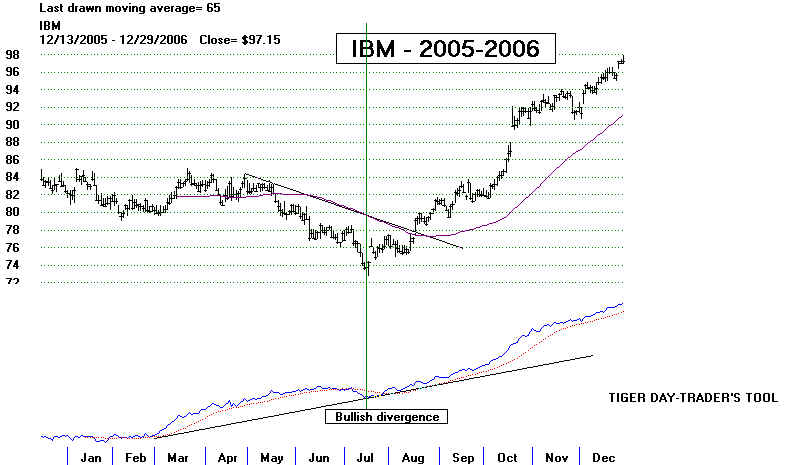
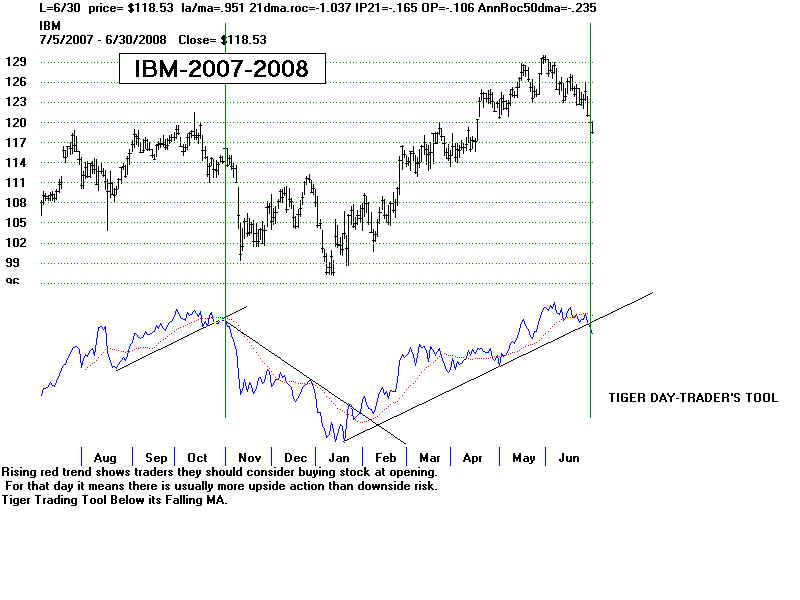
Bullish
Divergence by TTT sets up a big rally when |
 TTT
decline is bullishly shallower than
TTT
decline is bullishly shallower than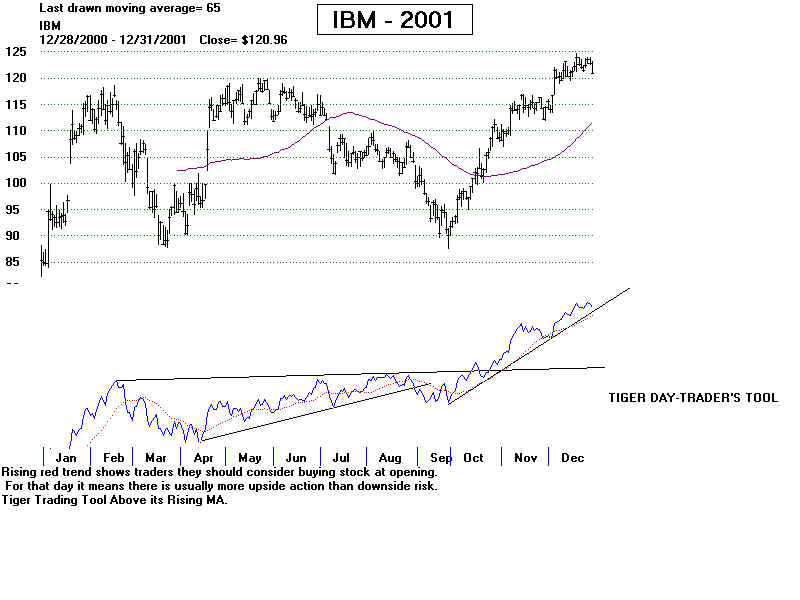
 Bullish
Divergence
Bullish
Divergence