
TigerSoft Freedom News Service 6/28/2009 www.tigersoft.com
Head and Shoulders Patterns
in The DJIA: 1915-2009
by William Schmidt, Ph.D. (Columbia University)
(C) 2008 All rights reserved. Reproducing any part of this page without
giving full acknowledgement is a copyright infringement.
Research on Individual Stocks upon Request:
Composite Seasonality Graph of Any Stock for $125.
Example of historical research NEM - Newmont Mining. Order Here.
 |
Tiger
Software Helping Investors since 1981
|
in The DJIA: 1915-2009
by William Schmidt, Ph.D. (Columbia University)
(C) 2008 All rights reserved. Reproducing any part of this page without
giving full acknowledgement is a copyright infringement.
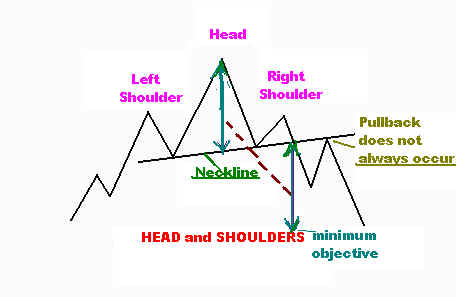
Head and shoulders price patterns frequently signal a reversal of trend.
The patterns range in size and symmetry. All are significant, especially if they
occur with gathering internal weakness and a major Peerless Sells in place.
They register the distribution of shares from insiders and professionals to
late-comers who think they are getting a bargain. In the pattern, look for volume,
breadth (the A/D Line) and the Tiger Accumulation Index to start drooping on the
left shoulder compared to the right shoulder. Where one or more of the
internals do not weaken, the pattern is more likely not to be completed. In those
cases, short sellers will have to scamble and the uptrend will probably continue
a little longer.
The pattern is not completed until prices close decisively (by 2%) below the
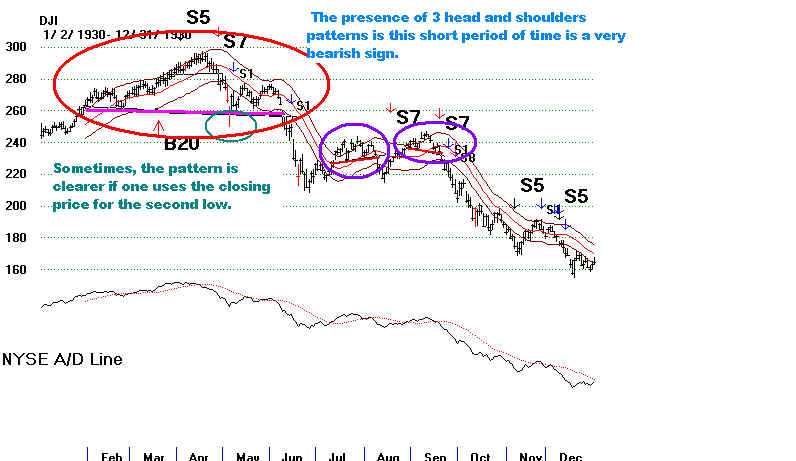
neckline, a line drawn through pattern's lows (or the closings if that makes the
price pattern look more symetrical.) The neckline may be rising, flat or falling.
Flat necklines are probably more bearish. They stand out more and make the
make the pattern's bearish reputation more self-fulfilling. Classic technical
analysis and theory sets out a minimum downside price objective for these patterns
to be the meximum height of the price pattern subtracted from the point of
breakdown before the neckline. As you will see here, prices often go much lower
than the minimum objective. That's what makes them so important.
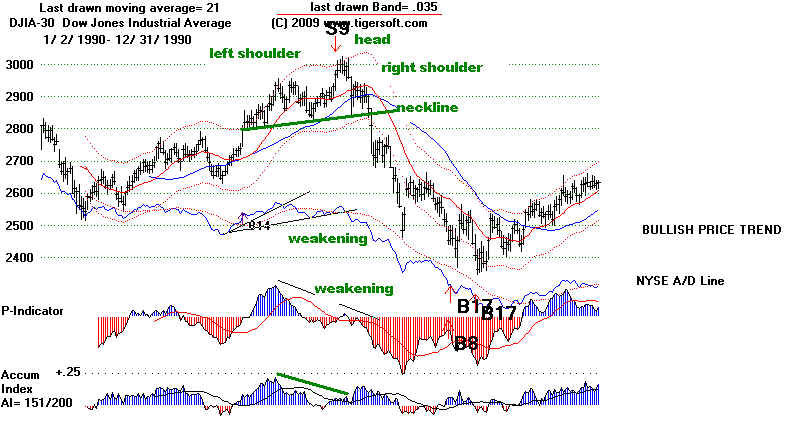
Do not expect perfect symmetry, though such patterns are found. The
right shoulder tends to be the same shape and duration as the left shoulder.
This is only a propensity. Sometimes the right shoulder is formed over a much
shorter time than the left shoulder. The right shoulder seldom lasts longer
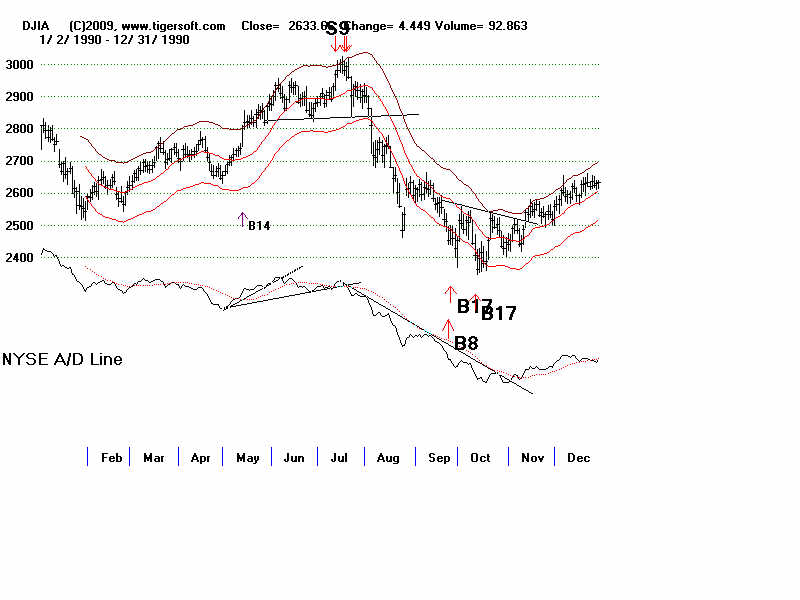
than the right shoulder. The 1990 head and shoulders pattern below shows this.
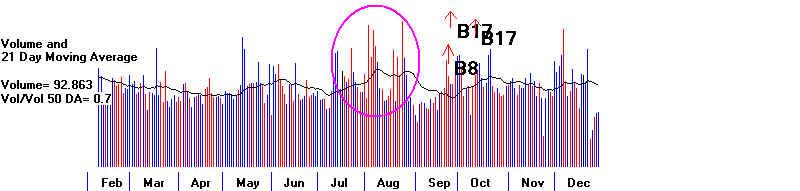
Note the way volume picks up when the neckline is violated. This is another
feature that will help you make a correct identification. Breadth (A/D Line and
P-Indicator) did weaken during the pattern. The Accum. Index did not weaken.
These patterns are hard to find using a computer. Well-tested flat necklines are no
problem, but a human being must judge if the distinctive two "shoulders" and
"head" are present. TIgerSoft will signal with an S10 when there is a well-tested
support failure. The user will have to decide if the broken support is the "neckline"
in a head and shoulders pattern. As there are plenty of cases to look at here, after
a little study, spotting them should become fairly easy.
Note that there are several main variations:
(1) Normal head and shoulders patterns which reverse a significant earlier advance;
(2) Patterns where the pattern fails when prices surpass the apex of the right shoulder;
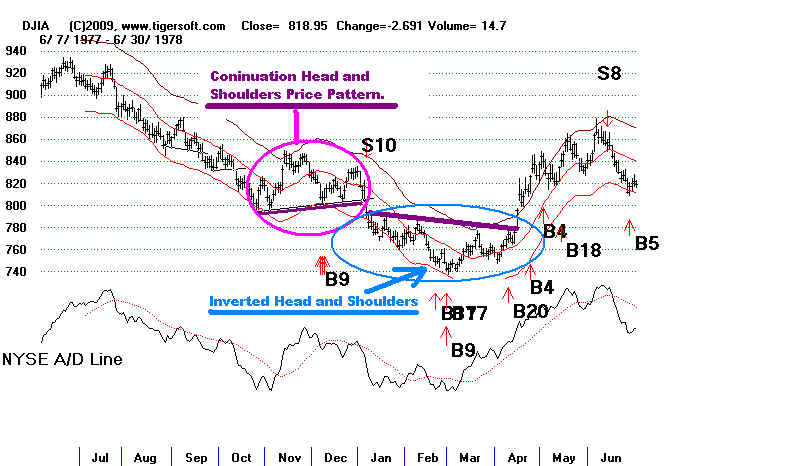
rather than break below the neckline-support; (3) Continuation head and shoulder
patterns which appear in continuing bear markets.
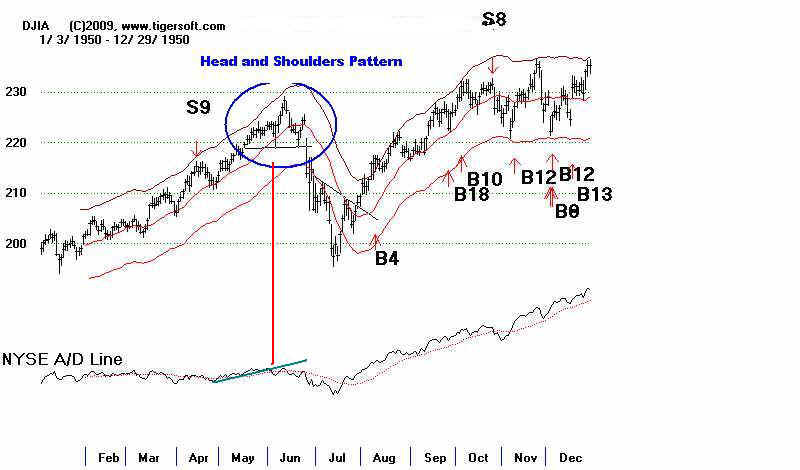
The patterns may take as little as two or three weeks to complete and still have
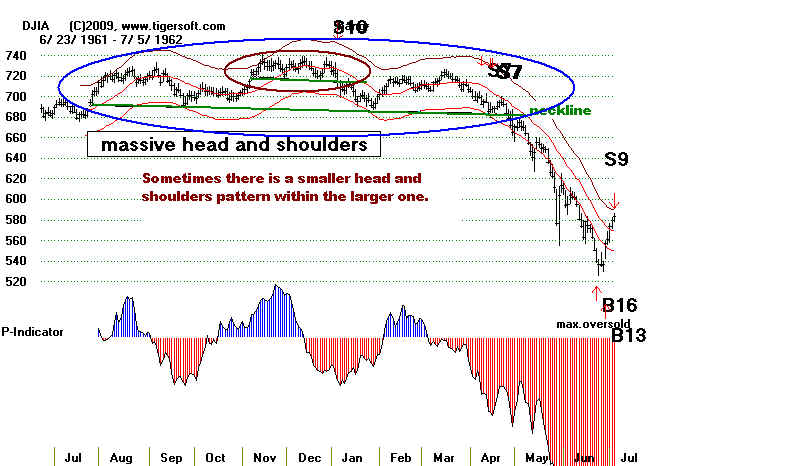
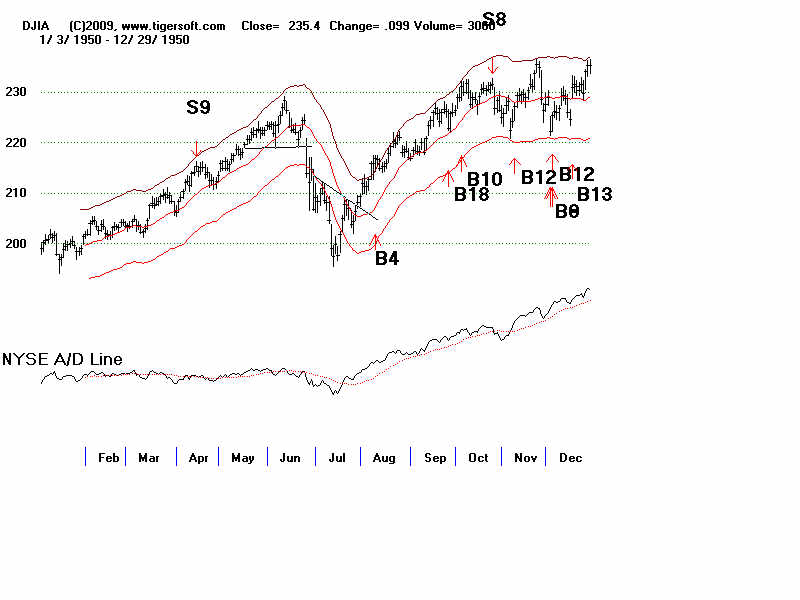
significant bearish potential, as in May-June 1950.
They can also last 8 months or more. The longer-term ones usually take
on much more importance. The 1961-1962 pattern took 8 months to complete.
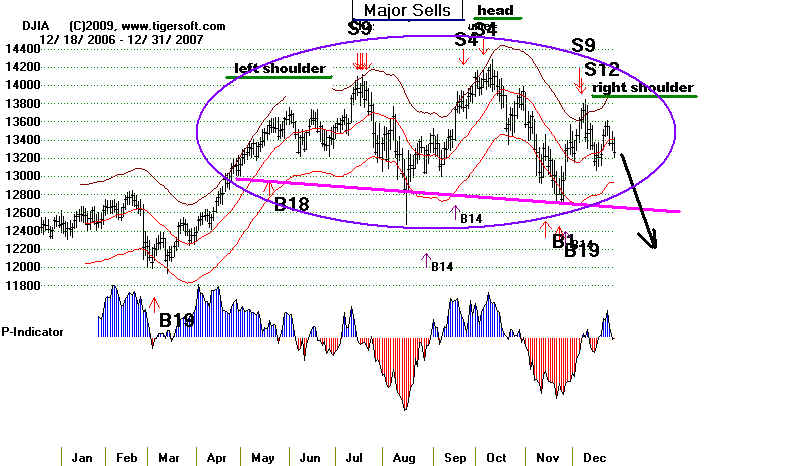
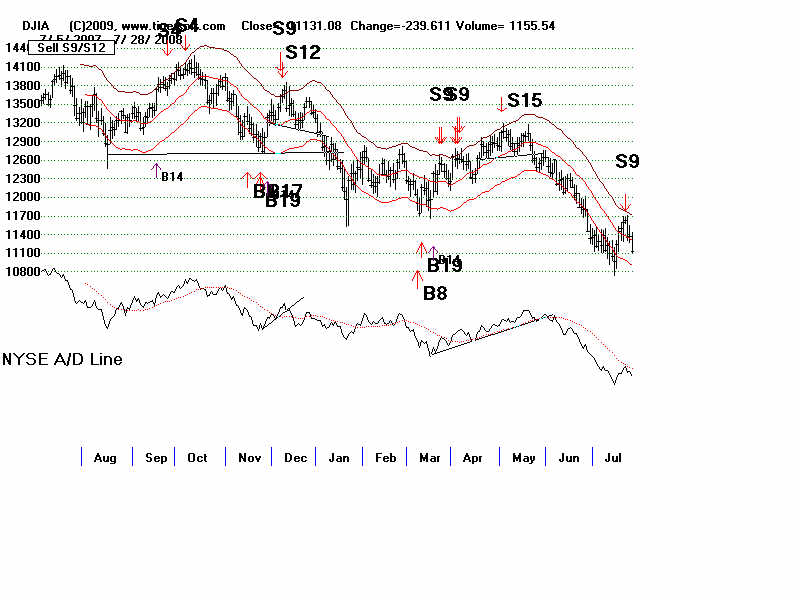
So did the 2007-2008 top.
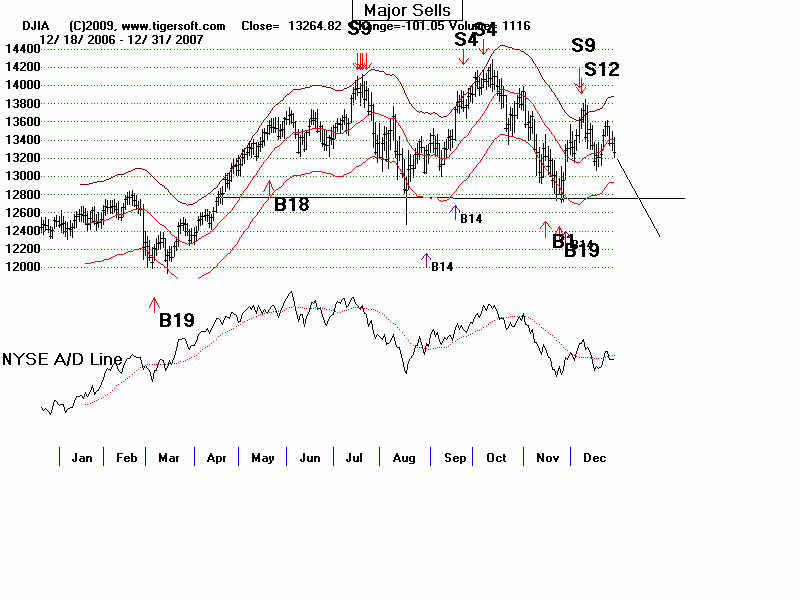
Don't expect perfect symmetry. The 2007 tops can be viewed as being
part of a massive Head and Shoulders pattern. Once the neckline gave way,
prices fell rapidly and a serious bear market began.
Watch for Bearish Head and Shoulders Patterns
Watch for Bearish Continuation Head and Shoulders Patterns
and Bullish Inverted Head and Shoulders Patterns.
There are lots and lots of head and shoulders pattern in the DJI
since 1919. This is an effort to provide a complete list and a display
of each. More than 75% of them work out profitably, I would estimate. Moves
past the apex of a right shoulder usually (90% of the time) abort the
pattern. Declines below the neckline complete the pattern. Frequently,
but not always, there is a retracement after the neckline is penetrated of 1/2 to 1/3
of the previous decline's loss. That move's failure to get past the right shoulder
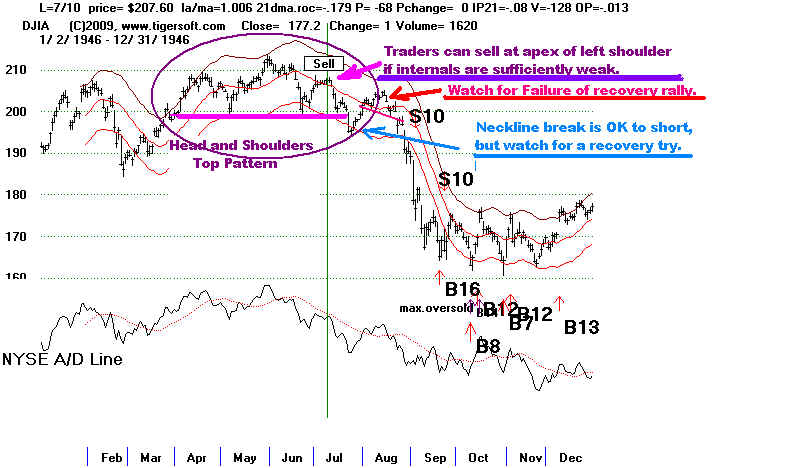
apex represents a second chance to go short if there is such a rally.
Many traders will go short on the apex of the right shoulder if volume is correct.
When TigerSoft's Accumulation Index falls off to zero or even below that,
we can gain more confidence to be this aggressive. Going short when the
neckline is clearly violated is used by many traders.
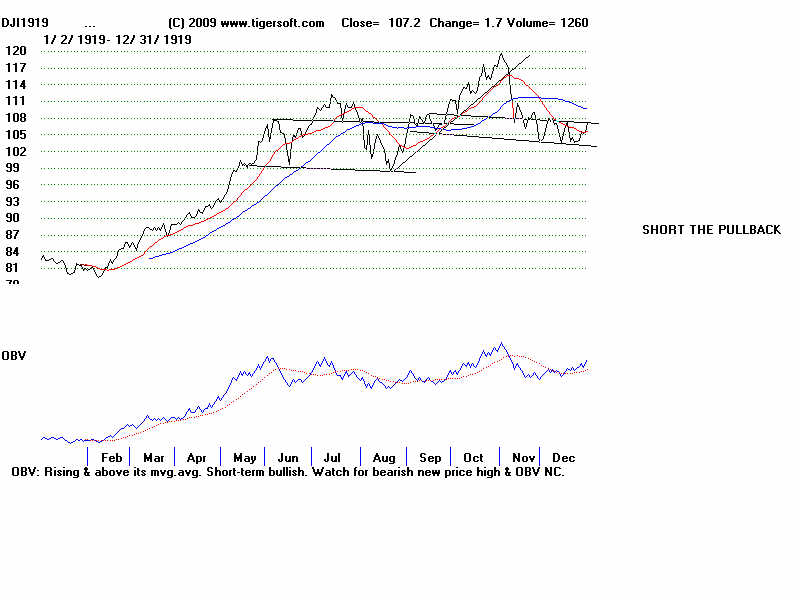
Only daily closing prices available on DJI until 1928.
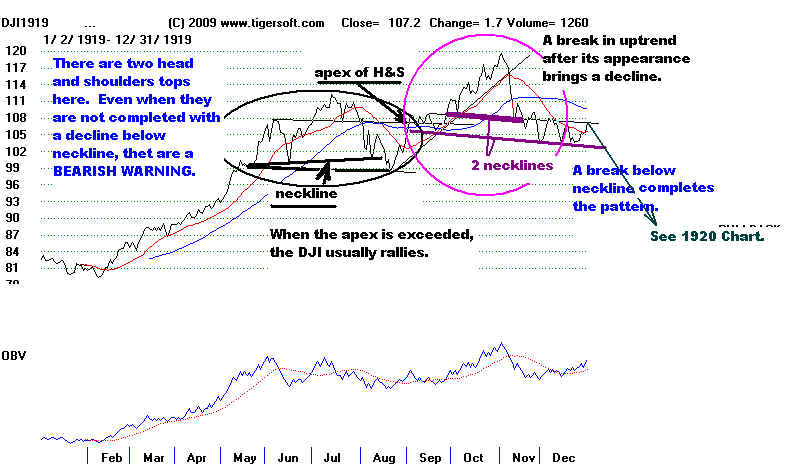
1919 rally to 111 and potential head and shoulder, but aborted and DJI rallied to 120.
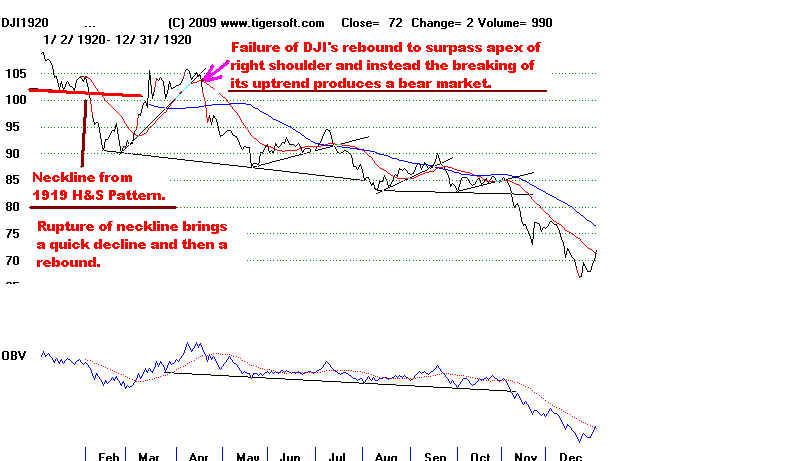
Head and shoulders with neckline at 102.
DJIA - 1919
DJIA 1920
From here on, the data includes daily highs and lows and NYSE A/D numbers.
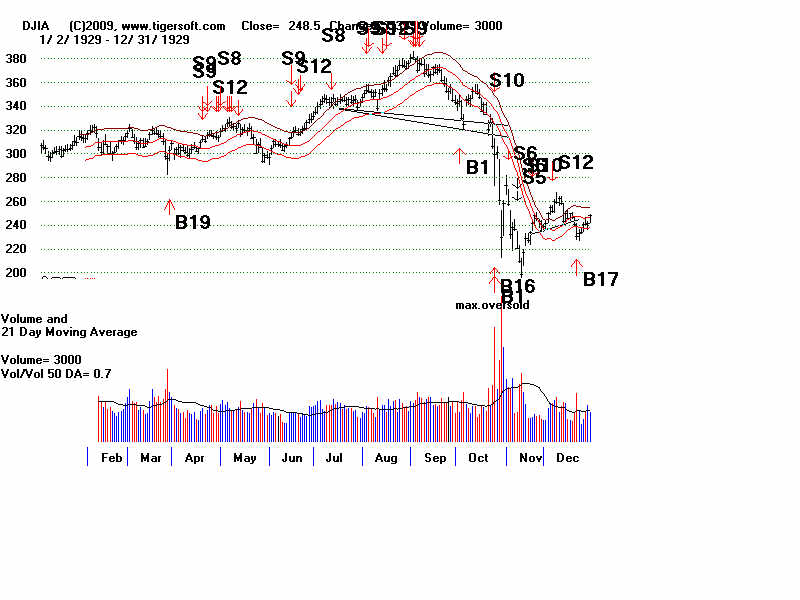
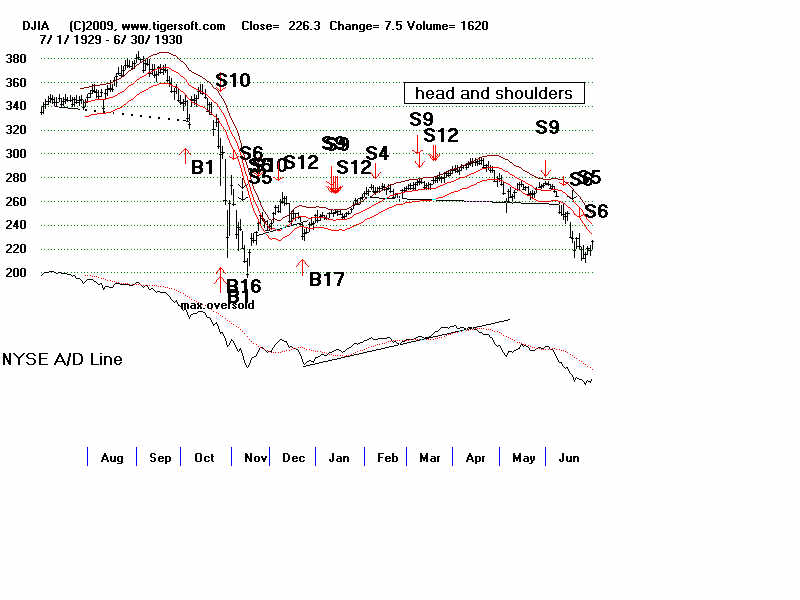
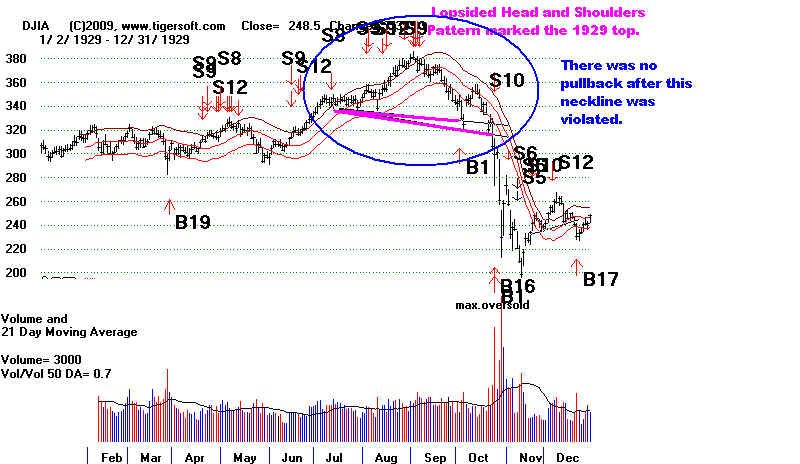
1929 rallied to 382 and then formed head and shoulders pattern.
NYSE A/D Line was already downtrending.
Note the mini head and shoulders pattern in Nov-Dec 1929
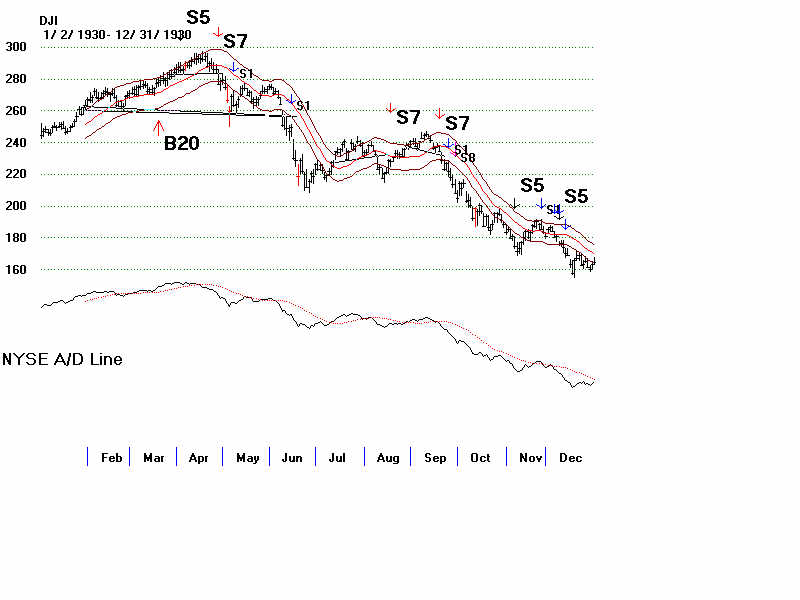
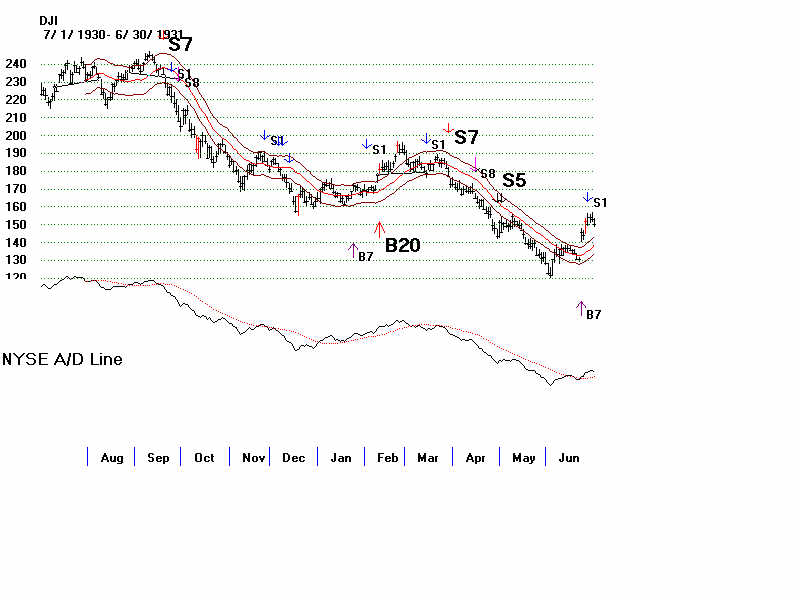
1930 Continuation head and shoulders with neckline break in May 1930.
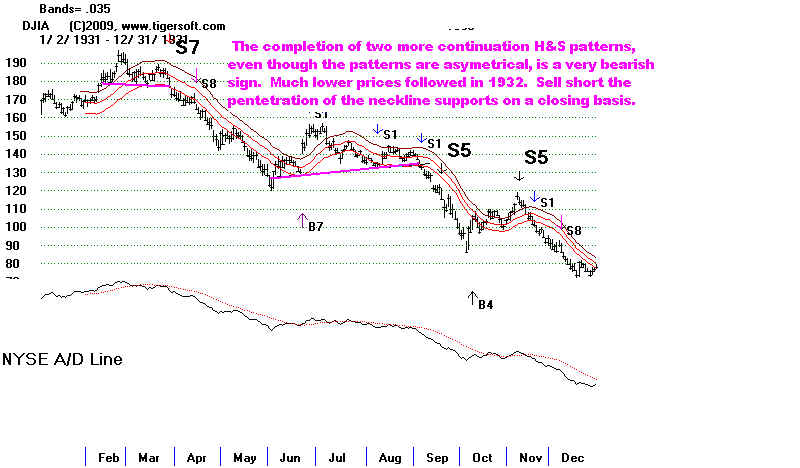
Notice 2 other continuation H&S patterns. This is bearish.
1931 Continuation head and shoulders 1931 chart.
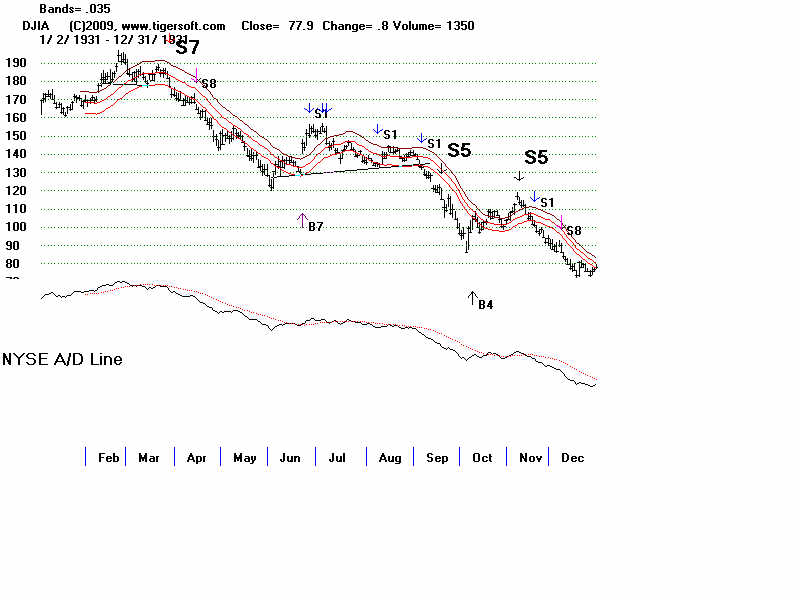
1932 decline featured many support failures.
1933 muliple head and shoulders tops 1933-1934
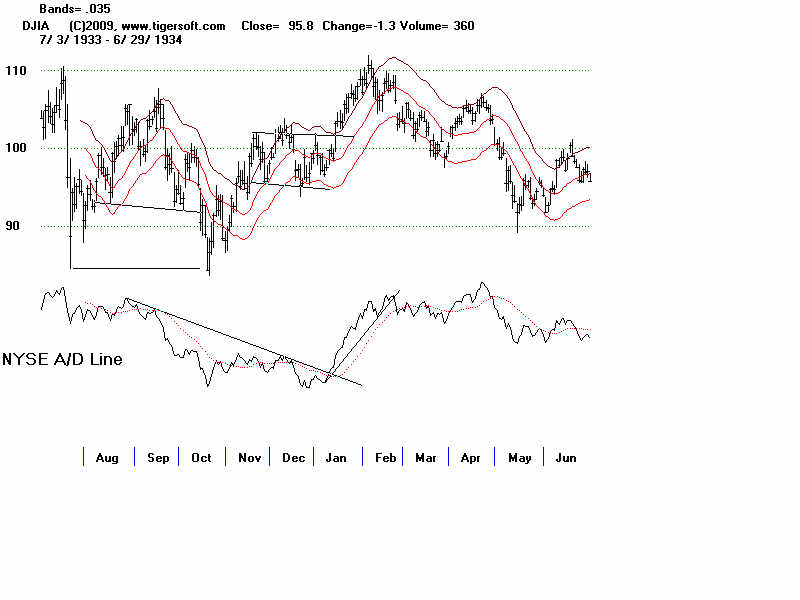
1934-1935 head and shoulders aborted but quick S9.
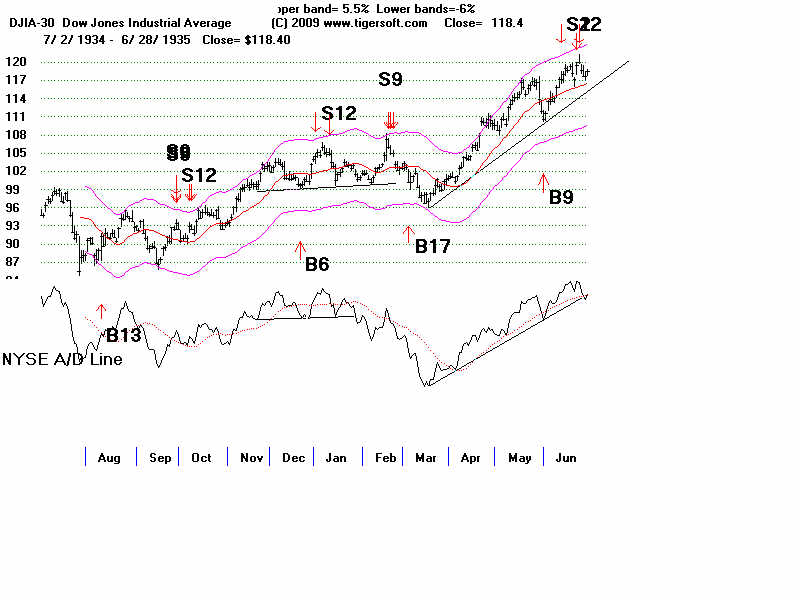
1937 Asymetric head and shoulders brings decline from 193 ro 165. Fake-out rally to 190. S9 at its top.
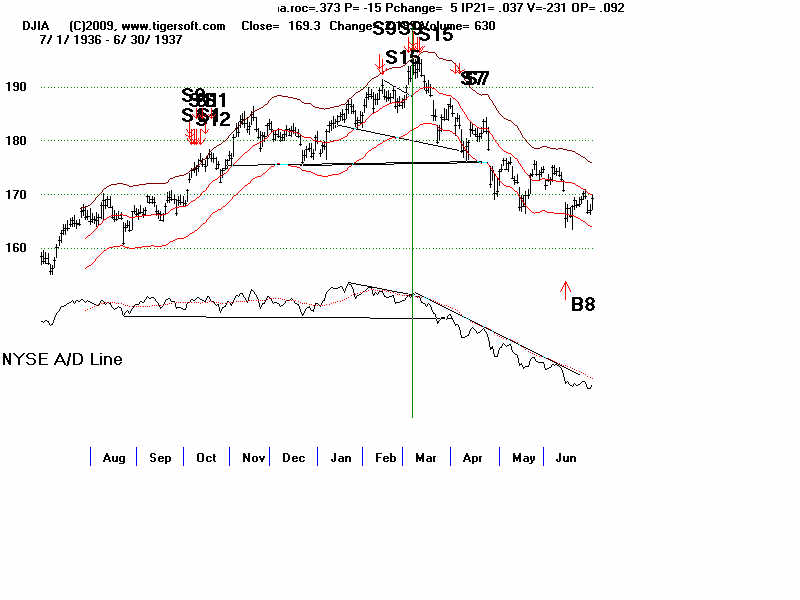
Two B7s fail in August and Sept after Sell S9...Use extreme bearish mode.
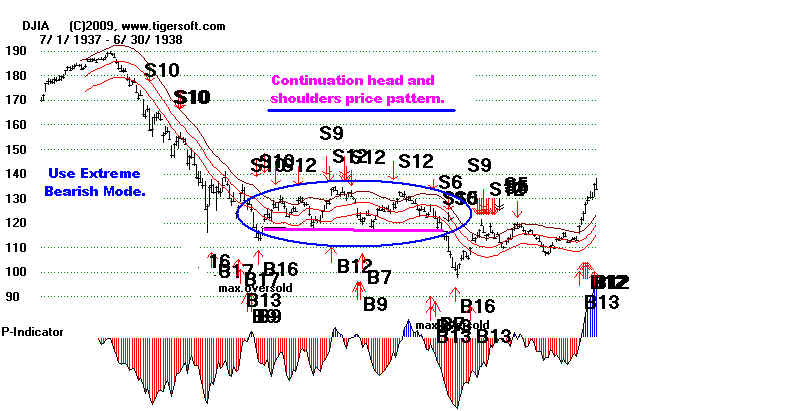
1938 Continuation head and shoulders from Nov 37-March 38. Buy B12...1937-1938
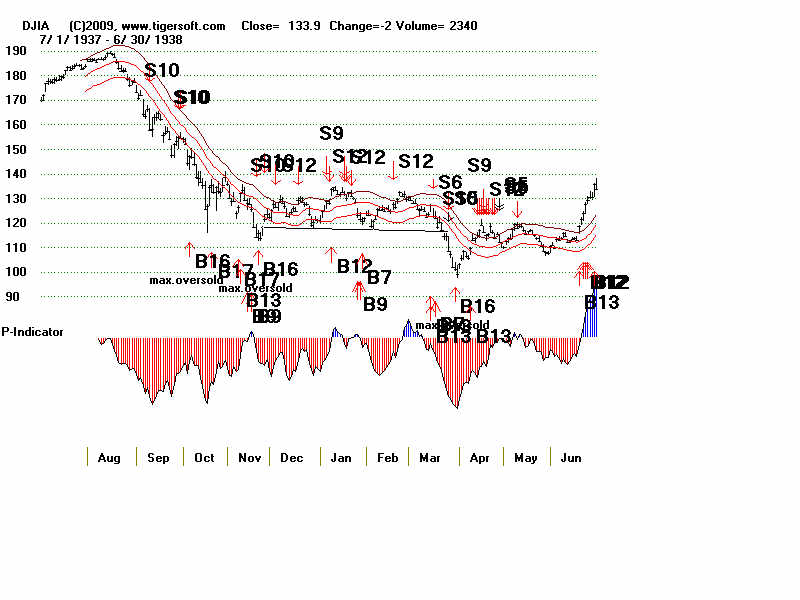
1939 fluctations tradeable with A/D Line Bad B13s, B17s
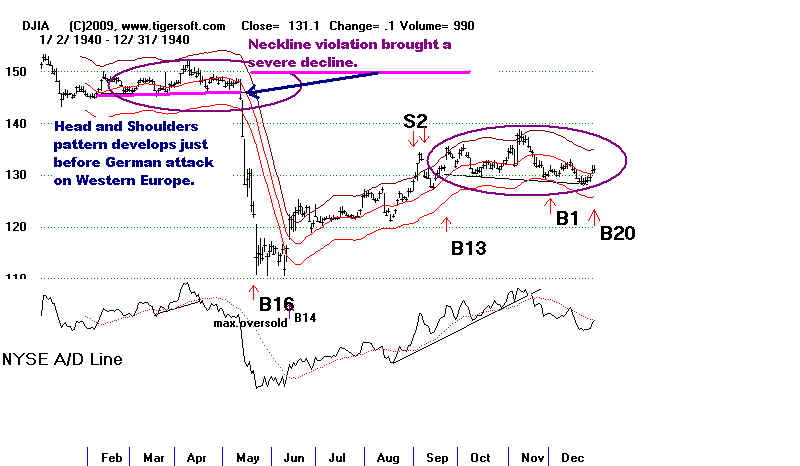
1940 unusually long lateral movement. Head and Shoulders with neckline - 145 support.
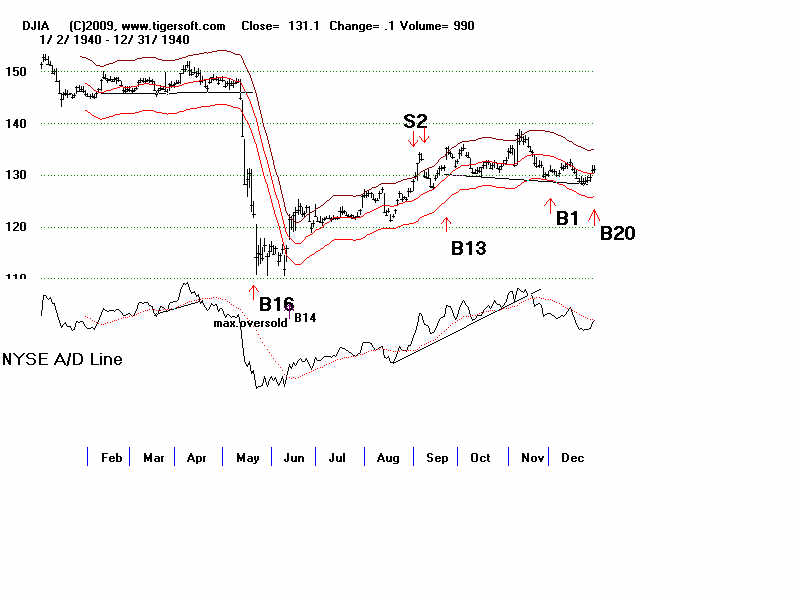
Note its asymetry - Patern was from Jan - May 1940.
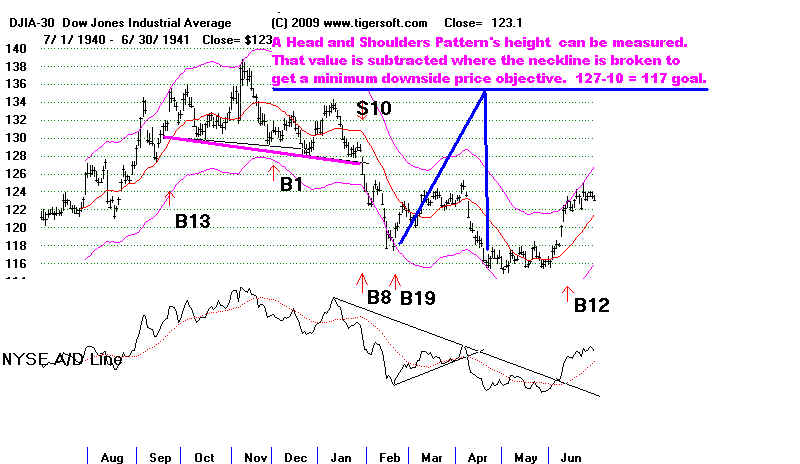
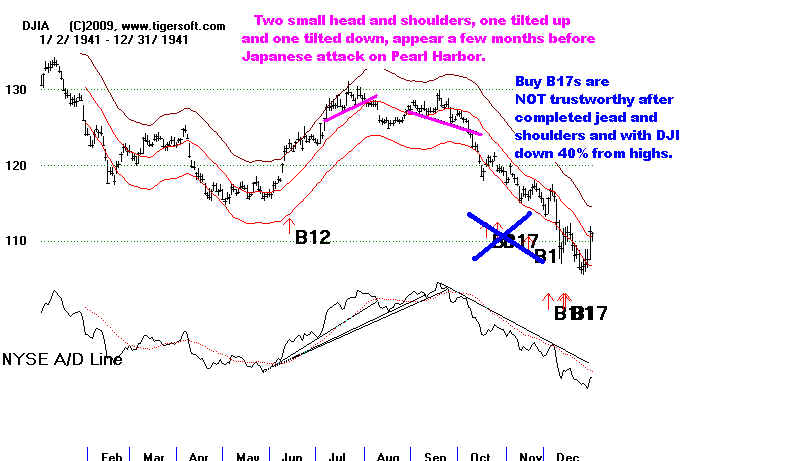
1940-1941 Sept-Jan 1941 head and shoulders.
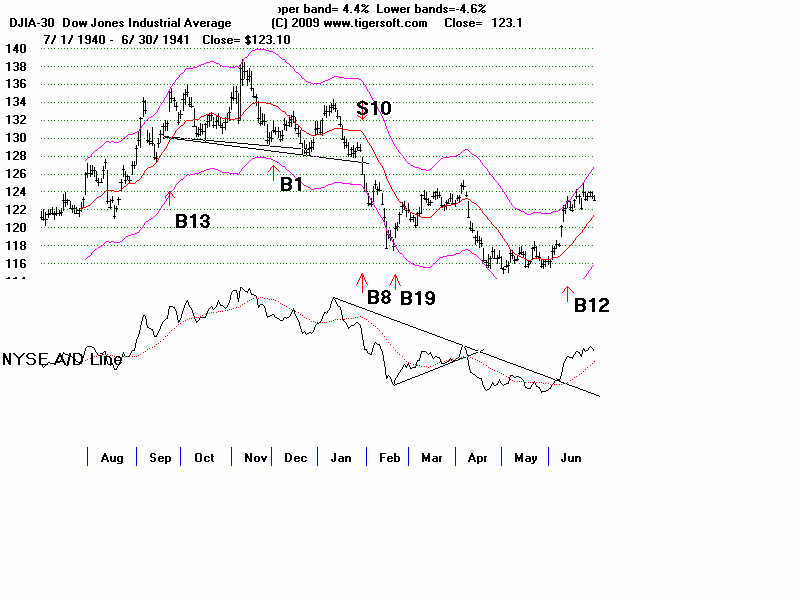
HS Measuring" 129-138 BREAKDOWN AT 127. - 10 = 117 IS TARGET.
HITS THIS AND MUST BUILD BASE AT 116.
1941 head and shoulders patterns
BAD B17s in October and Nov. Bad B1 in Nov. Decline to 94 in April 1842
1942 V bottom. Buy B4 a month off bottom. No inverted head and shoulders.
1943 up from 105 to 140.
Head and shoulders top - July to October - find Decline to 130. B1 is premature.
1944 Inverted and Shoulders Pattern - July 1943-May 1944.
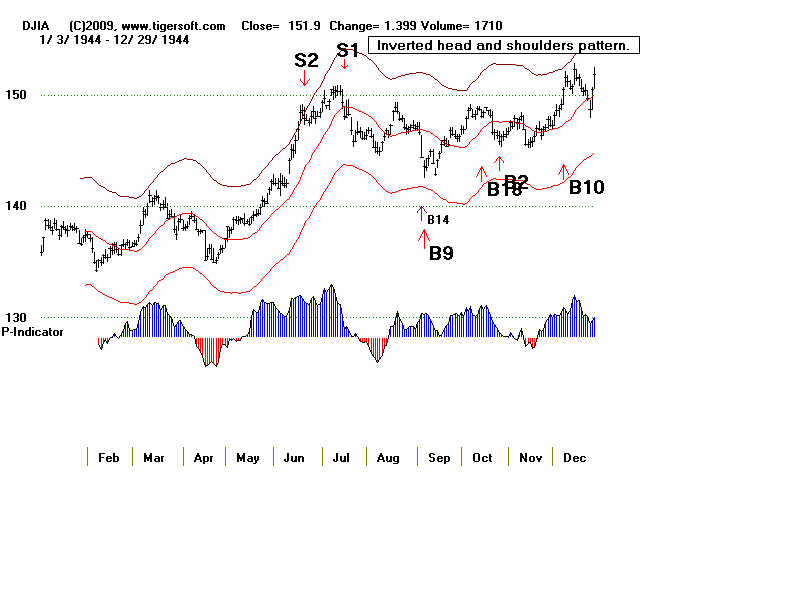
Inverted Head and Shoulders pattern - July 1944- Dec 1944.
1945 False head and shoulders. Breadth was too good. IP21=.085 on apex of rt shlder.
False head and shoulders. But breadth penetrated. IP21= -.049 P=17.
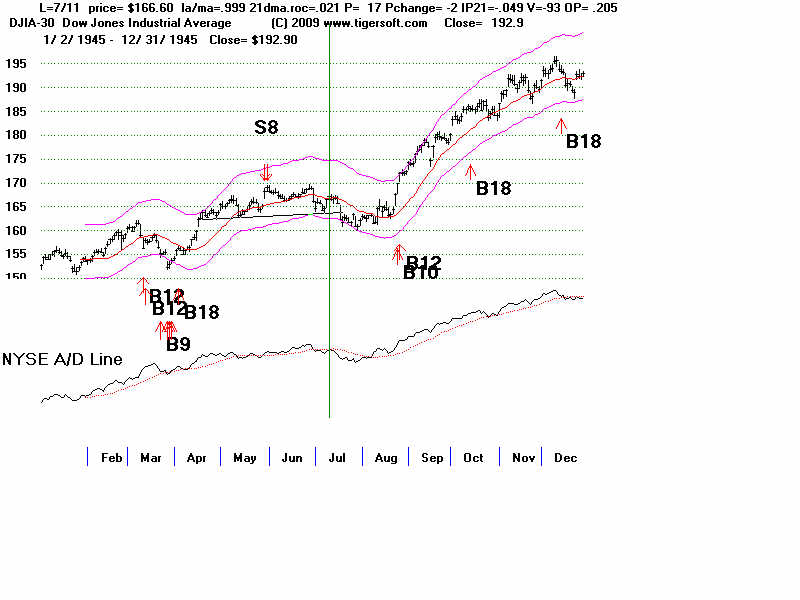
1945-1946 Multiple Head and Shoulders - Jan-Feb, April, May-June - Warnings.
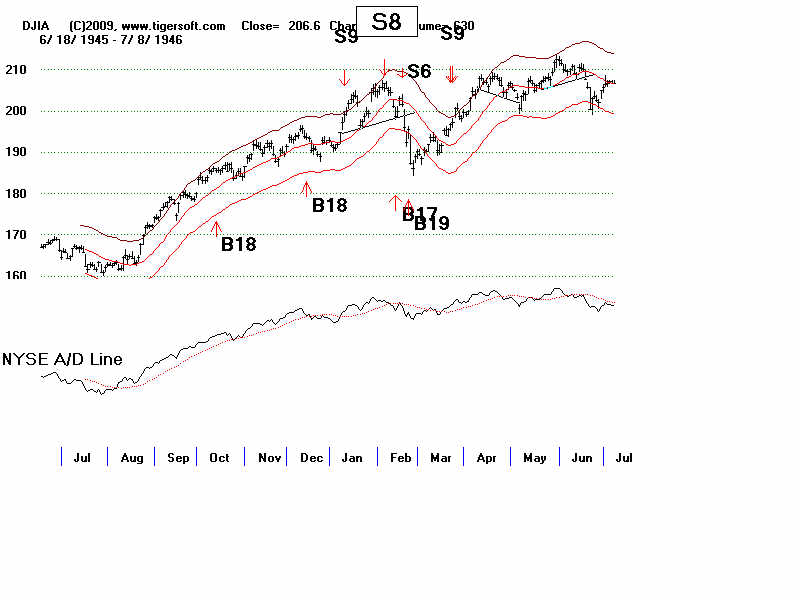
1946 Classic sprawling HEAD AND SHOULDERS APRIL - JULY 1946
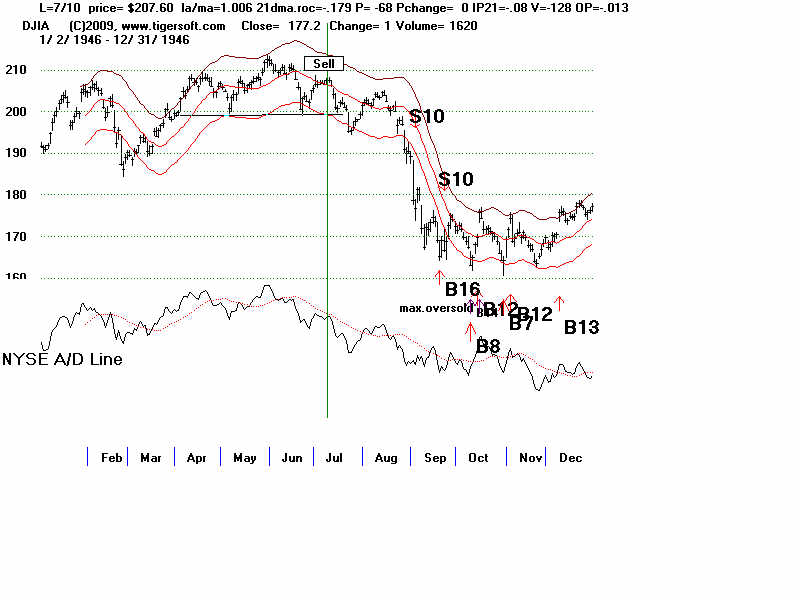
RIGHT SHOULDER APEX = -68 -.08 -.013
1947 HS OCT 47 - very brief.
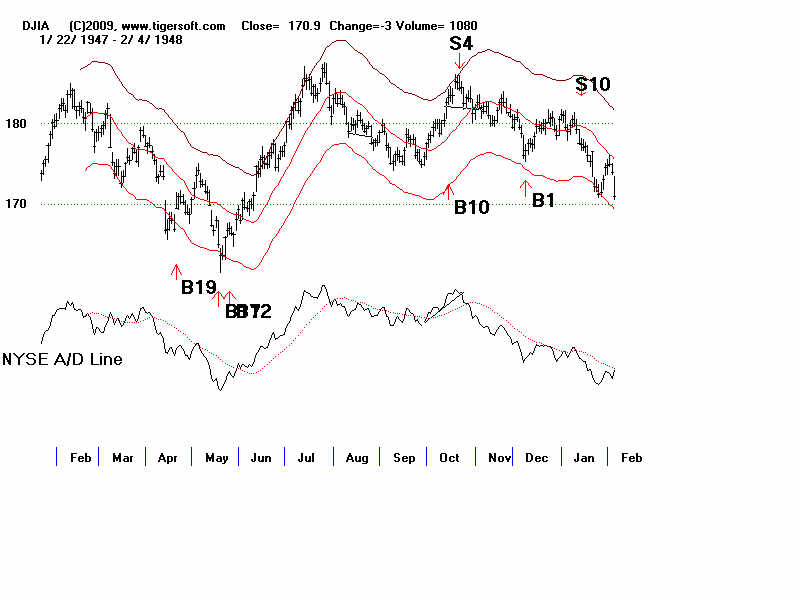
1948 HS Apr-July Best not to Buy for a month after breakdown below neckline.
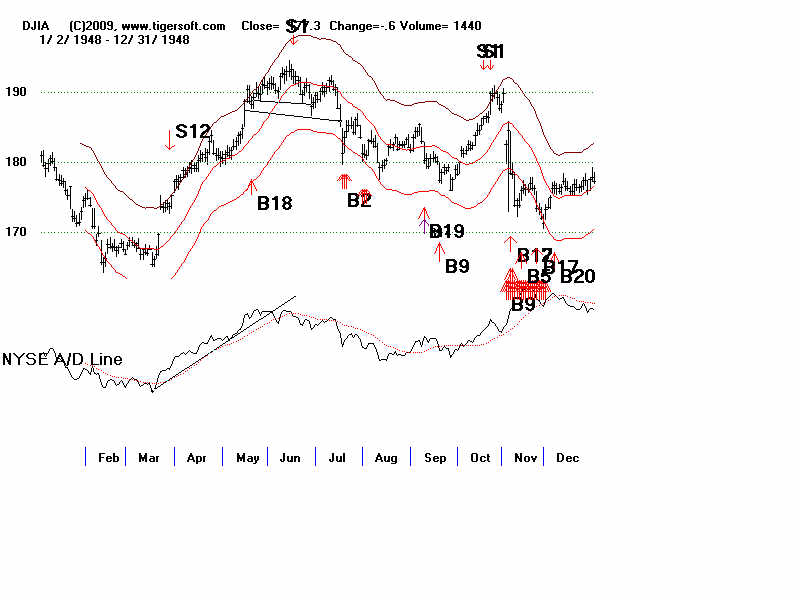
HS Dec-1948-Jan 1949
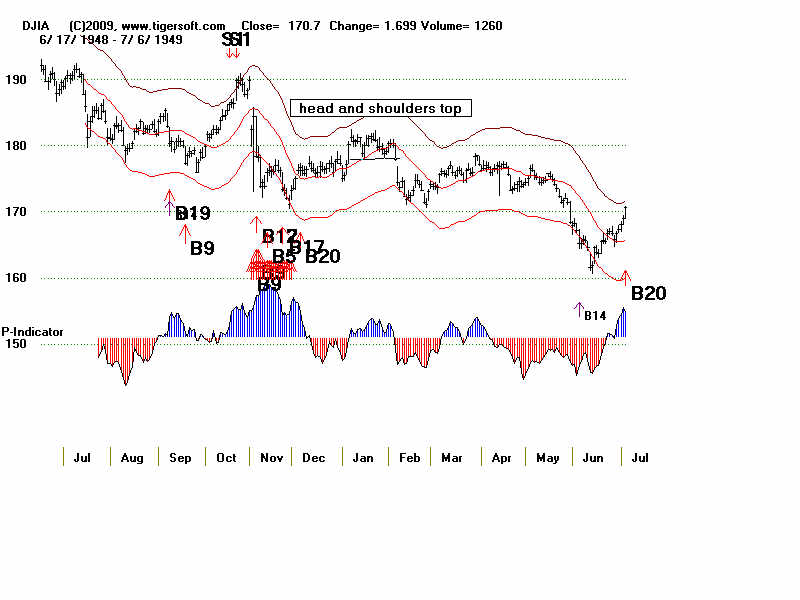
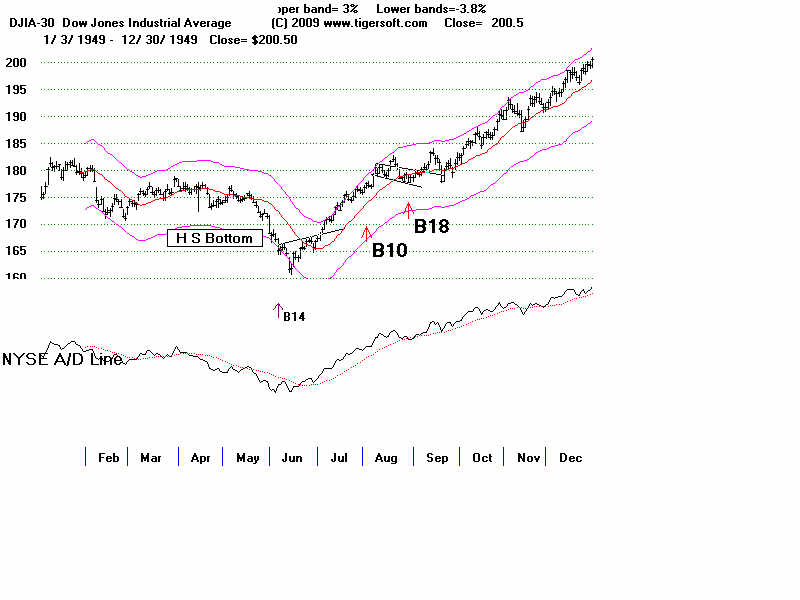
1949 Inverted HS June False HS in AUG
1950 HS May-June INVERTED HS June-July
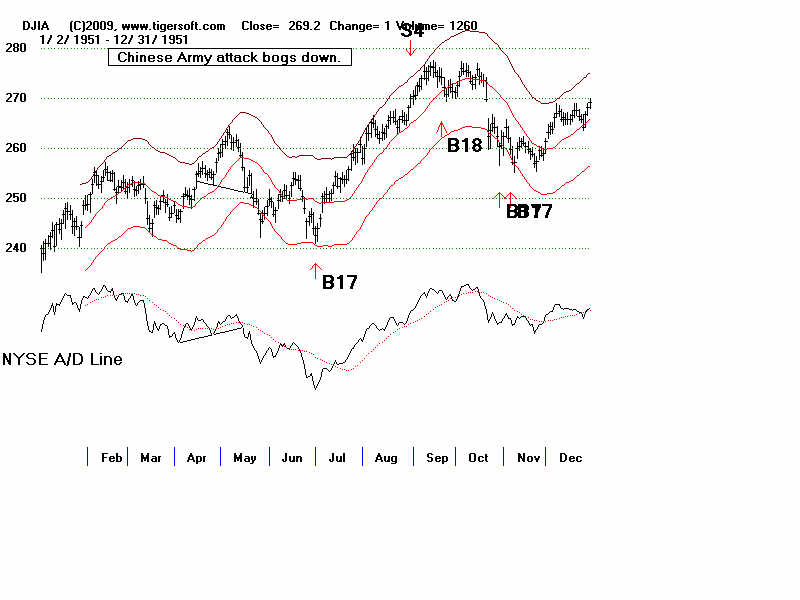
1951 HS Apri-May
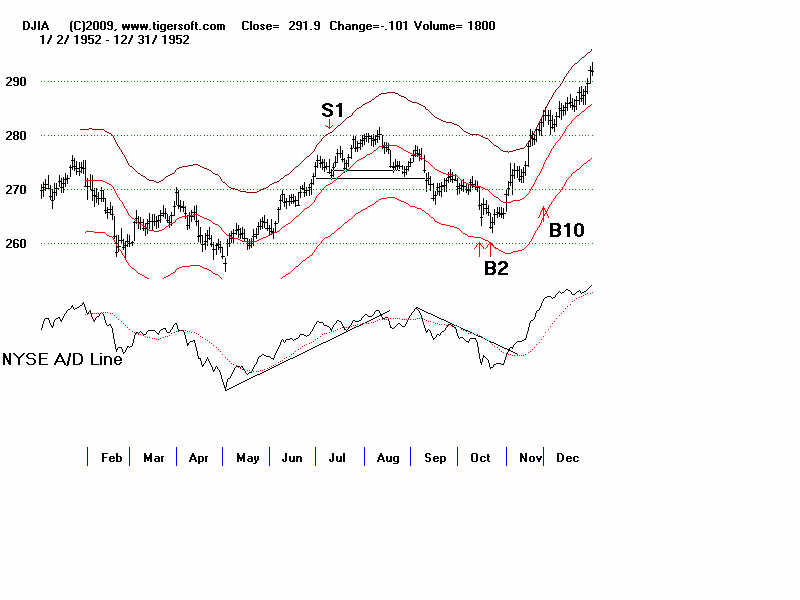
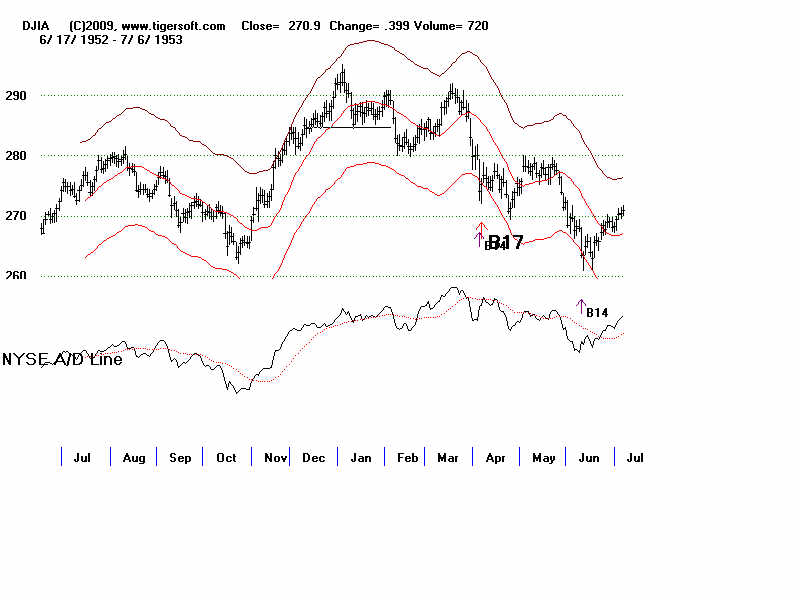
1952 HS Jan-Feb Mar-Apr Jul-Aug
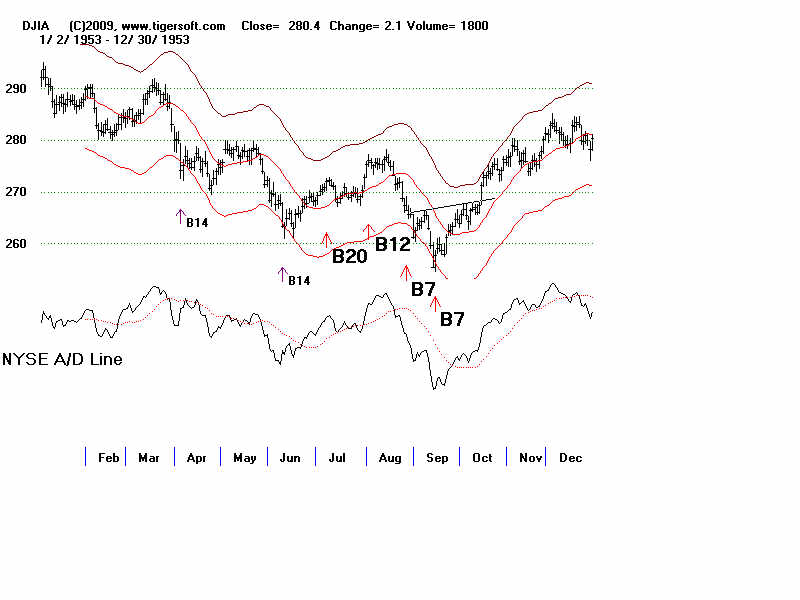
1953 HS Dec52-Jan 53 rising A/D Line. Inverted HS Aug-Sept
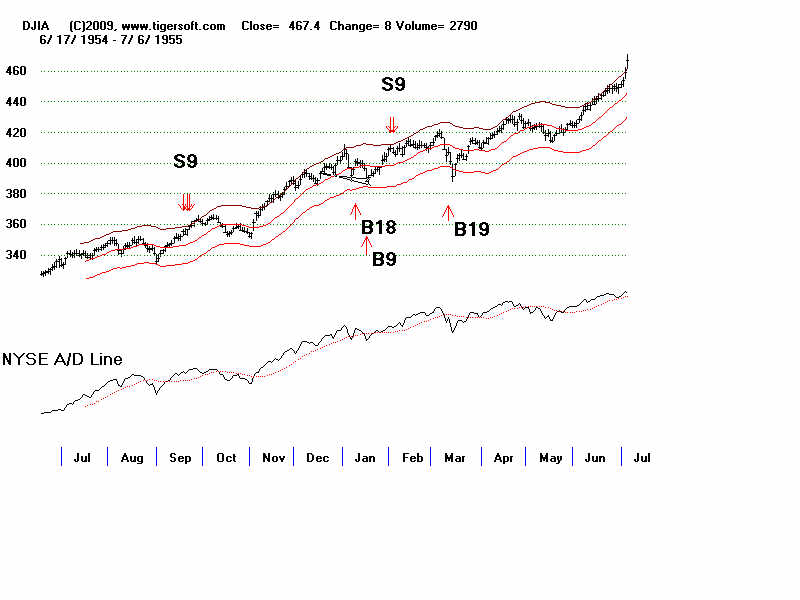
1955 Dec-54 -- Jan-55
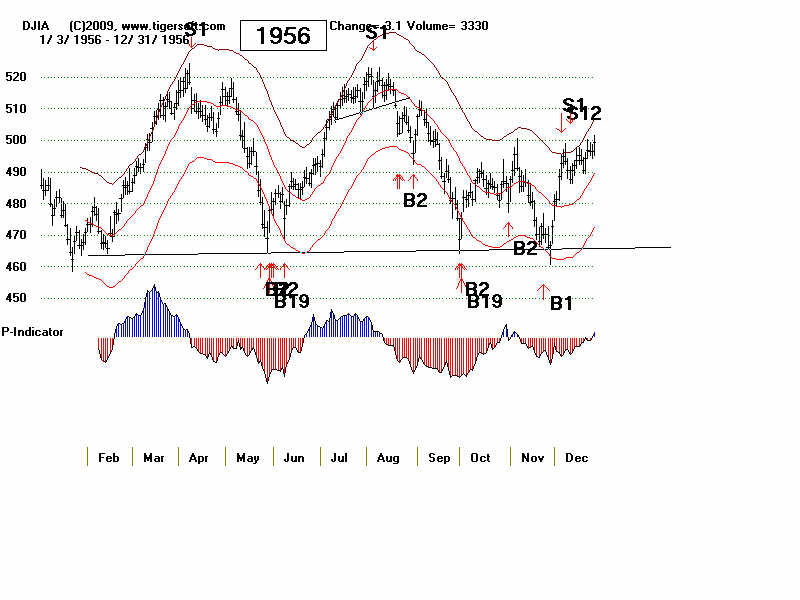
1956 Mar-Apr - imperfectly formed Head and shoulders in July-Aug was a classic
RULE don't buy right after completed HS
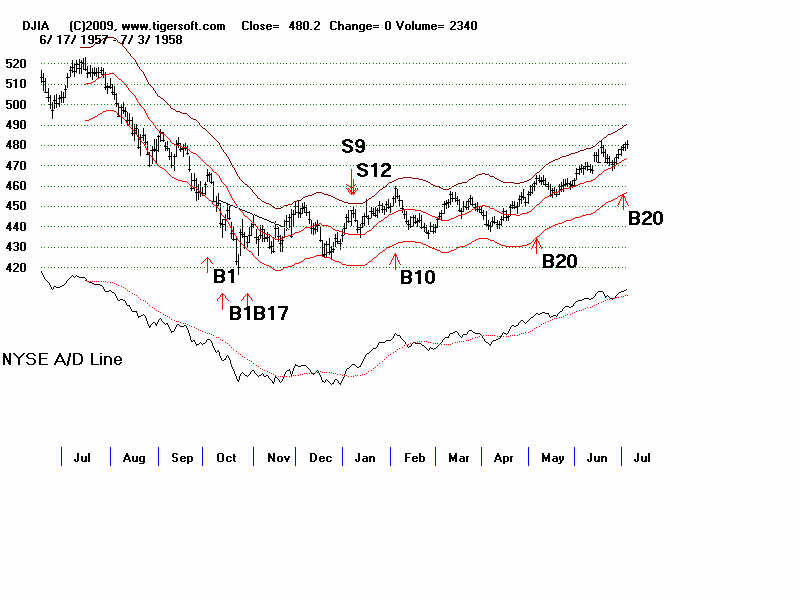
1957 Slanted Inverted HS
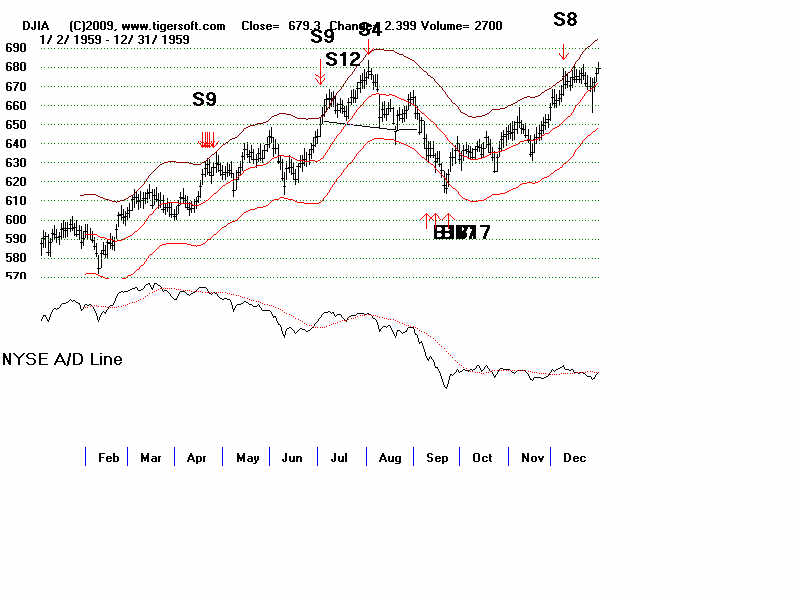
1959 Failed HS April HS June-Aug
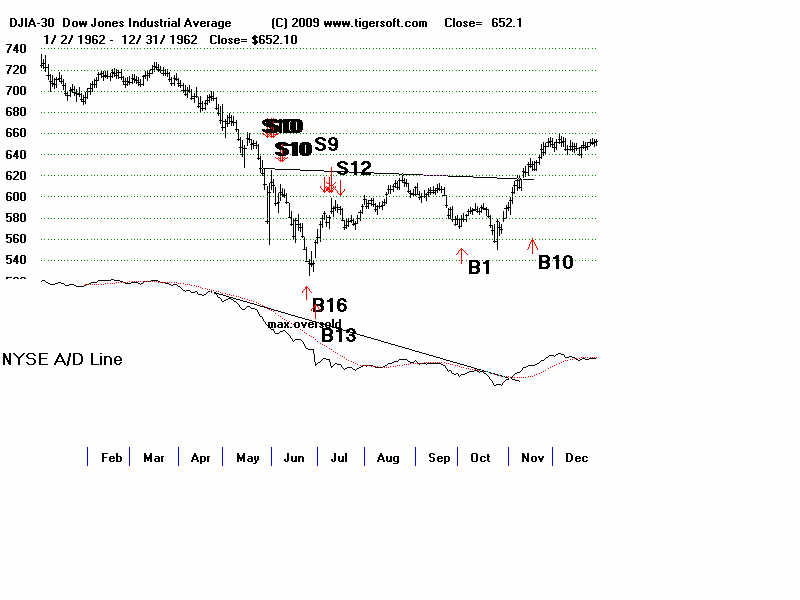
1962 Classic, massive HS - trading at top of range more than bottom (another HS distribution characteristic)
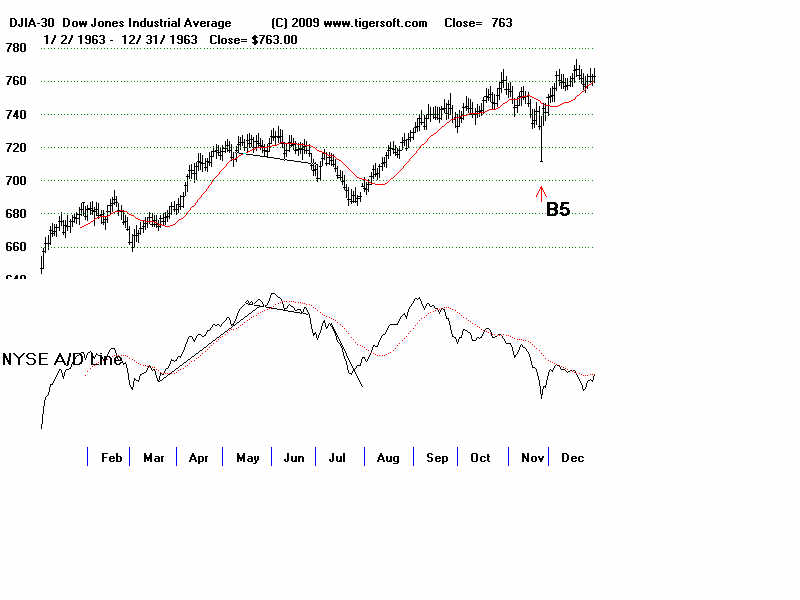
1963 HS - May-June 1963
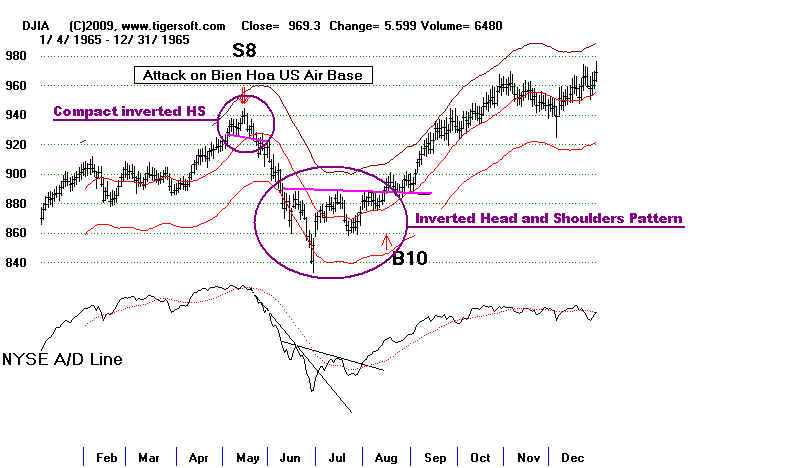
1965 Compact Head and shoulders followed by bullish Inverted Head and Shoulders
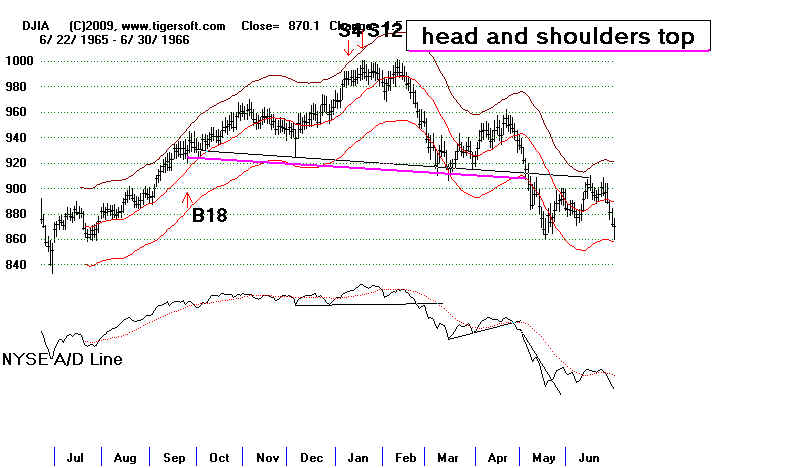
1965-1966 Market Top
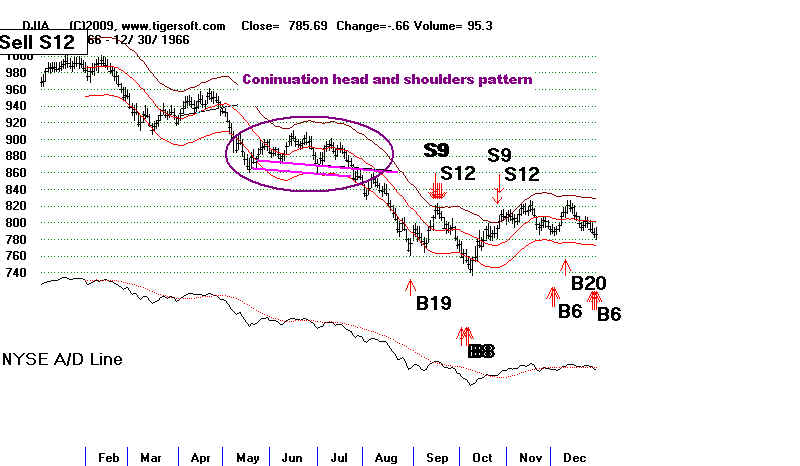
1966 Coninuation Head and Shoulders Pattern, May-July 1966
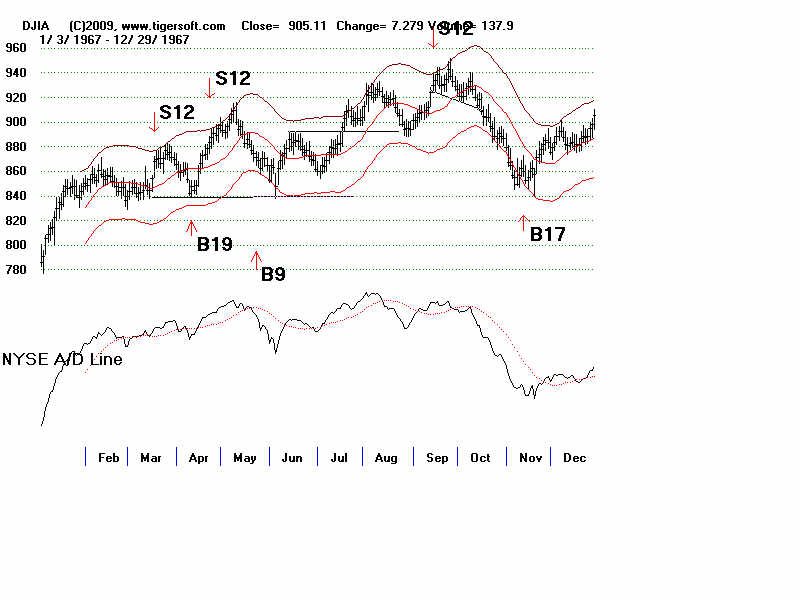
1967
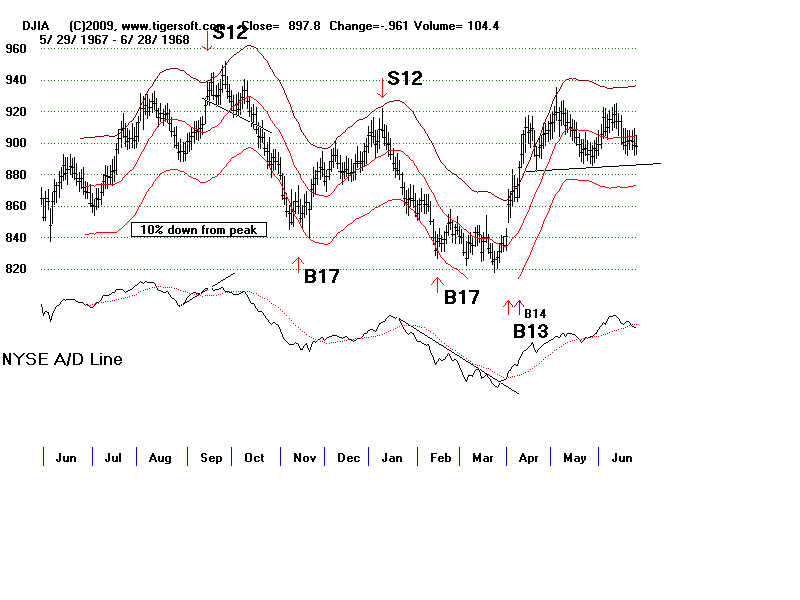
1967-1968
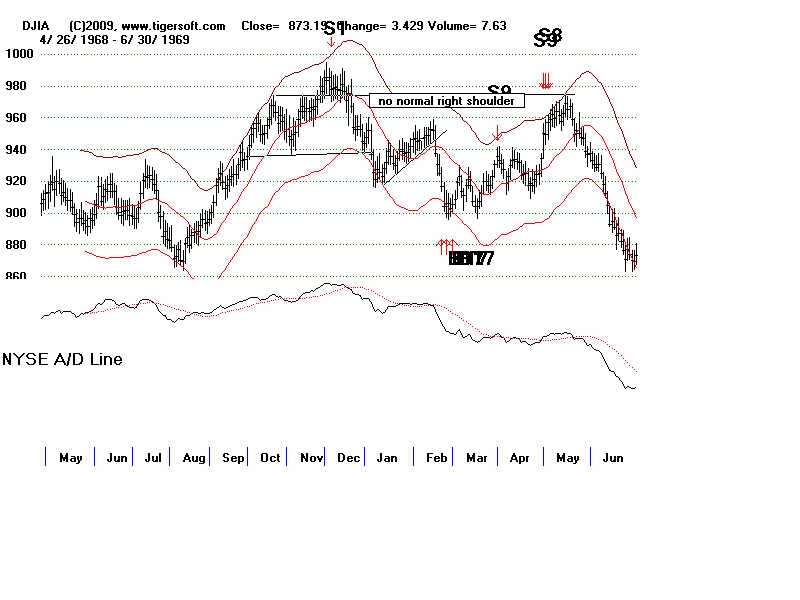
1968-1969
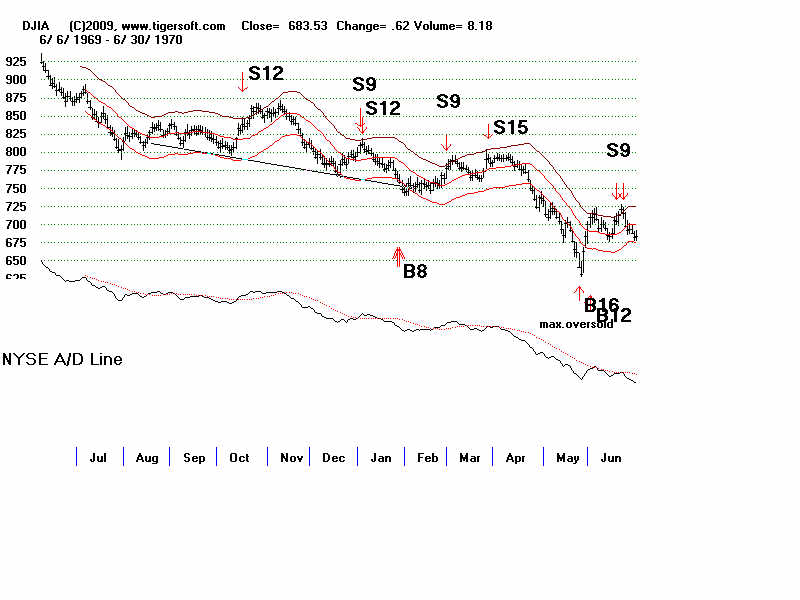
1969-1970
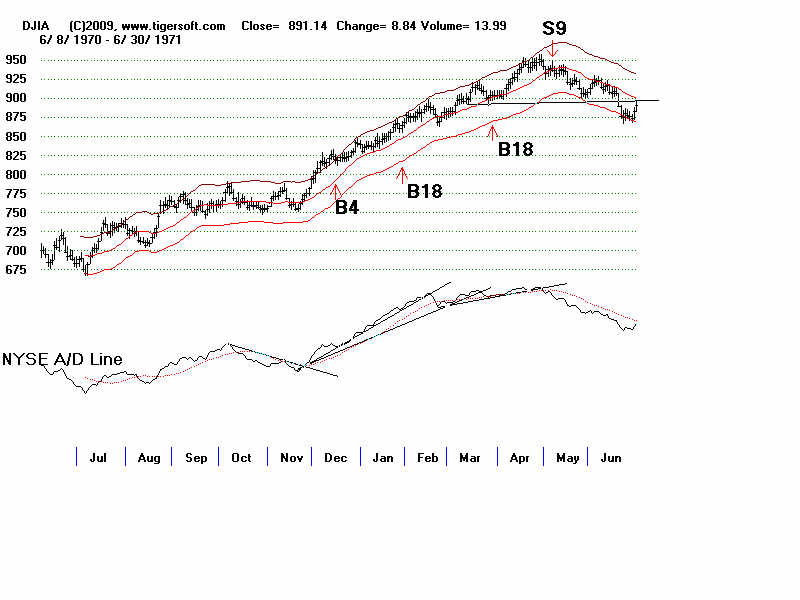
1970-1971
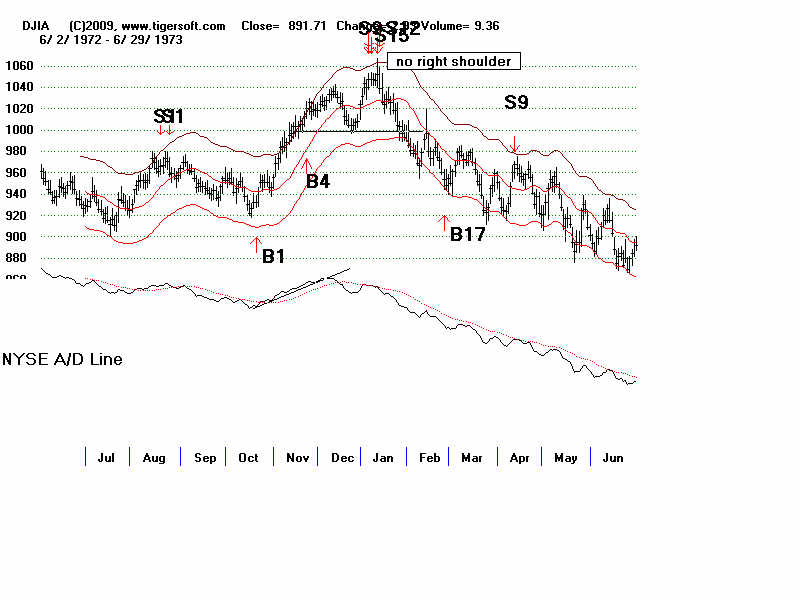
1972-1973
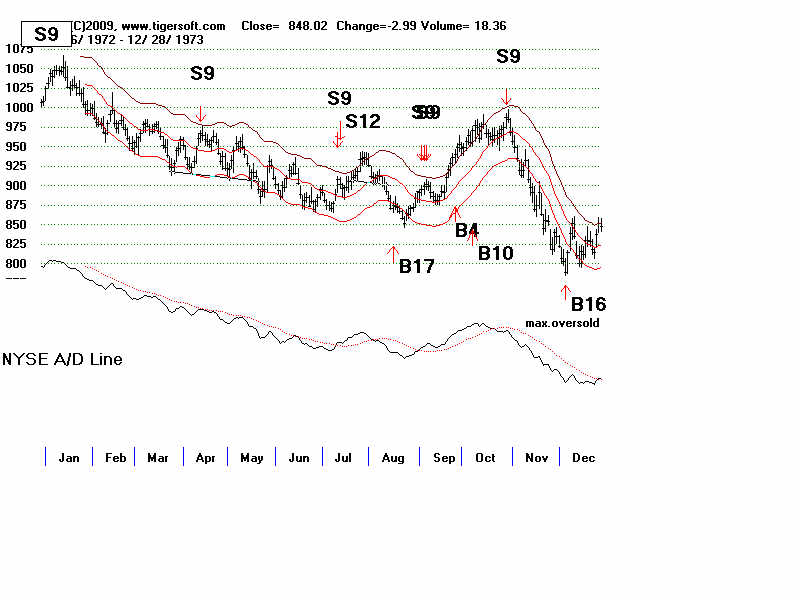
1973
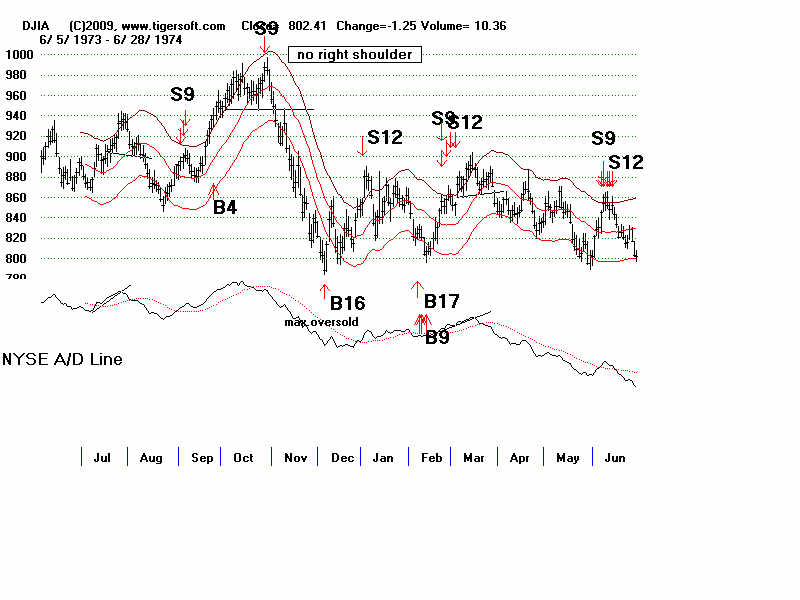
1973-1974
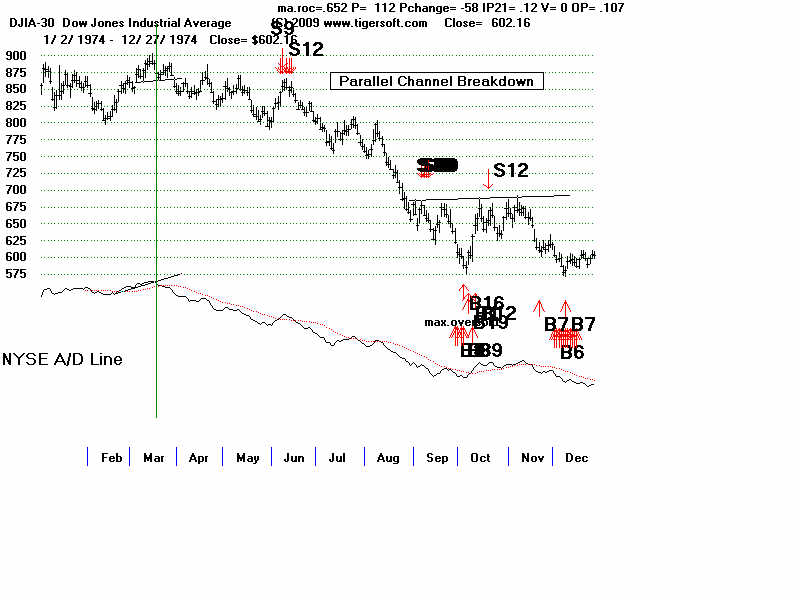
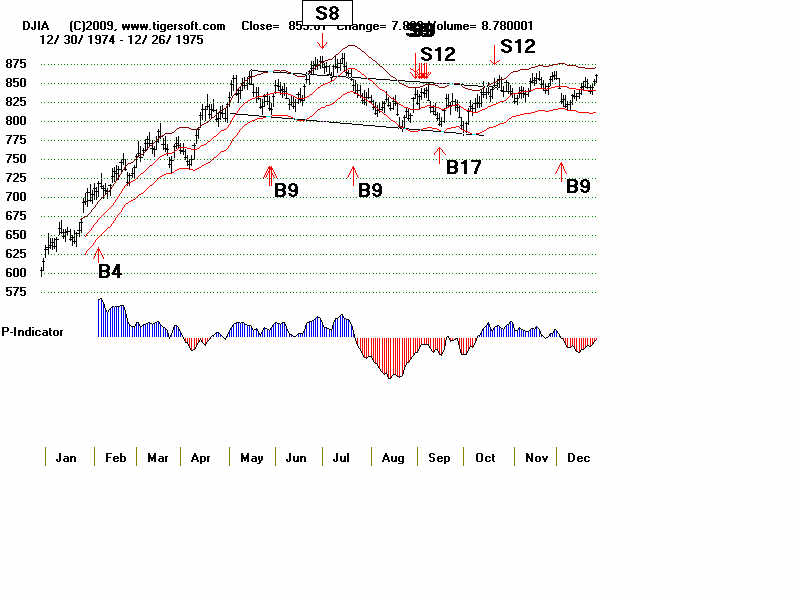
1974
1975
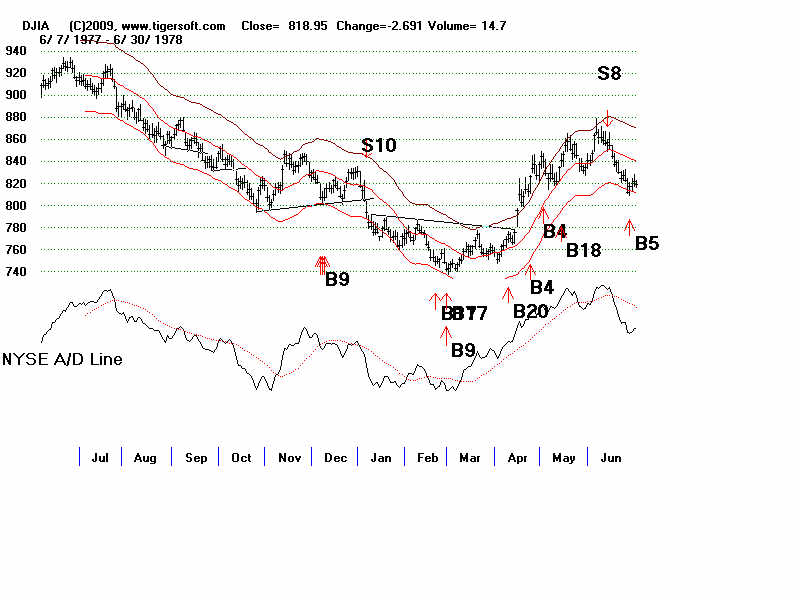
1977-1978
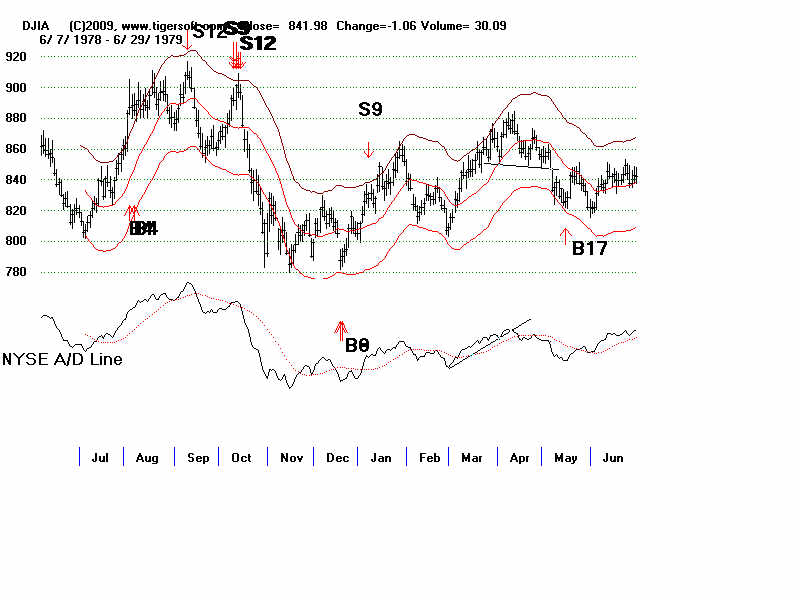
1978-1979
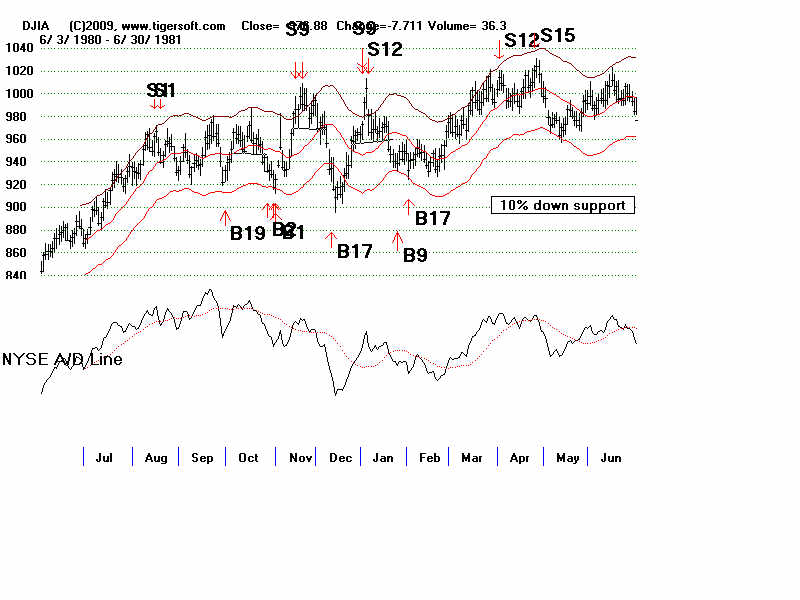
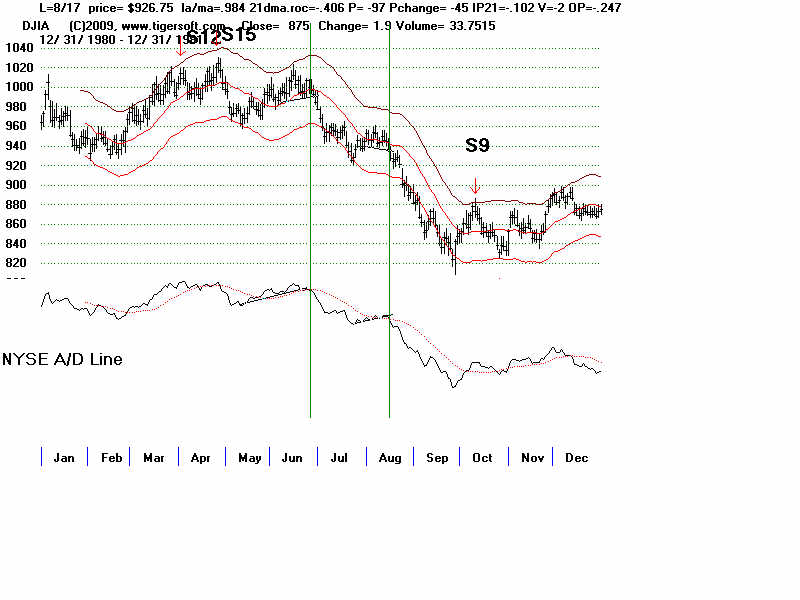
1980-1981
1981
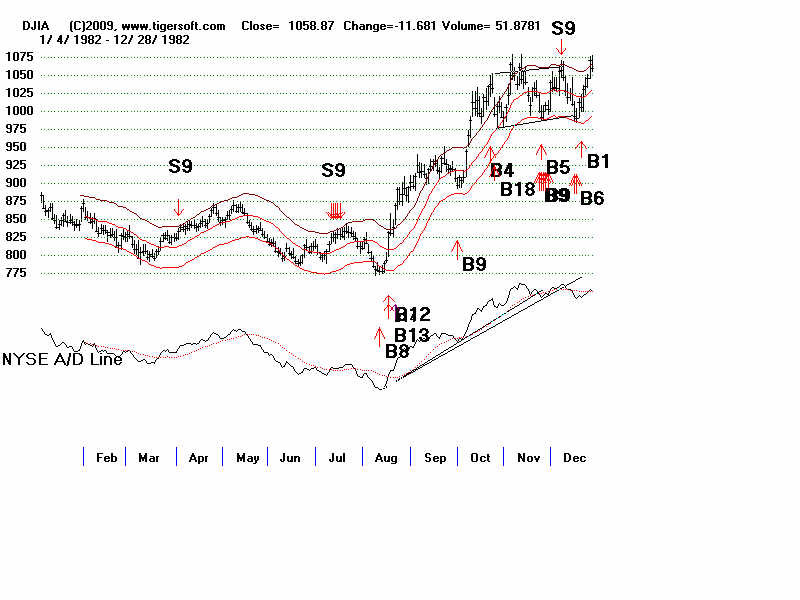
1982
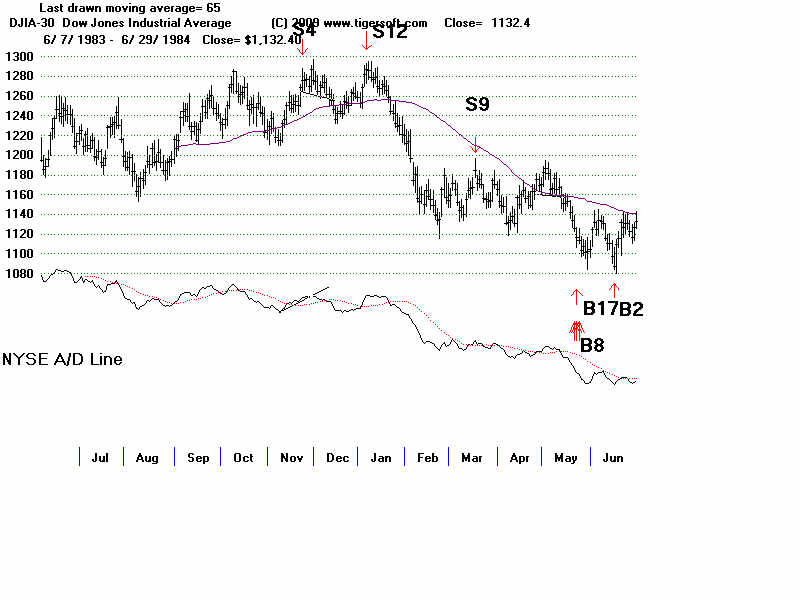
1983-1984
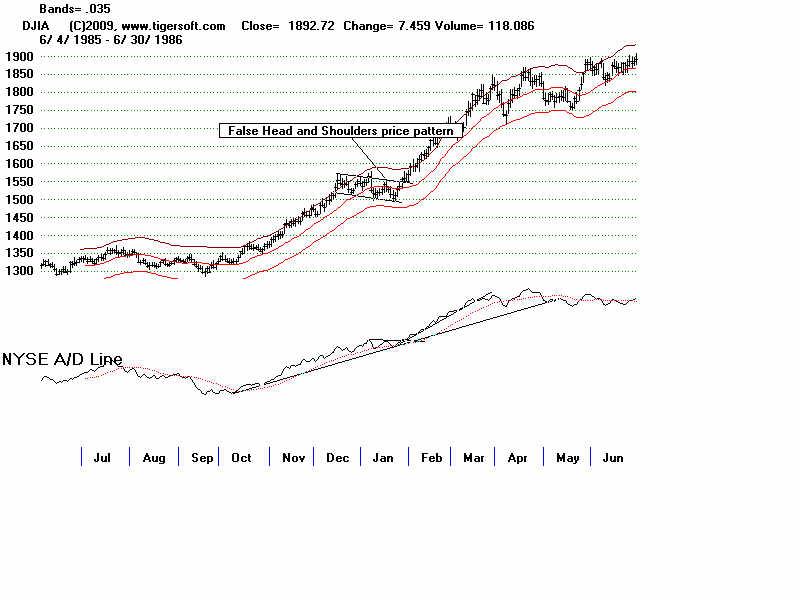
1985-1986
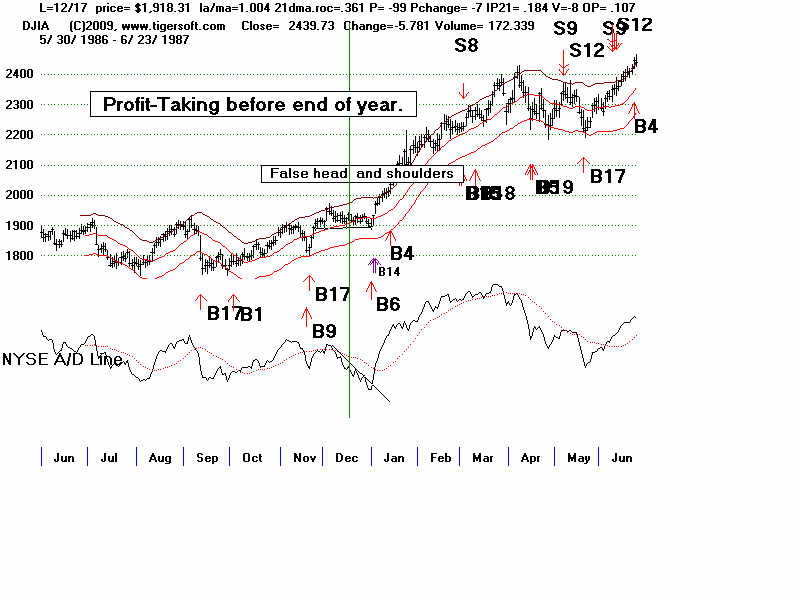
1986-1987
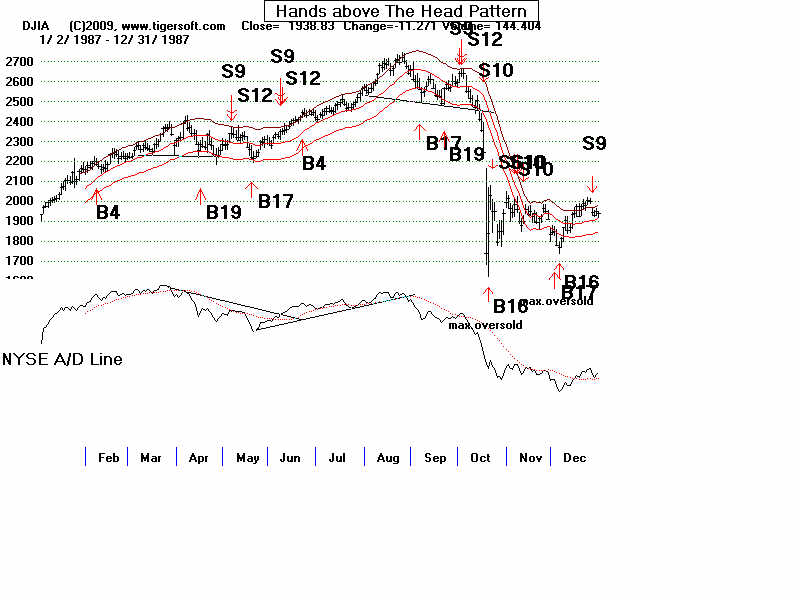
1987
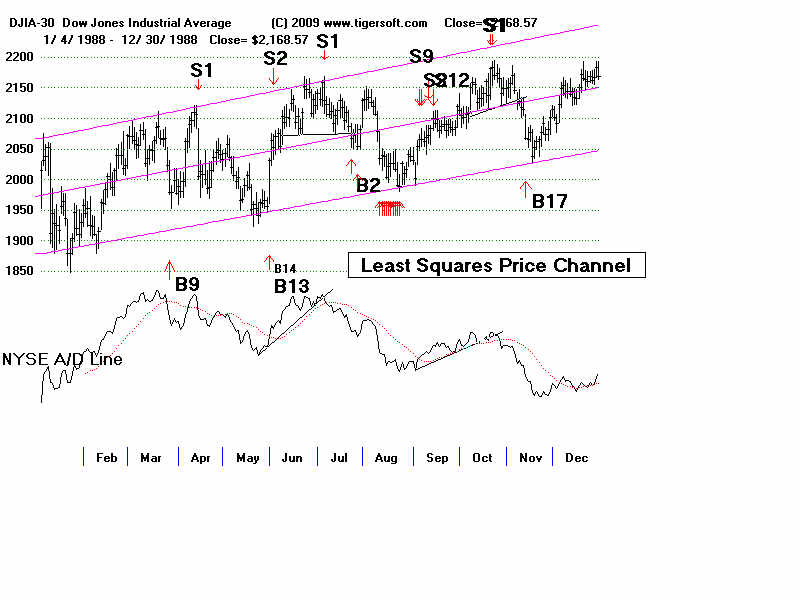
1988
1990
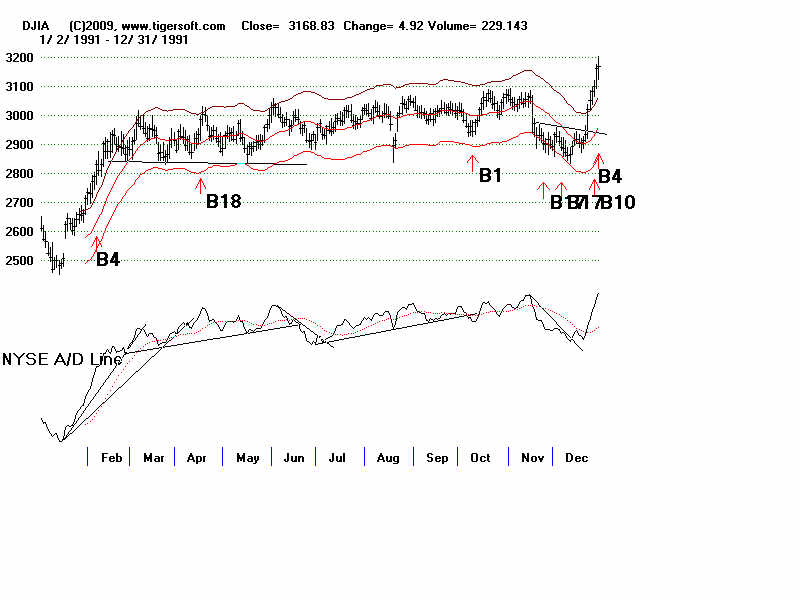
1990-1991
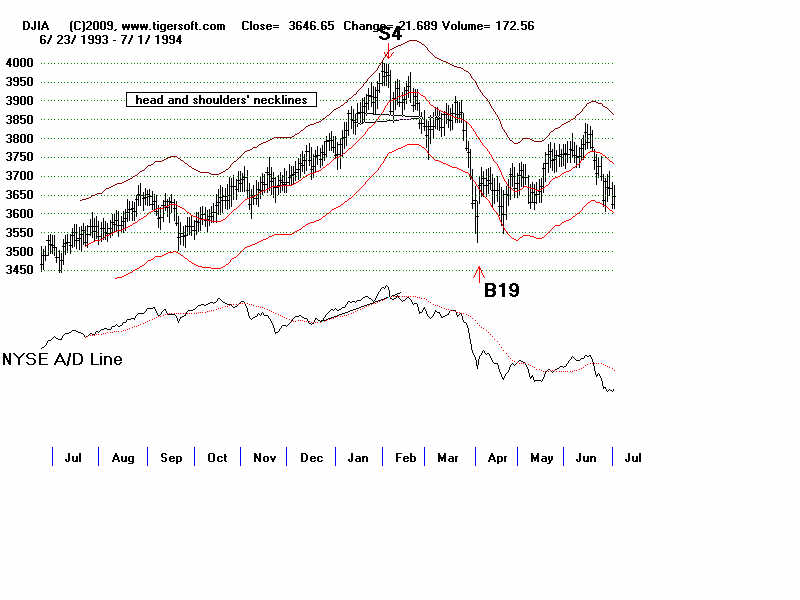
1993-1994
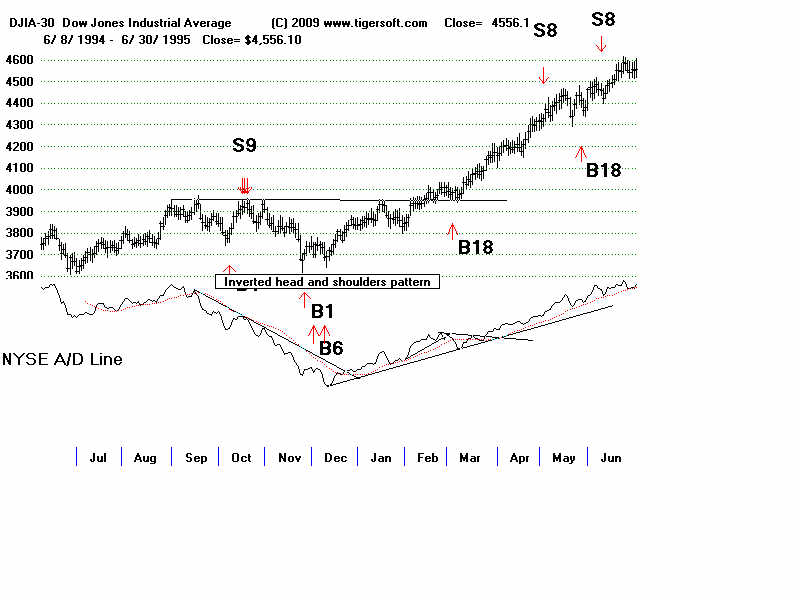
1994-1995
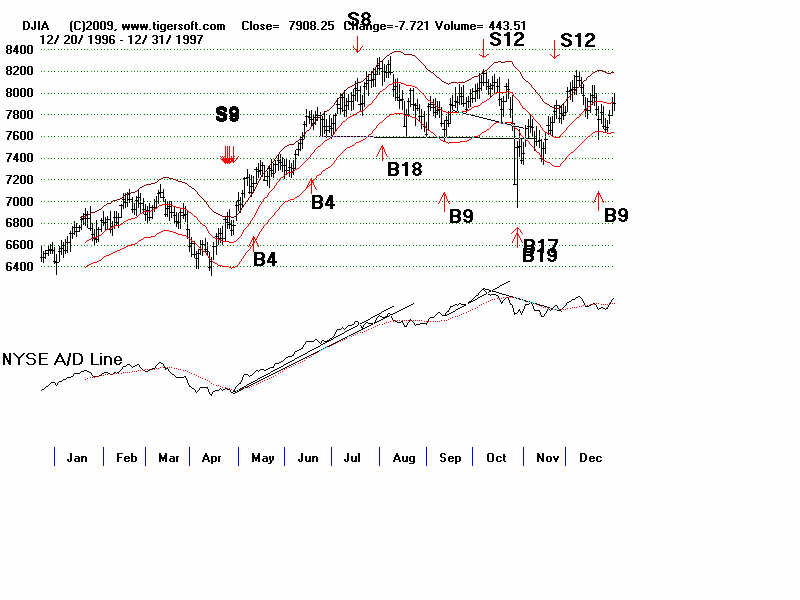
1997
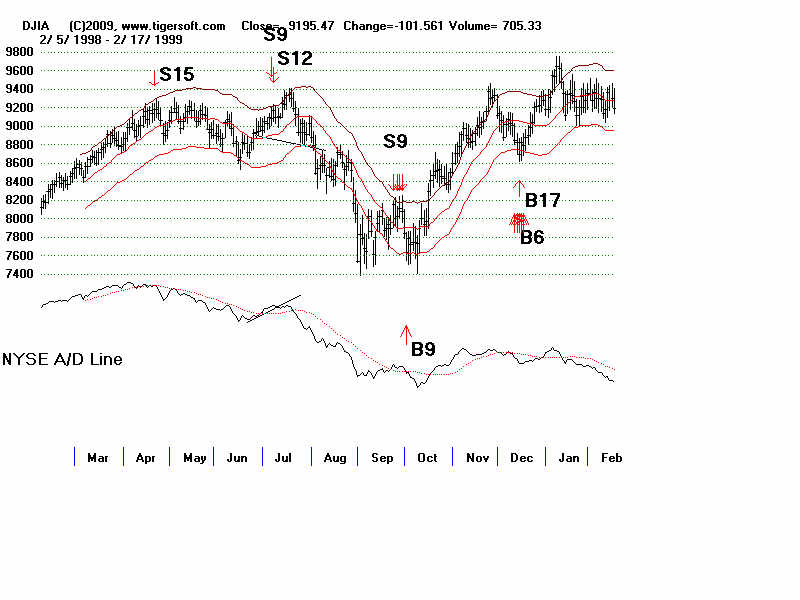
1998
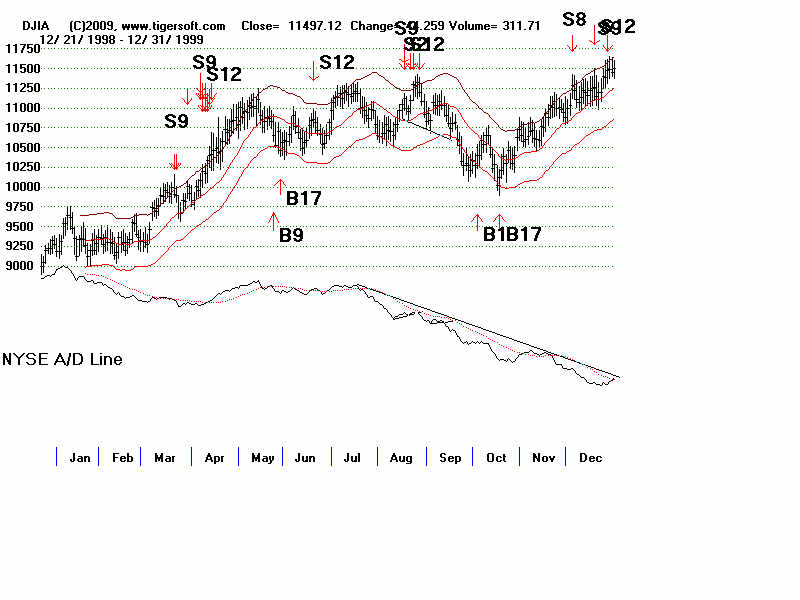
1999
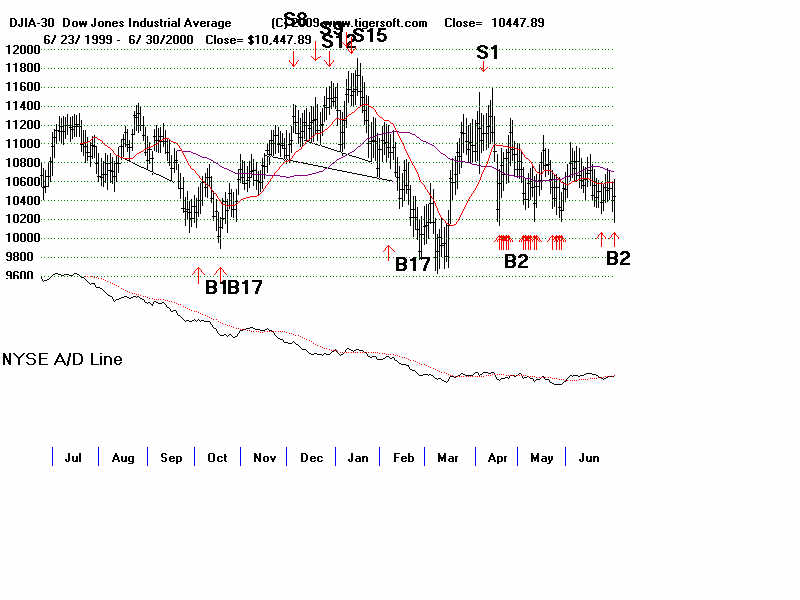
1999-2000
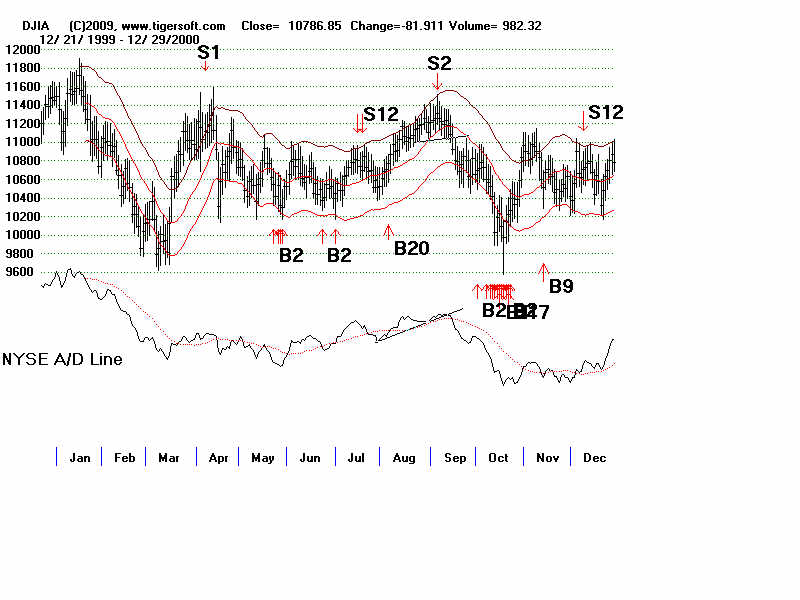
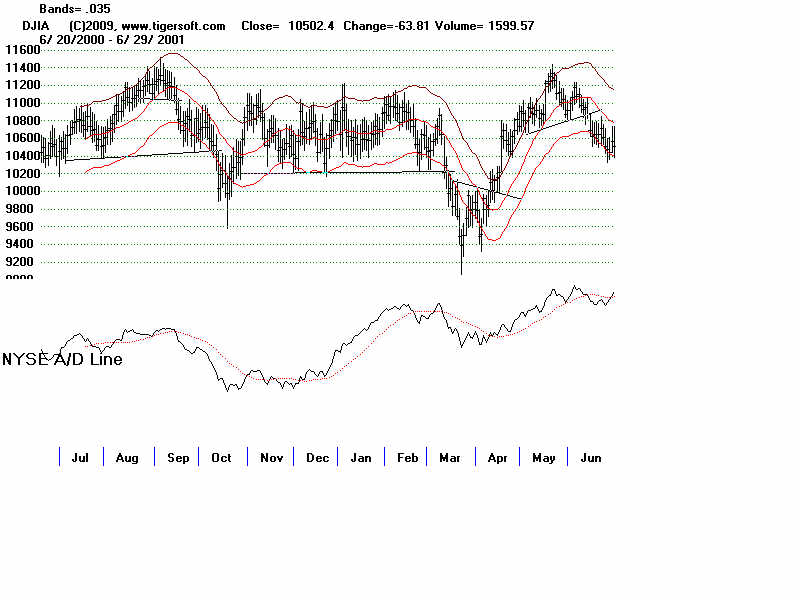
2000
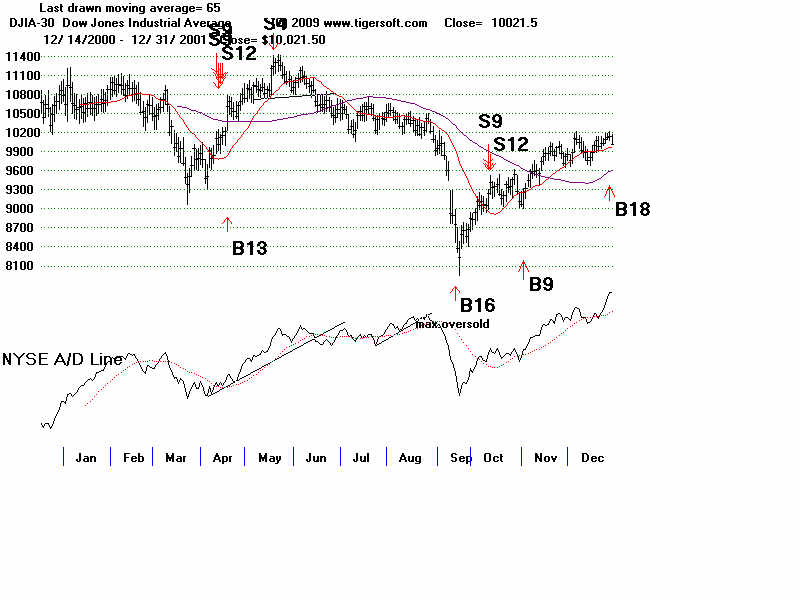
2000-2001
2001
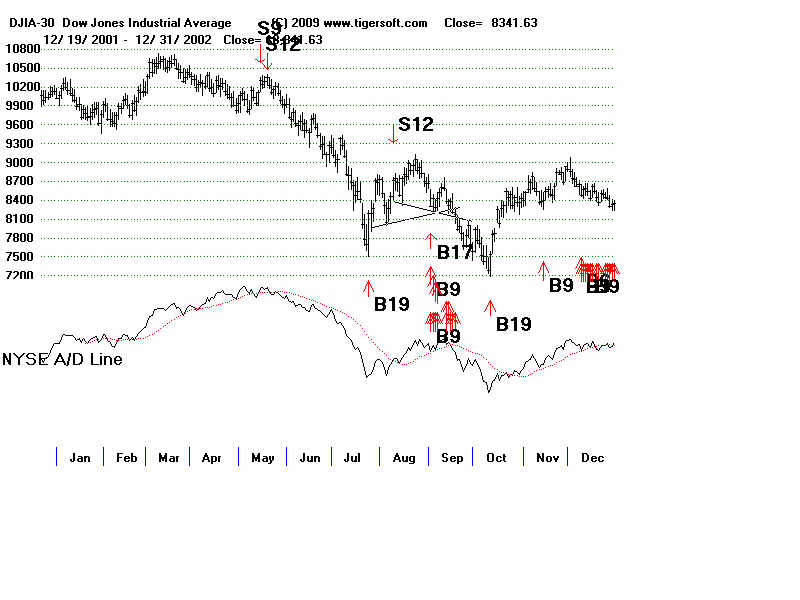
2002
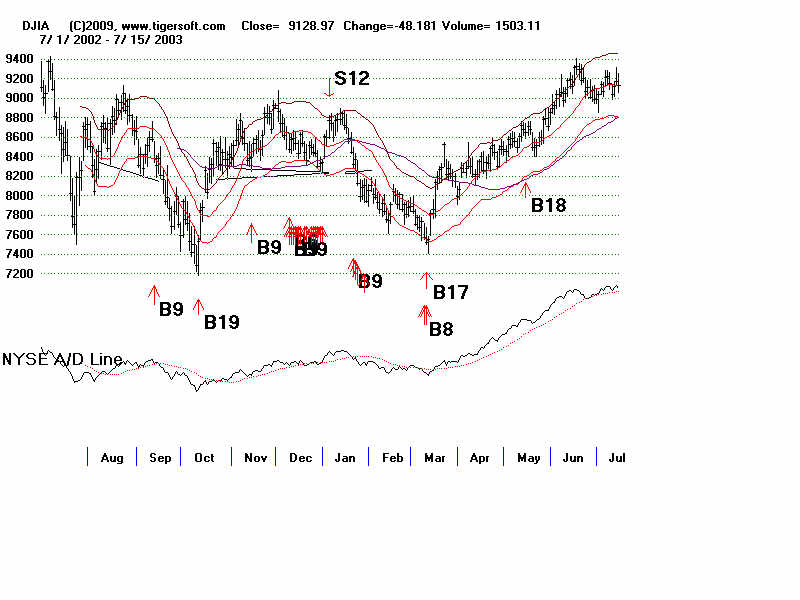
2002-2003
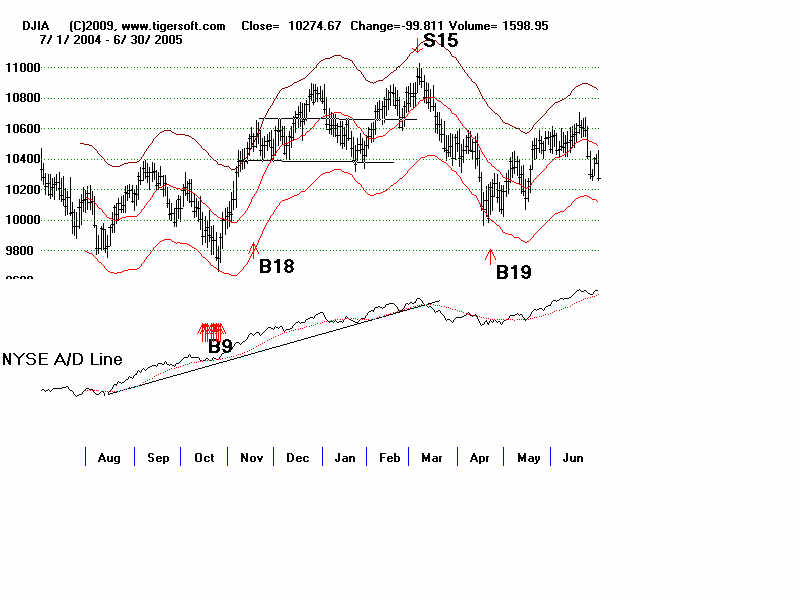
2004-2005
2007
2007-2008
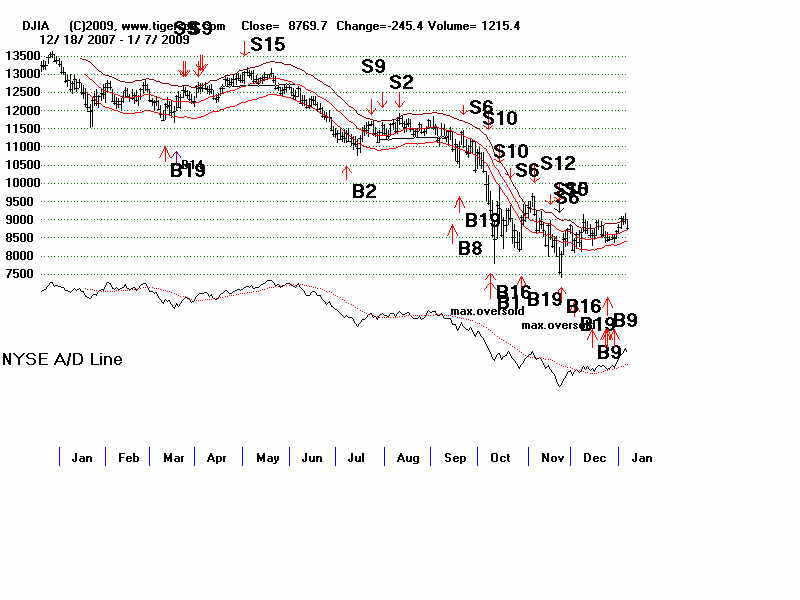
2008