WHEN TO SELL AN EXPLOSIVE SUPER STOCK
7/17/2009
(C) 2009 William Schmidt, Ph.D. www.tigersoft.com
Sample 2009 TigerSoft Chart.
Note that the right side of the charts are unavoidably cut off.

WHEN
TO SELL: The Case of DRYS
Let's review the most important set of conditions
that should cause you take profits,
and sell an "explosive super stock".
Take the case of DRYS. This is an extreme case.
The stock had risen from 30 to 130 in 7 months.
The first clue of a top was (red) high
volume "churning" as the stock rose
past 110. This should have made us suspicious
that the stock was being pushed up past 100 to
run in shorts, who were already down a
lot of money. TigerSoft's price bars turn red
when there is usual volume. Breakouts
often bring red price bars. Such red bars
are usually bullish. Bearish, on the other
hand, are red price bars not taking place on a
breakout but occurring after an extended
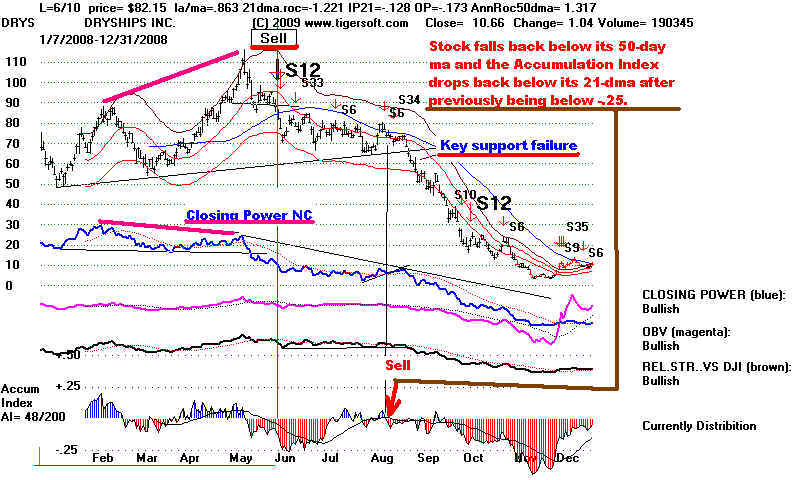
advance. The decisive event causing us to sell
is the breaking of the 50-day ma with
the Closing Power in a downtrend and below its 21-day
ma along with the Accumulation
Index no longer positive.
The chart above
shows that a complex distribution top pattern emerged over 100.
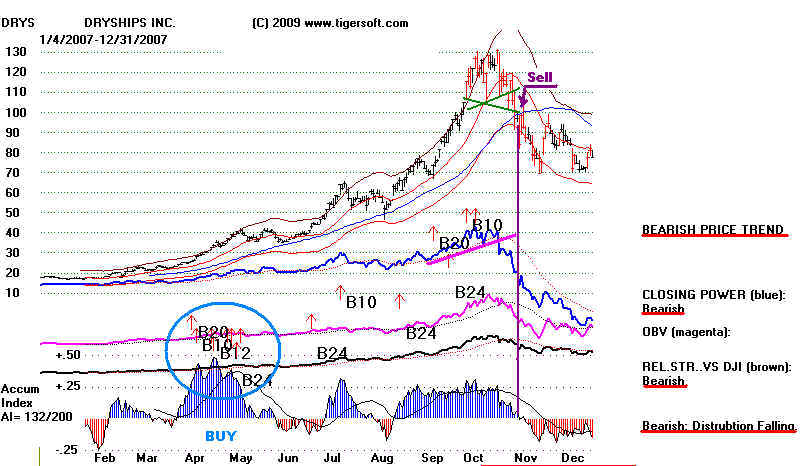
The criss-crossing necklines were soon violated. Very
significantly, the (blue) Closing
Power broke its uptrend. Realize that after a
long period when both Opening and
Closing Power are rising, as was true for much of 2007 with
DRYS, we can often see
the top quite clearly by watiching for the Closing Power to
break its uptrend. The public
(judging from the rising Opening Power) is still bullish.
But the professionals who had
been buying changed their minds. They shifted
to selling after the opening; they had
a lot of profits to take.
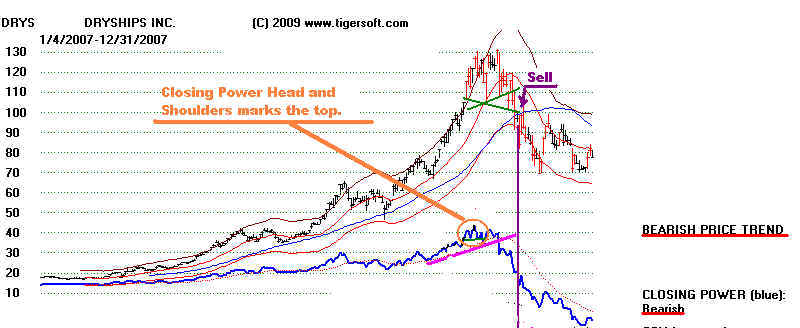
There were additional warnings that DRYS should be
sold. Below a small, but
bearish, head and shoulders top has been circled in
the stock's Closing Power.
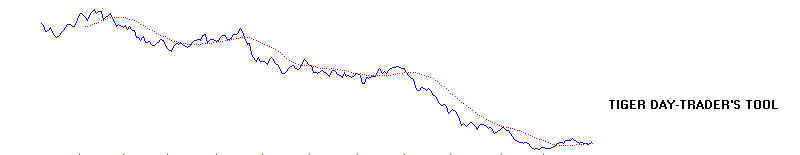
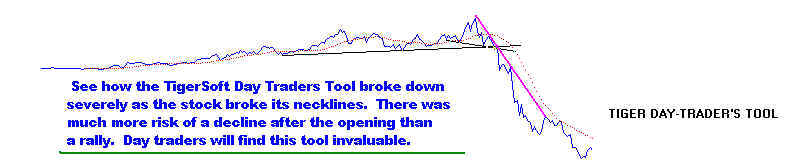
In addition, the TigerSoft Day Traders' Tool quickly
fell to new 12 month lows after
the stock broke its 50-day ma. This shows how
much more downside action there
was after the opening than upside trading. The
Day Traders' tool plots the cumulative
difference between the day's high minus the opening
with the day's opening minus
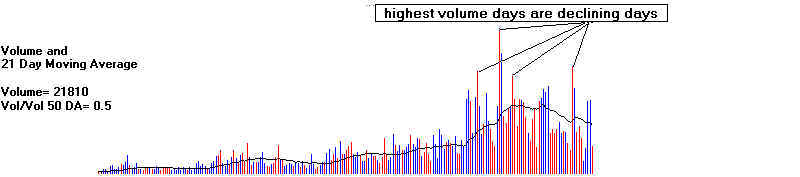
the low. And there were more bearish
signs. Volume was heaviest on down days as
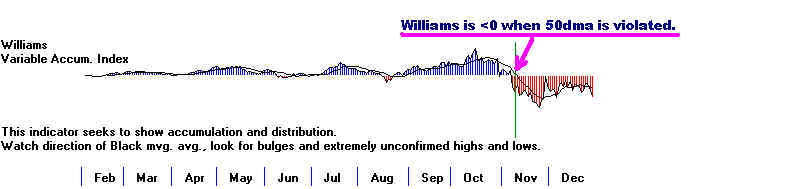
the top formation was made. The Williams
Oscillator was quite negative as the stock
violated its 50-day ma. Finally, consider how
far and fast the stock had risen in less
than a year. There was very little technical
support as prices started to fall.
The
temptation is enormous to buy back at lower prices a stock in which one has
made a lot of money. But look
at the warning signs a stock usually gives if it has
not safely bottomed. DRYS
illustrates this. Look at all the warning signs it gave
that the decline was not over.
By the end of the year the stock had fallen from 110
to below 10, losing more than 90%
of its value. Simply waiting for a confirmed move
over the 50-day ma would have saved
people here a lot of money.