Study of Unusual NASDAQ Strength Compared to DJIA
(C) 2009 www.tigersoft.com 6/21/2009

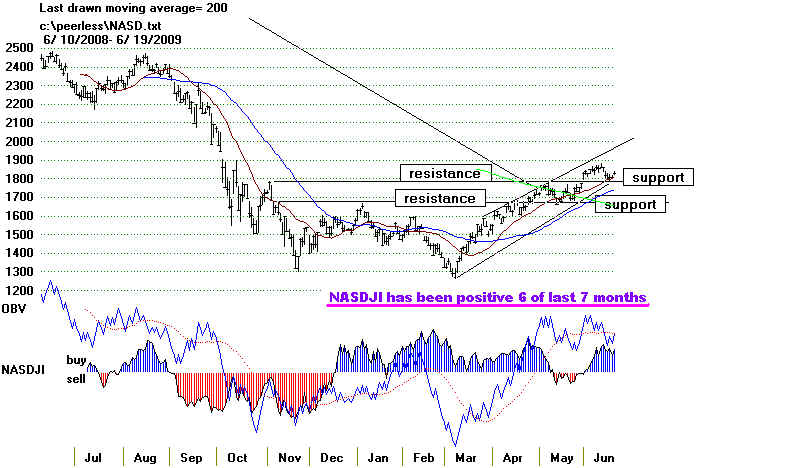
NASDAQ 2008-2009
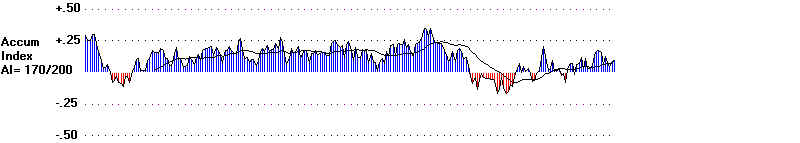
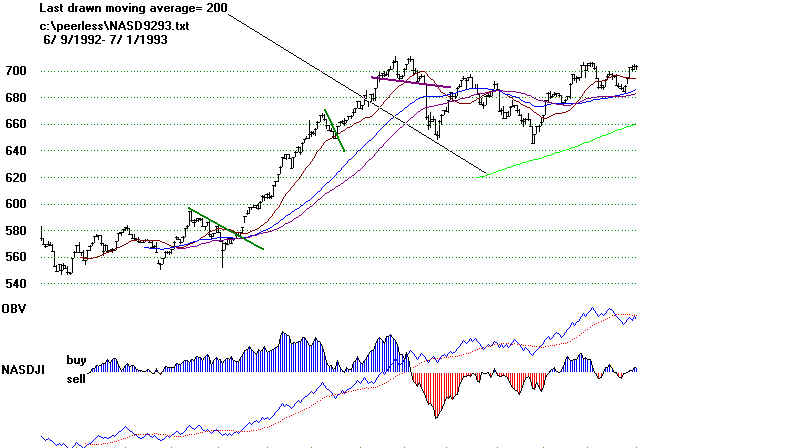
There are 3 previous cases where the NASDJI stayed positive 6 of 7 months: 1992-1993, 1999-2000
and 2003. as long as now.
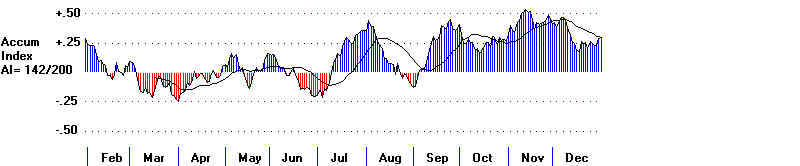
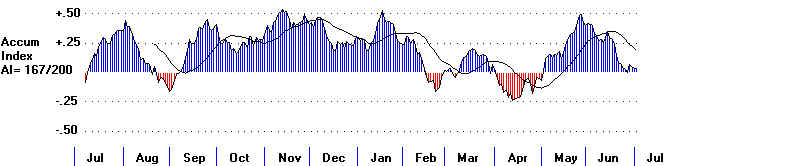
Tiger's "NASDJI" Indicator is a relative strength indicator that compares NASDAQ with DJI.
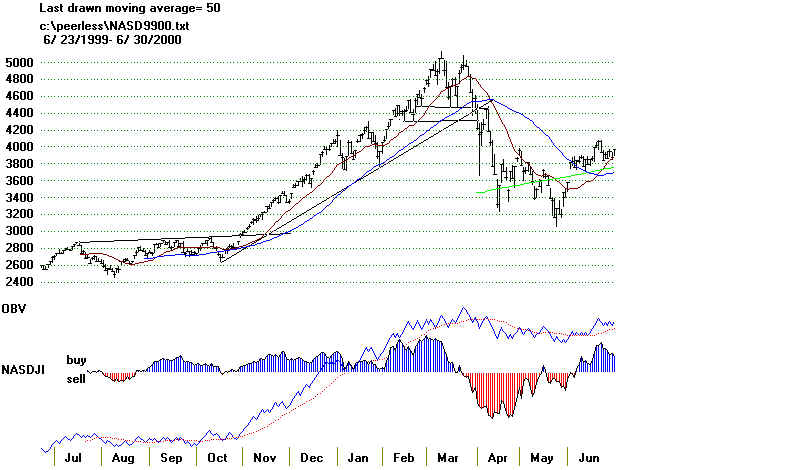
In runaway NASDAQ markets, like 1999-2000, there may be a premature Peerlesss Sell. 7 months'
positive NASDJI readings out of 8 months is the maximum in earlier cases. .
In 1968, secondary stocks went wild as now. This was before there was a NASDAQ.
The DJI lagged badly. The second break in the NYSE A/D uptrendline brought on a severe bear
market for all stocks. That bull market lasted 8 months. It had started when LBJ announced
he was not going to run again. The war in Viet Nam was very inflationary, as the wars in Iraq
and Afghanistan are now. The FED held back raising interest rates. When investors sense
inflation is not going to be checked by the FED and interest rates remain low, secondary stocks
get a special play, I would say. That is true now. But the secondary stocks' run upwards, in
the four past cases only lasted 8 months. That puts a 6 weeks' more limit on what we can expect
for a strong NASDAQ. hotmail.com
Year
Number of
Months NASDJI Positive Top of NASDAQ Rally Recognized by
-----
-------------------------------------
----------------------------
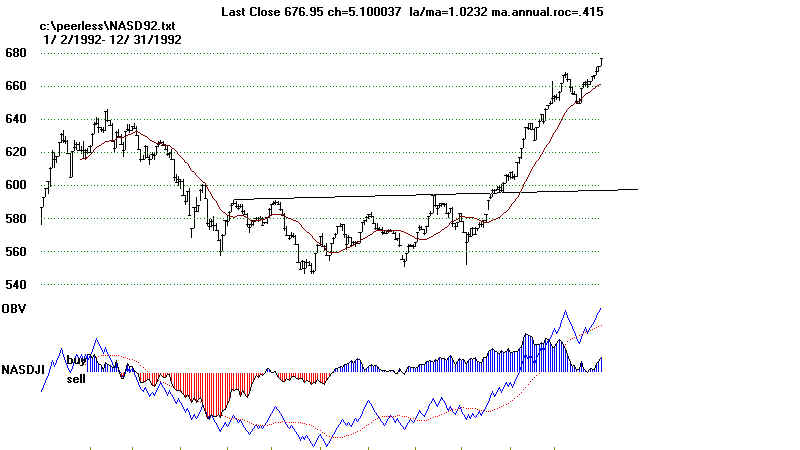
1992-1993
7
Double
Top and Support Failure.
Second
violation of 21-dma
Peerless
S15 on 5/20/1993
1999-2000
7
Double
Top and Support Failure
Hands
above the Head Pattern (shows over-speculation)
Premature
Peerless Sell S12 on 1/16/2000
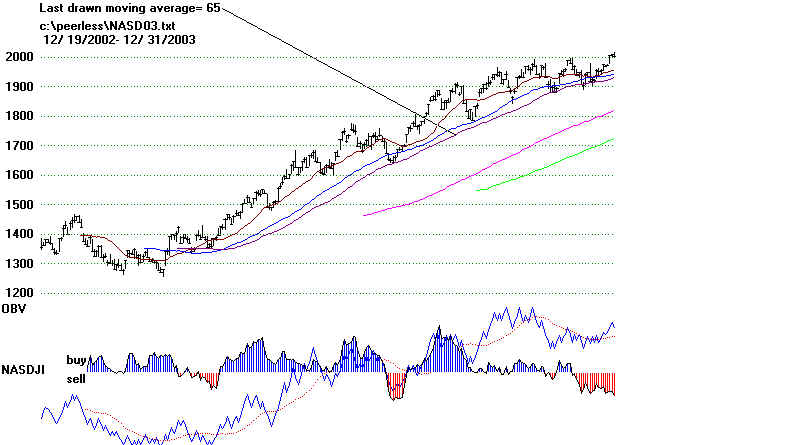
2003-2004
7
NASDAQ
starts to under-perform
Peerless
S15 - 2/11/2004
Peerless
S9 -2/20/2004
2008-2009
6.5
=======================================================
NASDAQ - 1999-2000