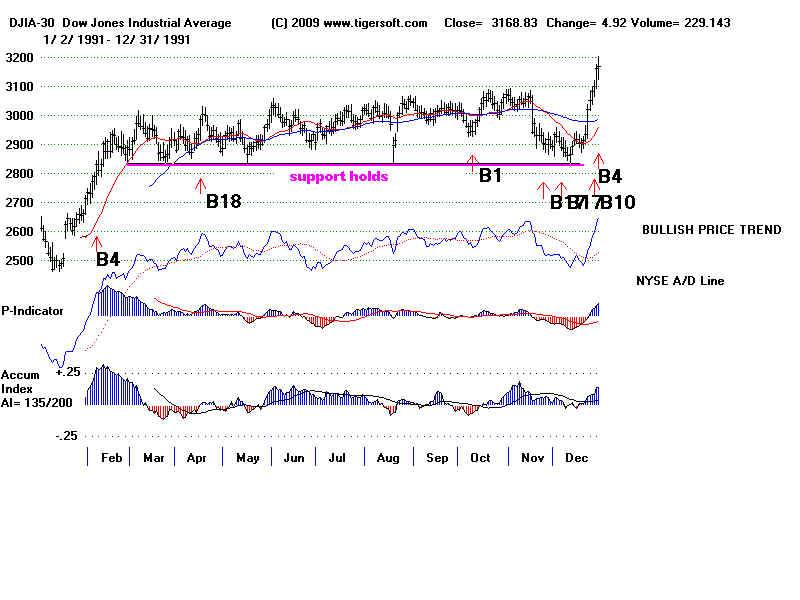
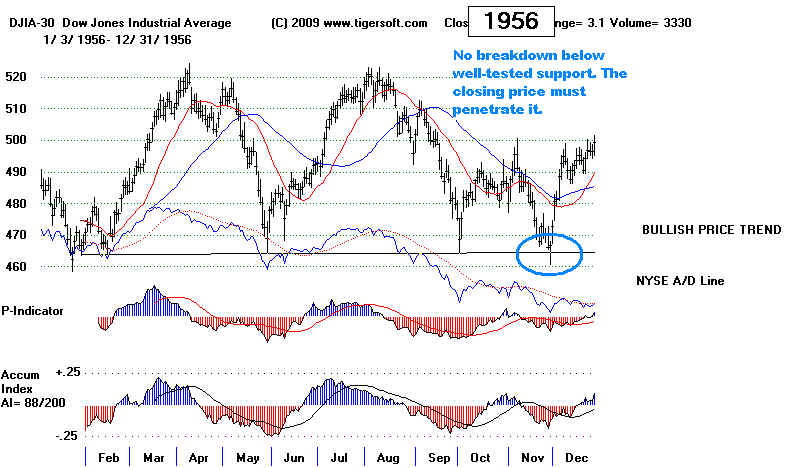
BELOW WELL-TESTED HORIZONTAL SUPPORT.
(C) 2009 William Schmidt, Ph.D.
www.tigersoft.com
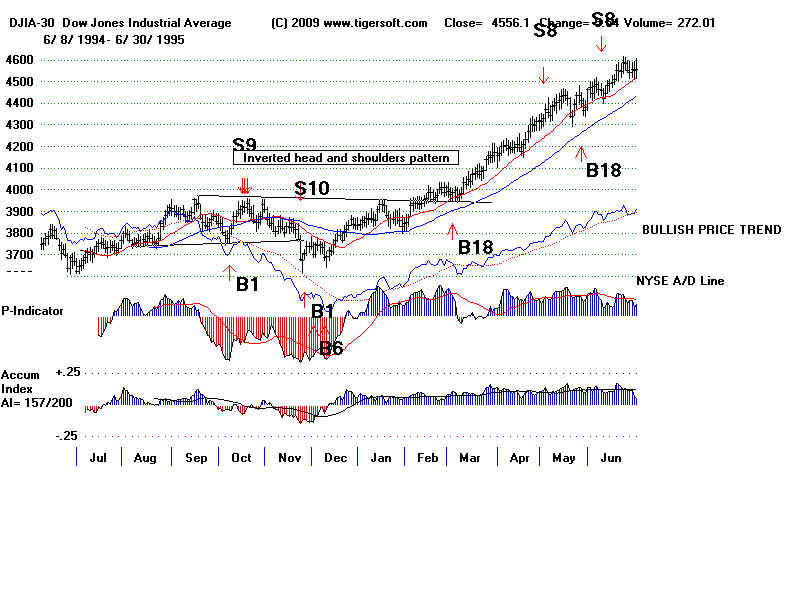
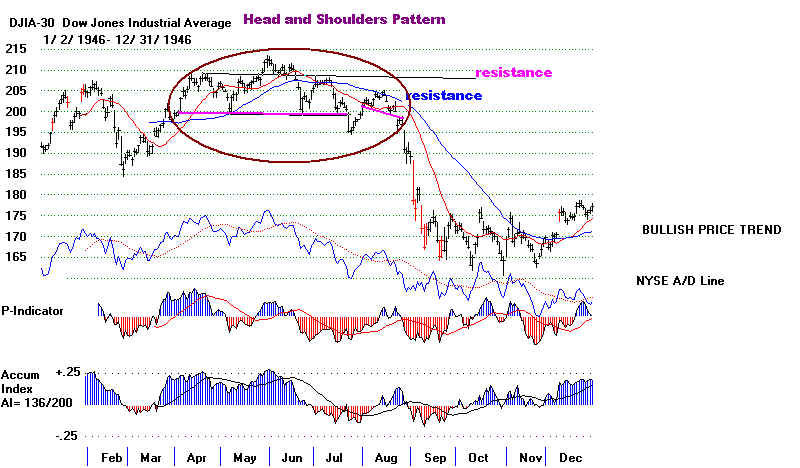
First - recognize normal and aborted head and shoulders patterns.
Prices keep falling in normal head and shoulders patterns.
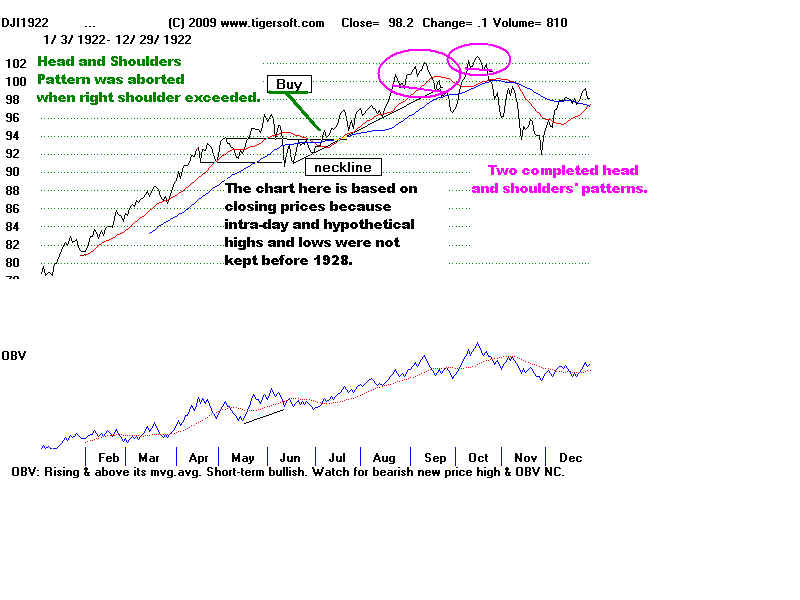
Well-Tested Support means the Support is at a line drawn through three or more
previous hypothetical lows. If there is a head and shoulders pattern, one of the points
can be a closing price.
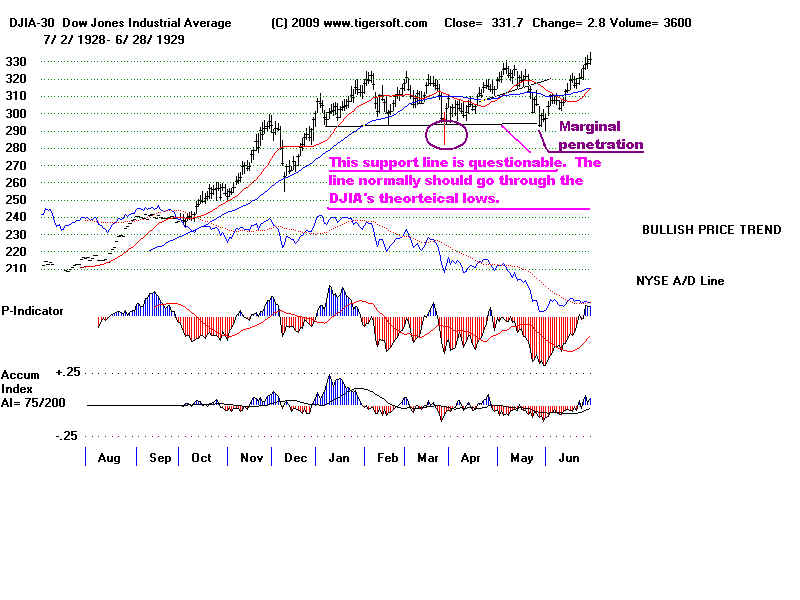
The head and shoulders top in 1929 consisted of a neckline through two hypothetical
lows and a reversing low closing price, See how the second rally failed to surpass
the highest point of the apex of the earlier right shoulder.
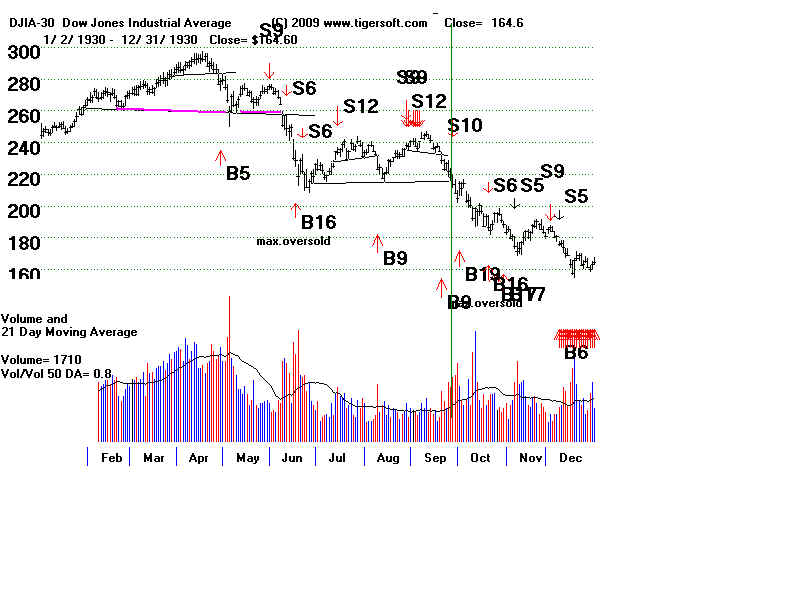
In March 1930 the DJI made what seemed to be a false breakdown below a head and
shoulders pattern's neckline. It then rallied but could not surpass on a closing basis the
apex of the right shoulder by a clear margin. That was a rally failure. The next breakdown
of the neckline brought a severe decline.
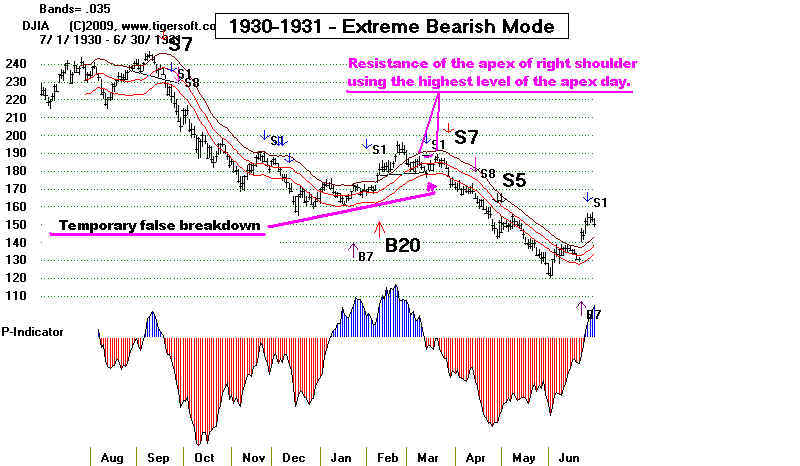
Reversals back upwards above the neckline are much more likely after a decline
which takes place with steadily positive readings from the P-Indicator.
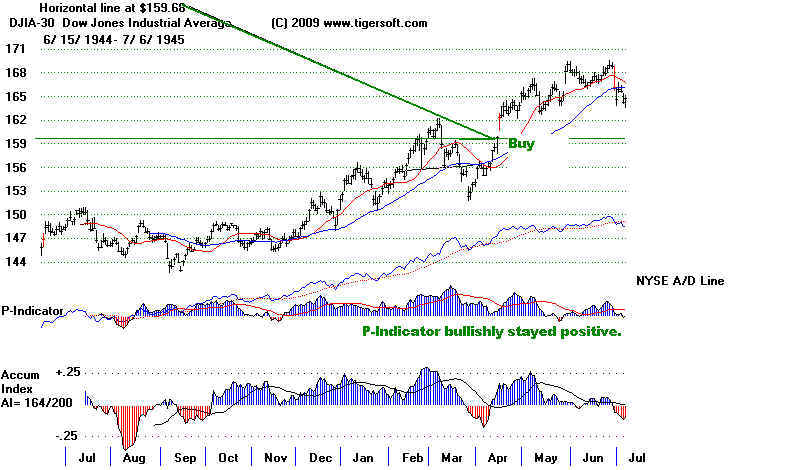
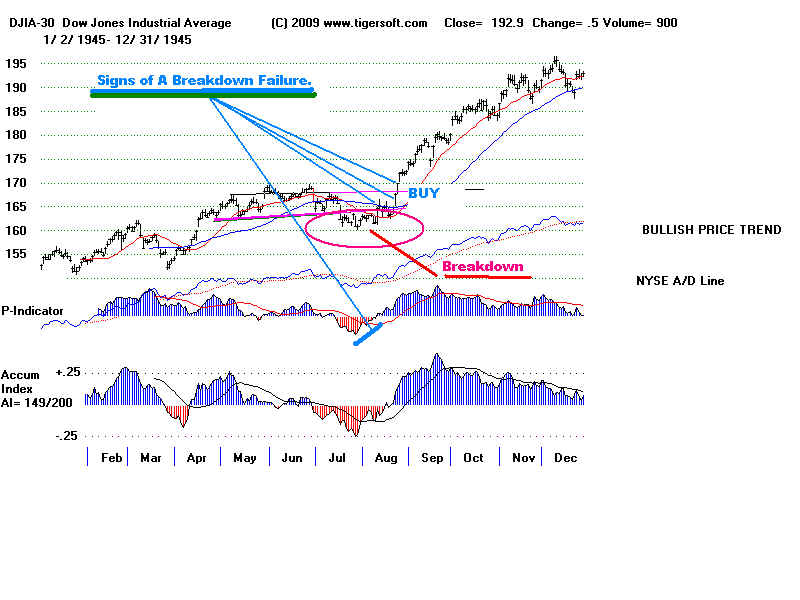
The chart for 1945 shows 4 signs to look for to spot a false breakdown:
1) Improving internals while the DJI is still below the neckline
2) DJI rises back above the neckline.
3) DJI rises back above the 50-day ma
4) DJI closes above the apex of the right shoulder.
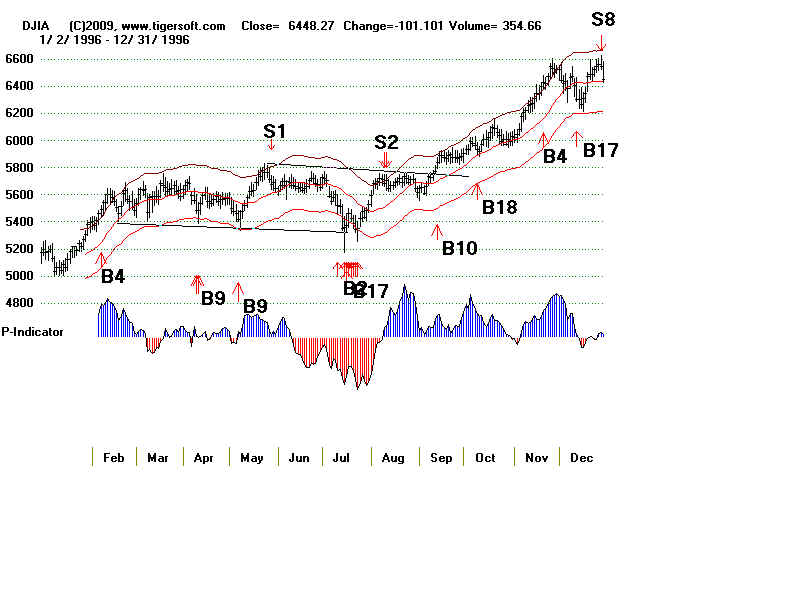
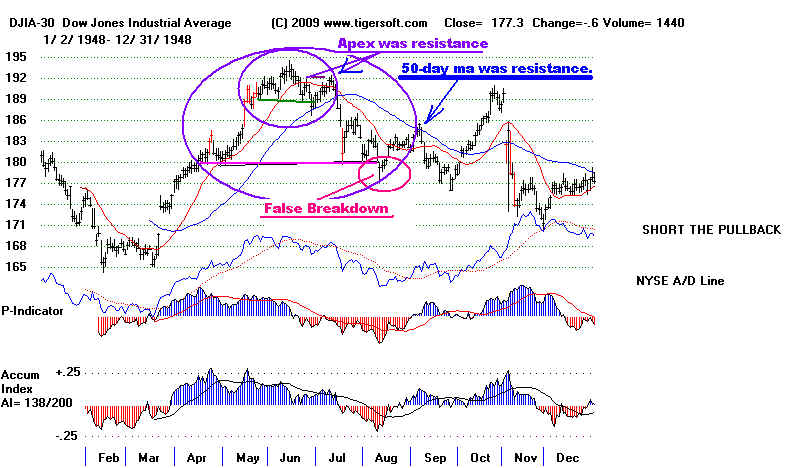
but then rallied back above the neckline. The rally bearishly stalled out
at the declining 50-day ma A sharp sell-off soon followed.
In September resistance at the falling 50-dma stopped the rally after a false breakdown.
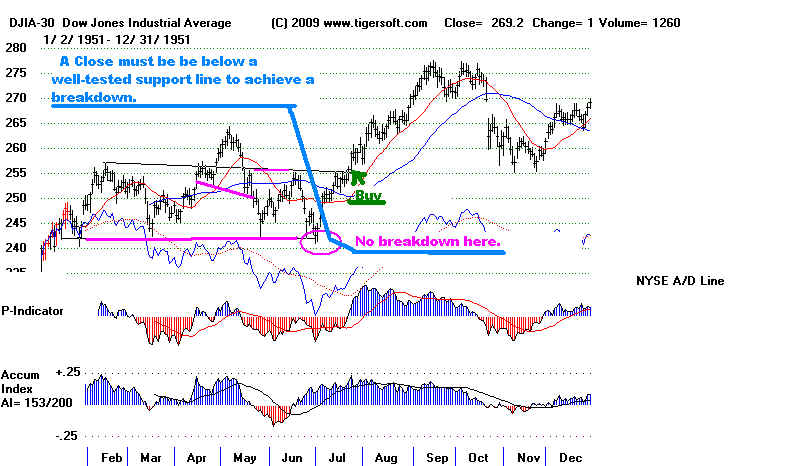
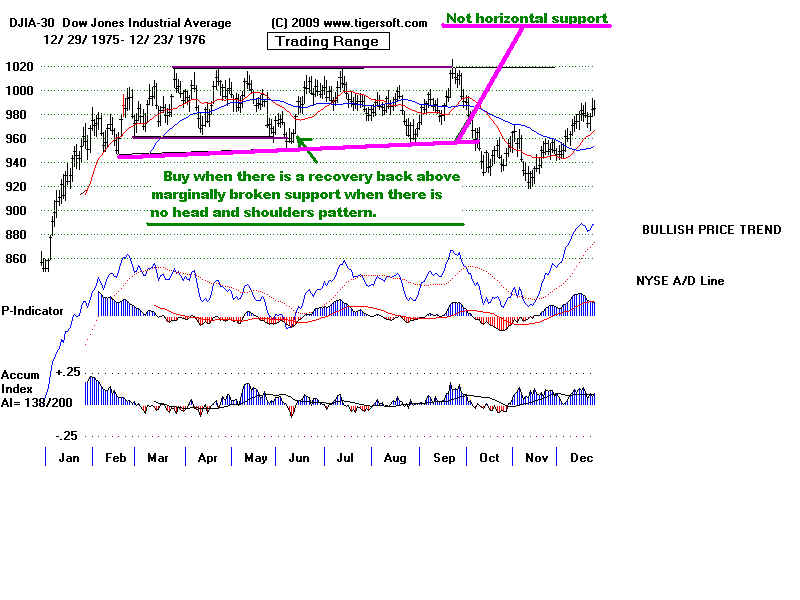
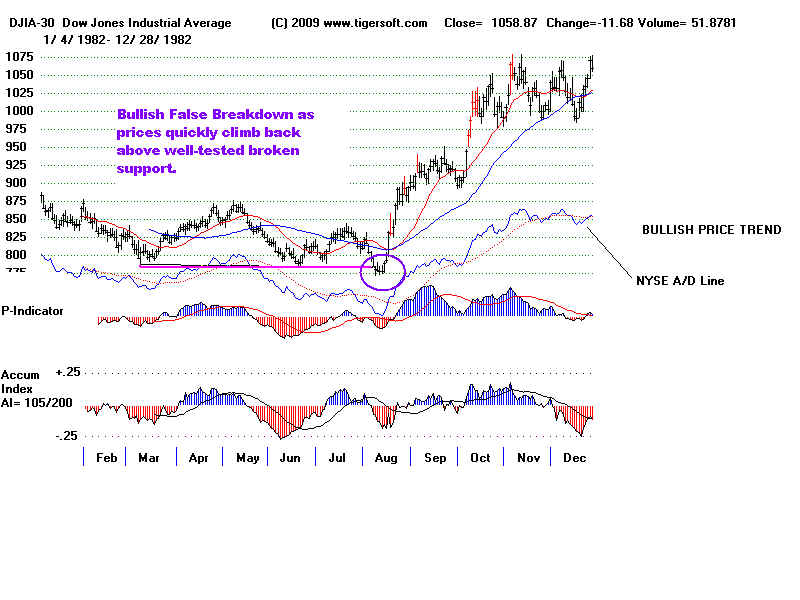
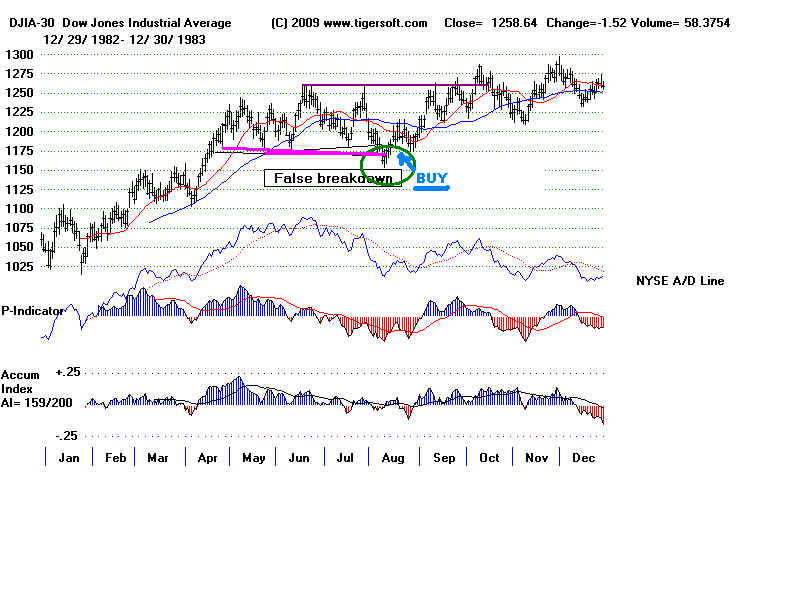
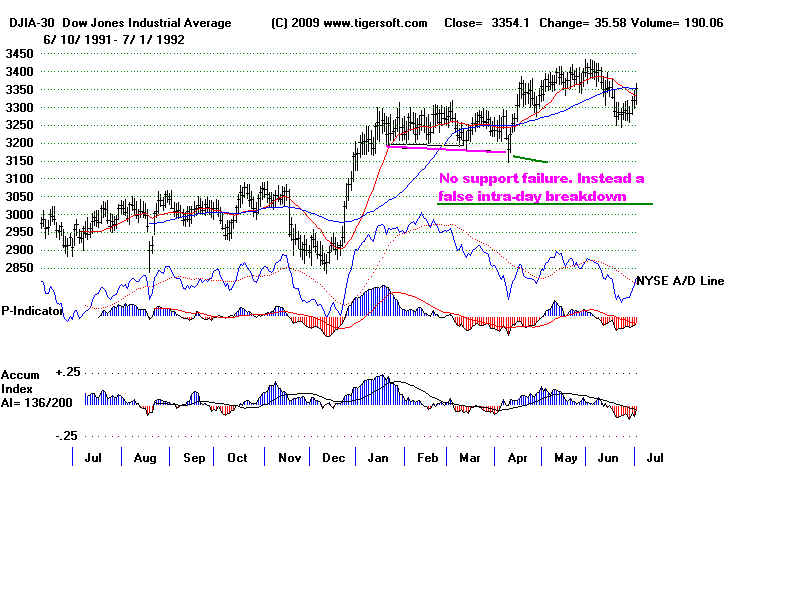
Buy when horizonyal support violation fails and prices quickly turn back
above the wel-tested support. Diagonal support lines can't be so reliably used.