
TigerSoft News Service 6/5/2008 www.tigersoft.com
PEERLESS WAS VERY PROFITABLE IN 2008-2009
FOR ALL TRADING VEHICLES:
STOCKS, ETFS, MUTUAL FUNDS - ANYWHERE!
PEERLESS STOCK MARKET TIMING'S
AUTOMATIC BUYS AND SELLS
Here we apply the Peerless Buys and Sells to
hundreds of Exchange Traded Funds, Fidelity Funds and a
sample of important stocks. Peerless works superbly in almost
all these areas because Peerless calls the tops and bottoms
of the DJIA consistently well and because the gravitational
pull of the DJI-30 is so great for all trading vehicles. Buying
and holding is very expensive. By comparion, Peerless is
very cheap. You will especially want to use Peerless for
Brazil, Russian, Mexican, brokerage and gold stocks, as well
as for the general market ETFs for the DJIA, SP-500, NASDAQ
and Russell-2000.
Trading Results:
Superimposing Peerless Signals on
Different Investments. Trading Gains, Buying, Selling
(and Selling Short) at Next Day's Opening and
Allowing $40/Trade for Commissions
and Starting with $10,000.
Translate percentages into Dollars. A 20% Gain
Using Peerless versus a 20% Decline Buying and Holding
Starting with $100,000 is a +$40,000 Difference using
Peerless would have meant to you.
/
1. GENERAL MARKET ETFs - DIA, SPY, QQQQ, IWM
2. FOREIGN ETFs - Examples - UK, Brazil, Mexico, Russia
3. 42 FIDELITY SECTOR FUNDs
4. MOST STOCKs -
Examples - AAPL, ADBE, CSCO, EBAY, GOOG, HD, IBM, QCOM
by William Schmidt, Ph.D. (Columbia University)
(C) 2009 All rights reserved. Reproducing any part of this page without
giving full acknowledgement is a copyright infringement.
Research on Individual Stocks upon Request:
Composite Seasonality Graph of Any Stock for $125.
Example of historical research NEM - Newmont Mining. Order Here.
 |
Tiger
Software Helping Investors since 1981
|
PEERLESS STOCK MARKET TIMING'S
AUTOMATIC BUYS AND SELLS
Trading Results: Superimposing
Peerless Signals on Different Investments
Quickly Shows Trading Gains, Buying and Selling at
Next Day's Opening and Allowing $40/Trade
Introduction to Peerless
PEERLESS RECENT REVERSING BUY/SELL SIGNALS ON DJIA
Action Date DJIA Gain
SELL 3/24/2007 12549 13.0%
BUY 9/15/2008 10918 0.9%
SELL 9/22/2008 11016 16.0%
BUY 10/8/2008 9258 0.1%
SELL 10/14/2008 9311 2.6%
BUY 10/28/2008 9065 0.8%
SELL 11/5/2008 9139 12.0%
BUY 11/21/2008 8046 1.3%
SELL 1/29/2009 8149
Cover 3/9/2009 6547 19.7%
BUY 3/10/2009 6926 12.3%
SELL 3/27/2009 7776 -3.1%
BUY 4/3/2009 8018 9.3%
Now 6/5/2009 8763
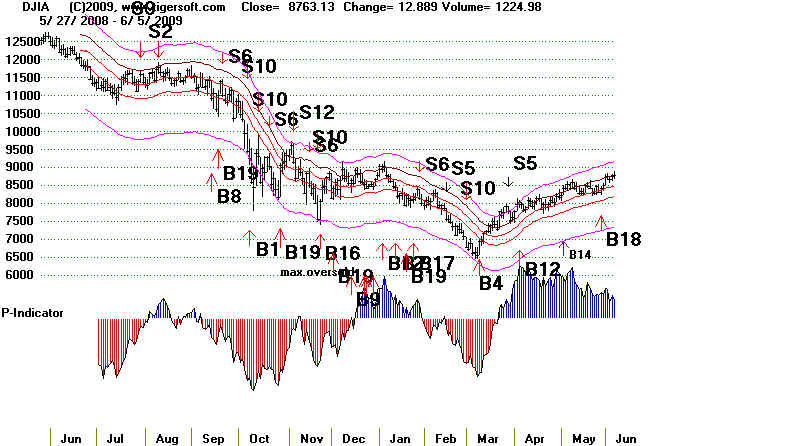
Peerless users, enter these commands to produce the DJI chart below with all signals.
PEERCOMM
+ PEERLESS
+Peerless Daily DJI
+ DATA
+ Superimpose DJI Saved Signals
(or DJI Major Buys and Sells when not in Extreme Bearish Mode.)
Buying and Selling Gain is shown first, +27.1%
Buying, Selling and Selling Short Gain is shown second, +99.6%
Buying and Holding Loss from 7/30/2008 to 6/5/2009 = -24.3%
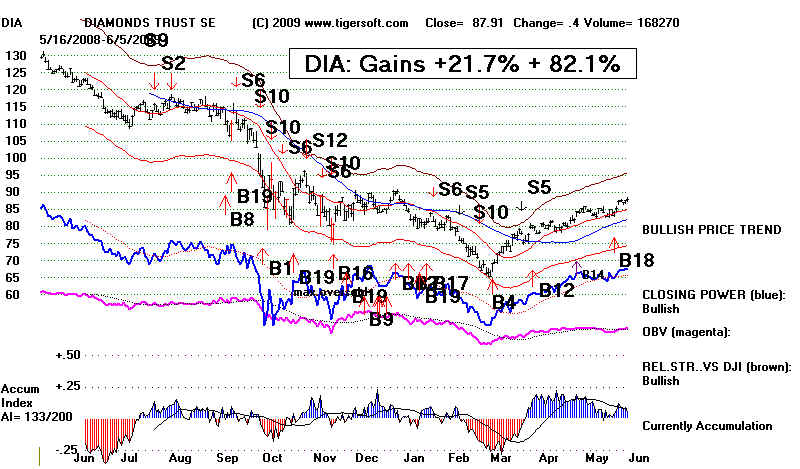
1. GENERAL
MARKET ETFs:
DIA
Buying and Selling Gain is shown first, +21.7%
Buying, Selling and Selling Short Gain is shown
second, +82.1%
Buying and Holding Loss from
7/30/2008 to 6/5/2009 = -23.3%
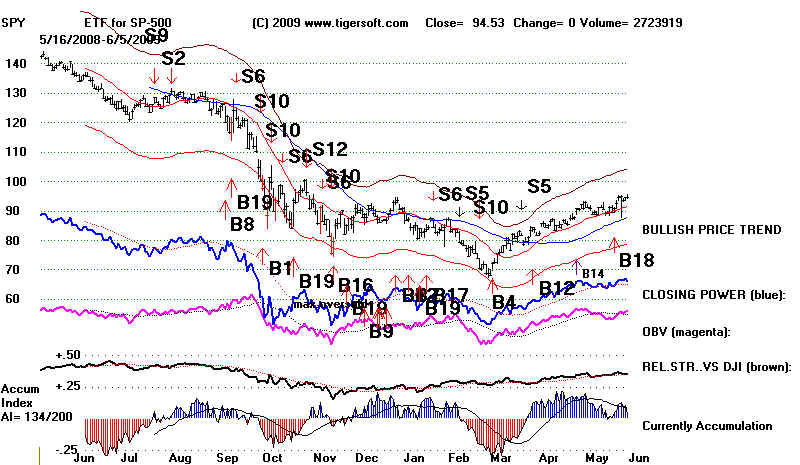
SPY
Buying and Selling Gain is
shown first, +30.7%
Buying, Selling and Selling Short Gain is shown
second, +112.6%
Buying and Holding Loss from
7/30/2008 to 6/5/2009 = -19.3%
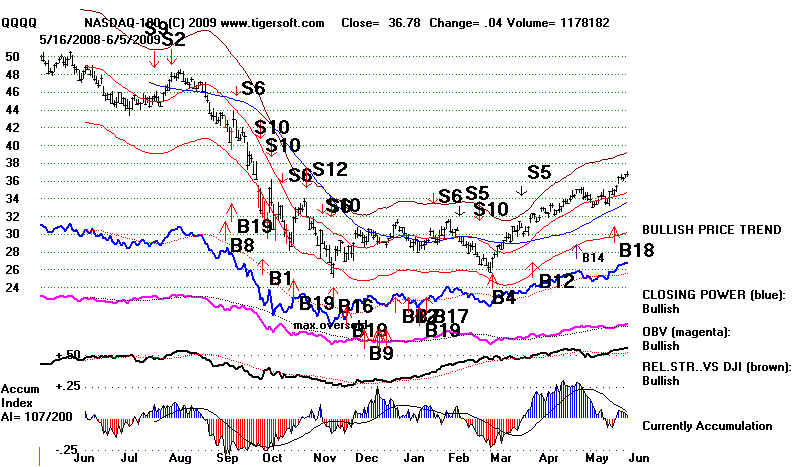
QQQQ Buying
and Selling Gain is shown first, +35.8%
Buying, Selling and Selling Short Gain is shown
second, +110.0%
Buying and Holding Loss from
7/30/2008 to 6/5/2009 = -18.5%
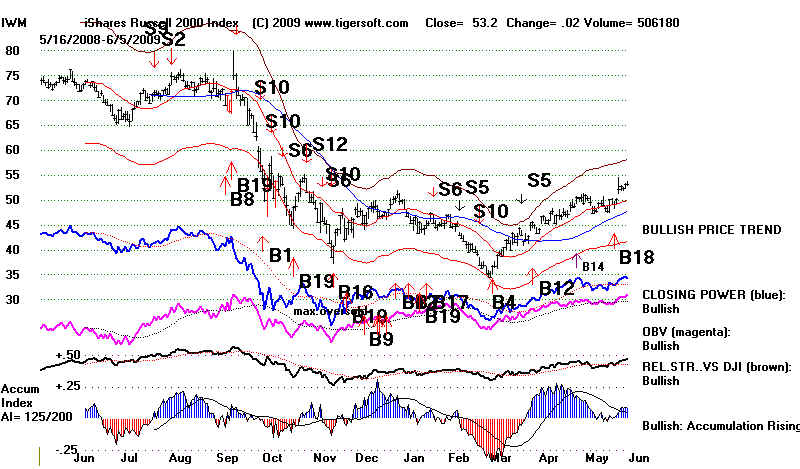
IWM (Russell-2000) Buying and
Selling Gain is shown first, +61.3%
Buying, Selling and Selling Short Gain is shown
second, +198.8%
Buying and Holding Loss from
7/30/2008 to 6/5/2009 = -24.9%
2. FOREIGN ETFs:
Russia, Brazil and India apprear to be excellent ETFs to be
traded with Peerless.
TRADING GAINS
Examples -
Peerless
Peerless
Buys/Sells
Buys/Sells/Shorts
UK
EWU ISHARES MSCI UK
+33.9%
+135.6%
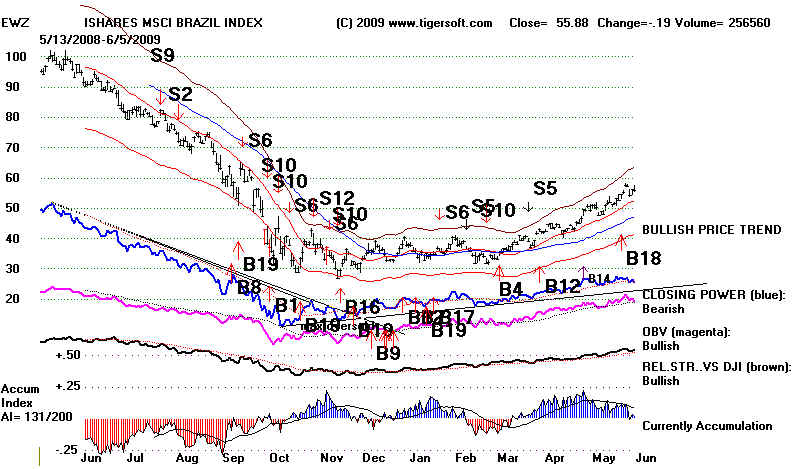
Brazil
EWZ ISHARES MSCI BRAZIL +114.3%
+381.0%
India
INP - INDIA
+104.9%
+276.0%
Mexico
EWW -I MEXICO
+73.3%
+259.8%
Russia TRF TEMPLETON RUSSIA
+301.8%
+729.0%
BRAZIL
Buying and Selling Gain is shown first,
+114.3%
Buying, Selling and Selling Short Gain is shown
second, +381.0%
Buying and Holding Loss from
7/30/2008 to 6/5/2009 = 31.8%
RUSSIA
Buying and Selling Gain is shown first,
+301.8%
Buying, Selling and Selling Short Gain is shown
second, +729%
Buying
and Holding Gain from 7/30/2008 to 6/5/2009 = 5.0%
              FOREIGN ETFS and TRADING RESULTS USING
                                           PEERLESS BUY AND SELLS
                               Percent Change from 63 Trading Days Back.
  3/6/2009 - 6/5/2009
Rank  Symbol Name             =Peerless Signals==     Price      Pct.Change
                                Buys    Buy and                   63 days
                                        SHort Sales
------------------------------------------------------------------------------
 1   TRF TEMPLETON RUSSIA FUND +301.8%  +729.0%       24.68         242%
 2   IFN INDIA FUND            +84.8%  +237.1%        31.53         129%
 3   IIF MS INDIA INV FUND    +114.2%  +312.0%        23.15         118%
 4   INP MSCI INDIA           +104.9%  +276.0%        52.68         112%
 5   CEE CENTRAL EUROPEAN EQUITY FUND +136.5% +584.1% 25.71         110%
 6   RSX MKT VCTR RUSSIA       +90.2% +300.0%         24.13         103%
 7   IF  INDONESIA FUND        +204.6% +864.2%         8.11          97%
 8   PGJ PowerShares USX China +86.3%  +227.0%        22.3           79%
 9   GCH GREATER CHINA FUND    +112.2% +282.5%        12.15          75%
 10  EWO ISHARES MSCI AUSTRIA  +88.7%  +388.2%        16.79          74%
 11  EWS ISHARES MSCI SINGAPORE+74.3%  +240.3%         9.48          73%
 12  GRR ASIA TIGERS FUND     +112.0%  +385.1%        15.59          71%
 13  SGF SINGAPORE FUND        +88.5%  +284.2%        10.42          71%
 14  EWI ISHARES MSCI ITALY    +65.9%  +253.6%        17.02          69%
 15  EWW ISHARES MSCI MEXICO   +73.3%  +259.8%        37.37          66%
 16  EWZ ISHARES MSCI BRAZIL   +114.3% +381.0%        55.88          66%
 17  KEF KOREA EQUITY FUND     +112.3% +390.0%         7.03          63%
 18  VWO Vanguard Emerging     +75.7%  +243.3%        32.9           63%
 19  EWC ISHARES MSCI CANADA   +90.9%  +317.4%        22.78          62%
 20  EWY ISHARES SOUTH KOREA   +124.3% +421.6%        35.71          62%
 21  FXI Xinhua China 25        +76.5% +200.0%        39.04          62%
 22  JFC JARDINE FLEMING CHINA  +62.2% +241.2%        12.01          62%
 23  EWH HONG KONG INDEX        +57.6% +159.6%        14.6           61%
 24  EZA SOUTH AFRICA           +64.4% +186.9%        47.67          61%
 25  TFC TAIWAN GRR CHINA       +79.8% +213.9%         5.17          61%
 26  EEM EMERGING MARKETS       +78.4% +237.4%        33.61          59%
 27  EPP PACIFIC EX-JAPAN       +61.7% +200.2%        32.68          59%
 28  ILF LATIN AMERICA 40       +91.7% +304.3%        36.09          59%
 29  MXF MEXICO FUND            +60.7% +281.6%        17.11          57%
 30  EWA AUSTRALIA INDEX        +33.0% +126.4%        16.85          56%
 31  CH  CHILE FUND             +82.5% +228.7%        15.5           55%
 32  EWD SWEDEN INDEX           +36.1% +118.7%        18.17          54%
 33  FEZ DOW JONES EURO 50      +50.9% +189.5%        35.19          54%
 34  EWP SPAIN INDEX            +49.7% +168.5%        39.16          53%
 35  EZU ISHARES MSCI EMU INDEX +43.6% +170.0%        31.85          53%
 36  EWK ISHARES MSCI BELGIUM  +58.6% +247.4%         10.27          52%
 37  EWG ISHARES MSCI GERMANY  +41.0% +388.2%         19.39          51%
 38  VGK Vanguard European     +35.5% +150.7%         41.07          50%
 39  CHN CHINA FUND            +30.8% +107.2%         21.94          49%
 40  EWT ISHARES MSCI TAIWAN   +41.6% +117.5%         10.72          49%
 41  EWN ISHARES MSCI NETHERL. +39.5% +157.0%         15.91          48%
 42  IEV ISHARES S&P EUROPE 350 +39.1%  +150.7%       32.54          48%
 43  EWQ IShares MSCI France   +36.4%  +139.5%        21.92          47%
 44  EWU ISHARES MSCI UK       +33.9% +135.6%         13.48          45%
 45  MF  MALAYSIA FUND        +219.9% +189.8%          6.13          45%
 46  IXN S&P GLOBAL TECHN.     +44.6% +137.9%         45.23          43%
 47  TF  THAI CAPITAL FUND     +80.2% +235.3%          8.53          43%
 48  EKH HOLDRS EUROPE         +64.8% +218.6%         50.8           41%
 49  TWN TAIWAN FUND           +67.8% +190.9%         12.44          40%
 50  VPL Vanguard Pacific      +47.1% +157.9%         46             39%
 51  EWL ISHARES MSCI SWITZ.   +30.2% +108.8%         17.94          35%
 52  EWM ISHARES MSCI MALAYSIA +41.6% +110.4%          9.04          32%
 53  ITF ISHARES S&P-TOPIX 150 +38.5% +135.1%         40.21          32%
 54  EWJ ISHARES MSCI JAPAN    +39.5% +133.7%          9.28          30%
 55  JOF JAPAN OTC EQUITY FUND +28.1% +97.5%           7.07          24%
 56  PWJ PS DYN MIDCAP GR      +39.1% +156.5%         14.42          24%
 57  IXP S&P GLOBAL TELEC.     +22.1% +86.2%          47.23          16%
                 FIDELITY INDUSTRY SECTOR FUNDS
     PROFITABILITY OF TRADING THEM WITH PEERLESS SIGNALS

               Brokerage stocks were particularly well traded
                      with Peerless BUYs and Sells from 2008-2009.
                      This accords with earlier published research here.


                                       TRADING GAINS
                                      Peerless         Peerless
                                                                        Buys/Sells   Buys/Sells/Shorts
        FSLBX  BROKERAGE-INV MGT    +72.7%        +209.6%

            Percentage Gain since DJI bottom on 3/9/2009
                           Buys, Sell and Short Sales

             FUNDS RANKED BY GAINS OVER THE LAST 63 DAYS
                      3/9/2009 - 6/5/2009 Rank
      Symbol   Name             USING PEERLESS SIGNALS   Price        63-Day
      FIDELITY SELECT FUND      BUYS ONLY With SHORTS                 Pct Gain
----  ------------------------  ----------    --------   ------       --------
 1    FSAVX  AUTOMOTIVE           +54.9%       +138.0%    22.17         159%
 2    FSPFX  PAPER-FOREST         +49.2%       +140.6%    21.33         104%
 3    FSLBX  BROKERAGE-INV MGT    +72.7%       +209.6%    41.2          77%
 4    FIDSX  FINANCIAL SERVICES   +47.0%       +153.6%    51.44         76%
 5    FSRBX  BANKING              +12.2%       +60.1%     12.83         71%
 6    FNINX  NETWORKING           +40.4%       +92.3%      1.91         67%
 7    FSDPX  IND. MATERIALS       +41.1%      +135.8%     41.98         65%
 8    FDVLX  Invest. Values       +29.5%      +110.9%     45.44         64%
 9    FSAIX  AIR TRANSPORTATION   +41.7%       +84.5%     23.81         63%
 10   FSCGX  INDUSTRIAL EQUIP.    +23.1%       +97.8%     20.76         63%
 11   FSESX  ENERGY SERVICES      +27.3%       +145.2%    51.49         63%
 12   FCYIX  CYCLICAL             +26.6%       +97.4%     14.68         62%
 13   FSNGX  NATURAL GAS          +50.2%       +155.0%    28.63         62%
 14   FSPTX  TECHNOLOGY           +36.8%       +97.2%     56.16         61%
 15   FSPCX     INSURANCE                             +57.9%          +169.3%     32.72         55%
 16   FSDAX  MILITARY/AEROSPACE   +32.3%       +90.6%     53.92         54%
 17   FBMPX  MULTI MEDIA          +22.8%       +70.3%     25.41         53%
 18   FSHOX  CONSTRUCT.& HOUSING  +23.9%       +67.7%     24.71         52%
 19   FNARX  NATURAL RESOURCES    +38.1%       +129.5%    24.7          51%
 20   FSRPX  RETAILING            +22.7%       +39.4%     36.28         51%
 21   FDCPX  COMPUTER             +22.6%       +72.6%     32.72         50%
 22   FSCHX  CHEMICALS            +20.3%       +80.0%     60.55         50%
 23   FSENX  ENERGY               +32.3%       +113.1%    38.62         50%
 24   FSELX  ELECTRONICS          +15.4%       +50.2%     29.83         45%
 25   FSRFX  TRANSPORTATION       +6.9%        +49.3      30.32         45%
 26   FSCPX  CONSUMER INDUSTRIES  +17.3%       +48.6      15.4          44%
 27   FWRLX  WIRELESS             +21.4%       +53.3%      6.12         44%
 28   FSHCX    MEDICAL DELIVERY             +77.1%       +228.6%     32.65         41%
 29   FSTCX  TELECOMMUNICATIONS   +30.8%       +80.1%     34.54         41%
 30   FSCSX  SOFTWARE             +18.4%       +52.8%     57.48         40%
 31   FDLSX  LEISURE              +22.3%       +48.2%     58.94         37%
 32   FSLEX  ENVIRONMENTAL        +25.2%       +87.6%     13.57         37%
 33   FBSOX  BUS.SRVCS-OUTSOURC.  +21.8%       +37.6%     13.24         35%
 34   FSCBX  SMALL CAPS           +17.5%       +61.4%     16.88         32%
 35   FSAGX    GOLD                                         +93.8%       +219.6      38.23          29%
 36   FDFAX  FOOD & AGRICULTURE    +7.7%       +28.7%     52.61         27%
 37   FSVLX  HOME FINANCE          +4.7%       +88.4%      9.35         27%
 38   FSMEX  MEDICAL EQUIP        +36.8%      +116.7%     20.15         25%
 39   FSPHX  HEALTH CARE          +30.2%       +95.9%     86.11         21%
 40   FSUTX  UTILITIES GROWTH      +7.3%       +51.6%     38.28         21%
 41   FPHAX  PHARMACEUTICALS      +15.9%       +51.1%      8.72         15%
 42   FBIOX  BIOTECHNOLOGY        +19.1%       +70.6%     58.57         11%
|
4. PEERLESS BUYS AND SELLS with Key Stocks
Some
Randomly Chosen Examples
The
Peerless signals are easily superimposed on any chart.
The software
generates the trading gains of these signals, assuming
that
positions are taken at the next day's openimg, following a
Buy or
Sell.
TRADING GAINS
Peerless
Peerless
Buy
&
Buys/Sells
Buys/Sells/Shorts Hold
AAPL
74.9%
187.4%
-8.3%
ADBE
31.4%
110.2%
-26.8%
CSCO
25.2%
65.2%
-9.9%
EBAY
30.9%
114.7%
-28.9%
GOLDMAN SACHS
105.7%
281.8%
-19.0%
GOOGLE
67.0%
166.4%
-6.6%
HOME DEPOT
22.3%
32.4%
2.6%
IBM
35.3%
101.6%
-16.1%
NEM (gold stock)
92.2%
255.7%
-9.0%
QCOM
12.7%
47.2%
-17.6%
RIMM
110.2%
304.9%
-30.9%
3
|
|
|
|