FOR SUBSCRIBERS TO HOTLINE ONLY
Characteristics of Market Tops since 1928
9/11/2010 (C) William Schmidt, Ph.D.
There have been 25 major market tops that led to DJI declines of more than 15%
since 1929. What signals and conditions most called them? Most common
are NYSE A/D Line non-confirmations of a new high, Sell S9s, a DJI at least 2.5%
over the 21-day ma with the V-Indicator negative, the Accumulation Index under
.06 and the P<70. But we still have to watch for other signals: S10 (1946 and 1962),
S1 (1948 and 1969), S8 (1977), S4 (2001 and 2007) and S15(2008).
20 A/D Line NC (The NYSE A/D Line did not confirm the high by making a corresponding
high of its own.)
16 P<70
15 S9s + 1 special varierty S9
15 V<0
16 DJI more than 2.5% over 21-dma
15 AI<.06
14 DJI Head/Shoulders
13 S10s
10 P<0 (P-Indicator)
9 S12s
7 S15s
5 Current AI<0
4 S4s
5 S8s
1 S7 Extreme Bearish Mode
1 S5 Extreme Bearish Mode
1 S6
1 S1 (1948)
1 Repeated failure to get past round number resistance. (1976)
The cases where the A/D Line remained strong despite the top were:
5/29/46 Earlier S9 and H&S
12/2/69 S1...later S9
9/21/76 Later S8
5/21/01 Earlier S9 and earlier S12. H&S

Characteristics of Final Market Tops since 1928
8efore A Steep Bear Market
Date S9 S12 A/D-NC V-Ind. Head/Shoulders Other Signals LA/MA P-I IP21 OP21
---------------------------------------------------------------------------------------------------------------------------
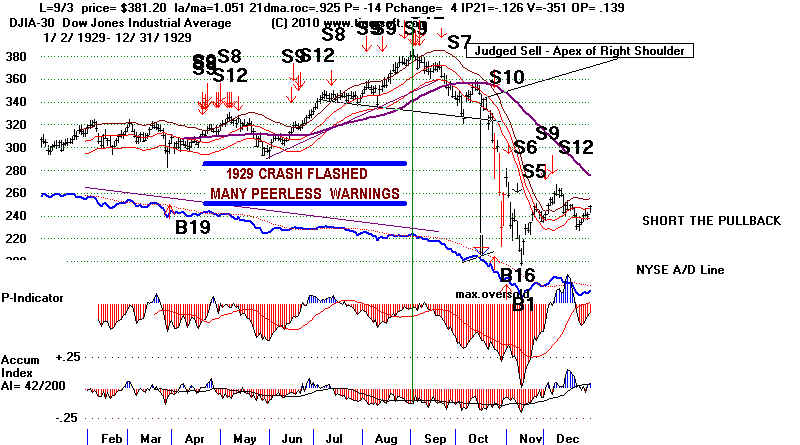
#1
9/3/29 Y Y Y-lengthy -351 Y - 6 wks later S7 and S8 1.051 -14 -.126 .139
There were at least 10 sets of major Sells in the 5 months before the final top
S9/S12/S7
---------------------------------------------------------------------------------------------------------------------------
#2
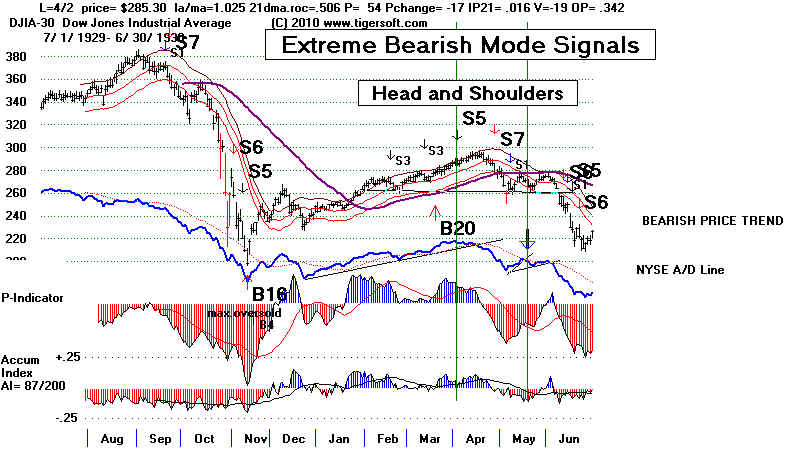
4/17/30
E-Y Y-10day -322 Y - two months later also E-S4 1.024 -2 .084 .524
There were at least 4 sets of major Sells in the 5 months before the final top using normal mode.
Using Extreme Bearish Mode, Peerless gave a Sell S5 (Extreme Mode) on 4/2/1930
Yes -19 1.025 54 .016 .342
---------------------------------------------------------------------------------------------------------------------------
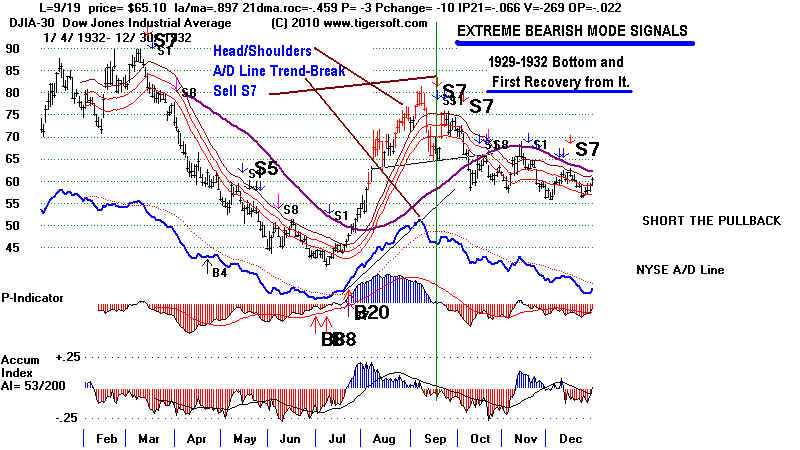
9/7/32 Y 464 Y - month later S8 S6 1.118 129 ,056 .233
The NYSE A/D Line trend-break cliched the S8 and S12 sell signals quite well.
S8/S12/S6
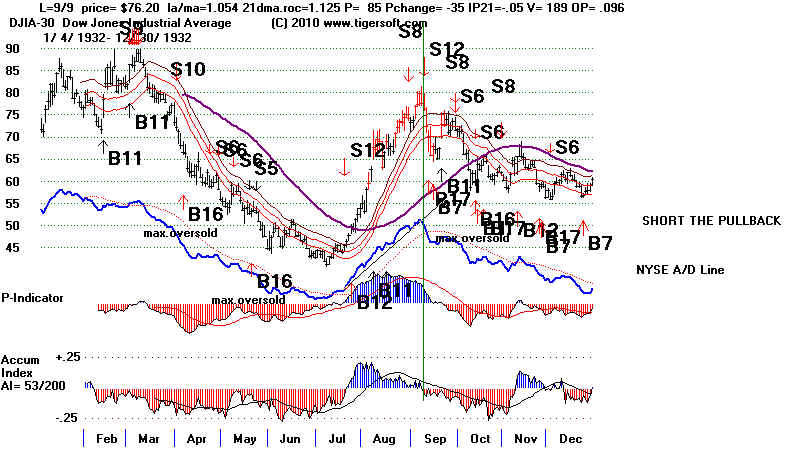
Extreme Bearish Mode shows a Sell S7 on 9/19/1932. S7(EBM) .897
The trend-break of A/D Line, Sell S7 and head and shoulders were clear warnings of this top..
S7(EBM)
---------------------------------------------------------------------------------------------------------------------------
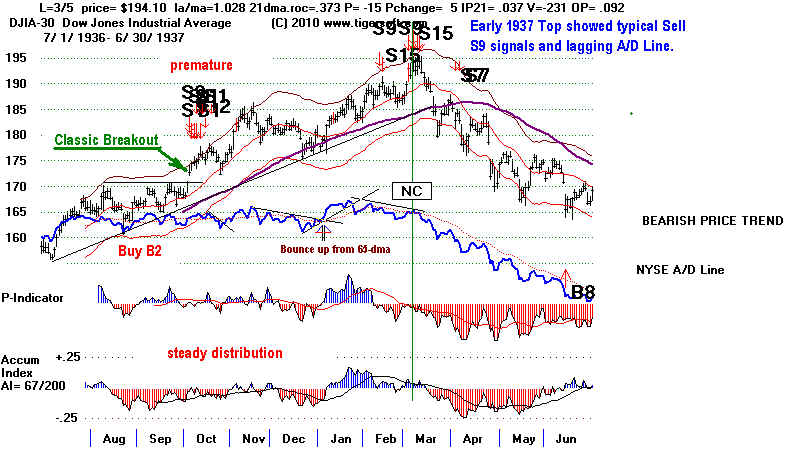
3/5/37 Y Y-30 day -231 Y - month later S15 1.028 -15 .037 .094
There were 3 clusters of major Sells before the final top in March 1937.
S9/S15
---------------------------------------------------------------------------------------------------------------------------
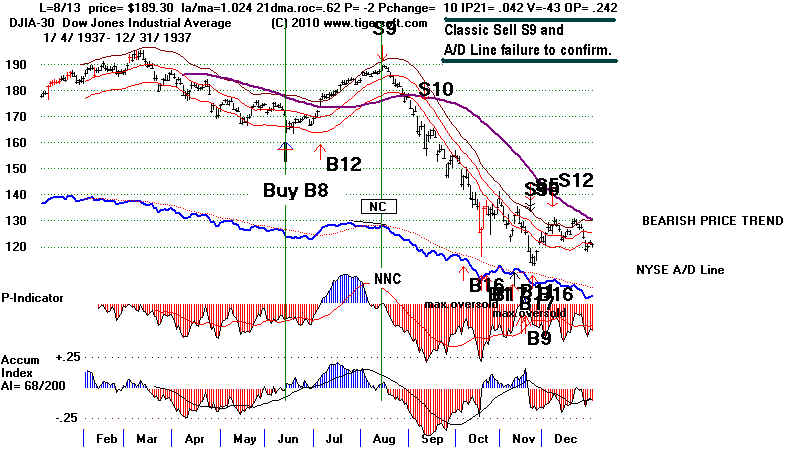
8/13/37 Y Y-15 day -43 1.024 -2 .042 .242
There had been earlier 3 sets of major Sells in the previous 6 months, though they are not shown in this chart.
See the previous chart.
S9
---------------------------------------------------------------------------------------------------------------------------
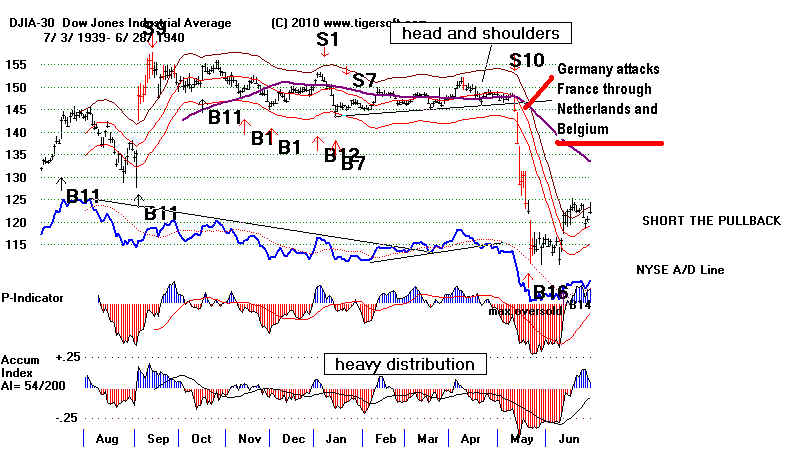
9/13/39 Y Y-6 wks 56 also S8 1.181 -43 .138 .317
The top here did not produce a significant decline here until May 1940.
1939 S9/S8
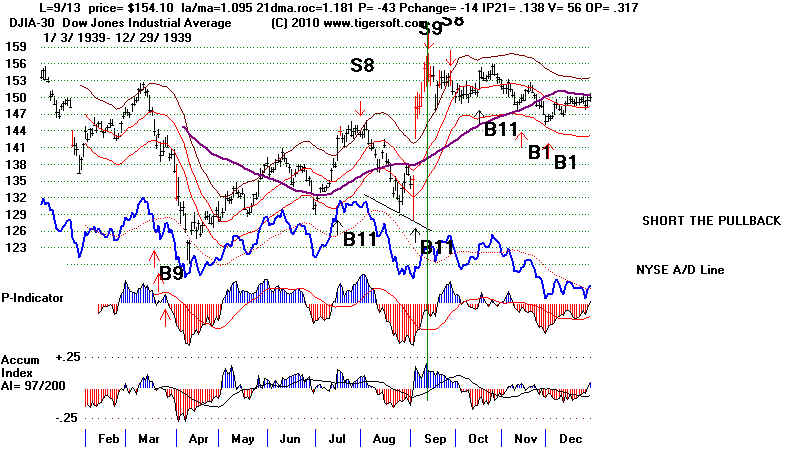
1939-1940
S9
---------------------------------------------------------------------------------------------------------------------------
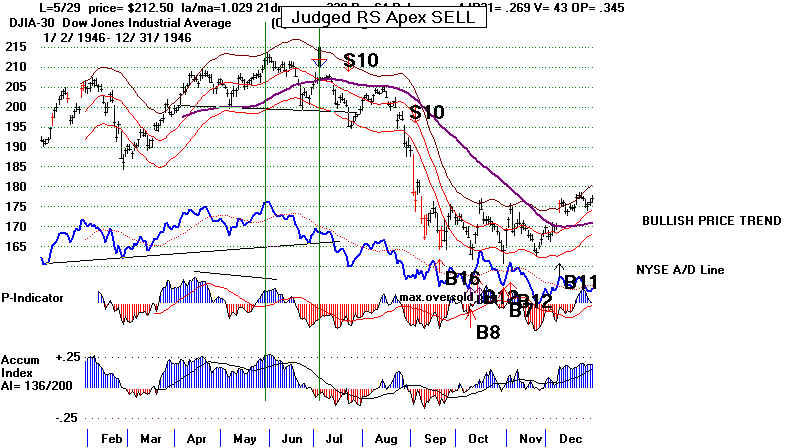
5/29/46 E-Y 43 Y - month later S10 1.029 64 .269 .355
Classic Head and Shoulders
When a head and shoulders develops, using the turning down of the A/D Line after
the apex of the right shoulder has been reached works well here and generally.
---------------------------------------------------------------------------------------------------------------------------
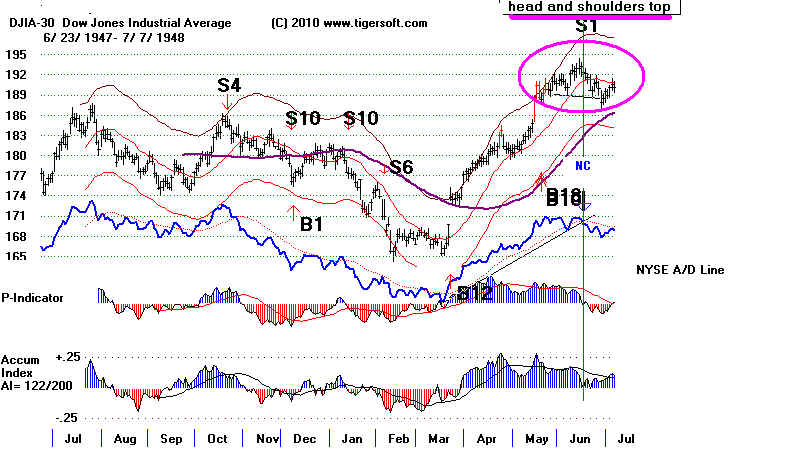
6/14/48 Y-10day 62 Y - 3 weeks later also S1 1.012 55 .106 .143
S1
---------------------------------------------------------------------------------------------------------------------------
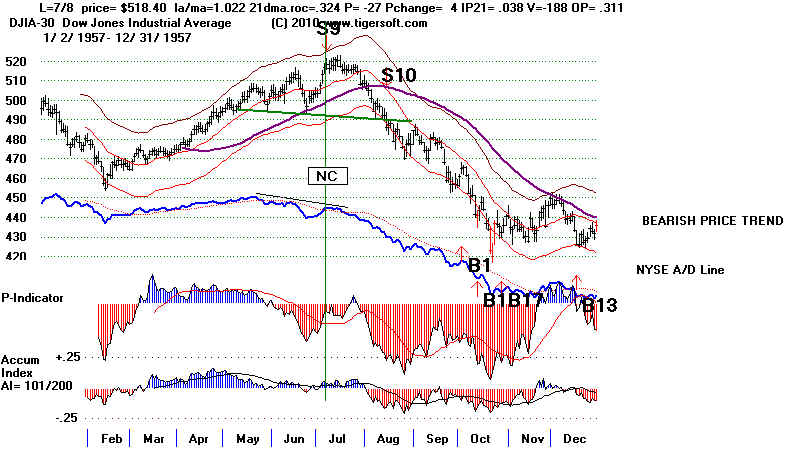
7/15/57 Y Y-6 wks -217 1.02 -41 .063 .107
Perfect Sell S9 occurred on 7/8/1957, a week earlier. Note the clear way the A/D Line did not confirm the last highs.
S9
---------------------------------------------------------------------------------------------------------------------------
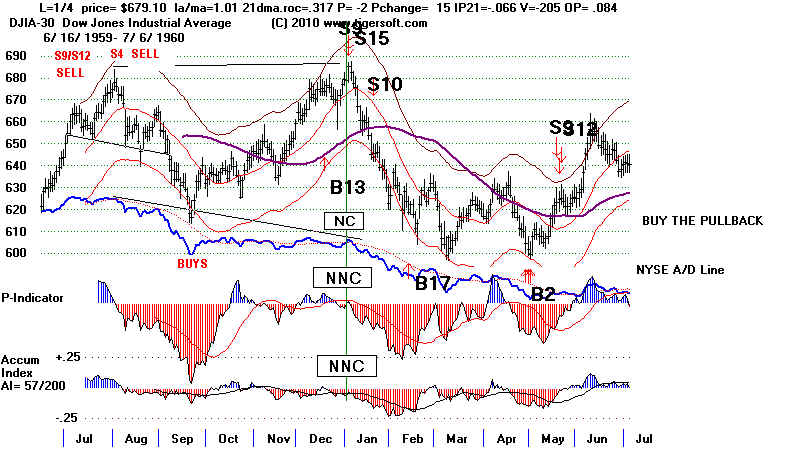
1/5/60 Y Y-lengthy -186 also S15 1.018 4 -.038 .09
divergence
S9/S15
---------------------------------------------------------------------------------------------------------------------------
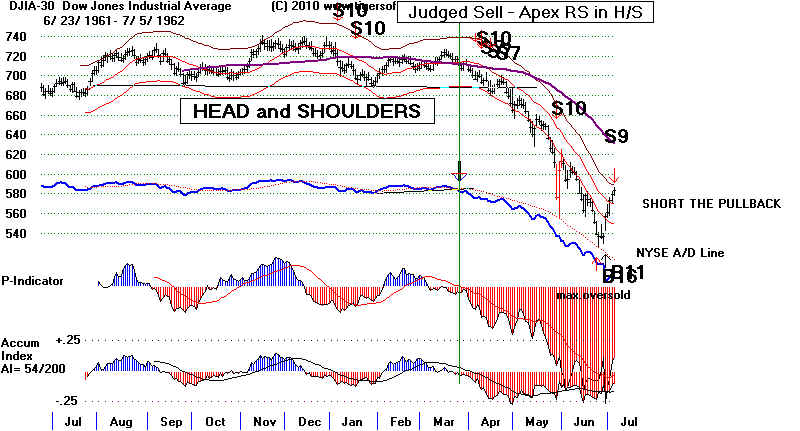
Peak on 11/15/1961 showed LA/MA= 1.034 ROC= .522 P=20 OP21=.108 V=53 OP=.408
Selling just after peak of right shoulder when NYSE A/D Line uptrend was broken
would have been advised.
---------------------------------------------------------------------------------------------------------------------------
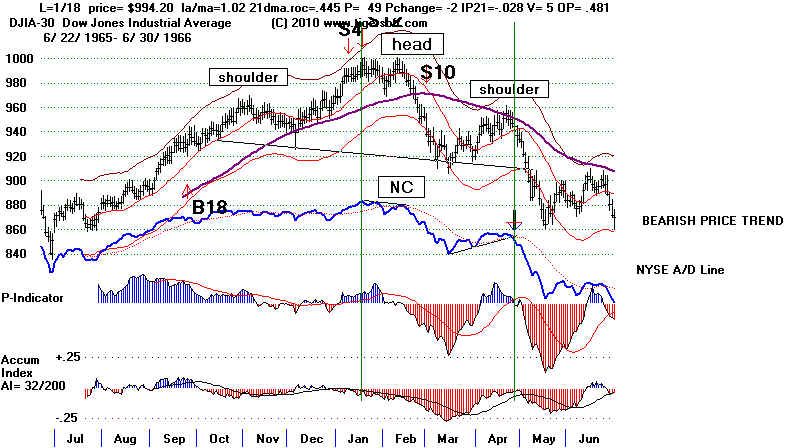
2/9/66 E-Y Y-15 day 4 Y - 2 months later Also E-S4 1.007 3 -.064 .153
1/18/66 Y 5 Y - 3 months later Also S4 1.02 49 -.028 .481
S4/S12
---------------------------------------------------------------------------------------------------------------------------
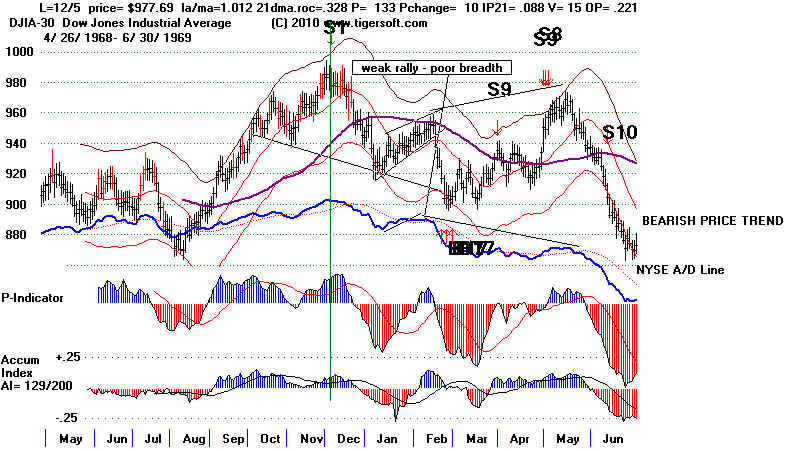
12/2/69 12 S1 1.021 114 .068 .169
5/14/69 Y 0 S8 1.028 61 .097 .237
S1 S8/S9
---------------------------------------------------------------------------------------------------------------------------
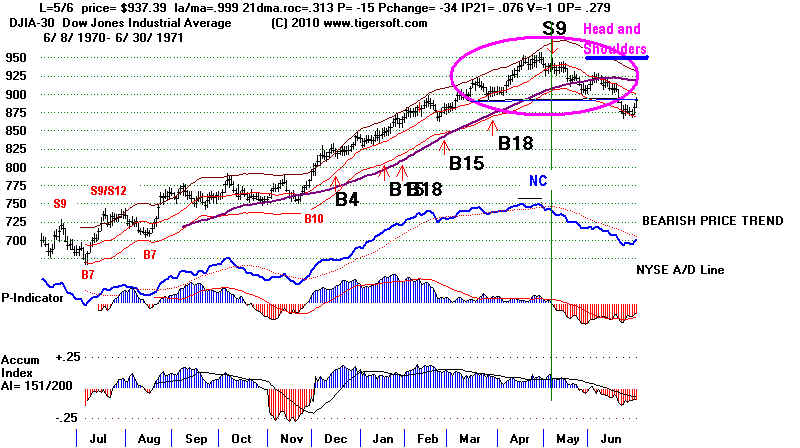
4/28/71 Y-1 wk 1 Y - 6 wks later S9-variation 1.024 82 .095 .405
S9
---------------------------------------------------------------------------------------------------------------------------
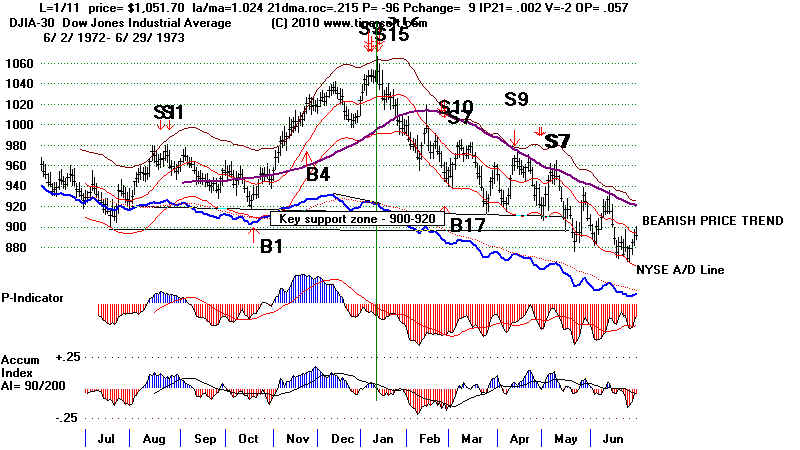
1/11/73 Y Y Y-1 month -2 S15 1.024 -96 .002 .059
S9/S12/S15
---------------------------------------------------------------------------------------------------------------------------
9/21/76 2 1.033 178 .181 .173
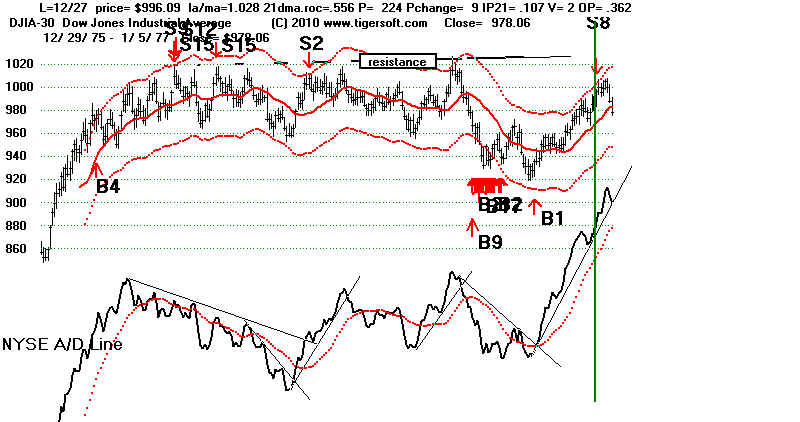
12/27/77 S8 1.028 224 .107 .362
A/D Line was very strong until June when DJI fell more than 12% from its Sept 1966 highs.
It was impenetrability of the 1000 resistance that contributed mightily to the DJI decline in 1977.
S8

---------------------------------------------------------------------------------------------------------------------------
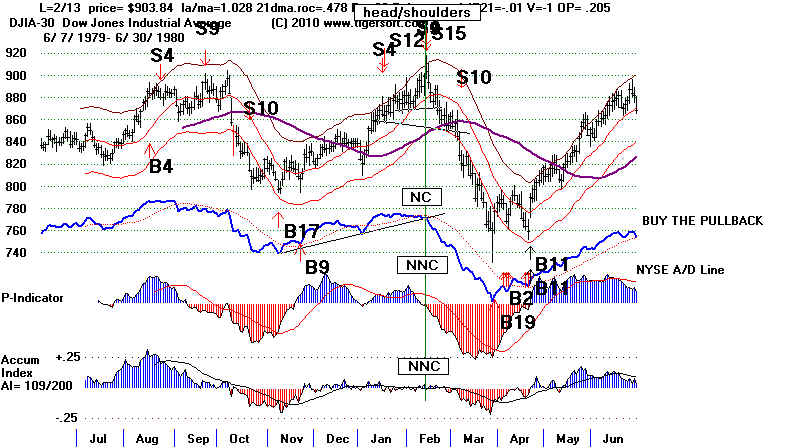
2/13/80 Y Y Y-2 weeks -1 S15 1.028 -26 -.01 .208
S9/S15
---------------------------------------------------------------------------------------------------------------------------
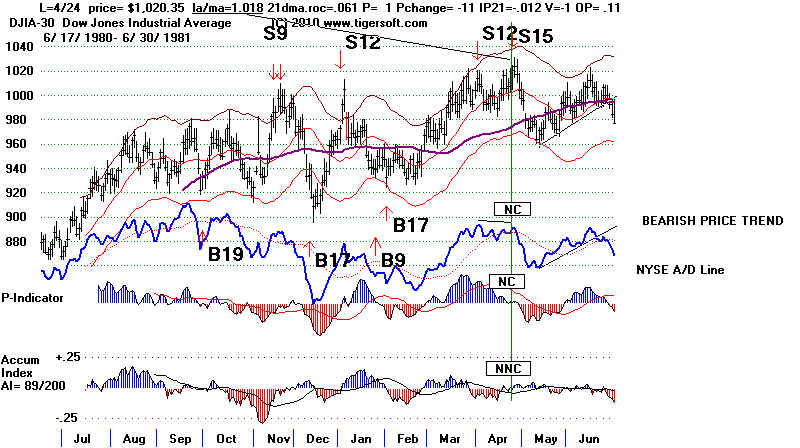
4/27/81 Y Y-2 weeks 0 S15 1.02 11 .026 .21
3 earlier major Sell-Sets (S9s and S12s) in previous 5 months.|
---------------------------------------------------------------------------------------------------------------------------
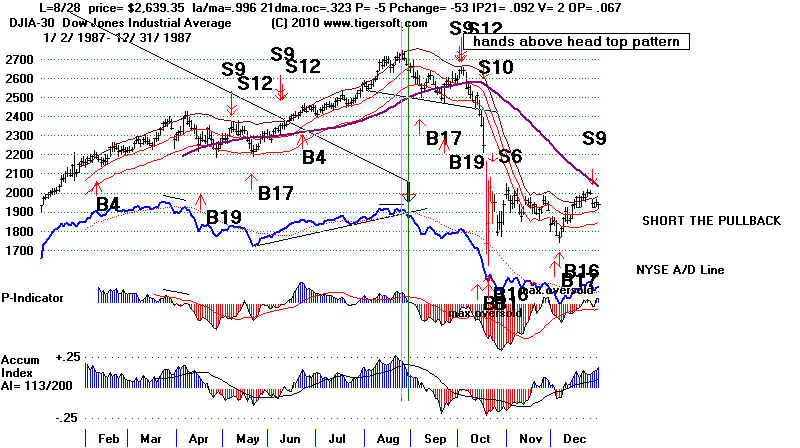
8/25/87 Y-1 wk 21 1.034 117 . 224 .319
The August top saw an A/D Line trend-break after a 3 month advance put the DJIA into an oversold
position. The P and AI Indicators dropped quickly below their 21-day ma. The A/D Line trend-break
should have been used to take profits, at least.
10/2/87 Y Y -7 hands above head pattern 1.026 -56 -.017 .068
2 earlier major Sell-Sets (S9s and S12s) in previous 6 months.
S9/S12
---------------------------------------------------------------------------------------------------------------------------
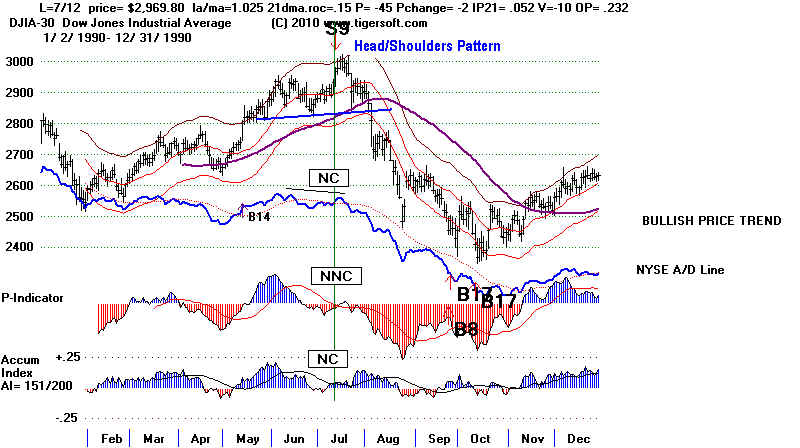
7/16/90 Y Y-6 weeks -3 Y - 3 wks later 1.033 0 .049 .426
S9
---------------------------------------------------------------------------------------------------------------------------
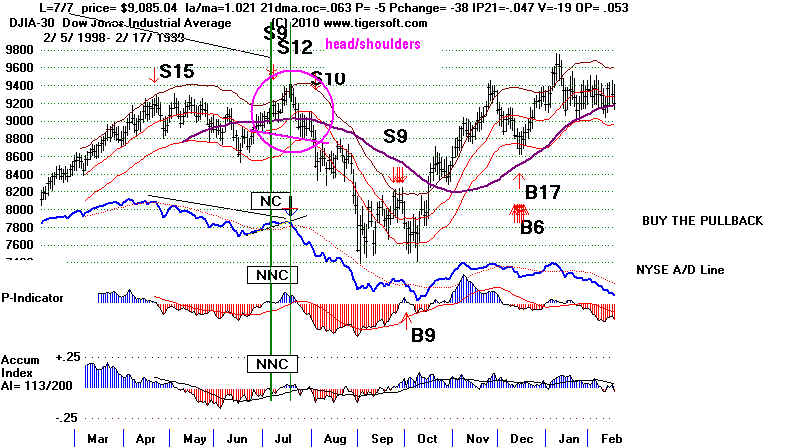
7/17/98 Y Y Y - 4 mo 11 Y - 2 weeks later 1.034 141 .026 .134
S9/S12
---------------------------------------------------------------------------------------------------------------------------
1/14/00 Y Y-lengthy -28 Y - 1 month later S15 1.03 90 -.058 .441
6 earlier major Sell-Sets in previous 6 months
December is normally a bullish month. December S9s can be premature.
S9/S15
---------------------------------------------------------------------------------------------------------------------------
5/21/01 E-Y E-Y 410 Y - 1 month later S4 1.041 410 .151 .08
A/D Line was very strong until August when DJI fell more than 12% from its May 2001 highs.
S4
---------------------------------------------------------------------------------------------------------------------------
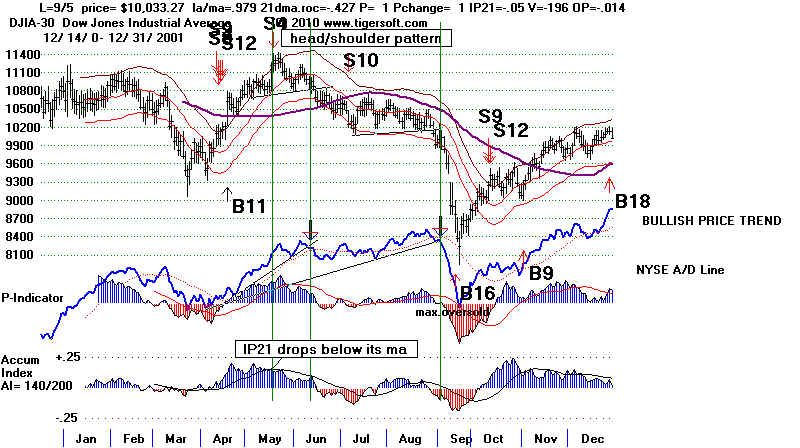
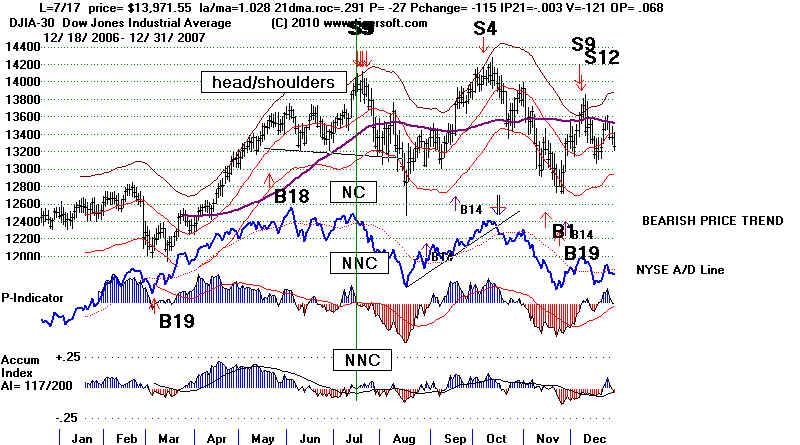
10/19/07 Y - 4 mo 140 Y - 1 month later S4 1.027 408 .119 .282
The multiple major Sells in 2007 set up the big decline in 2008-2009.
S4
---------------------------------------------------------------------------------------------------------------------------
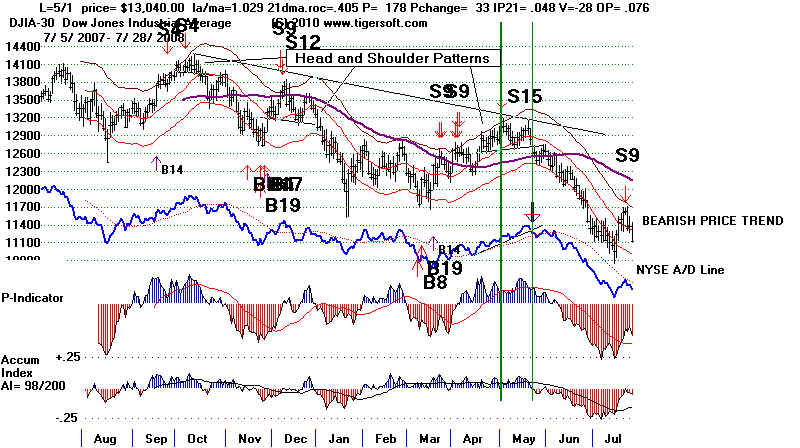
5/1/08 Y-2 weeks -28 Y-2 weeks later S15 1.029 178 .048 .076
S15
===============================================================================