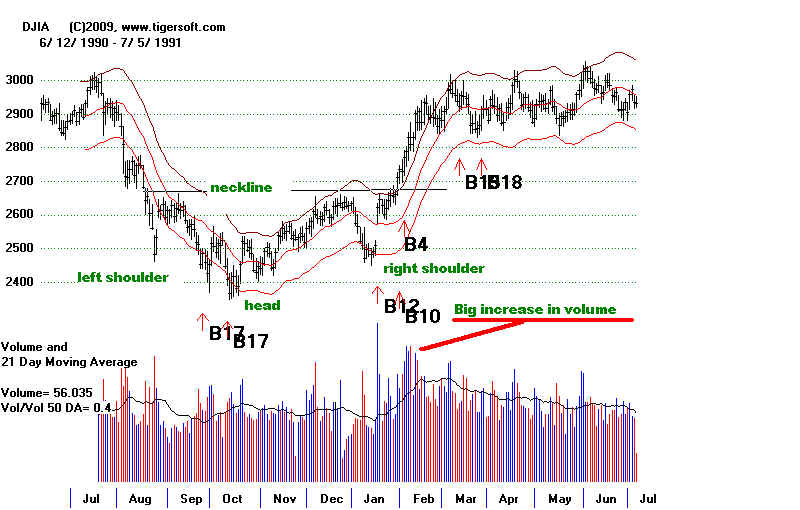
Inverted Head and Shoulders Patterns
Are Usually Quite Bullish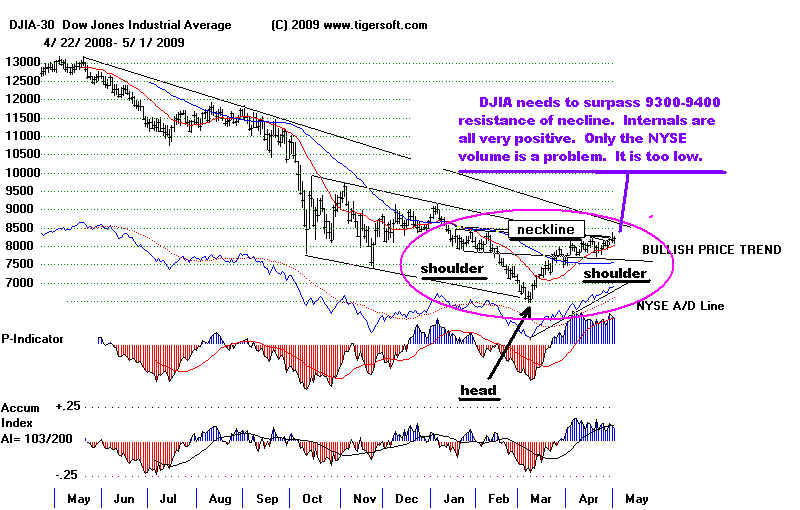
Prices
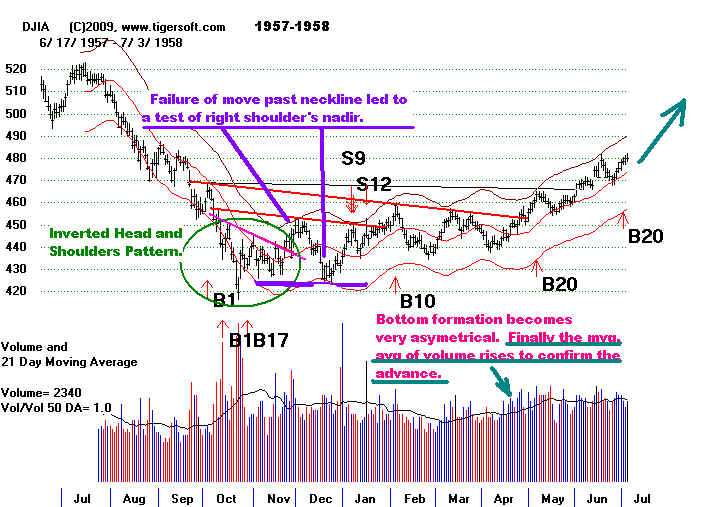
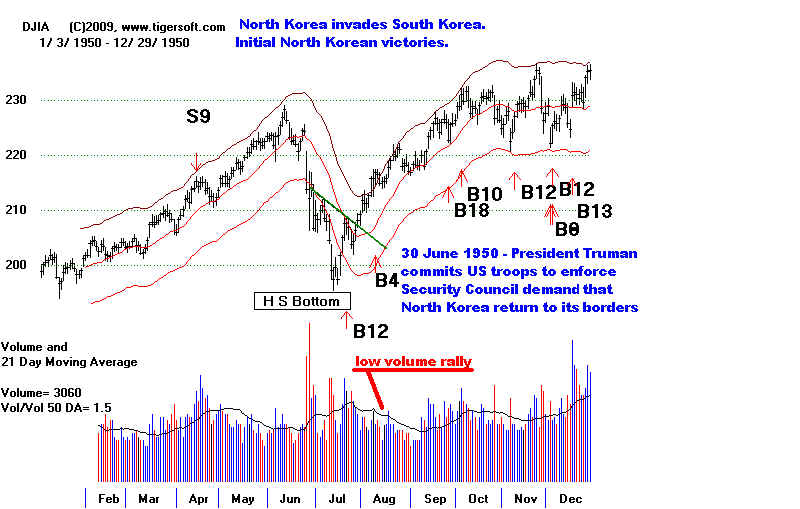
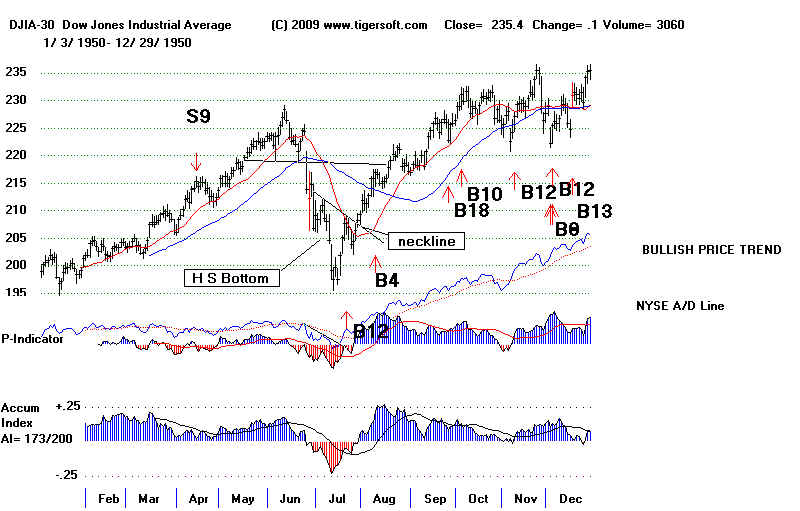
sometimes form an Inverted Head and Shoulders Bottom pattern.

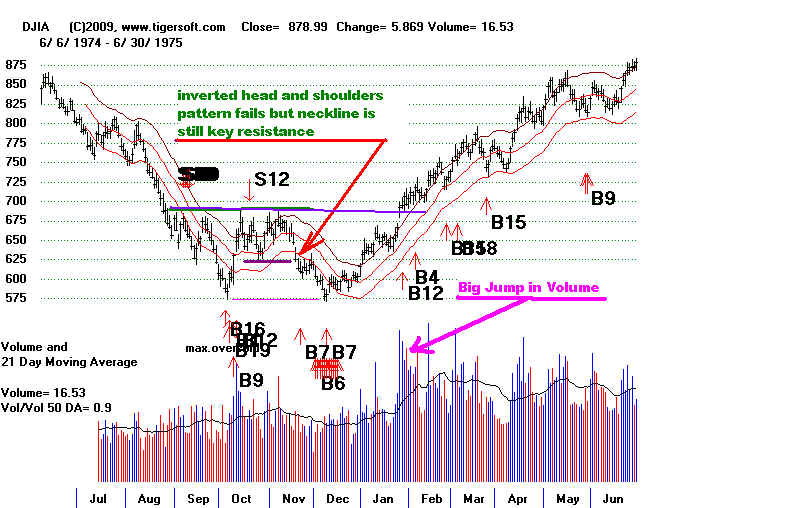
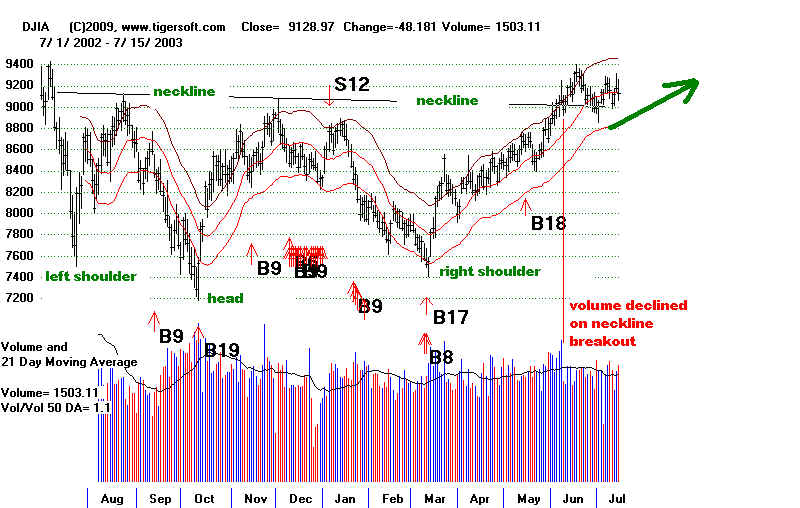
An increase in volume when
prices move up past the pattern's neckline validates the pattern.
Some technicans consider such
a volume increase to be absolutely necessary. You can see below
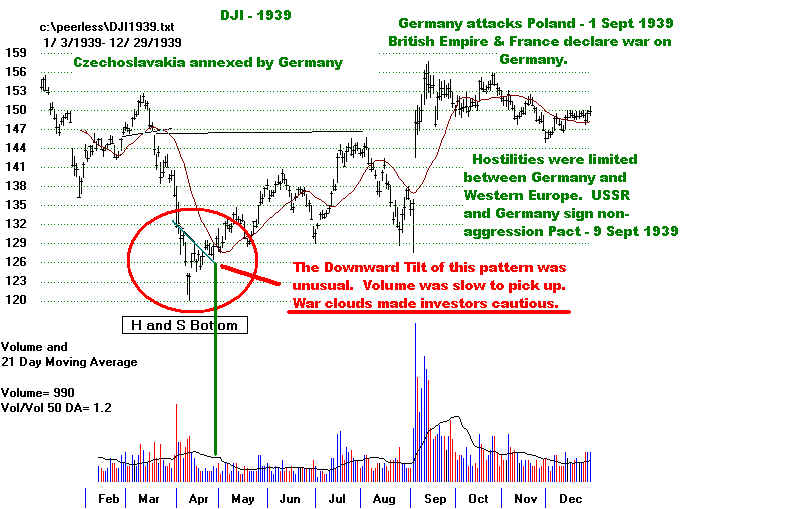
in 1939 and 1950.
We want to see volume rise because it will usually be needed to eat up
overhead supply.
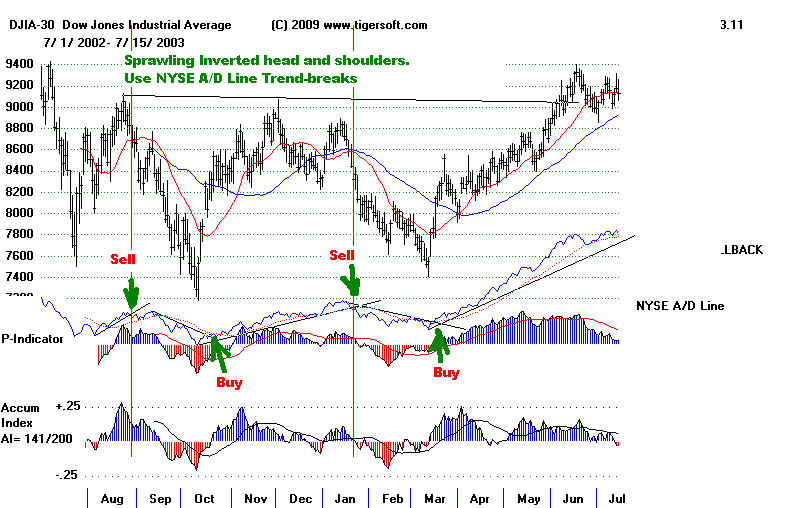
However, these two cases show that excessive fear can drop prices abnormally.
A recovery from that oversold
condition may occur on realtively low volume.
Below is a typical view of a head and shoulders bottom.
(Source:
http://stockcharts.com/school/doku.php?id=chart_school:chart_analysis:chart_patterns:head_and_shoulders_b
)
Prior Trend : It is important to
establish the existence of a prior downtrend for this to be a reversal pattern.
Without a prior downtrend to reverse, there cannot be a Head and Shoulders Bottom
formation.
Left Shoulder : While in a downtrend,
the left shoulder forms a trough that marks a new reaction low in the
current trend. After forming this trough, an advance ensues to complete the formation of
the left shoulder
(1). The high of the decline usually remains below any longer trend line, thus keeping the
downtrend intact.
Head : From the high of the left
shoulder, a decline begins that exceeds the previous low and forms the low
point of the head. After making a bottom, the high of the subsequent advance forms the
second point
of the neckline (2). The high of the advance sometimes breaks a downtrend line, which
calls into
question the robustness of the downtrend.
Right Shoulder : The decline from the
high of the head (neckline) begins to form the right shoulder.
This low is always higher than the head, and it is usually in line with the low of the
left shoulder. While symmetry
is preferred, sometimes the shoulders can be out of whack, and the right shoulder will be
higher, lower, wider,
or narrower. When the advance from the low of the right shoulder breaks the neckline, the
Head and Shoulders
Bottom reversal is complete.
Neckline : The neckline forms by
connecting reaction highs 1 and 2. Reaction High 1 marks the end of
the left shoulder and the beginning of the head. Reaction High 2 marks the end of the head
and the beginning
of the right shoulder. Depending on the relationship between the two reaction highs, the
neckline can slope up,
slope down, or be horizontal. The slope of the neckline will affect the pattern's degree
of bullishness: an upward
slope is more bullish than downward slope.
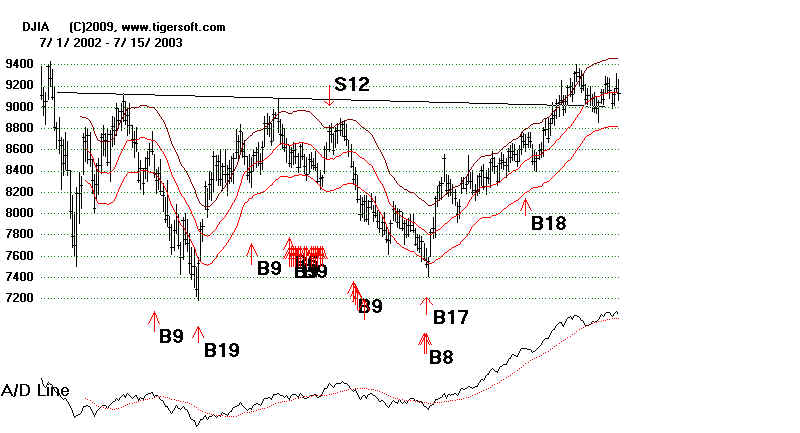
Volume : While volume plays an
important role in the Head and Shoulders Top, it plays a crucial role in the Head and
Shoulders Bottom. Without the proper expansion of volume, the validity of any breakout
becomes suspect.
Volume levels during the first half of the pattern are
less important than in the second half. Volume on the decline of the left shoulder is
usually pretty heavy and selling pressure quite intense. The intensity of selling can even
continue during the decline that forms the low of the head. After this low, subsequent
volume patterns should be watched carefully to look for expansion during the advances.
The advance from the low of the head should show an
increase in volume...
Neckline Break : The Head and
Shoulders Bottom pattern is not complete, and the downtrend is not reversed
until neckline resistance is broken. For a Head and Shoulders Botom, this must occur in a
convincing manner,
with an expansion of volume.
Resistance Turned Support : Once
resistance is broken, it is common for this same resistance level to turn
into support. Often, the price will return to the resistance break, and offer a second
chance to buy.
Price Target : After breaking neckline
resistance, the projected advance is found by measuring the distance from the neckline to
the bottom of the head. This distance is then added to the neckline to reach a price
target. Any price target should serve as a rough guide, and other factors should be
considered, as well. These factors might include previous resistance
levels, Fibonacci retracements
or long-term moving averages.
|
1939
1949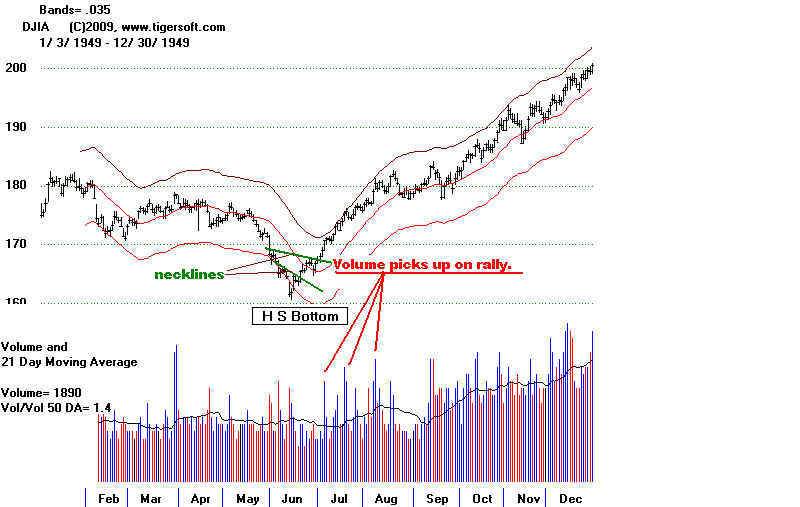  
1950
1957-1958
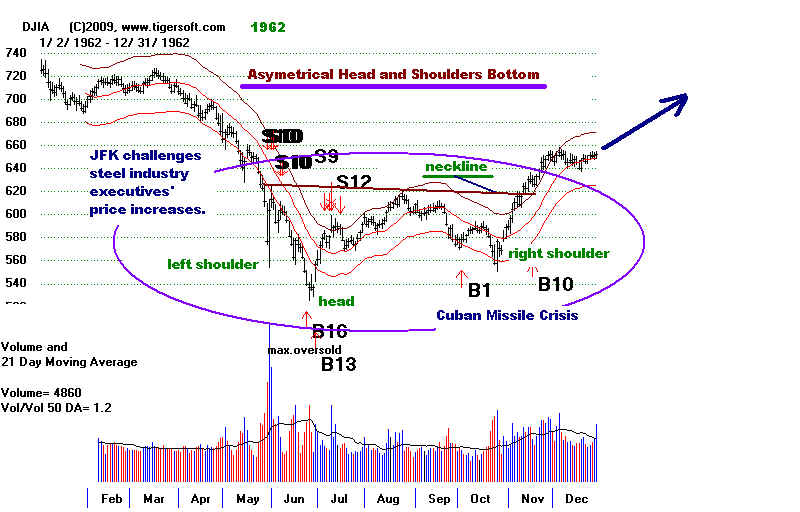
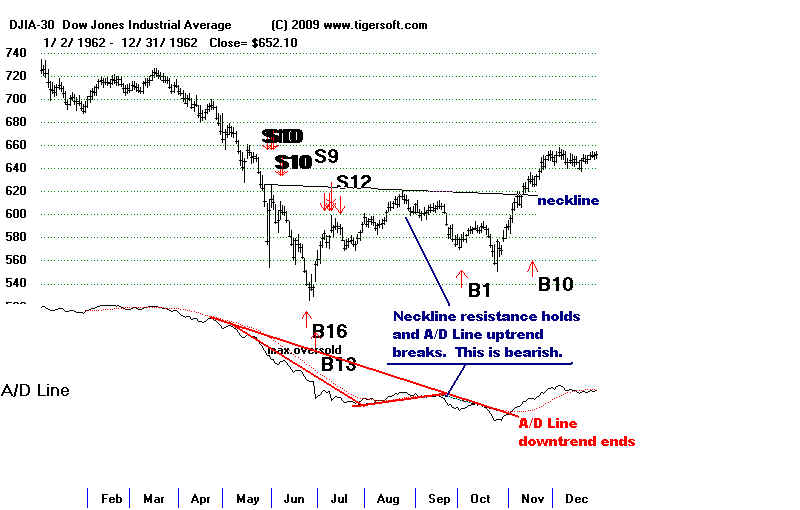
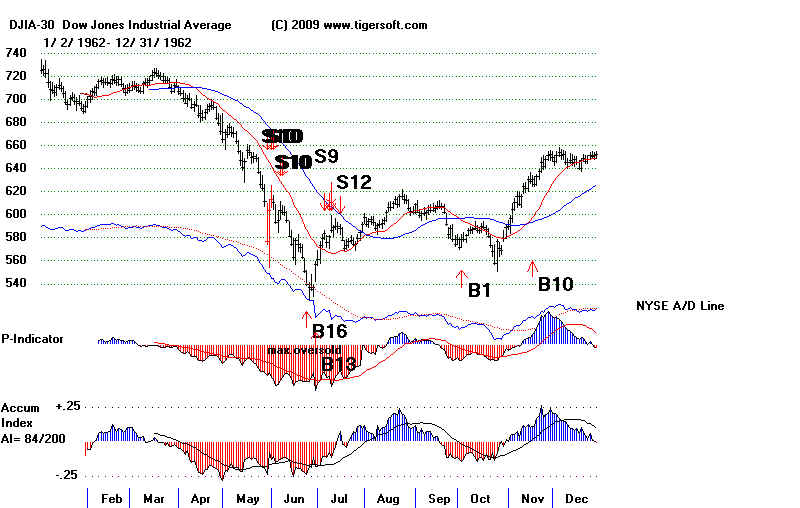
1962
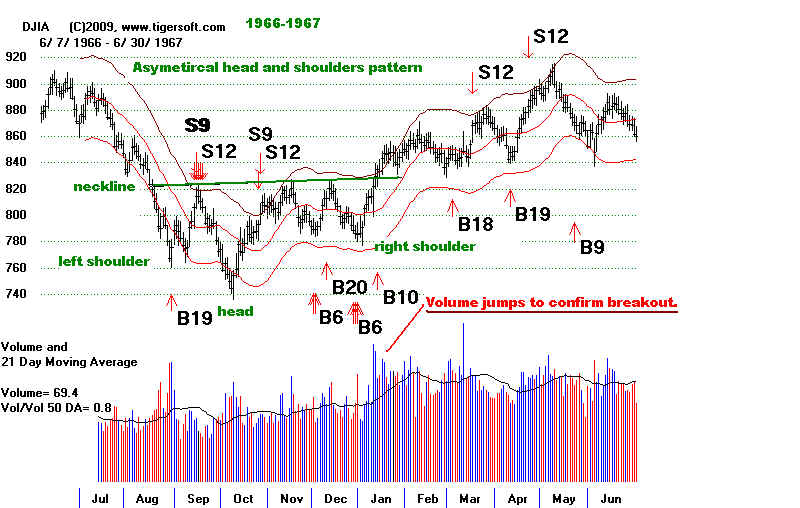
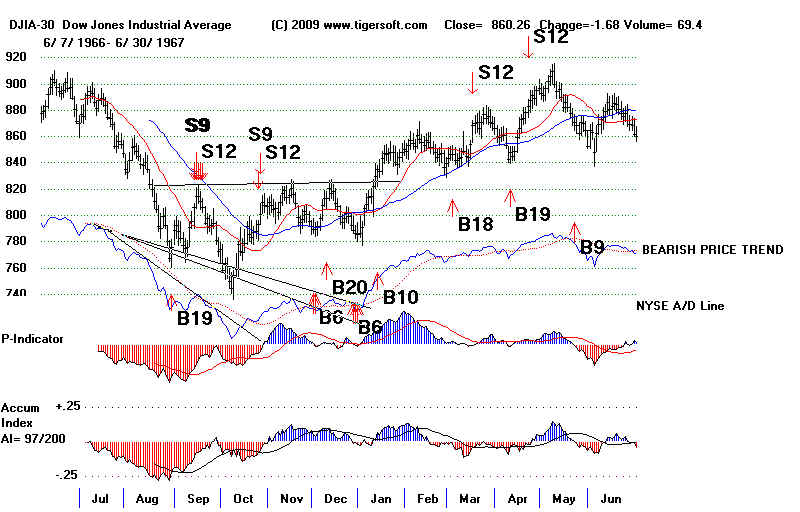
1966-1967
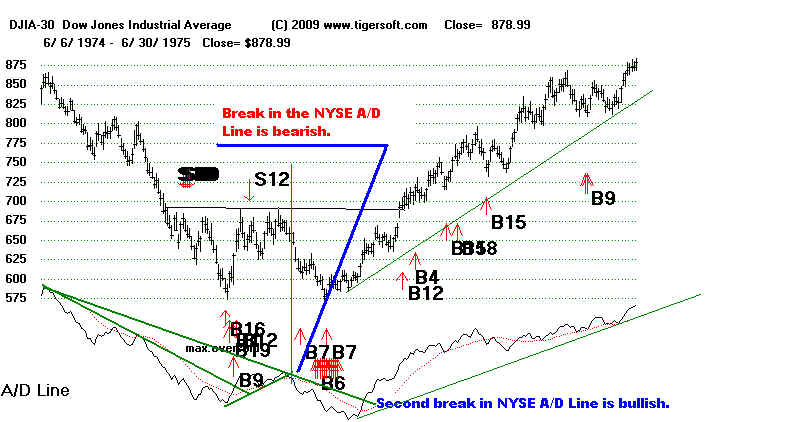
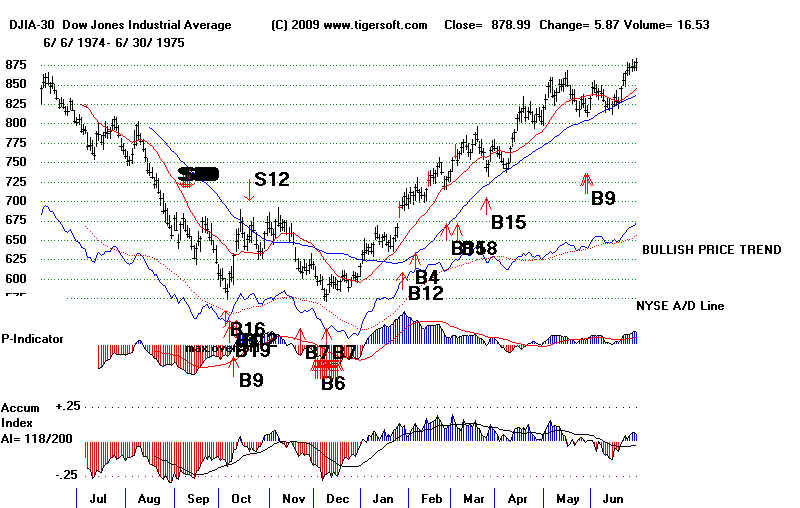
1974-1975
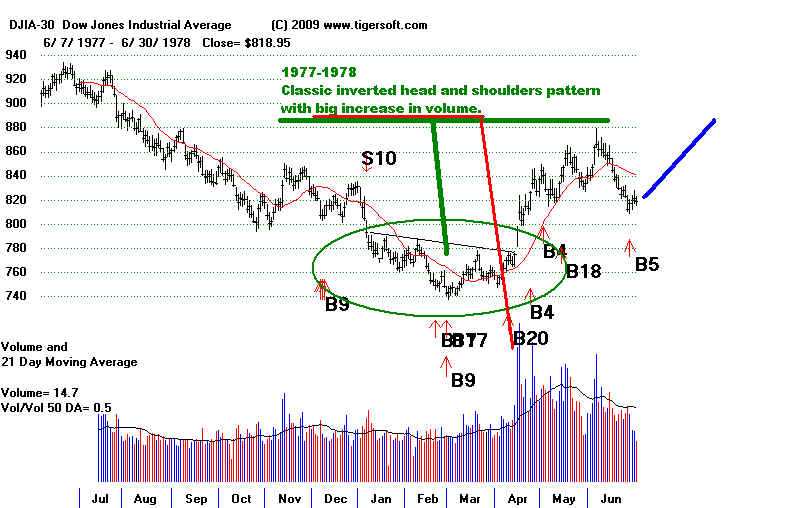
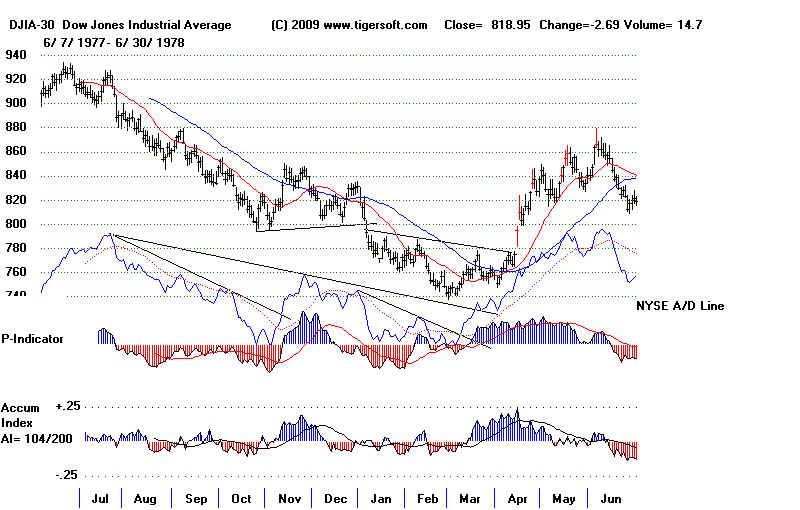
1977-1978
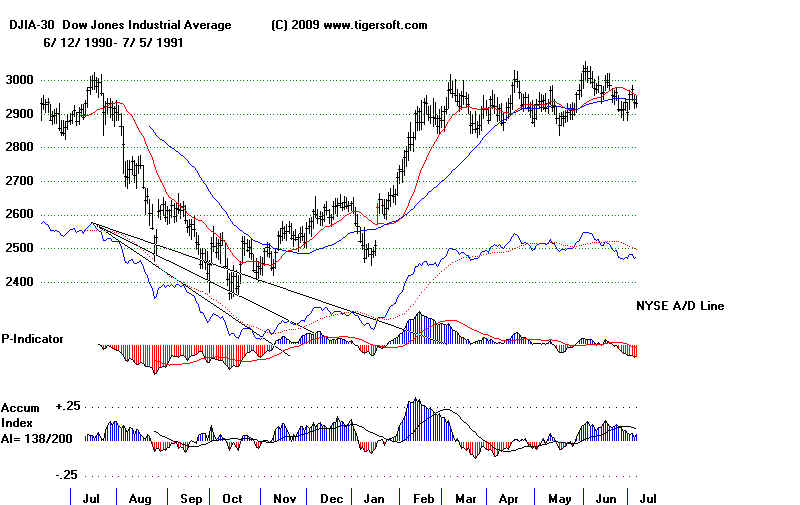
1990-1991
2003-2003
|
 TigerSoft
News Service 5/3/2009
www.tigersoft.com
TigerSoft
News Service 5/3/2009
www.tigersoft.com