TigerSoft
News Service 3/1/2009 www.tigersoft.com
TigerSoft
News Service 3/1/2009 www.tigersoft.com Lessons of The 1930s: Part 1
Calling Bottoms in The DJI 1929-1938
This study shows show one might have called a bottom
in the DJI correctly in the period 1929-1938 after the
DJI was in a bear market that brought a decline of
more than 40% in 12 months. That is the condition
now that the DJI currently is in.
Part II will show how one might best have traded the
rallies after bottoms were made in the period 1929-1941.
Revised Peerless Software Will Be Posted
on Elite Subscriber Page
by William Schmidt, Ph.D.
 |
Tiger
Software
Research on Individual Stocks upon Request: Composite Seasonality Graph
|
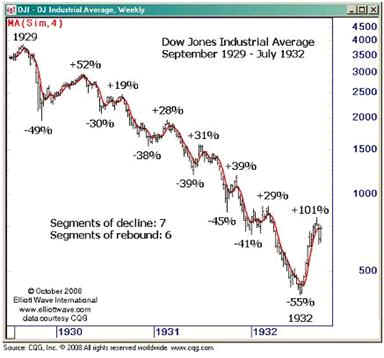
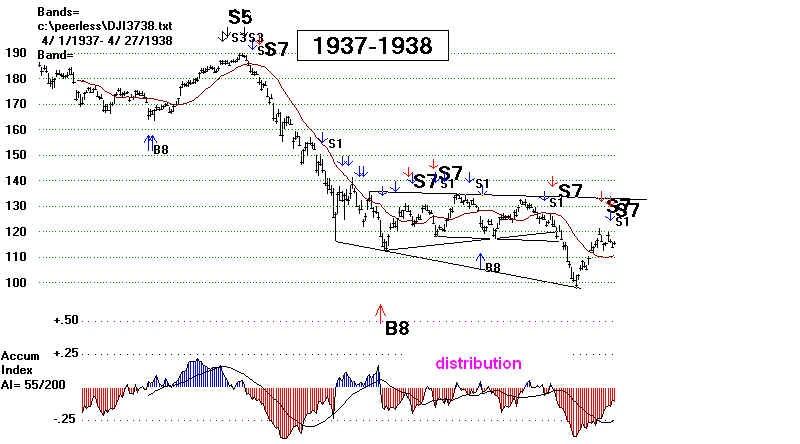
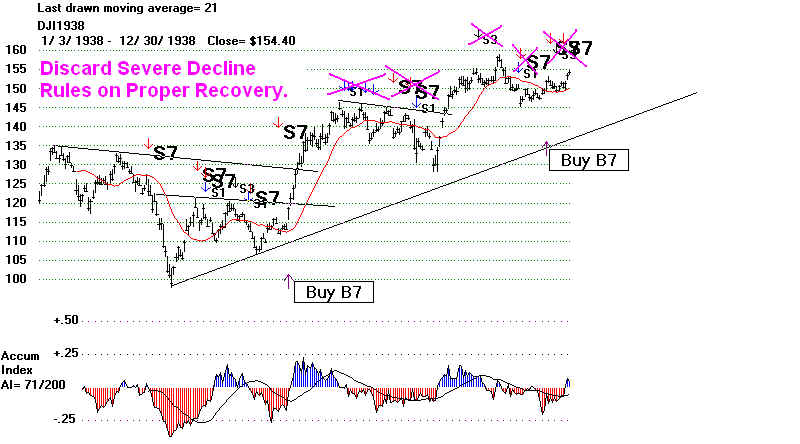
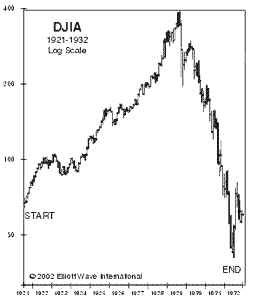
Calling Tops and Bottoms in A Severe Bear Market INVESTING IN AN EXTREME BEAR MARKET How Much Lower? Is it Too Late To Sell? The DJI is now (3/2/2009) down 52.2% from its all-time high. The DJI also reached this degree of decline on 11/6/1930. The DJI then stood at 182. It did not bottom out until 7/8/1932 at 41.20. How Different Are The Market's Technicals Now? What are the best technical tools to use now? Obama Is no Hoover. But Obama is also no FDR! Now we have an integrated global economy. Will stimulated Americans buy just buy Chinese manufactured goods? Market tops are certainly predictable as or soon after they occur. The TigerSoft charts below show the unusually heavy distribution and insider selling that occurred in the middle of 1929 as the market approached what was to be a high that was not to be execced for 25 years. In additon, there was a clear head and shoulders pattern. The combination of so much red distribution shown by TigerSoft's Accumulation Index AND prices very over-extended and uncorrected was very bearish. Prices had run up more 300% in the prior 8 years. At the very least, trend-traders should have sold when the steep uptrendline was broken. To make matters worse, big declines often take place in the September-October period. Add to that 5% down margin requirements and one can see the powder-keg the market was sitting on in September 1929. Peerless users who are familiar with the long period of bearish divergences between the DJI and the NYSE A/D Line in 1972 and again in 1999 before the 1973-1974 and 2001-2993 bear markets must wonder what the NYSE A/D Line must have looked like in 1928 and 1929. Severe Bear Markets Are Different Than Any Seen between 1942 and 2007 The Peerless that worked so well from 1942-2008 would not probably have worked very well in the 1929-1937 period, though we can't be totally sure, because there is no daily data on the number of NYSE advancing and declining stocks or their trading volume and Peerless needs that. What we can readily see is that the declines were a lot steeper in the 1930s and volatility was much higher. The DJI fell 89% from its 1929 high to its 1932 low. It fell 47% in just two months in 1929. The 1937-1938 decline was 48% from top to bottom. And the DJI fell more than 38.5% from each of its 12 month highs in 1929, 1930, 1931, 1932 and 1937. Such weakness did not occur after 1942. The deepest bear market after 1942 was from January 1973 to December 1974, a decline of 46.2%. The sharpest 10-week panic was in 1987 when the DJI plunged 36.2%. After 1942, the deepest declines from a peak withn a year to a low was between October 1973 and October 1974 when the DJI fell 40.7%. We can use the extremes of weakness for the period from 1942-2007 to set parameters. That is what the Standard Peerless Buy B16 did. But when the weakness exceeds these parameters we need to go back to the 1930s experience. On 11/20/2008 and again on 2/17/2009 (and since), the DJI fell more than 40.7% from its peak to a low. We have to look back to the 1930s to find parallel cases. When we do that we see that the some of the 1942-mid-2007 Buys do not work well and need to be changed when the market enters this new realm of extreme weakness. Poor Track Record of Standard B16s from 1929-1937 October 1929 299.50 200 33% paper loss June 1930 226.60 212 7% paper loss October 1930 186.40 158 11% paper loss December 1930 157.50 bottom April 1931 147.90 122 18% paper loss September 1931 110.80 88 20% paper loss November 1931 87.90 76 13% paper loss April 1932 66.50 41 35% paper loss May 1932 53.10 41 22% paper loss October 1932 59.80 bottom September 1937 147.20 115 21% paper loss November 1937 115.80 bottom March 1938 100.90 bottom Sell S6s As Warnings
Buy and Sell Signals for A
"Severe Bear" Market. |
||||||||||||||||||||
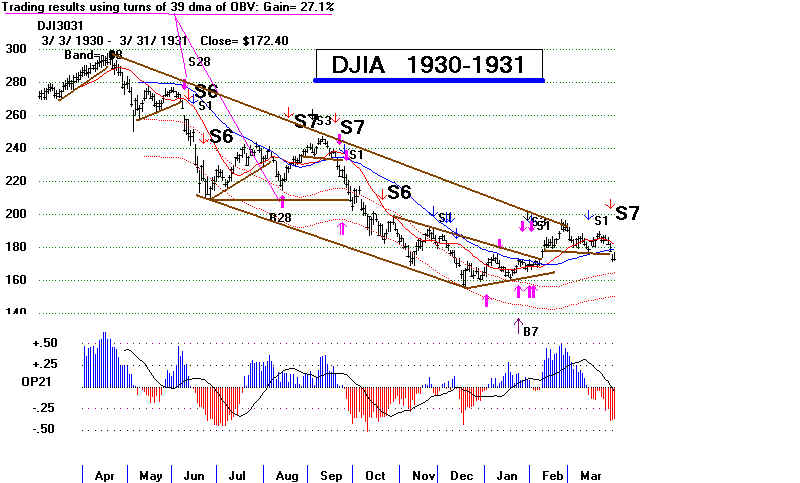
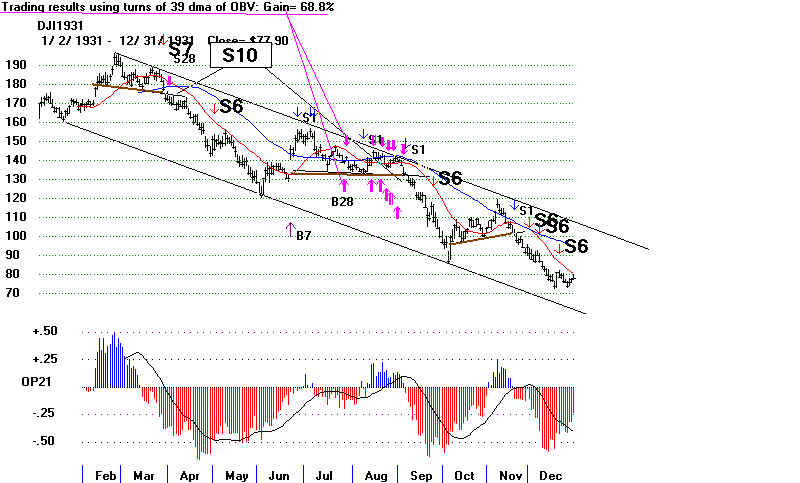
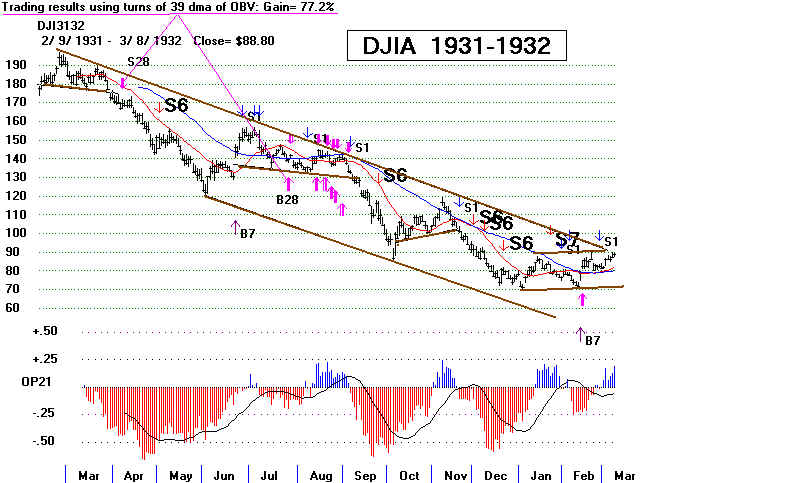
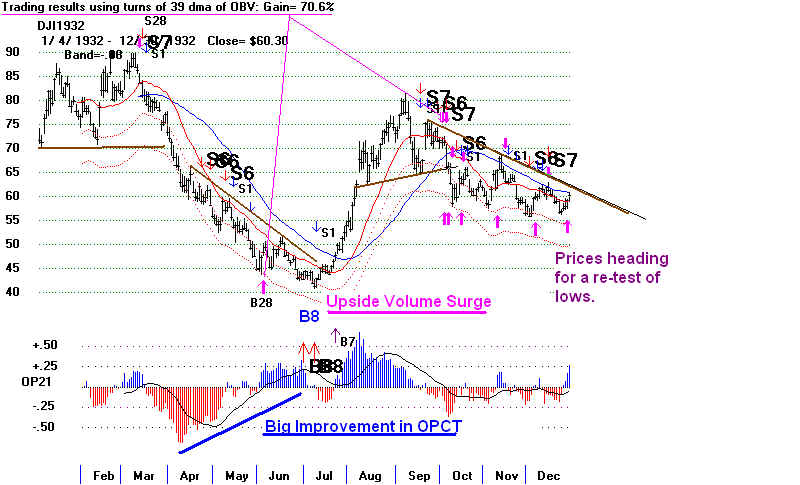
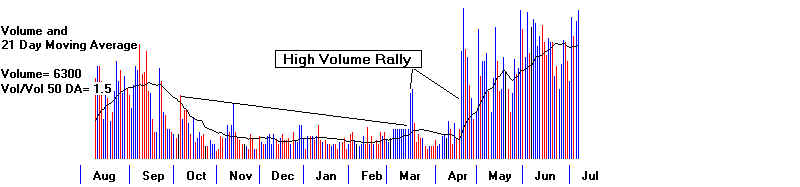
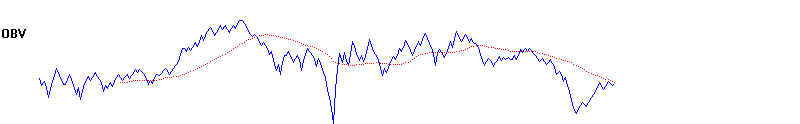
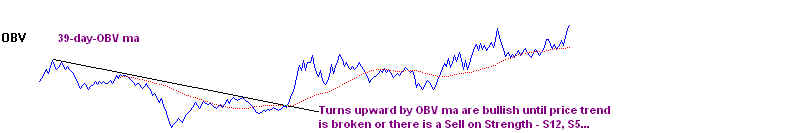
1929 Sell S12 signals would have called the top in September 1929. The had been months of red insider selling and distribution before the head and shoulder pattern broke down. Has one used the normal Buy B12 after the breakdown, it would habe been premature. The fact that the decline took the DJI down more than 38.5% fromthe high should have been a warning not to use the normal B12 that worked well from 1942 to 2008. In addition, note the very bearish Sell S6. This - which denotes the big money wants out and is ready even to sump into a a rally of 2.45% up that might normally be expected to bing a further rally. 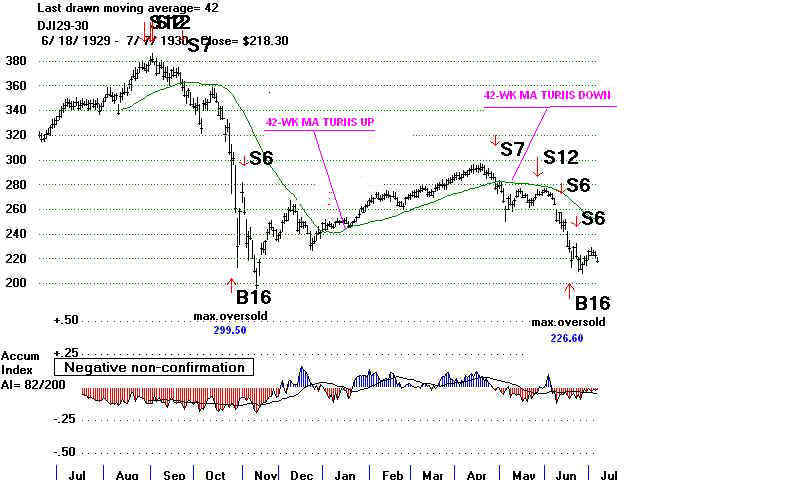 The DJI's 1929 collapse took it down well below the 40%-in-a-year level that indicates extreme weakness. The Buy B16 represents at 30% level below the 21-day ma. This is considered the maximum likely decline. The turning up of thr 39 week ma of OBV is considered a Buy B28. The rally recovers almost 50% of what was lost in the Crash of 1929. A series of sell signals tells is the rally is over and we should sell short again. Sell S5 Sell S7 Sell S1 Sell S6 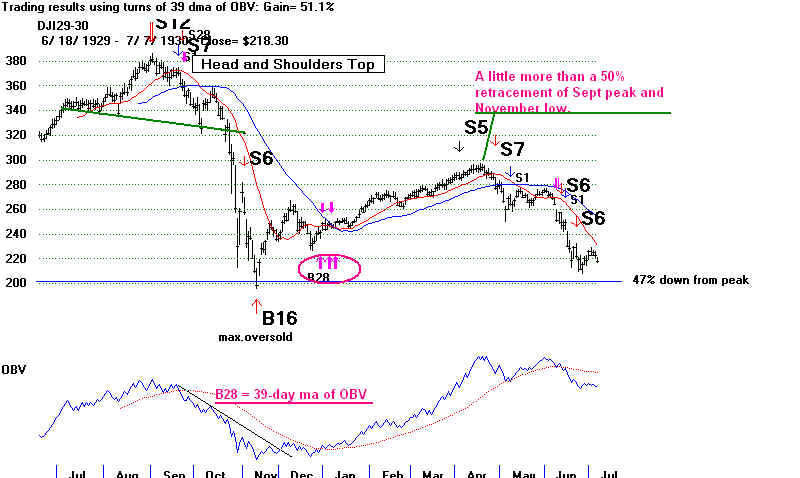 |
||||||||||||||||||||
1930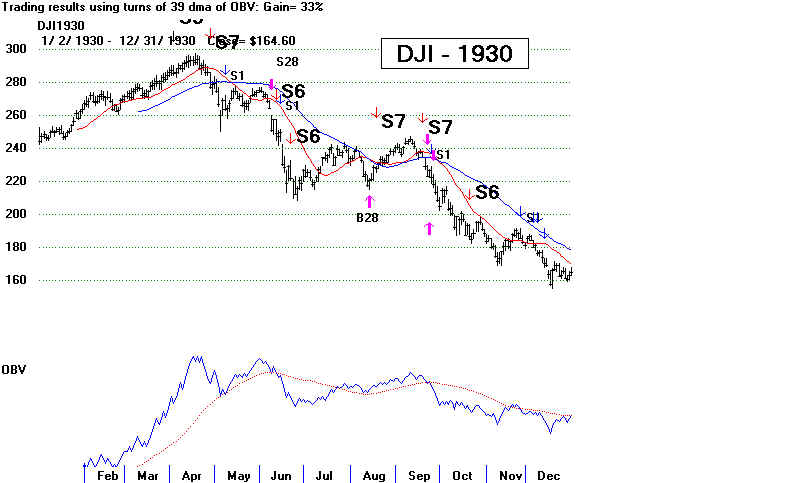 |
||||||||||||||||||||
|