 |
NYSE A/D LINE BEHAVIOR |
How Will We Call The Next Top?
Expect Peerless to give a Sell signal before the DJI falls more than 8% from its high.
That is what happens over and over again since 1929. Sell S9 signals and extreme
divergences between the NYSE A/D Line and the DJI are the most frequent signal
of a top. Watch also for Sell S12 signals, which arise fromt he Accumulation Index
being negative as the DJI approaches the upper band, There are a few other major
Sells that can bring a significant top, notably S4s, S8s and S10s (which are usually
completed head and shoulders patterns), But what happens if there is no Sell signal?
What should we look for? We should be watching the NYSE A/D Line. History suggets
that a break in its uptrend-line will change the complexion of the market for the worse
very quickly. We can get an idea of this by looking at six cases of nascent bull markets,
from among quite a few we might have looked at.
What Will Happen if the NYSE A/D Line's Uptrend Is Broken?
A break in an A/D Line uptrend, so long as the uptrend did not last more than a year, brought
at least a testing of the DJI's key support and the lower band. If the key support failed, the DJI
went lower. It fell much more in 2002 when there were additional Peerless Sells than in 2004,
when the DJI was steadied by the dynamics of a Presidential Election year and a quick recovery
in the NYSE A/D Line. An A/D Line that rights itself quickly after its trend is broken, is apt to
experience a much shallower decline. That is what happened in 1958 and 2004. Weakness
in th A/D Line after its uptrend is broken, ia apt tp lead to much more weakness if the DJI's
key support is broken. The 2002 experience shows the dangers.
Declines from Top A/D Line Trend
1933 22% 7/18/1933 top 108.70 Bottom at 84.40 on 10/19/1933 Down-trending
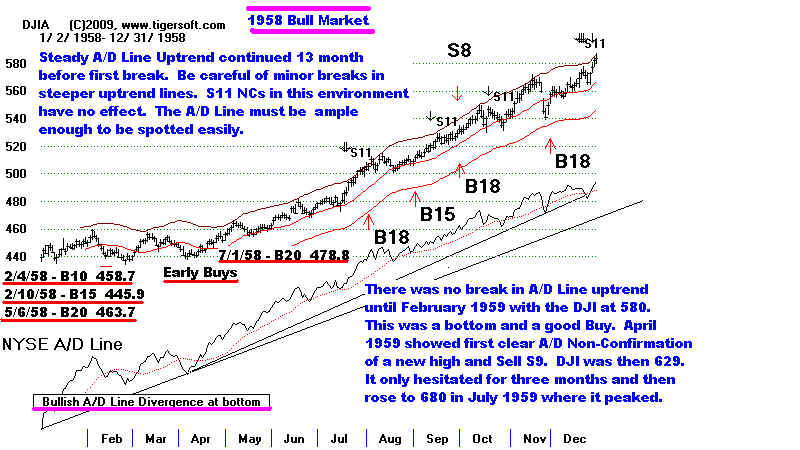
1958 5% 11/17/1958 top 567.40 Bottom at 544.90 on 11/24/1950 Up-Trend Continues
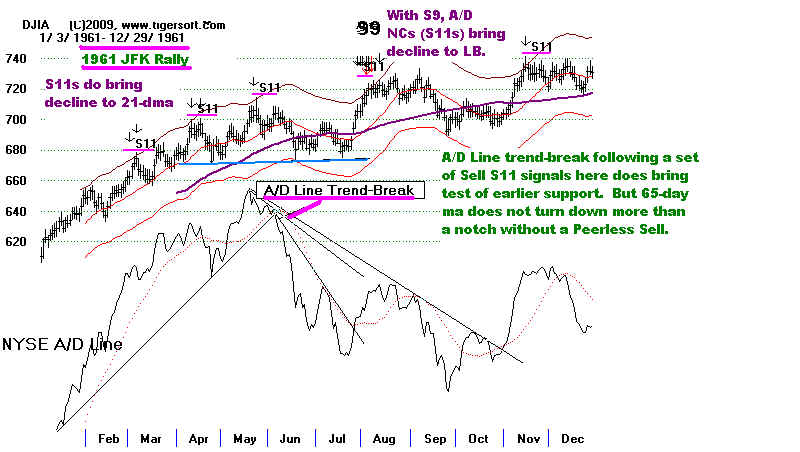
1961 5% 8/21/1961 top 724.70 Bottom at 691.90 on 9/25/1961 Down-trending
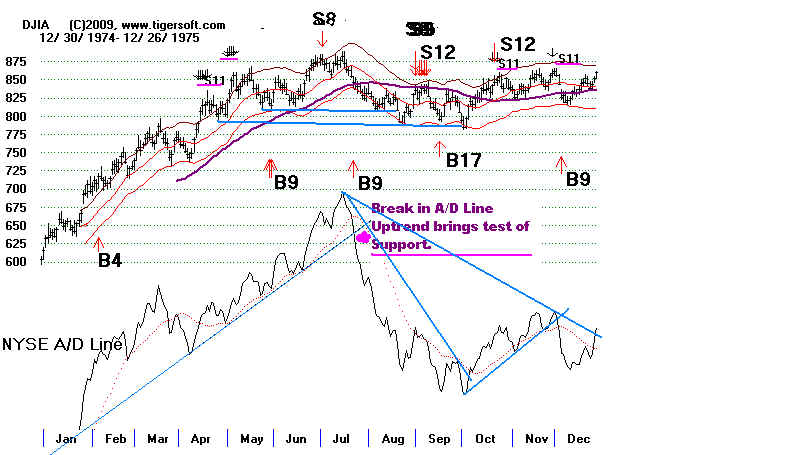
1975 11% 7/15/1975 top 881.81 Bottom at 784.16 on 10/1/1975 Down-trending until October
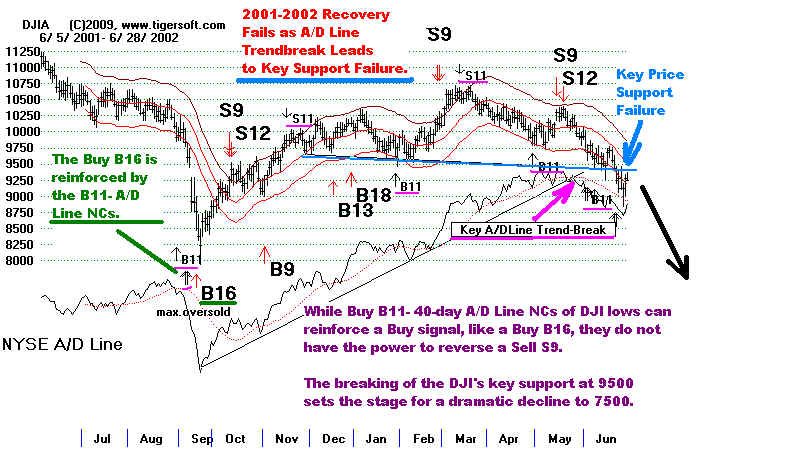
2002 32% 3/15/2002 top 19607.23 Bottom at 7286.27 on 10/9/2002 Down-trending until October
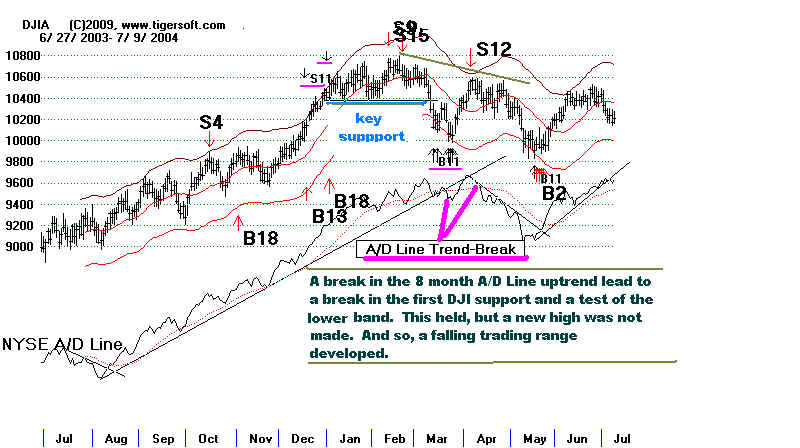
2004 9% 2/17/2004 top 10714.88 Bottom at 9749.99 on 10/25/2004 Down-trending until May
Rally ended with A/D Line Trendbreak.
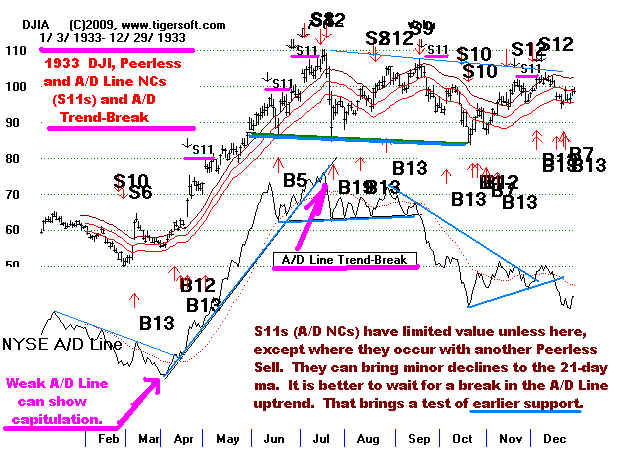
Waiting for Serious A/D Line NC and Break in Underlying A/D Line Uptrend. Year-Long A/D Line Uptrends Become More Resilient
the longer they last. Minor Breaks in Them are less significant.
Minor 40-day Sell S11 A/D Line NCs did bring declines to the
rising 21-day ma. And when the A/D Line uptrend was violated
there was a test of support. A tets of the lower band did not
occur until there was a Peerless Sell.
The Peerless ell S8 at the top leads to a break in the A/D Line.
Since the Buy B9 is based on good breadth, which starts
almost immediately to falter badly when the A/D Line uptrend is broken, the failure of the Buy B9 to stop the decline should not be surprising. The decliune does stop at the DJI's price support.
month NYSE Uptrend A/D Line brought a break in the key price support despite minor B11-40-day A/D Line NCs.
range throughout most of 2004. The minor Sell S11s did not
help here. The minor B11s at the lower band did bring a
rally since the A/D Line uptrend was either not violated or
later there was a Buy B2 also.