TigerSoft News Service 2/5/2010
Visit our www.tigersoft.com
TigerSoft News Service 2/5/2010
Visit our www.tigersoft.com
TREND-BREAKS IN RECOVERY RALLIES
FROM SEVERE BEAR MARKET BOTTOMS
1930, 1932, 1933, 1937, 1938, 1971, 1975, 1984 and, 2002
by William Schmidt, Ph.D. (Columbia University)
(C) 2008 All rights reserved. Reproducing any part of this page without
giving full acknowledgement is a copyright infringement.
 |
Tiger
Software Helping Investors since 1981
|
FROM SEVERE BEAR MARKET BOTTOMS
Most of the time, a break in a well-tested NYSE A/D Line uptrend occurs within
a year, usually much sooner, and a then significant decline then starts. This is seen
in nine cases: 1930, 1932, 1933, 1937, 1938, 1971, 1975, 1984 and, 2002. Now
2010 shows a break in its well-tested A/D Line uptrend. We can use this past
data to see what factors occur when a break in the A/D Line uptrend takes place
and a decline of more than 10% follows. We can assume that the more of these
bearish elements are seen in early 2010, the more bearish this new year will be.
Consider that the cases where the key values (P-I, IP21 and Opct) are closest to the
current cases. And consider also that the average decline is18.8% from the point of
breakdown in the A/D Line uptrend to its lowest levels in the next 4 months.
The current does show a Buy B17. These work out profitably more than 90% of the time.
However, the A/D Line trend-break in these curcumstances should nullify that Buy B17,
based on the bearishness of such trend-breaks,
Subsequent Buy signals soon after these A/D Line breakdowns are not all losses.
Here are the cases. Blue means the next Peerless Buy signal was 4 weeks or more
after the A/D Breakdown. Red shows those cases where next Buy was within 4 weeks
of A/D Breakdown.
CONCLUSION: Looking at all these cases shows that waiting a month for a Buy
after an A/D Line uptrend break gives the A/D Line weakness a better chance to
play itself out and show what bearishness it contains. This strategy would have
eliminated the terrible 1937 case and achieved a better buying point in 1938, while
losing only one chance to garner a +5.4%gain.
A/D Trend-Break Next Ordinary Peerless Buy Next Extreme Bearish ModePeerless Buy
DATE DJIA DATE DJIA SIGNAL DATE DJIA SIGNAL
4/15/1930 293.30 9/19/1930 229.00 B9 -6.9% Appropriately no Buys
(At 220 DJI falls back below 220
level for S5 under extreme bearish mode rules.)
9/19/1932 76.20 10/19/1932 65.7 B17 +7.6% Appropriately no Buys
7/19/1933 103.60 7/24/1933 94.3 B19 +5.4% 7/21/1933 88.70 B8 -3.2%
8/17/1937 188.70 8/30/1937 177.9 B7 -11.2% Appropriately no Buys
Down more than 20% in 8-weeks.
Do not Buy until DJIA's 21-dma flattens.
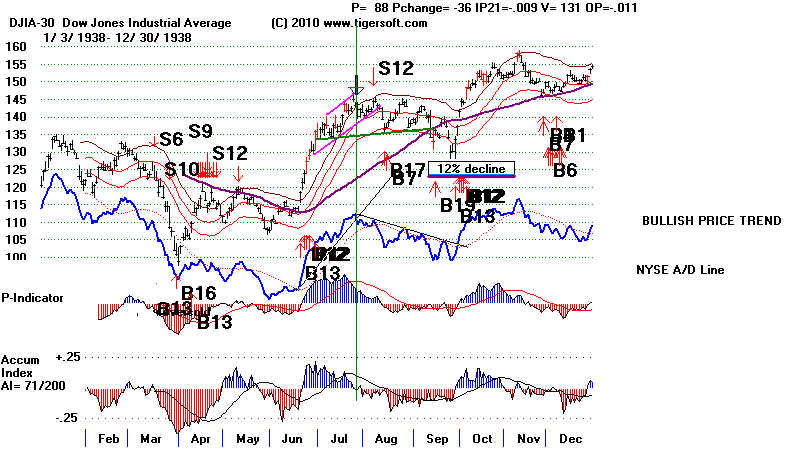
8/27/1938 140.20 9/15/1938 136.2 B19/B17 Gain! Wrong - No buys.
Additional decline to 130.20
9/18/1938 133.70 Big Gain!
5/6/1971 939.39 8/16/1971 888.95 B13 +1.2% 8/16/1971 888.95 B8 +0.3%
7/23/1975 836.67 9/16/1975 795.13 B17 +6.5% 9/19/1975 829.79 B20 -1.3%
1/23/1984 1244.45 5/21/1984 1125.31 B17 +9.8% Appropriately no Buys
5/28/2002 9981.58 7/24/2002 8191.29 B19 +6.4% Appropriately no Buys
1/25/2010 10196.86 no subsequent Buys yet
---------------------------------------------------------------------------------------------------------------------------------------------
Avg. +18.8%
1/25/2010 10196.86 +130 +124 .009 .11 open...
---- Point of A/D Line Uptrend Break DJI --- ------- Subsequent 4 MO Low ------
DATE DJIA P P-Adjusted IP21 Opct DATE DJIA Pct Decline
4/15/1930 293.30 +27 +134 .097 .609 6/24/1930 211.80 27.7%
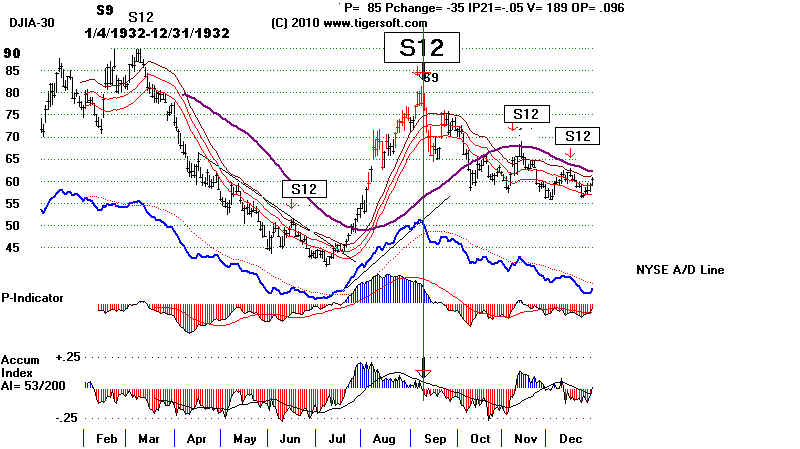
9/19/1932 76.20 +85 +412 -.05 .096 12/2/1932 55.90 26.6%
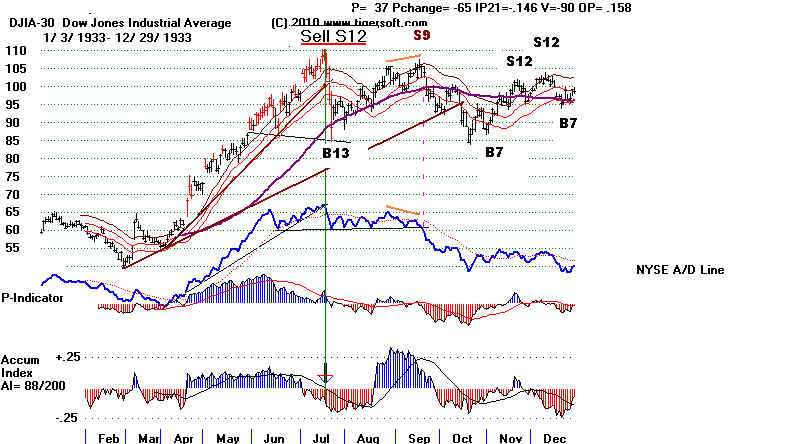
7/19/1933 103.60 +37 +178 -.146 .158 10/19/1933 84.40 18.5%
8/17/1937 188.70 -26 -120 .011 .016 11/23/1937 115.80 38.6%
8/27/1938 140.20 +88 +396 -.009 -.011 9/26/1938 129.90 7.3%
5/6/1971 939.39 +21 +61 .065 .364 8/10/1971 839.59 10.7%
7/23/1975 836.67 -18 -49 -.063 -.105 10/1/1975 784.16 6.3%
1/23/1984 1244.45 +45 +70 -.032 -.371 5/23/1984 1113.80 10.5%
5/28/2002 9981.58 +16 +101 .022 .12 9/24/2002 7683.13 23.0%
---------------------------------------------------------------------------------------------------------------------------------------------
Avg. +18.8%
1/25/2010 10196.86 +130 +124 .009 .11 open....................................................
(P-Adjusted = P + (1 + ((2009-year)/80 * (2009 NYSE companies traded/1929 NYSE companies traded)
where year is year of data to be adjusted. In 1929 there were approximately 600 different stocks
on NYSE. In 2009, there were approximately 3000. This was an increase of 2400 or a jump 400%.
So, a P-Indicator reading of +20, would in 2009 terms have been +100. The Peerless software
uses unadjusted P levels to produce certain signals. The current case's adjusted P-indicator readings
are most like 1930 and 2002. The IP21 readings in the 2010 case are most like 1937 and 2002.
Multiple bearish signs to be on watch for.
Red indicates high frequency.
1) Sell S9:
1937, 1971
2) Sell S12
1932, 1933, 1838, 1984, 2002
3) Sell S8:
1975
3) rising wedge pattern:
1930, 1984
4) Head and shoulders top:
1932, 1933, 1971
5) Last rally could not reach the upper band:
1937
6) Low volume rally:
1937, 1984, 2002
7) Break in well-tested A/D and price uptrendlines:
1930, 1932, 1933, 1937, 1971, 1975, 2002
8) Bearish A/D Line Divergence from Prices at top:
1938, 1984
9) DJI is unable on rebound to get past flat 65-day ma:
1930, 1932, 1971, 1975,
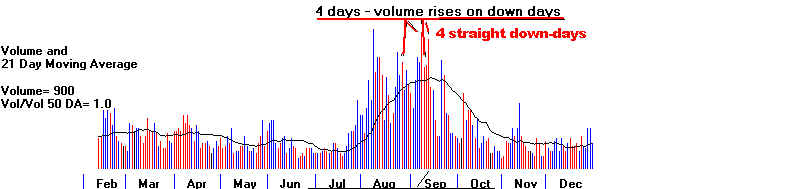
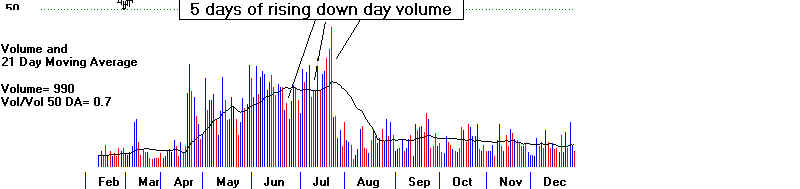
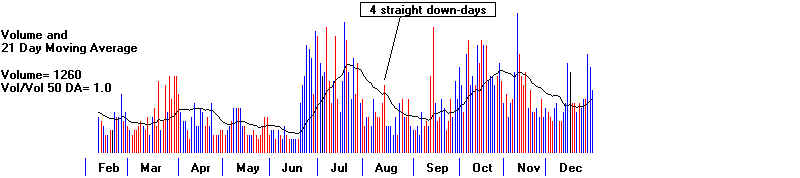
10) 4 or more instances of daily volume increasing on down days within a 2 weeks of A/D Line trend-break.
1930, 1933, 1937, 1971, 1975, 1984. 2002
11.) Weak A/D Line after penetration of its uptrend.
1930, 1932, 1937, 1938, 1971, 1975, 1984
12.) Four or more straight down-days.
1930, 1932, 1937, 1938, 1971, 1975, 1984, 2002
13). Prices quickly drop below AND stay below lower 3.5% band:
1932, 1933, 1937
| 1930 Multiple
bearish signs here: 1) rising wedge pattern 2) break in well-tested A/D and price uptrendlines 3) DJI is unable on rebound to get past flat 65-day ma 4) 4 instances of daily volume increasing on down days within 2 weeks of A/D Line trend-break. 5.) Weak A/D Line after penetration of its uptrend. 6.) Four or more straight down-days. Result: Depression. 80% DJI drop in next two years. 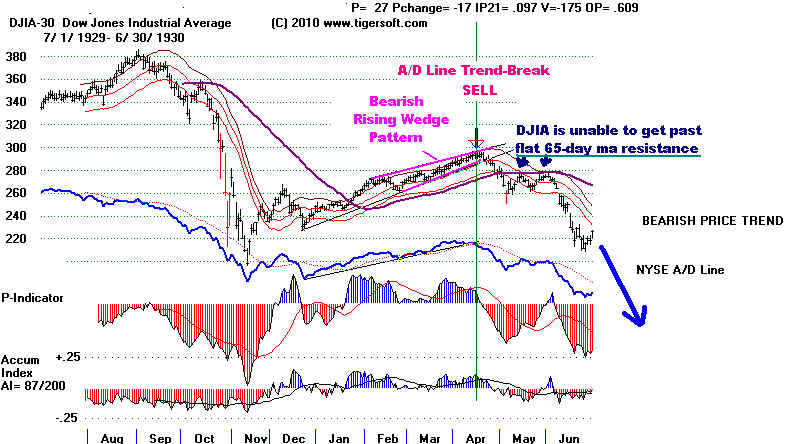 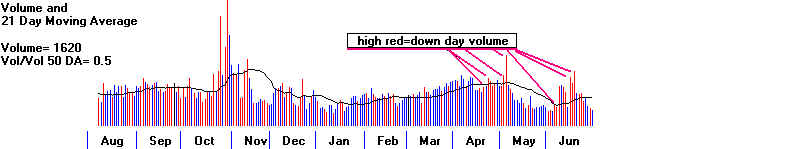
|
||
| 1937
: Multiple bearish signs here: 1) Peerless SELL S9 2) Last rally could not reach upper band. 3) Low volume rally 4) 5 instances of daily volume increasing on down days with a month of A/D Line trend-break. 5) Prices quickly drop below and stay below the lower band. 6) Five straight down-days. 7) Weak A/D Line after penetration of its uptrend. Result: DJI declined 40% from peak in 3 months. 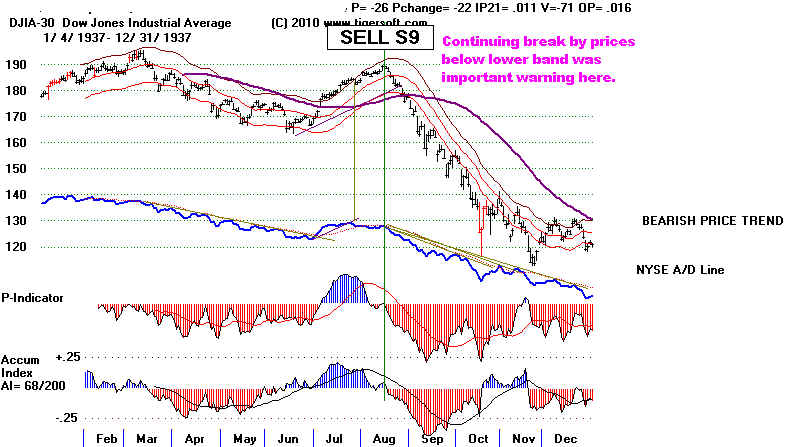 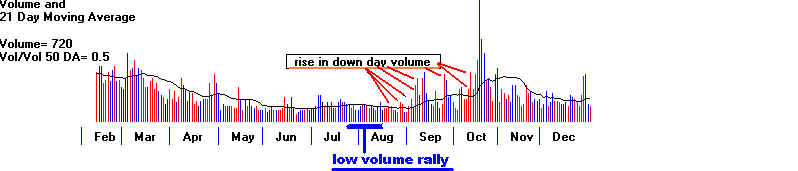
|
||
| 1971 Multiple
bearish signs here: 1) Sell S9 2) Head and Shoulders Top Pattern. 3) Break in well-tested A/D uptrendline. 4) DJI is unable on rebound to get past flat 65-day ma 5) 4 instances of daily volume increasing on down days within 2 weeks of A/D Line trend-break. 6.) Weak A/D Line after penetration of its uptrend. 7.) Four straight down-days. Result: DJI declines 16% from peak in 7 months. Nixon prevented much worse of a decline by taking US off the rigid Gold Standard in August. 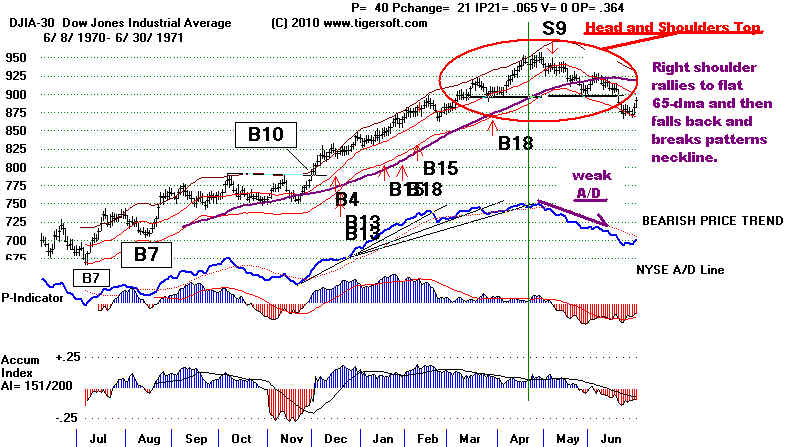 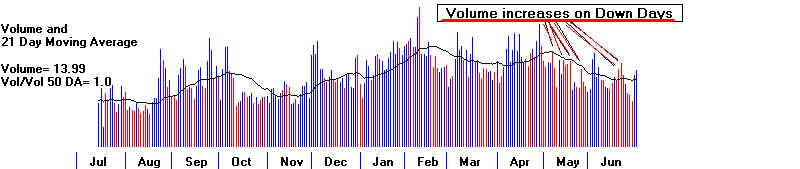
|
||
| 1975 Multiple
bearish signs here: 1) Sell S8 but then Buy B9 at lower band. 2) Break in well-tested A/D uptrendline. 3) DJI is unable on rebound to get past flat 65-day ma 4) 4 instances of daily volume increasing on down days within 2 weeks of A/D Line trend-break. 5.) Weak A/D Line after penetration of its uptrend. 6.) Five straight down-days. Result: DJI declined "only" 11% from peak in 3 months. 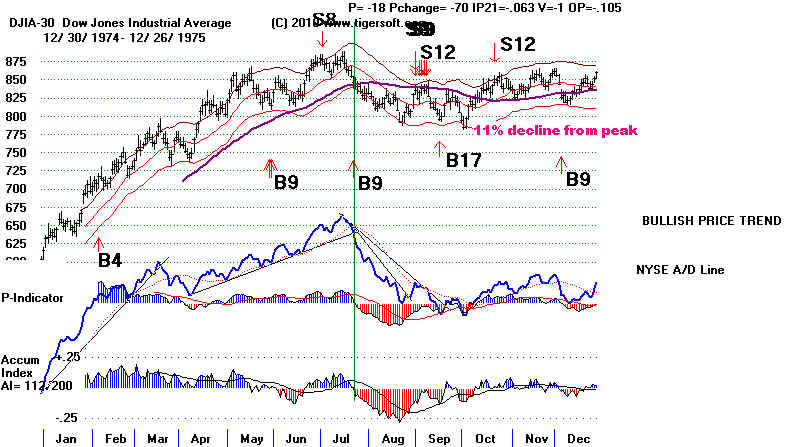 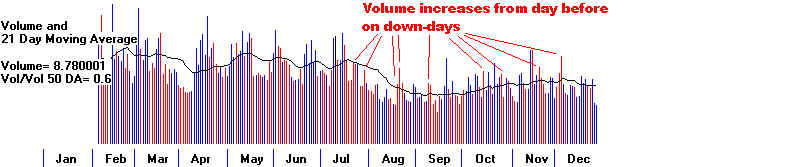 |
||
| 1983-1984
Multiple bearish signs here: 1) Sell S12 2) Bearish Rising Wedge 3) Break in well-tested Price uptrendline. 4) A/D Line failed to confirm last few highs. Bearish Divergence. 5.) 8 instances of daily volume increasing on down days within 2 weeks of A/D Line trend-break. 6.) 7 straight down days near top and just afterwards. 7.) Weak A/D Line after penetration of its uptrend. Result: DJI declined 16% from peak in 7 months. 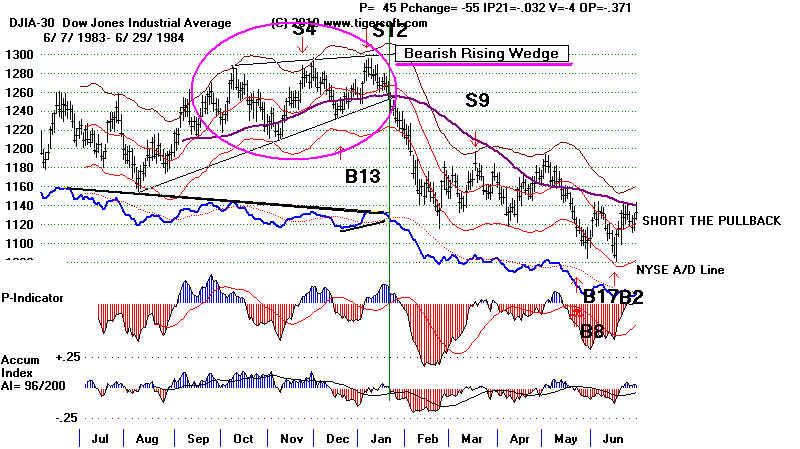 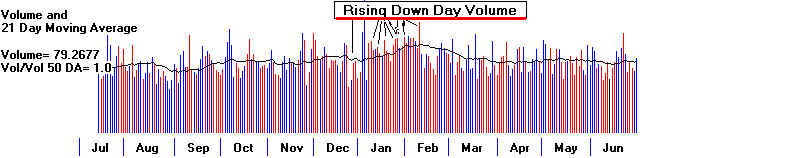 |
||
| 2002 Multiple
bearish signs here: 1) Sell S9 2) Sell S12 3) Break in well-tested A/D Line uptrendline. 4) 9 instances of daily volume increasing on down days within 2 weeks of A/D Line trend-break. 6.) 7 straight down days near top and just afterwards. A severe bear market immediately followed trend--break 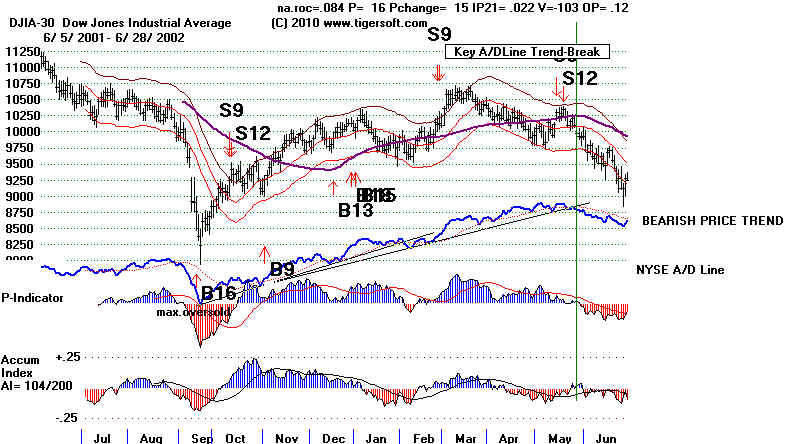 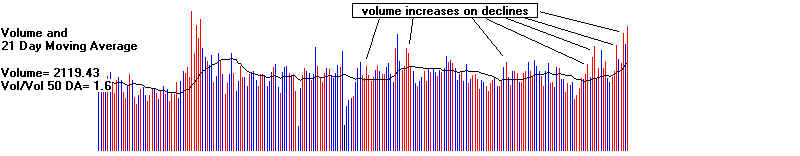 |