TIGERSOFT SUPER-B12s on WEEKLY CHARTS
                      
(C) 2010 William Schmidt, Ph.D.

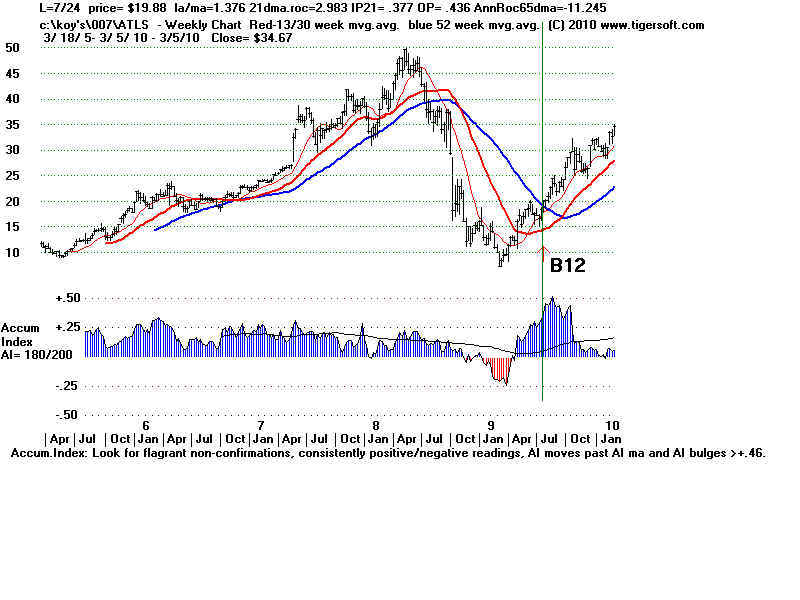
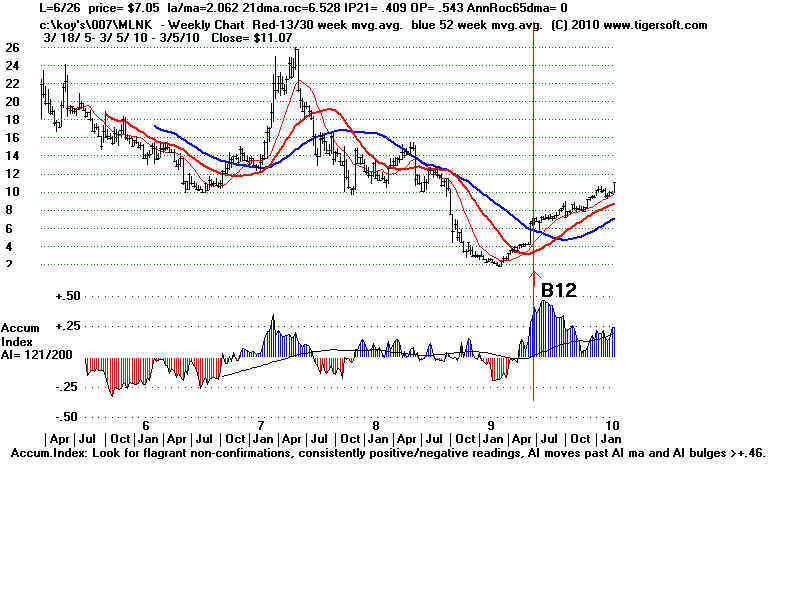
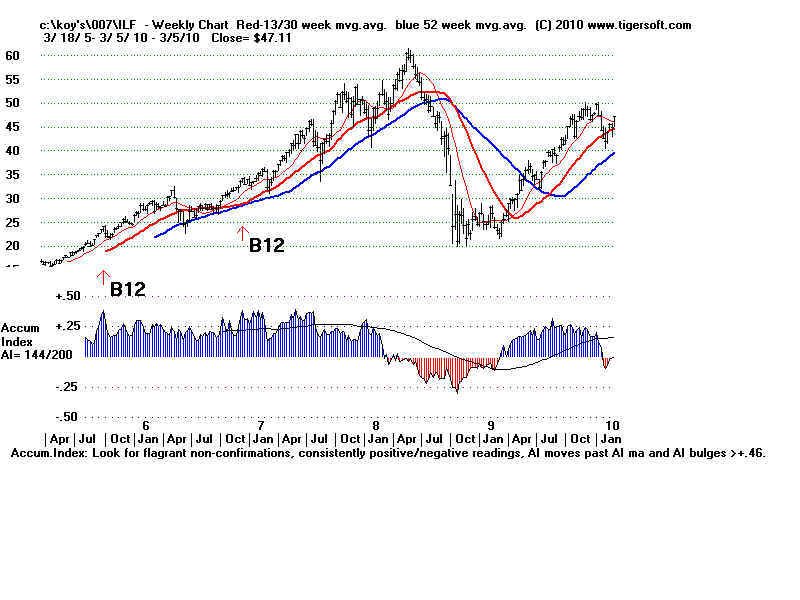
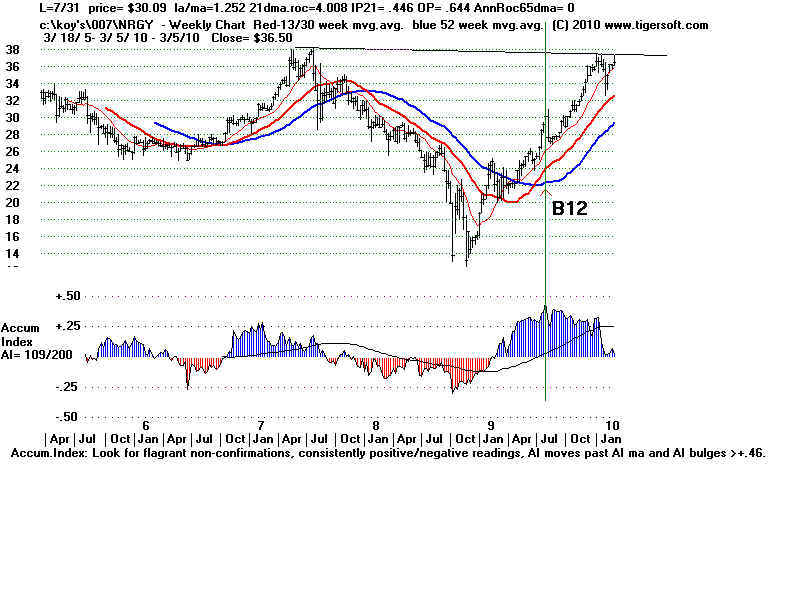
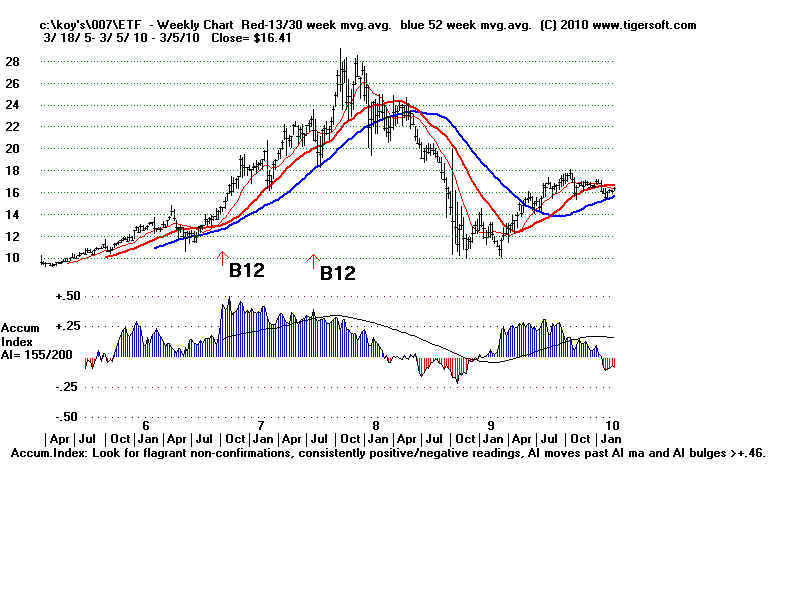
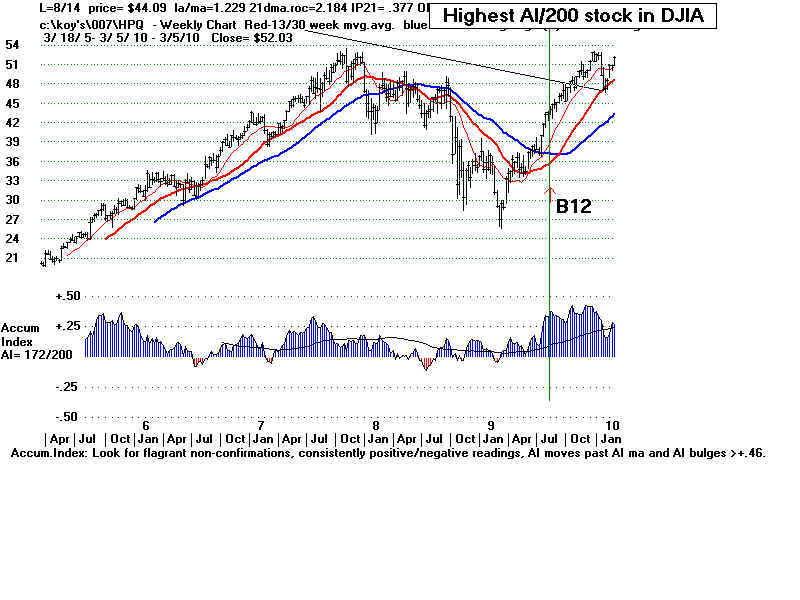
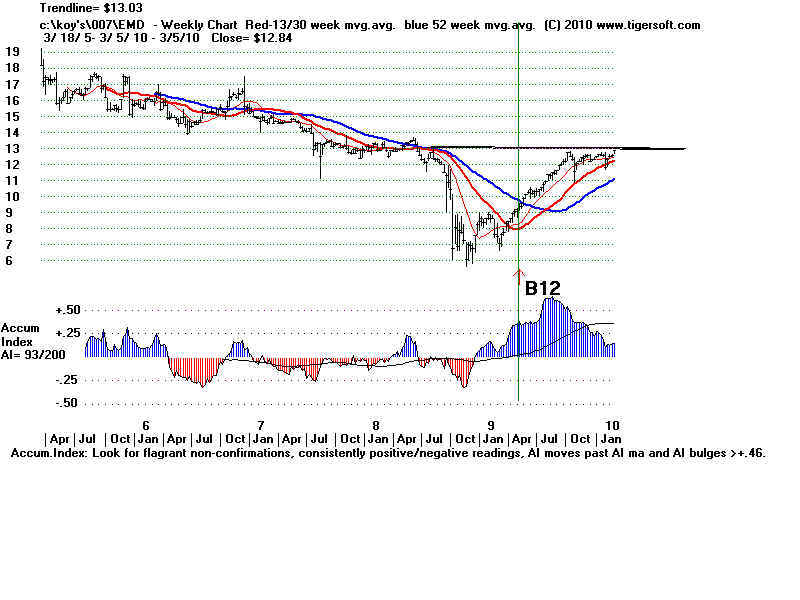
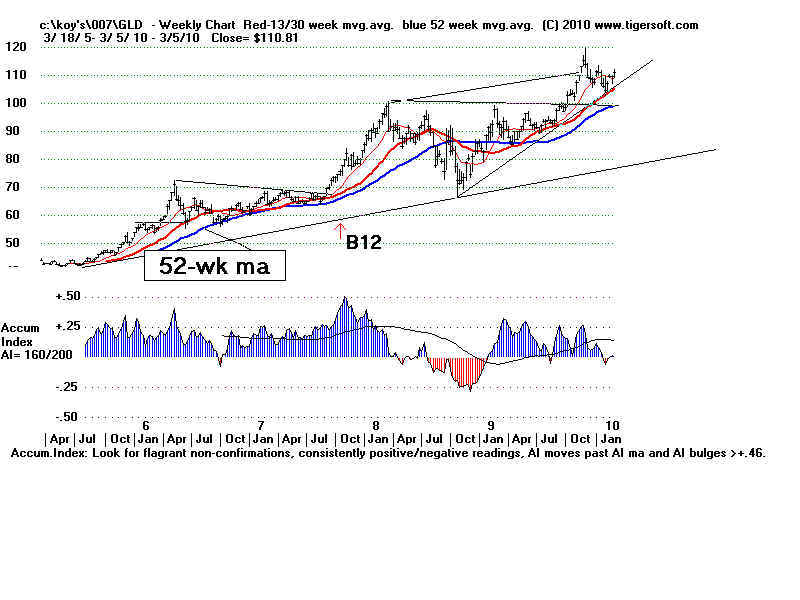
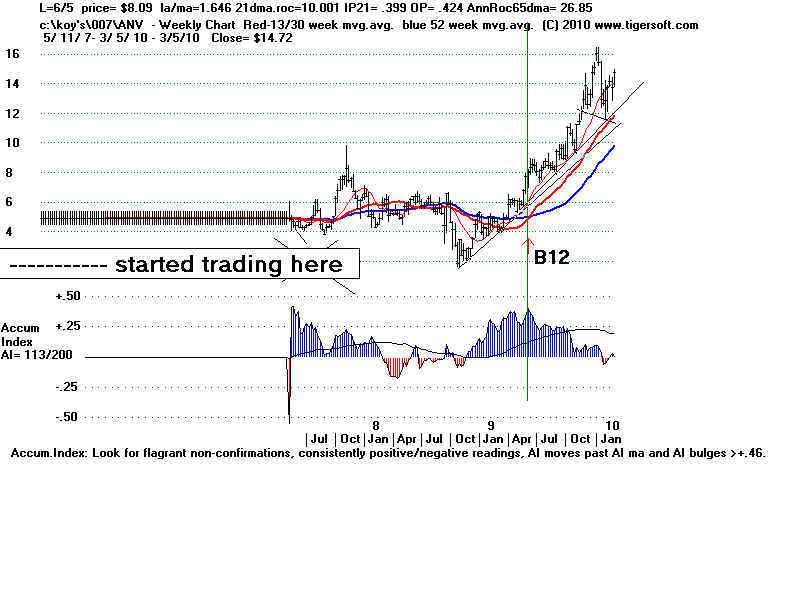
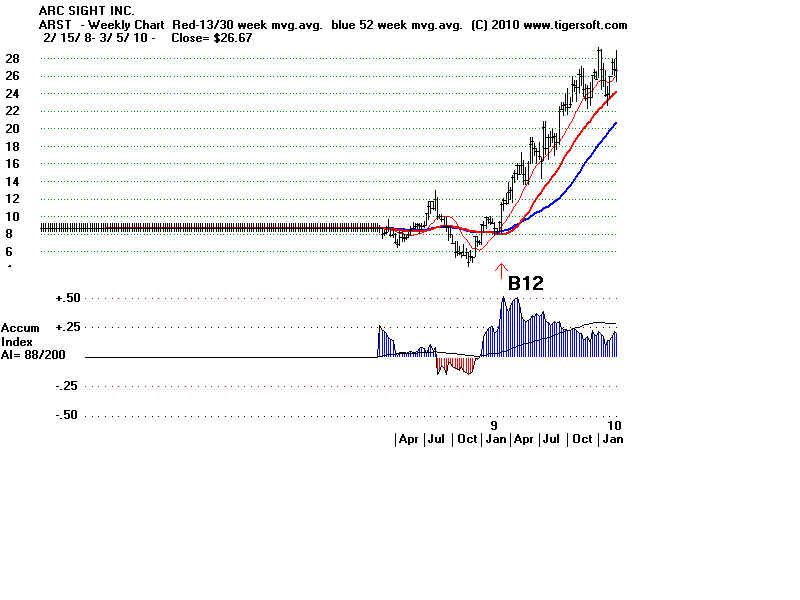
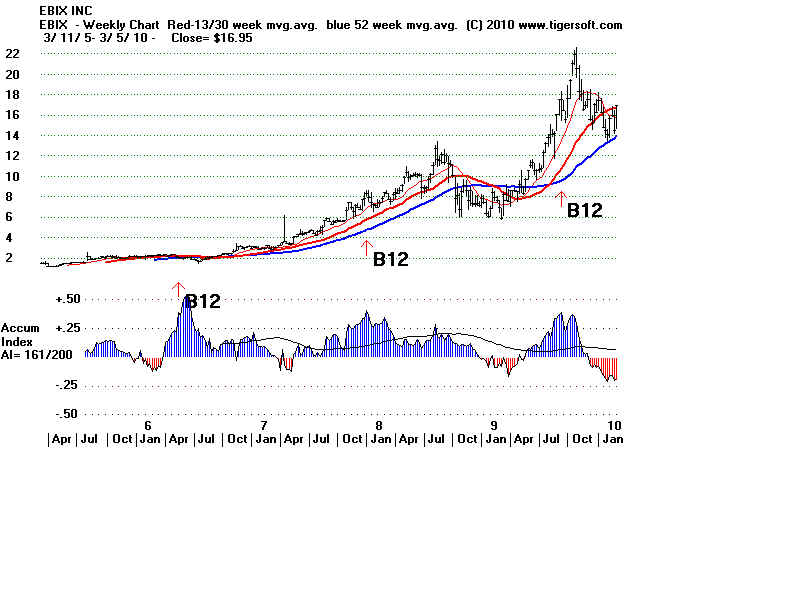
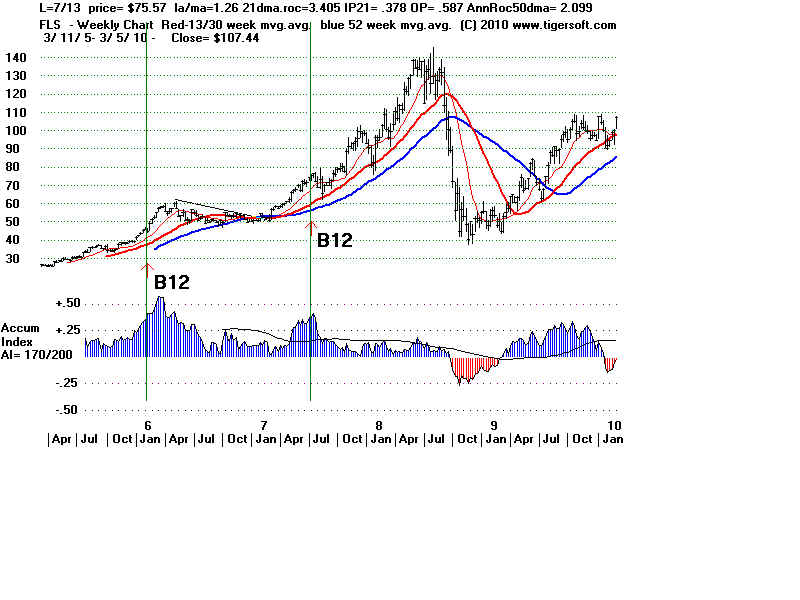
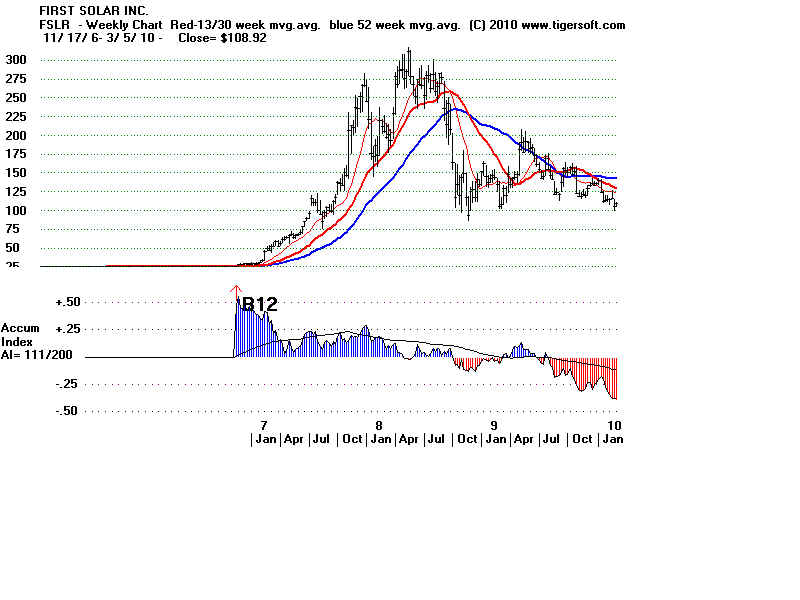
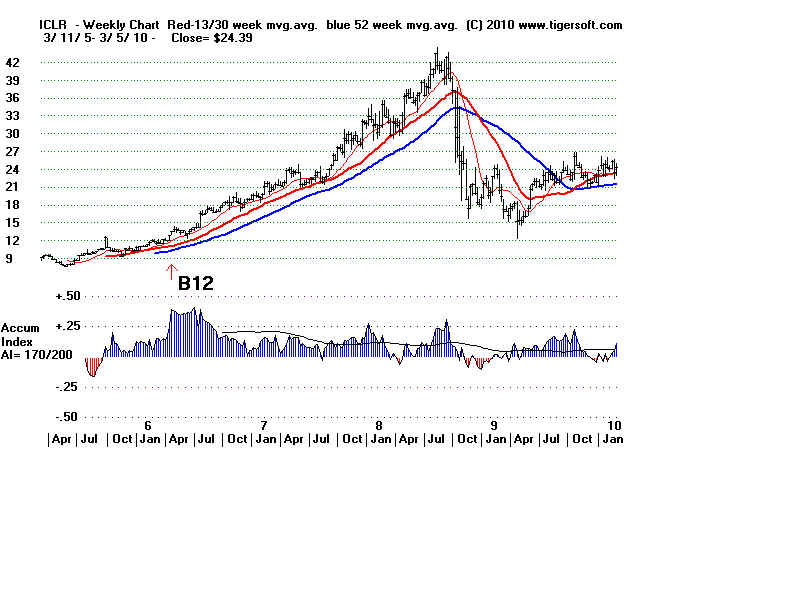
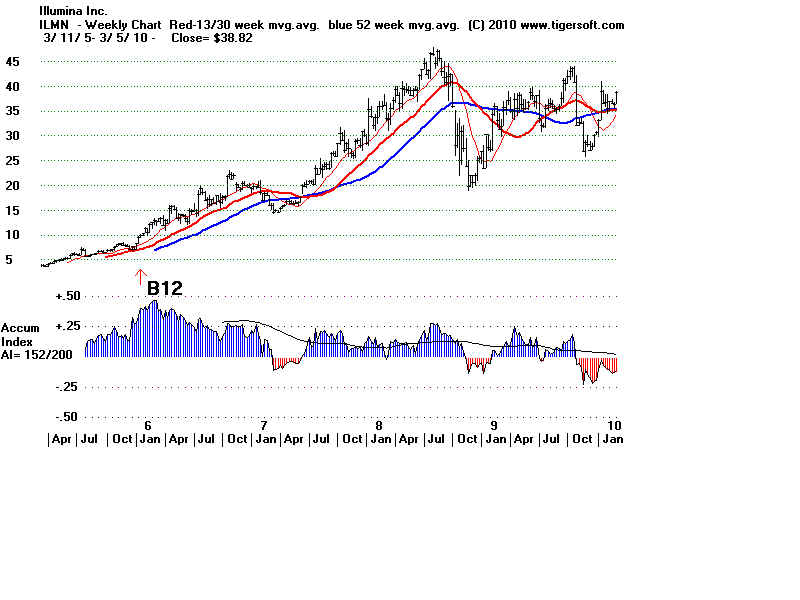
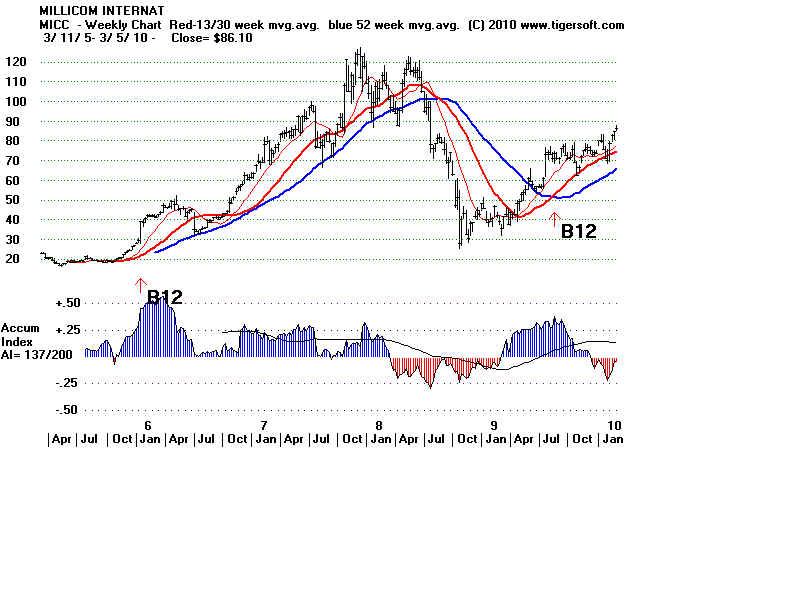
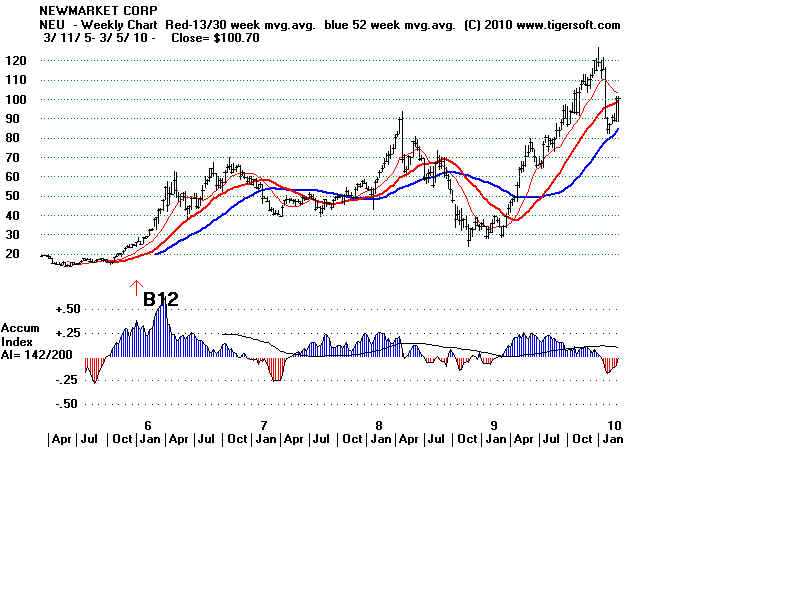
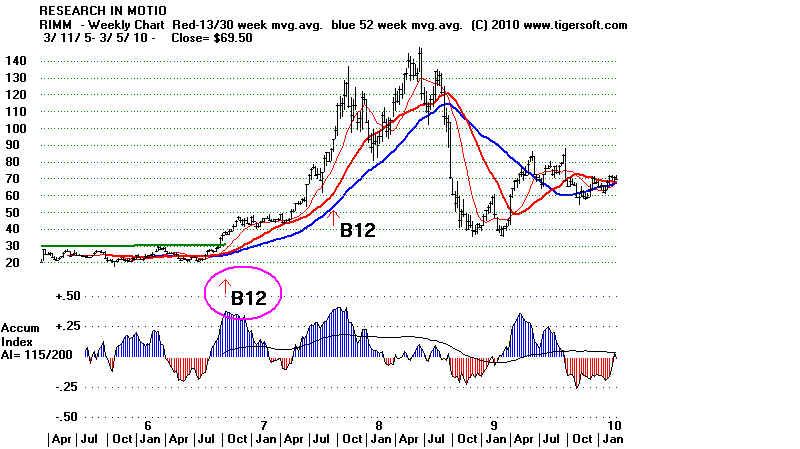
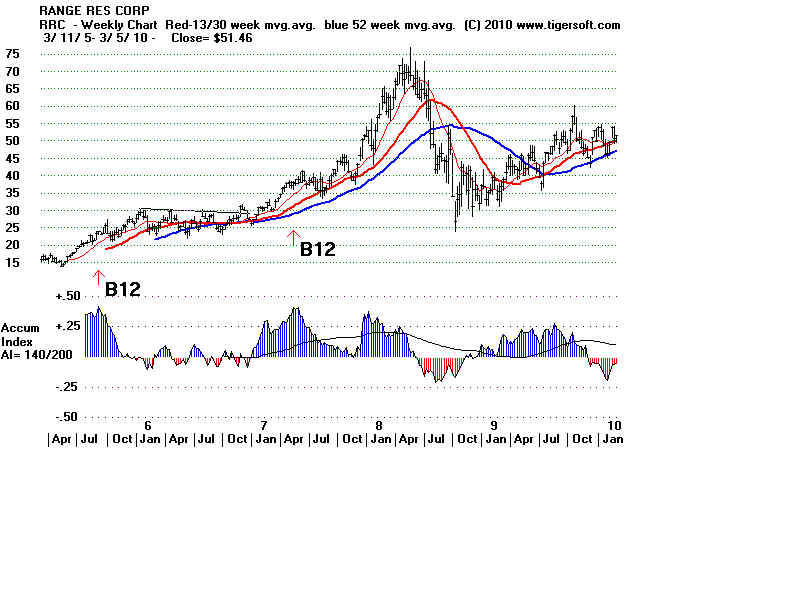
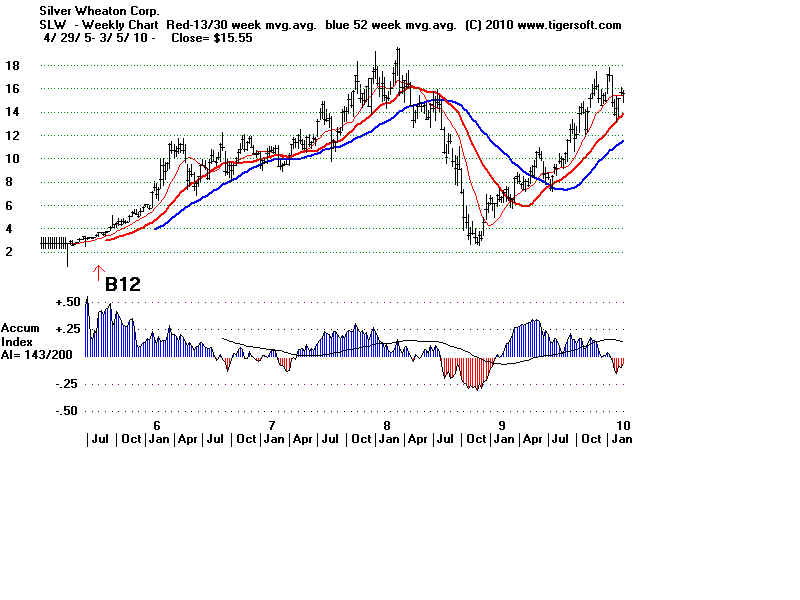
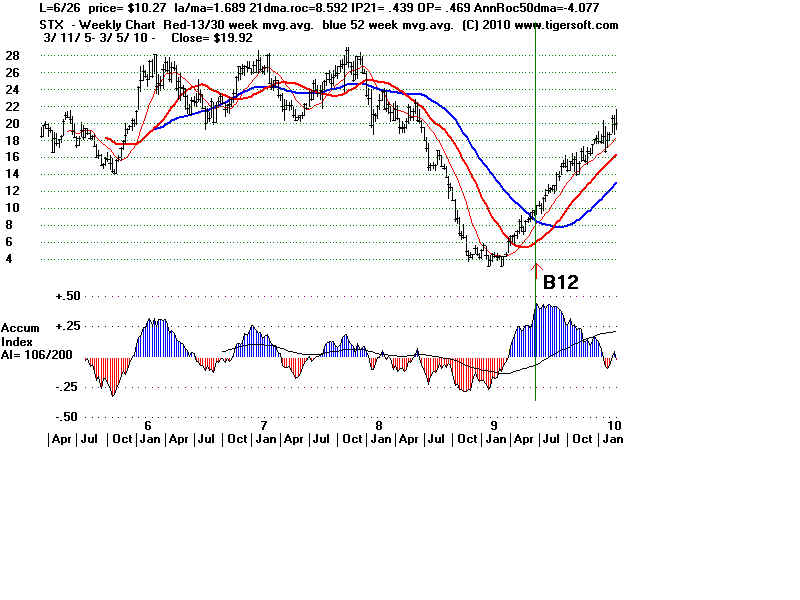
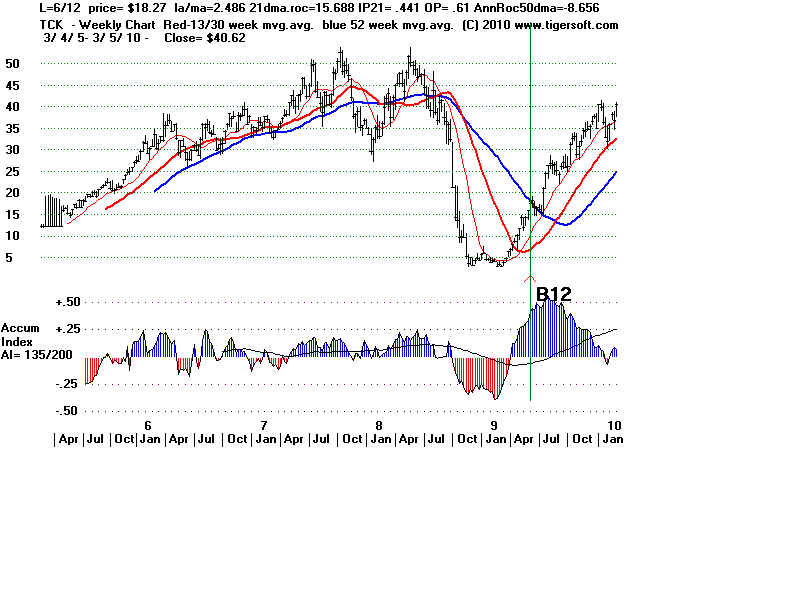
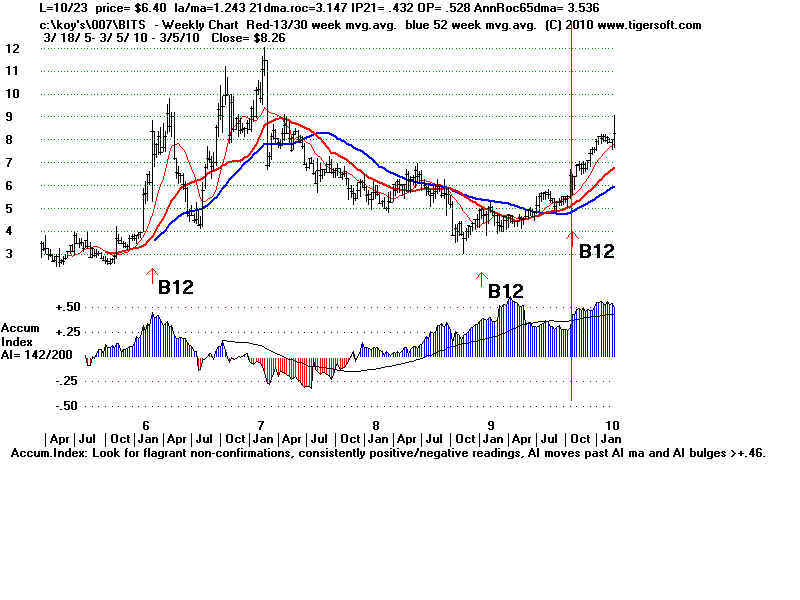
       Study these cases.  See how they keep rallying up off the rising 13-wk and
       30-wk mvg. avgs after a Buy B12 launching.

       These
new Weekly Buy B12 were reliably very profitable.
  
     
  Bold red 30-wk ma - If prices are over-extended, it is often useful to
        SELL when 30-wk ma is violated, especially if Accum Index is negative.


Blue 52 week ma. This is KEY SUPPORT.   It must not fail or turn down. 


wpe197.jpg (64889 bytes)

wpe196.jpg (67218 bytes)
wpe195.jpg (62473 bytes)
wpe194.jpg (68427 bytes)
wpe193.jpg (62349 bytes)
wpe192.jpg (68201 bytes)

wpe191.jpg (63425 bytes)
wpe190.jpg (61841 bytes)
wpe18F.jpg (59121 bytes)
ARST2.BMP (1920054 bytes)
EBIX2.BMP (1920054 bytes)
FLS2.BMP (1920054 bytes)
FSLR2.BMP (1920054 bytes)
GS2.BMP (1920054 bytes)
HES2.BMP (1920054 bytes)
IAU2.BMP (1920054 bytes)
ICLR2.BMP (1920054 bytes)
ILMN2.BMP (1920054 bytes)
MICC2.BMP (1920054 bytes)
NEU2.BMP (1920054 bytes)
RIMM2.BMP (1077654 bytes)
RRC2.BMP (1920054 bytes)
SLW2.BMP (1920054 bytes)
STX2.BMP (1920054 bytes)
TCK.BMP (1920054 bytes)

wpe198.jpg (66329 bytes)