Accum Index Bulges above +.50
Conclusion:
Expect higher prices, probably after a shallow consolidation,
and then a rally until there is a Peerless Sell.
9 Consolidations/Advances or Advances
8 Declines after a Peerless Sell
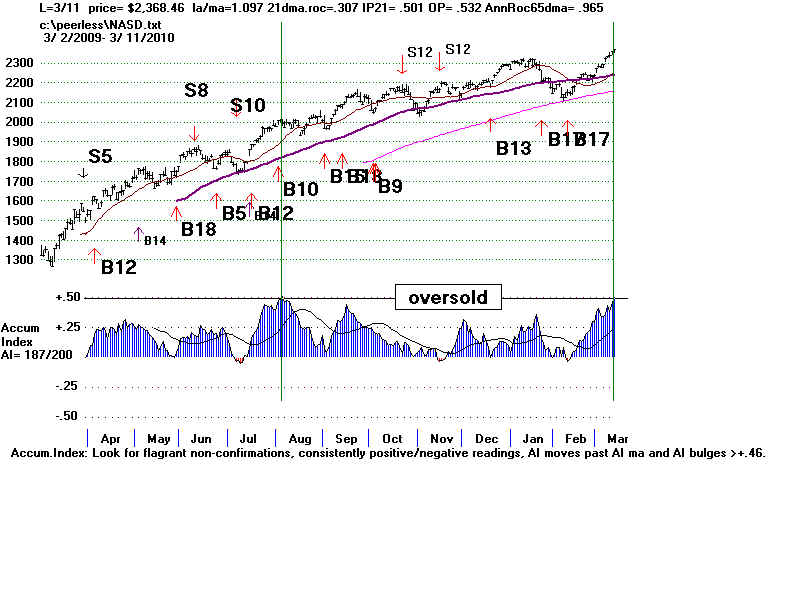
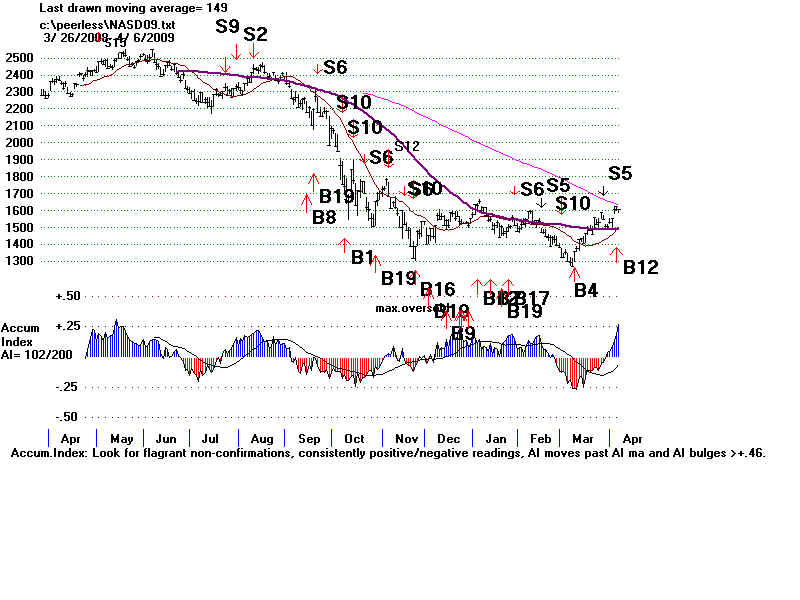
March 2010 - ?
August 2009 - Very shallow 4 consolidation followed by breakout
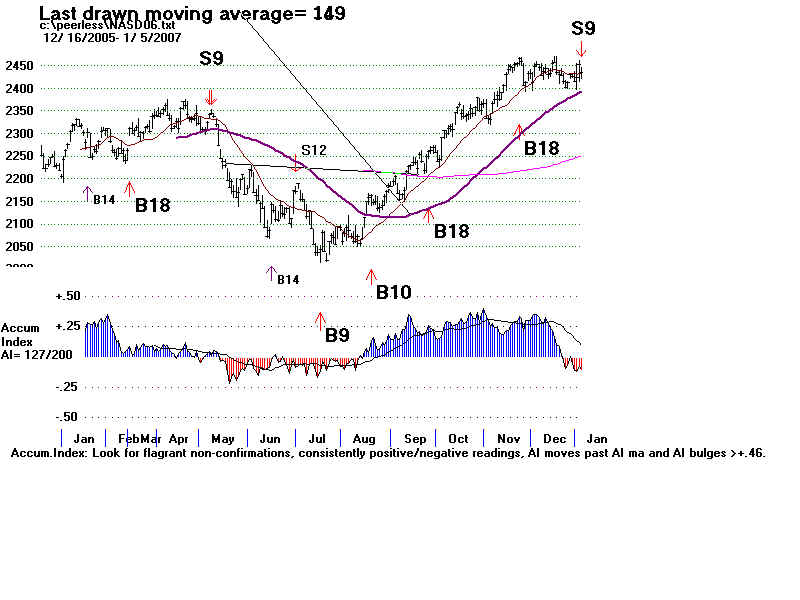
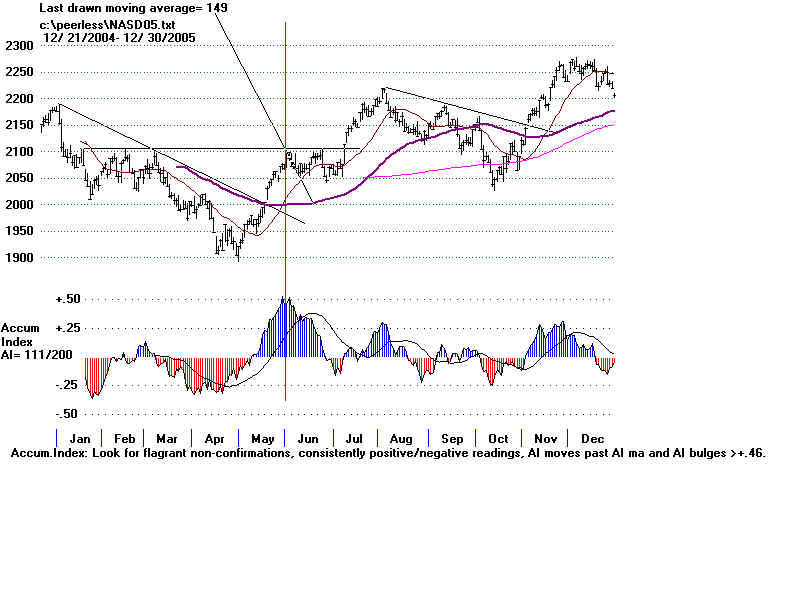
June 2005 - Very shallow 4 consolidation followed by breakout
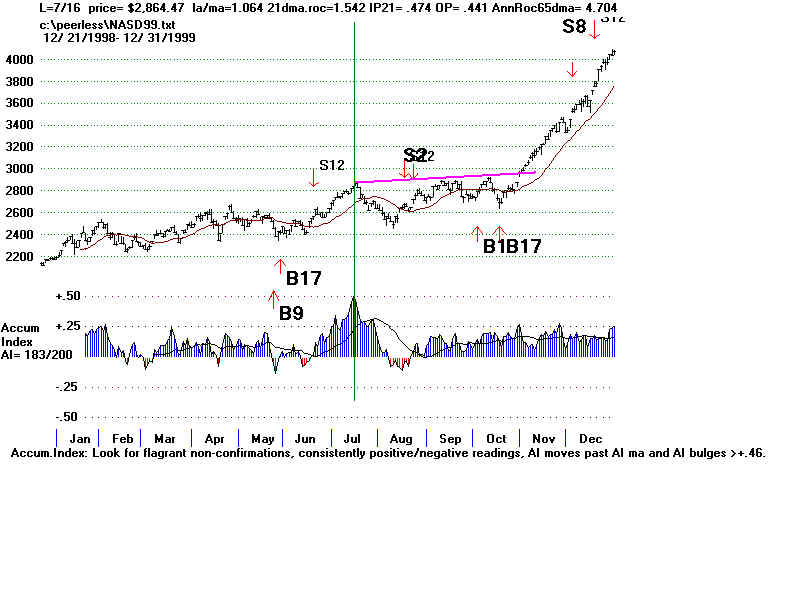
July 1999 - Decline after S9 from 2900 to 2500, 3 mo flat consolidation and then breakout.
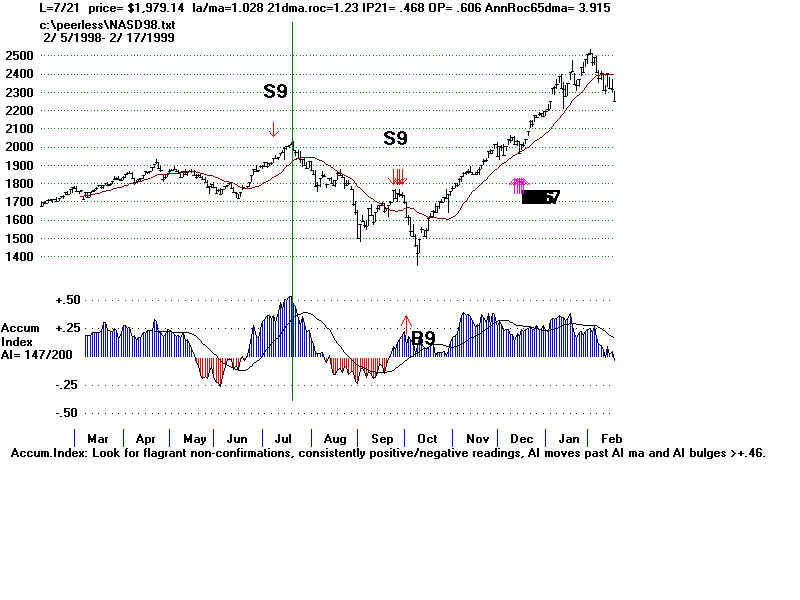
July 1998 - Declined after Sell S9 from 2000 to 1400.
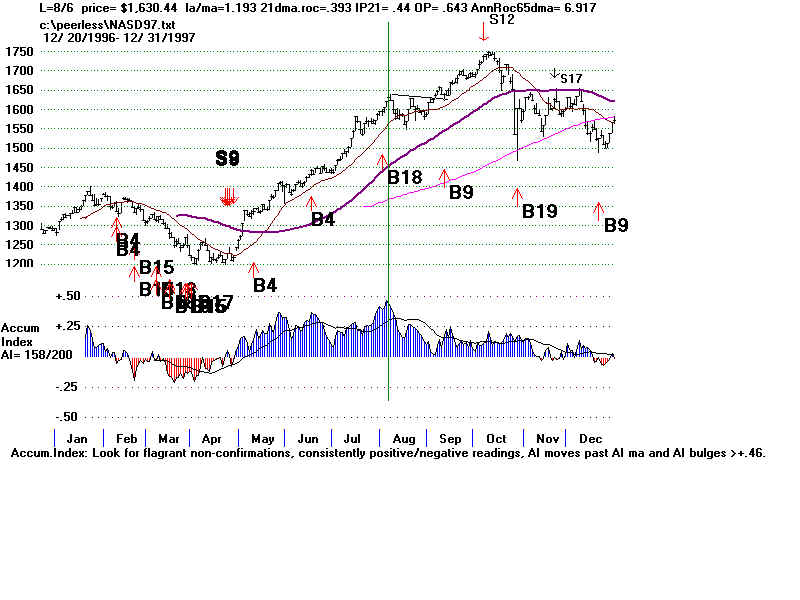
August 1997 - Shallow one month consolidation and then breakout to Sept. Sell S12 15% decline
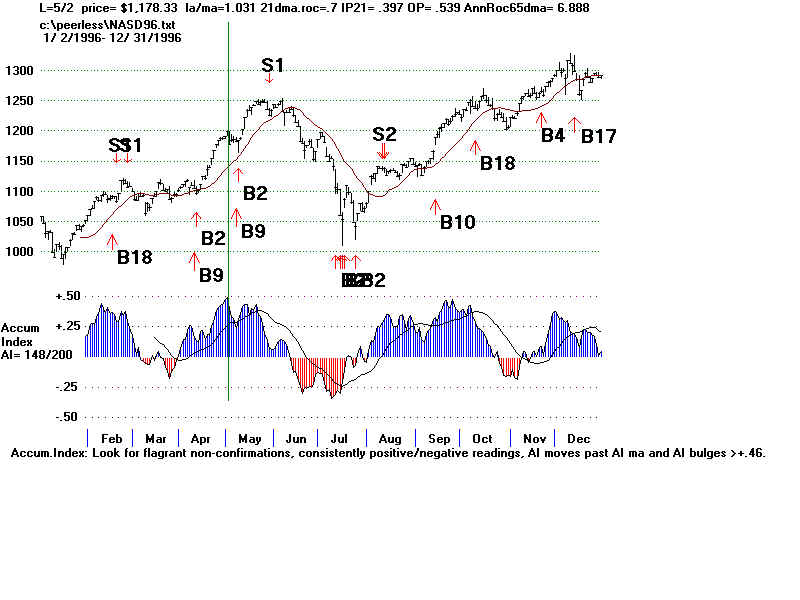
August 1996 - Rallied 4% more, then Peerless S1 send NASDAQ down from 1250 to 1050
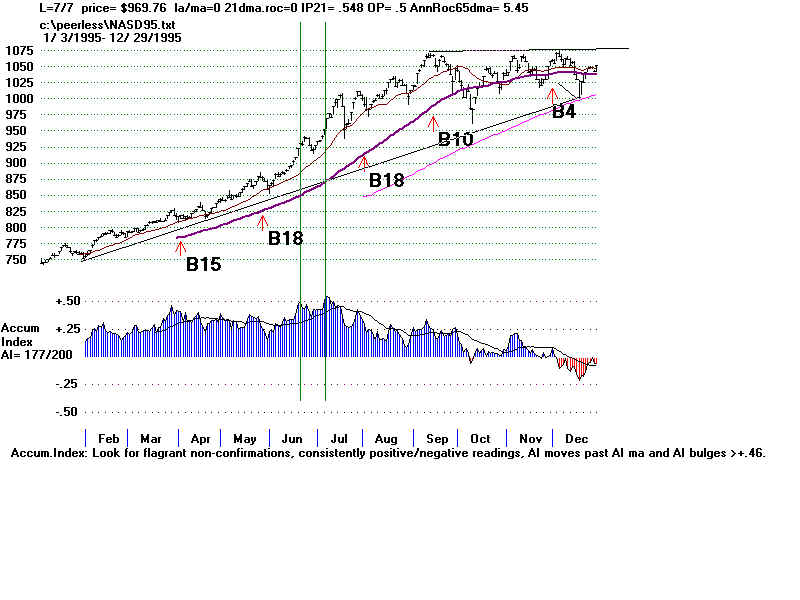
June 1995 - June and July 1995 - Part of a wall of Accumulation. NASDAQ went much higher.
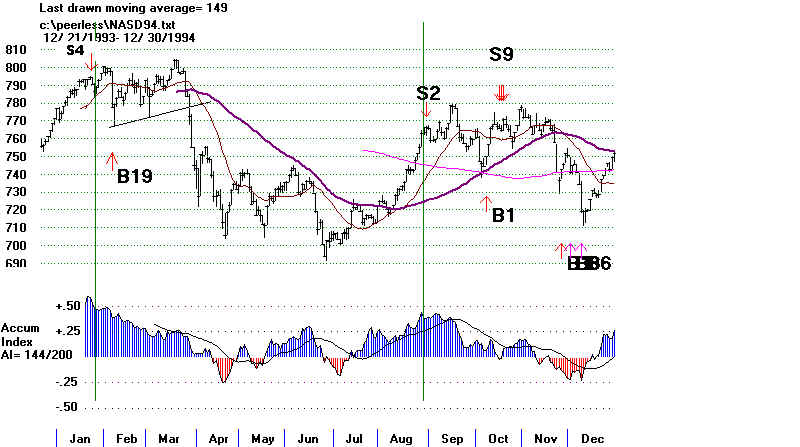
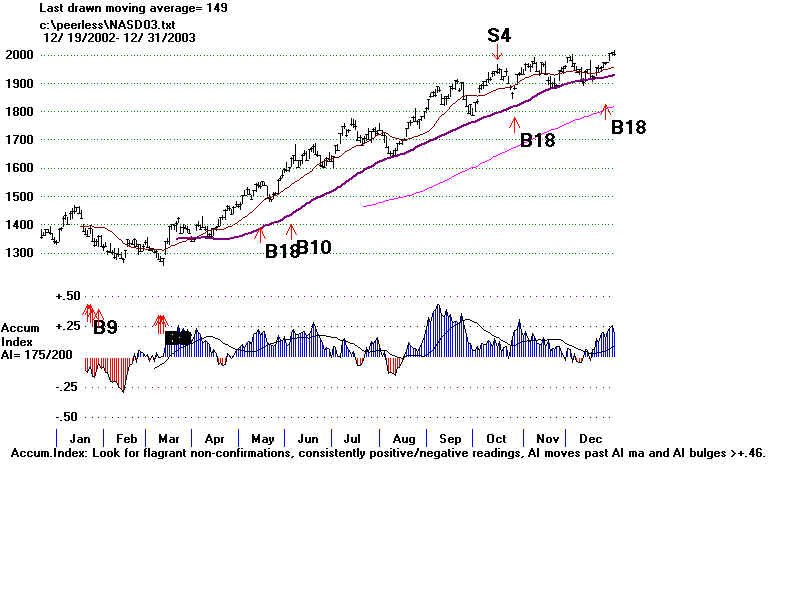
January 1994 - DJI at 790 --> decline to 700. At top was a Peerless Sell S4
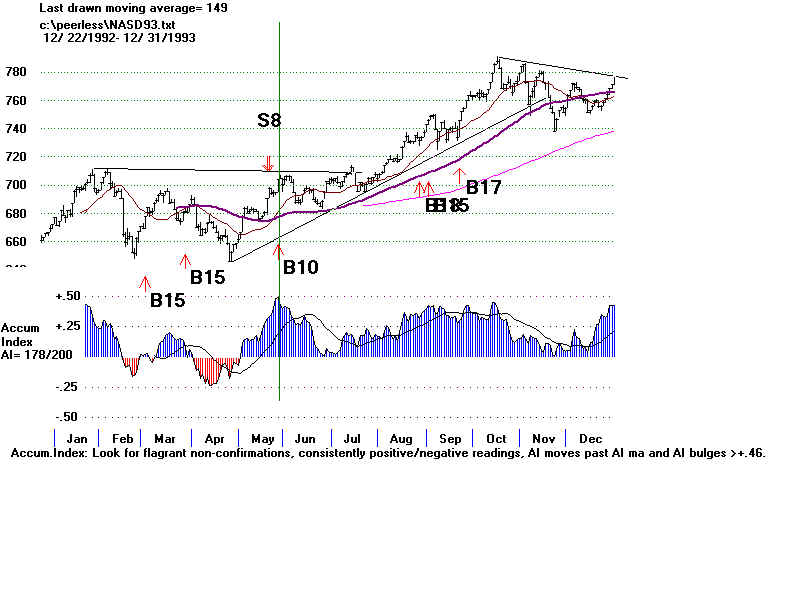
May 1993 - 6 week shallow consolidation and then breakout.
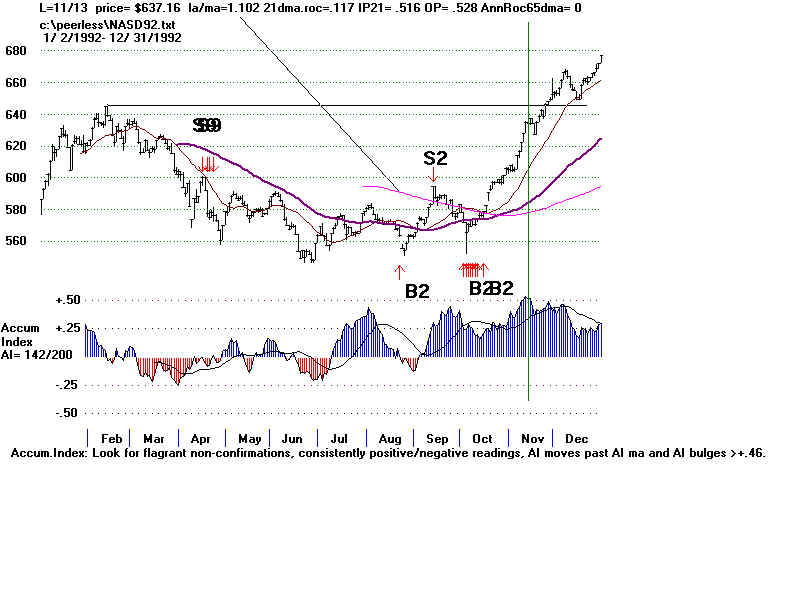
November 1992 - a few days hesitation and then breakout run.
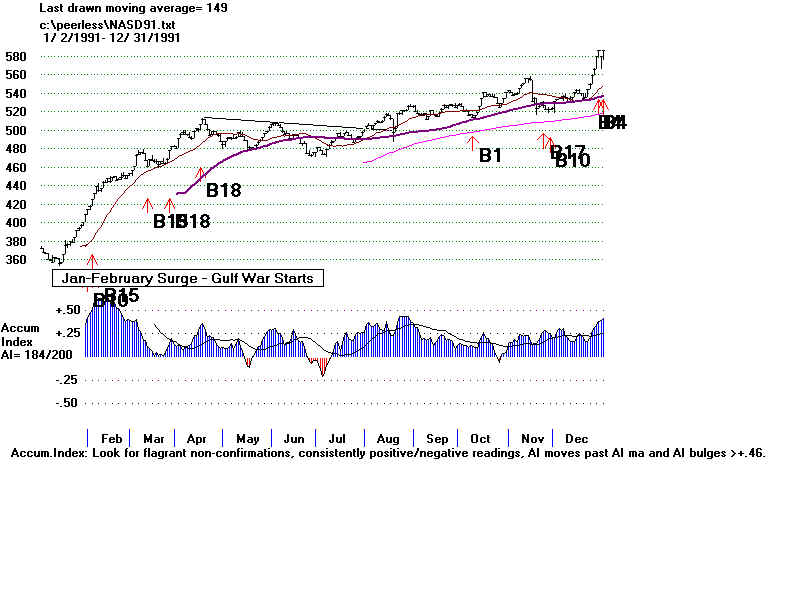
February 1991 - DJI surged upwards without hesitation.
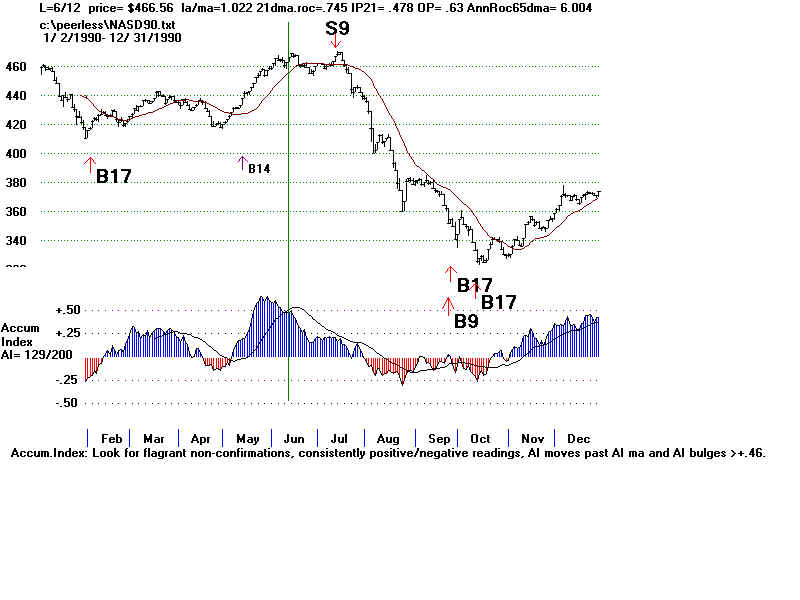
June 1990 - One month consolidation. Then Sell S9/S12 and decline from 460 to 330.
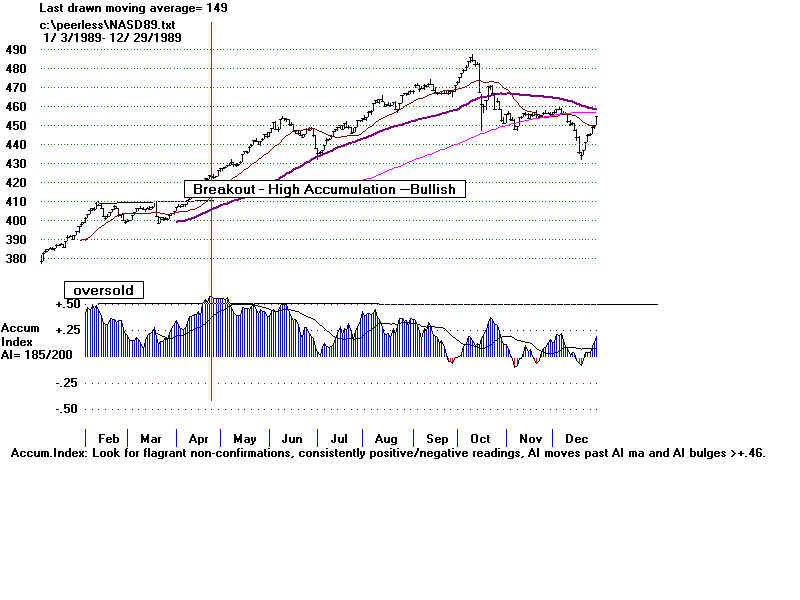
January 1989 - leads to 2 month consolidation and then breakout.
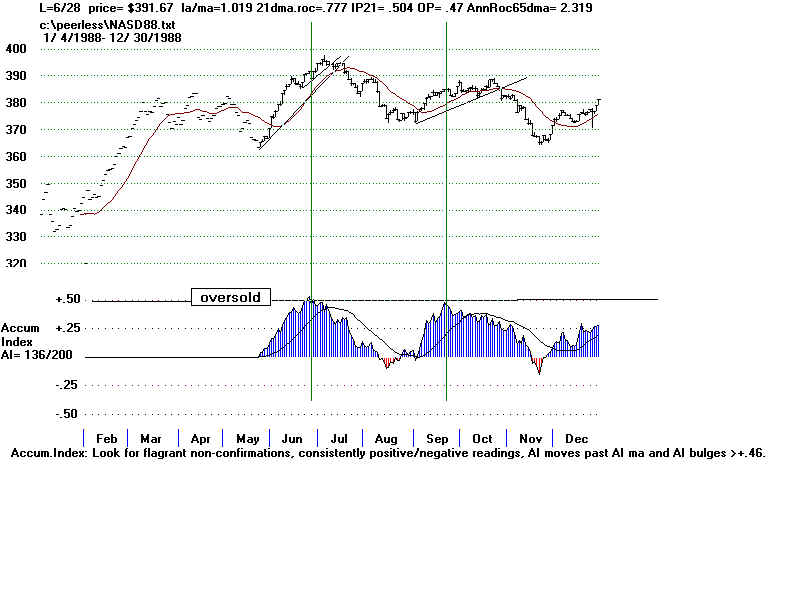
June 1988 - 6% decllne after Peerless S1.
September 1998 - 6% decllne after Peerless S1
April 1989 following breakout and move much higher.
and then breakout.
1250 to 1050
NASDAQ went much higher.
in August, the Accum. Index did not reach +.50