 TigerSoft New Service
3/8/2010
TigerSoft New Service
3/8/2010RULES FOR TRADING TIGER WEEKLY CHARTS
Profiting from Weekly TigerSoft Charts
Using 3 Key Moving Averages
and The TigerSoft Accumulation Index.
13-week moving average - 30-week moving average - 52-week moving average
TigerSoft Accumulation Index - originated and developed by William Schmidt in 1981.
(C) 2010 William Schmidt, Ph.D. All Rights Strictly Reserved.
-------------------------------------------------------------------------------------------------------------------------------------------------------------------------------------------
Make Money. Use TigerSoft To Track Key Insider Buying and Selling in All Your Stocks
www.tigersoft.com PO Box 9491 - San Diego, CA 92169 - 858-273-5900 - william_schmidt @hotmail.com

A Guide To TigerSoft Weekly Charts
(C) 2010 Wm. Schmidt. Ph.D. and www.tigersoft.com
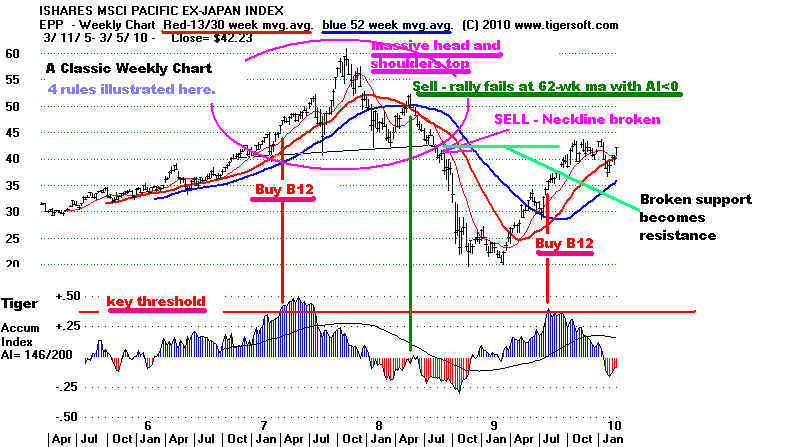
Classic TigerSoft Weekly Chart shows 5 Starting Rules:
1)Head and shoulders top,
2)Buy B12s based on AI bulges.
See Study of Buy B12s here with a 100 Examples.
Study the most powerful Buy B12s
3)Sell failed rally at flat 52 wk ma with AI<0
4) Broken support becomes resistance.
AND The Blue 52-week ma shows longer-term trend when rising is support
When it is falling it acts as resistance..
 =============================================================================
More information will be added over time to this. Please come
back again and visit our main website - www.tigersoft.com
To place newer weekly TigerSoft chart on your screen use these
commands:
Peercomm + Peerless-2008-2010 + TigerSoft (version-3/3/2010)
+ Weekly Stocks
=============================================================================
More information will be added over time to this. Please come
back again and visit our main website - www.tigersoft.com
To place newer weekly TigerSoft chart on your screen use these
commands:
Peercomm + Peerless-2008-2010 + TigerSoft (version-3/3/2010)
+ Weekly Stocks
   These charts are based on downloaded weekly (WeekdatA.exe and
   WeekdatB.exe from Tiger Data page) for SP-500 and QQQQ stocks.
   More weekly stocks' data will soon be added.  The price for our
   weekly and the 6000 stocks' daily data is $150 for a year,
   On left side (of TigerSoft's Form61) pick a stock and click button
   "Graph Selected Stock"  A weekly chart of the last 5 years
   appears.  Note the red 13 week (65-dma), the bold red 30-wk ma
   and the bold blue 52-week ma.
   On the right side (of Form61) click Graph All Stock to see all the
   stocks, one after another, where you hit the down-arrow (2) key
   to continue or the up-arrow (8) key to go back up a stock.
   Click the button "Run Weekly Flag Program" and the computer will
   generate sub-lists of stocks making 5-year highs or lows, stocks
   surpassing or falling below their 52-week ma and all stock within
   a few percent of the mvg. avg.  When the Flag Program click the
   appropriate button on the right to see the stocks fitting these
   descriptions.
Interpretation:
   Below are rules for reaching bearish conclusions. The reverse of
   them can be used to reach bullish conclusions.    We can try to spell
   these, but the best way to understand what works is to apply these
   concepts and others you discover yourself to lots and lots of
   sample weekly charts from the past.
Bearish Warnings on Weekly Charts
   Weekly charts let you see well-tested trendlines of support and
   resistance that go back more than a year.  These would not be
   seen on a daily chart that only goes back a year. One would not
   even know they have been violated, or how significant that was.
   Head and Shoulder Top formations are often much more easily seen
   with weekly data.  The right shoulder of the price pattern is nearly
   always accompanied by much weaker (even red) levels of the Tiger
   Accumulation Index than on the head and on the left shoulder.
Rally Failures
      A rally to a declining blue 52-week ma when the Accumulation
      Index is negative is distinctly bearish if it has been rising,
      the stock is over-extended to the upside, has a coincident trendline
      or a bearish top formation, especially a head and shoulders pattern.
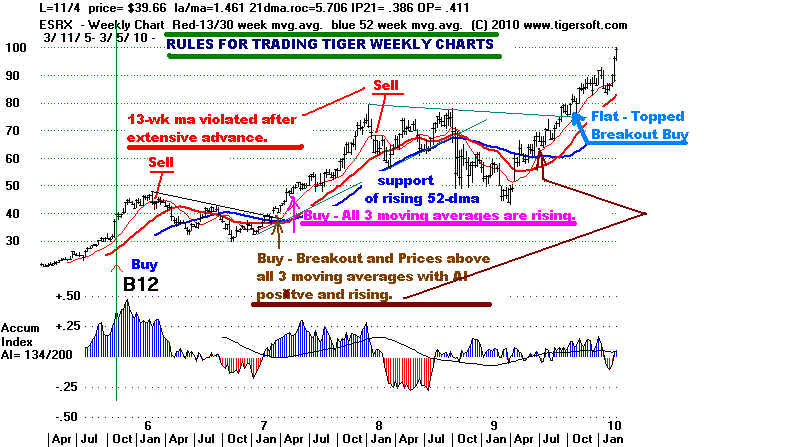
   In a rising market, the 13-wk ma acts as support. But if that is
   broken below on a weekly closing basis, the 30-wk ma is likely to
   be tested. And if that mvg.avg. is broken on a weekly closing basis
   the rising 52-wk ma will probably next be tested.  With some exceptions,
   noted below, as long as a moving average is rising steeply it will
   probably hold. The turning down of the moving average means this
   support has clearly given way.
   Since there can be too much additional decline if we wait to sell
   only when the moving average turns down, use the other technical elements
   below to decide whether to sell on a simple violation.  Use these
   considerations:
        (1) the rate of change of the moving average. The higher
        and more positive the rate of change of the ma is, the
        more likely a test of the ma will produce a revound in prices
        and that ma will probably act as support.  If the bold
        red 30-week ma starts to flatten as it is being tested,
        the odds increase that it will be violated.  Example:
        Compare AAPL in October 2008 (bearish) with AAPL in
        January 2009 (bullish.)
        (2) how over-extended prices are and how far prices might
        fall if there is a decline to the next support level. A stock
        that has not violated its bold red 30-wk ma for a year and
        a half is more likely to show additional weakness. A stock
        that is up 5x or 10x in two years becomes very vulnerable
        to profit taking when the 30wk ma is violated.
        (3) whether there is also a well-tested price uptrendline that
        has just been violated.
        (4) whether more than one of these key moving averges
        coincide.  Two of more key rising moving averages are likely
        to act as successful support than one, though a closing
        violation will likely produce a bigger and sharper decline.
        Compare AAPL in April 2006 (bullish) with July 2008 (bearish
        when 30-wk and 52-wk were both violated on the same week.
        (4) whether a clear top pattern has developed, such as head
        and shoulders pattern, which adds to the bearishness.
        (5) what the level of the Accumulation Index is.  Positive
        level of the Accumulation index suggest there is still
        support.
        (6) whether there is other indications of price support,
        namely a recent low at this level that also served as support
        and pruduced a good rally.
        (7) whether the last new high was confirmed by Accumulation
        or not.  A false new high or breakout on negative Accumulation
        is more likely to produce a deeper decline.
Bullish Flag/Flat Topped Breakouts
         Little "box" patterns are easier to spot on a weekly chart.
       Breakouts from these when the Accumulation Index is above +.20
       usually bring a further rally.
         Moves into 5-years highs are usually very bullish, provided the
       Accumulation Index is postive.