 TigerSoft New Service
Make Money. Use TigerSoft To Track Key Insider Buying and Selling in All Your Stocks
www.tigersoft.com PO Box 9491 - San Diego, CA 92169 - 858-273-5900 - william_schmidt @hotmail.com
--------------------------------------------------------------------------------------------------------------------------------------------------------------------------------------------
Bubble Stocks Are Going Higher
"Know Thyself." How To Pick and Play Them.
When To Sell A Bubble Stock
by William Schmidt, Ph.D. - Author of TigerSoft and Peerless Stock Market Timing
Our Peerless and TigerSoft programs, signals, Insider Buying and Professional Buying indicators
strongly suggest that the market may now going into a bubble phase and buying climax. This
periodically happens when interest rates are kept low, longer than usual, AND money shifts into
more and more speculative, thinner and thinner stocks after a long advance. Confidence soars
and professionals the public alike sell Blue Chips to buy technology and story stocks that are
moving upwards fast. "Performance or else" dictates it. Wall Street was built on these basics:
profitable manipulation of stock prices, group-think, stories and hype and the need to perform.
The competition among money managers in this environment all but guarantees bubbles from
time to time. After all, their bonuses are derived from their profits using other people's money.
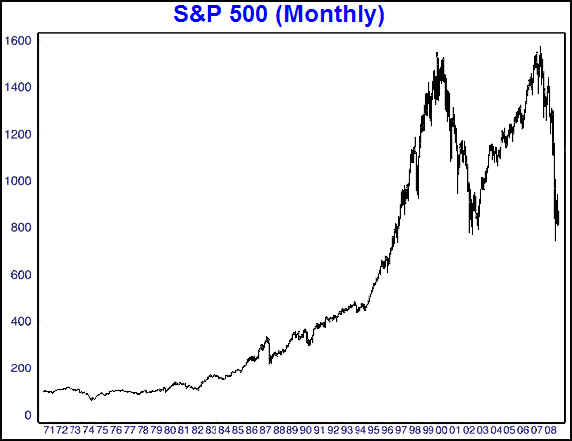
A Long Bull Market often ends in a Bubble -
Example SP-500 Bubble 1995-2000
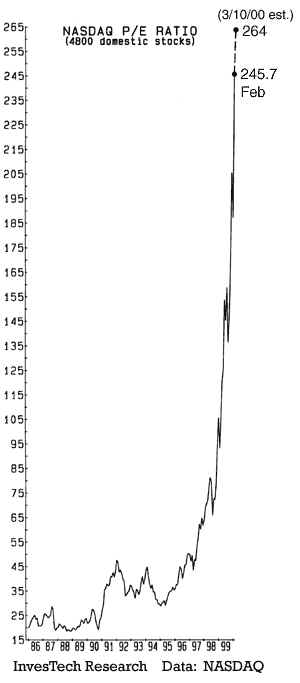
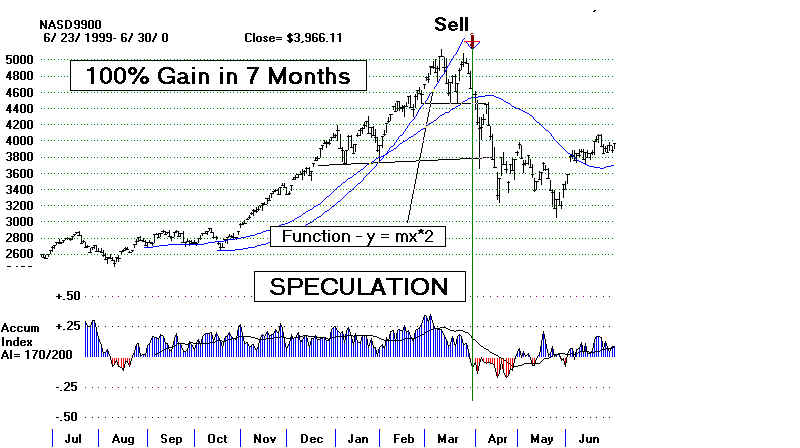
Example NASDAQ Bubble 1999-2000
http://www.itulip.com/naspe.gif
Nikkei 225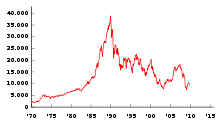 |
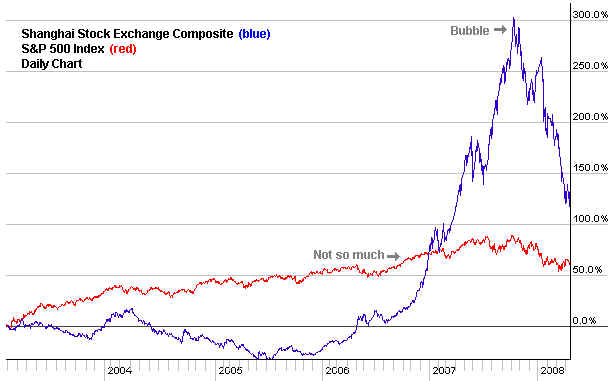 http://www.tradersnarrative.com/wp-content/uploads/2008/04/chinese%20stock%20market%20bubble%202008%20bear%20market.png |
So, we are seeing a highlyu selective new bubble now. Look below at how some stocks
are
screaming
higher and higher in hyperbolic fashion. These are companies new to 99.9% of all
investors.
I
want to point out that this is not a general market bubble. True, the DJI has risen
more than 50%
from
its March 2009 low, but there is precednt for that in a lasting, surging bull market.
Some
examples
are 1933, 1954-1955 and 1957-1959.
After these "super stocks" have been located, the trick here. of course, is to
spot their tops and
not
hold too long. A simple French Curve works in many cases. Draw an
accelerating line through the
recent
bottoms. TigerSoft does that automatically using exponential functions. But
there's much more
than
curve-fitting we can offer. Over the years, TigerSoft has learned a many things
about these
speculatiive
swings upward and how to catch their reversal.
"Know thyself", said Socrates. For one thing, bubble stocks
can keep rising a lot longer than
many investors can hold out and keep away from the party. So, if you know you can
be induced by a very bullish stampede eventually to buy, it is better to buy earlier.
It will then
be easier to sell with a profit when the times comes. Second, use our Peerless. Peerless will
almost certainly give a Sell near the final top. That' what it has been doing since
1981 and
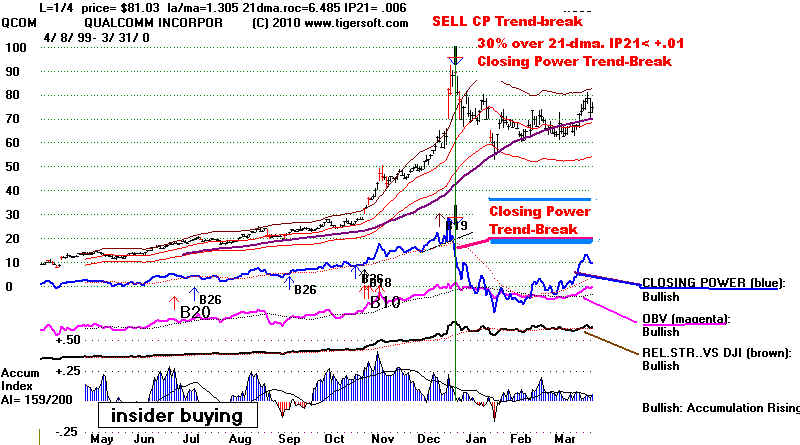
with back-testing, back to 1928. Third, watch TigerSoft's unique tools, the Professional Selling
and the Tiger Closing Power Indicator.
They will almost certainly gives us ample warning
when to sell. See examples in 2000, 2007 and 2008. Our advise, get
TigerSoft and Peerless.
They we will explain all this....
For now, see (2/20/2010) Watch The Pros To Catch
The Tops in "Bubble" Stocks.
Below see three stocks that
are going up faster and faster now.
They are acting like sirens calling wayward and uninitated investors towards the rocks.
Notice that they have the classic take-offs we identify with explosive super
stocks.
Insiders
Rule The Stock Market. AND
http://www.tigersoft.com/Tigersoft-Explosive/index.html
Yahoo reports that this company has only 3 employees
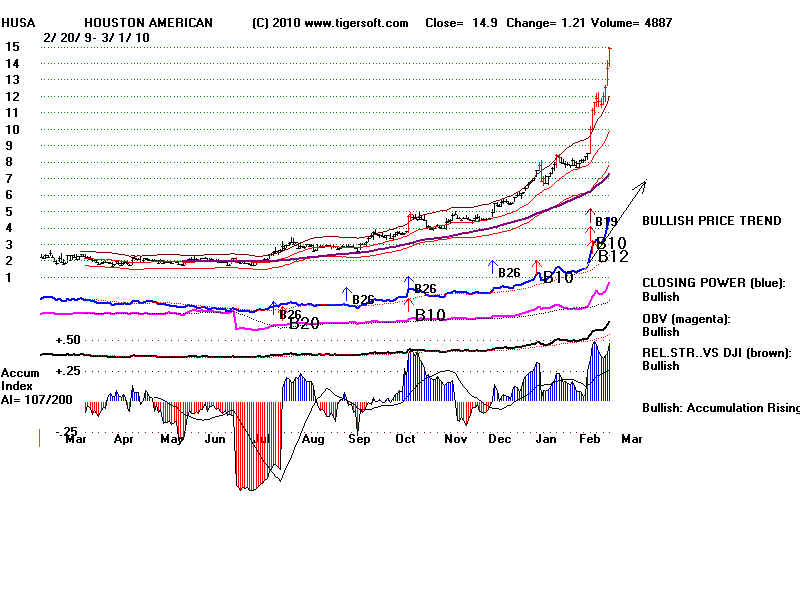
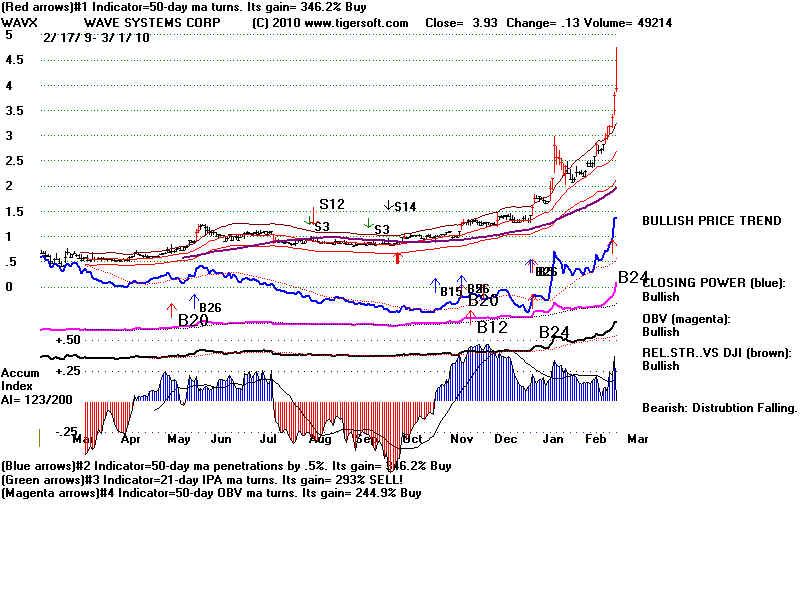
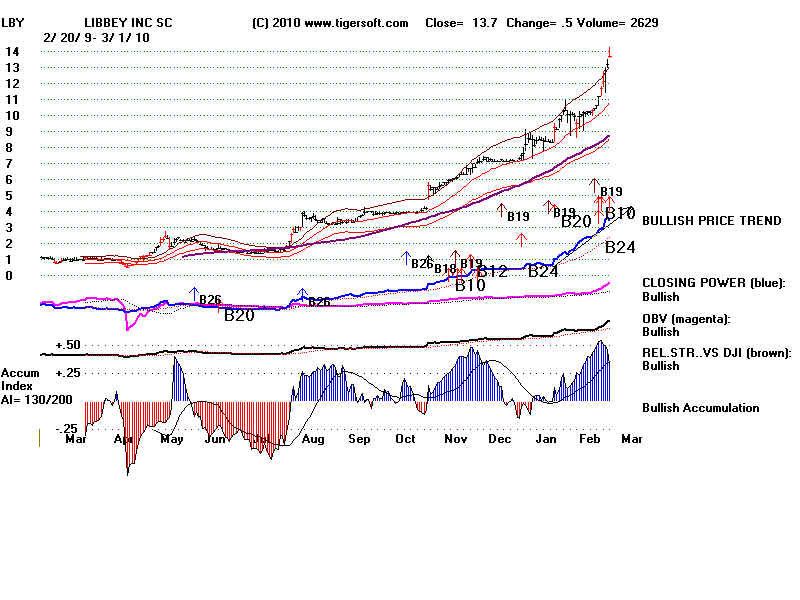
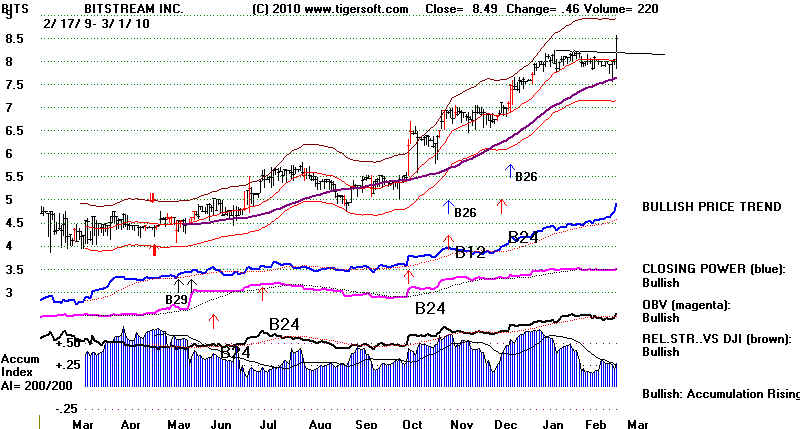
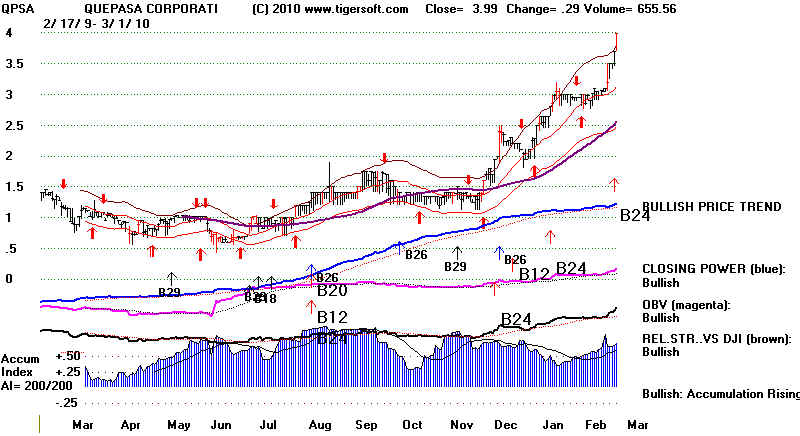
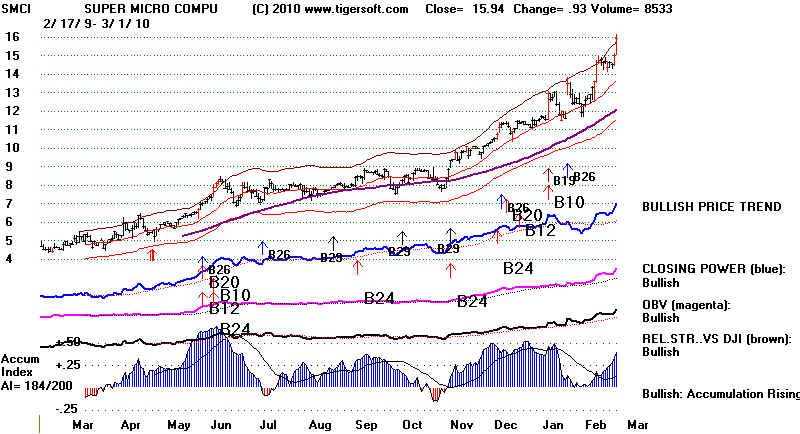
These show a lot of Blue at the bottom of
charts. This means insiders hold a lot of the
stock tightly. Bigger gains usually occur.
Dips are usually buying opportunities.
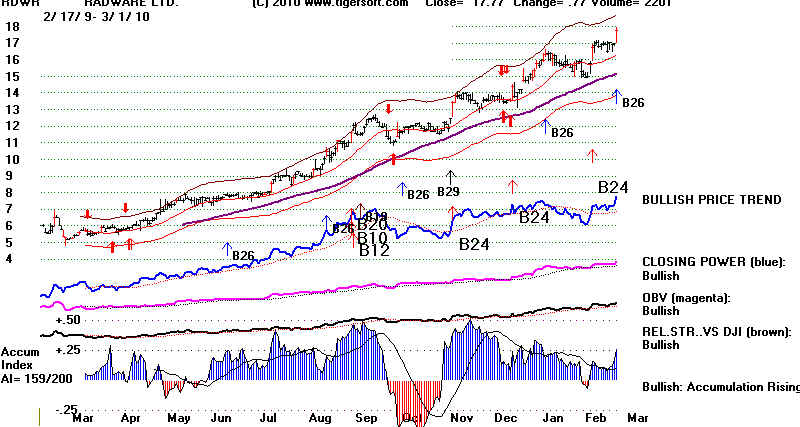
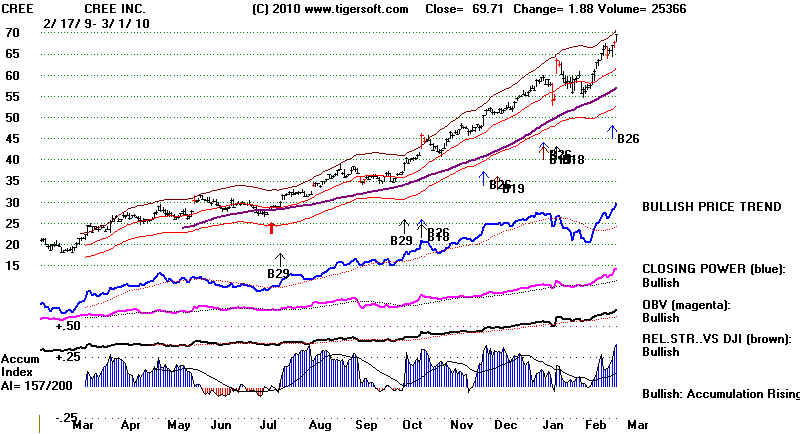
Here are 12 stock-ideas to research and
do dilligence on. As you can see, they show
a lot of Blue Accumulation and their CLosing
Power Line is confirming their new highs.
BITS 8.49 +.46 AI/200=200 Breakout IP21>.25 CP=NH All Bullish
QPSA 3.99 +.29 AI/200=200 Breakout IP21>.25 CP=NH All Bullish
Stocks with Very High AI/200 Scores:
HEIA 38.89 +1.79 AI/200=175 Breakout IP21>.50 CP=NH All Bullish
SMCI 15.94 +.93 at upper band...AI/200=184 IP21>.35 CP=NH All Bullish
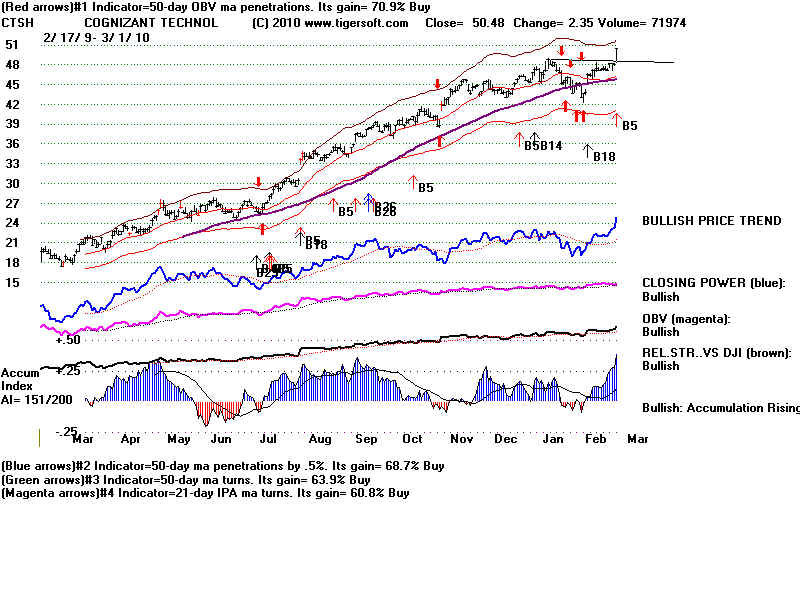
CTSH 50.48 +2.35 AI/200=151 IP21>.35 CP=NH All Bullish
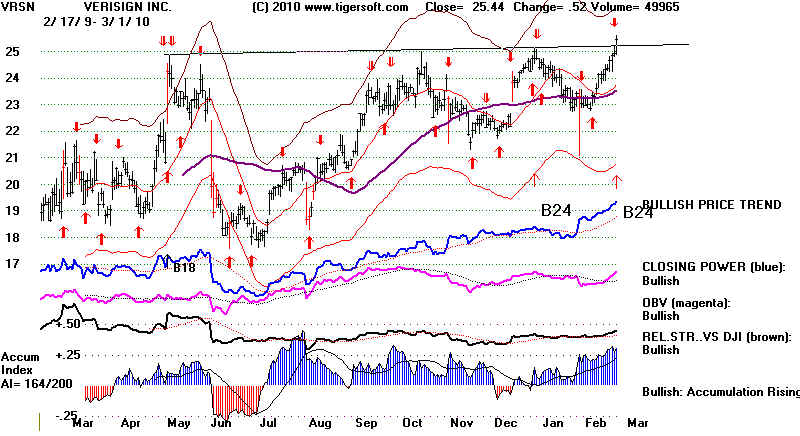
VRSN 25.44 +.52 AI/200=164 IP21>.30 CP=NH All Bullish
ALTR 25.03 +.60 AI/200=152 IP21>.30 CP=NH All Bullish
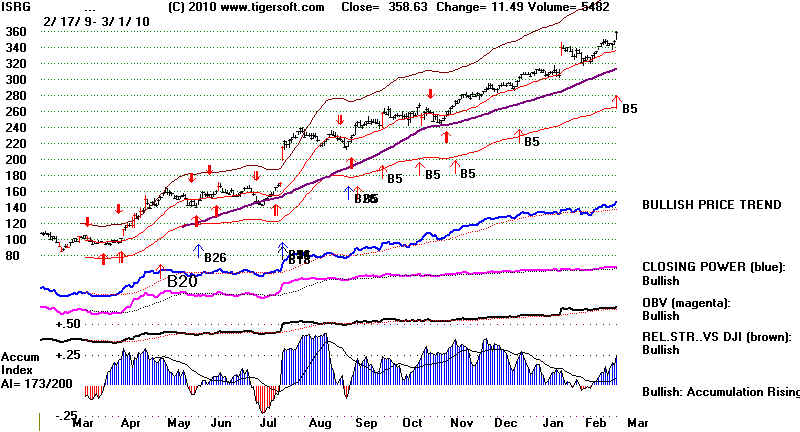
ISRG 350.63 +11.49 AI/200=173 IP21>.25 CP=NH All Bullish
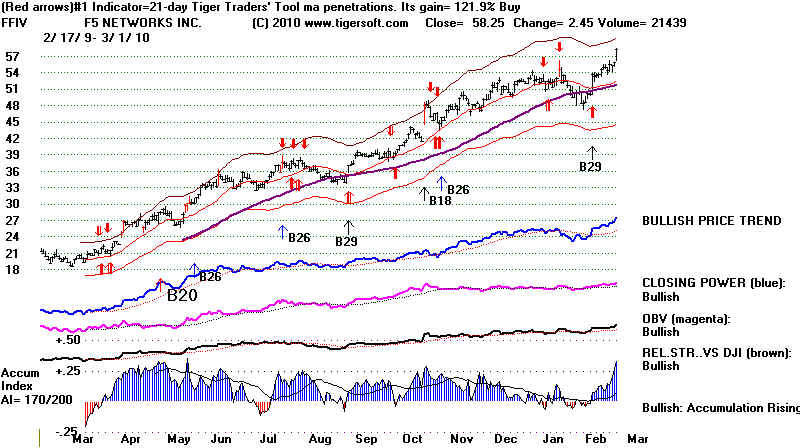
FFIV 58.25 +2.45 AI/200=170 IP21>.30 CP=NH All Bullish
RDWR 17.77 +.77 AI/200=159 IP21>.25 CP=NH All Bullish
CREE 69.71 +1.88 at upper band...AI/200=157 IP21>.35 CP=NH All Bullish
WBMD 43.84 +.76 at upper band...AI/200=165 IP21>.30 CP=NH All Bullish