====== TigerSoft and Peerless Daily Hotline. ======
7/17/2008 (C) 2008, William
Schmidt, Ph.D.
Notice
The location of this Hotline will change Sunday. If you do not receive an
Email by Saturday evening, let me know. If your subscription has expired,
the charge for a year's subscription is $298.
Note To
Readers: blue or green means the
text is new tonight
black means previously written.
=======================================
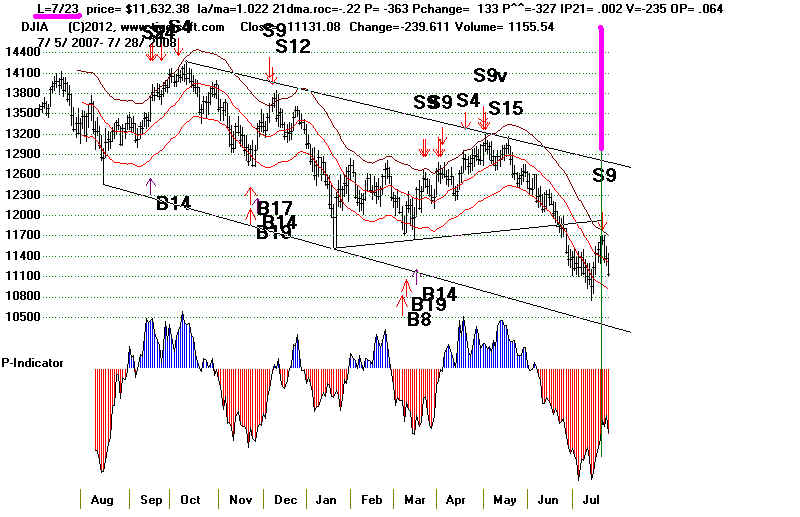
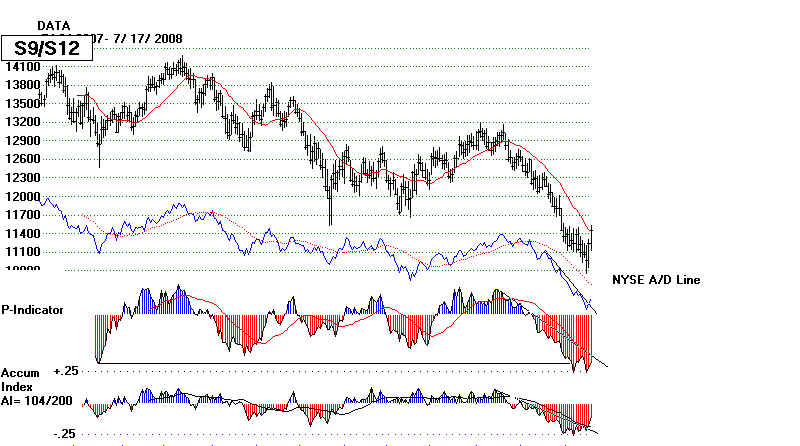
Below
is Peerless Chart showing Sell S9 in the wings - about to
appear
in one week after this Hotline was written...
HOW ARTIFICIAL WAS THIS DECLINE?
WAS THIS ALL A "BEAR RAID"?
With the financial stocks up sharply for a second day in a row since the SEC
banned naked short sales in leading financial stocks, one has to wonder how much
of the size of the decline owed to hedge fund naked shorting of these stocks
and why, if the SEC is at all concerned about excessive market volatility owing to
bear raids, it does not ban naked short sales in all securities and enforce this
rule with stiff penalties. The answer is, of course, the SEC is the client of
Wall
Street insiders, not the investing public. I might not have said that, but for
way at the end of June 2007 the SEC cleared the way for a bear market by
suddenly, capriciously, illegally allowing short sales on down-ticks. We should
watch the SEC. They want financials to rally now.
I have to mention their
hypocrisy. They are supposed to police insider trading. But it is clear from
the high volume of trading before the announcement, that they let favored
insiders know in advance.
Given their heavy weighting in the DJI - BAC, C and JPM, I would think
the DJI will move higher and reach the point of breakdown, 11700.
(In
fact, this is the level that was reached.)
More evidence that we have just seen a bear raid which the SEC
is controlling, perhaps unknowingly, is the fact that the very weakest Fidelity
groups for the prior month , as of two days ago, were those that rose that most
these last two days. I have learned that when the media says the rally was due
to "short-covering", it is usually a good idea to do just that. The Shorts
have been
pretty smart of late. It would be an error, I think, to dismiss their covering
as based
on poor judgement or emotionalism. A Summer Rally in a bear market often begins
after the second week of July. See the tables near the bottom.
Despite the rally, we have no major Peerless Buy. So,
the odds favor the
rally being short-lived, unless you are accept the Bear Raid
hypothesis, which
would suggest that the DJI has along way to rally, now that insiders have accumulated
so much stock at the bottom. Looking back to
1965, there are few "V" bottoms
and still fewer bottoma without major Peerless Buys. Three quarters
of the time, bottoms require at least another test. Last August there were 4 straight
days with more than 2000 NYSE advances. But more recently we have only seen
two
days in a row. The DJI is now at the declining 21-day ma. In bear markets,
this
and the upper band around 11750 typically act as resistance. But when the DJI rises
too fast, the DJI can keep advancing past the upper band.
------------------------ 1949 ----------------------
Sometimes, there was no timely major Peerless Buy signal at the bottom.
But the P-Indicator turned very positive and the NYSE A/D Line had shown a
Non-Confirmation
on the final low. This was also true at the bottom in early 1942. If it
is a true bottom,
there is usually some type of non-confirmation like this. Otherwise, the
probabilities are high that in a few months, the market will be making more
new lows.
Brea
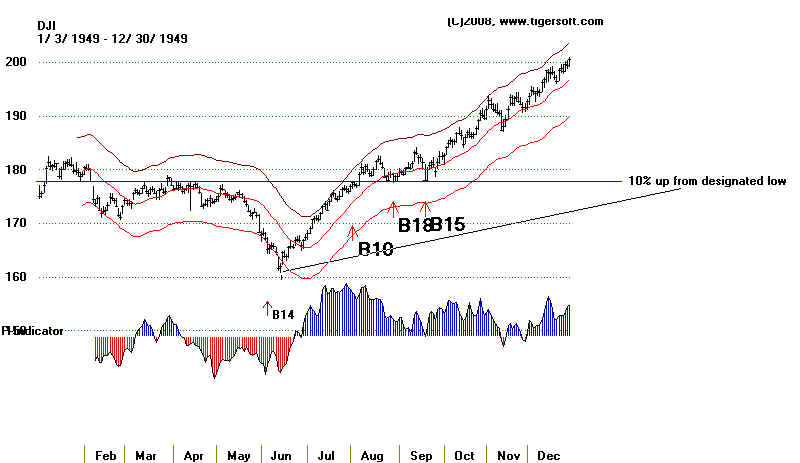
Note the red price bars indicate unusually high volume.
----------------------- Big Rally for Financial Stocks
------------------------------
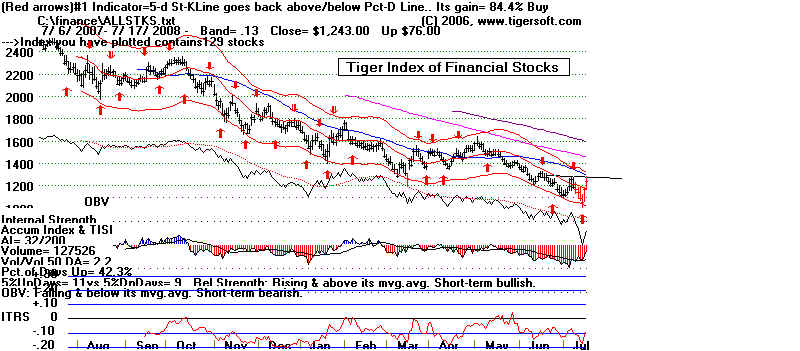
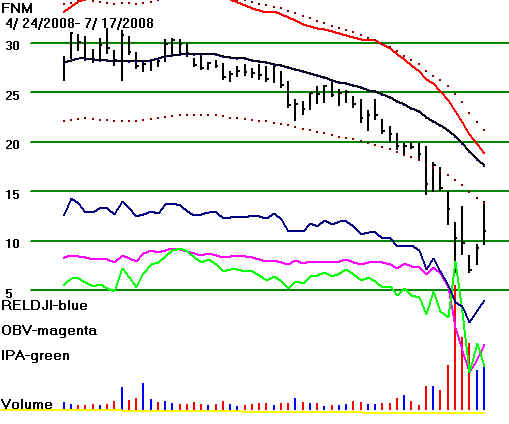
Wells Fargo and Fannie Mai Rose More Than 40% In Two Days
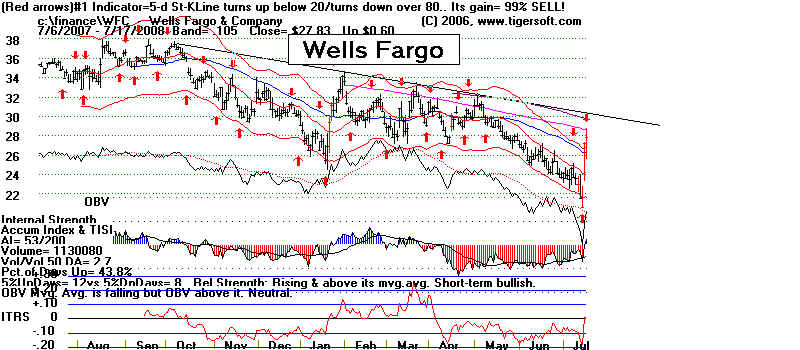
FNM Up 30% Today.
------------------------------- JPMorgan -------------------------------
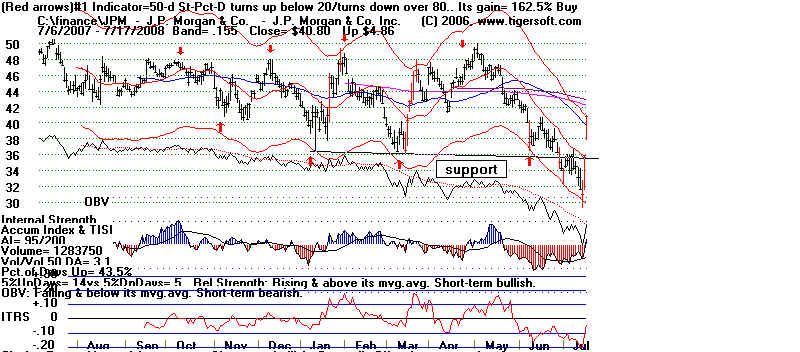
How Good A Rally Will
This Be?
The market rallied despite news that the inflation rate rose
1.1%
just in June and 5% in the last 12 months, officially. The reality is much
worse. The
Labor Department labors very hard to find methods for
minimizing the rate
of inflation. Adjusting for inflation, weekly wages fell 0.9
percent in June, the third straight monthly decline and the biggest drop in almost
four years. The July Jobs report for June showed 62,000 fewer jobs were
created than a year ago. Make no mistake about it, it we are heading into
recession. The
core economic problems are not being addressed.
Middle East Peace?
Another important reason the market rose today was the
announcement
this morning that the Bush Administration will send a senior envoy to Switzewrland to
talk with Iran. The talks are said by the White House to be a "one-time
deal,"
designed to demonstrate a serious desire to resolve the impasse over Tehran's
nuclear ambitions. This is a "significant
departure from longstanding policy."
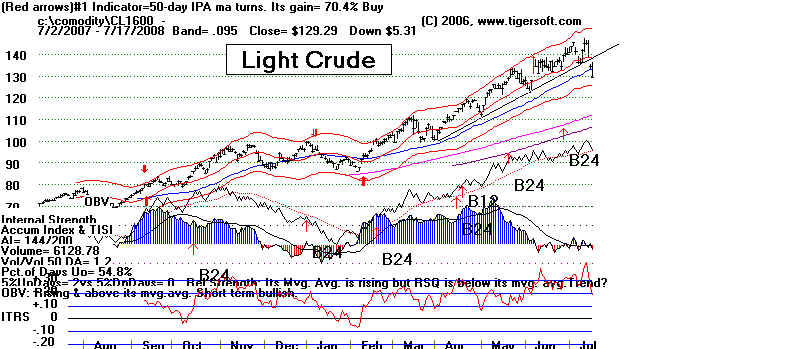
Crude Oil is now back to its 50-day ma. Watch what happens here and whether
the margin requirements for crude oil trading are raised from 5% to 50% like
stocks. It certainly has that volatility. Speculative bubbles can be reduced
by raising
margin requirements. It may not work immediately, but it will stop the bubble.
This is what the SEC did in 1968. It raised margin requirements from 40% to 50%
to cool off the low-priced stock bubble then.
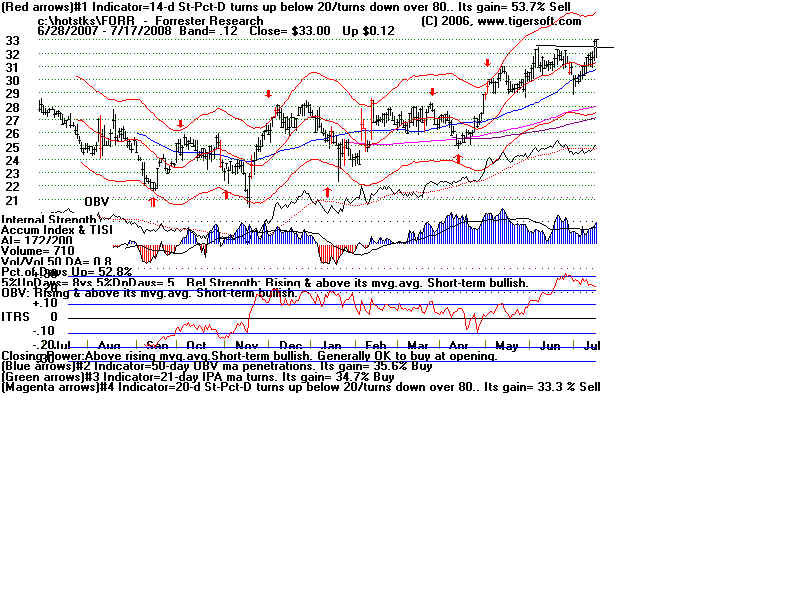
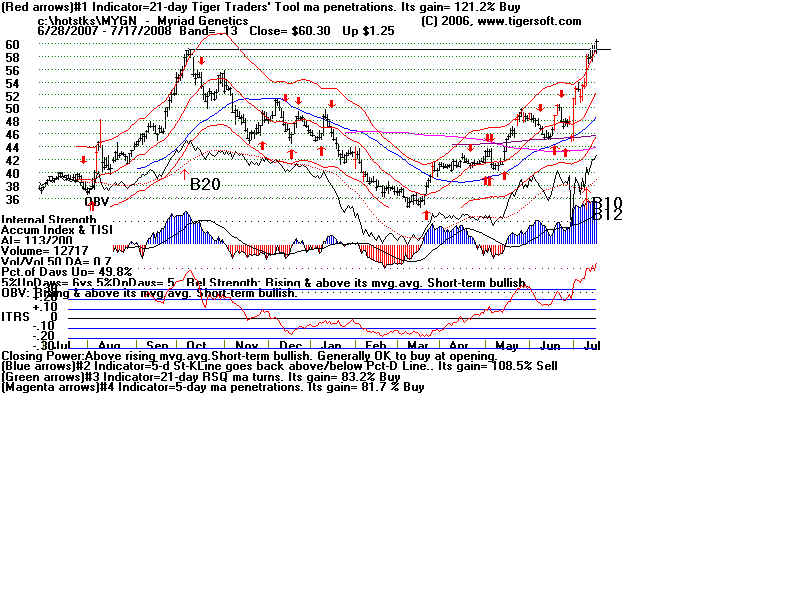
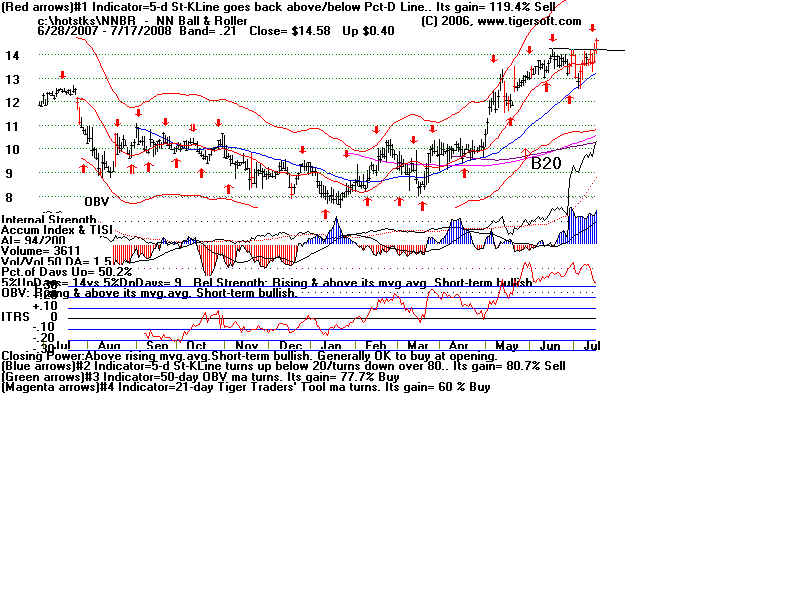
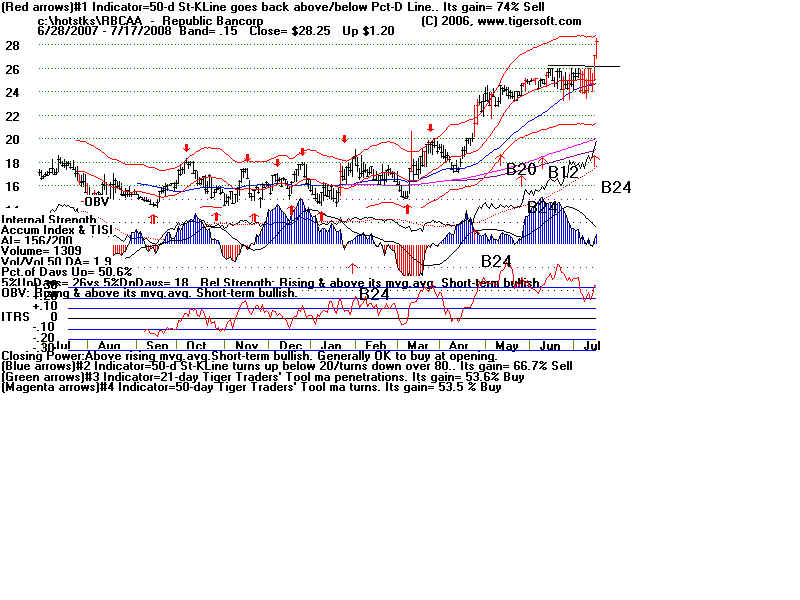
Until there is a new major
Peerless Buy signal other than a Buy B2 (which is
considered a trading range signal), we may wish simply to stay loosely short stocks
whose Accumulation Index is below its 21-day ma (TISI) and hold some high
accumulation stocks that are above their 50-day ma.
Huge Rallies in Finance Stocks
------------- 2-day rate of change -------------
Freddie Mac
+58%
Fannie
Mac
+54%
MGIC
Investm Corp +50%
Lehman
Bro
+48%
Washington Mutual +38%
Bank of America
+37% in DJI 30
Wells Fargo
+34%
JPMorgan
+31% in DJI-30
....
Citigroup
+23% in DJI-30
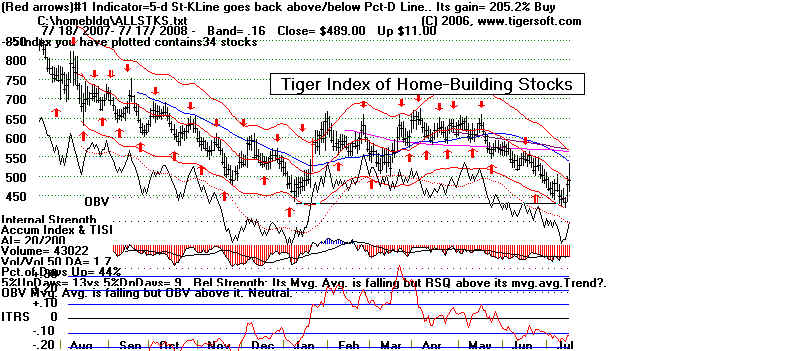
Housing prices moved up more today. As long as the
index does not make
new lows, we can hope that the worse is over. But if housing stocks breakdown
the situation for banks could worsen. Falling housing prices mean more
mortgage defaults and
walk-aways. It is possible we will see another leg down for the homebuilding and
therefore
the home finance and banking sectors. This would be enormously stressful for
the market
and for the US Dollar because of the guarantees that the Federal Government is undertaking
in this area. The current US deficit is $9 trillion. It could rise by
another $5-$7
trillion more if housing prices decline for another year and the war in Iraq continues
or is expanded to Iran. More bank failures seem likely, given this scenario.
So more
market weakness seems likely.
Unfinished Downside Business
Keep in mind that the DJI rose from a low of 1900 in 1988, twenty years ago,
to a high of 14,000. That is a gain of 600%. By any standards that is a
steep advance.
From 1946 to 1966, the DJI rose from 165 to 990. That is a 500% gain. Bear
markets
are worth examining now. From 1966 to 1970, the DJI fell 46% from its highs. A
comparable move down here from the peak of 14000 would bring another test of 7500.
I think a decline like that is very probable over the next four years. This
projection may
serve some strategic planning purposes, though between now and then, we will likely
get lots of Peerless Buys and Sells.
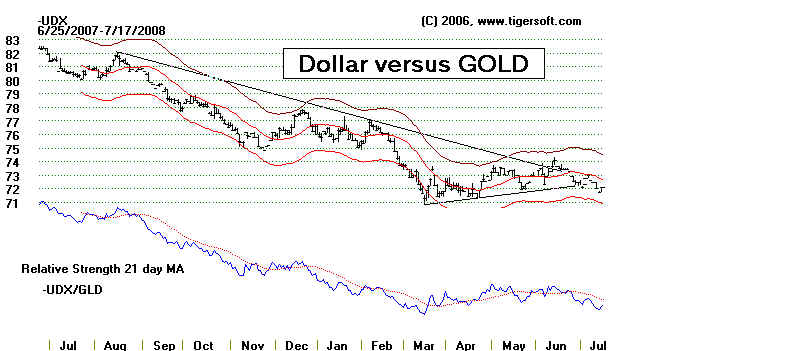
Expect more weakness from the Dollar. Watch (below) to see if it falls below 70.
I would look to Gold, Silver, the Japanese Yen, the British Pound and the Euro as ways
to hedge against the new weakness expected in the Dollar as it breaks to new lows.
See - http://www.tigersoft.com/Tiger-Blogs/index.htm
DJI In Bear Markets: 1915-2008
There have been 29 earlier cases since 1915 when the DJI fell
20% or more
in less than a year. Graphs are posted at the bottom of the 7/13/2008 Blog.
http://www.tigersoftware.com/TigerBlogs/July-12-2008/index.html
In
this Blog I show lines on these charts at the point where the DJI falls more
than 20%. The regular Peerless rules cannot be applied before 1942.
There
is no data on advances and declines or up and down volume.
You will see that Peerless Buy B2s (as opposed to Index B2s) never
reversed a decline that had taken the DJI down more than 20%. (B13s is a
signal to expect a year-end Santa Claus rally, nothing more. Trends are considered
changed by the Index Buy B1 and Buy B2 when the 65-day ma changes direction).
There are two cases of bottoms in July (1932 and 1934). Of the 24 cases in which
the bear market lasted past June, twenty had bottoms between October to
December.
The late summer months tend to not bring market
bottoms.
-------------------------------------------------------------------------------------------------------------------------
----------------------- DJIA ---7/16/2008------------------------------------------------
--------------------- Tiger Index of Home-Building Stocks ---------------------------
-------------------------------------------------------------------------------------------------------------------------------------------
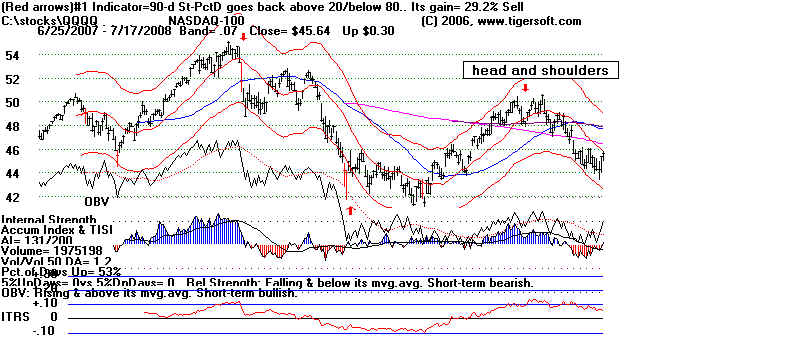
QQQQ Is Still Stronger Than DJI or SPY
Weak Closing Power is a Bearish Warning...
 ================================================================== ==================================================================
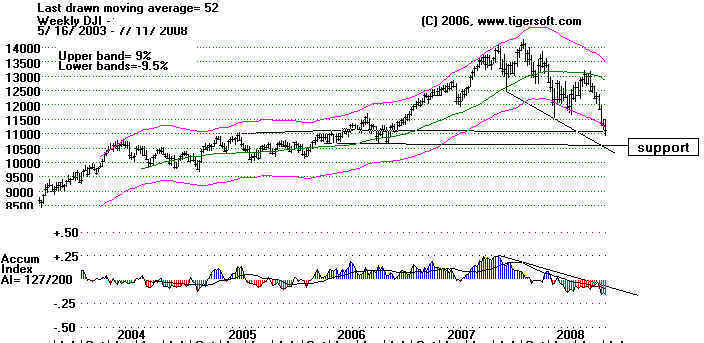
The Weekly DJI Shows some support at
11,000, the point of breakout in 2006,
after two years of backing and filling beneath that. Remember that broken
resistance becomes support on the next decline (usually!?). The next support level
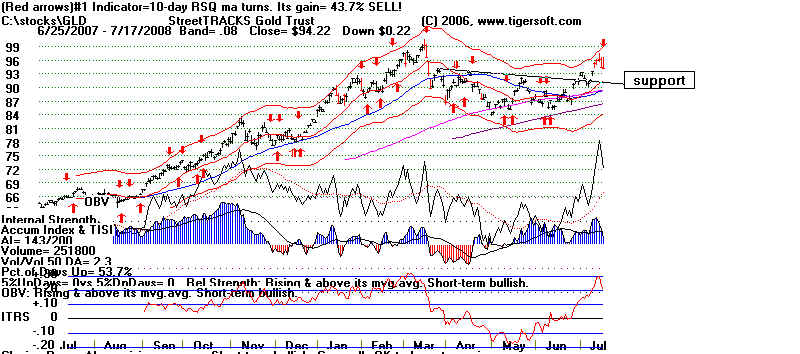
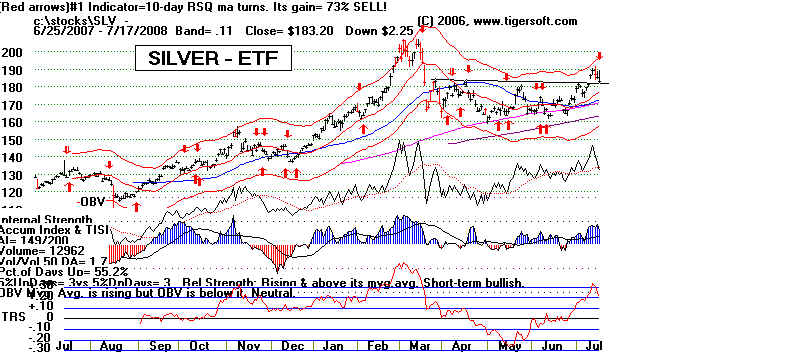
is 10,000. Gold and silver have broken out. I would expect the Dollar to
start another
decline. Confidence in US banks fits in with weakness in the Dollar. That
will mean
higher oil prices, more inflation and layoffs. All this translates into a 1970s
style
bear market, and there were lots of them. Resistance for a rally will come in at 11750
and 12000.
A Break by The Dollar below 70 Would Be Trouble.
Watch the Dollar this coming week. It is at a key support
level. If it breaks
down, the FED will be much more limited in what it can do to stimulate the economy
or bail out banks. If the Dollar holds, the FED still has some maneuvering
room to prop
up the the stock market (and economy) until after the Presidential Election.
History
shows that is what the Fed will try to do. The latest during a Presidential Election
Year that the Fed has moved to lower interest interest rates was on August 30, 1968.
(See my study)
Summer Bounces in Bear Markets.
67% of the time the period from July 4th through Labor Day (early August) shows
a rise in the DJI, according to Arthur Merrill. However, this June saw the biggest
percentage DJI decline since 1930. In on-going bear markets, it is most often
better
to wait for a buying short-term buying opportunity between July 9th and July 24th.
Bear market rallies are brief and dangerous to trust.
On-Going Bear Markets and The Results of Early July Buying: 1966-2008
1966 - There was a shallow rally from 7/1 to 7/11.
1969 - There was a shallow rally from 7/1 to 7/7
1973 - The DJI declined until 7/9 and then rallied to 7/26.
1974 - The DJI declined until 7/12 and then rallied to 7/25.
1977 - The DJI declined until 7/13 and then rallied to 7/22.
1981 - The DJI declined until 7/24 and then rallied to 8/6.
2001 - The DJI declined until 7/12 and then rallied to 7/17.
2002 - The DJI declined until 7/24 and then rallied to 8/22.
Historical
Studies
Here are the charts for all Presidential Election Years:
1944-2004.
The DJI is now down more than 20% from its July 18th, 2007 peak.
Interesting things happen around
this point: It is a key pivot point.
1969 temporary bottom for one
month. Slight initial penetration/
1973 rebound
from 19% down level. 18% rally for 10 weeks.
1977 slight rebound and
bottom for 8 weeks.
1981 6% rebound for 10
weeks.
1987 violated and DJI fell an
additional 20% in 1 day.
1990 Violated slightly for a
week and then rebounded to start new
bull market. There were multiple Buys then.
1998 5 separate tests of the
20%-down line and new bull market.
Buy B9s marked bottom.
2001 9/11 saw DJI drop
26% from peak. Buy B16 two days earlier.
2002 Violated 20% down and
fell 26% from peak. B19 at bottom.
|
Dark War Clouds Lifting?
We still have not seen a "wash-out" decline that acts as a selling
climax. An attack by Israel on Iran is a danger that is kept alive by
daily saber rattling. That would easily drop the market another 10-20%
and send oil prices up to $200. It is this fear that has caused the oil to
surge so much in the last few months.
See Consequences and costs
of an Israeli/US attack on Iran.
Today, Iran said it did not anticipate war with Israel
or the US. That
is the reason, I think, that oil and natural gas fell so sharply.
Another news item to watch for is whether the initial margin requirements
for buying crude oil futures is tightened. It is now 5% to 7%. The Senate
under the direction of its Democratic Leadership has chosen not to raise the
rates. Senate Majority Leader Reid has taken $365,000 from Financial
Industry PACs. Crude oil is falling now. But speculation is a real problem
and there's no reason consistemt with public welfare for allowing speculators
to buy crude oil contracts with so little down.
Light Crude
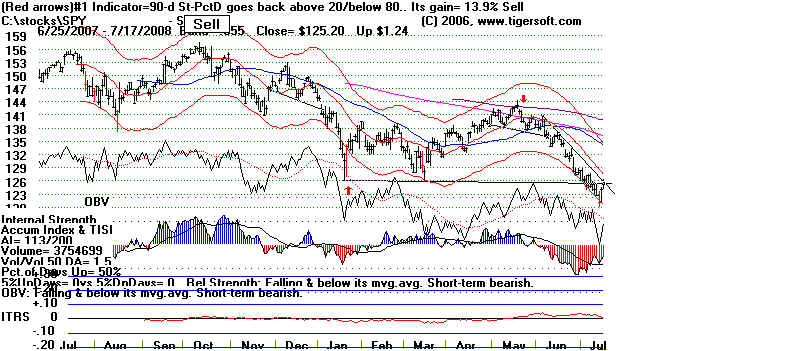
SP-500 Chart
The Dollar Looks Vulnerable
Gold and Silver Are Breaking Out.
A challenge of Their year Highs is likely
---------------------- DOLLAR -------------------------
---------------------- GOLD
------------------------ -------------------------
=================== Silver ============================
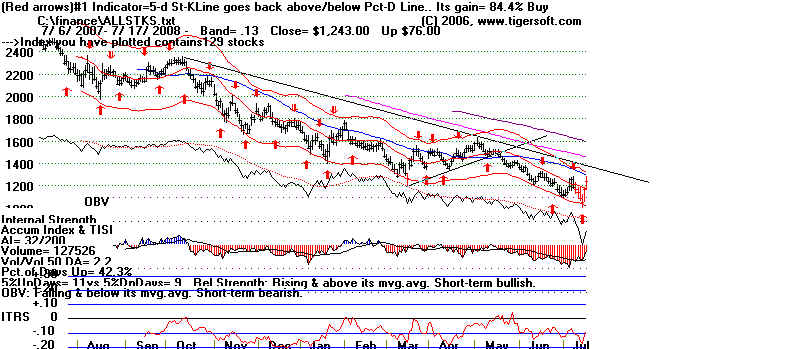
Tiger Index of Foreign ETFs
Breakdown from triangle is bearish.
90-day Stochastics have worked very well for the last 12-months here.
Not shown below, it remains on a Sell.
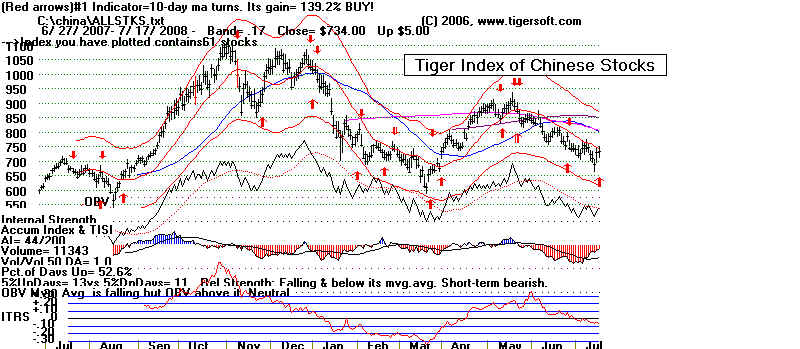
China
|
|
