|
====== TigerSoft and
Peerless Daily Hotline. ====== 5/21/2008 (C) 2008, William Schmidt, Ph.D. Important This HOTLINE's Page's Location will change on 5/22/2008. If you have not received an announcement in your email -box by the morning of 5/22/2008 (Thursday) telling you the new location, it either means your subscription has run out or we have inadvertently left your email out from those that were sent out. To renew for $298/year, please go to the link If you have subscribed to the Tiger Elite Service, you will see a link there to the new site. RENEW HOTLINE HERE Or email me at william_schmidt@hotmail.com
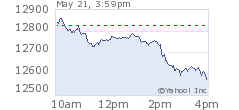
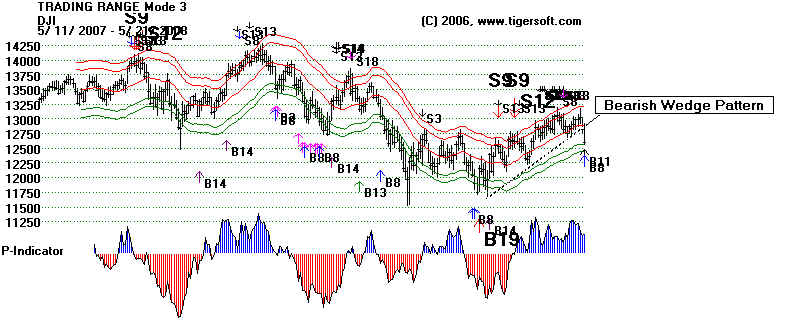
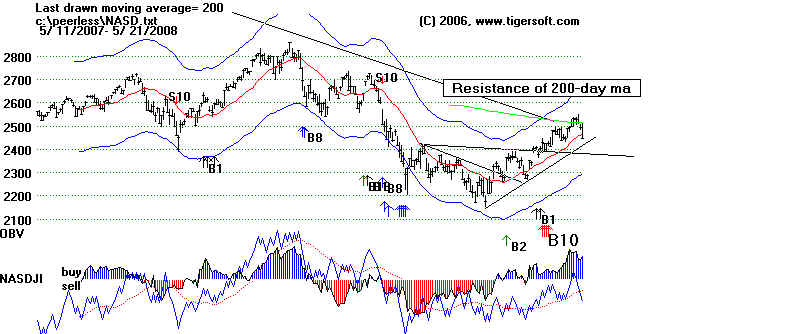
-------------------------------- Peerless Chart of DJI with Signals
---------------------------------------------
|


Peerless Stock Market Timing: 1928-1966
Track Record of Major Peerless Signals
Earlier Peerless-DJIA charts
7 Paths To Making 25+%/Yr. Using TigerSoft
Index Options
FOREX trading
Investing Longer-Term
Mutual Funds
Speculative Stocks
Swing Trading
Day Trading.
Stock Options
Commodity Trading
Tiger-Blog: Stocks, Political
Economy and Insights that you will
not get in a timely way from the
mainstream Media. These are
designed to let you see the "Larger
Picture." Also Occasional Personal Notes.
==================== FIDELITY SECTOR FUNDS ===========================
Use this study to monitor ever-changing sector strength.
21 Day GAIN - 5/20/2008
32 of 42 funds were up for last month.
Strongest Pct Change
FNINX Networking +10%
CSCO, GOOG, JNPR, MRVL, EMC, RIMM, new COGO, NTAP, BRCM, new ARRS
FSPTX Technology +7%
CSCO, MRVL. NOK, YHOO, new MR, RIMM, new VSEA, new CTRP
Multi-Media, Outsourcing, Natral Resources, Wireless +6%
Weakest Pct Change
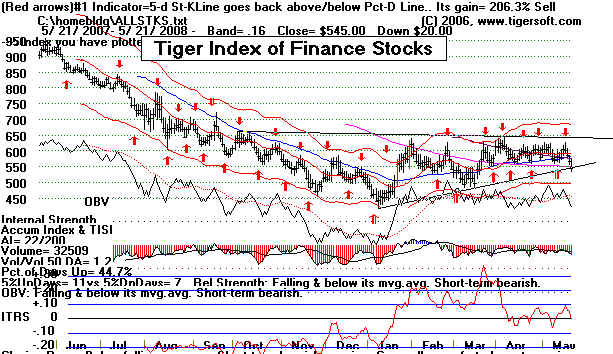
Insurance -5%
Financials -3%
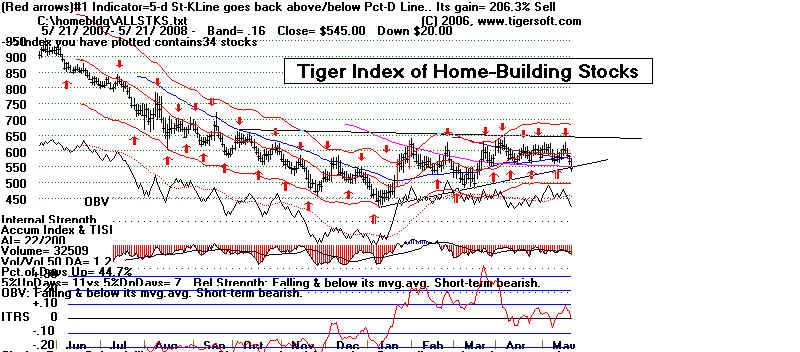
Chemicals and Home Finance -2%
=============================================================================
Recent Studies That Apply.
2/5/2008 First quarter declines in a Presidential Election when a new political party is going
to win the White House.
In a Presidential Election year, Wall Street has to factor in the policies of a new President.
When a new political party takes over the White House, there tends to be weakness longer in the
Presidential Election year. Since 1920, in 7 of the 8 cases where a new party gained control of the White
House, the market did not reach a bottom until March at the earliest (2000). April saw two bottoms.
July produced the low twice. October did the same as July. Only in one year, did the DJI fall all year.
In 1920, the DJI declined all year, from 109 to a low of 72 in December.
In 1932, the DJI fell from 70 at the beginning of the year to the Depression
bear market low of 41 in July.
1952 is an exception. The DJI fell only from 270 at the start of the year to a
low of 257 in April. It then rallied for the rest of the year as the market looked
forward to a Republican more pro-business President.
In 1960, it fell from 685 at the start of the year to low of 568 in October. It then rallied.
1976 was an exception. The DJI rallied at the start of the year and closed the year near
its highs.
In 1980, the DJI suffered a sharp decline in February and March, from 900 to 755 in April.
In 1992, the DJI went sidewise for the year, The final low was in October.
In 2000, the DJI angled downward, with two deep "pot-holes'. The year's low was in March.
========================= 1977 and Seasonality ===============================
The 1977 experience shows a steady erosion may lie ahead for stock prices now. Or, the decline
may be rapid, as short sales are now allowed on down-ticks. I said last week that: "I consider the situation
dangerous. If the FED is going to act, it must do so quickly and dramatically. Why is it delaying?
Seasonality is bearish. I have pointed out how often the DJI pivots down early in
a Presidential Election year. Presumably, it must get used to changing agendas and
priorities from the would-be Presidents. Arthur Merrill first pointed this out in 1984 in his
"Behavior of Prices on Wall Street". Studying all the Presidential elections years from
1886 to 1983, he notes than Januarys are up 54%, Februarys up 46%, Marches up 70%,
Aprils up 47%, Mays up 47% and Junes up 50%. The mean for all months was 56%.
=========================== Pivoting Down in January =============================
Another bearish point: it is bearish that we would have had
a major Sell in December,
based on the internal weakness of the market as the DJI reached the upper band, but for
the
Peerless rule that denies a Sell in December now. At this stage, I would allow S9s
in Decembers
in years before a Presidential Election year. 1959 was such a case.
Seasonality is very problematic
if we
think in terms of the 4-year Presidential cycle. In 10 of the 23 cases since
1916, the DJI
peaked at the first of the new year and then declined various percentages, always at least
5%. Tops
with more than 10% decline were seen by mid February in 12 of the 23 cases. Runaway
advances
were seen only in 1944, 1964, 1972 and 1996. Waiting for a decline at least to the
lower band to
buy would have worked in all but these four years.
1916 - Jan. 1 top and 15% decline: Bounce in April, Bottom and 4 month rally in July.
1920 - Jan. 1 top and 30% decline by December after bounce from February low.
1924 - Feb. 7 top. and 13% decline until May. Then rally for rest of year.
1928 - Jan. 1 top. and 5%
decline and then very strong for rest of the year.
Dem/Rep 1932 - mid Jan top and 15% decline, rally and
then 50% decline until July.
1936 - rallied to April 7 top
and then fell 12% in late April and
recovered.
1940 - Jan. 1 top and then 28% decline to May .
1944 - up for rest of year - WWII.
1948 - Jan. 1 top and then
9% decline ending in March.
1952 - mid Jan top
and 7% decline ending in April.
1956 - Jan. 1 top and then
5% decline ending in January
1960 - Jan. 1 top and then 13% decline ending in April. Fed Credit tightening.
One month rally followed by decline that lasted until October.
1964 - up for rest of year.
1968 - Jan. 1 top and then 10% decline ending in March
1972 - up for rest of year. Nixon got Fed Chrmn to loosen credit.
Dem/Rep 1976 - up until March and then sidewise.
1980 - rallied to February 13 top and then fell 18% to March bottom and recovered.
1984 - Jan. 1 top and then 17% decline ending in July.
1988 - Jan. 1 top and then 9% decline ending in mid July.
Dem/Rep 1992 - up until May top and then 8% decline ending in October
1996 - up for rest of year.
2000 - mid Jan top and 18% decline until March.
2004 - rallied to February 12 top and then fell 9% by October.
(This study is developed further at the bottom of this page.)