TigerSoft News Service 2/22/2008 www.tigersoft.com
See Blog 10/7/2007 Trading Food Commodities
Food Commodities Viewed by TigerSoft
by William Schmidt, Ph.D. (Columbia University)
(C) 2008 All rights reserved. Reproducing any part of this page without
giving full acknowledgement is a copyright infringement.
Research on Individual Stocks upon Request:
Composite Seasonality Graph of Any Stock for $125.
Example of historical research NEM - Newmont Mining. Order Here.
 |
Tiger
Software Helping Investors since 1981
|
Food Commodities Viewed by TigerSoft
We are long DBA. The chart shows why. Prices surpass the 50-day ma with the Tiger
Accumulation Index being positive. The bulge of intense accumulation showed that the advance
was heating up and could go "hyperbolic". The commodity charts here are based on "perpetual
contracts". The longer term charts show that these commodities' prices often spike and fall
back very quickly. Using protective stops just below their 5-day or 10-day ma is probably
reasonable.
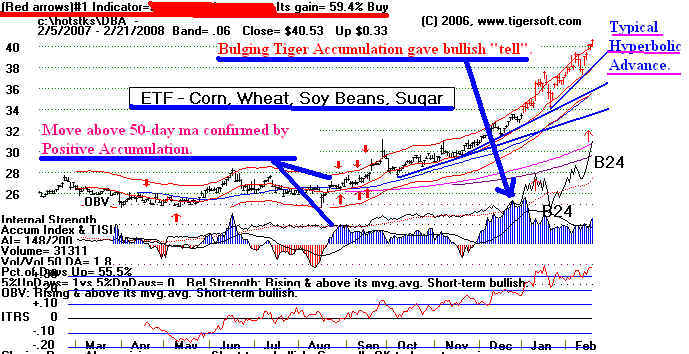
This page shows how strong, lot of Accumulation and high relative strength, Food
Commodities are now.
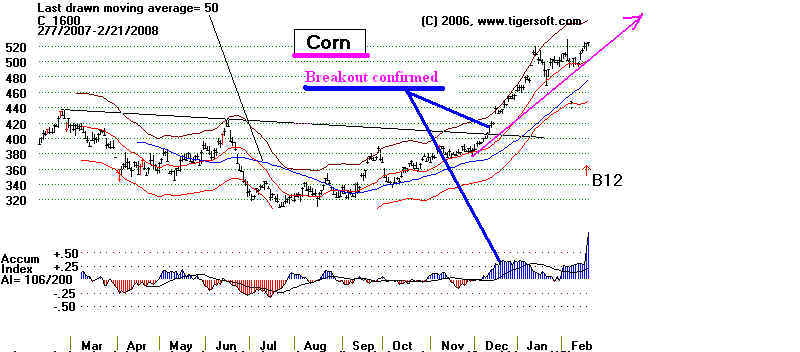
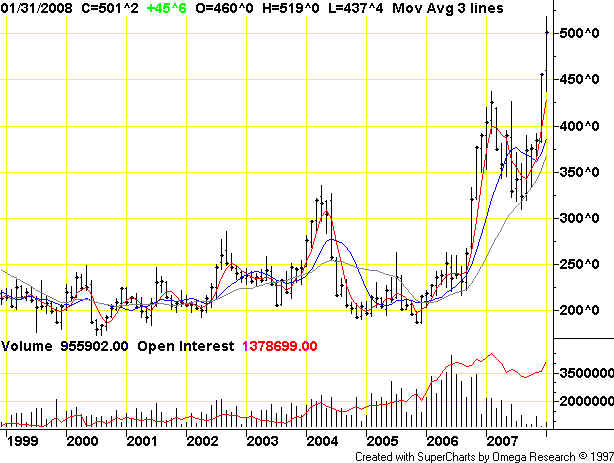
======================== Corn ================================
CORN is on a Buy. Positive Accumulation confirmed the breakout. The all-time high
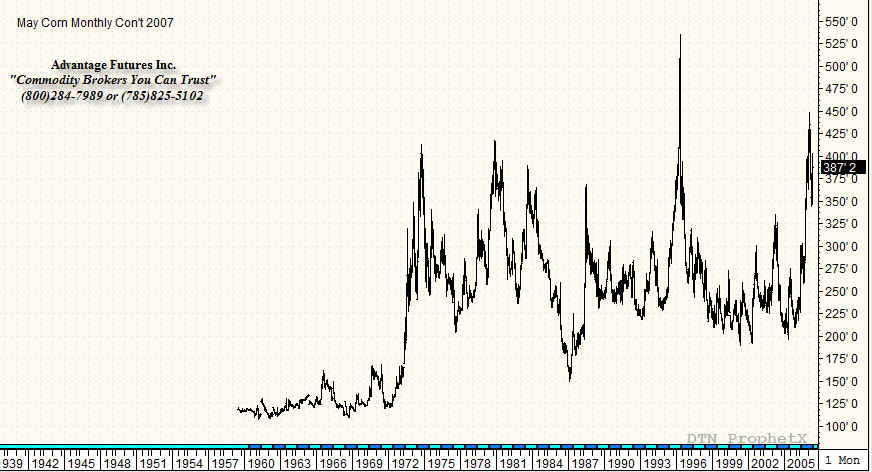
was seen at 525 very briefly in 1993 or 1994. (See the monthly chart below). The last time
it reached this level it reversed and quickly lost all its gains. This calls for caution.
Monthly Corn
======================== Cocoa ================================
COCOA - Break was confirmed by positive Tiger Accumulation.
Note how high the levels of recent Accumulation are. Higher prices must
be expected. It previously peaked at 2400 in 2002. A double top was needed
to bring about a reversal.
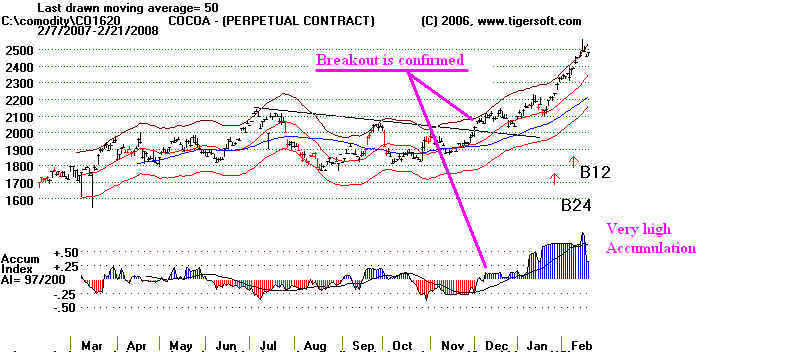
Cocoa Weekly
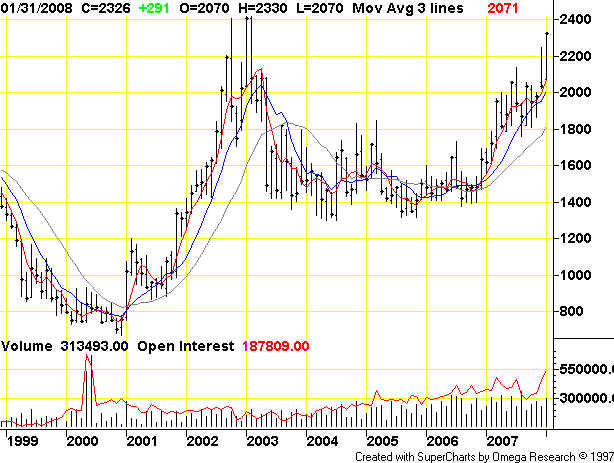
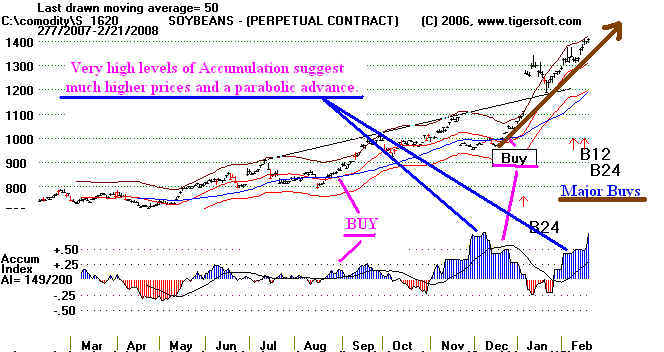
======================== Soybeans ================================
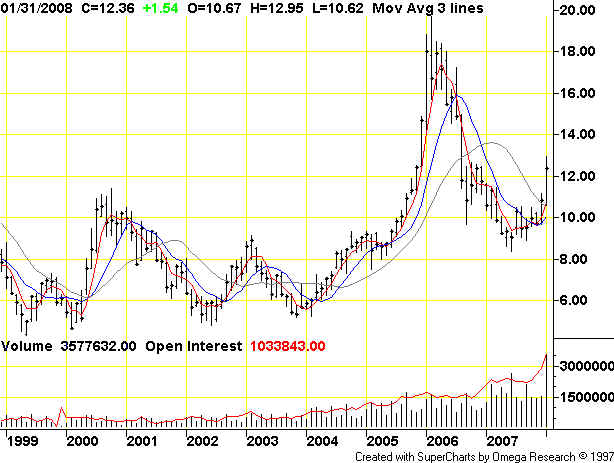
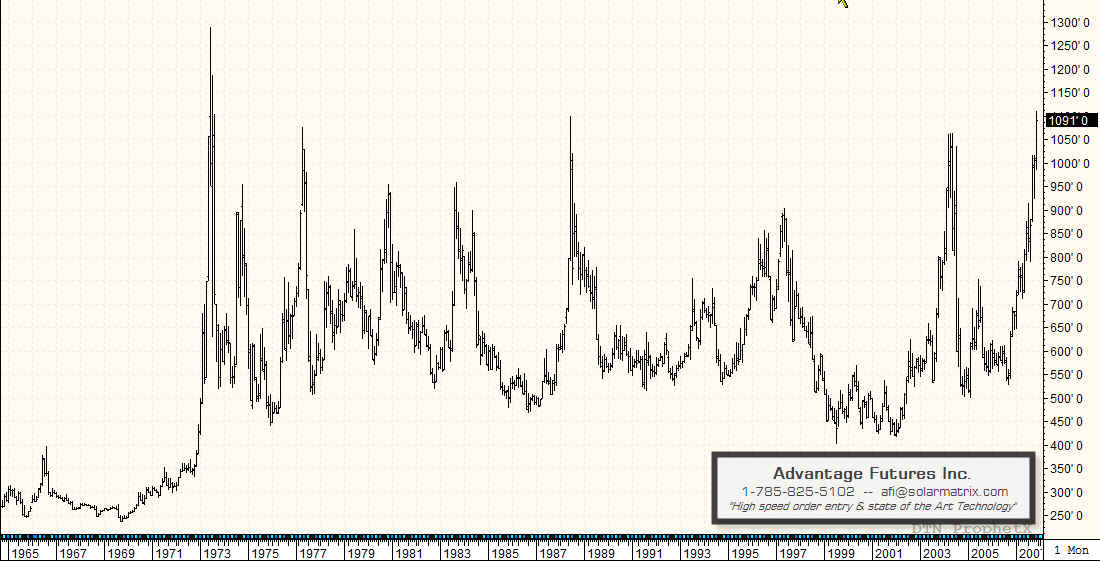
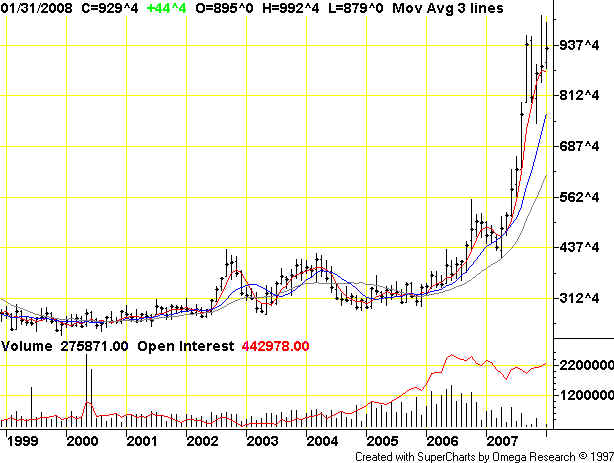
Soybeans are at an all-time high. Their history shows numerous spikes up
followed by equally steep declines. This means that a 5-day or 10-day ma should
probably be used to protect profits.
Monthly Soybeans
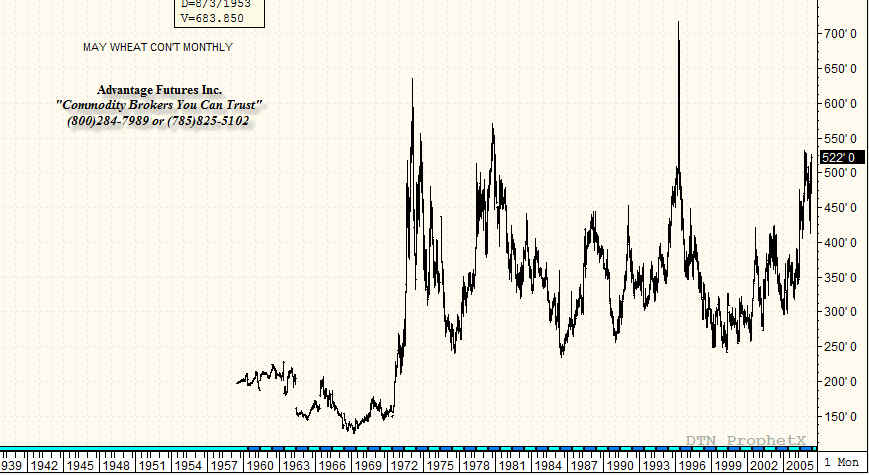
======================== Wheat ================================
Wheat is at an all-time high. Its peaks are often spikes. This means that a 5-day or 10-day
ma should probably be used to protect profits.
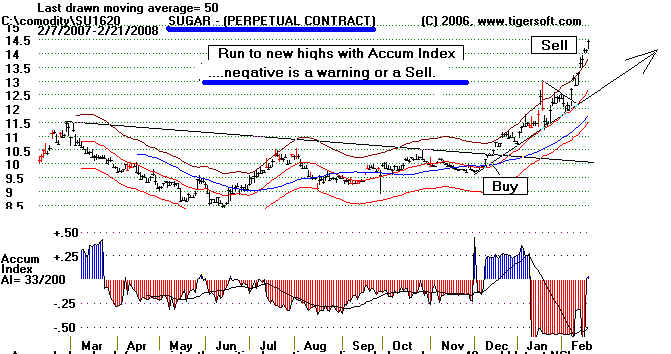
============================= Sugar =========================================
Sugar looks bearish because the new highs show red Distribution.