TigerSoft Freedom News Service 8/7/2009 www.tigersoft.com
BULLS SHOULD BE ABLE TO SPOT
THE 17 RED WARNING FLAGS
IN OVER-EXTENDED LOW-PRICED STOCKS
by William Schmidt, Ph.D. (Columbia University)
(C) 2008 All rights reserved. Reproducing any part of this page without
giving full acknowledgement is a copyright infringement.
Research on Individual Stocks upon Request:
Composite Seasonality Graph of Any Stock for $125.
Example of historical research NEM - Newmont Mining. Order Here.
 |
Tiger
Software Helping Investors since 1981 More Oil
Profits' Cartoons.
|
Stock Market Bulls
Should Be Able To Spot
17 Warning Signs To Look for in Over-Extended
Individual Low-Priced Stocks.

Often a stock gets so far above its rising 50-day ma, that there seems to be more risk
if one placed a stop beneath this line than there is upside potential. In some of these
cases, the stock will drop only to the buy-zone area between the 50-day and 65-day ma.
and then recover. But in many cases, such a decline is more than 20% and there, is no
guarantee, that the stock that rocketed up so fast this will not utterly fizzle once the high
performance speculators are forced to sell. The absence of shorts may actually mean
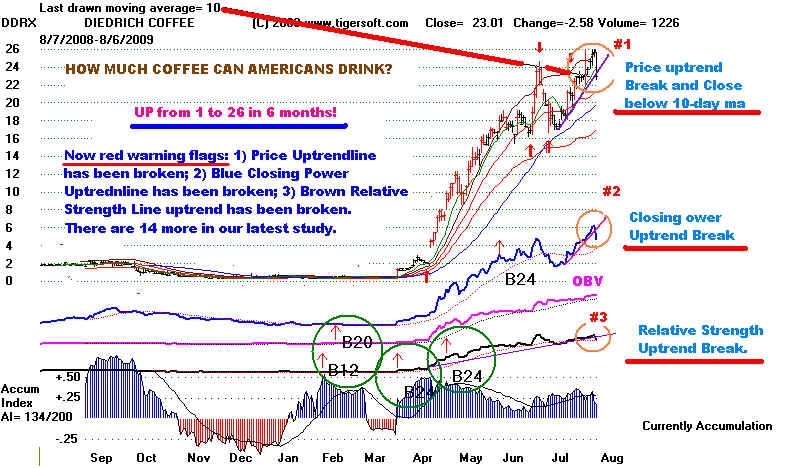
that there is little cushion of buying underneath. Stocks as strong as DDRX below have
driven short sellers CRAZY! We are not suggesting selling short, only when to take
profits in explosive super stocks that our augmented Buy B24s and B12s picked early
in their moves.
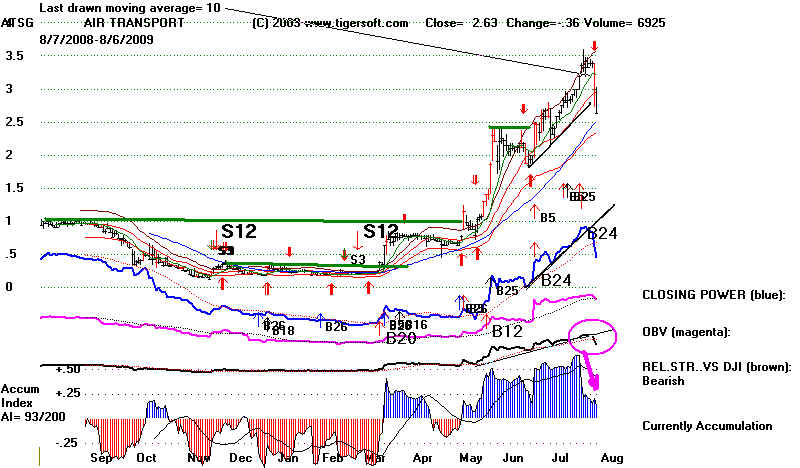
The first stock, AFSG, now shows 7 red flags, but there are 10 more that are seen in
the stocks shown below.
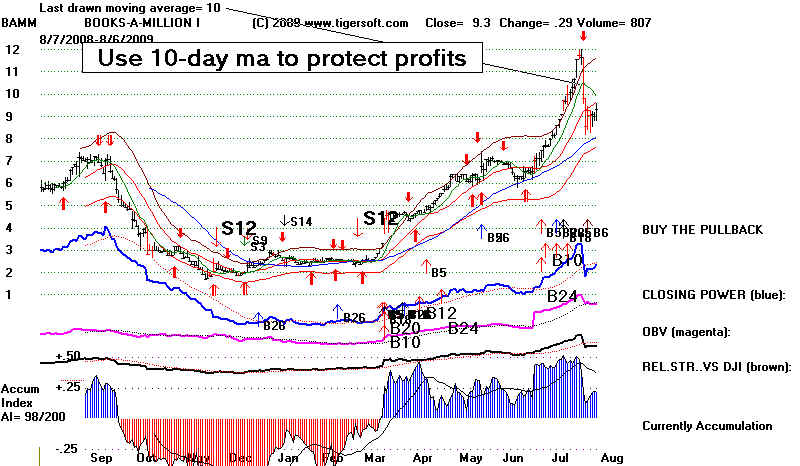
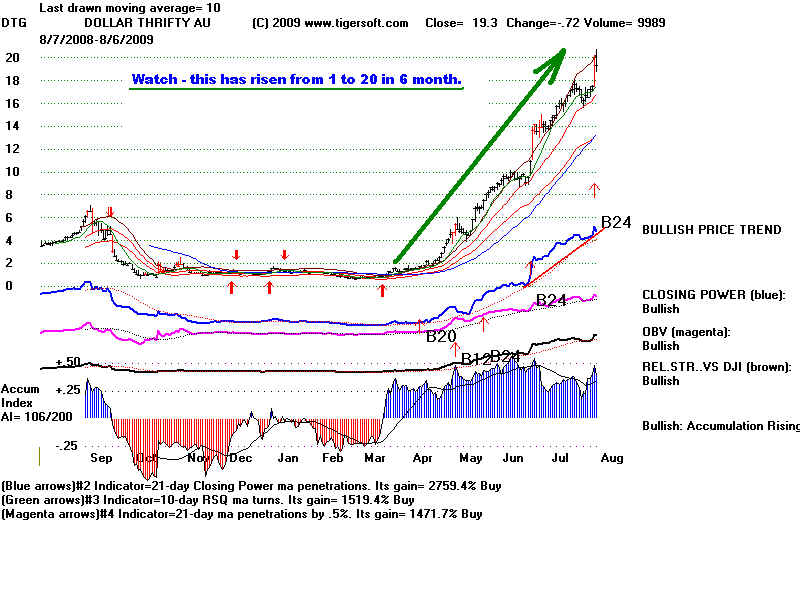
1) The stock has just more than quadrupled in 6 months and violates its 10-day ma on a closing basis.
(DDRX, at the top of this page, has risen from 1 to 26!):
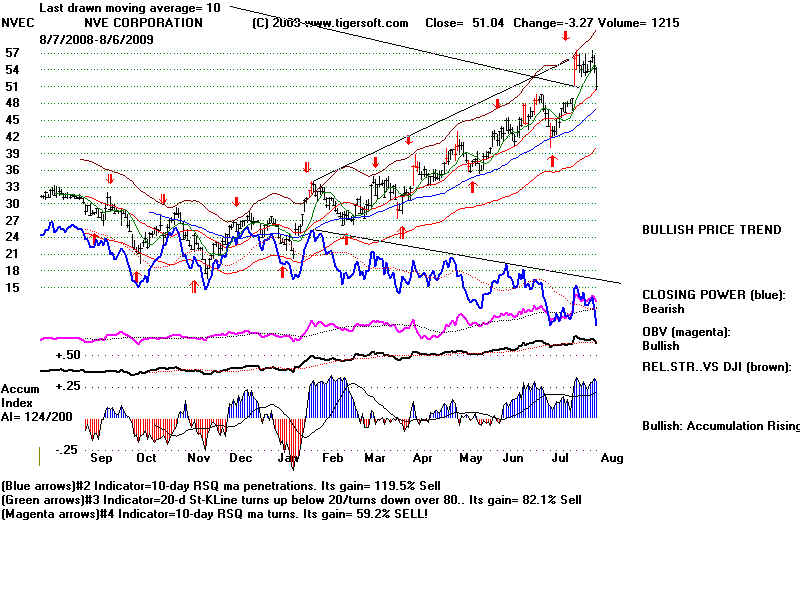
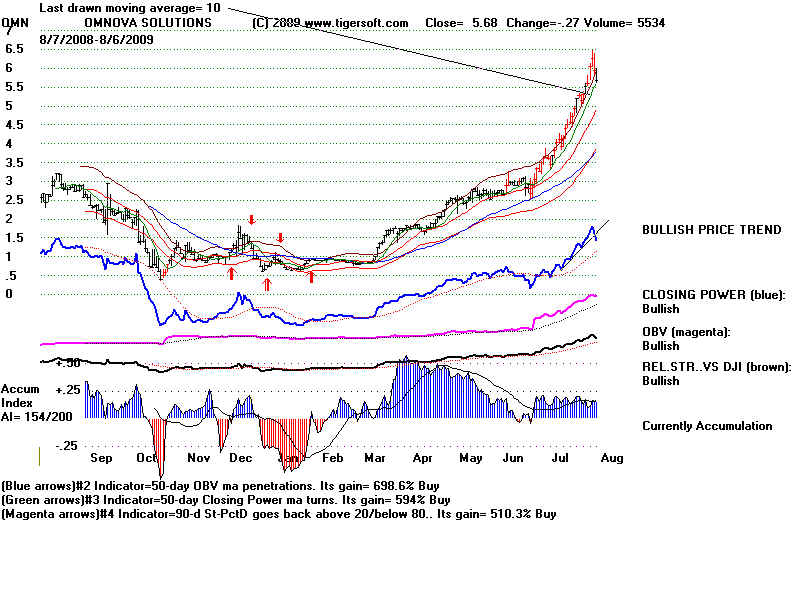
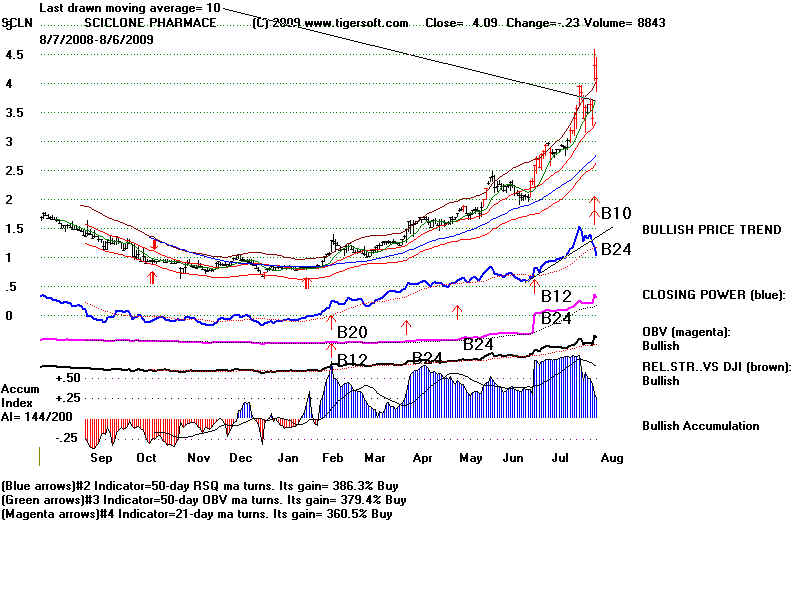
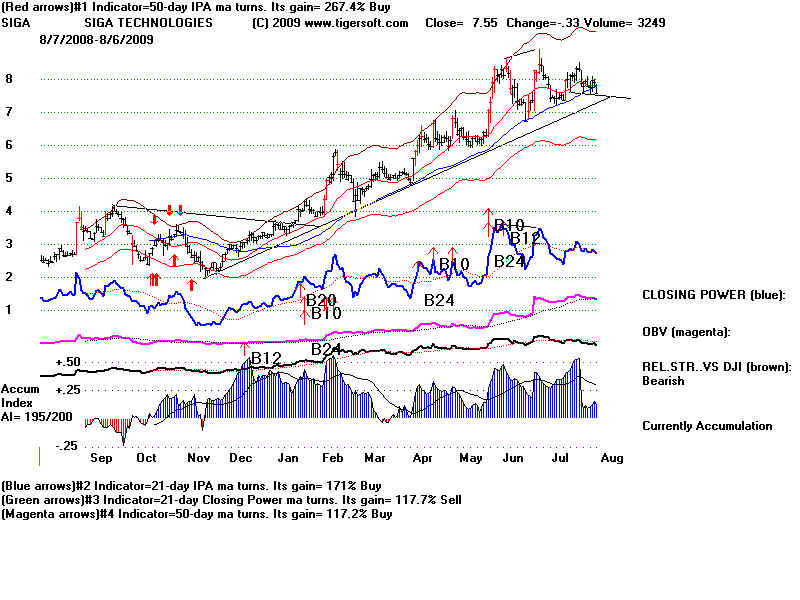
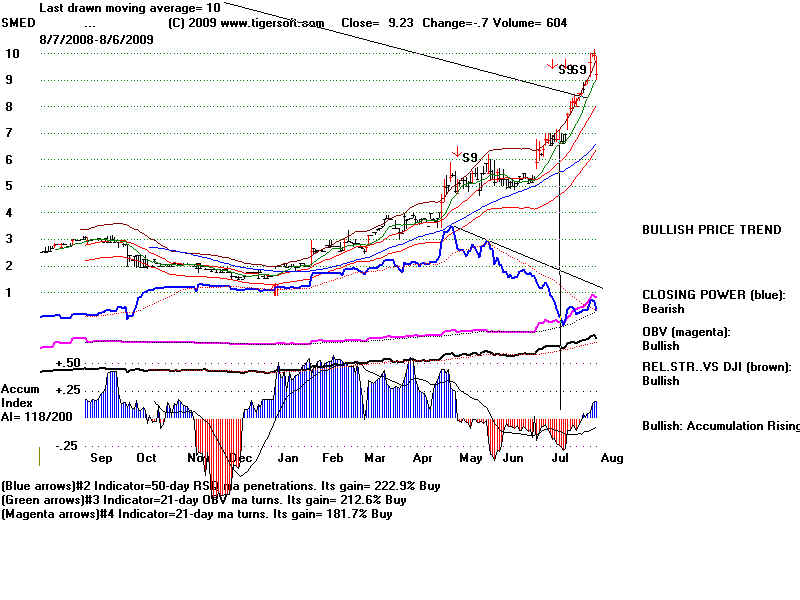
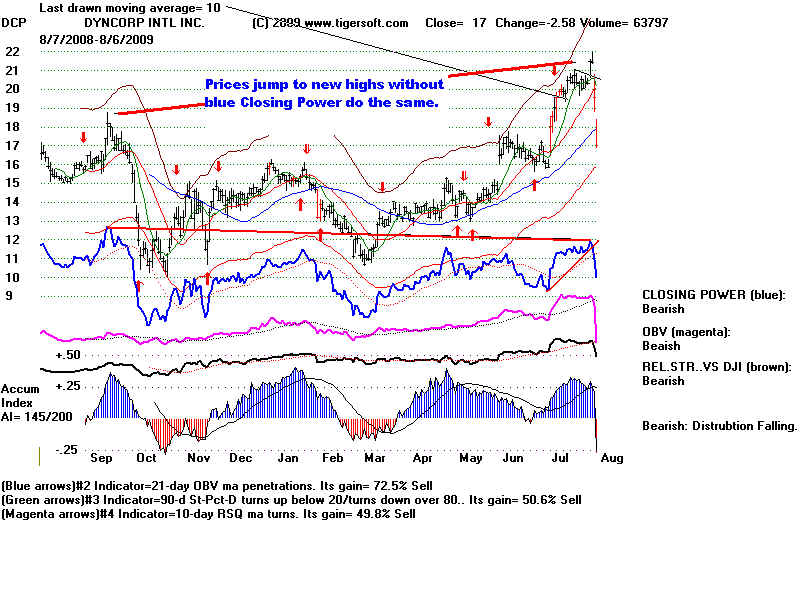
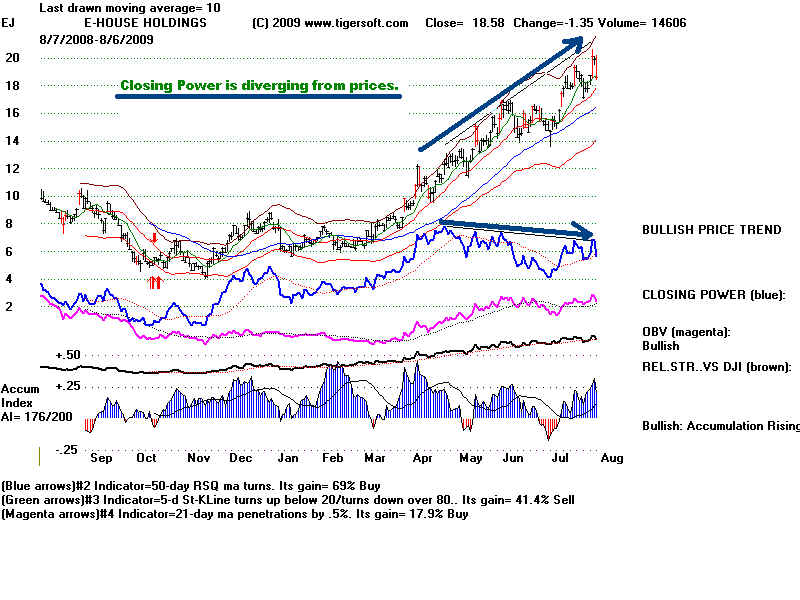
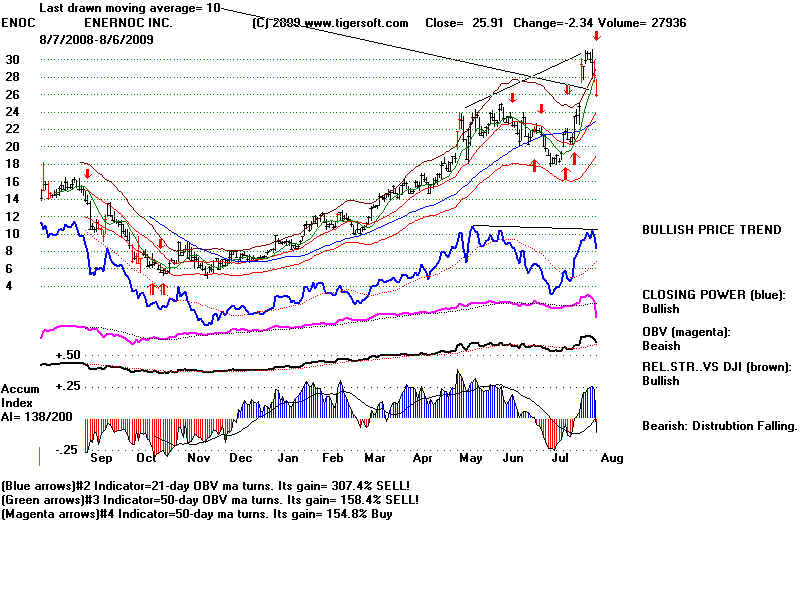
2) The uptrend of the (Blue) Closing Power is violated, especially if there has been a failure
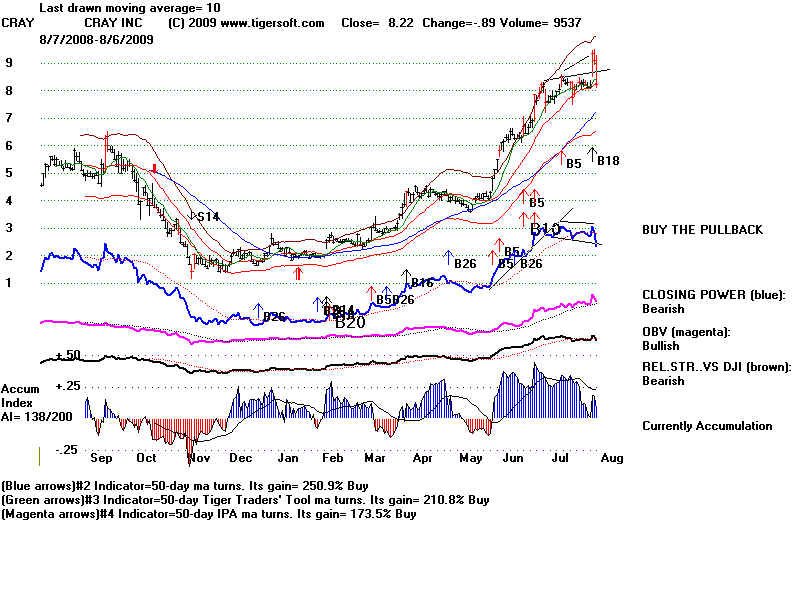
by CLosing Power to confirm a new price high. (CRAY. DSCP, NVEC, SCLN, SMED)
3) The (magenta) OBV line drops below its dotted 21-day ma
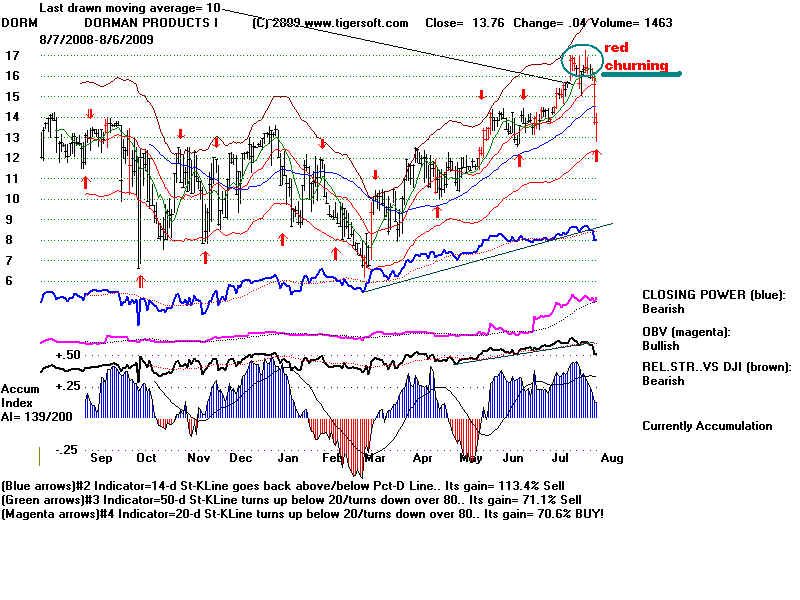
4) The stock's brown Relative Strength Quotient Line's uptrend is violated.(DORM)
5) The Accumulation Index falls from above +.50 to below +.25 in less tha 2 weeks.
6) The AI/200 score is under 130
7) Prices break their steep price uptrendline
Look also for:
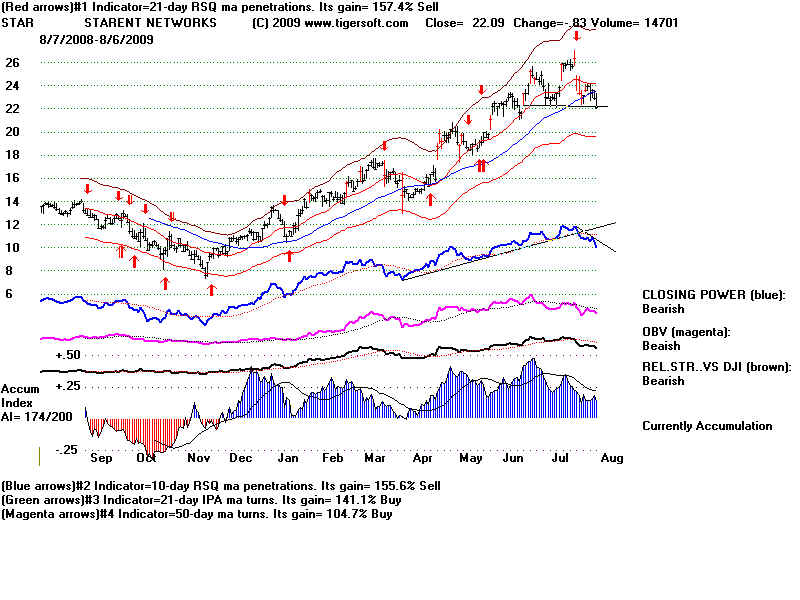
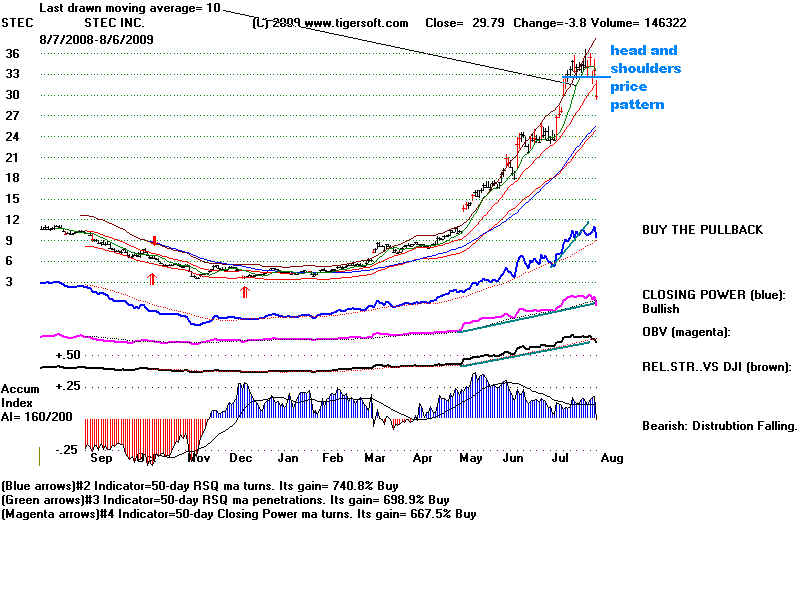
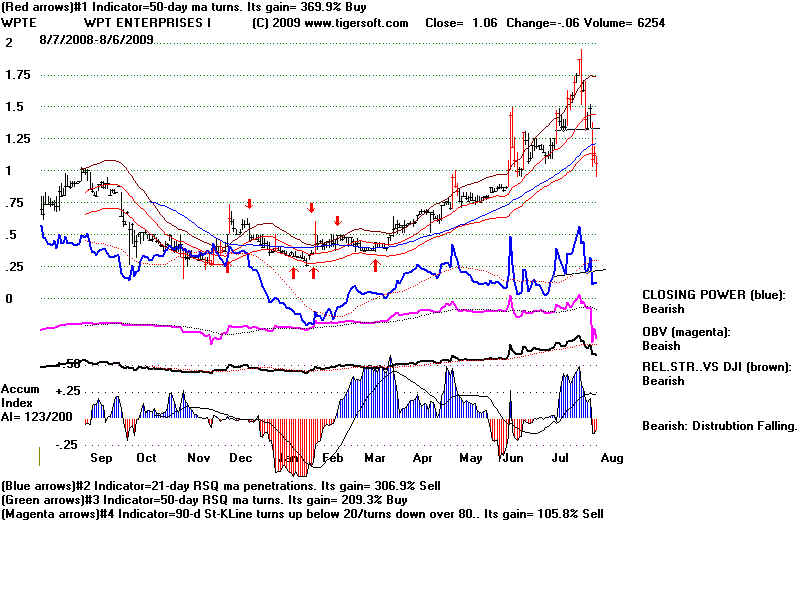
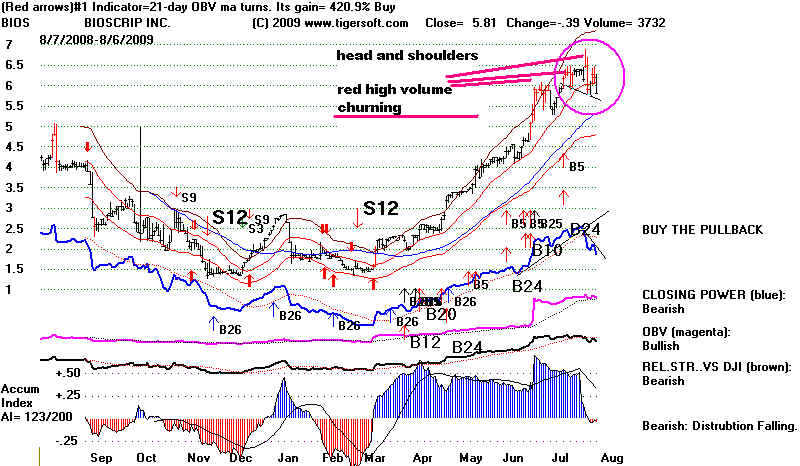
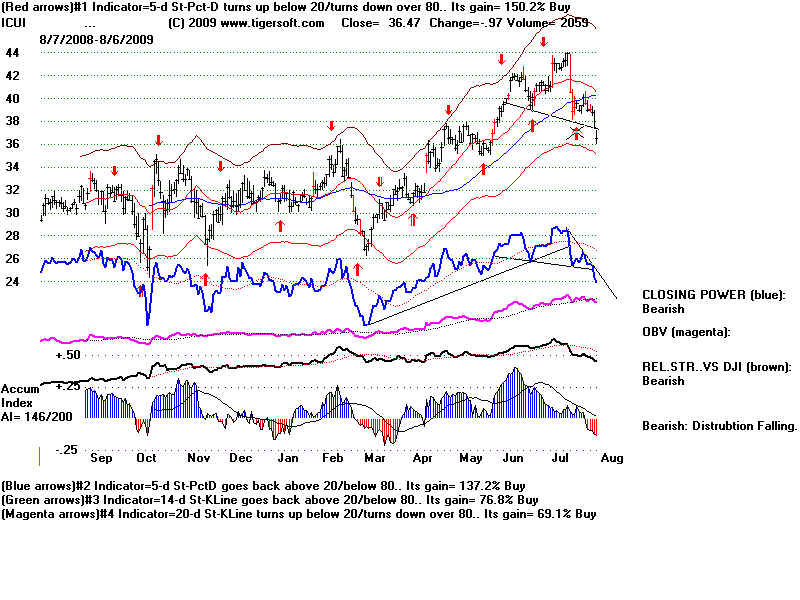
8) bearish head and shoulders patterns. (BIOS, ICUI, SIGA, SMRT, STAR. STEC, WPTE)
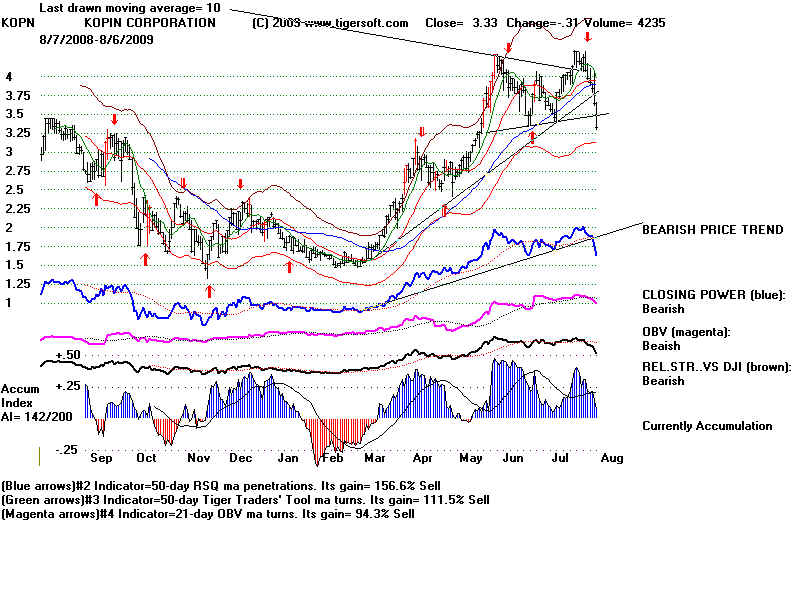
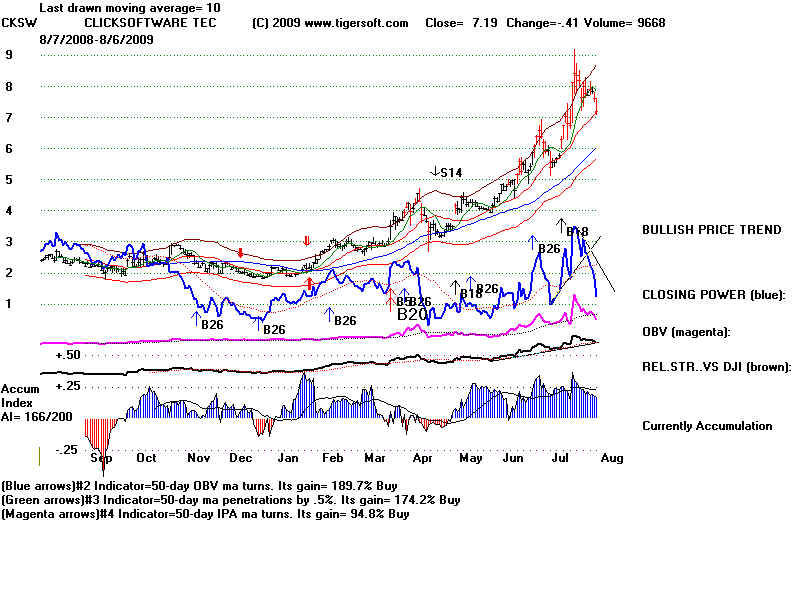
9) red high volume churning. (BIOS, CKSW, DORM, KOPN)
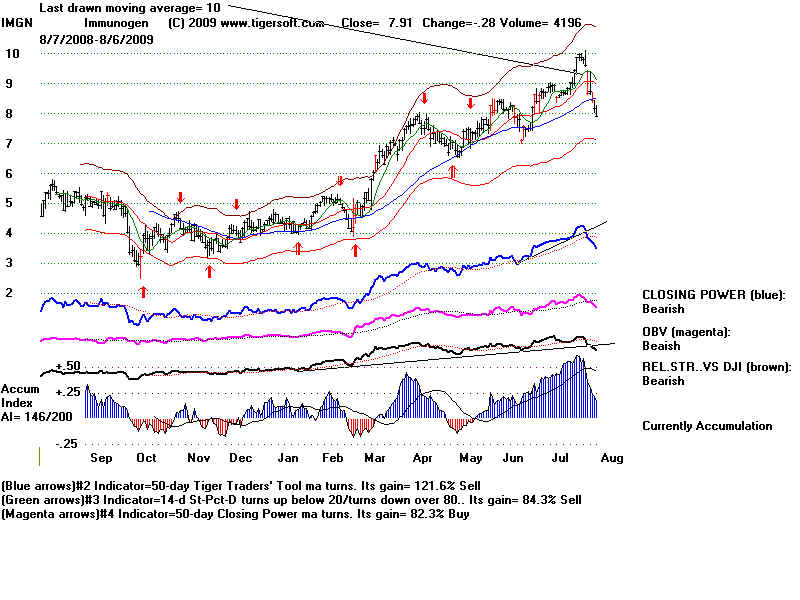
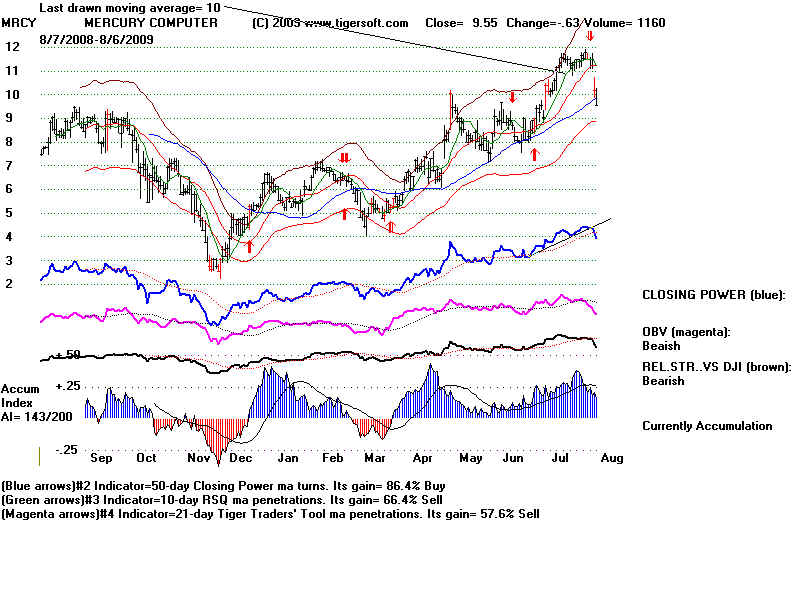
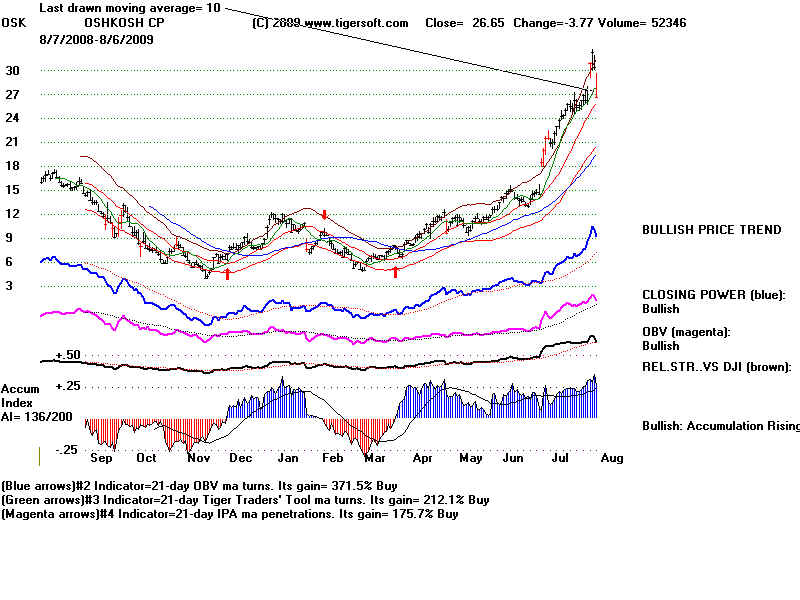
10) red high volume downside gaps. (DSCP, IMGN, MRCY, OSK)
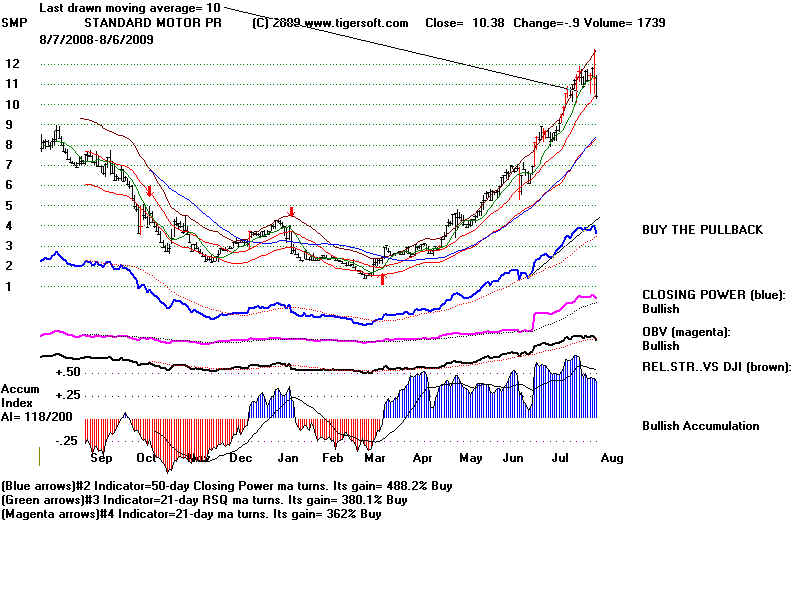
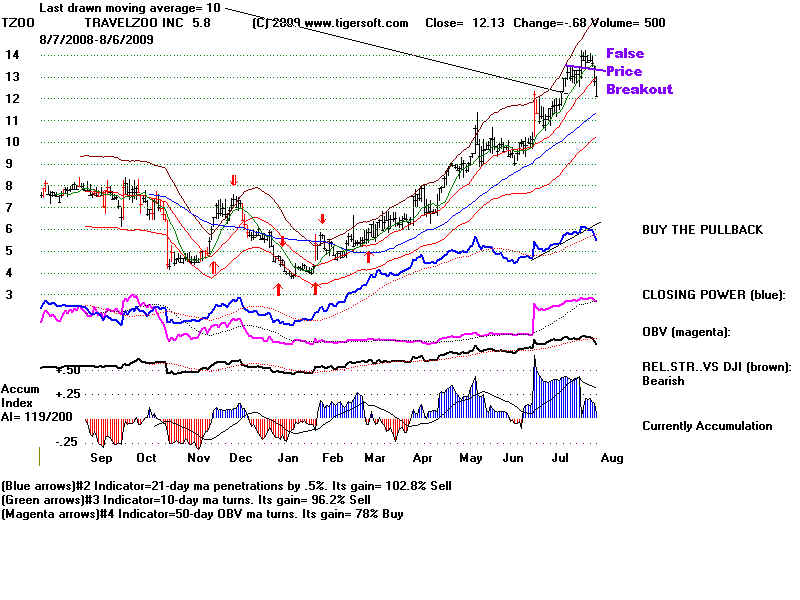
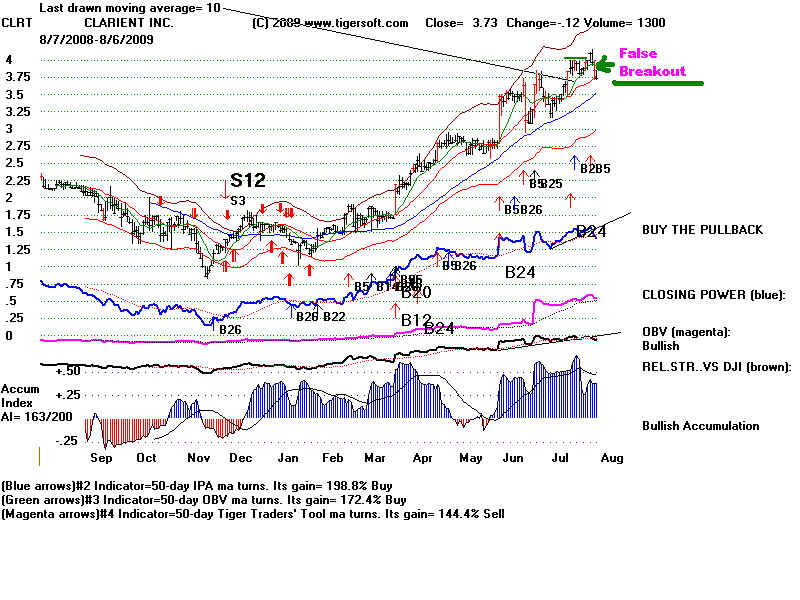
11) false breakouts. (CLRT, CRAY, SMP, TZOO, VITA)
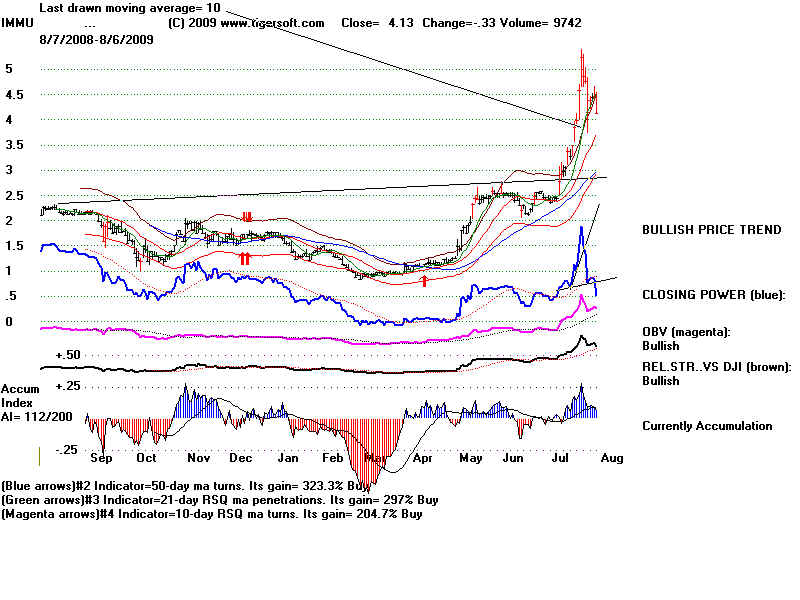
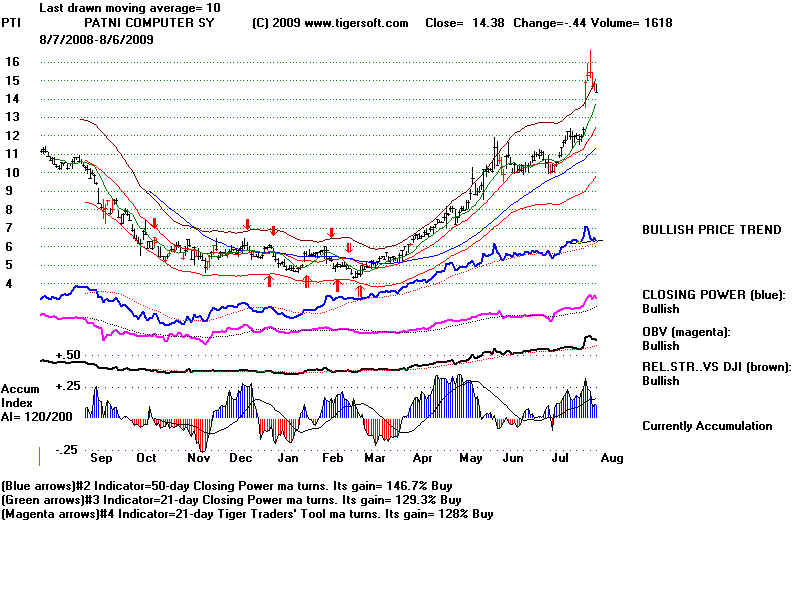
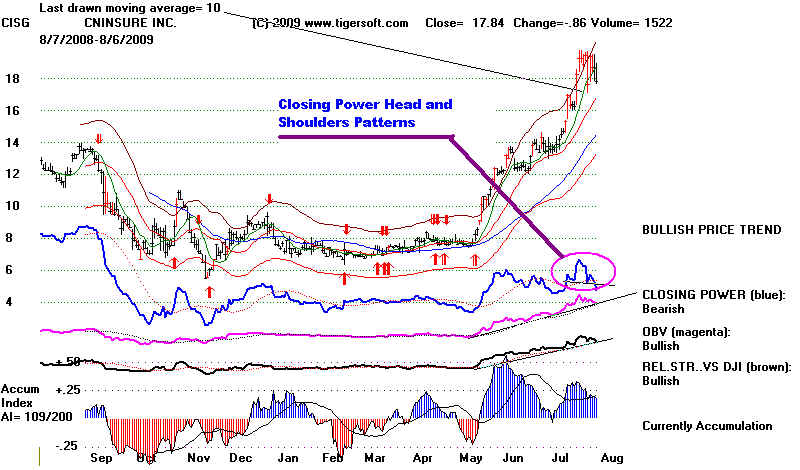
12) Closing Power head and shoulders patterns. (CISG, IMMU, PTI, WPTE)
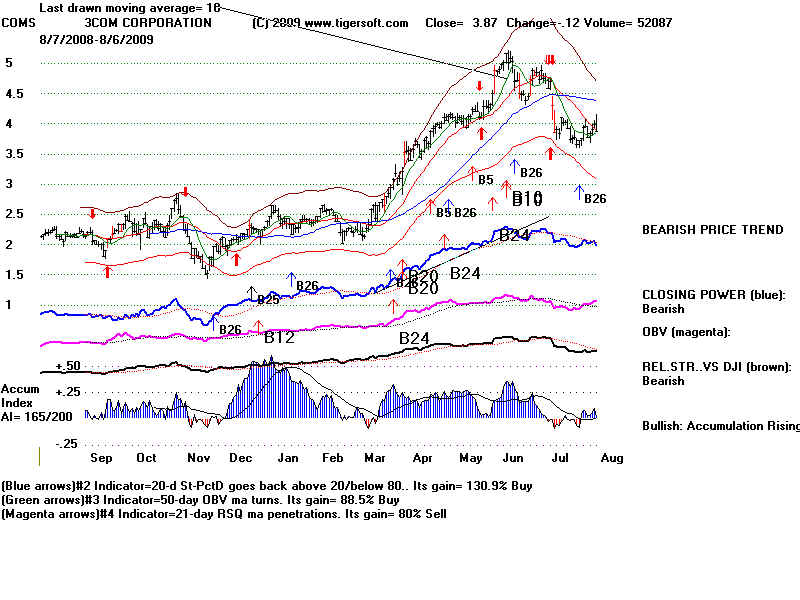
13) Prices breakdown and then rally but fail to get past falling 21-day ma (COMS )
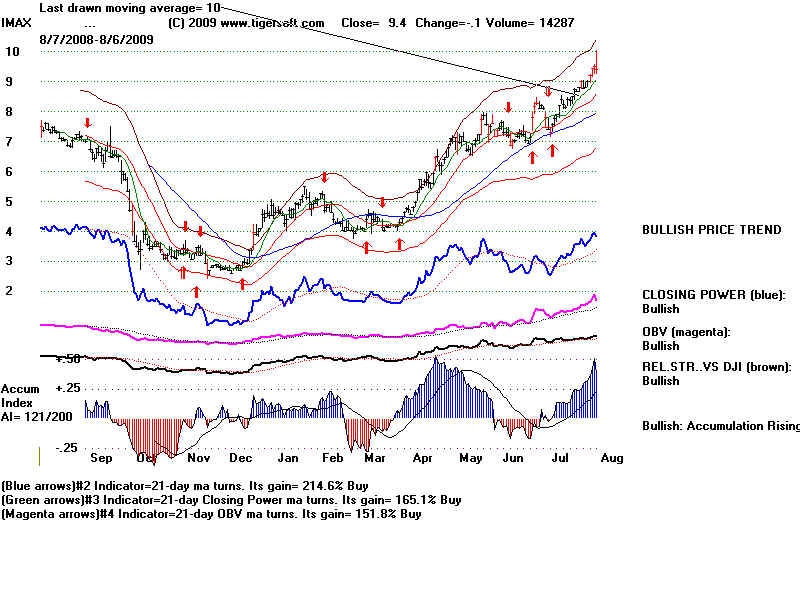
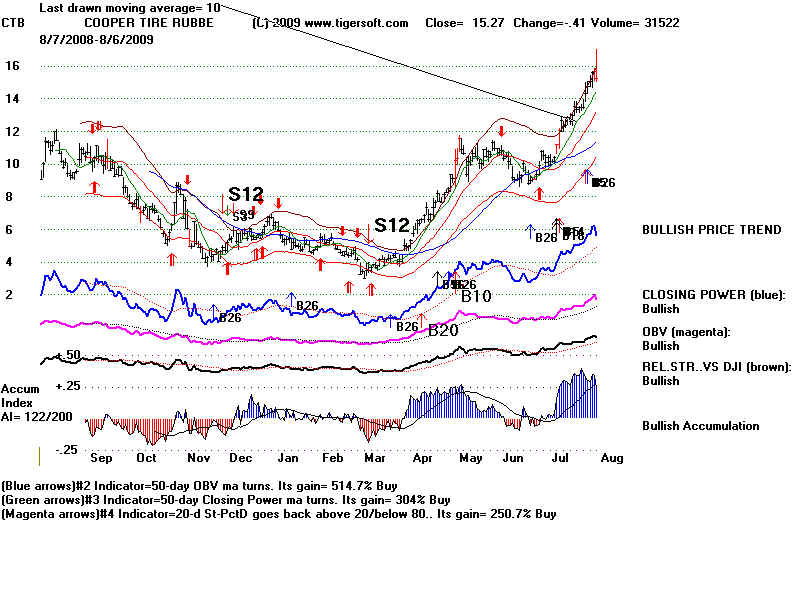
14) Red high volume reversal day (CTB. IMAX )
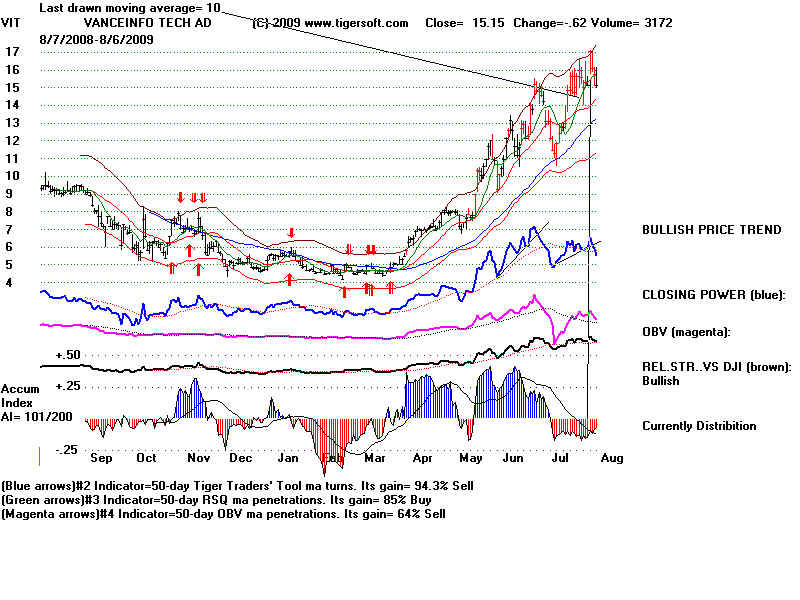
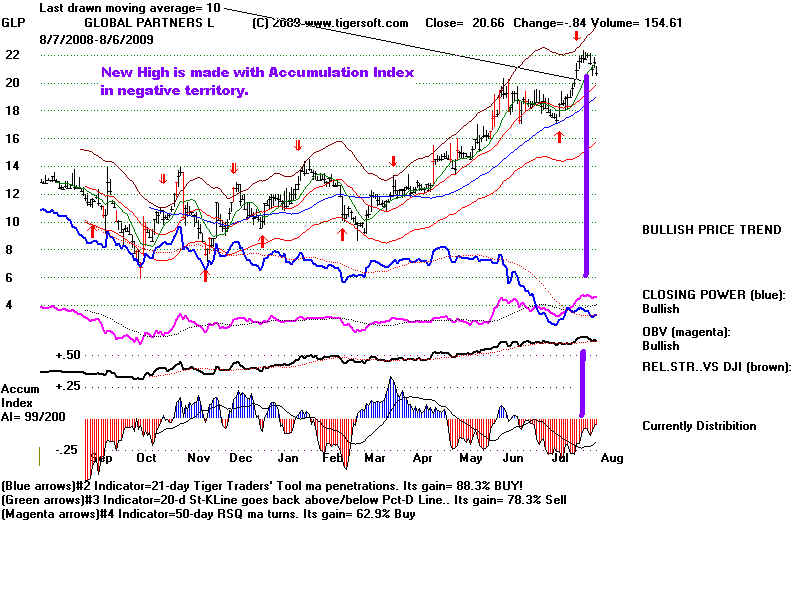
15) New highs are made with the Accumulation Index in negative territory. (GLP, VIT)
16) Hands above the Head Price Pattern (KOPN)
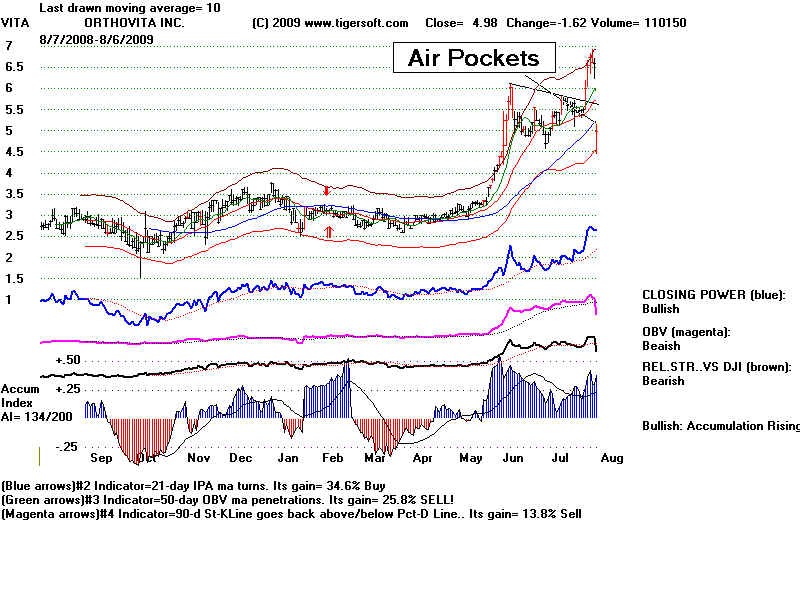
17) Price air pocket (VITA)
BAMM shows the same red flags in the chart below.
RED REVERSAL DAY
RED REVERSAL DAY