(C) 2009 www.tigersoft.com
July 29, 2009
1965-2008, the DJI has risen these percentages of the time:
--------------------------------------------------------------------------------
56% after the next 3 trading days. Avg Gain = +0.3%
49% after the next 5 trading days. Avg Gain = +0.0%
54% after the next 10 trading days. Avg Gain = +0.3%
56% after the next 21-trading. Avg Gain = +0.2%
59% after the next 2 months Avg Gain = -0.4%
51% after the next 3 months Avg Gain = -0.4%
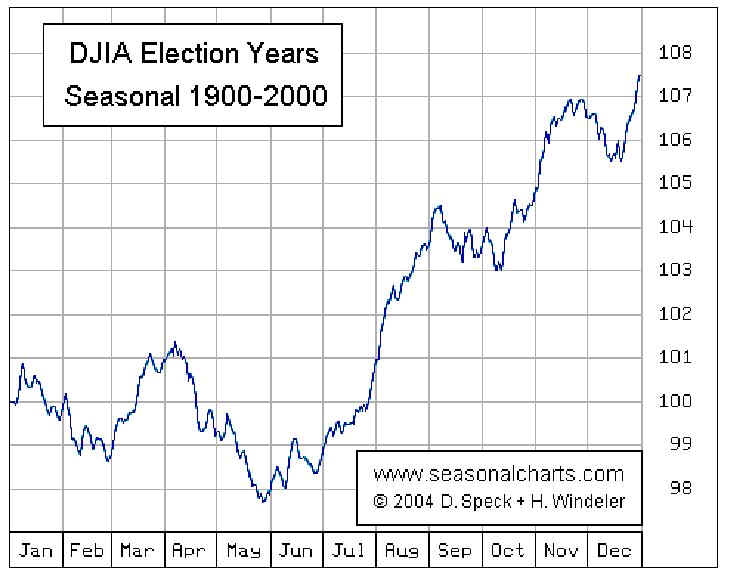
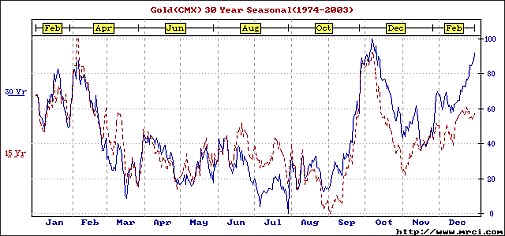
OTHERs' SEASONAL CHARTS
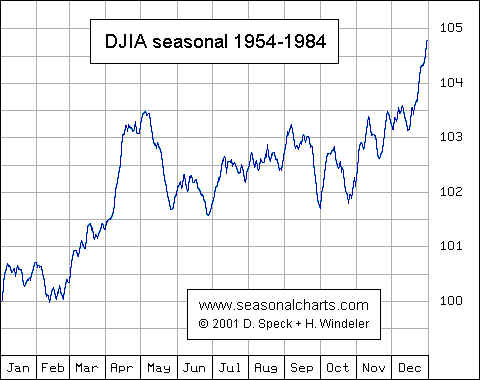
To demonstrate the limitations of cycles, note how little the chart below would have
prepared you for the dire decline after June in 2008.
DJI - 1954-1984
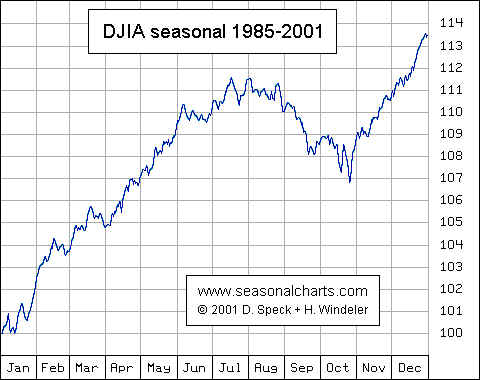
DJI 1985-2001
Gold
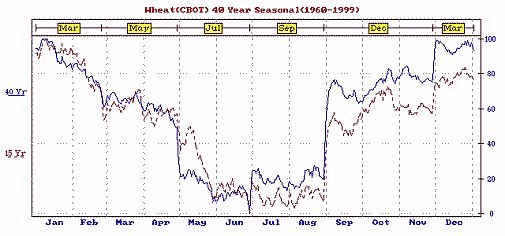
Wheat