----------------------- For TigerSoft Elite Subscribers -------------------------
This is a supplement to my book Explosive Super Stocks book.
Horizontal Breakouts
Make Excellent Trades
by William Schmidt, Ph.D.
All Rights Reserved. (C) 2008 William Schmidt and Tiger Software
Stocks exceeding flat and well-tested resistance often make quick spurts up as
traders realize that there is not much stock readily available just above a price level that
has persisted for some time. The aggressive buying that allowed the breakout is apt to
continue and advance the stock sharply as others are attracted to the quick advance.
Good news often comes out: better earnings, a broad industry-wide advance or even a
coming buy-out.
Why is flat resistance so important to spot? Stock offered exactly at the
old highs usually represents less informed, simple and easy profit-taking at what
seems an advantageous price. It is less likely to be smart and insider-informed selling.
I have said in my Explosive Super Stocks book that it often represents lazy
and inattentive institutional selling. Once prices breakout, those who sell may
have sellers' remorse and either buy back quickly or vow to buy again if the stock
falls back to the level they have sold.
Aggressive traders can profit from these breakout moves time after time in
many different stocks. To be successful, though, over the long run and when bear markets
occur, traders should use good money management principles, work with protective stops
and learn to read a chart to assess a stock's internal technical health to validate the breakout.
Using Peerless Stock Market Timing will make you aware when the overall market has
risks that should make you especially vigilant. You will do best at this game when the number
of New Highs is expanding and over 100 on the NYSE. That is the major reason for
my posting each day the number of 12-month NYSE new highs and lows.
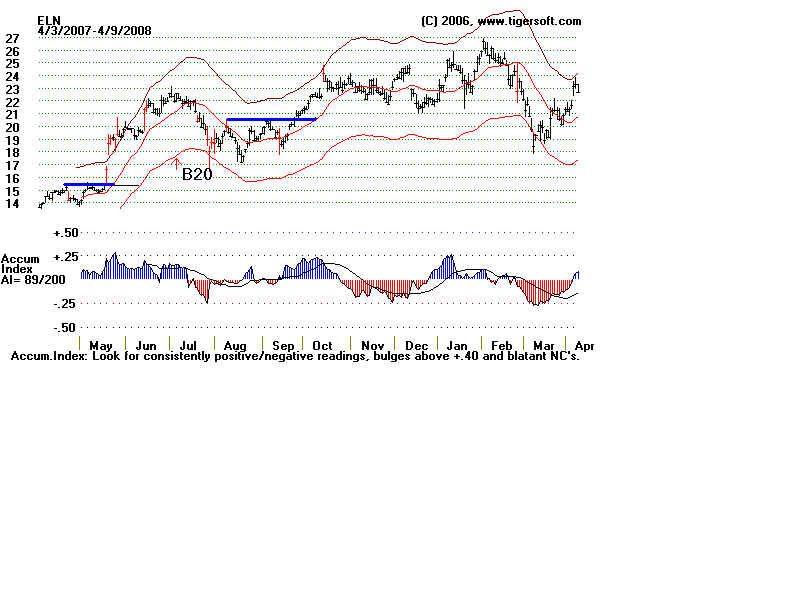
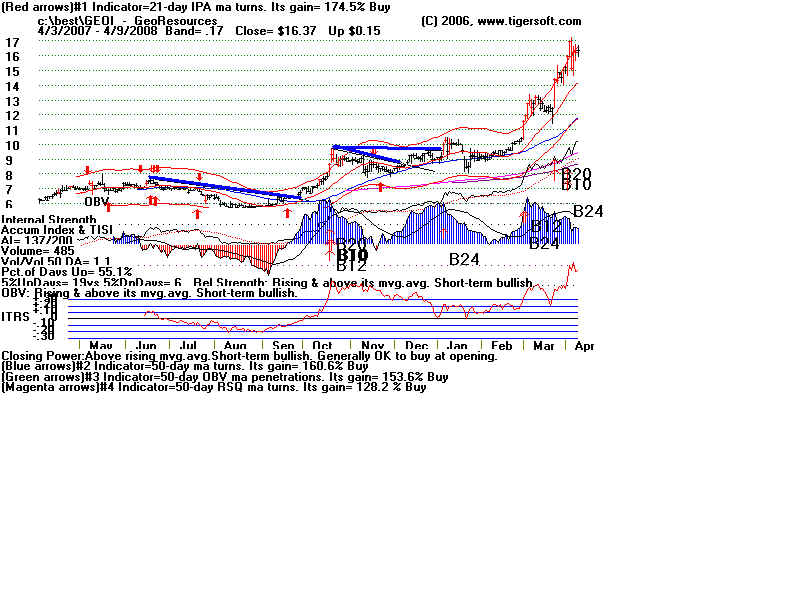
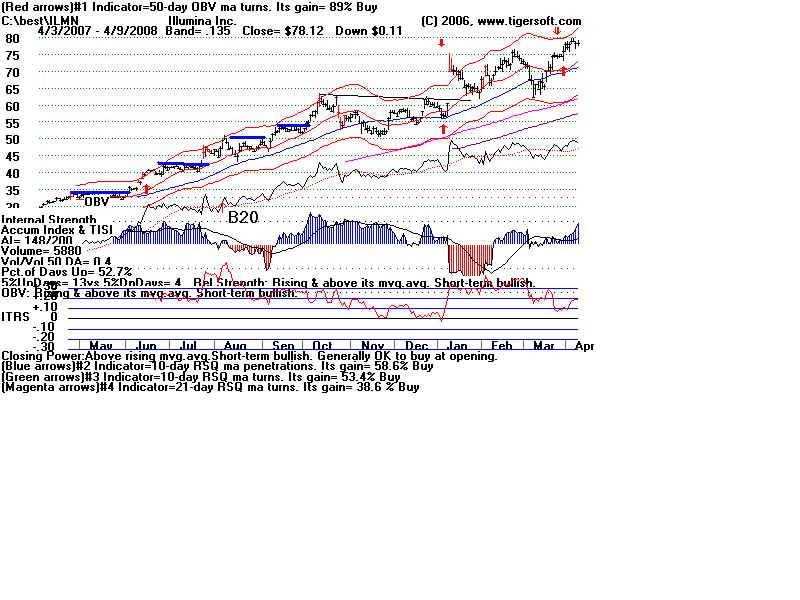
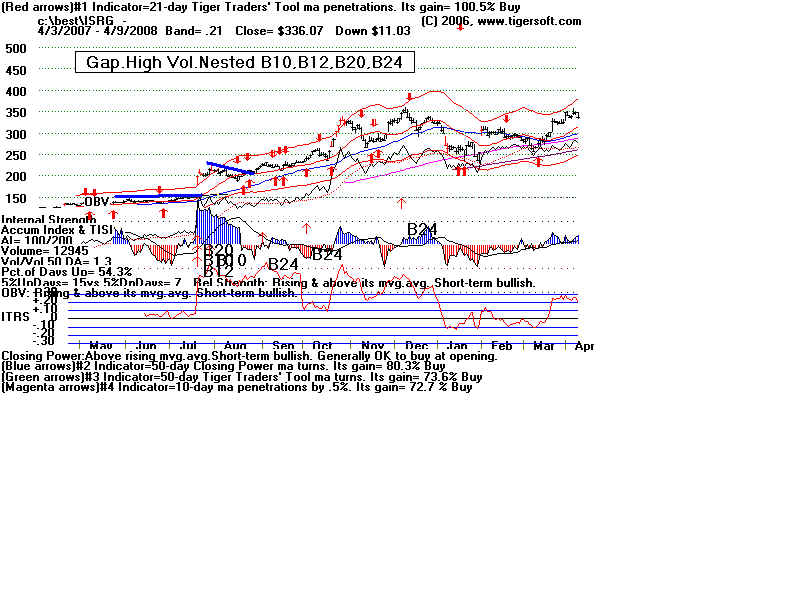
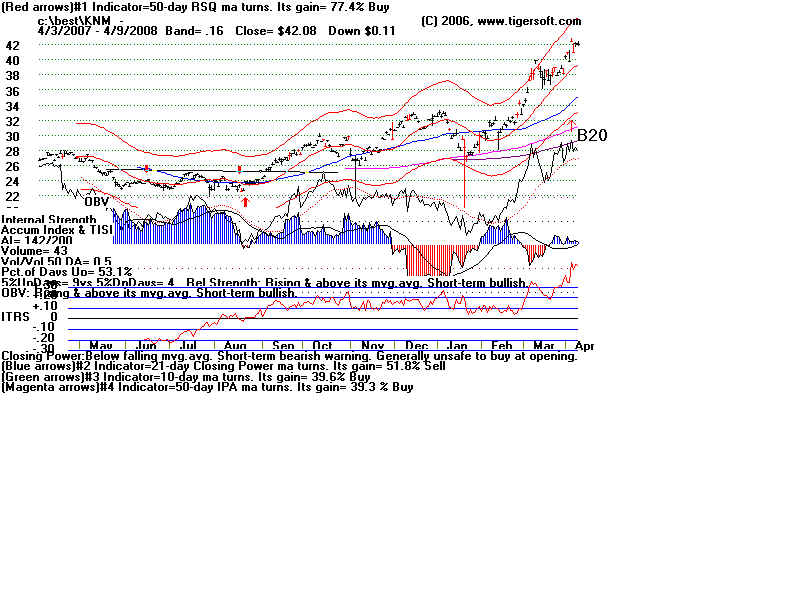
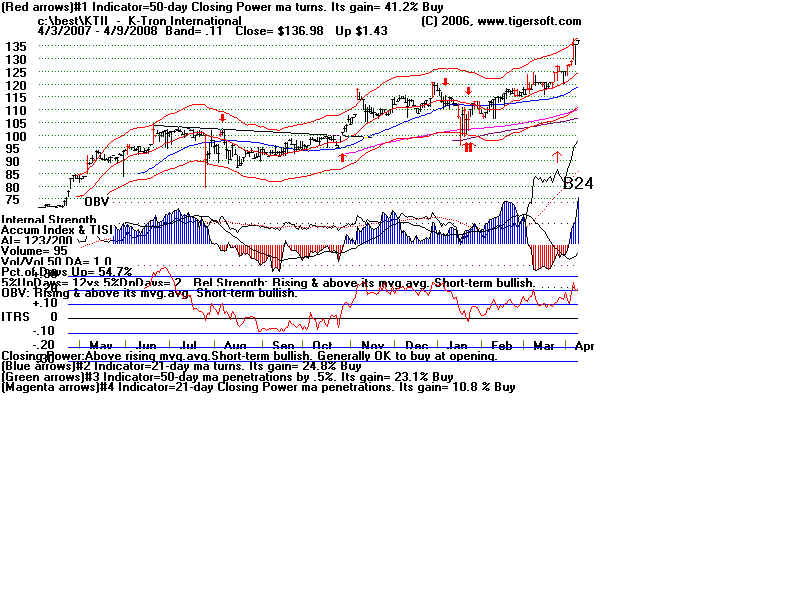
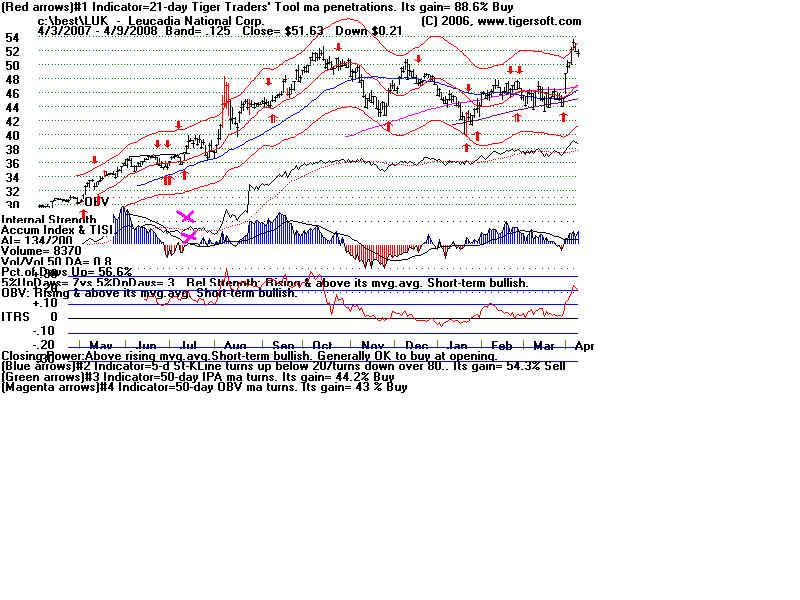
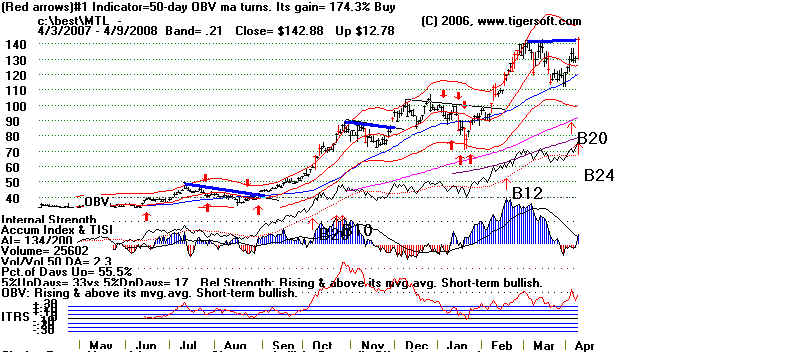
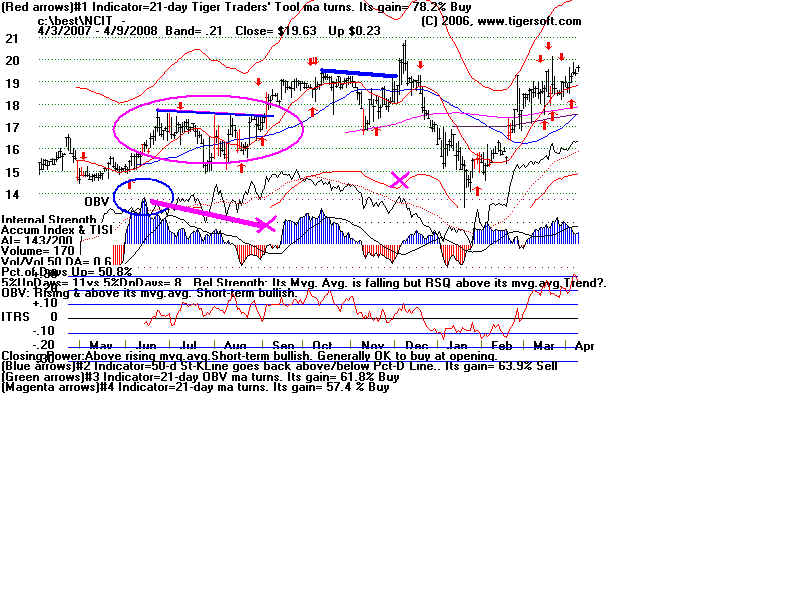
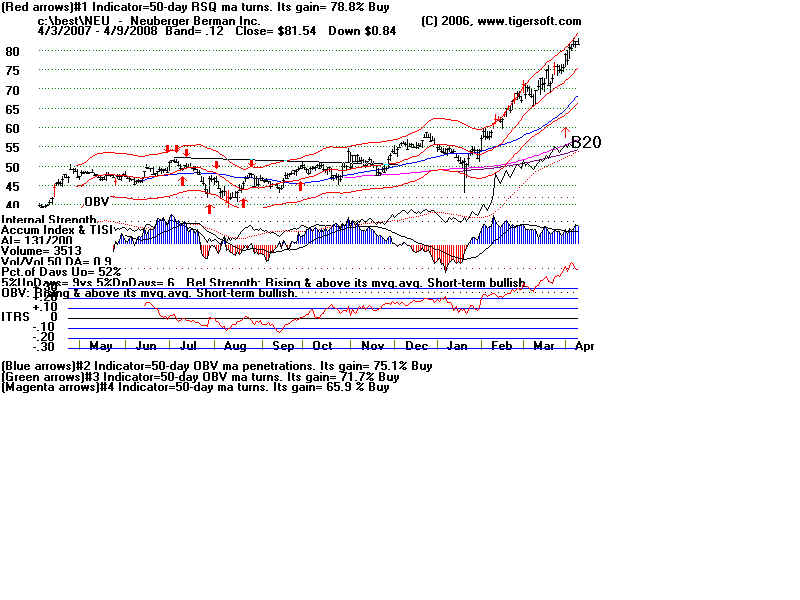
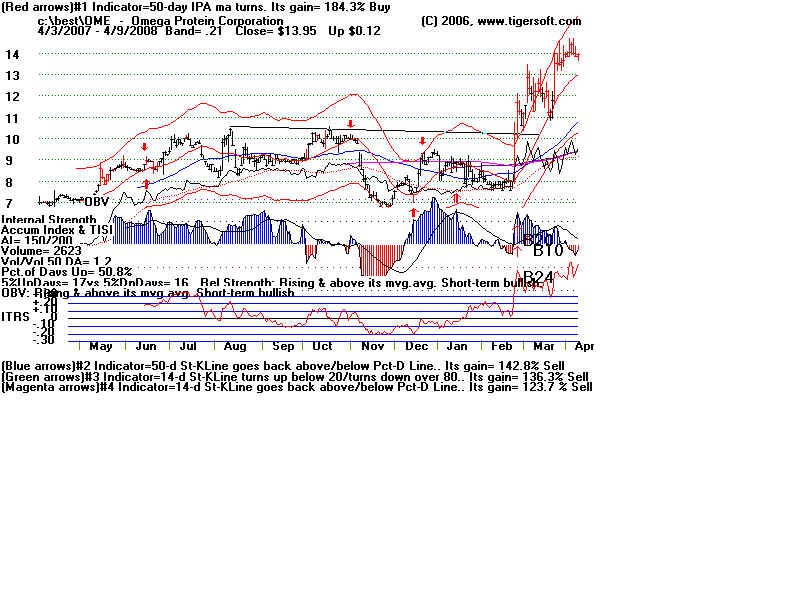
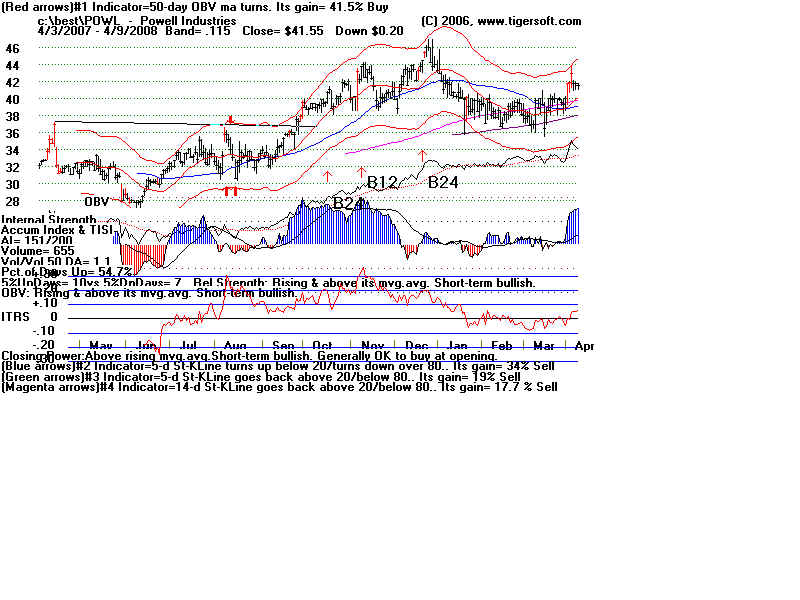
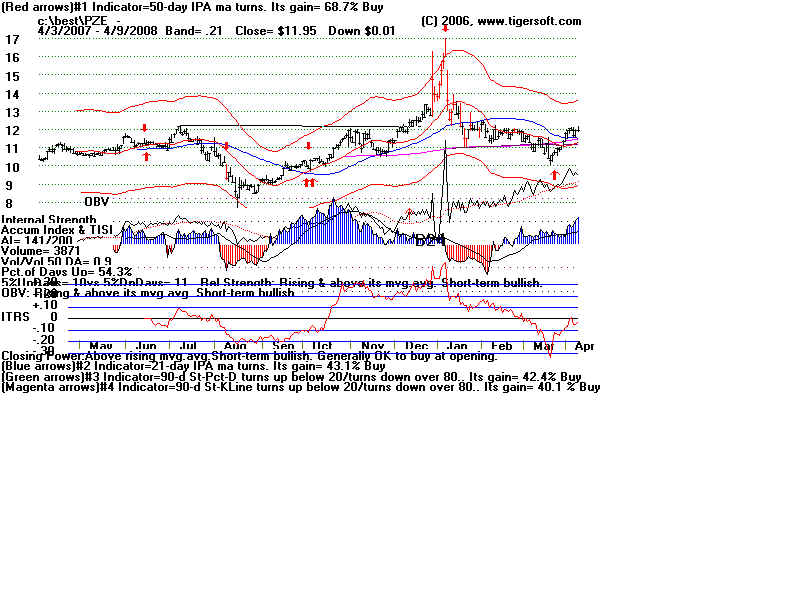
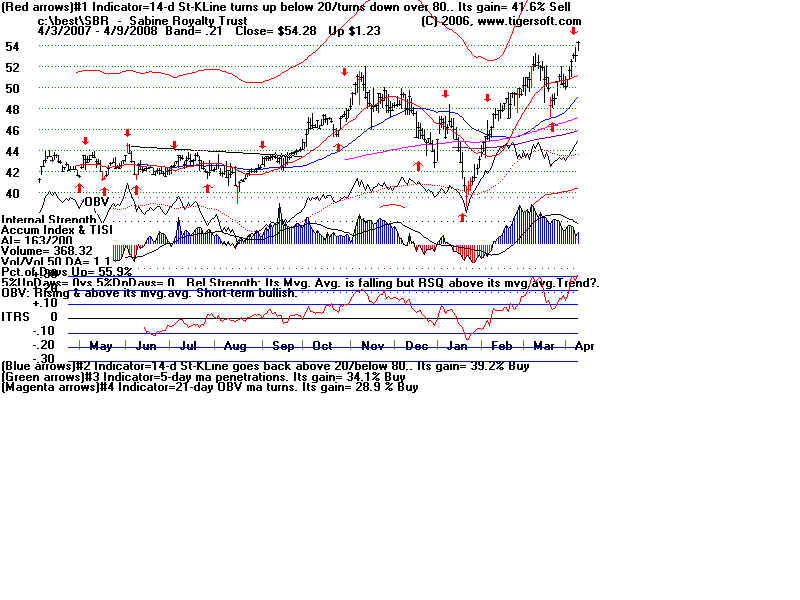
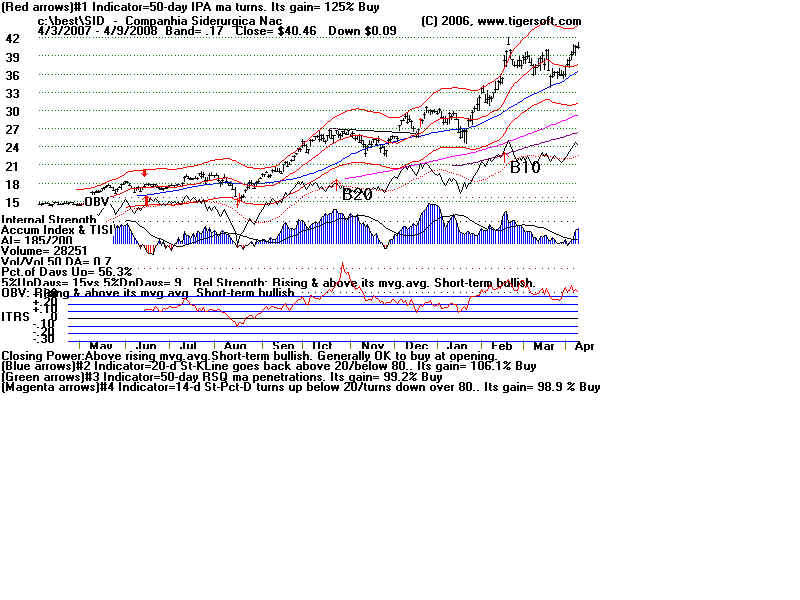
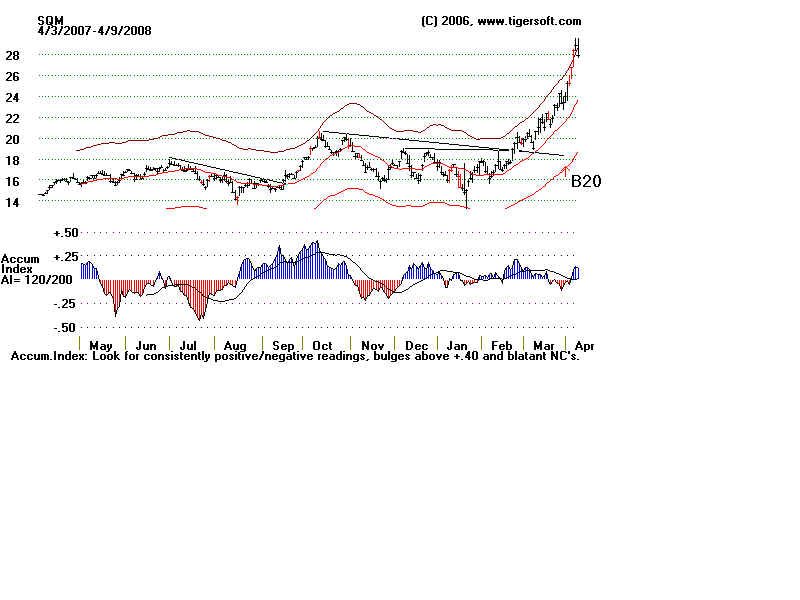
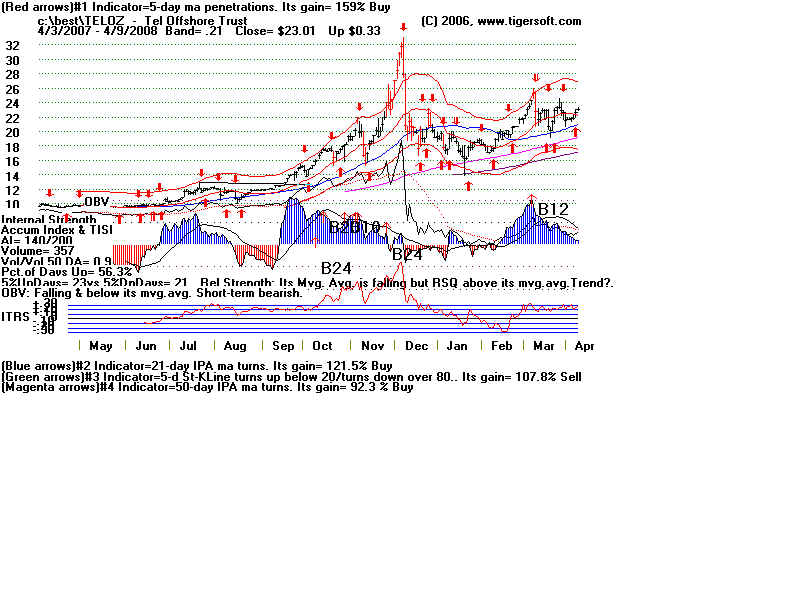
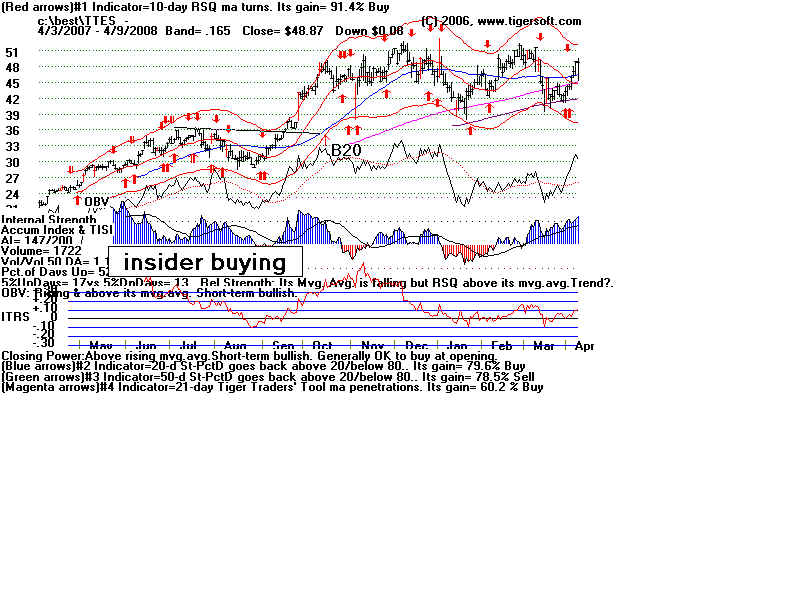
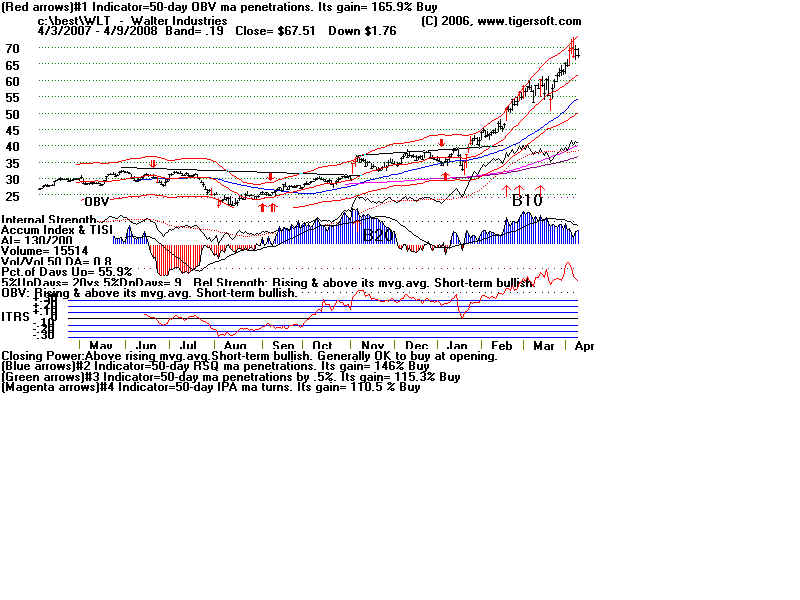
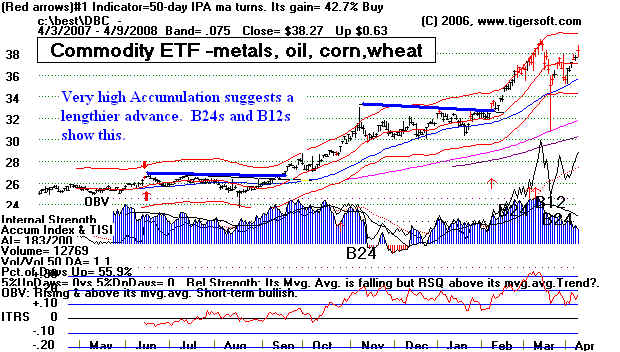
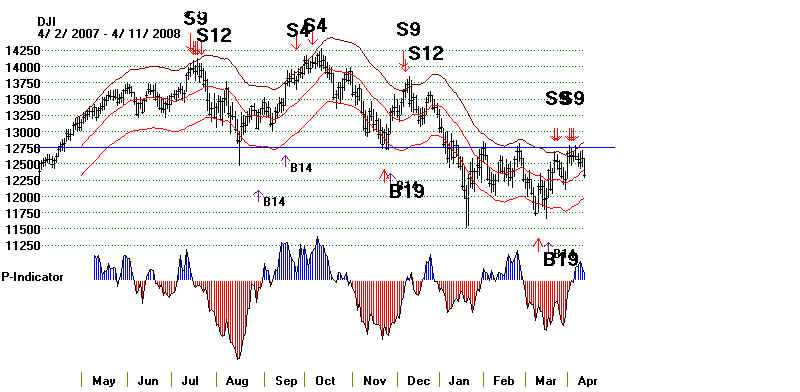
Placing automatic major Buy signal on your charts. Look for major Tiger Buys:
B10, B12, B20 and B24. See the chart below. Simultaneous major Buys are particularly
bullish.
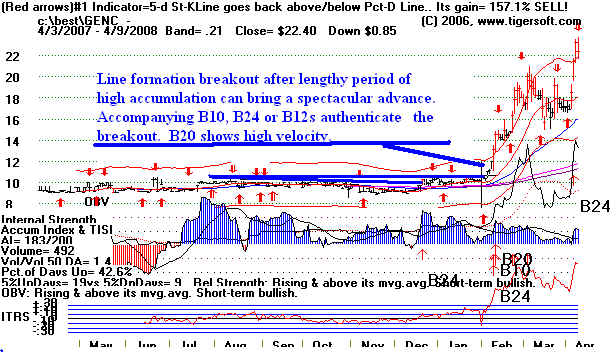
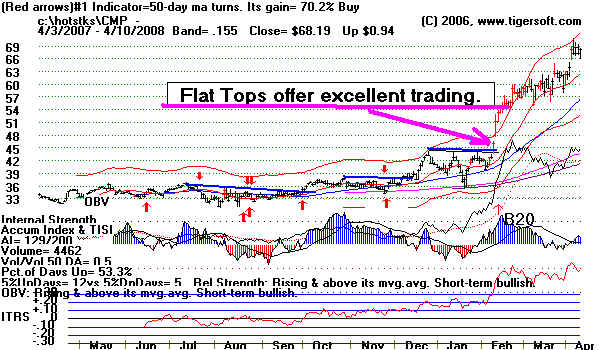
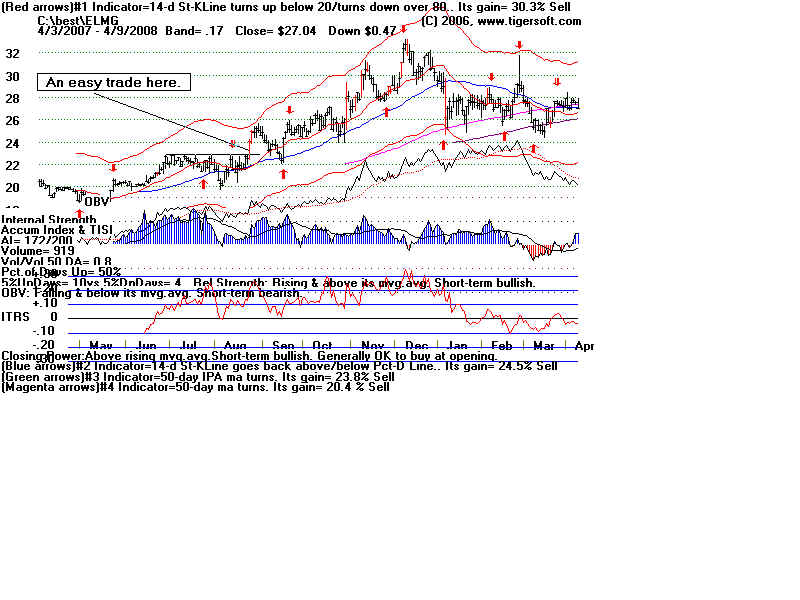
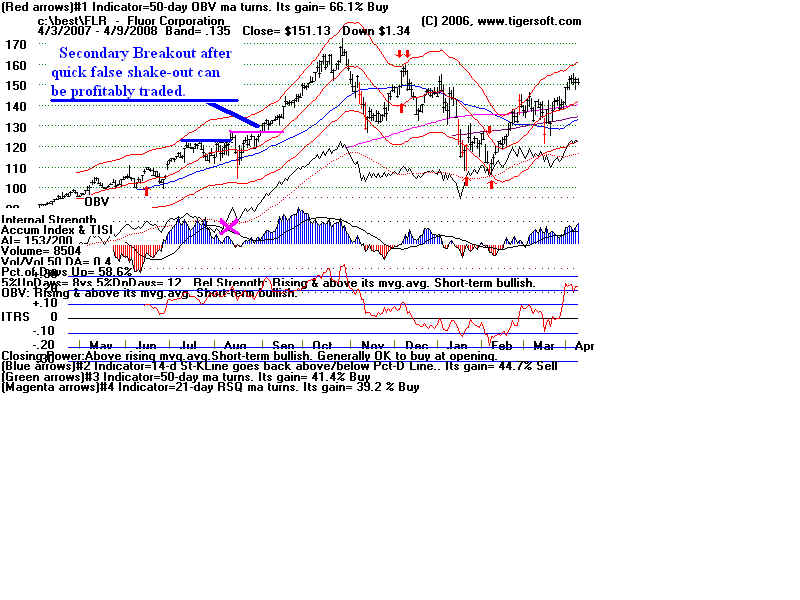
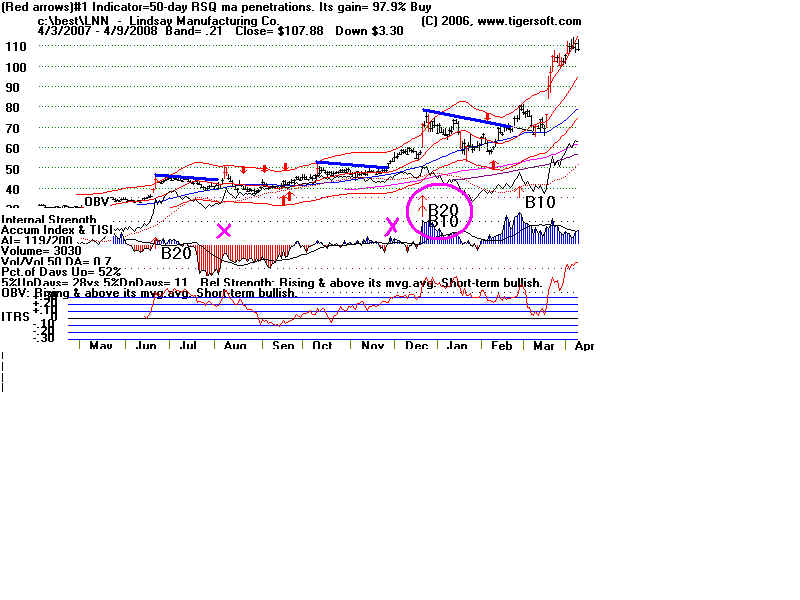
Rules for Spotting Reliable Breakouts
The Best Flat-topped Breakouts have
1) Nearly flat resistance lines drawn through intra-day highs.
2) The line should go through at least 3 highs, each separated by a few trading
days or more, 3 weeks or more.
3) The Close on the breakout day must clearly be above the resistance line.
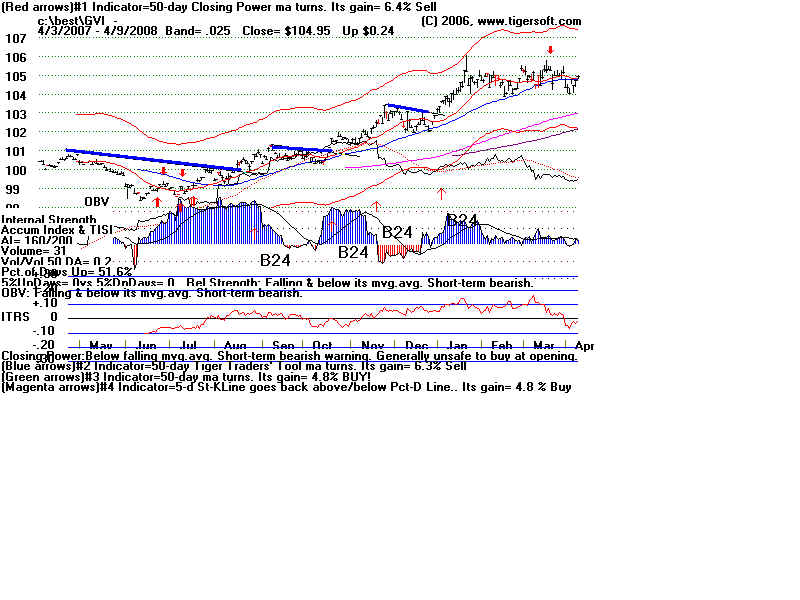
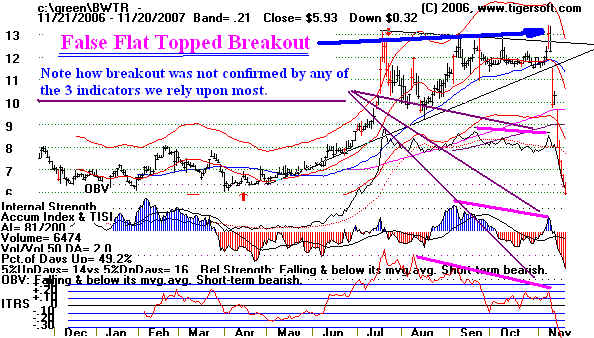
The resistance lines here are posted as Blue Lines.
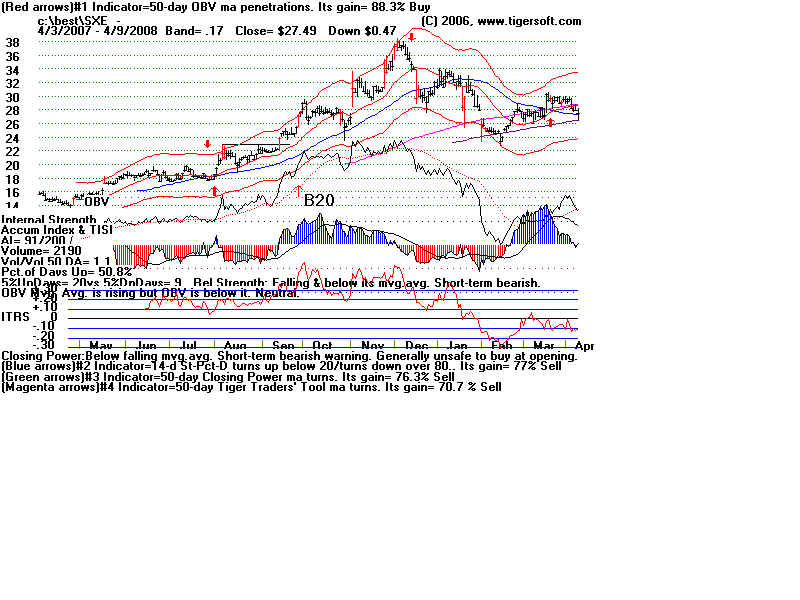
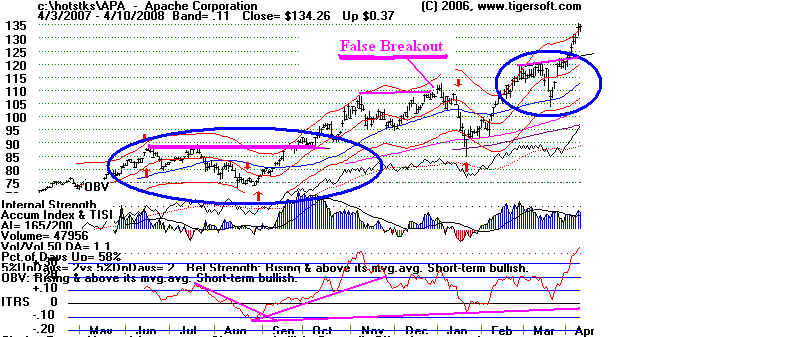
(The most recent breakout looks quite false. Note the negative Accumulation
Index readings on the breakout.)
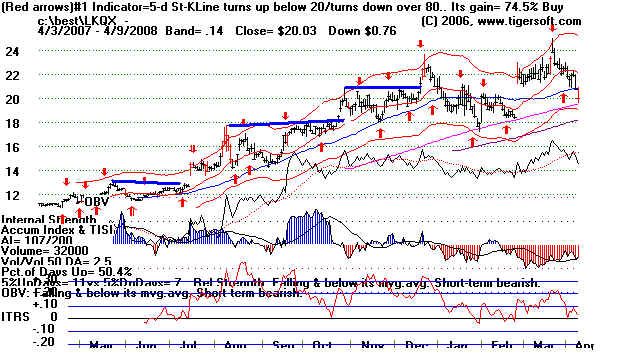
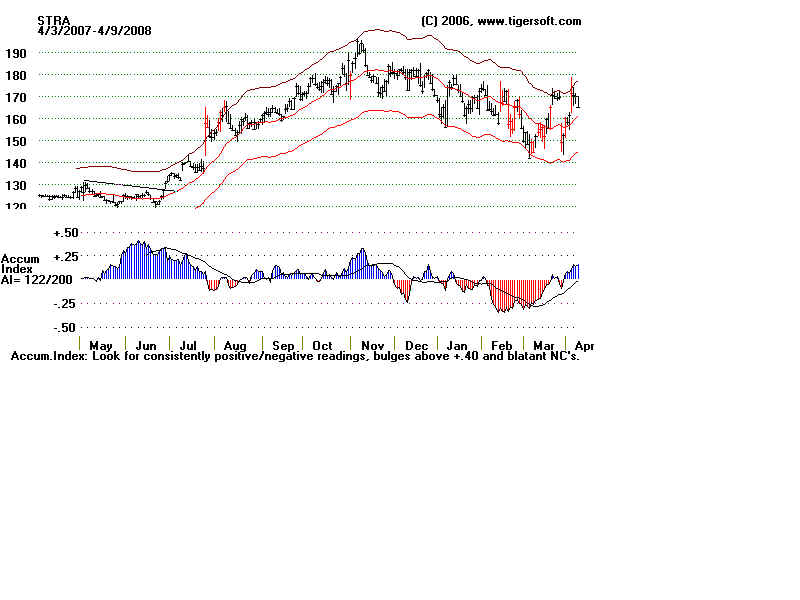
4) The price bar turns red for the breakout day indicating unusual volume.
5.) A price gap also authenticates the breakout.
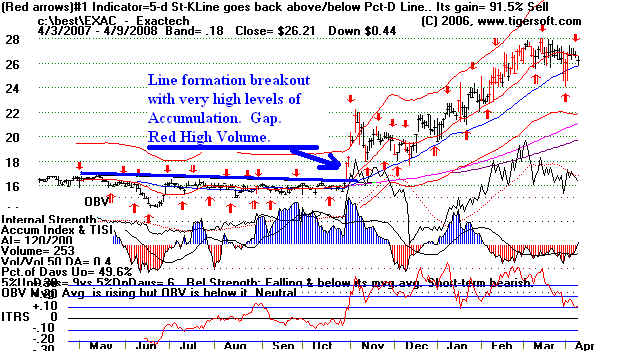
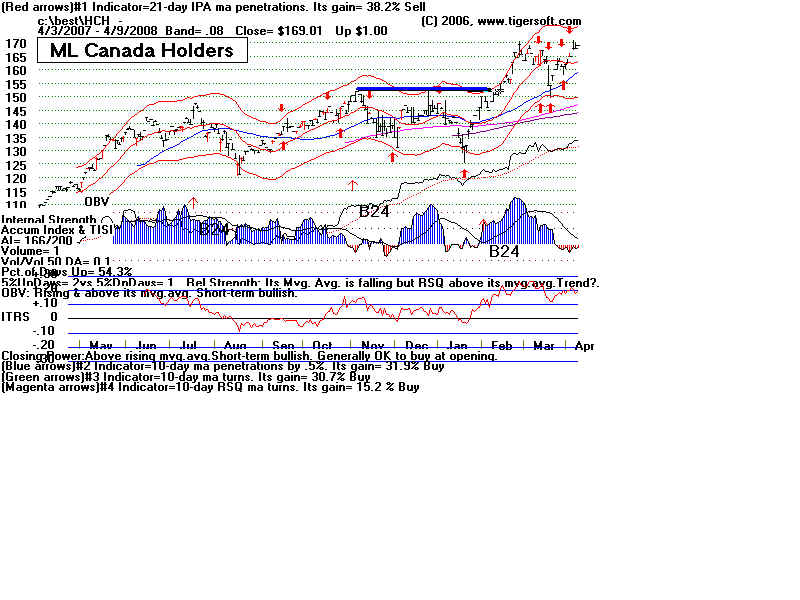
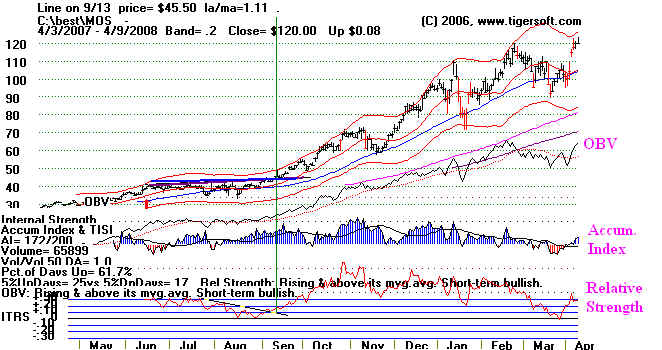
6) The Tiger Accumulation Index should be rising and above +.20. Above +.50 is superb.
Highs levels of Accumulation before or after the breakout are very bullish.
7) The Black OBV Line should be making a new high that corresponds to price.
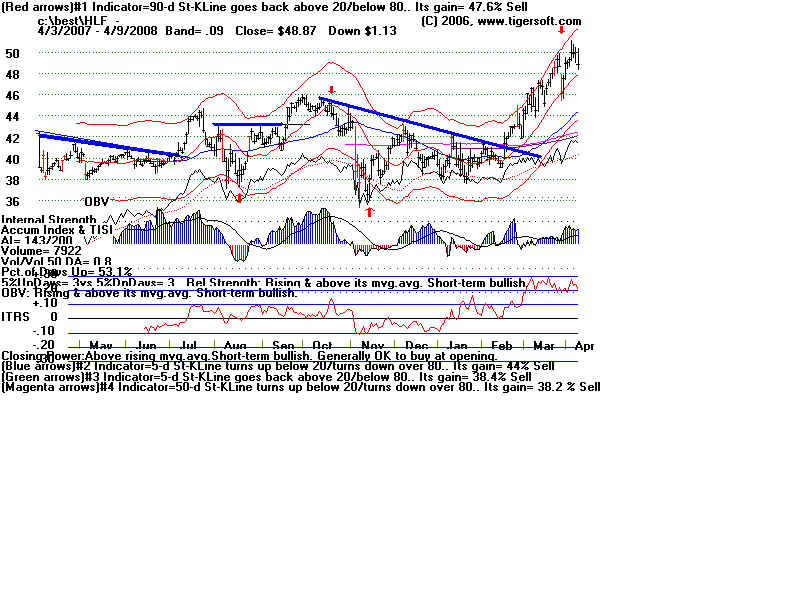
8) The Tiger ITRS (Relative Strength) should be above 0, show a rising trend or breaking
above a declining trend.
9.) Breakouts into all-time high territory are apt to advance most easily.
10.) Breakouts from trading ranges just below recent prices highs often set up an advance
past those highs.
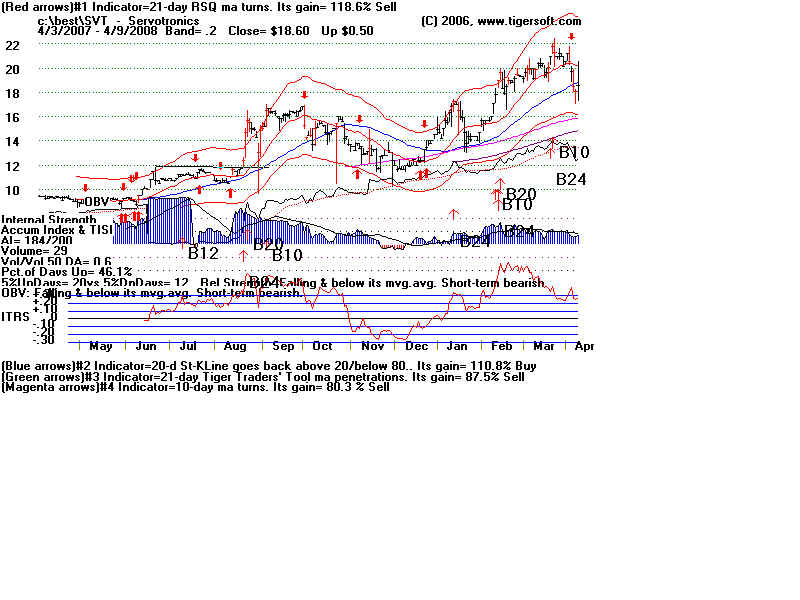
In addition, it helps if the stock has recently (in the last two weeks) tested
unsuccessfully the resistance level.
You do not have to catch the stock exactly as it breakouts out or at the
close the day of the breakout. The moves are often substantial. Most
of the Bullish Special Situations are breakouts. Few have all the desired
characteristics. When a breakout fails it is often because the general
market has gotten very weak. Short-term traders can place stops just below the
point of breakout. Others should use the 21-day ma. A close below that negates
the breakout. Whip-saws can occur. But they are part of the cost of doing
business. And Selling on a failed breakout is the best way to preserve capital,
since some stocks make significant tops after making a false breakout.
Read my Explosive Super Stocks for more examples, theory and trading rules.
Run the nightly analysis and then look for new highs, stocks close to a near high,
B5s, B10s and B24s. The thrice a week hotline offers Bullish Special Situations
that meet most of the conditions above and now offer impending breakouts to watch.
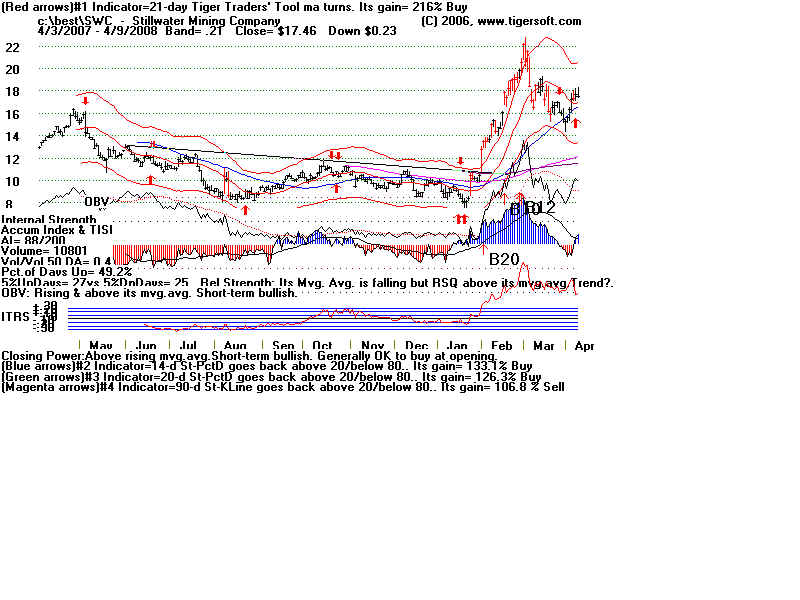
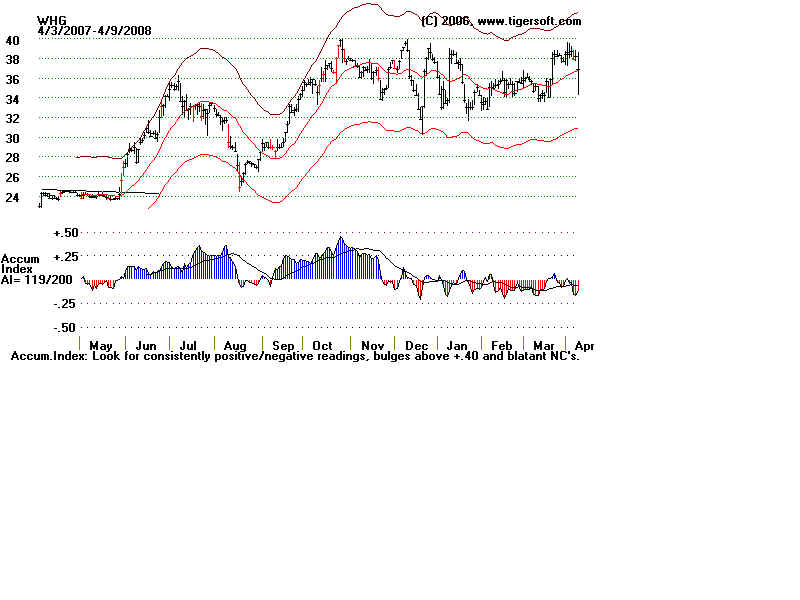
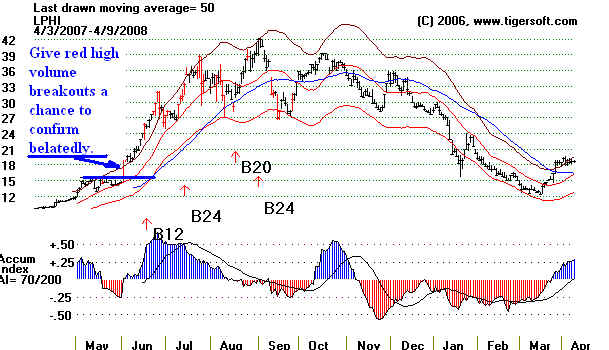
When to take profits? Traders will often be glad to get 10%. You can use
lots of other rules. But as long as the stock is above a rising 50-day ma, it
will probably go higher, especially if there is an earlier Accumulation Index bulge
above +.40
Watch Out for FALSE BREAKOUTS:
( From - http://www.tigersoft.com/Tiger-Blogs/11-15-2007/index.html )
How To Predict and Spot Them.
How To Profit from Them.
Traders will inevitably find themselves
owning a stock that
makes a false breakout like the ones show below. The hardest part
will not be in spotting the falseness of the breakout, but in getting
yourself to take a small loss. This is essential money management.
Take the loss. You can always buy the stock back if it makes
a subsequent high. The danger of a 33% loss or more is quite high.
Savvy traders look for these patterns to short. They know the
breakout has already forced the more nervous short sellers to
cover. Without short sellers to cushion the decline, prices
can fall a long way.
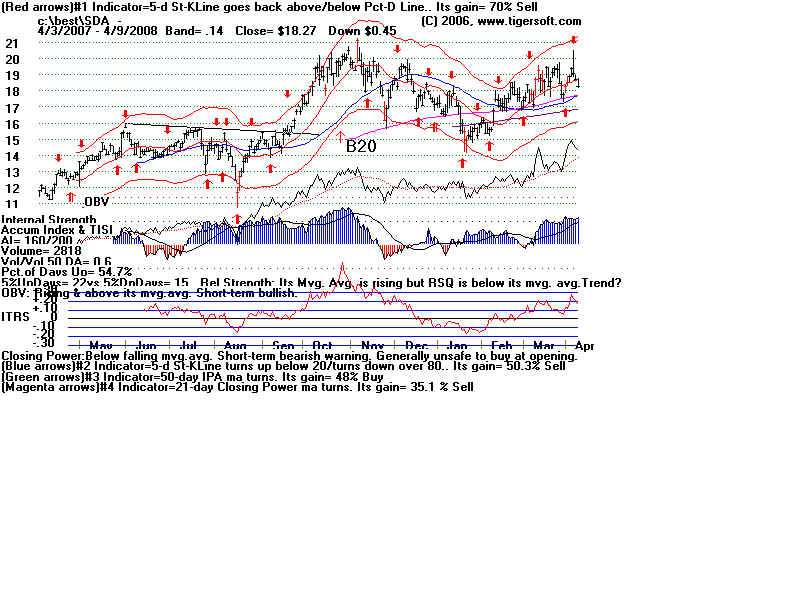
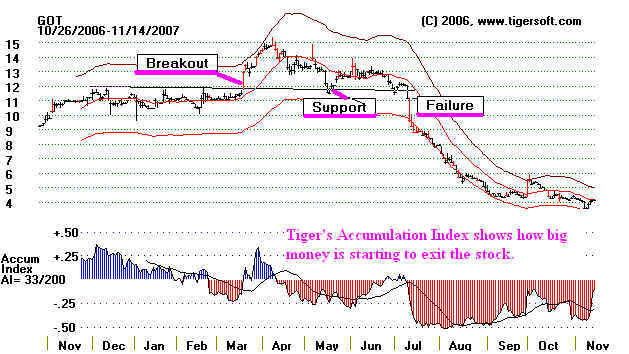
The point of breakout represents overcome resistance. Former
resistance is normally excellent support. When the expected support
fails and there is heavy red Distribution shown by the TigerSoft
Accumulation Index, watch out. The stock will probably become
quite weak and should be shorted. Note the heavy (red) down day
volume in the chart of GOT in July when the breakout has clearly
failed.
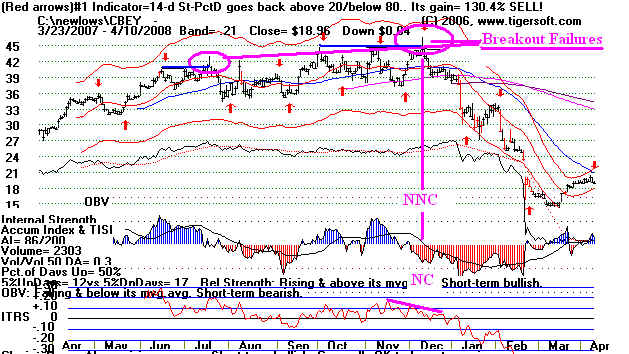
The Close Must Be above Resistance on the
Breakout
In
July and again in November, the close on the breakout attempt was not above
the
key flat resistance. The stock quickly fell back. In November, CBEY's breakout
attempt
was
accompanied by negative readings from the Tiger Accumulation Index and an ITRS
(Relative
Strength) non-confirmation. Look for these false moves. They often set up big
declines.
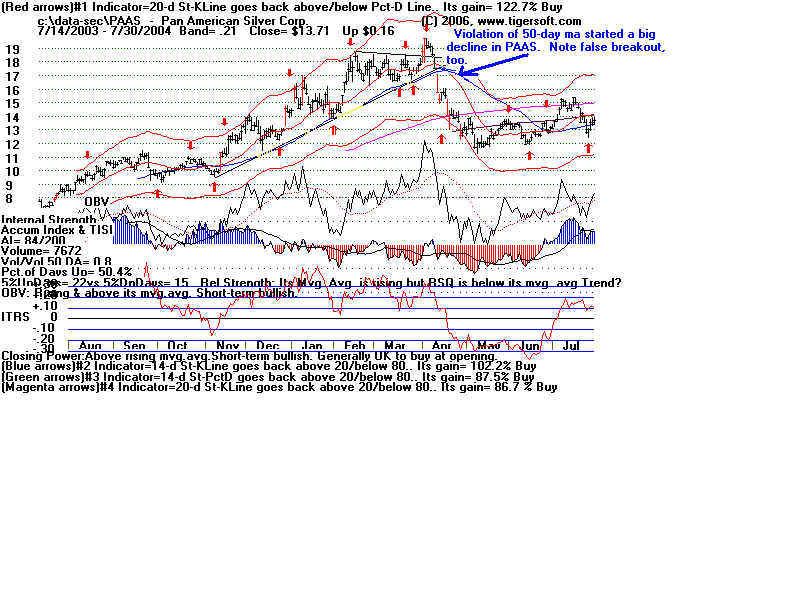
False Breakouts above Flat Tops Are Obvious and Often Very
Bearish.
PAAS had already
doubled in 7 months. That made the March breakout fail. 20 is often
a significant psychological price barrier. The negative (red) Tiger Accumulation Index showed that
insiders were heavy sellers before, during and after the brief breakout in March. The plunge
on heavy volume below the 50-day ma proved the stock was in trouble. It subsequently
lost
50% of its entire advance from 8 in July. This chart shows that OBV did confirm the
breakout.
It was the Tiger Accumulation Index which gave you the best clue that the breakout was
false.
FLAT-Topped BREAKOUTS with Comments:
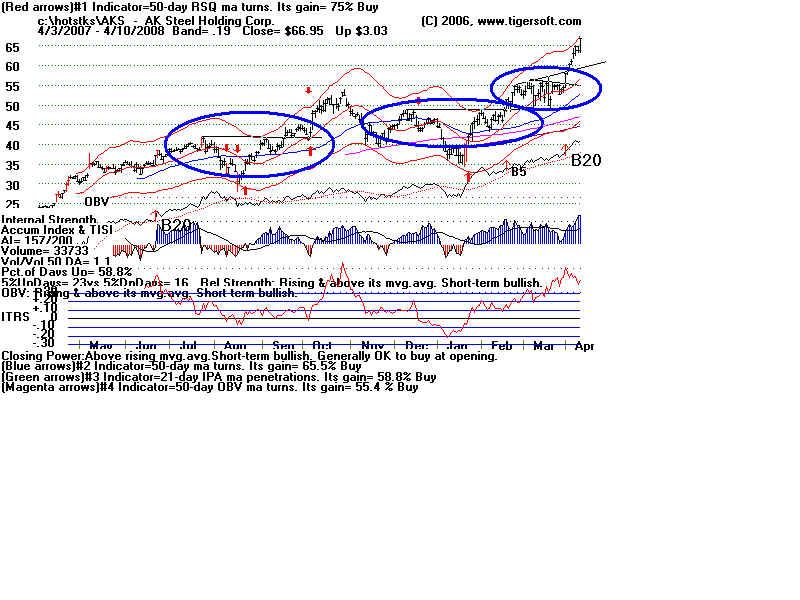
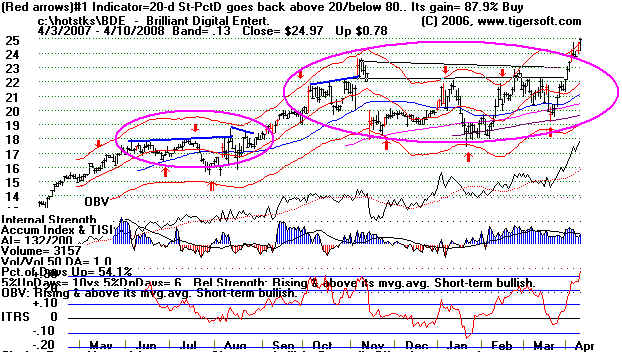
AKS - 2007-2008
Often the horizontal breakouts are inverted head and shoulders patterns.
Study the chart and earlier ones, if available, to see repeating patterns and how reliable breakouts are.
Tiger Buy B5 signals do not necessarily appear on breakouts. These patterns are hard to have computer identify.
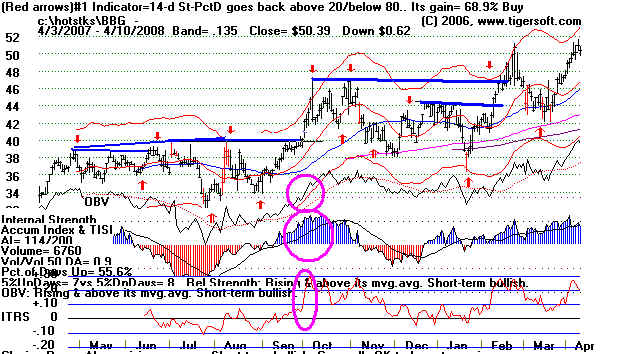
ANR - 2007-2008
See how this stock's prices run up to the resistance and fall back for a few days and then breakout.
Look for each stock's price mannerisms.
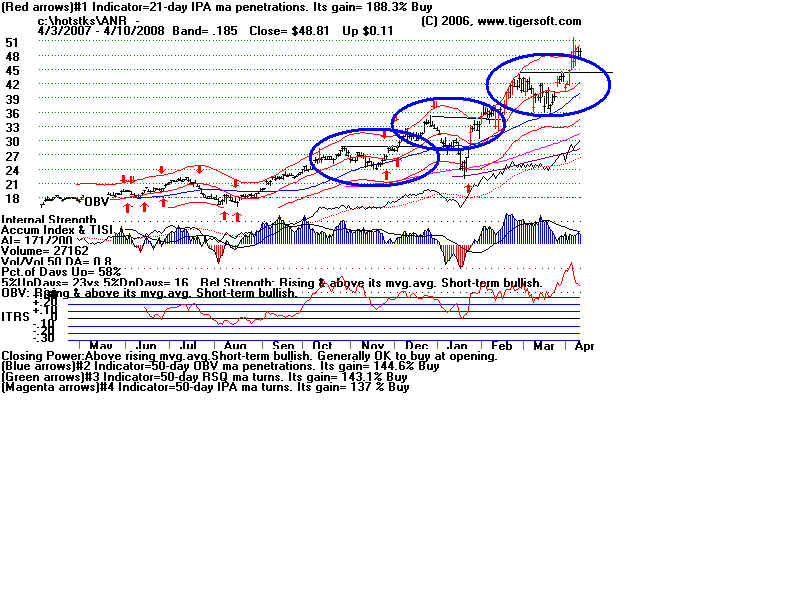
The December breakout was false. Its Accumulation Index readings were a little below +.20
on the breakout.
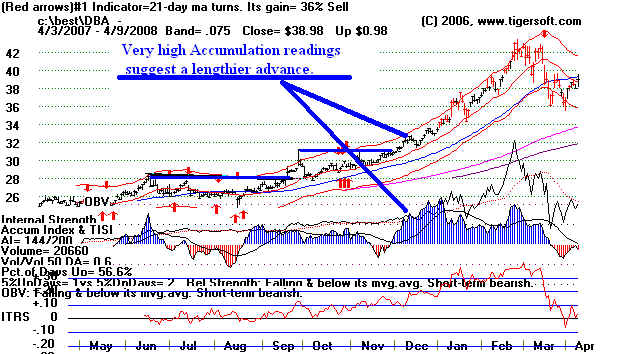
Flat-topped breakouts accompanied and preceded by bulging Accumulation are most reliable.
Generally, high levels of Accumulation go a long way in precluding beg declines.
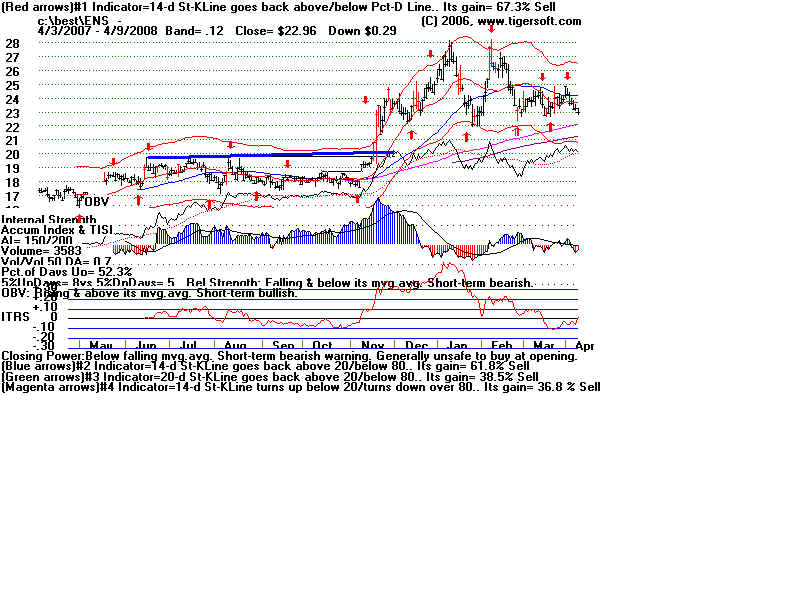
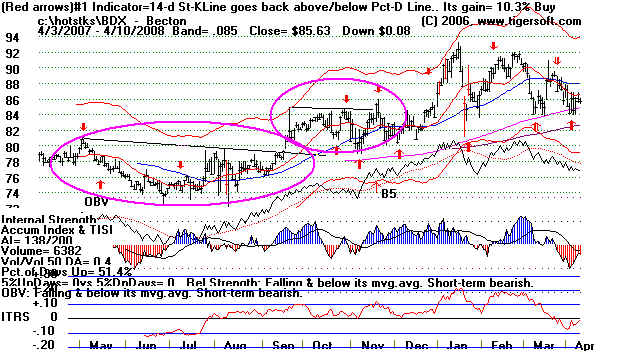
This chart shows two false breakouts: August and November. The Accumulation Index
readings were too low in both cases to make the breakouts trustworthy.
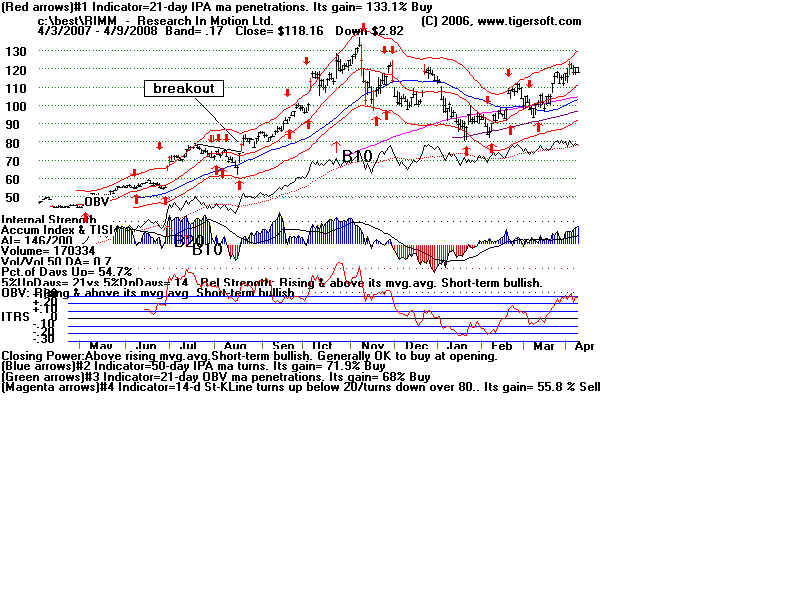
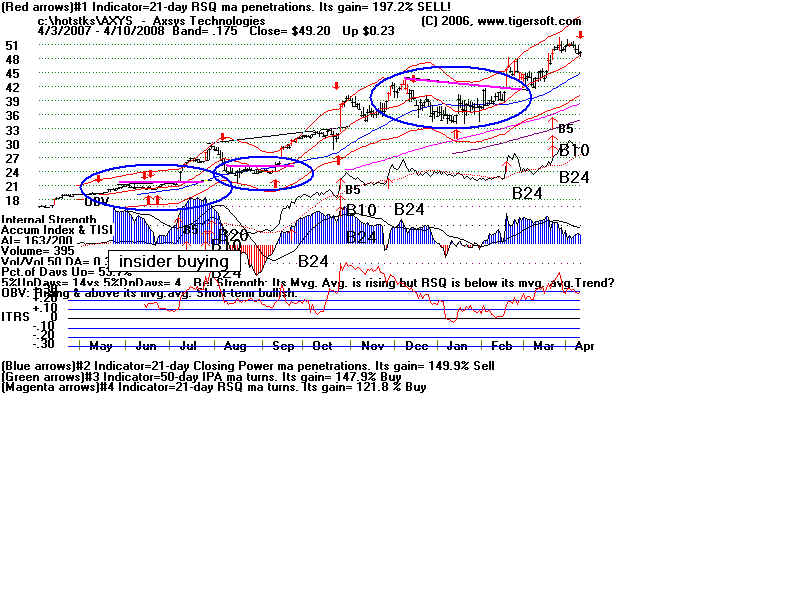
This September breakout was confirmed by a recently strong Accumulation Index,
am OBV rising to new highs and an ITRS breakout. The January breakout had only
good OBV. But the minor breakout set up a second breakout. Watch for when one breakout
can lead to a second. They offer excellent potential, too.
Big NYSE companies seldom make 10% advances in a week on breakouts. The B5 breakout
failed in November. It got caught up in a declining general market. Its internals were not bad.
It just fell back into its base. When the market climate grew more favorable, it rallied the next month.
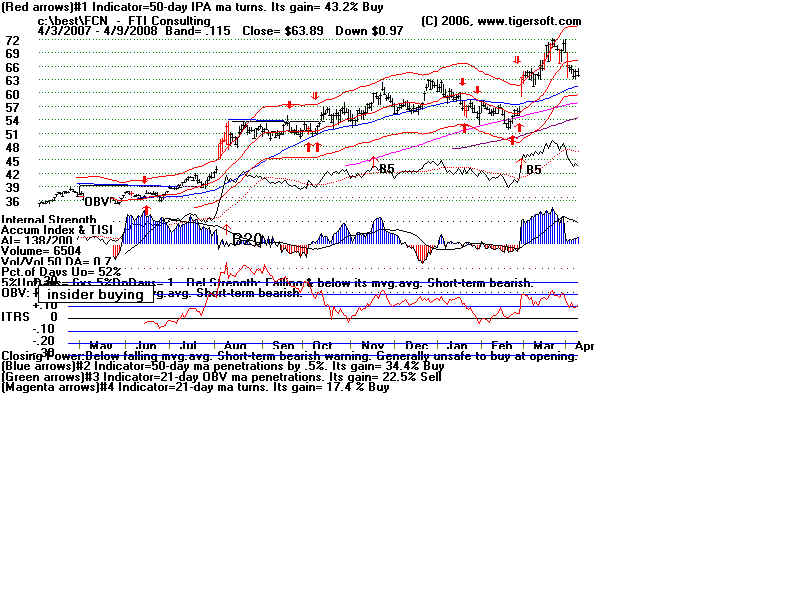
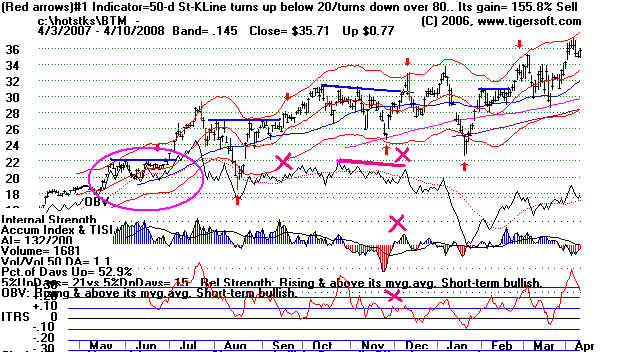
BTM - 2007-2008
The June breakout had good OBV and the Accum. Index had recently been +.25.
But look at the many non-confirmations marked with an "X" in November.
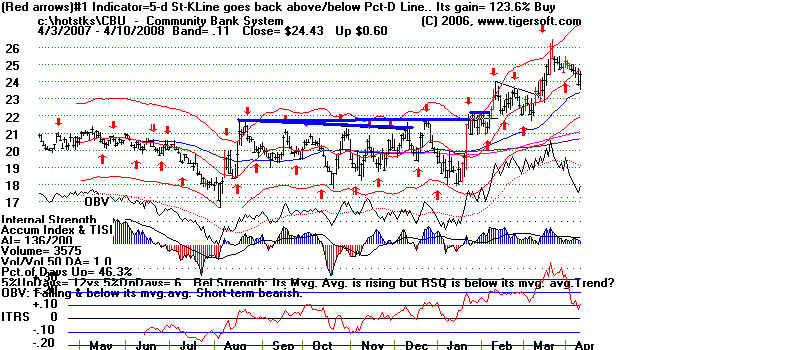
CBU - 2007-2008
Lots of marginal breakouts. The Accumulation Index was too low to make
them safe. The OBV Line had been higher in the beginning of 2007.
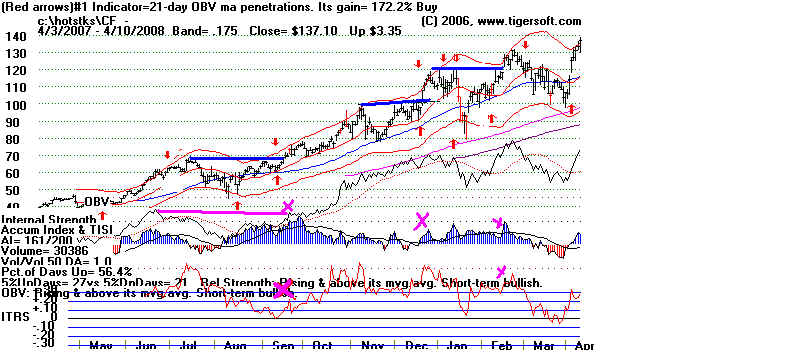
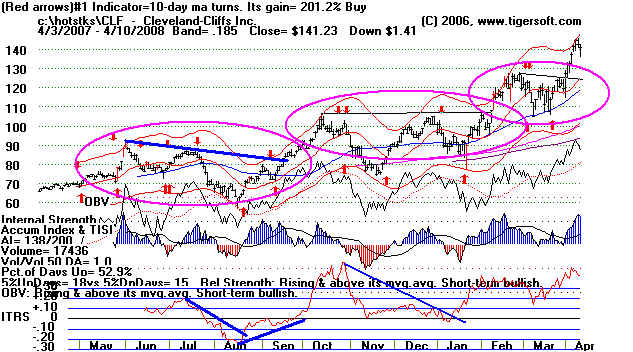
CF - 2007-2008
Lots of "X" Non-Confirmations on the breakouts. Traders should know these
were less reliable.
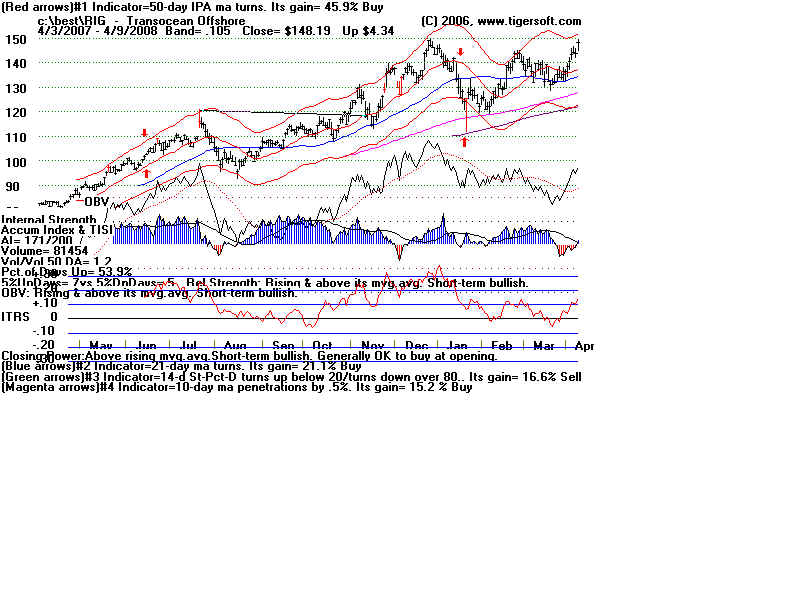
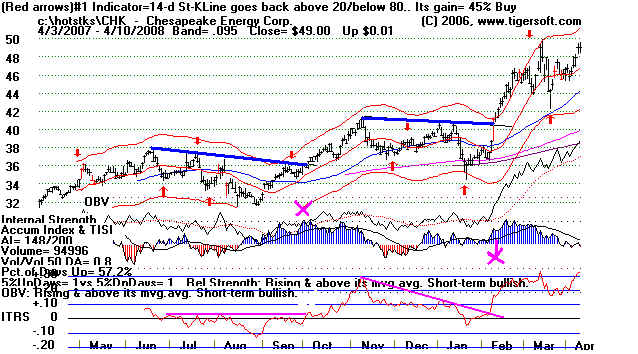
CHK - 2007-2008
A good year for energy stocks. The minor OBV NC on the September breakout might
have bee overlooked for that reason. The February breakout has a low current Accum.
Index, but the breakout still worked because the group was hot. The price patterns
here were tested 3 or 4 times and flat. The second breakout occurred with red high
volume.
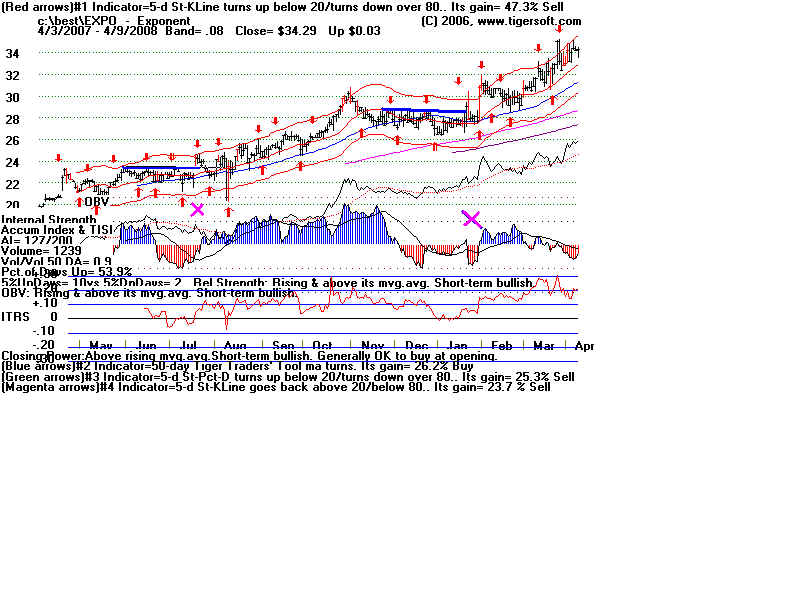
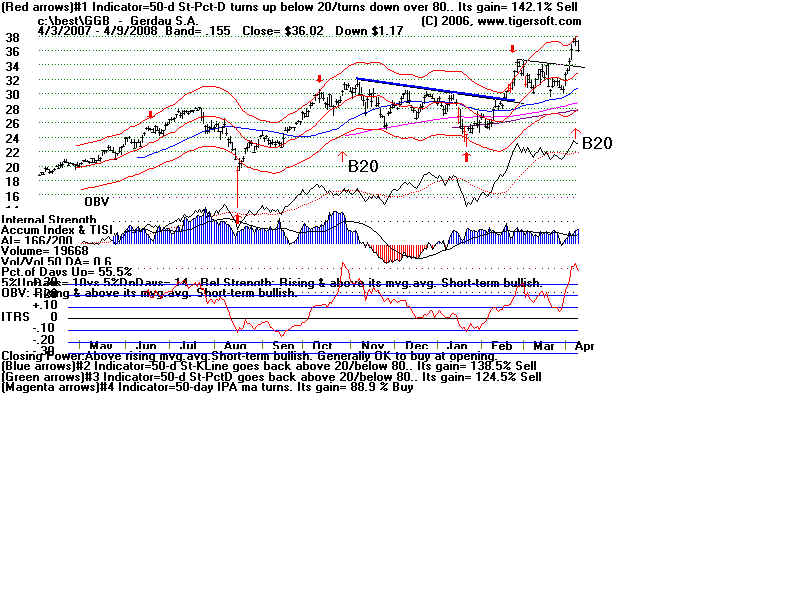
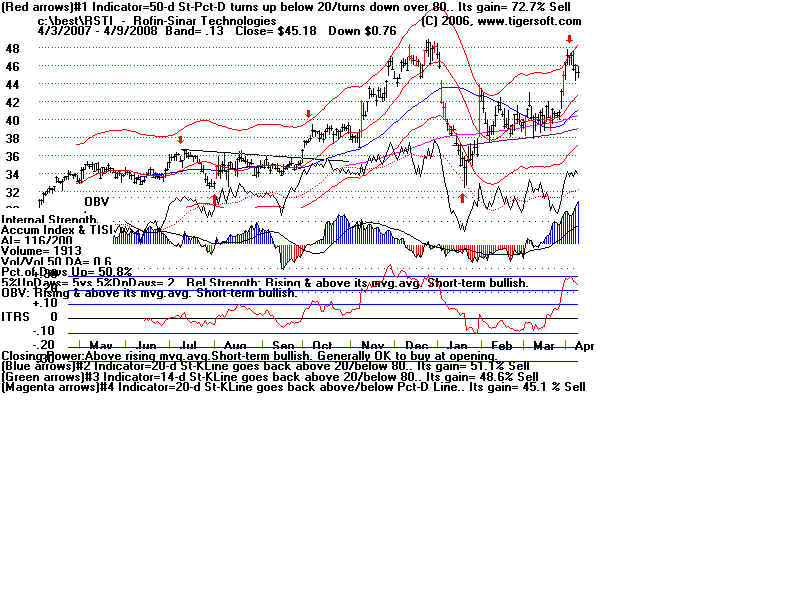
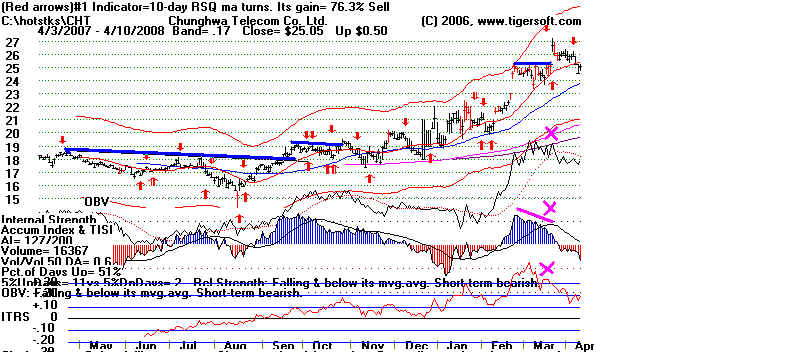
The September 2007 breakout was confirmed. The gap low-volume breakout recently
did not. The "X"s show the OBV, Accum. Index and ITRS non-confirmations.
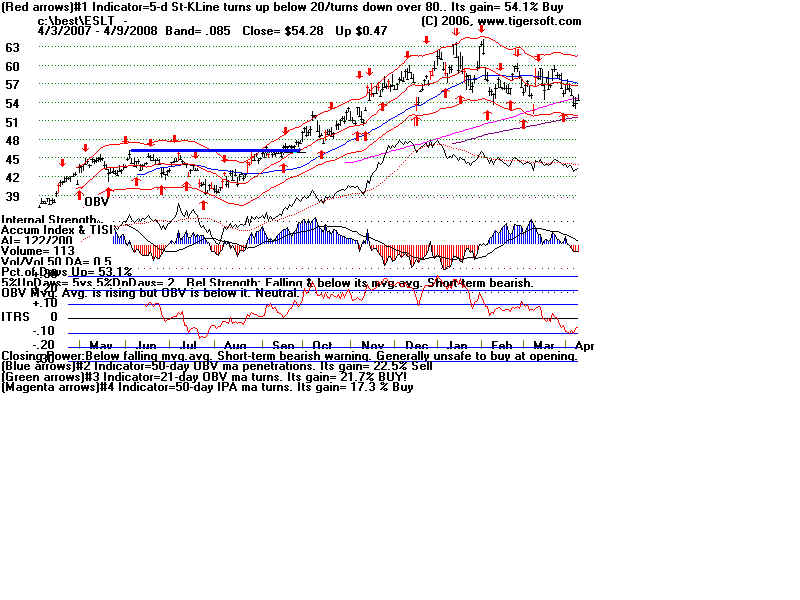
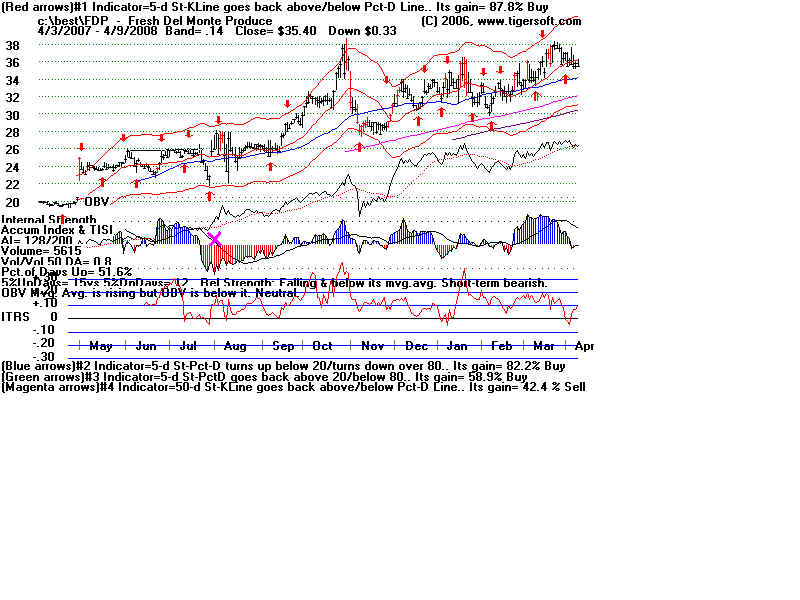
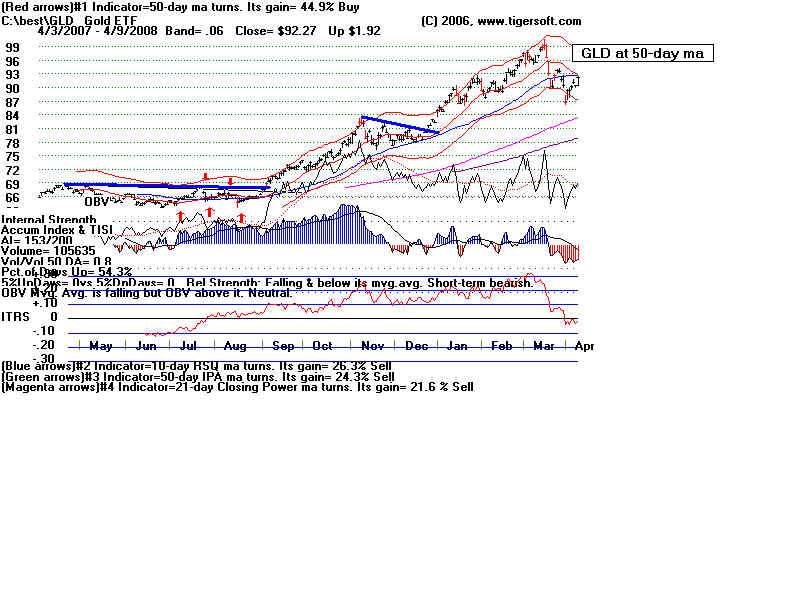
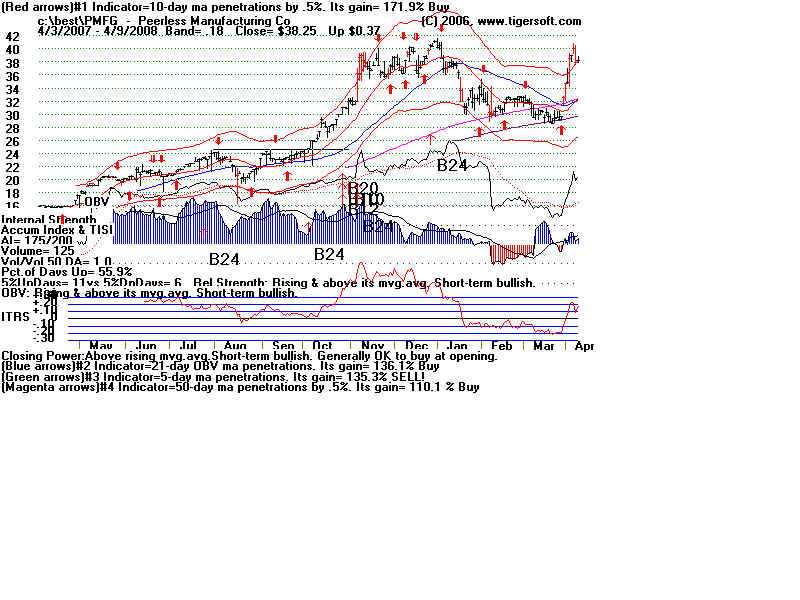
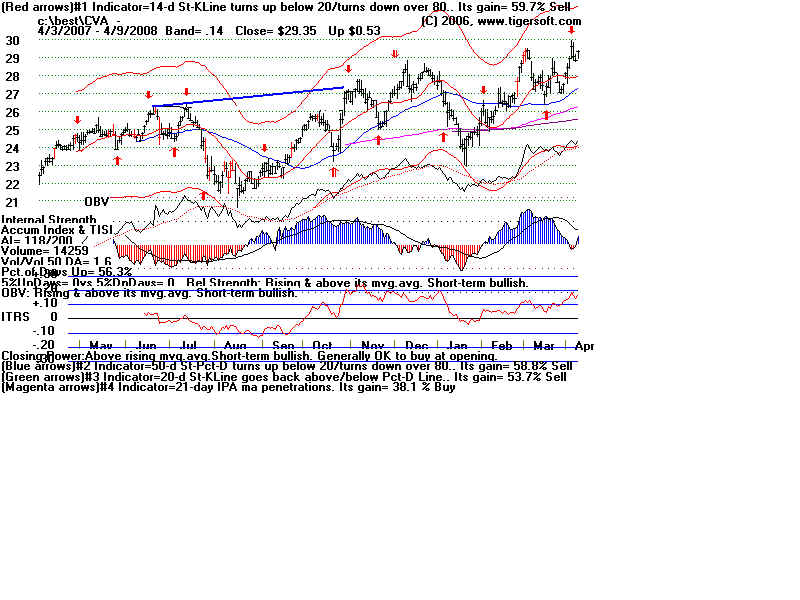
The breakouts shown below were confirmed. But the stock is a little slow moving.
Be sure to draw the lines through the intra-day highs. The blue line below is not flat enough to
safely qualify. The preceding decline is too deep.
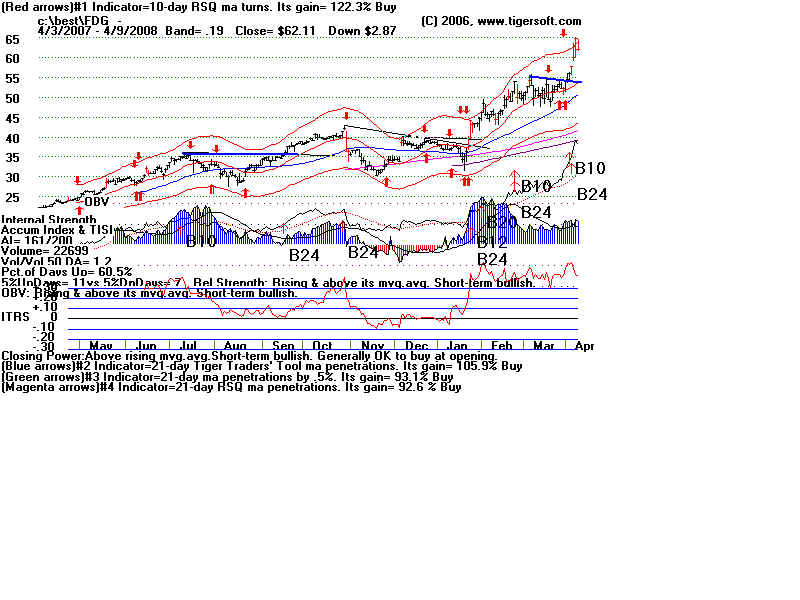
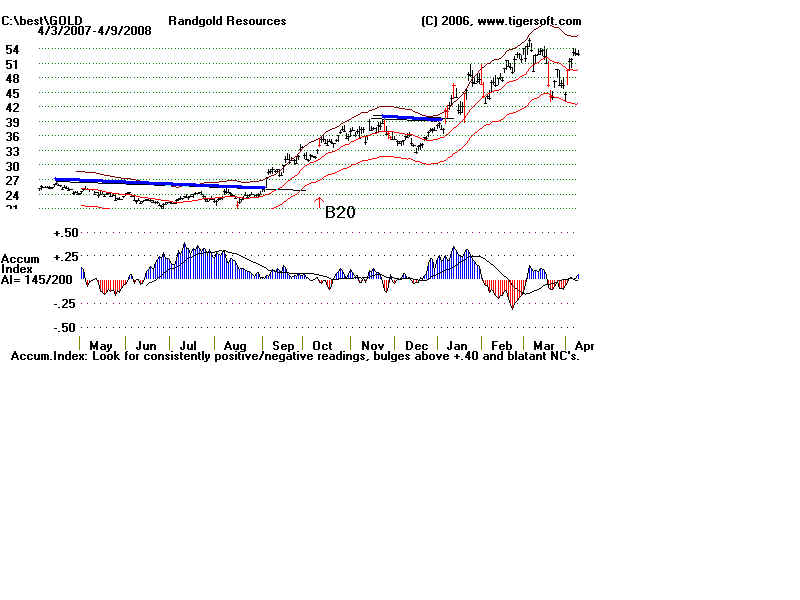
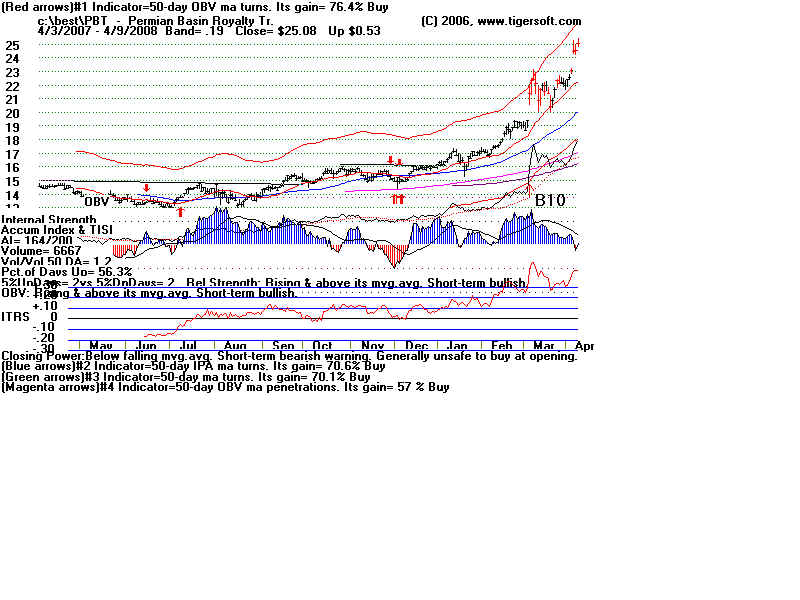
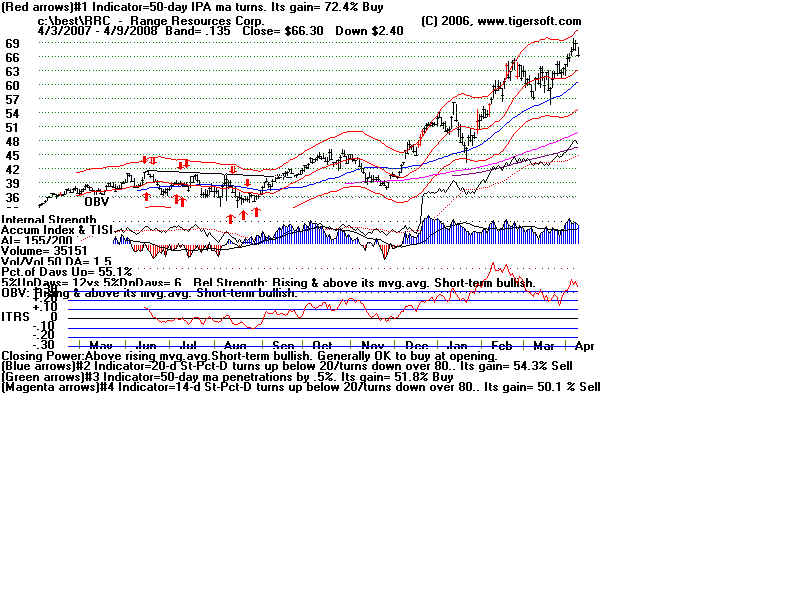
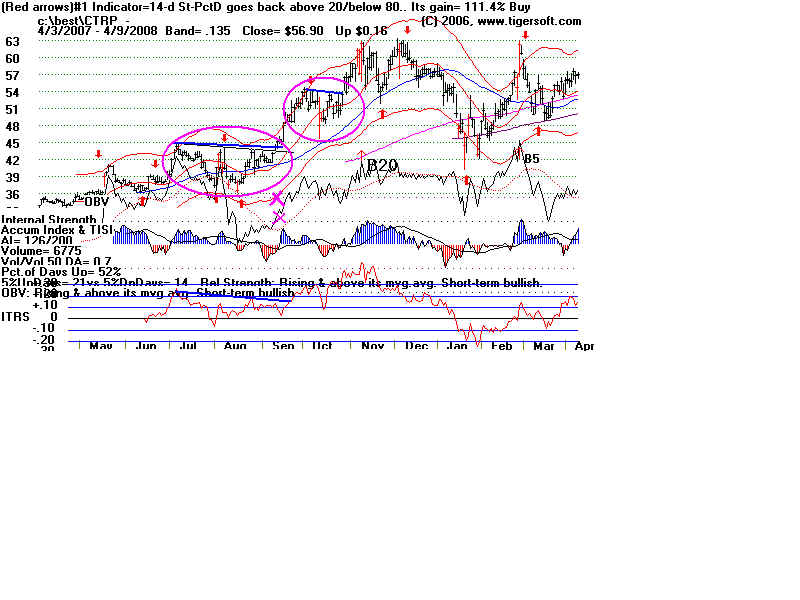
When you see a bulge of Accumulation, watch for the next breakout. It is apt to
work out well. Thus, buying just over 36 in January worked out very well.
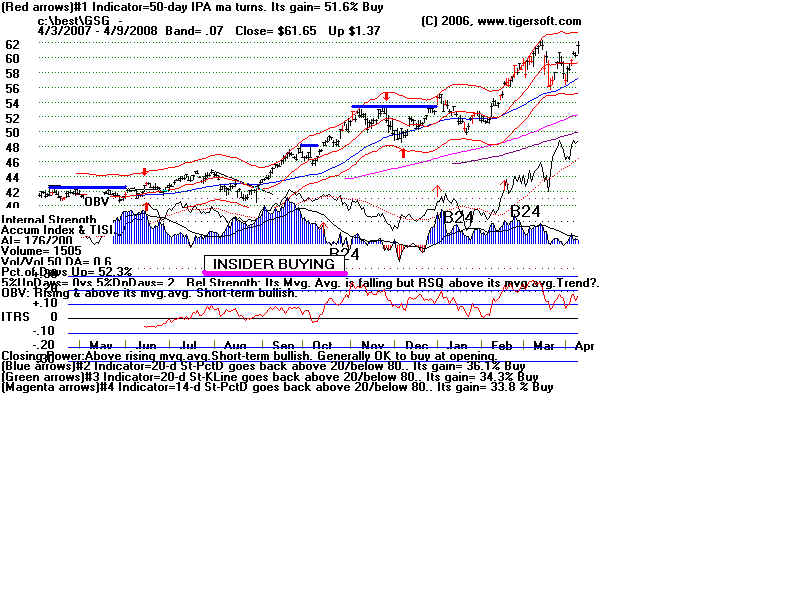
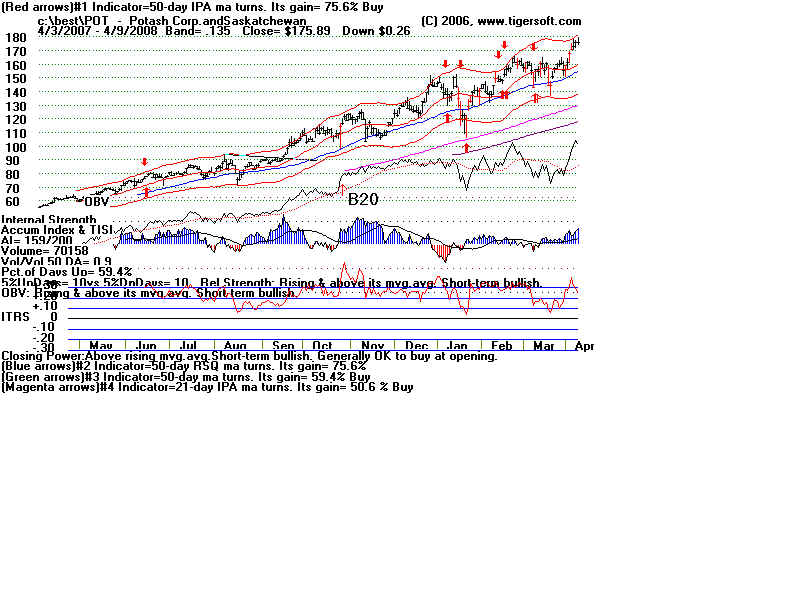
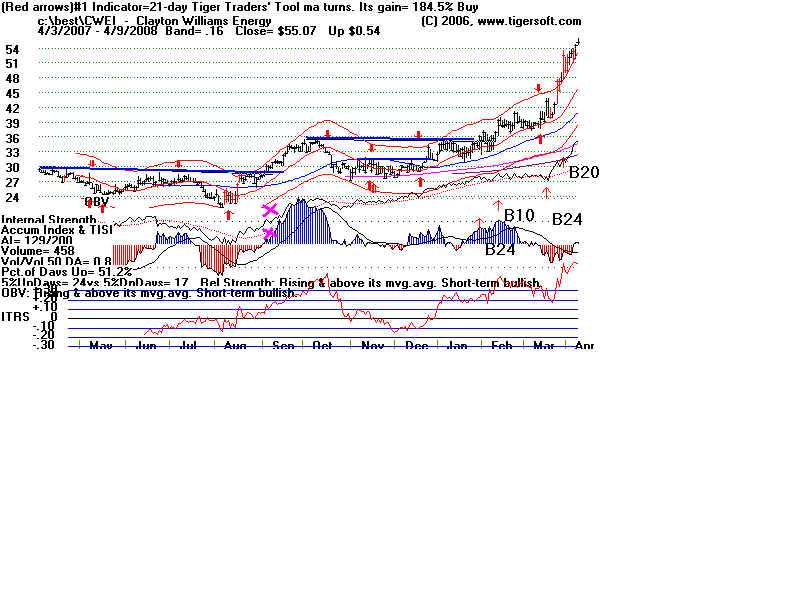
The earlier AI bulge nullifies a negative non-confirmation by the Accum. Index on
the March new highs. In a generally hot oil and gas move, these breakouts are
especially reliable.
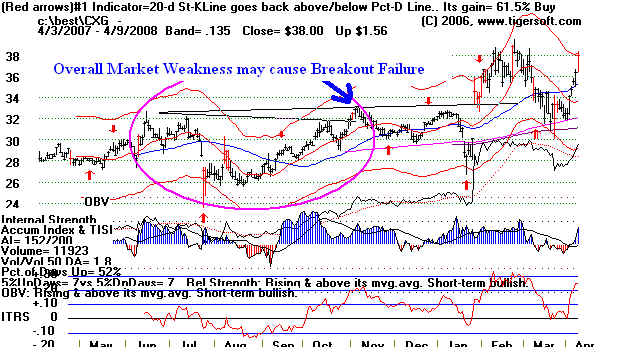
Even when internal strength indicators satisfactorily confirm, there can still be
false breakouts. It is best to trade with the market as judged by Peerless. A new
Peerless will be released very soon.
------------------------------------- DJIA ------------------------------------------------------------
------------------------------------------- CXG
-------------------------------------------
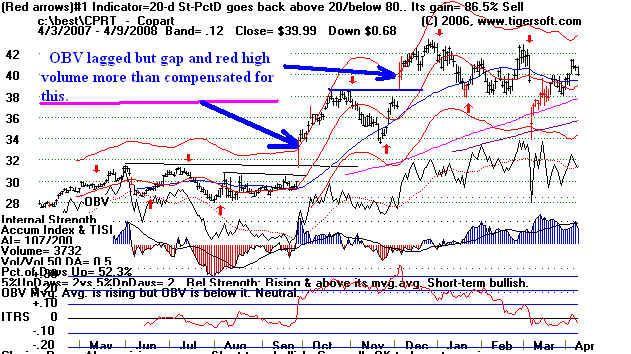
CPHD - 2007-2008
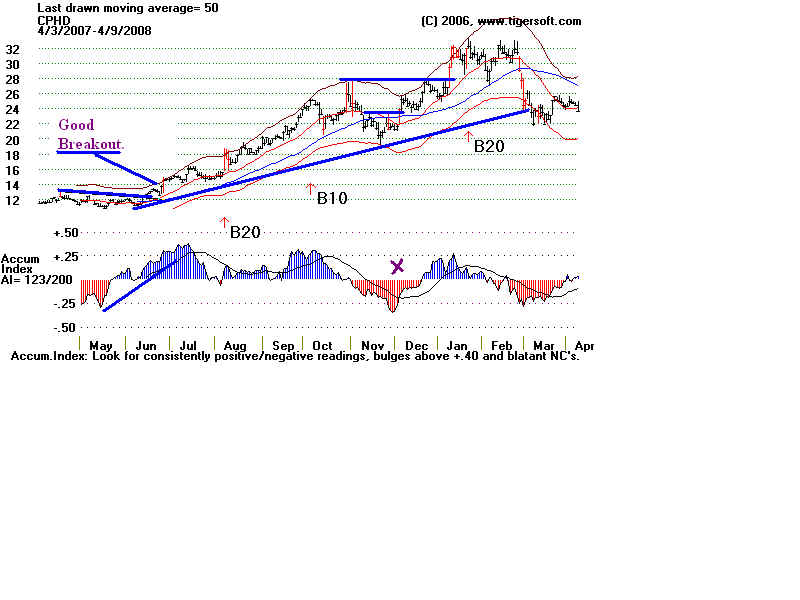
Red High volume breakouts with gaps more than makes up for a lagging OBV.