TigerSoft Freedom News Service 9/4/2008 www.tigersoft.com
How To Trade Silver and Silver Stocks
Much More Profitably
Case Studies of Silver, PAAS and SSRI
(Pan American Silver and Silver Standards)
Where Is Their Likely Support Now?
Test Your Understanding of These Concepts
with another Silver Stock:
(Silver Wheaton and SLW)
by William Schmidt, Ph.D. (Columbia University)
(C) 2008 All rights reserved. Reproducing any part of this page without
giving full acknowledgement is a copyright infringement.
Research on Individual Stocks upon Request:
Composite Seasonality Graph of Any Stock for $125.
Example of historical research NEM - Newmont Mining. Order Here.
See the TigerSoft techniques for find Explosive Super Stocks: Oil Coal
 |
Tiger
Software Helping Investors since 1981
|
Limited Time Special Offer Introductory Stock Software |
How To Trade Silver and Silver Stocks
More
Safely and More Profitably
by William Schmidt, Ph.D.
(Columbia University)
(C) 2008 All rights
reserved. Reproducing any part of this page without
giving full acknowledgement
is a copyright infringement.
------------- Tiger Index of 6 Silver
Stocks -----------------
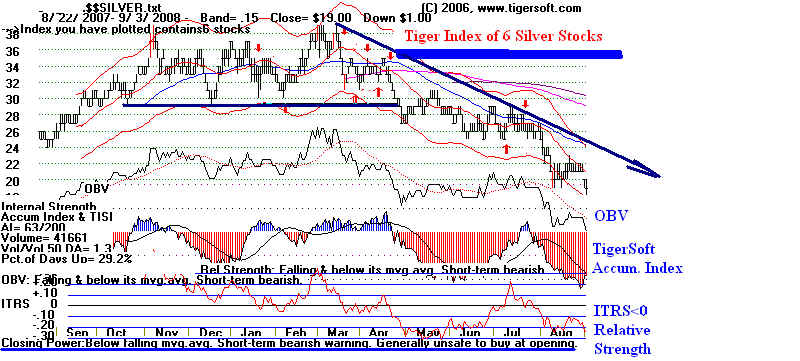
Silver
Stocks include:
Silver Wheaton Corp.
(NYSE: SLW),
Helca Mining Co. (NYSE:
HL),
Coeur d'Alene Mines
Corp. (NYSE: CDE),
Silver Standard
Resources Inc. (Nasdaq: SSRI),
Apex Silver Mines Ltd.
(AMEX: SIL)
Pan American Silver
Corp. (Nasdaq: PAAS).
------------- Silver
and Gold Yearly Charts
----------------- 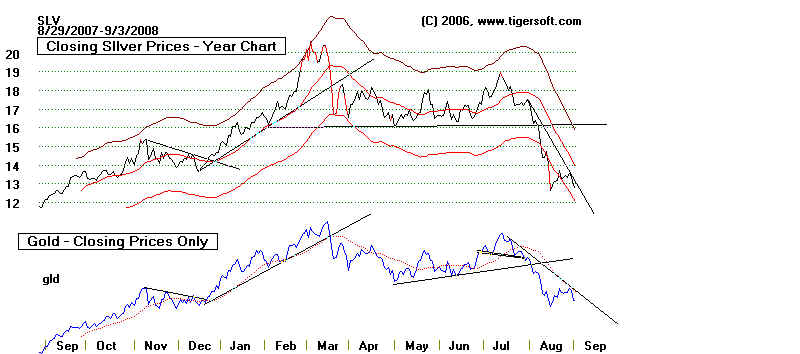
We are told that SIlver and Gold prices are manipulated.
That's nearly always the case. It begs the question of
which direction do the manipulators want prices to
take. TigerSoft's Accumulation Index and Closing Power
go a long way to answer this question. Only
TigerSoft
offers these tools.
Watch the Trend!
TigerSoft's Closing Power's Trend Is Your Friend
We
are also told that a big Lehman Commodities
fund is now liquidating its
positions, hence the big sell-off.
That helps explain the particular decline we see now.
But it will not help us in the future. It will be better to
understand that precious metals swing violently much
of the time, sometimes up and sometimes down. Our
job is to watch for the tell-tale signs of trend-reversals
that occur in cycle afer cycle.
Lessons We Can Widely Apply To Trading
Silver and Silver Stocks More Profitably.
(1) Silver and Gold Should Regulalry Be Compared with Crude
Oil
and The Dollar
A rising
Dollar hurts Gold and Silver. A falling Dollar helps.
When
crude oil prices rise, it puts pressure on the Dollar because
of how much oil the US
imports. When the Dollar weakens, as it had
for several years until this
Summer, Gold prices rise as investors try
to beat inflation. While
Silver is more a commercial metal, and can
sag like crude oil because of a
recession, it is also widely promoted
as a hedge against a falling Dollar.
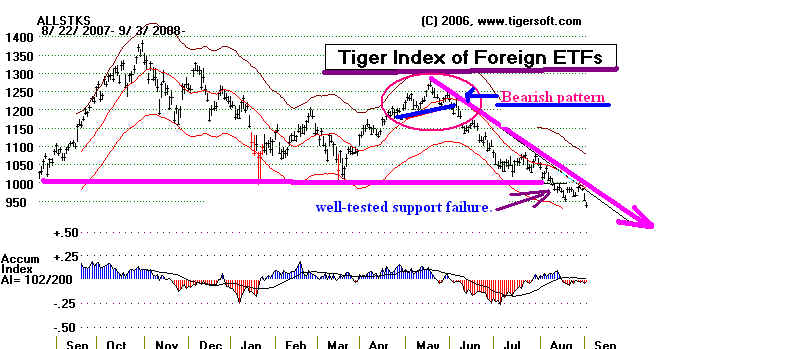
(2) Watch the Tiger Index of Foreign ETFs to spot the
type of global
economic weakness which
will hurt the global demand for Oil
and Silver.
It is significant now that foreign ETFs (exchange
traded funds that
represent different
countries' stocks) have broken below their
support and are in a
downtrend. Demand for silver is waning.
Gold usually holds up
better in this environment.
When the DJI cannot rally in the face of sharply falling oil prices,
it is a warning about how eak the overall economy is. As I finish
this Blog this is
alarmingly true.
TigerSoft predicted the
world bull market was ending in November 2007 by seeing
many head and shoulders
patterns in foreign ETFs.
http://www.tigersoft.com/Tiger-Blogs/11-22-2007/index.html
(3) Precious Metals Have Recently
Fallen Sharply.
A decline in metals' spot prices drops
mining companies'
shares to the extent that
they have not hedged their selling prices.
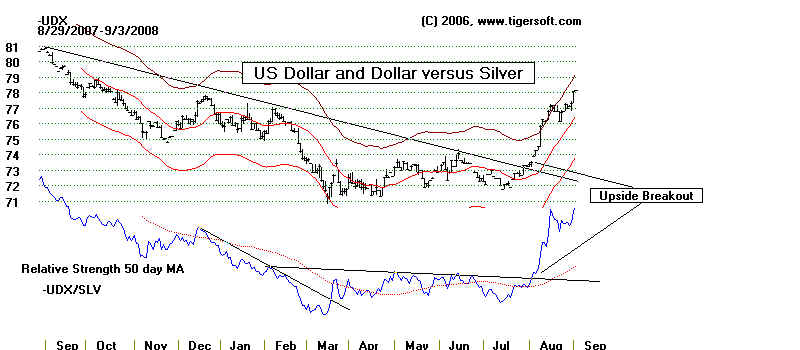
In late July
2008, the Dollar (See below.) reversed its down-trend.
That was matched by gold and silver
falling sharply.
You can see that the quotient of the Dollar divided by Silver
broke its downtrend a few days before the Dollar completed its
reversal pattern and turned
up. Someone watching this chart
closely
would have been given advanced
notice that Silver would become weak.
The fall in Crude Oil prices is a
reasonable explanation for the rise in
the Dollar. But it works in
reverse, too. When the Dollar is worth more,
it buys more Crude Oil. It is
quite probable that the Administration
has orchestrated a rise in the
Dollar and a concurrent fall in the
price of Crude Oil, to make
Republican chances better in November
for the Election. This also
happened in the 3rd quarter of 1976, only
to be followed a super rally in
Silver and Gold when the Democrats
came into office.
----------------------- US Dollar and Dollar/Silver
-------------------------------------
(4) Use
A Ruler To Spot Changes in the Direction of Commodity Swings
Commodities tend to run together.
More and more hedge
funds
and mutual funds are trading commodity ETFs.
That
puts extra pressure on prices. They have always had booms
and
busts historically. Their
advances very often come in
big
spurts. Their uptrendlines are hyperbolic. The chart
of
Crude Oil now shows how simple trendlines would have
helped spot the points in time when prices changed direction.
Since silver prices are historically very volatile, it is important
not
to fight their trend.
I wrote a Blog on 3/21/2008 and talked about how silver is
often manipulated on the short side
with impunity. Displaying
all of Silver's charts since 1979,
I showed that somone using
just a ruler ought to be able to
make money in it regularly.
See these concepts and all the
charts at
http://www.tigersoftware.com/TigerBlogs/3-21-2008/index.html
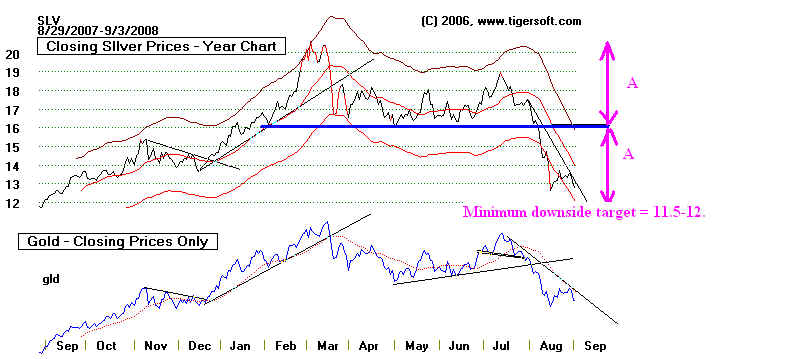
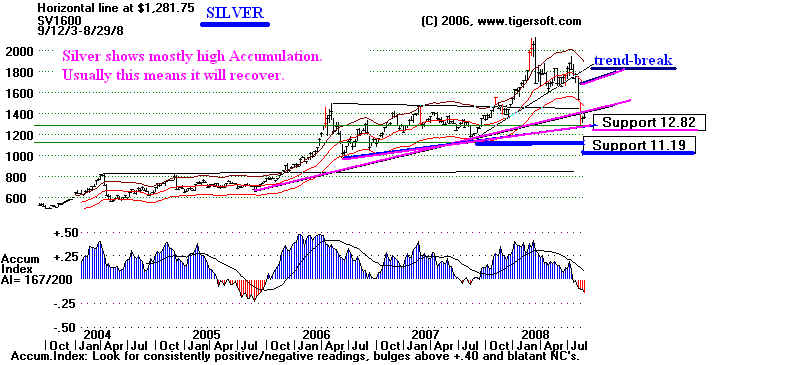
(5) Use Downside Projections.
Classic technical analysis postulates that a breakdown from
a trading range typically sets up a
minimum downside objective
that can be reckoned by
supbtracting the height of the trading
range from the point of breakdown.
Here the height of the pattern
was "A", about 4.30
points and the point of breakdown was 16.
That sets up a minimum downside objective of 11.70 with Silver now.
----------------------- Silver and Gold Prices
-------------------------------------
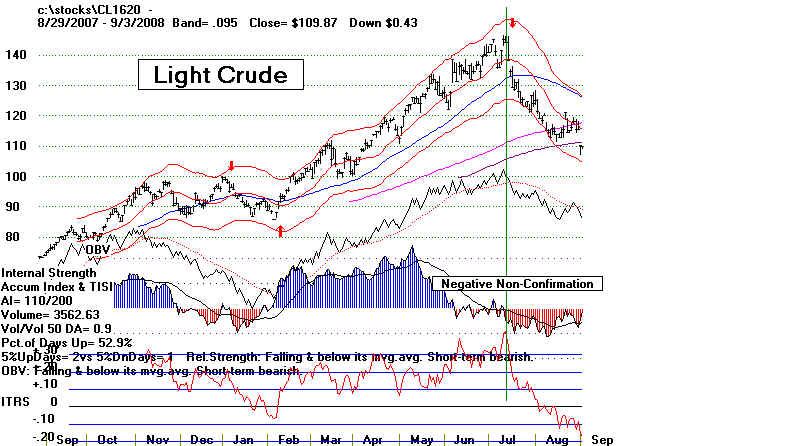
----------------------- Crude Oil (Perpetual Contract) -------------------------------------
Crude oil has sliced through its rising 200-day ma with negative
(red) readings from the Accumulation
Index. This is bearish,
though the fact that the (black) 200-day
ma is rising usually means there
will be a rally back to the point of
breakdown of this ma.
(6) Use
TigerSoft's Accumulation Index To Spot Reversals
Crude Oil is in many ways the key now to predicting
Gold and
to a lesser extent silver.
Experienced TigerSoft users know to
watch our Accumulation index
closely. Bulges of Blue Accumulation,
especially on a price breakout from
a base, are very reliably
bullish. But after a long advance, a new price high that occurs
with the Accumulation Index
negative, or nearly so, is often making
a significant top. The July peak in Crude oil (above) showed such a
bearish negative non-confirmation.
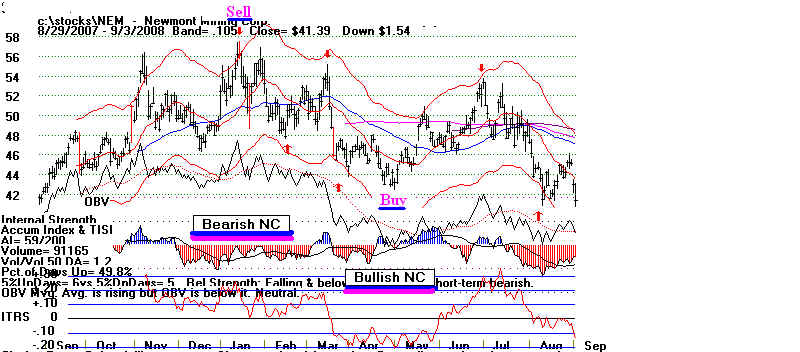
Similarly, we want to watch
for new lows being made with the
Tiger Accumulation Index positive,
Newmont, a gold stock, illustrates
this below.
----------------------- Newmont Mines
(Gold Stock) -------------------------------------
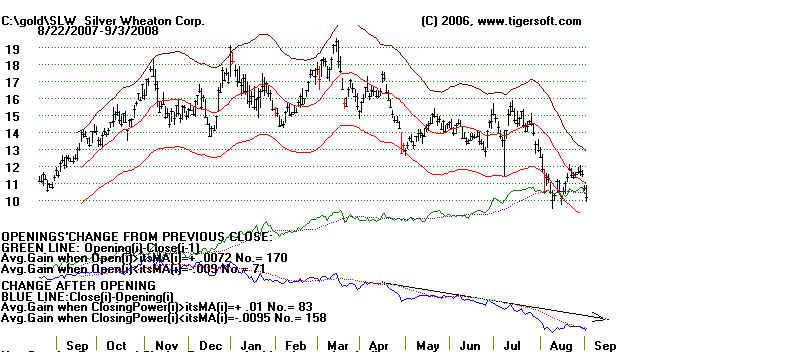
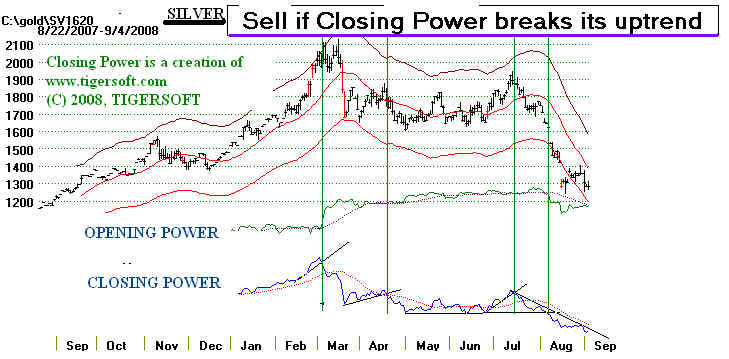
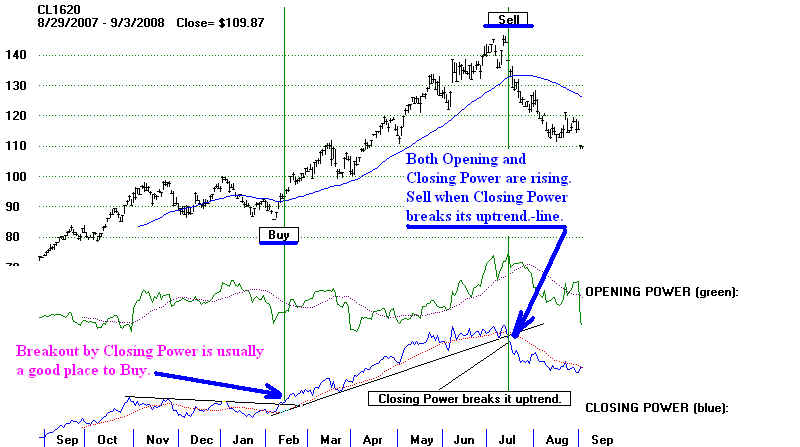
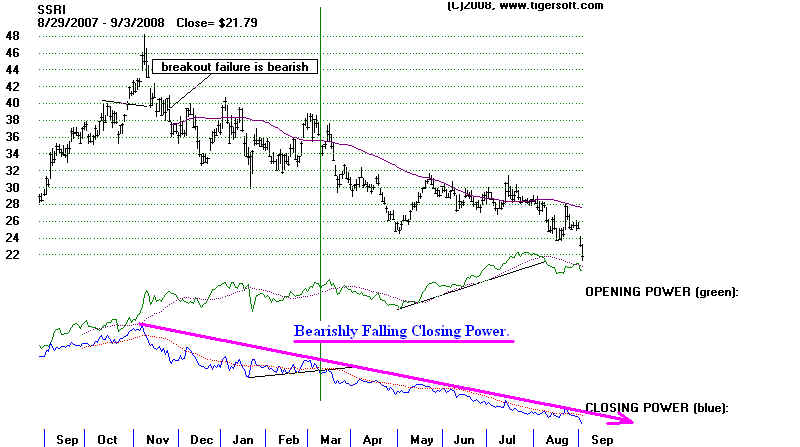
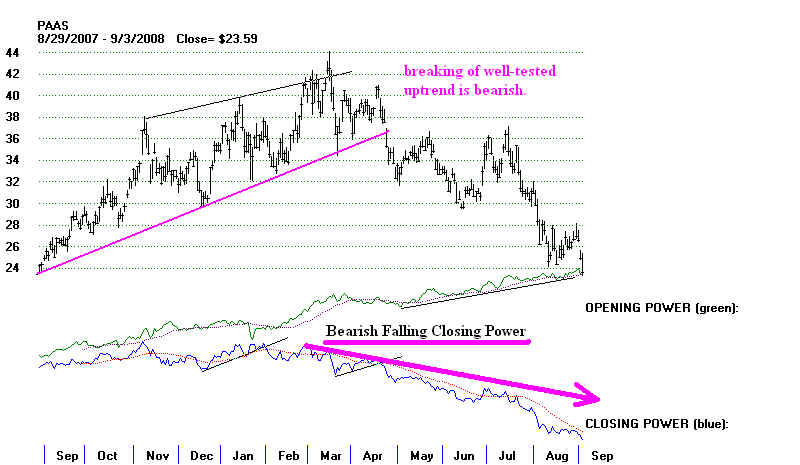
(7) Use TigerSoft's Closing Power To Spot
Reversals
There was another bearish aspect to
Oil's advance into July.
It was too quick. It
had "bubble characteristics" in the sense that
both Tiger's Opening Power
(public buying) and Closing Power
(professional buying) were
rising simultaneously. This makes for
an exciting climax in prices.
But when the Closing Power breaks its
uptrend, it is bearish.
Traders will usually make money looking
for these situations and
going short. See the Opening and Closing Power
for Crude Oil in the chart
below.
----------------------- Crude Oil (Perpetual Contract) -------------------------------------
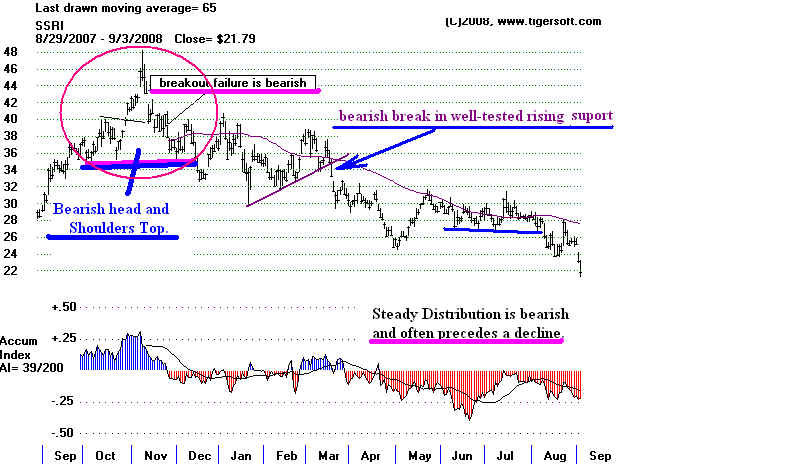
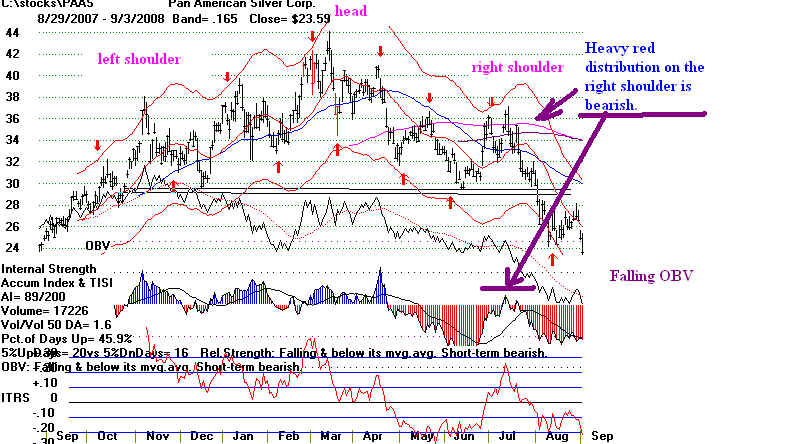
(8) Study individual silver stocks like SSRI and PAAS for signs of red
(bearish) distribution, (bearish)
false breakouts, (bearish) head and
shoulders tops and (bearish)
violations of well-tested support.
For more information on "false breakouts" see:
http://tigersoft.com/Tiger-Blogs/11-15-2007/index.html
and
http://www.tigersoftware.com/Breakouts/index.html
TigerSoft predicted the
world bull market was ending in November 2007 by noting how
many
head and shoulders patterns were appearing in foreign ETFs.
http://www.tigersoft.com/Tiger-Blogs/11-22-2007/index.html
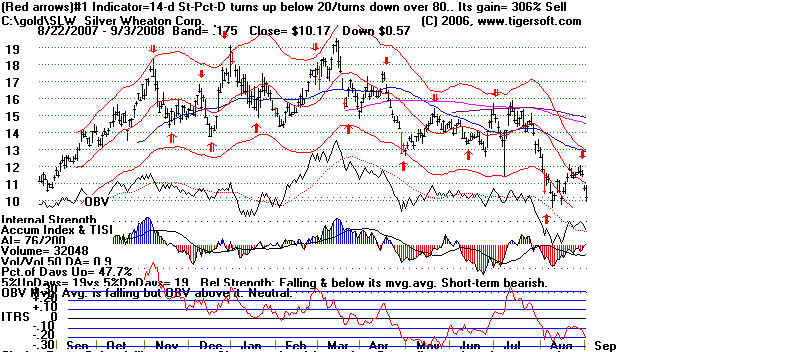
So
long as the Accumulation Index is below its falling moving
average and the Tiger
Closing Power is falling, it would be best not
to try to call a
bottom. Guarding capital should be the #1 rule for
traders and investors.
------------------------------------------- SSRI --------------------------------------------------------------
--------------------------------------------------- PAAS -----------------------------------------------
(9) Study individual
silver stocks like SSRI for important clues about
where professionals think the stock is headed. A falling Closing
Power trend is bearish. That the public is bullish, shown by
a rising Opening Power, is usually not enough to keep the stock
from falling.
======================= SSRI ==============================
======================= PAAS ==============================
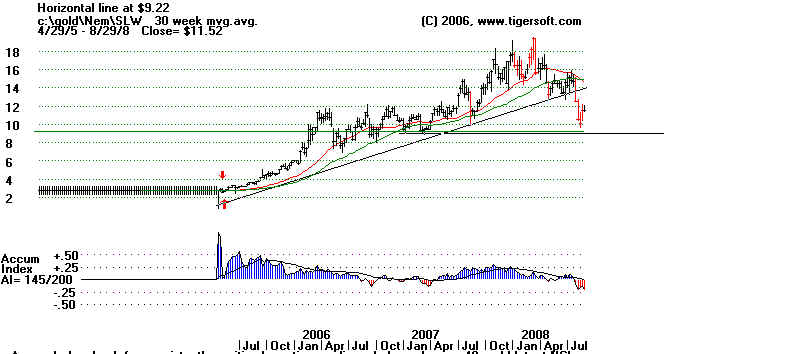
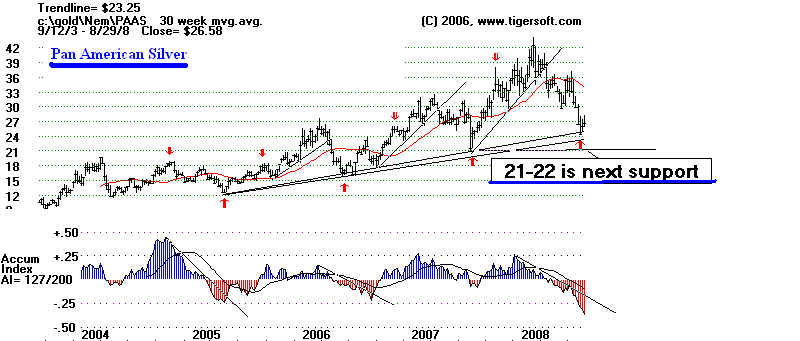
(10) Look at Weekly Charts To
Find Support on A Steep Decline.
Below are the 5-year charts of Silver, Pan-American Silver (PAAS)
and Silver Standards (SSRI).
Earlier lows are commonly used to try
to call a bottom. But when
prices fall very, very steeply, it may seem
like calling a bottom in this
environment is like catching a "falling knife".
----------------------- Silver Stock - PAAS -------------------------------------
PAAS formed a head and shoulders top
with a neckline
at 30. The height of its pattern
was 43-30. Taking the height
of the pattern, 12 points from 30, yields a downside price
objective of 18 using classic technical analysis techniques.
A rally back to 30 would then be a distinct possibility technically.
Traders would expect a rally of 33% to 50% of the amount lost
from the high to be recovered.
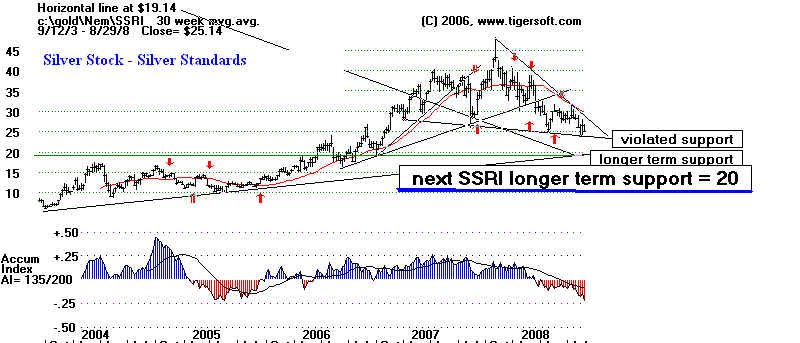
----------------------- Weekly Silver Stock - SSRI -------------------------------------
It is hard to be constructive about SSRI's technical picture.
It should find support at 20, but how much will it rally?
The weekly chart of SSRI shows a bearish head and shoulder top.
The right shoulder displays negative (red) distribution. The height
of the pattern is about 20 points highs. The breakdown point
was about 25. This too-simple approach warns that it could drop
back below 10. Traders should understand that It is not
safe to buy until is breaks its price downtrendline. And any rally
from 20 back to 25-26 should be used to sell, as a precaution.
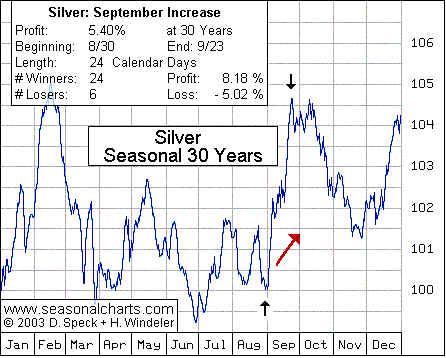
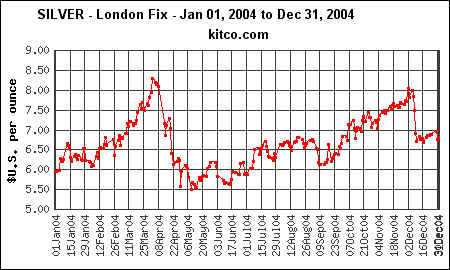
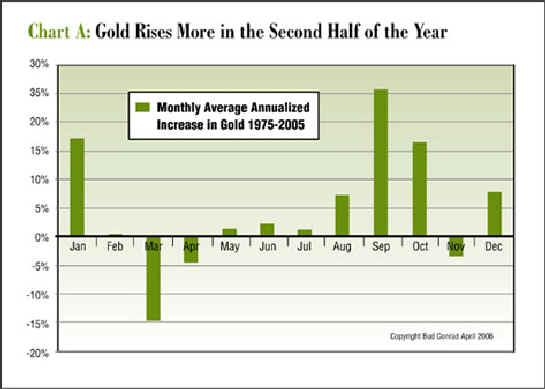
(11) Use Gold Seasonality to Help
You Look for Tops and Bottoms.
When Silver goes opposite to the direction expected by
Seasonality we should certainly be cautious. It should
by
seasonality be rallying this month, instead it is falling.
The chart
and the data below show how Silver did from 1973-2003.
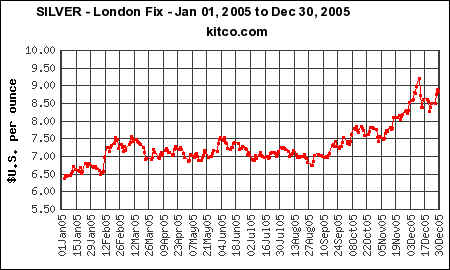
Silver also
rose in September each year, 2004-2007, That means
it advanced
in September in 27 of 33 years.
The 'Silver: September Increase' is
the seasonal rise in silver, starting
on August 30 and ending on September 23. The increase was observed
in 24 of 30 years, resulting in an average profit of +8.2%. But there were
also 6 years, where the price of silver fell during this period of the year.
The average loss then was -5%. The overall rise during all 30 years was
+5.4% p.a.
( http://news.goldseek.com/GoldSeek/1061908537.php
)
Silver 2004
Silver was up.
Silver 2005
Silver was up.
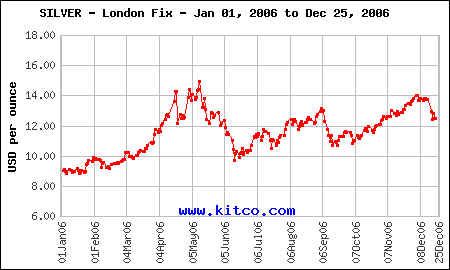
Silver 2006
Silver was up.
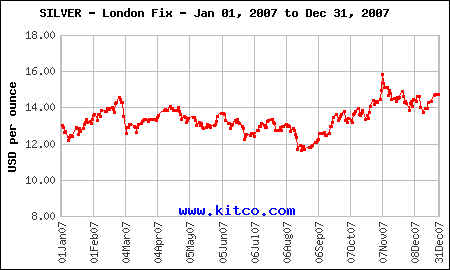
Silver 2007
Silver was up.
======================================================
Apply These Concepts to Another SIlver Stock,
SLW