NEM- Newmont Study: 4/15/2010
TigerSoft Charts (C) William Schmidt, Ph.D.
TigerSoft Accumulation Index and Professional Buying-Closing Power
Relevant Raw Materials' Chart - GLD (Gold)
Industry or Sector ETF Chart - Here we use XAU. Also Tiger Chart of Gold Stocks
Current Weekly Chart
Current Year's Chart
Composite for Seasonality
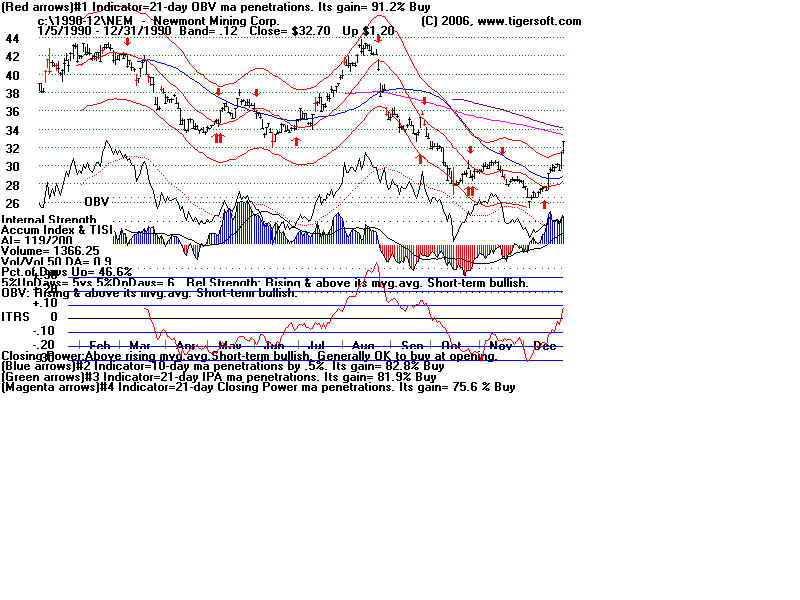
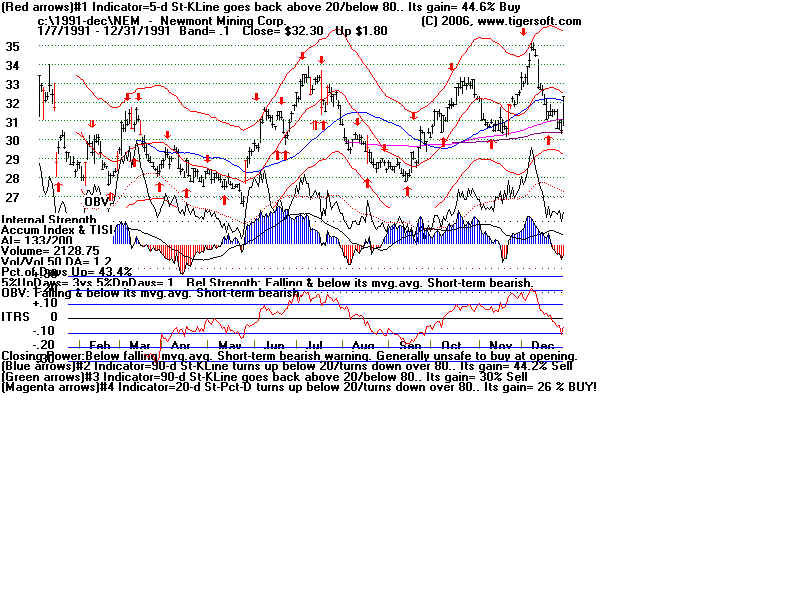
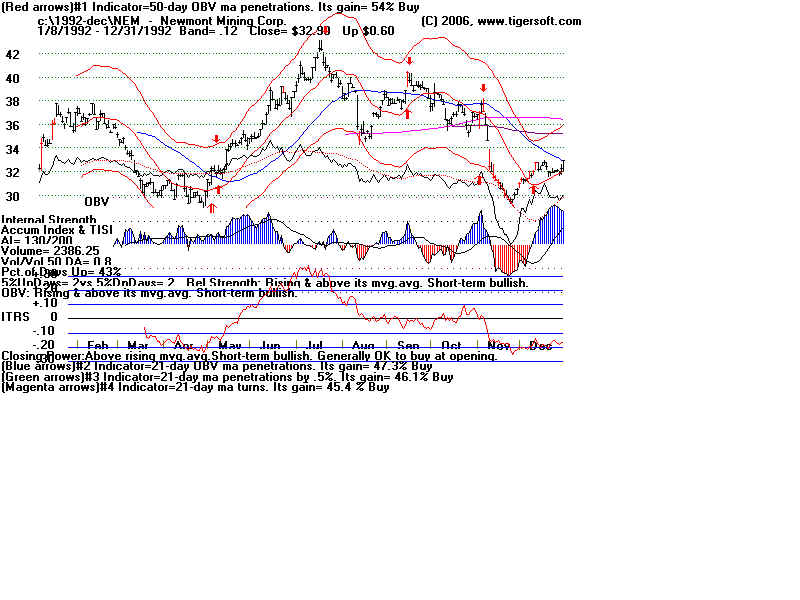
Yearly Charts: 1990-2007
This is a sample of Research we can provide you on a Request Basis. Price is $125 per stock.
Contact - william_schmidt@hotmail.com 858-273-5900 Visa/MC accepted.
ORDER HERE - http://www.tigersoft.com/Order_Forms/order-SpecialResearch.htm
 |
NEM - Newmont Mining Gold Mining Stock . TigerSoft Study 4/15/2008 TigerSoft Charts (C) William Schmidt, Ph.D. For more information: www.tigersoft.com
|
NEM- Newmont Study: 4/15/2010
TigerSoft Charts (C) William Schmidt, Ph.D.
Unique Indicators:
TigerSoft
Accumulation Index: See study of NEM from 1987-2010
86%
if its Sell Signals are accurate and profitable.
TigerSoft
Professional Buying-Closing Power's Trend-Breaks - below
| 2009-2010
USE TREND-BREAKS IN TIGER'S CLOSING POWER TO BUY AND SELL ESPECIALLY IN STOCK THAT IS TRADES UNEVENTFULLY. 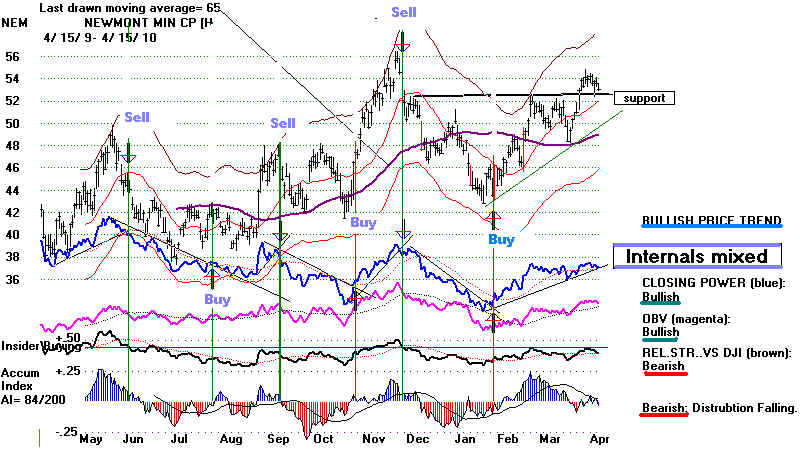 |
| 2008-2009
USE TREND-BREAKS IN TIGER'S CLOSING POWER TO BUY AND SELL 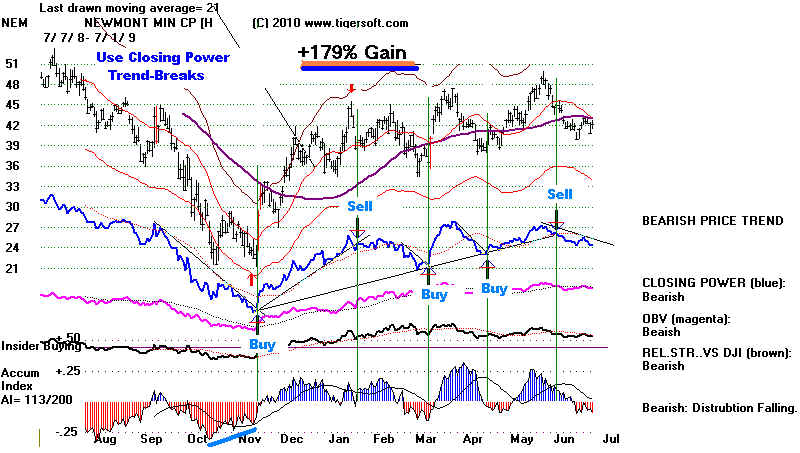 |
2008
CP Sell
CP Sell CP-Buy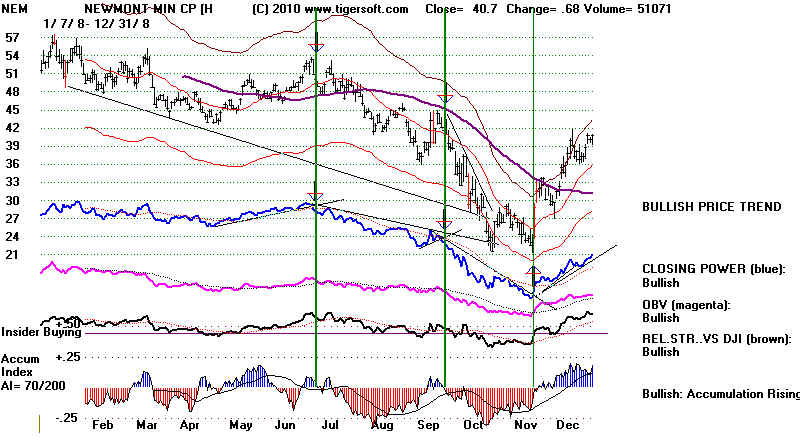 |
More Unique Indicators:
Relevant Raw Materials' Chart - GLD (Gold)
Relevant Industry or Sector ETF Chart - Here we use XAU and Tiger Index Chart.
Current Weekly Chart
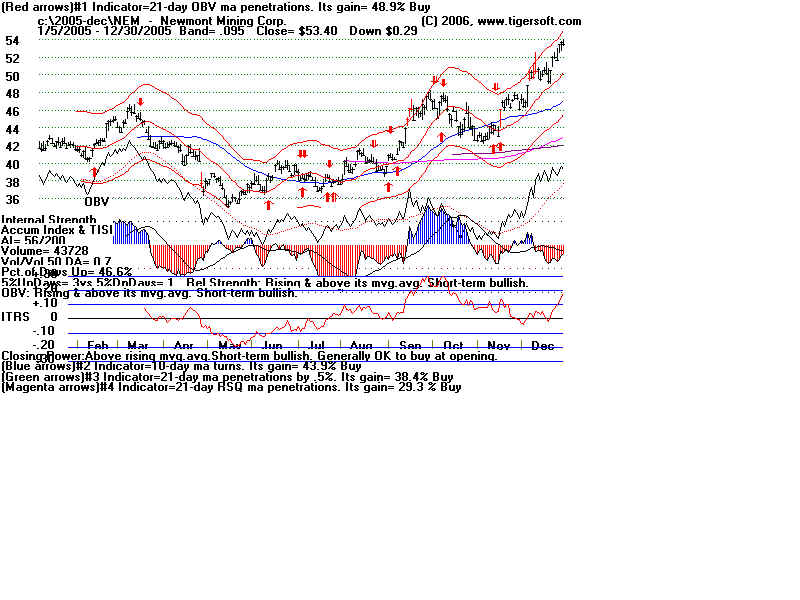
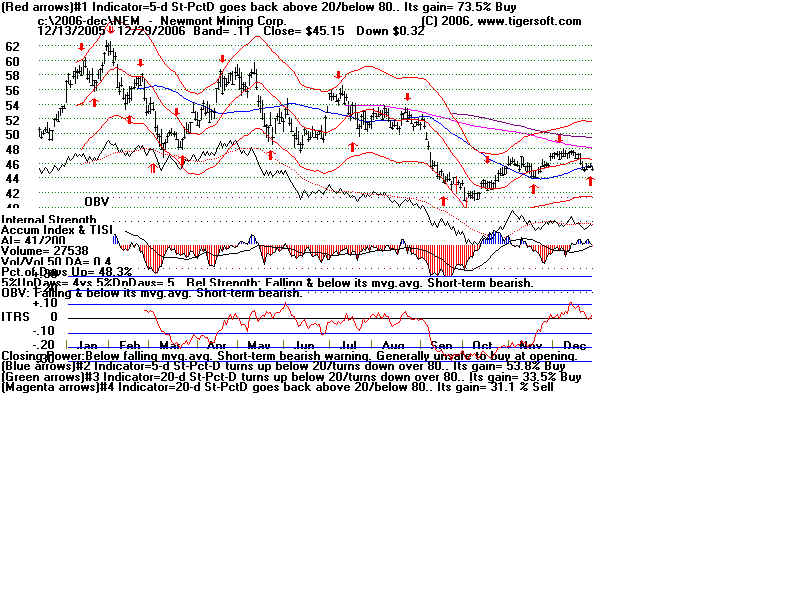
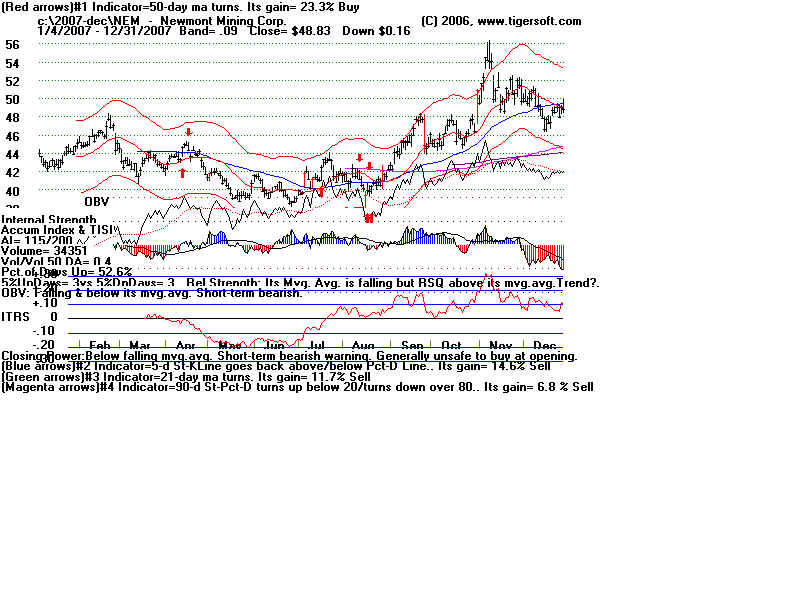
Current Year's Chart
Composite for Seasonality
Yearly Charts: 1990-2007
NEM website - http://www.newmont.com/en/
Other TigerSoft Analyses
like this are offered for $125.
Observations:
Previously TigerSoft has noted that insiders and their closet Wall Street connections
appear
to
hold back relevant information from shareholders while selling their shares to an
unknowing public.
See -
http://www.tigersoft.com/Insiders/NEM-Insider%20Selling.htm
Other
gold mining shares appear more attractive in that their relative strength is greater
and
their shares appear to show significantly more accumulation.
See
bottom of this TigerSoft Blog - http://www.tigersoft.com/Tiger-Blogs/Jan-29-2008/index.html
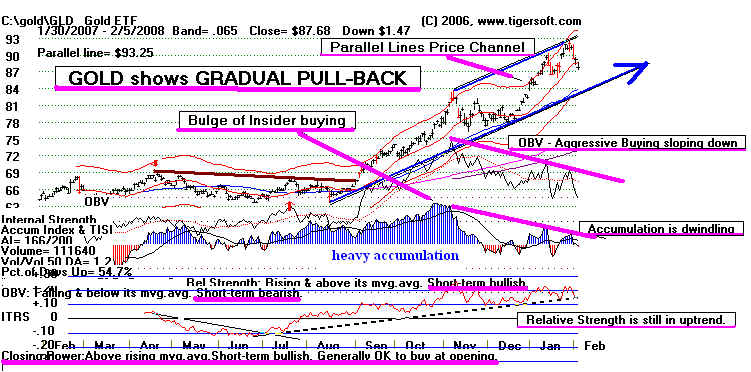
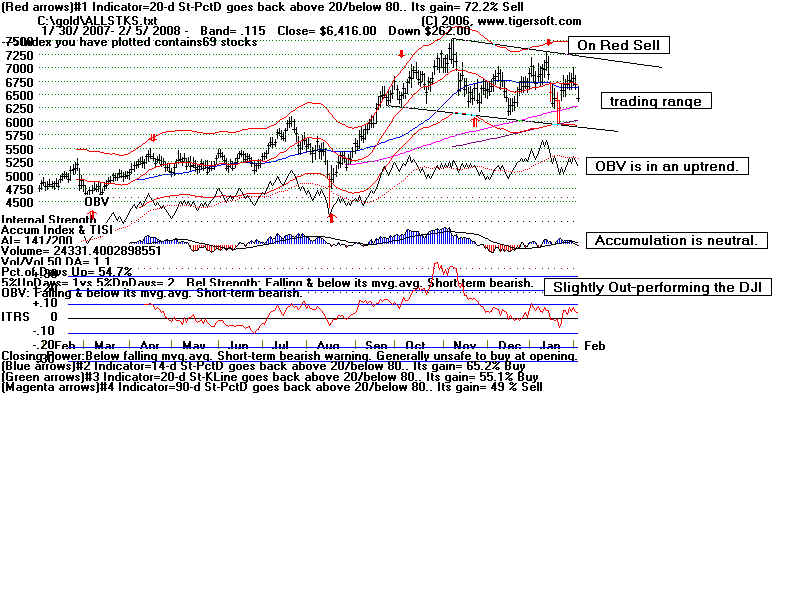
Gold
is in minor down-trend. But still in intermediate uptrend. Internals are
weakening.
A
decline to bottom of price channel may be shaping up. Or Gold may simply move sidewise
to
the bottom of the channel. Interest Rate cuts are bearish for Dollar and bullish for
Gold.
Federal Spending and US Trade Deficits are, of course, long-term bullish for Gold and
bearish
for
the Dollar. The Dollar (Not shown) is on an intermediate-term TigerSoft Sell.
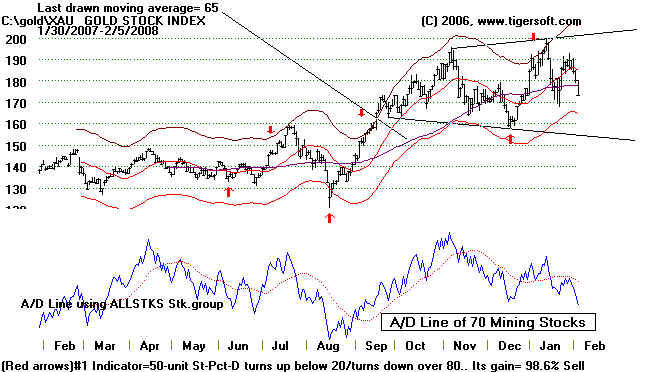
Industry Charts are still on optimized Sells. As they have gained nearly 100% for
the last
year,
I would trust them.
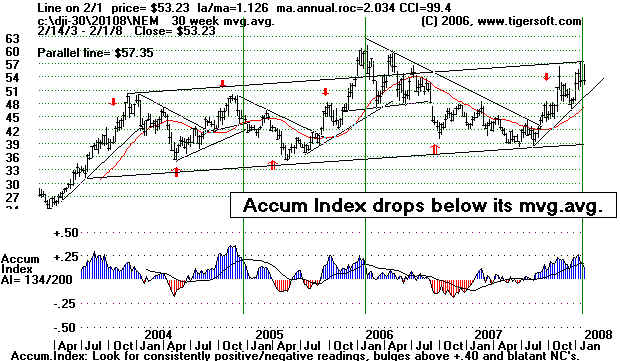
Weekly chart shows uptrendline which crosses at 48.84. Breaking that
sets
up a more lower target after the next rally. That level acts as support
Weekly chart shows the current Accum. Index has just fallen below its ma.
This
also sets up a much lower target after the next rally.
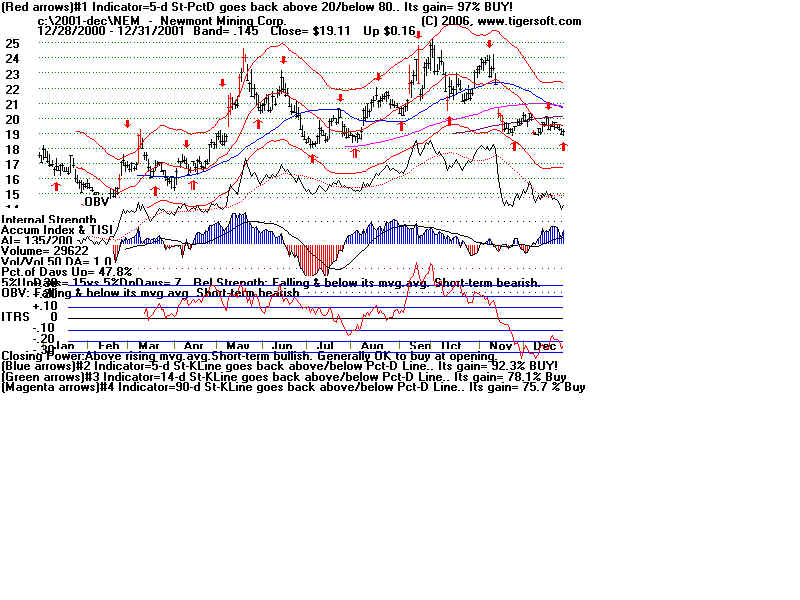
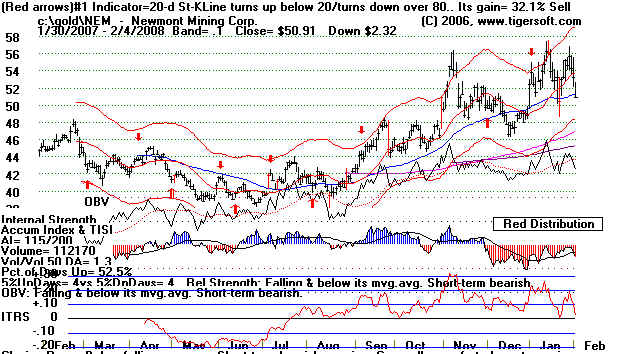
Current Daily shows very red Distribution for 10 weeks. Insiders are selling
in
advance of news to come out, perhaps when next earnings come out on Feb 8..
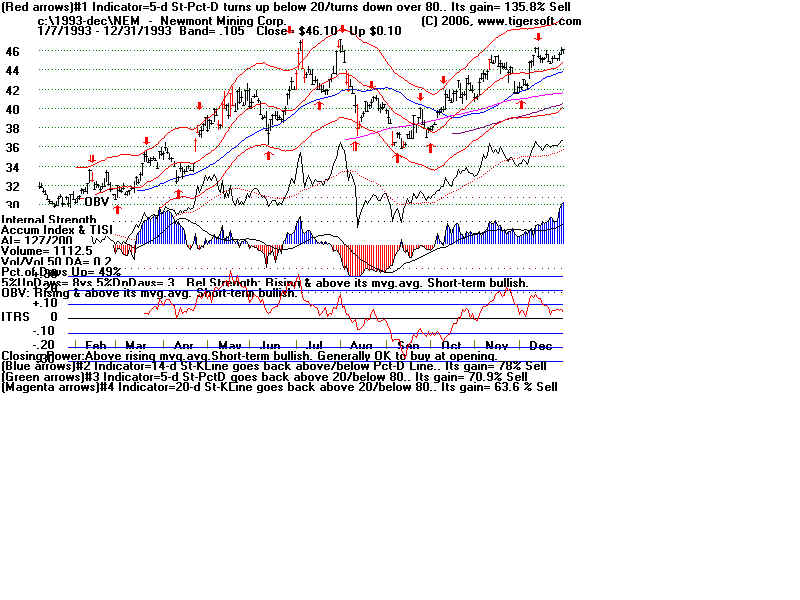
11 Earlier examples of this that proved bearish. 1 case saw rally continue.
July 92 - far less severe selling on strength.
July 93 - far less severe selling on strength.
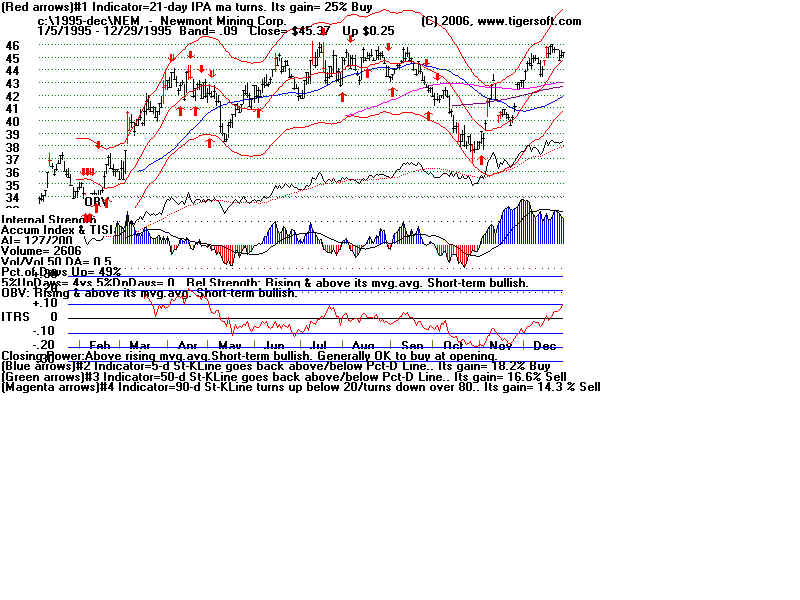
April 95 - far less severe selling on strength.:
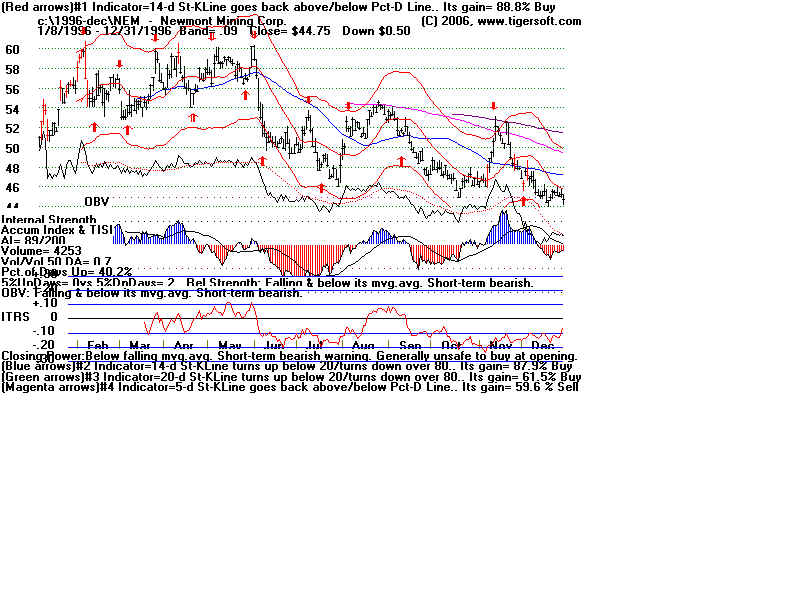
May 96 - far less severe selling on strength.
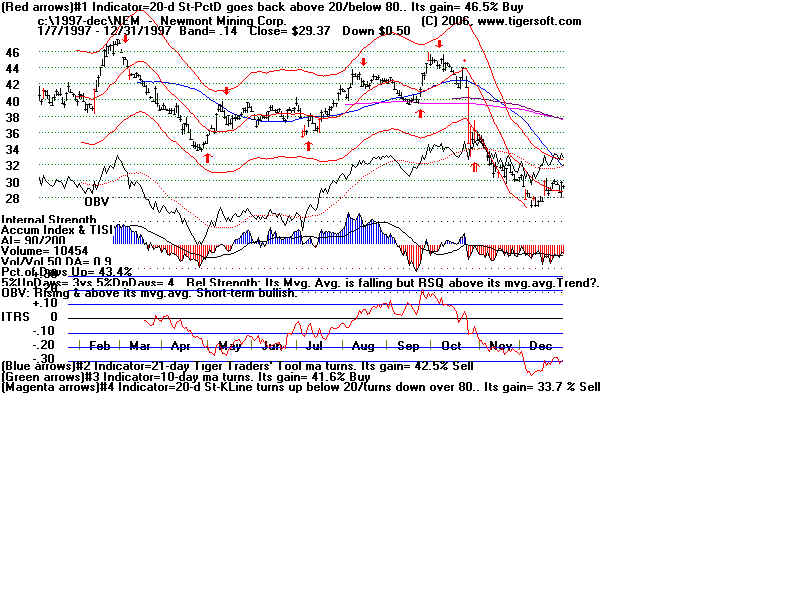
September 97 - selling on strength.:
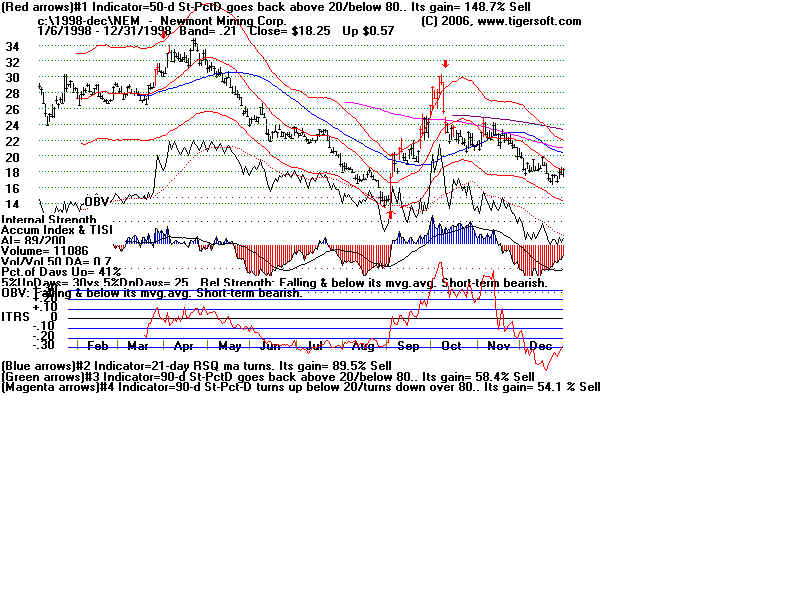
April 1998 - selling on strength
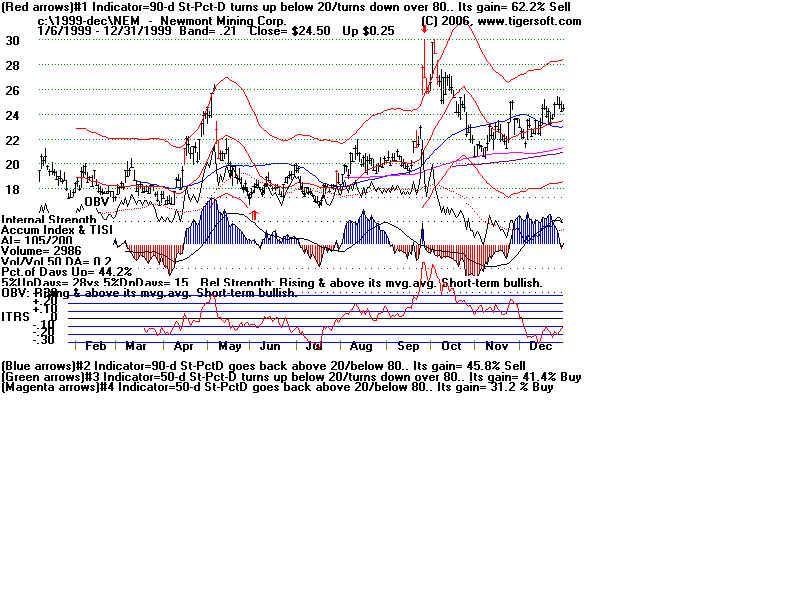
October 1999 - selling on strength
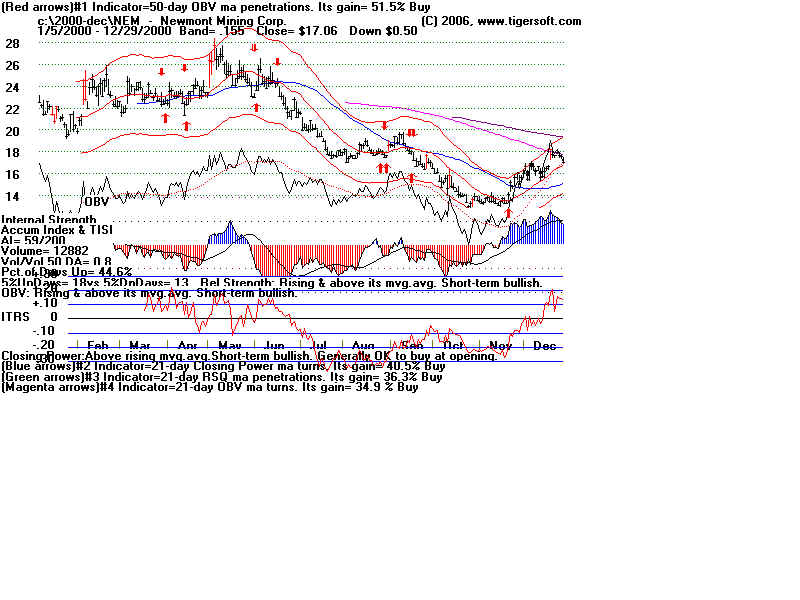
October 2000 far less severe selling on strength.
October 2001 far less severe selling on strength.
March 2004 far less severe selling on strength.
X December 2005 - NEM rallied another 10%
April 2006 significant insider selling and big drop.
Composite suggests a mid Feb peak.to mid March low. Then rally to mid April
In
addition: Note that Tiger statistics for the last year show that:
The best day of the week for the stock is Friday. It is rises 57.6% of the time.
The probability of opening higher is greatest on Friday - 76.9%
The probability of opening lower is greatest on Tuesday - 53.0%
The probability of a strong closing is greatest on Wednesday 55.7%
The probability of a lower closing is greatest on Monday 36.7%
For the
last month, ir is now showing a tendency to both open lower and close below the opening.
Streaking: There are no cases of it declining more than 4 straight days.
There are no cases of it rising more than 6 straight days.
=========================== XAU Gold Stock Index
=============================
=========================== XAU Gold Stock Index
=============================
The optimum system has gained nearly 100% for the last year.
The A/D Line for 70
mining stocks is in a downtrend.
==================== TIGER
INDEX OF 69 Gold/Silver Mining Stocks ===================
==============================================================================
Current Weekly Chart
Composite NEM Chart for Seasonality