 TigerSoft and Peerless Daily Hotlines
Samples - 3/24/2010
- 4/12/2010
Earlier Hotlines
-
Links
removed for these older hotlines. They are available to subscribers...
2010 2/12/2010 - 3/22/2010
1/15/2010 - 2/11/2010
2009
10/21/2009-1/14/2010
8/30/2009-10/20/2009
7/31/2009-8/28/2009
7/1/2009-7/31/2009
6/14/2009-6/30/2009
5/1/2009 - 6/11/2009
3/30/2009-4/30/2009
----------------------------------------------------------------------------------------------------------------------------------------------------
4/12/2010 Peerless Remains on A Buy.
If there is a retreat, it should be shallow
4/12/2010 10006 la/21-dma= 1.015
21dma-roc = .433
P= +316 Pch= -8 IP21= .077
V = 20 Opct = .426
21dma-roc >.70 shows unusual momentum. A reversal down is
more unusual.
More information on back-testing this soon.
IP21 (Current Accum.) >.25 make it harder for a downwards reversal.
Important Notice: Redistribution of any text
or concepts here is a violation of copyright laws. This is valuable intellectual
property.
All violators will be subject to legal action. Please visit www.tigersoft.com Goggle TigerSoft and a technical subject, to get
additional examples and a further discussion of concepts and terms used here.
See also our Books for sale. .
(C) 2010 William Schmidt, Ph.D.
===> Order form to Renew
On-Line, "Nightly Peerless/TigerSoft Hotline " ($298)
3/30/2010 When Selling A High
Accumulation "Bubble" Stock on Weakness Is A Good Strategy.
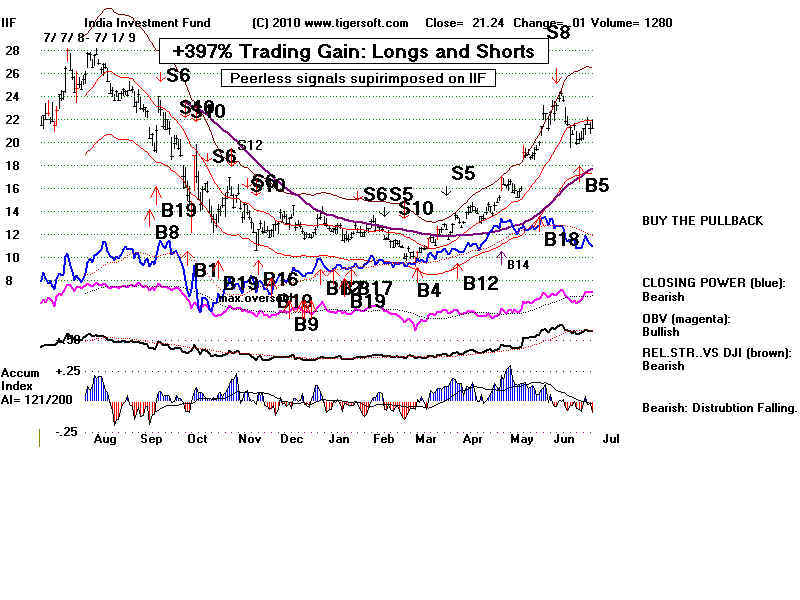
3/27/2010 - Indian ETFS Using Peerless Buy and Sell: So Very Profitable since 1998
3/11/2010
Tiger Weekly Buy B12s on All Stocks, ETFs, Commodities.
3/1/2010 - Many Bubble Stocks Are Going Higher.
2/20/2010 - Watch The Pros To Catch The Tops in "Bubble" Stocks.
Market Tops Seem To Follow Their Break-Downs
-------------------------------------------------------------------------------------------------------------------------------------------------------
HOTLINE - 4/12/2010
-------------------------------------------------------------------------------------------------------------------------------------------------------
Overnight Market Action:
Bloomberg
Futures around the world before the US Markets open.
24-hour Spot Chart - Gold
24-hour Spot
Chart - Silver Dollar and Currencies
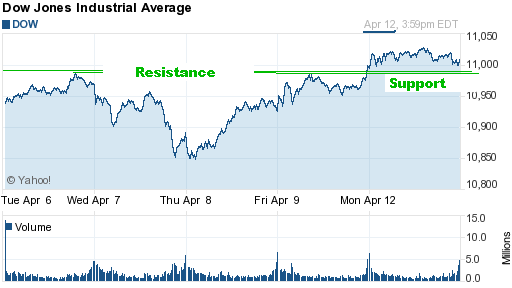
5-day DJI Chart - 4/12/2010 10980-11000 is support
Daily NYSE 224 New Highs - NYSE 3 New Lows
Bullish.
Daily NASDAQ 149 new
highs - NASDAQ 4 new lows. Bullish.
So long as the ratio of new highs to
new lows is 10:1, it's hard to predict a significant
decline. New lows exceeding new highs within 4 days of making a new DJI high,
on the other hand is very bearish.
HOTLINE -
4/12/2010 Peerless Remains on A Buy.
Gold's Internal Strength Is A Warning That The Rally in Stocks Will
Be Limited.
Stay long is our recommendation. Since 1965, the DJI has risen 73% of the time
in the week following April 12th. In fact, the DJI rallied 63% of the time in the
month after April 12th.
Volume was low, as usual. But the move past 11000 showed good breadth and the
internals have not slipped so much down from their previous highs to make a decline back
to
the lower band a high probability. The Closing Power uptrends are still
rising.
I
went through about 250 of the SP-500 stocks to see if there are any head and shoulders
patterns among their charts. There were none, except AA's. Oil, retail and
financial
stocks, particularly, are quite strong.
By my
thesis, the strength in the bank stocks is intentional on the part of the Fed and the
Obama
Administration. Sadly, the Power Elite finds it impossible to help their banker
friends and
also
create Main Street jobs directly. That is a contradiction that only they seem to
still
deny.
They must gamble that the rising stock market will give the rich and the
surviving middle class enough extra money to boost consumer demand. But will what
they
buy really be made in America?
Gold, Bankers and Stocks
The
Power Elite's role now in propping up the Dollar would be nice to get data on.
They
do seem now to prefer a strong Dollar, which especially helps the big US banks
to
keep and attract deposits. My guess is that the Fed-Administration-Banker
triumvirate
are
probably shorting Gold to discourage a run upwards in it. Again no information is
available. A Goldman man runs the Commodities regulatory agency. He will not
permit
big
short sale positions to be disclosed publicly. Only big long positions must be
revealed.
How
long will the FED-ADM team succeed in holding down Gold? Look at all the
Accumulation in
the
perpetual contract for Gold (GO1620). (I believe the futures market in Gold is more
important and a better predictor than GLD. It seems likely that GLD represents
public
buying or selling, while the trading in Gold futures is done by big profesionals. )
I
keep remembering how from 1977 to 1980 when Democrats took over from Republicans
and
unemployment was very high, Gold quintupled even as the Fed raised rates steeply.
But
there are other President-Democrats. FDR ended all speculation in Gold. But,
Obama is
not
only no FDR, he is also no Carter. I think he is trying to be more like Clinton.
In
financial matters, Clinton took financial marching orders from Greenspan, Rubin and
Summers,
all
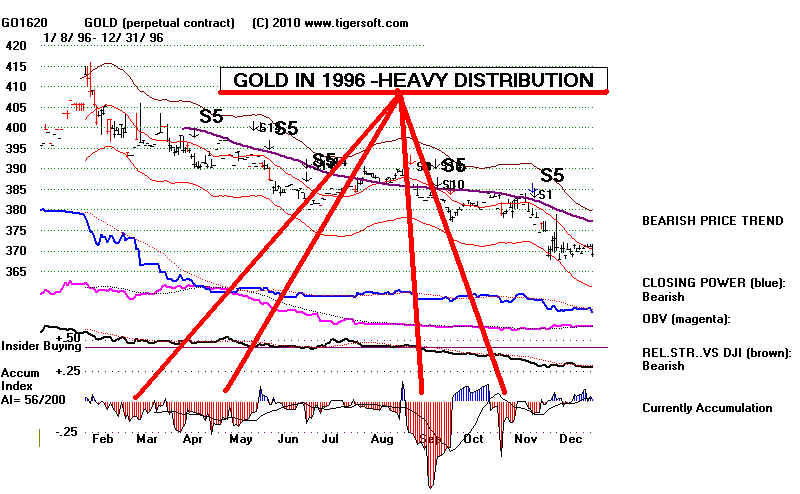
representatives of Wall Street. Under Clinton, Gold first rose from 330 to 420 and
held there
until
1996. Then it began a long slide downward to 250 in late 1999, as stocks became
a
much better investment. If stocks were presently at the start of a 5
year advance,
as in
1995-1999, Gold would be in a decline or showing red Distribution from TigerSoft.
That
it now shows so much Accumulation, suggests that Wall Street's efforts to rekindle
a
long bull market will probably not be successful.
GOLD IS NOW UNDER HEAVY ACCUMULATION
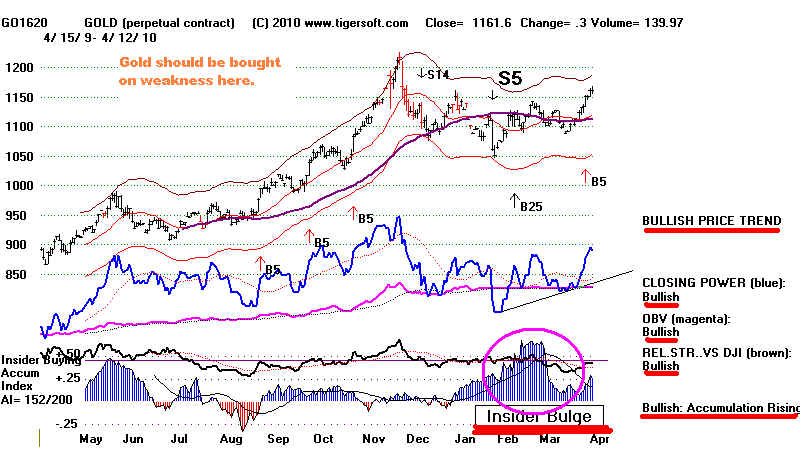
If
Gold were about to go into a long decline -thereby showing stocks would rally much
further - one would think it
would show heavy red distribution, as it did in 1996 when it
was starting a four year
decline.
STOCKS
Generally,
it is best to focus on high AI/200 stocks with the market up nearly 9%
since the
first of the year. Then look for high current Accumulation (IP21) and rising
Cloning
Powers.
Group:
Stocks with Bullish Internals
========
=============================
SP-500 - D -
41.18 (AI/200=188, IP21>.25 )
NASD-100 LNCR - 47.18
(AI/200=178, IP21>.25)
FAST - 51.90 (AI/200=140. IP21>.25)
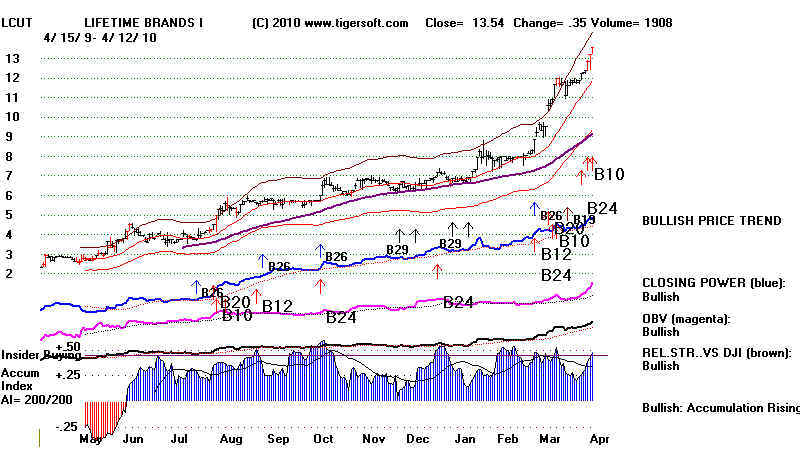
NHCONF LCUT -
13.54 (AI/200=200. IP21>.48)
VOE - 50.23 (AI/200=184, IP21=.43
PHT - 16.44 (AI/200=199, IP21=.26
LNCR - 47.18 (AI/200=178, IP21=.32)
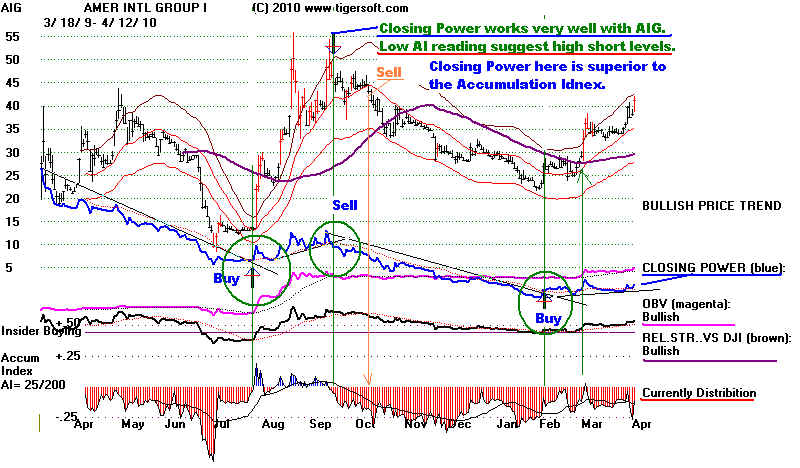
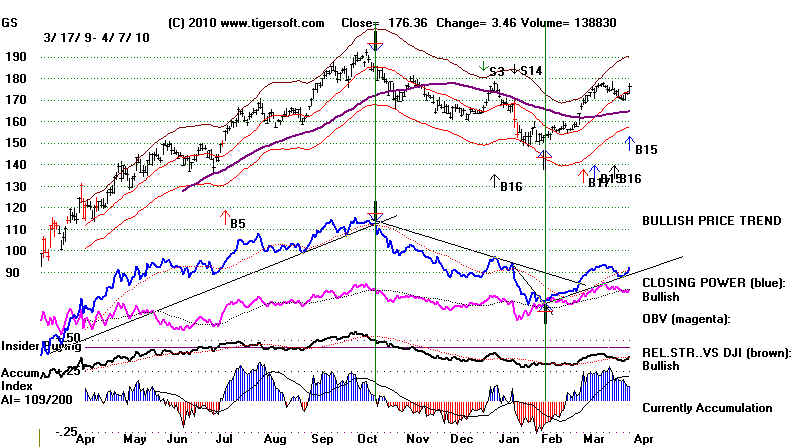
AIG - Turnaround
Look at AIG's chart below. You can see how important the 65-dma was and how the
Closing Power's trendbreaks have timed the stock's turns superbly. The AI/200
has
been very negative for a year. Eventually, the stock will decline. At least,
the
is
usually true with stocks showing so much red Distribution.
==================================================================================
==================================================================================
HOTLINE -
4/9/2010 Peerless Remains on A Buy.
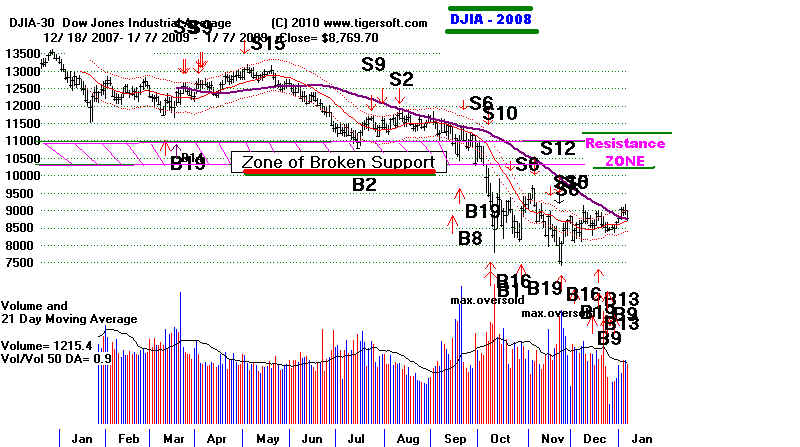
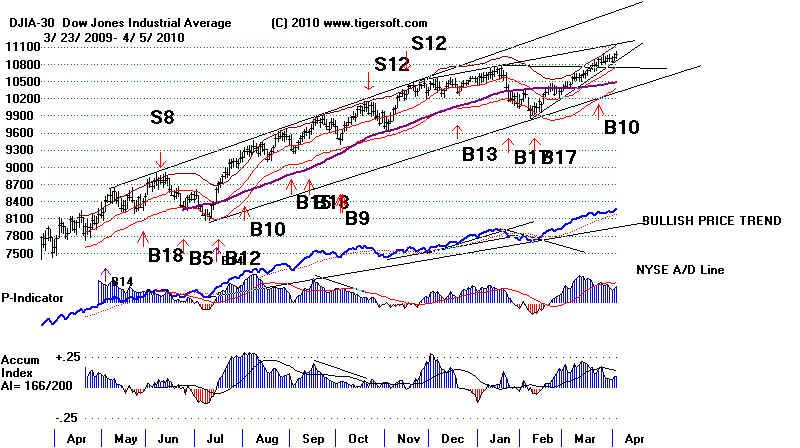
The 10,000 Barrier Almost Overcome
The DJI is
challenging the 11000 psychological resistance. This actually seems to be
the top of
the resistance zone that crumbled in 2008 when Paulson demanded $800,000,000
for his
Wall Street buddies, "or else". The shock of that collapsed the market
below
the
attempted 10600-11000 support. As we all know, broken support becomes resistance.
It is that
resistance which the DJI has been eating up for the last few months. It seems
that now
the resistance may be nearly all eaten up. This is difficult to assess, admittedly,
and volume
has been low. Nevertheless, it now looks like the DJI is close finally to surpass
the
rest of the
10600-11000 resistance. With Peerless on a Buy and the NYSE A/D and CLosing Power
Lines still
uptrending, we have to remain bullish. I think I am correct that the Power Elite
wants,
almost desperately, for the rally to continue. The alternative, with unemployment
still so
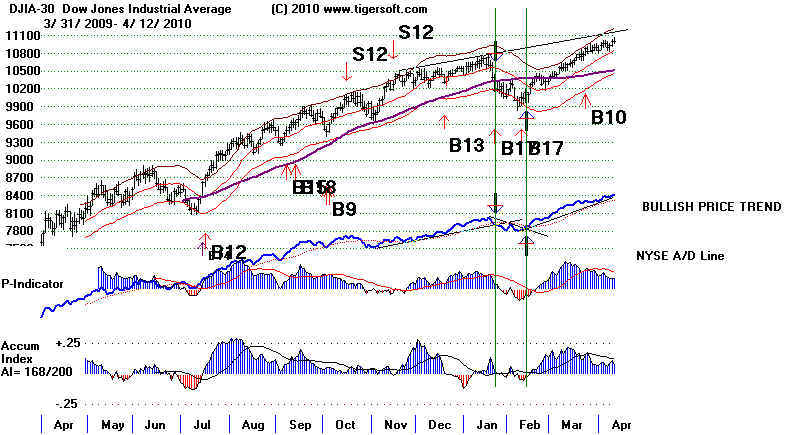
high, is too grim. 4/8/2010 12000 or Bust. The
Power Elite's Biggest Gamble of All"
2008: DJIA's -10600-11000 Resistance Has Been A Barrier to DJI's Advance in 2010.
I think that the operative Peerless Buy signal should be respected. Confidence in
Peerless
grew for me
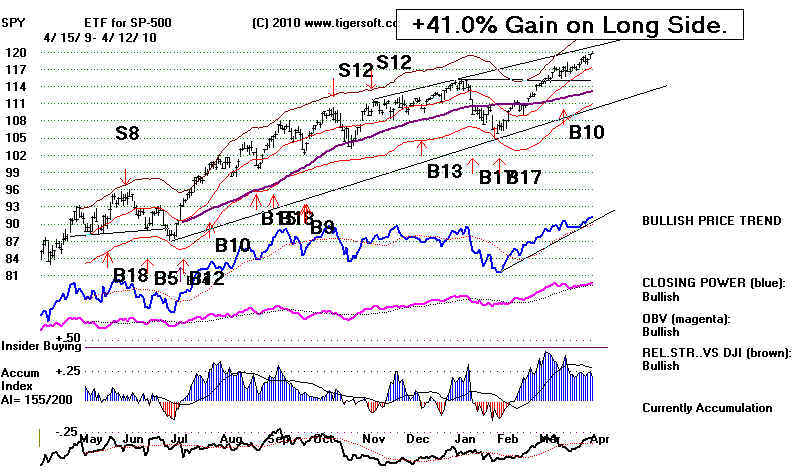
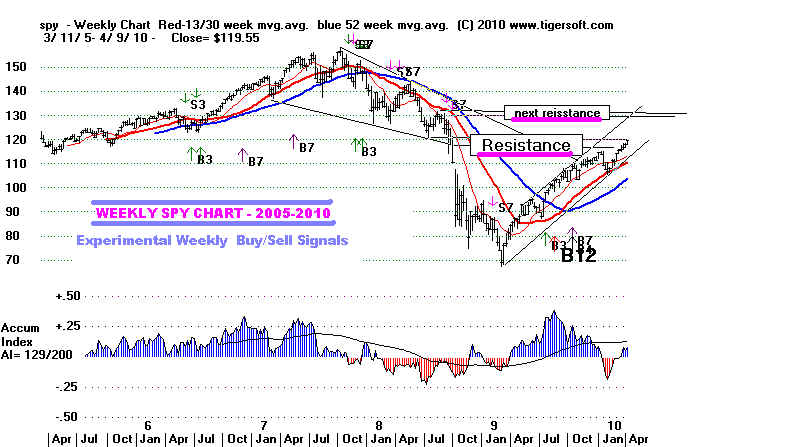
as I researched this weekend my new study of Peerless and trading SPY.
In
particular, besides great gains on the SPY using Peerless, I noticed that after a
+30% Annualized
Return on SPY since 1993.
big
advance since 1993, when a long trade on the SPY was up more than 8.4%, as now,
the odds
have been good (10 of 16) that SPY will rise still more and achieve a gain of more
than 13%
before the next Sell. In the other 6 cases, the SPY could not rise to a gain
of more
than 11.9%.
That might take the DJI only to 10200. Should this less bullish scenario play
out, it is
still worth noting that only shallow declines followed the next Sell in these 5 cases:
+2.6%,
+0.5%, +4.7%, +4.4%, +5.7%. So, the conclusion I reach is that the odds are
perhaps 60%
that the DJI will keep rising meaningfully. But if there is a Sell signal soon,
only a
shallow decline will follow.
Cases where the SPY Gained more than 8.4% aon a Buy: 1993-2010
2/27/1996 Sell S1 +3.3% decline after earlier +43.7%
rally
4/22/1997 Sell S9 -6.8% rally aftter +13.1% rally
9/18/1997 Sell S12 +2.3% decline after +14.1% rally
4/28/1998 Sell S15 +12.4% decline after +16.4% rally
6/18/1999 Sell S12 +2.8% decline after 36.0% rally.
- 12/28/1999 Sell S9 +2.6% decline after 11.9%
rally - minor additional rally
- 10/10/2001 Sell S9 +0.5% decline after 8.5% rally. - minor additional rally
10/15/2003 Sell S4 -1.3% rally after 17.9% rally.
- 2/11/2004 Sell S15 +4.7% decline after 9.4% rally. - minor additional rally
- 12/28/2004 Sell S8 +4.4% decline after 9.6% rally. -
minor additional rally
5/8/2006 Sell S9 +5.4% decline after +14.4%
rally.
1/5/2007 Sell S4 +2.1% decline after +13.4%
rally.
- 7/17/2007 Sell S9 +5.7% decline after 11.8% rally. - minor additional rally
- 3/27/2009 Sell S5 -4.4% rally decline after a
9.3% rally. - minor additional rally
6/9/2009 Sell S8 +5.6% decline after a +14.6%
rally.
10/21/2009 Sell S12 -1.9% rally after a 20.0% rally.
Current rally is +8.5%/
-------- PEERLESS SIGNALS ON DJIA ---------
HOTLINE -
4/9/2010 10997 la/21-dma= 1.016
21dma-roc = .474 P=
+323 Pch= 1 IP21= .117 V = 26 Opct
= .426
21dma-roc >.70 shows unusual momentum. A reversal down is
more unusual.
More information on back-testing this soon.
IP21 (Current Accum.) >.25 make it harder for a downwards reversal.
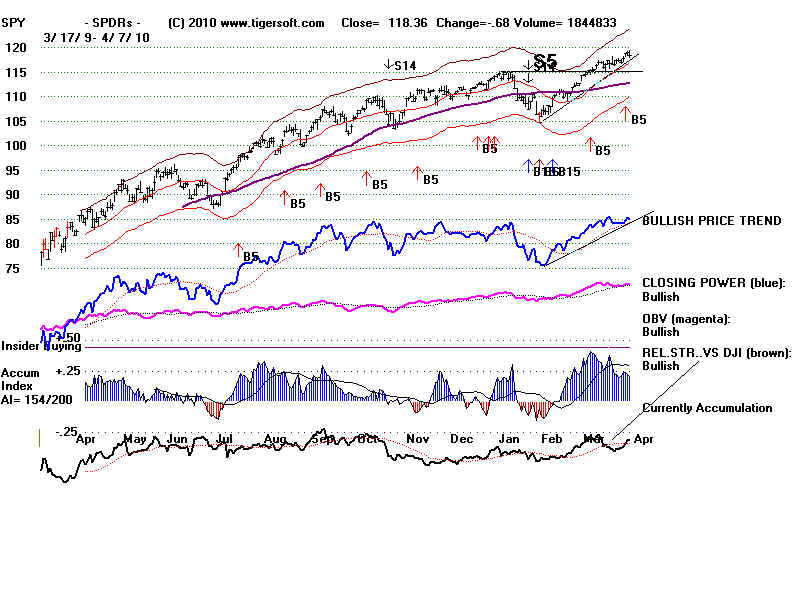
SP-500 - Closing Power is making
a new high.
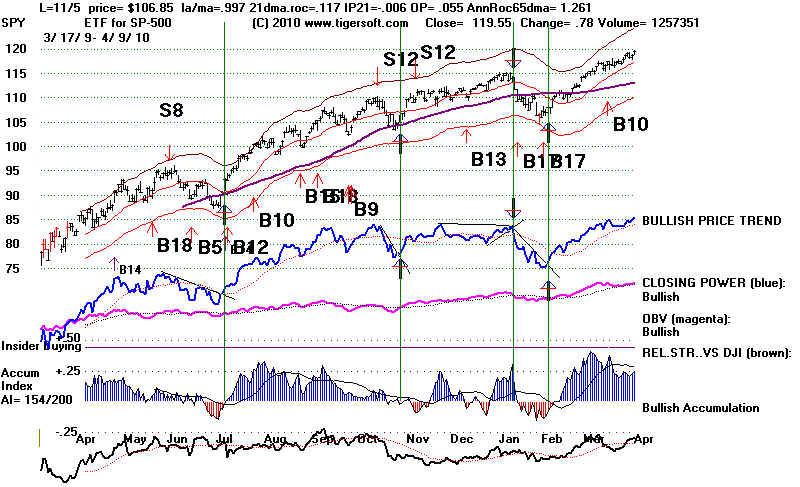
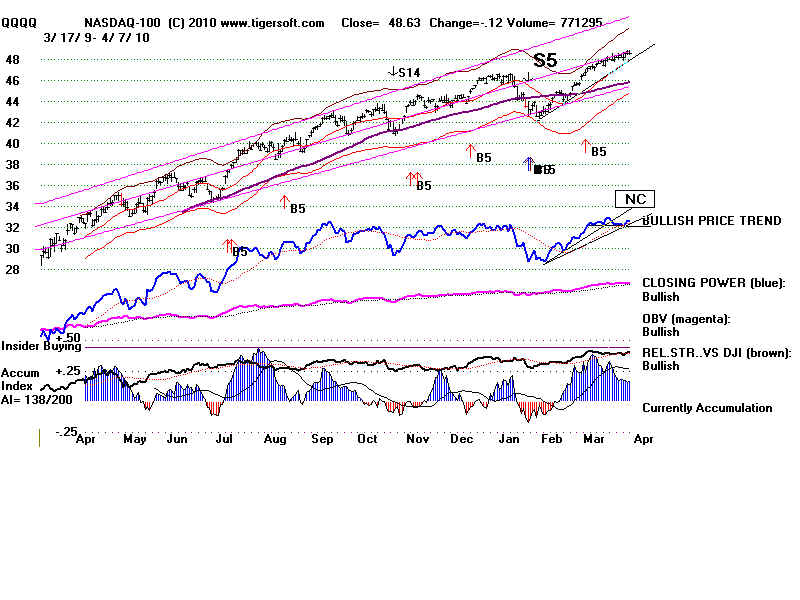
QQQQ - - Closing Power is making a new high.
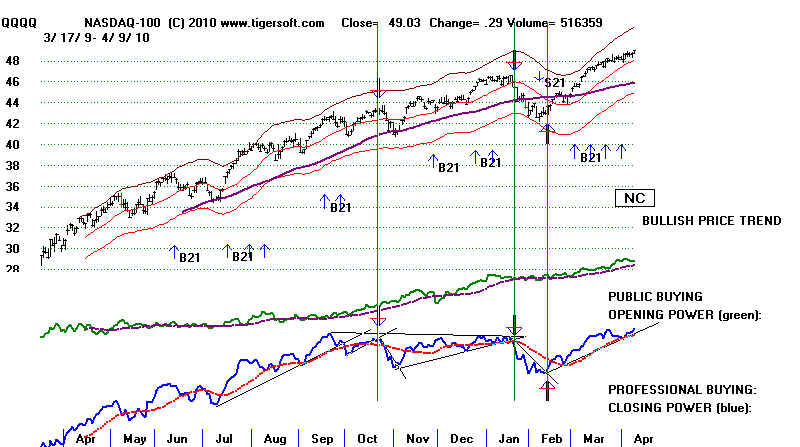
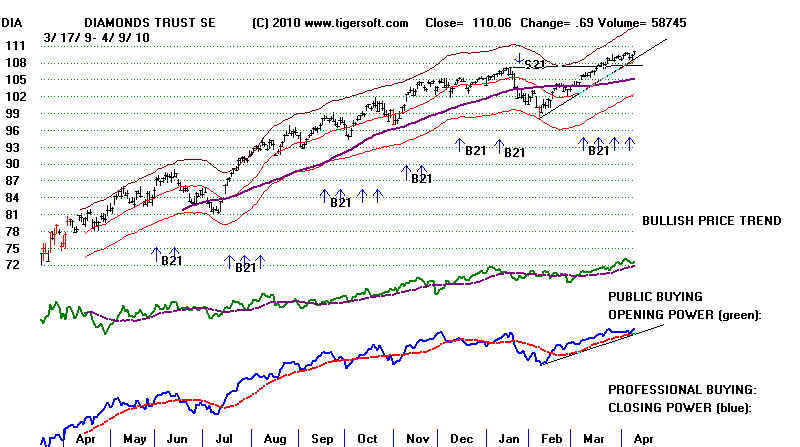
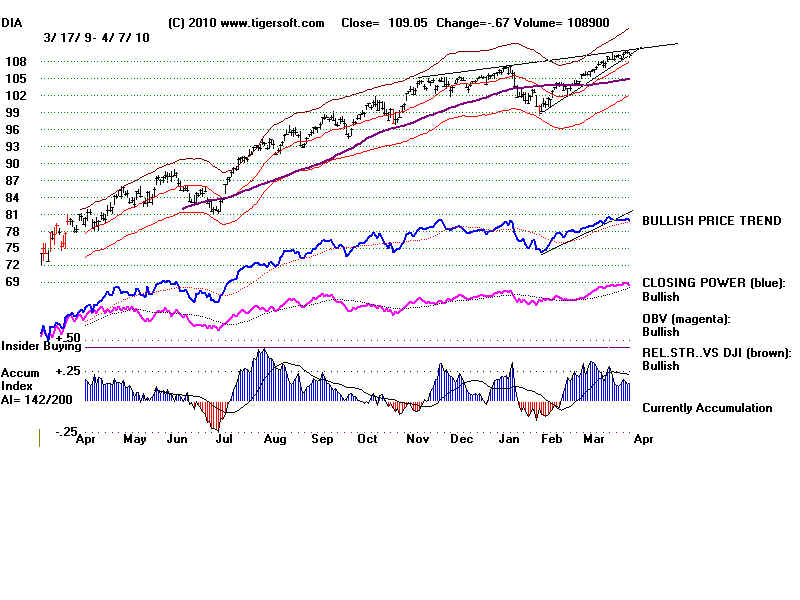
DIA - - Closing Power is making a new
high.
=================================================================================
HOTLINE -
4/8/2010 Peerless Remains on A Buy
The
Triumvirate-Power Elite (the
FED, Obama and Big Wall Street banks) have gambled big
that they can keep the stock market rising. Given
their financial orthodoxy, perspectives
and self interests, they really have no other alternative.
Their control seems unshaken
by the current blue-ribbon panel looking into the causes of
the 2007-2009 Crash and who is
to individually blame. The "Power Elite"
(this is easier to spell!) want to demonstrate that
they are very much in control. One way to do
this was to keep Goldman Sachs rallying.
Another is to turn up the market and move it past the
psychological resistance of 11000.
See - http://www.tigersoftware.com/TigerBlogs/April-9-2010/Index.html
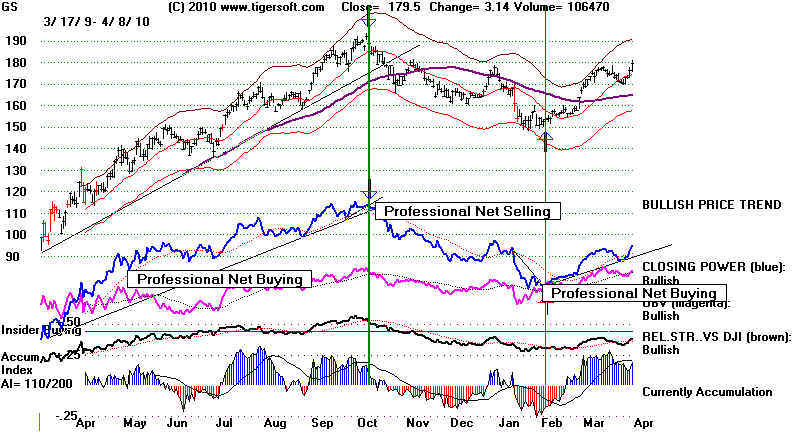
Below are the charts of Goldman,
DIA and QQQQ, No Closing Power sells seem
possible tomorrow, in that it would take a very weak close
after a very strong opening to
break the Closing Power uptrends. 11000 is a good
target to bring in more trading volume.
That is not lost on Wall Street.
.
INDIVIDUAL STOCKS
Looking
at the Tiger data base NHCONF and running the bullish screen, it is clear
that insiders and professionals are
still pushing upwards high Accumulation stocks.
Use TigerSoft and view the charts of G, PHT, CHGY, MRT, HYT, RT, VCBI
=================================================================================
HOTLINE - 4/7/2010 Peerless
Remains on A Buy
We still have no new Peerless Sell.
The A/D Line uptrend is intact. Since the Closing Power
for the QQQQ did not confirm the recent
new highs,. we will consider any break in its
uptrendline to be a short-term sell.
Today, I can still find more stocks
that look like they will
rally than fall. But prudence
probably dictates taking some profits in stocks not showing
high or lengthy blue Accumulation.
After all, 11000 is a logical point for intense resistance.
Bearishly, volume keeps rising on
down-days, too. So, our Stocks' Hotline sold advised
selling a few lower AI/200 stocks.
I have argued that what makes this market so
unusual is the amount of MONEY the Fed is
pumping into it. It is as though all the
big players have been provided trillions in capital, as long
as they use the money to buy, not make cheaper
business, home or personal loans. I don't
think this strategy of the Financial-Politcal
Power Elite will change on its own until the
DJI is even higher. As long as the Dollar
does not collapse, the Fed will probably continue
to keep rates very low. A re-valuation
upwards of the Chinese currency might change
this. But for now, the Dollar's Tiger
chart has all "bullish" notations and its Closing
Power is in an uptrend.
Wall Street's failures and excesses were the
subject today of the "FInancial Crisis Inquiry
Commission" http://www.fcic.gov/hearings/ Its chairman
is Phil Angelides, former
California
State Treasurer interbiewed Greenspan and
Rubin. http://www.fcic.gov/reports/
Greenspan
says "I was wrong 30% of the time"?
Ex-Citi
exec says he warned Rubin on mortgage risk
Ex-Citi
executives face questions on mortgages
Such talk, I think, caused the decline
today.
But take heart, the market would
have crashed wide open, if this panel were really about
to do its job. The DJIA would have fallen
500 points is the panel was moving to recommend:
1) a separation of investing and commerecial banks functions into different
insttitutions'
2) the break-up of the too-big-to-fail banks,
3) the imposition of a stiff windfall tax on Wall Street's big bonus executives
in the bail-out firms,
4) a challenge to the Fed's secrecy in the matter of the trillions in bank bailouts and
5) clear refutation of those who would give the Fed even more powers vis-a-vis banks.
I think we can safely bet that there will
be no expose of the secret arrangement between
the Administration, the Fed and Wall
Street Banks, in providing these banks trillions from
taxpayers in return for worthless
toxic debt collateral. There is also very little chance that
anyone will challenge the Federal
Reserve, Greenspan, Bernanke or Bernanke for being
far too chummy with the very
bankers that caused the Crash. I think that I can guarantee
no one on this panel will attack their
central bankers' perspective as being unable to conceive
of economic growth that does not depend
first on Wall Street handouts and a Wall Street
bull market. Lastly, I would bet
that none will attack the central bankers' perspective that
conveniently forgets how dangerously
undemocratic the highly massive and monopolistic
Wall Street banks are as they push around
politicians of both parties with millions and
millions of dollars in what are politely
called "campaign contributions"
That's why Goldman Sachs rose today and
why such talk as was heard today will NOT much
dampen the spirit of the bulls.
The most
succinct exposition and summation on how Wall Street and the Federal Reserve
are
boosting stocks by risking a bigger bubble than in 2000 for stocks, 2004 for housing and
2008
for oil, is offered today by Dylan Ratigan.
DIA - ETF for DJIA
Closing Power
Uptrend - violated
Bullishly both Opening & CLosing Power are
rising (above their rising 21-dma).
TIGER INDEX OF SP-500 and SPY
Both Opening and Closing
Powers are rising.
This suggests we are in a vertical ascent phase.
Closing Power-Percent - violated its
uptrendline.
The CP
and CPP have not confirmed the recent highs.
87% of the SP-500 stocks are above their 65-dma.
TIGER QQQQ and INDEX OF
NASDAQ-100
QQQQ - All Bullish
Closing Power Percent is not confirming the advance, could easily break its
uptrend-line.
and could be forming a bearish Closing Power head and
shoulders..
86% of the NASDAQ-100 stocks are above their 65-dma.
That uptrend has been slightly violated.
==================================================================================
HOTLINE -
4/6/2010 Peerless Remains Bullish....
11000 on the DJI is the logical place for sellers to concentrate
their sell orders,
if they want to take
profits or get out even. But, we have no signs that there will
be more than a very
shallpw decline, if there is a retreat. In two days, we will have
seen a 13 month rally
from the March 9th, 2009 bottom. Bull markets that last 12 moonths
this long are much more
likely (2:1) to last at least 3 additonal months than suffer
an 8% or more decline.
Breadth remains very bullish. Both Opening and Closing
Power are rising for the
biggest ETFs. Peerless remains on a Buy. There is no indication
that interest rates will be
raised. Interest sensitive stocks are among the best performing
and highest accumulation
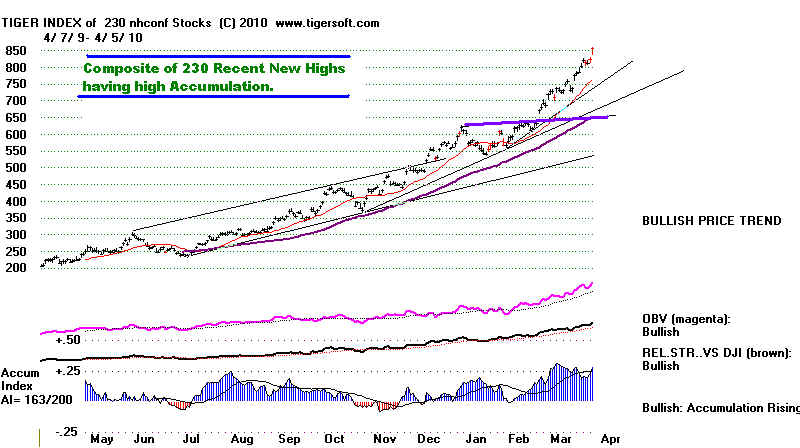
groups. Meanwhile, other high accumulation stocks that make new
highs are spectacularly
strong and there are a lot of such stocks. Below is a composite of
more than 200 of them.
"Enjoy the ride". I have to say.
Index of High Accumulation New Highs
=============================================================================
HOTLINE -
4/5/2010 Peerless Remains on A Buy.
Speculative fervor continues to build.
We have no reason to sell. This is one of those times when we want to let our
profits run. Peerless relies
on automatic signals, derived mostly from
breadth indicators and Tiger's
Accumulation Index. The public is pushing up openings
now. Closings are neutral,
not bearish. Both Openings and Closing Powers are
rising. This shows the market is in
verticle ascent. I would, for now disregard other
normally useful tools, like the
MACD, CCI and RSI, whose non-confirmations of
new highs are sometimes very
premature in vertical ascent markets.
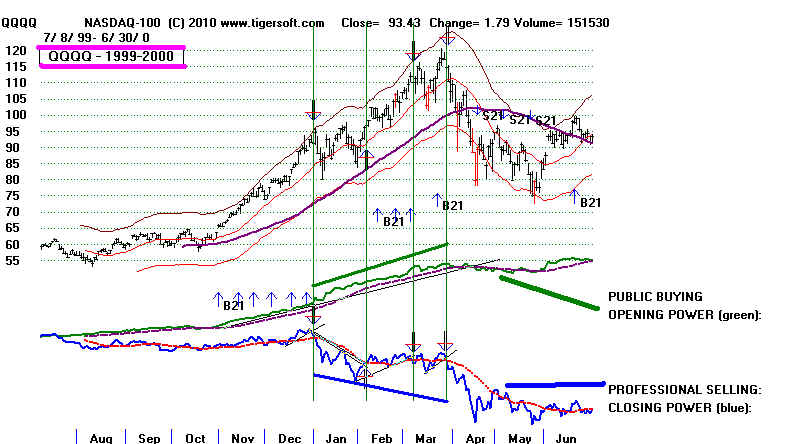
The biggest
mistake the Peerless automatic signals have made since 1981 was showing
premature Sell S8 and S12 Sell signals in
first quarter of 1999. In practice, this was easily
overriden by our Hotline because I
allowed for the special strength of the market at all-time
highs and we could see all the stocks
that showed powerful Accumulation on new highs.
I mention this for three reasons.
First, always be careful about
standing in front of a herd of bulls. Expect execess.
The QQQQ's Closing Power was wrong
for 3 months in early 2000. It was a lot easier
to ride some speculative
"bubble" stocks than resist the trend by going short, or
even sitting ont he sidelines.
Second, always be open to new
ideas. We have unprecedented collusion now between
an inexperienced,
semi-figurehead President, the Federal Reserve and the biggest Wall Street
banks. If they want the
market to go up, accept that it probably will.
Why the stock market keeps going up and up?
The Secret Deal Obama, The Fed and Wall Street Seem To Have
Reached.
I still remember reading in high school Emerson's essay "Self Reliance how a
"foolish consistency
is the hobgoblin of little
minds". (A radical idea for a public high school?). So, regarding the
need to keep an open mind, and not
be a victim of a foolish consistency, I keep checking
the worst of the Peerless signals.
It amounted to standing in front of a herd of bulls.
Today, I discovered something new
about this period from February to May 1999. This
period every four years, in the
year before a Presidential Election year have always been
either neutral or strong since
1927. As it turns out, cancelling Sell S9s in 1935, 1959, 1967
and 1999 during these three months
impoves our model quite a bit. Recalling Emerson,
a new Peerless will do this.
A new "SuperImpose DJIA saved signals" file will be provide
these results. The results
gotten trading the DJIA, SPY and QQQQ with this revised
Peerless since 1994 will be posted
in a few days. The on-line-book will show you these
details later this week.
Thirdly, TigerSoft's
Accumulation Index has never worked better. I say this out of pride
but also because there's a
message in this that we should accept or, at least carefully
consider. I take
it to be very bullish today that we see a large number of high Accumulation
breakouts. The 11000
barrier on the DJIA may not hold the general market back. There
were more than 25 new highs
tonight with recent or current Accumulation bulges over
+.45. See ALL the graphs of these high
Accumulation breakouts here.
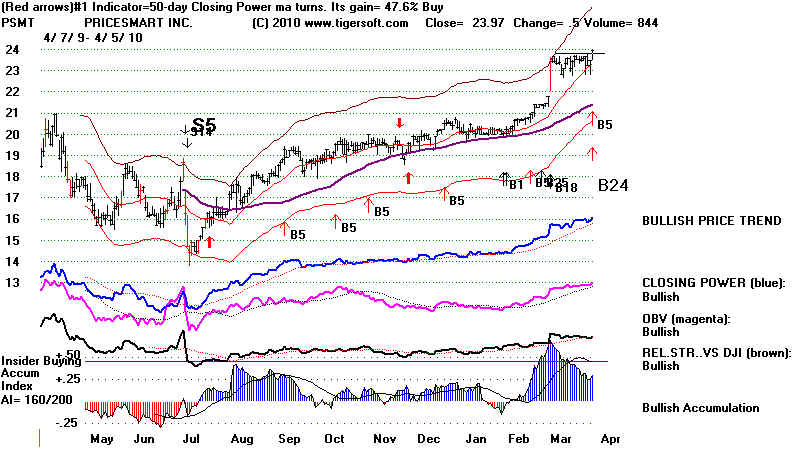
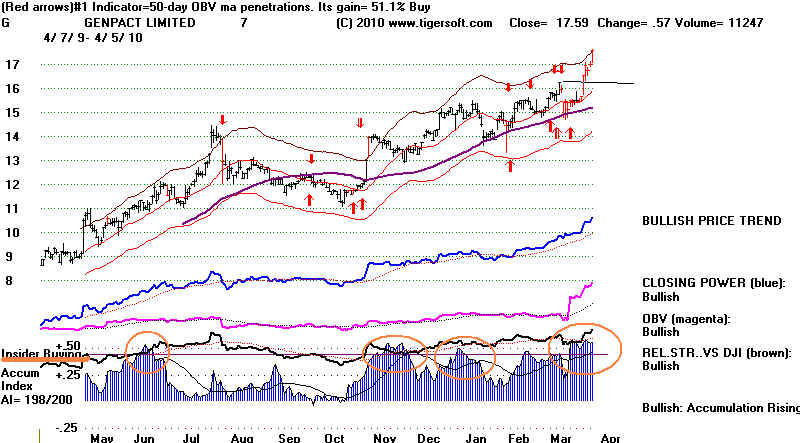
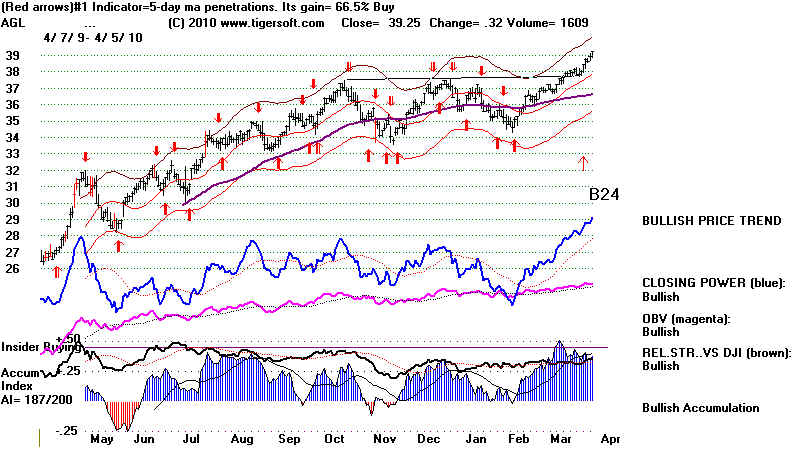
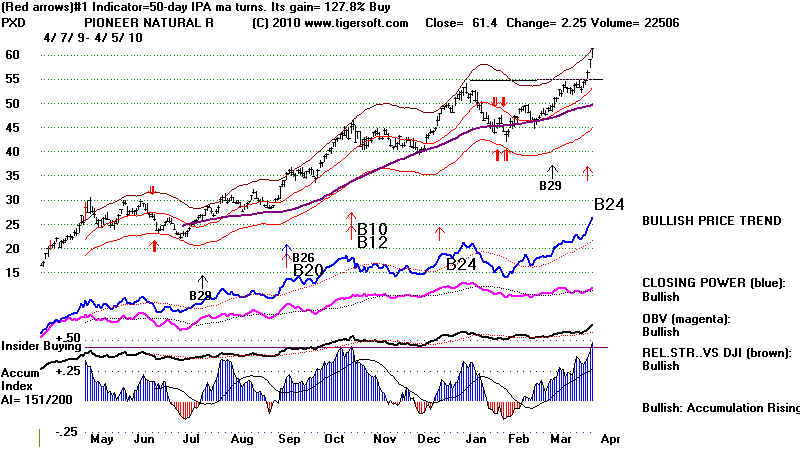
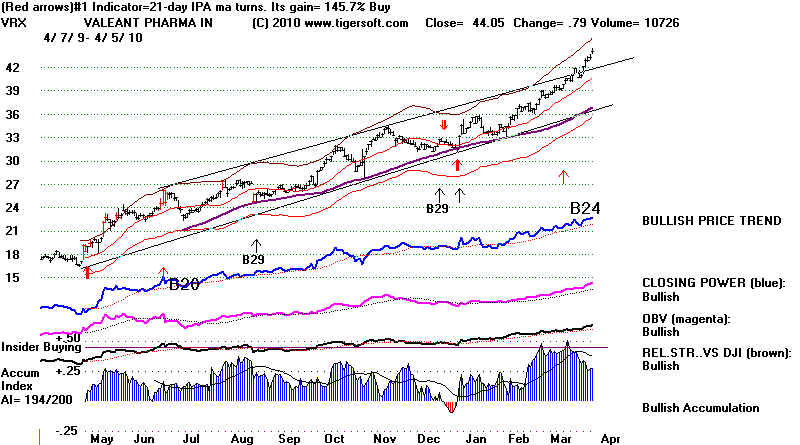
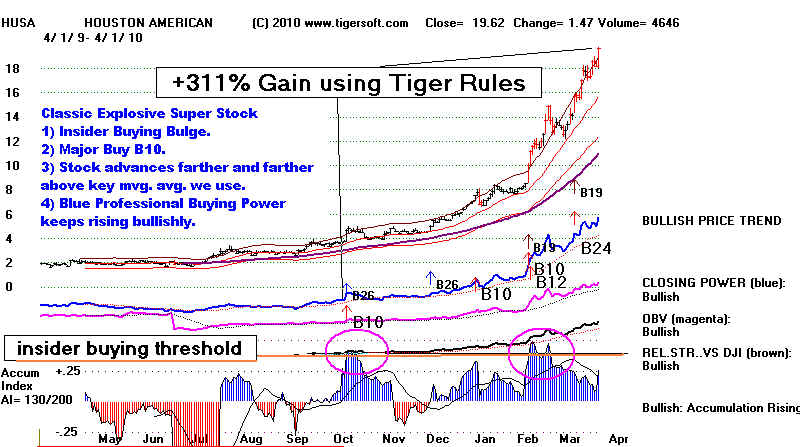
In recognition of the proven
power of Accumulation Index bulges past +.45, to signify
key insider buying, the
revised Peerless will henceforth for stocks show a horizontal like
at the +.45 level.
You can see this "insider trading threshold: in the sample breakouts
shown just below.
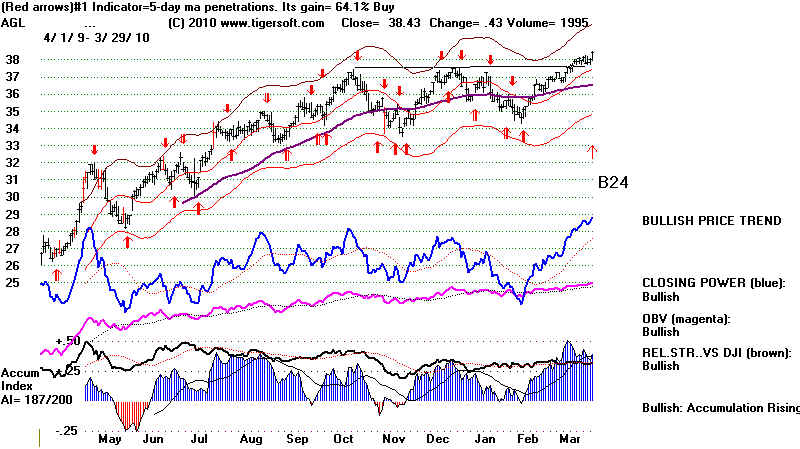
Charts of high Accumulation new highs: PSMT, G, AGL, PXD and VRX
 |
===============================================================================================
HOTLINE - 4/1/2010 Another Good
Day for the Rally. Notice the Rotation
The Nasdaq and
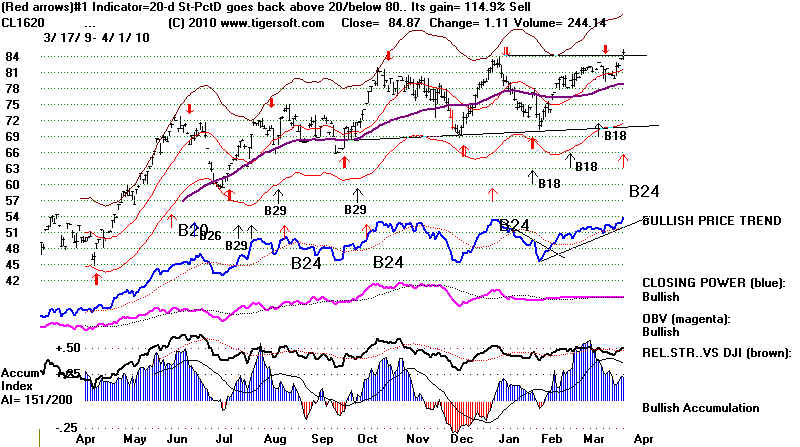
low-priced stocks took a day off, as traders noted the breakout by Crude Oil (below)
and bought the best of the oil stocks. Breakouts like this annul red Sell signals
based on
Stochastics and appreciate the value of trading mainly in
the direction of Peerless. Normally,
we recommend breakouts to be in the strongest stocks.
But at some point these are too
far extended and we should consider buying stocks showing
Buys based on their
crossing back above the 65-day ma with positive
Accumulation. (Gold is moved above
at level, too, today, but shows negative Accumulation.
Not surprisingly, the Dollar fell,
though its CLosing Power is still above its uptrend-line
and so may still recover. XOM
and CVX look like good long trades, as mentioned yesterday.
That will help boost the
DJIA. I looked at lots of stocks tonight and
except for PFE in the DJI, I do not see any
ahowing significant danger of a pullback, i.e. head and
shoulders patterns, negative
non-confirmations of new highs or breaks of their 65-dma.
CRUDE OIL NEW HIGH - TODAY.
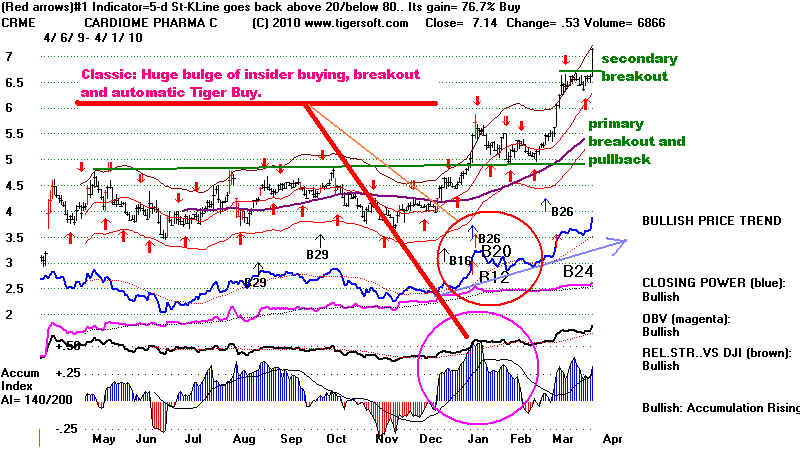
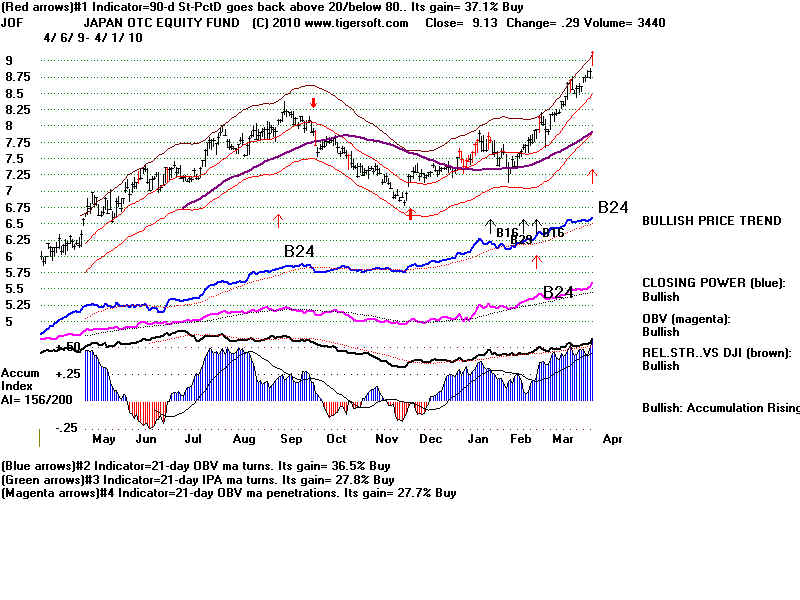
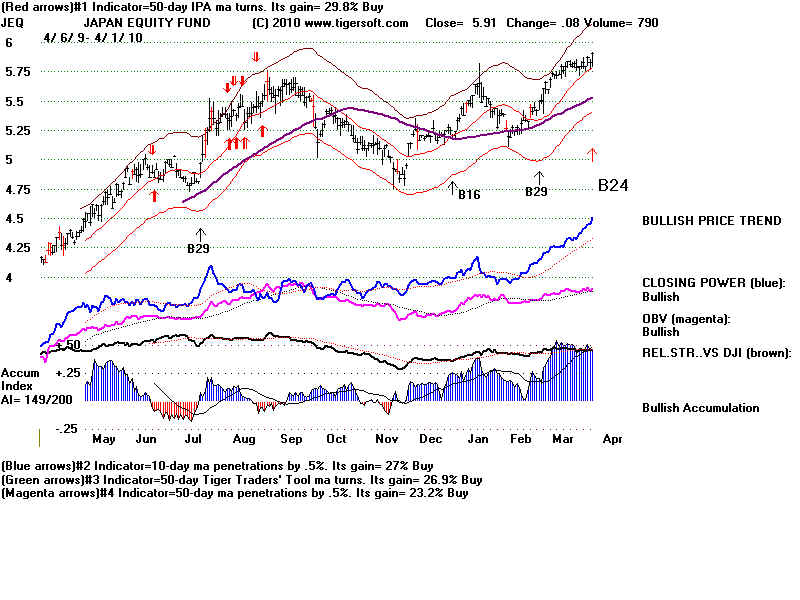
Of
course, in this market traders are still bidding up a number of the high accumulation
breakouts: HUSA, CRME (shown below) and JEF, JOF, VRX and ZQX which met our
"explosive super stocks" breakout
requirements. The new downloads NHCONF and ACCUMVER
should be a great source for these stocks.
Screen for Bullish, BOTHUP, B12, B10 and B20
using ANALYSIS from PEERCOMM.
JOF, JEQ and
HUSA
===========================================================================================
3/31/2010
Peerless Remains on A Buy. Speculative Low Priced Stocks Remain Hot
The Opening and
Closing Powers are both rising for the QQQQ, SPY, DIA and IWM.
Odds favor a Pull-Back to just below the DJIA's 21-day ma, a
decline of about 2% down from here
and then a recovery to new highs. The specualtive strength
in the market barely cooled down
today on today's mild sell-off. A number of stocks made
confirmed new highs, showing an
IP21 greater than +.25. Here are some of the best of their charts.
What keeps me bullish are a powerful technicals and a powerful
political trimverate:
1) We have no new Peerless Sell in this the 12th month of the
advance without an 8% decline;
2) Breadth remains very good, despite the last two days and the
market is now attracting the public,
judging from the rising A/D Line and surge of interest in thin
low-priced stocks.
3) The market is being pushed up by an unbeatable (in the
short-run) political-financial trimverate,
the President = Treasury Secretary, the Federal Reserve Chairman
and monopoly Wall Street
bankers, like Goldman Sachs.

This triumverate wants the public in the market for different
reasons. They believe business
confidence will be eventually be restored if they can get the
stock market back above
12000, even 14000. They believe that stock market is less a
reflection of corporate earning
expectations than an automatic predictor and precursor/promoter
of furure corporate earnings.
They believe rising stock prices will create new business
ventures and jobs. But where? In the USA?
They neglect that another crash after a bigger bubble is burst
will wipe out many more of the
surviving middle class who are now being enticed into this
market's specualtive phase.
How much will this induced and artificial investment boom address
the profound need for the
rebuilding of the American infrastructure and create and restrore
American manufacturing jobs?
This and the even greater conccentration of wealth and power that
will result GUARANTEES
eventually another financial collapse. The powers that be seem to
have learned nothing from the
last collapse. Want proof? Watch what happens to
financial reform in Congress!
Perhaps, because they know that a new Crash is a real
possibility, they will do all in their
power to keep the market rallying. I have written for a
year that Obama uses rhetoric to
satisfy his progressive base, all the while giving more and more
to boost to Wall Street and
big corporations. His concessions today to the "drill,
baby, drill crowd" are more proof of
how determined, pehaps desperately so, he is to keep this rally
allive. Oil stocks make up a big
part of the DJIA and SP-500: CVX and XOM.
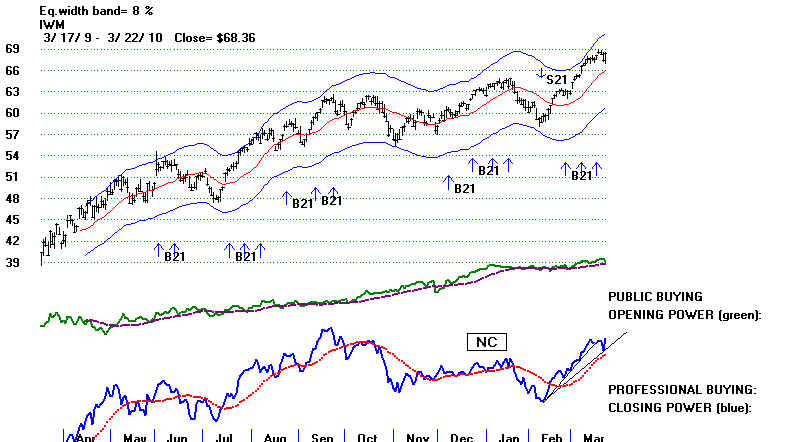
Back to Technicals
The IWM shows a red Sell from a 14-day Stochastic-K Line.
This system (shown by the red signals)
has gained 43.4% for the last year. That should earn it
some respect. IWM/s Closing Power has
broken its uptrend. Its OBV, Relative Strength and
Accumulation Index have lost their "bullish"
status.
What If The Market Weakens Next Much More?
In that case, we will see a big increase in the number of stocks
that form head and shoulders patterns,
that fall below key support levels, break their 65-day ma with
negative IP21 (current Accumulation
Index readings) and then have their 65-day ma turn down.
New Bearish Tiger Data Downloads
See When Selling A High Accumulation "Bubble" Stock on
Weakness Is A Good Strategy.
This offers
TigerSoft's rules to to sell swiftly falling "super" stocks. Beyond this,
I will start to place
on our Tiger Data Page screenings of all stocks for bearish
conditions each night. A good place
to start with be to create directories of stocks to
download each night with all stocks closing
below the 65-day ma with a negative Accumulation Index AND
also for a separate Tiger directory
all stocks below a newly falling-65 say ma, as long as
their Accumulation Index is below +.25.
================================================================================
3/30/2010 Peerless Remains on A Buy. Speculative Low Priced
Stocks Remain Hot
The internal strength indicators are still too strong to predict
anything more than
a decline to the 21-day ma. The DJI is eating up the supply
of stock at 11000. Both
the Opening and Closing Powers remain in uptrends.
The upward power in the stocks showing the highest Accumulation
and highest
momentum is nothing short of amazing now. Momentum like
this draws the
public into the market. The result is that Opening Power is
now stronger
than CLosing Power. The period 1999-2000 shows that this
condition can last
for 3 months. A recognizeable top pattern is also likely to
occur, as well as
a Peerless Sell, at the top.
So, instead of telling the market to go
down, because we do not like Fed rigged
markets and we think the economy is still in deep trouble, I
would suggest working
with the trends of the stongest high AI/200 stocks and
trade their Closing Power uptrends
on the long side. The next decline to the 21-day ma will
likely be a good trading
Buy, just as it is with all powerfully uptrending stocks showing
high Accumulation.
The NASDAQ now shows a very high level of positive Accumulation.
Its AI/200
level is 188. Hesitation and more new new highs is what
this strength has historically
shown until there is a Peerless sell.
ISSI -
Typical Low-Priced Rocket-Stock - ISSI was 40 back in 2000.
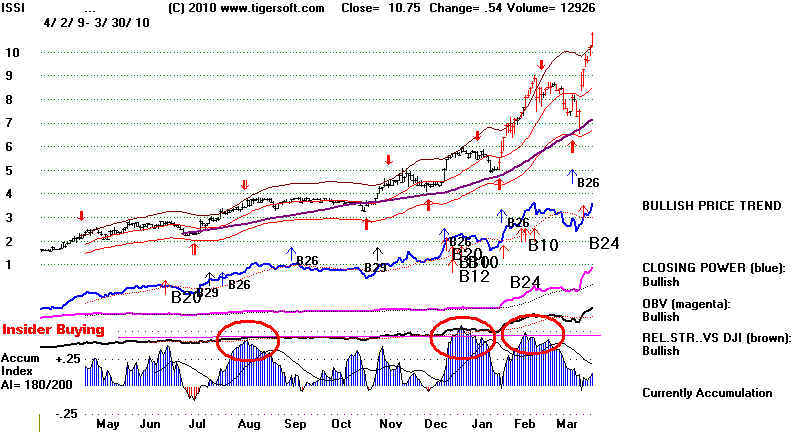
Tahiti Anyone?
Tomorrow will end the first
quarter. Followers of our Tahiti
system, as orginally
set forth, simply buy the highest AI/200 (the count of the number
of days with positive
Accumulation for the last 200 days) stock at the end of the
quarter and hold 21-months.
This system which was meant to be used with the DJIA, but could
and should be used
with other groups of stocks, like the SP-500 (a much larger
universe), the NASDAQ-100,
all medical and all oil stocks. See their charts here. HPQ now shows
the highest AI/200
value in the DJI and just made 5 year high, too.
HPQ
53.26 highest AI/200 stock in DJIA
DTE
45.38 highest AI/200 stock in SP-500
CHKP
34.8 highest AI/200 stock in NASDAQ-100
ARTC
29.84 highest AI/200 healthcare stock
MWE
31.61 highest AI/200 oil stock
=================================================================================
3/29/2010 Hotline Buy B17/ B10 - Give The DJI More
Chance to Reach 11000.
All
the reasons that I posted last week for still being bullish still pertain. It is
true that
the
Closing Power uptrends could be significantly violated on a reversal down
from
a stong opening tomorrow. Given the upwards momentum, I doubt if that would
bring
a DJI decline of much more than 2.2%, slightly below the rising 21-day ma.
More
and more signs show a pattern of higher openings. That suggests overseas and
public buying.
STOCKS
I am
starting to post the data for new yearly highs with an IP21 (current AI) reading
above
.25 at some point in the last month. Below are some of the better ones
tonight. Apply the principles of an augmented B24 to these and you should do well.
Either look at the "bullish", "both up" or "unusual volume"
flags with these stocks
to
find very good candidates to sue the rules in Explosive Super Stocks.
WHEN TO SELL HOT STOCKS -
When Selling A High Accumulation "Bubble" Stock on Weakness Is A
Good Strategy.
Back testing shows that these high Accumulation stocks making new highs
are
often superb BUYS for an aggressive investor who is willing also to:
1) Sell on a Peerless Sell,
2) if the stock breaks below its 65-day ma with negative AI readings or
3) when the 65-dma then turns down.
I am asked why sell such a stock in a strong general market. "The rising
market's tide
will
lift all boats". Sadly, this is not true. Insider can make mistakes.
And so will we
if we
do not have a "Plan B". The reason is that we just have to have some
insurance
against a bigger decline. Moreover, we can usually find a better stock to
replace
the
one we are selling. This new stock is apt to do better. Alternatively,
we can also promise
ourselves when we sell this stock that we will buy it right back if it gets back above
the
rising 65-dma with good internals. If you are still resistant to taking a loss
quickly,
wait
for the stock's 65-dma to turn down to sell. That will save some situations.
But
this
can also increase the loss on a stock that cannot rally. Here is a link showing
some
high Accumulation stocks that last year did decline from their 65-day ma
and
did not turn back up from it even though the general market has been strong.
Please read the unpublished Blog I did tonight.
When Selling A High
Accumulation "Bubble" Stock on Weakness Is A Good Strategy.
====================================================================================
HOTLINE - 3/25/2010
Buy B17/ B10 - Give The Market
More Chance to Advance.
The DJI has now risen 12.5 months without an 8% correction. Since 1929, there
were three other big advances that
lasted nearly exactly as long as the present advance
and then started a decline of more
than 8%. But in 11 cases the DJI continued to move
higher. Based on the behavior of
longduration bull markets, I would have to say
these advances take on a life of
their own. They are self-perpetuating. We are nearing that
stage. Based on the history of
these long-duration advances, if the DJI were to advance
for another month, the odds would
be 8:3 that it can rally for, at least, 3 months after that.
Length of Long Rallies in Time
12-13 months
1936 (12.5). 1961 (12.5), 2006 (12.5)
13-13.5 month
1973 (13.5)
14-14.5 months 1943
(14.5)
15-15.5 months
1994 (15.5)
16-19.5 months
1946 (17.5), 1959 (19.5) 1984 (17). 1992 (17)
20-24 months
1955 (24). 1989 (21.5)
over 24 months
1965 (30.5). 1997 (30)
The only bearish condition we can identify presently are the break in the steep Closing
Power uptrends of the SPY, QQQQ and
DIA and the fact that the DJI is back to the point of
breakdown, 10850-11000 from
September 2008. That may bring a retreat to the rising
21-day ma. But the momentum
is clearly a factor. Until we get one or more of the following
conditions, a major Peerless Sell
signal, it is not consistent with market history to call a top here.
Even then, a decline of about 10%
would be typical in these cases. The bearish conditions
to for are:
1) a completed head and shoulders top,
2) a false breakout from above horizontal resistance,
3) a well-tested price-uptrend break or the V-Indicator is negative with the DJI at least
2%
over the 21-day ma.
Typcially there are much bigger non-confirmations of a new price high by the A/D line,
the P-Indicator and Accumulation
Index than we are presently seeing. The P-Indicator
and the Accumulation Index
typically drop to levels less than 60% of their previous highs
when making new unconfirmed highs.
STOCKS
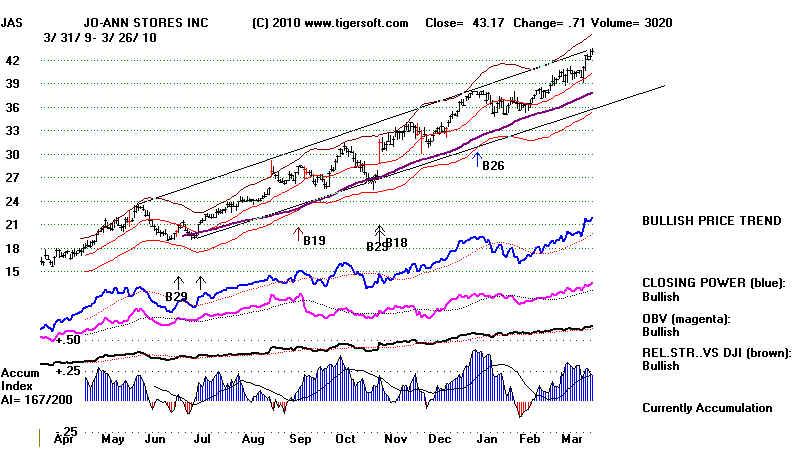
1. Retail Apparrel
Strength.
For some reason, new health insurance rules or maybe fashion changes, a number
of retail clothing stores are
very much in favor and making new highs. The stronger
Dollar is helping these companies
buy more cheaply overseas. Higher end sales are
clearly picking up as the sotck
market rises.
The stocks I have put in this list are: AEO, ANN, BWS, BEBE, CHS, CWTR, FDO,
FINL,GIII, GES, GPS. JAS, JWN, LTD,
SHLD, SHOO, TGT, TLB, URBN, WEL, WTSLA and ZQK.
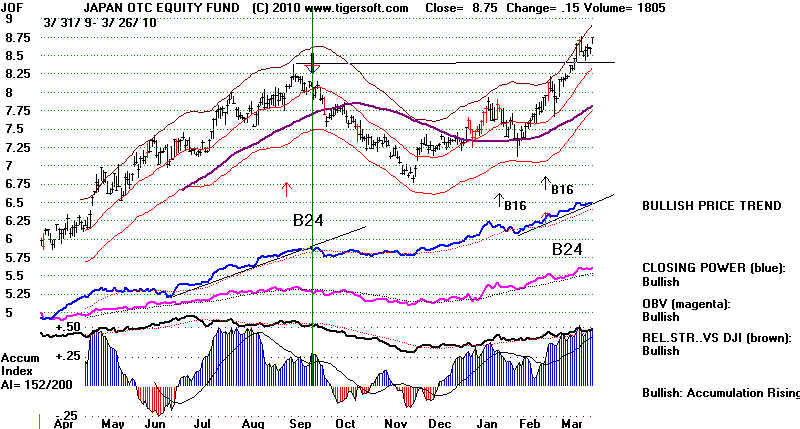
2. JOF (Japanese OTC
stocks look good)
3. Peerless has worked
very well with Indian ETFs since 1998, year after year. The world
markets seem totally
integrated now. How that will help American workers looking for
industrial jobs is not clear.
1.
Women's Apparel Stores - New Highs
 |
2. Japanese OTC Stocks Strong
While the Japanese Yen has been flat against the Dollar for six months, smaller
Japanese stocks may be starting
their own leg up. When one recalls the size of
the 1980s Japanese bull market,
JOF becomes an attractive specualtion. Their
strength reflects the same investing
emphasis on secondary stocks that exists
in the US.
 |
=========================================================================
3/25/2010
Buy B17/ B10 - Give The Market
More Chance to Advance.
There was a late market sell-off today. Only the DJI held a small gain.
The DJIA could not keep advancing into the heavy overhead supply
of stock at 10800-11000
from when Paulson appeared that Sunday night in September 2008
and gave Congress
an ultimatum to give Wall Street $800 billion or else the market
and the US economy would
drop into oblivion. A lot of people wish they had sold that
Monday morning. This 10800-11000
is clearly important resistance. But just reaching it
does not mean the market will go
into a decline. In fact, it is normal for a market moving
higher into overhead resistance
to eat up chucks of that overhead supply of stock, rest and again
move higher. We need to
see more than a failure to hold the highs to become bearish.
True - there were 459 more down than up, however. This is the second Thursday in two
weeks when breadth fell behind the DJIA. Given the momentum of
the 12 1/2 month bull market
that has not seen even a full 8% decline, we have to remain
bullish. Note, we have
no Peerless Sell signal. If we look at all the year-long
advances since 1928, there are only
two or three cases when the DJI dropped more than 8% without a
Peerless Sell. Usually,
tops occur only after the A/D Line clearly stops confirming DJI
highs.
True also - the P-Indicator is not confirming the recent highs by making a new high.
This often brings a small retreat, back to the 21-day ma, but
usually not more. It usually
takes a bigger non-confirmation to bring decline. I will
charts of all the cases of year-long
rallies since 1028 at this location, later tomorrow or this
weekend.
http://www.tigersoftware.com/TigerBlogs/March-25-2010/index.html
That a retreat is becoming more likely can be judged from the failure of the CLosing Power
Percent, which factors in volume, to make new highs on this
year's rally compared to last year.
Clear breaks in the uptrend are usually bearish. But
both the Opening and CLosing
Powers are above their rising 21-day ma. This
"BOTH-UP" condition is associated
with vertical ascents. That should cause us to give the
market more time to advance.
Other bullish factors: the B10 shows that support at 10800 should hold up in the
short-run. Since 1966, the DJI has risen 72.5 of the time
from the close on March 25th to
21 trading days later. The Public is not as Bullish as might be
expected at a top. Usually
we spot a top by a long series of higher openings. Lastly,
we can safely bet the FED is doing
everything it can to hold the market up until April 15th.
====================================================================================
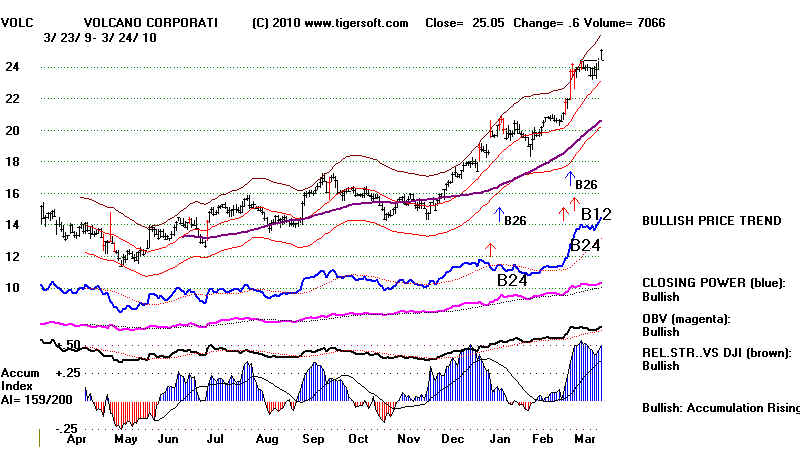
3/24/2010 Buy B17/ B10 - A/D Lines and CLosing Powers Are still rising.
High Accumulation
Stocks still are behaving well. A San Diego medical equipment - VOLC -
company just
broke out to a new all-time high today.
Yesterday's Buy B10 is less important as a signal in itself, than it is to underscore that
the market is
still very strong. The breakout the Buy B10 reports is not from a pattern
showing three
tests of a resistance line relatively equally spaced over the last 3 months.
That is what we
want ideally to see in the price pattern for a Buy B10. The internals do
meet the
requirements for a Buy B10. The internals do not show the exceptionally
high IP21 (above
+.30) and OPct (above +.50) readings that are associated with the most
powerful B10s.
Another negative: Buy B10s in a market already well-advanced as this is
are much more apt
to gain a modest 3% to 5% more than the typical 10% seen for all Buy B10's.
Another factor to
lower our expectations is that March B10s - like our cases
presently - only
bring modest 4.3% gains, unlike Buy B10s in January and February.
whose 5 cases
average+20% gains. But there is still plenty of upwards momentum,
very fine breadth
and one other element. Buy B10s in the second year of a Presidential
cycle are quite
bullish. There have been 8 such automatic Buy B10s since 1928. Their
gains average
15.9%. See the new research
I have posted
about Buy B10s -
Buy B10 - historical research http://www.tigersoft.com/PeerInst/-Buy-B10.htm
Still No Problem Finding High Accum Stocks Making New Highs
VOLC - All time high breakout today and
B12 breakout from short-term flat top.
Yahoo reports corporate insiders are selling mostly. Our indictators suggest their
associates
are buying these shares. This is often a prelude to giving more sponsorship and
publicity to the
stock. Volcano Corporation 3661 Valley Centre Drive
Suite 200 San Diego,
CA 92130
http://www.volcanotherapeutics.com
Volcano Corporation designs, develops, manufactures, and
commercializes a suite of intravascular ultrasound (IVUS) and functional measurement (FM)
products
used in the diagnosis and treatment of vascular and structural heart disease. Its IVUS
products consist
of consoles...digital and rotational IVUS catheters, and imaging tools, including virtual
histology, IVUS tissue
characterization, and ChromaFlo stent apposition analysis; and FM offerings include
consoles and single-use
pressure and flow guide wires used to measure the pressure and flow characteristics of
blood enabling
physicians to gauge the plaque?s physiological impact on blood flow and pressure. The
company?s products
under development comprise IVUS guided therapy products, such as IVUS guided stents and
IVUS
guided coronary and peripheral balloons; forward looking IVUS for minimally invasive
diagnostic and
therapeutic applications in the coronary and peripheral vasculature; and optical coherence
tomography (OCT)
technology that allows imaging of detailed structures in the vasculature. Its ongoing
clinical studies include the
bifurcation lesion analysis and stenting, assessment of dual anti-platelet therapy with
drug-eluting stents,
and Volcano OCT image lesion analysis using intravascular optical coherence tomography. In
addition,
the company develops and manufactures micro-optical spectrometers and optical channel
monitors to
telecommunication companies. Volcano Corporation serves physicians and technicians who
perform PCI
procedures in hospitals, and other personnel who make purchasing decisions on behalf of
hospitals
through its direct sales force and distributors, as well as through supply and
distribution agreements with third
parties. As of December 31, 2009, it had an installed base of approximately 5,000 consoles
worldwide
Also:
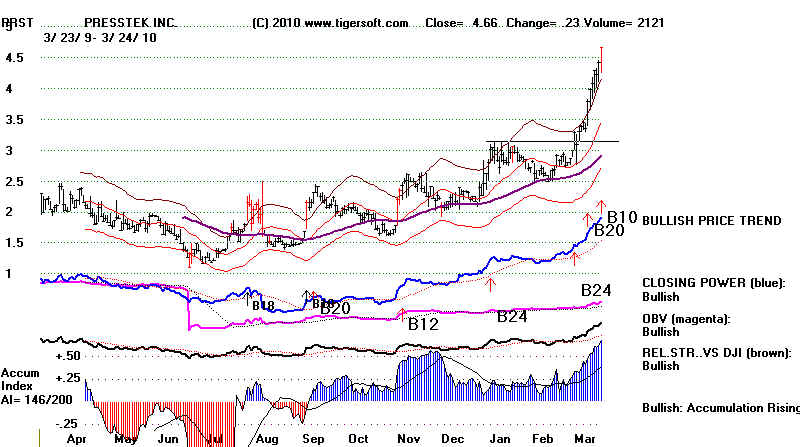
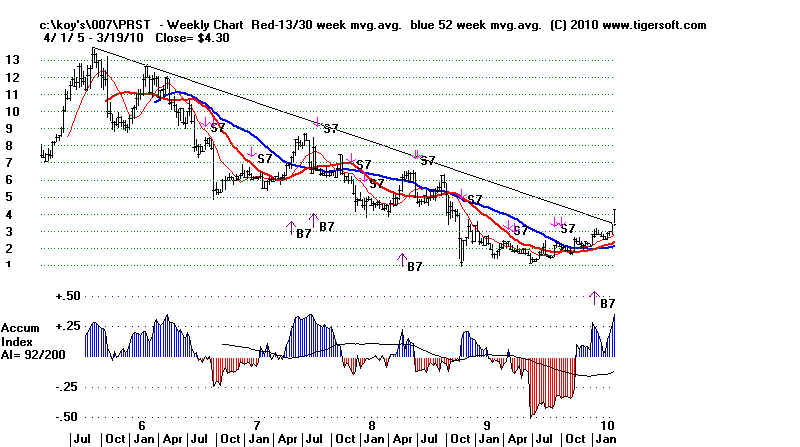
PRST - 4.66 was a $98 stock in 1997
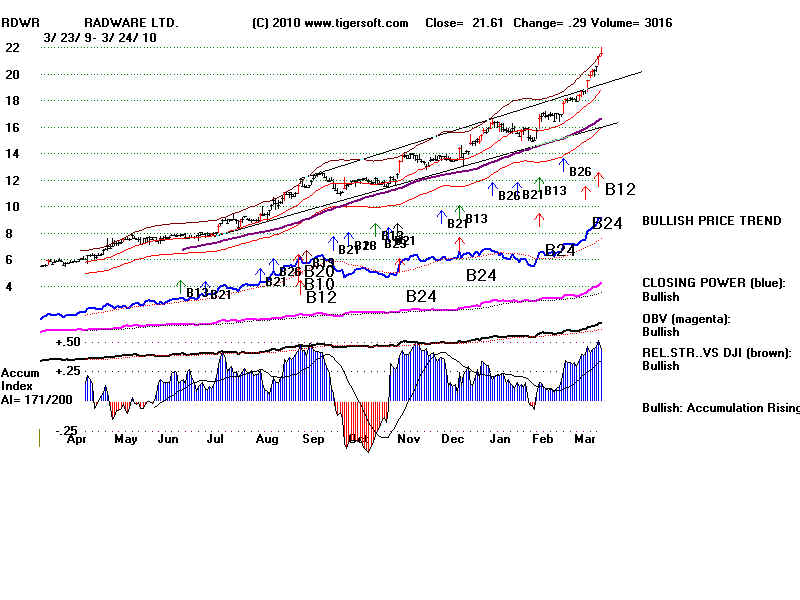
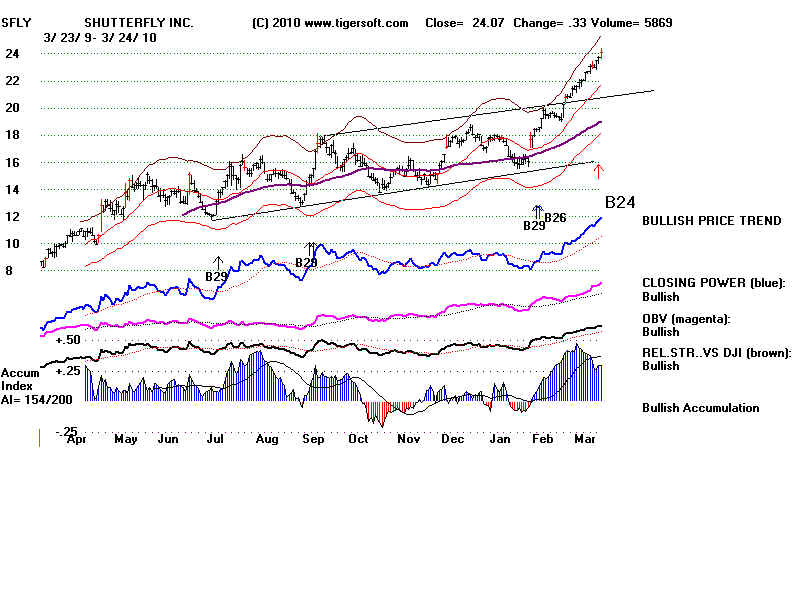
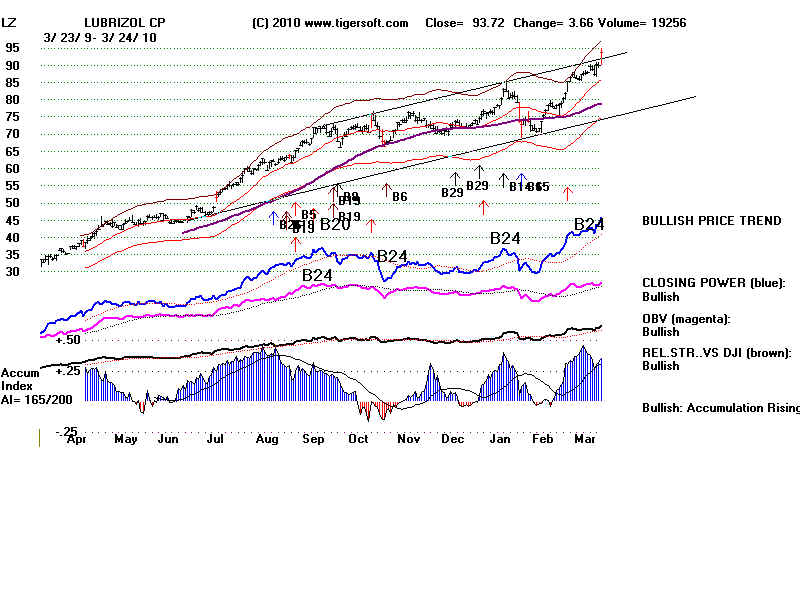
SFLY, RDWR and LZ show that stocks that have exceeded their parallel resistance line
are moving higher. Speculators and Insiders are still optimistically buying
very strong
stocks.
===================================================================================
HOTLINE -
3/23/2010 Buy
B17.
The DJI's upturn
accelerated. Peerless remains on a Buy, The upwards velocity
owed technically to the fact that
both the Opening and CLosing Powers are rising.
This means the market opens higher
and closes still higher. I take this to mean that
both the Public and Professionals
are buying. That the Closing Powers made new highs
today means we should work with
newer, less steep uptrends for them.
Peerless reinforced the bulls with an automatic BUY
B10. The main significance
of this in our case is that
it posits 10750-10800 as new support. Normally, we
should see the flat and
well-tested resistance that the DJI has gone through.
A flat, thrice or more tested
resistance line is not so clear here. The result may
be that the usual immediate
vertical ascent that follows a Buy B10 may not occur
here. In addition,
11,000 is a natural round-number resistance level.
Buy B10 - historical research http://www.tigersoft.com/PeerInst/-Buy-B10.htm
The rally past 10800 will
drive the bears "nuts". The A/D Line has confirmed the
move. That is very
important. Most tops occur only after the A/D Line fails to confirm
a new DJI high. So, we should
see the DJI moving higher and chewing up the
overhead supply of stock with
each rally.
Meanwhile the number of new
highs rose sharply today. Speculative, tech,
restaurant, military and
interest-rate stocks are all doing well. Concentrating
on the highest accumulation
stocks - horizontally and vertically - should
continue to pay off quite
well.
=========== RUSSELL-2000 ===================
IWM: Both Opening and CLosing
Power are rising (above their 21(dma) The Closing Power
uptrend in still rising.
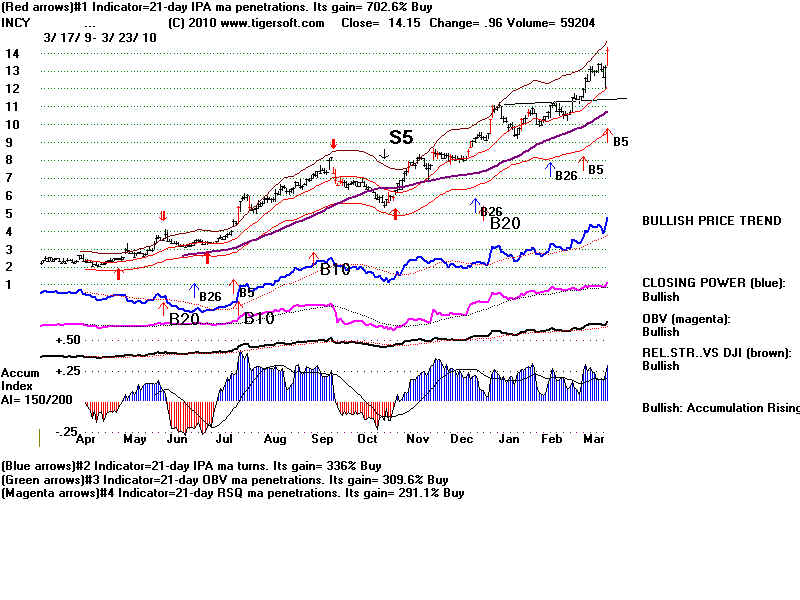
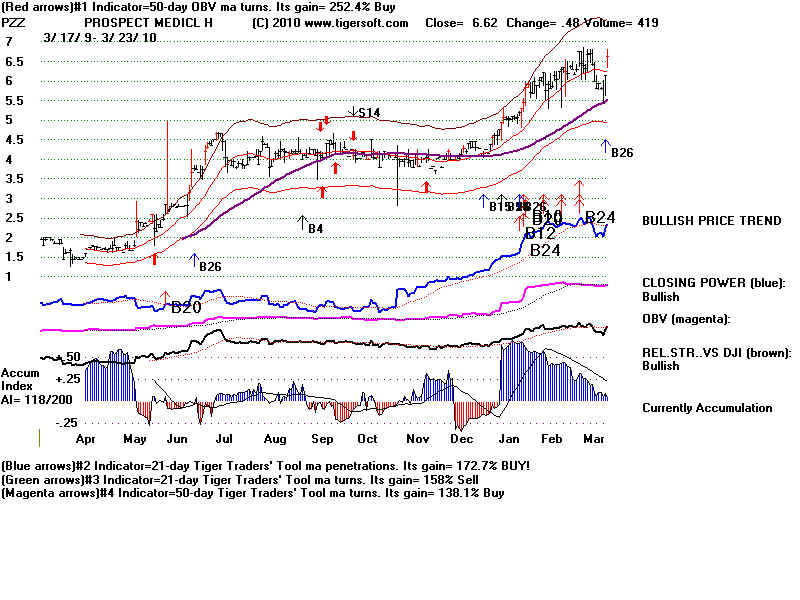
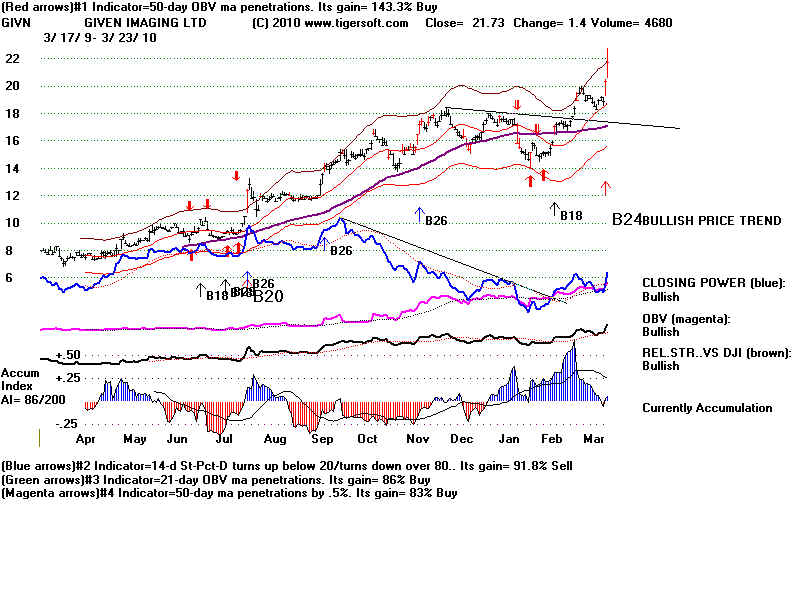
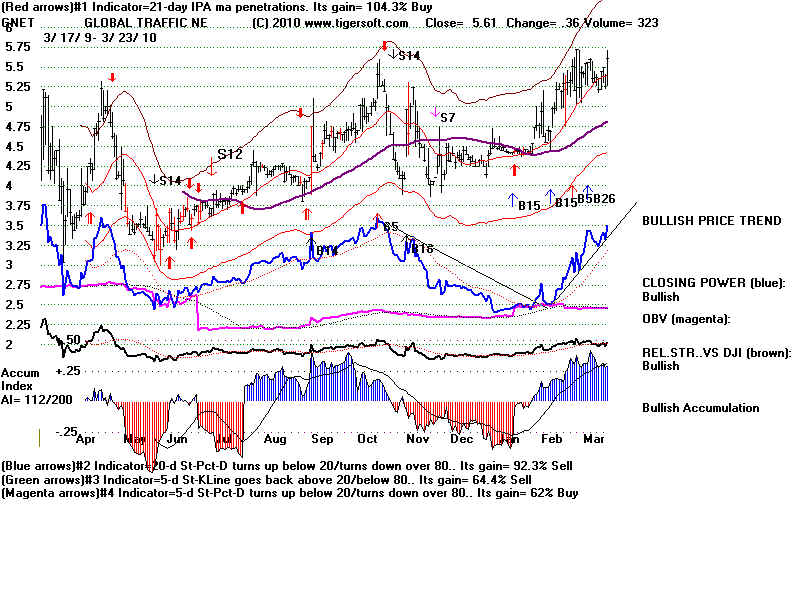
3/23/2010 Buy B17, Stocks continued to soar. It's helpful to look at the
stocks
up the most today that made new highs.
It shows the technical conditions that release
and propel a stock. (Do this with
Tiger using the older Tiger Charting programs +
Ranking Results + User Set Ranking + 1 +
1. ) Here are the top 3 gainers above 3.
INCY
PZZ
GIVN
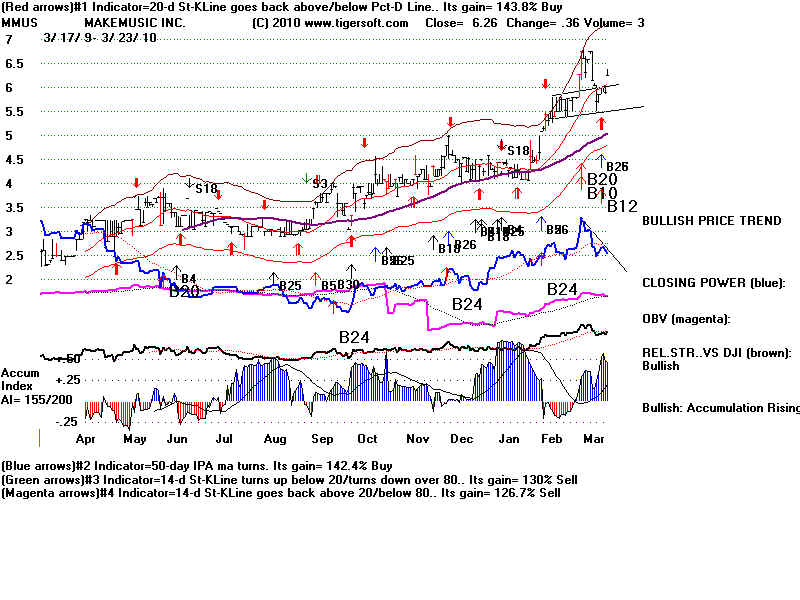
GNET
MMUS
For earler HOTLINES, click on links at top of page..
======================================================================================