


TigerSoft and Peerless Daily
Hotline
http://tigersoftware.com/11HL5522/index.htm
NEW
ADDRESS after Christmas
We
will EMAIL you with the new Hotline IP address in plenty of time.
-----------------------------------------------------------------------------------------------------------------------
(C) 1985-2014 William Schmidt, Ph.D. www.tigersoft.com
All rights strictly reserved.
Tiger Software 858-273-5900
PO Box
22784 San Diego, CA 92192
Email william_schmidt@hotmail.com
Previous Hotline -http://tigersoftware.com/112211-H/index.htm 11/22/2013-3/20/2014
http://tigersoft.com/1111-HL/index.html
10/22/2013-11/21/2013
----------------------------------------------------------------------------------------------------------------------
----------------------------------------------------------------------------------------------------------------------
 Shhh.
Sharing this hotline address with non-subscribers is a violation of our contract
Shhh.
Sharing this hotline address with non-subscribers is a violation of our contract
with you and a violation of copyright laws. I work hard for you. Respect that
effort!
---> To
renew this Hotline, order
here $350 (check) - $360(Visa/MC)
www.tigersoft.com/-2GBL13HL/index.htm
-----------------------------------------------------------------------------------------------------
 http://tigersoft.com/-HL42013/index.html
http://www.tigersoft.com/-2GBL13HL/index.htm
http://tigersoft.com/-HL42013/index.html
http://www.tigersoft.com/-2GBL13HL/index.htm
 A Guide To Profitably Using The
Tiger Nightly HOTLINE
A Guide To Profitably Using The
Tiger Nightly HOTLINE
 Peerless Signals: 1915-2013

New Peerless
Signals and DJI Charts - version 7/4/2013
1965 1965-6
1966
1966-7
1967
1967-8
1968
1968-9
1969
1969-70
1970
1970-1
1971
1971-2
1972
1972-3
1973
1973-4
1974
1974-5
1975
1975-6
1976
1976-7
1977
1977-1978
1978 1978-79
1979
1979-80
1980
1980-1
1981
1981-2
1982
1982-1983
1983
1983-1984
1984 1984-1985
1985 1985-1986
1986
1986-1987
1987
1987-8
1988 1988-9
1989
1989-90
1990 1990-1
1991
1991-2
1992
1992-3
1993
1993-4
1994
1994-5
1995
1995-1996
1996
1996-7
1997
1997-8
1998
1998-1999
1999
1999-2000
2000
2000-1
2001
2001-2
2002
2002-3
2003
2003-4
2004
2004-5
2005
2005-6
2006
2006-7
2007
2007-8
2008
2008-9
2009
2009-10
2010
2010-11
2011
2011-12
2012
2012-2013
Background and New Studies
4/15/2014 Introduction to Tiger/Peerless Buys and Sells.
Peerless Charts and Signals
Different Types of
TigerSoft/Peerless CHARTS, Signals and Indicators
Documentation for
TigerSoft Automatic and Optimized Signals.
How reliable support
is the DJI's rising 200-day ma?
SPY Charts since 1994: Advisory Closing Power S7s,
Accum. Index, 65-dma, Optimized
Signals.
4/7/2014 Advisory Pink Closing Power S7s at ETF at top since
1994
1994 1996 1997 1998 1999 2000 QQQ SPY
DIA 2002 2007 2008 SPY 2011 2013-2014
The New 2014 Peerless.exe Software has now been posted on the Elite Stock Professional
Page.
================================================================
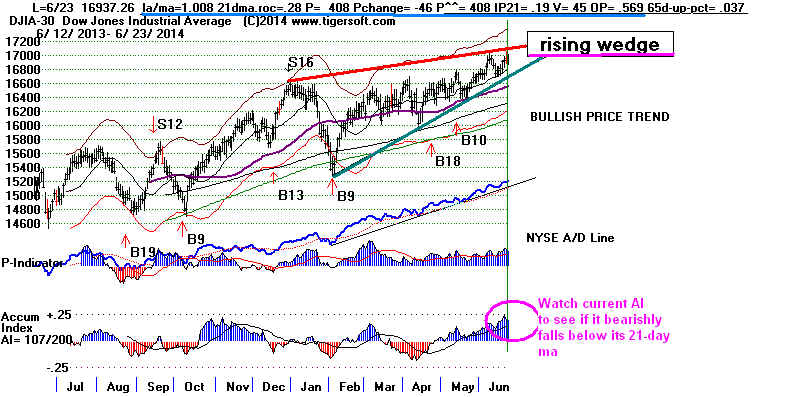
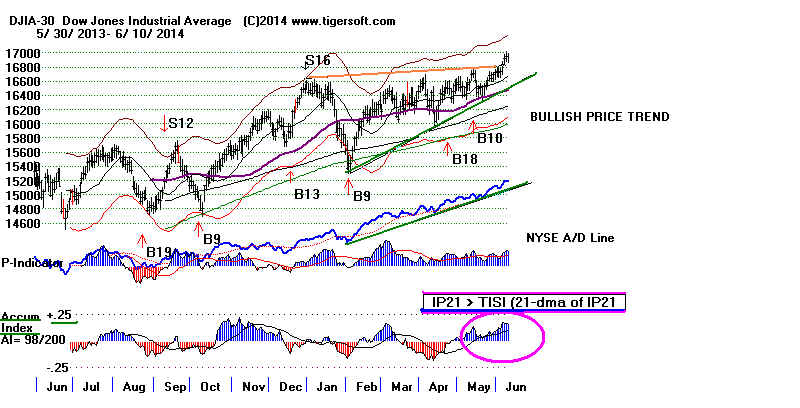
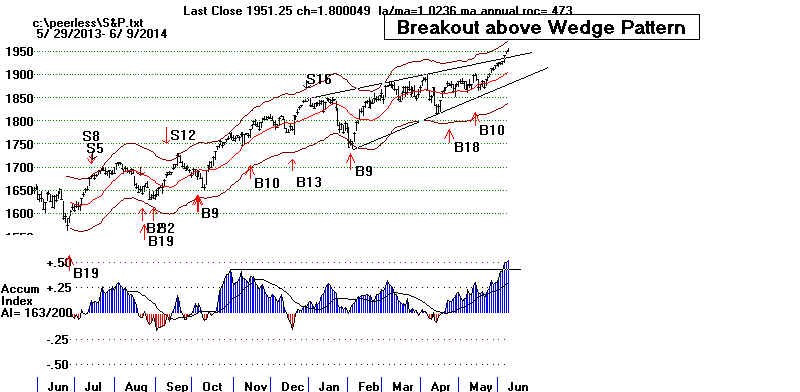
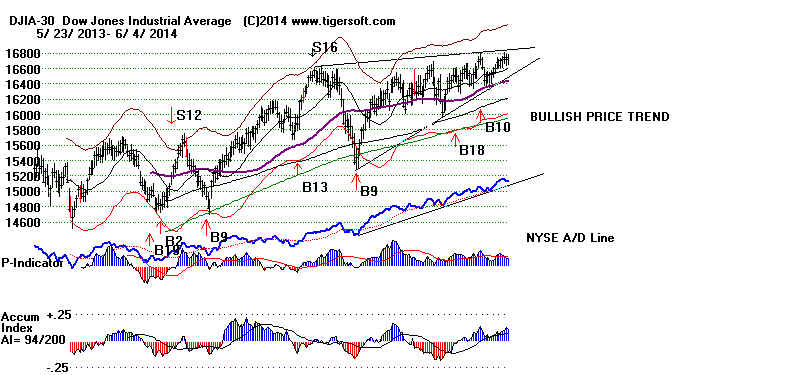
6/23/2014
Still No Peerless
Sell. However, if the current
Accumulation Index drops below its 21-day ma, it would
likely bring a decline to the lower band even if there
is no
Sell S4. In additon, if its rising price-support line is broken,
the
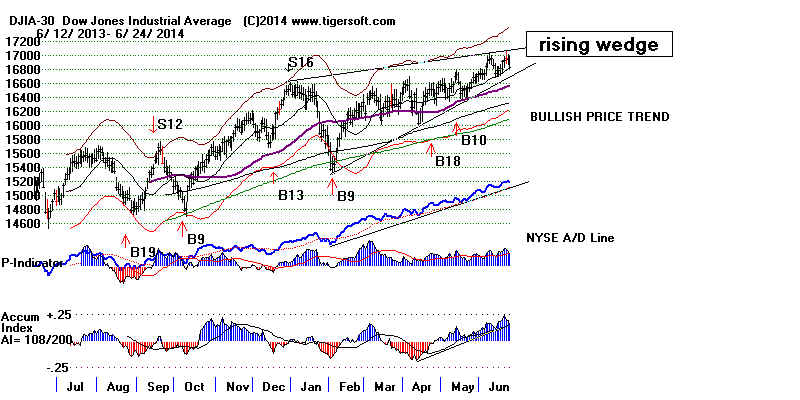
DJI's rising wedge pattern casts a 3:1probability spell
in
favor of a decline to the lower band. But without a Peerless
Sell,
a deeper decline seems very unlikely. The rising A/D Line
(representing the FED's lower interest rates) just gives too
much
underlying strength.
16700 is now the likely new support
I
tested hypothetical data to see if we would get a Sell S4
if
the current AI (IP21) were to drop below its 21-day ma.
We
would not get one. As presently written, we would
not
get a Sell S4 because
1) the DJI would have to close below its 21-day ma,
2) the P-I would have to be below +1,
3) the one day in P-I would have to be below -47.
4) the OPCT would have to be below +.45
5) The DJI would have to close 9% up from its 65-day low.
Still, tonight I checked the cases where the IP21 has broken its
21-day ma in June of the 2nd year in a Presidential cycle.
The
pattern of subsequent declines is unmistakeable with
or
without a Sell S4. But our lower band should hold if there
is no
Peerless Sell. The current internal strength readings
are
much too high. See the new study tonight of IP21 breaks
of
their MAs in Junes in the Second Year of a Presidential
Election.
ISIS CRISIS
All
this is also premised on the ability of the Iraq government
to
fend off the extremeist Sunni rebels' (ISIS) attack on Baghdad.
They
have proudly killed hundreds of captive Iraq Government
soldiers. Their cruelty can only stiffen the resolve of those defending
Baghdad. It should be able to hold out. Moreover, I would think
the
Obama Administration would understand how weak and
indecisive they will seem if they were to allow thousands and
thousands more to be cruelly killed by ISIS soldiers.
See Will
ISIS brutality backfire? and ISIS
outshines al-Qaeda's cruelty - Al Arabiya News
Of
course, if the Iraq capital were to be quickly over-run it would,
no
doubt, shock the market. The big American and British
oil
stocks would then have to worry about nationalization of
Iraq
oil, as it was under Saddam Hussein.
> To Key Index and Leading Stock Charts: DJI,
SP-500, etc.
Peerless DJI Chart SPY Chart NASDAQ Chart QQQ
Chart
IBB
Chart IWM Chart
Hourly DJI-OBV Hourly-MVM0735
FAS-3x Financials IBB-Biotechs
--> 55 - 77
MAXCP stocks
Bullish MAXCP Stocks (6/24/2014)
--> 63 +1 MINCP stocks Bearish MINCP Stocks
(6/24/2014) BEARISH plurality
--> 22 -27 New Highs on NASDAQ 16 +4 new lows. Bullish plurality
-->
52 -49 New Highs on NYSE 14
+6 new lows. Bullish plurality
New Study
Testing A Simple Unconditional Sell S4
in Rising Markets since 1930 in Junes
in the 2nd Year of A Presidential Election Year.
All
Junes might be of interest here, but time is limited and I've
found
that the 4-year cycle generally has a profound effect
on
the stock market. So, let's consider those cases where
the
DJI was in a long bull market in June of the second year
of
the 4-Year Presidential Cycle (namely a
year of Congressional
Elections.) We can compare the Peerless key values now
with
those of the cases of such Test S4s in these years.
See the charts of these Test Sell S4s here.
Keep in mind that
that
the key values we see now will be somewhat lower if
the
IP21 does break its 21-day ma.
The
current Key Values are so much more positive than those
in
the Test Sell S4 cases below, a decline to the lower band would
seem
the most the DJI might muster this month to please the bears.
LA/MA = 1.000 ANNROC = .15
P= +317 IP21 = +.143 V = +19 OPCT = +.48
65D-UpPct = +.031
high tied high
high high
1 6/11/1946 DJI dropped below lower band. Sell S5,
S4 and head/shoulders.
LA/MA = 1.001 ANNROC = .114 P=9 IP21 = +.143 V = -55 OPCT = +.228 65D-UpPct = .073
2 6/16/1950 DJI dropped below lower band Sell S8, S5 and head/shoulders.
LA/MA = 0.997 ANNROC
= .1124 P= -19 IP21 = +.073 V = -131
OPCT = +.230 65D-UpPct = .073
3 6/13/1978 DJI dropped to lower band
LA/MA = 1.008
ANNROC = .228 P=32 IP21 = +.016 V = 1 OPCT = +,206
65D-UpPct = .127
4 6/25/1986 DJI dropped below lower band
LA/MA = 1.01
ANNROC = .204 P=-48 IP21 = +.109 V = -2 OPCT =
+,089 65D-UpPct = .057
5 6/18/1990 3% rally and then bear market.
LA/MA = .999
ANNROC = .208 P= 15 IP21 = +.084 V = -1
OPCT = +,026 65D-UpPct = .069

================================================================
OLDER HOTLINES
================================================================
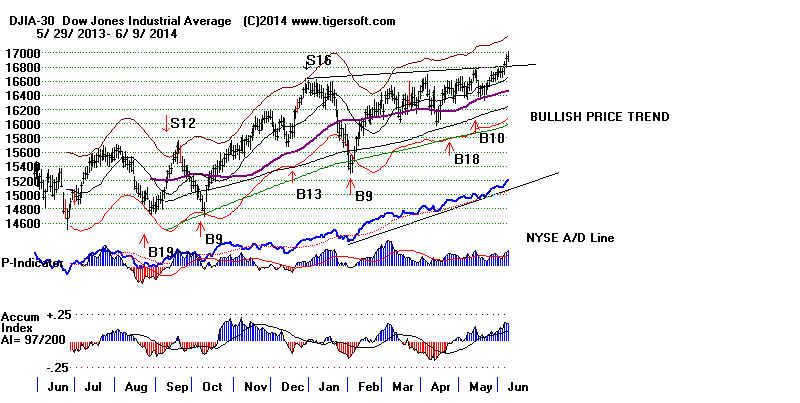
6/23/2014
Still No Peerless
Sell and none looks
imminent though we should watch the Accumulation Index
on the DJI. If the current AI (IP21) drops below its 21-day
ma, we may get a Sell S4.
Today's shallow decline could have been much worse. So,
Monday sellers did only limited technical damage. Still, the
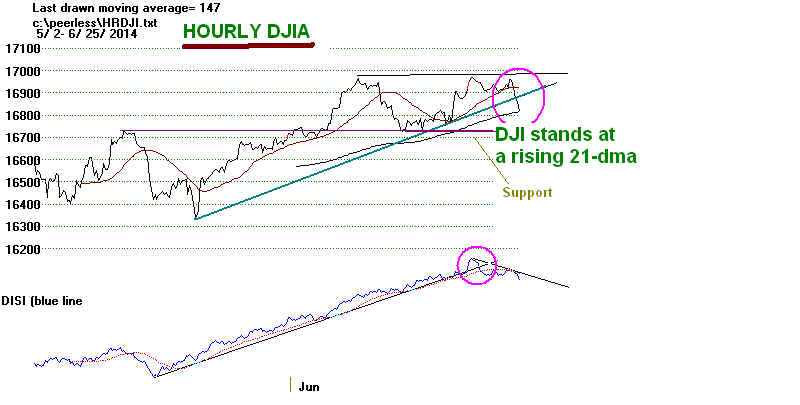
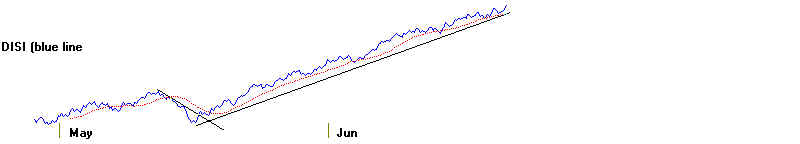
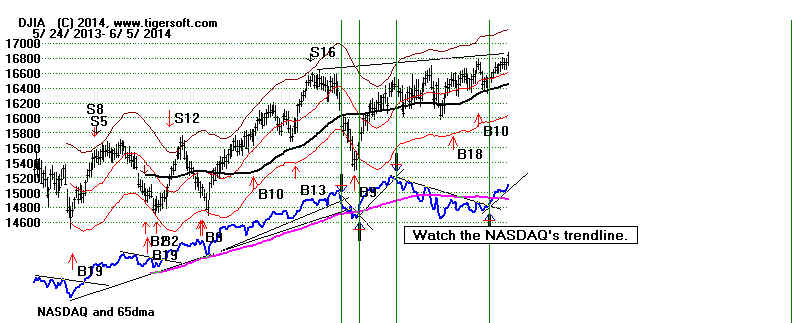
NASDAQ has stalled at its previous highs, the Hourly OBV (DISI)
Line has broken its uptrend and DJI now seems to have been
recaptured by a normally bearish rising wedge pattern. So,
watch the IP21 on the DJI.
> To
Key Index and Leading Stock Charts: DJI, SP-500, etc.
Peerless DJI Chart SPY Chart NASDAQ Chart QQQ
Chart
IBB
Chart IWM Chart
Hourly DJI-OBV Hourly-MVM0735
FAS-3x Financials IBB-Biotechs
--> 132 - 69
MAXCP stocks
Bullish MAXCP Stocks (6/23/2014) Bullish plurality
--> 57 +1 MINCP stocks Bearish MINCP Stocks
(6/23/2014)
--> 49 -39 New Highs on NASDAQ 12 -7 new lows. Bullish plurality
--> 101
-93 New Highs on NYSE 8
-10 new lows. Bullish plurality
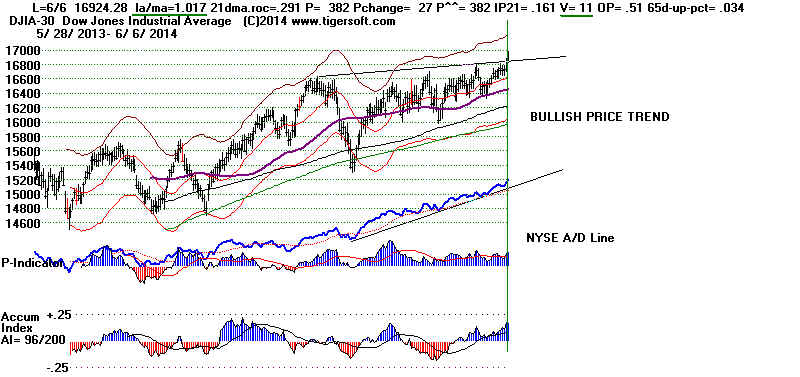
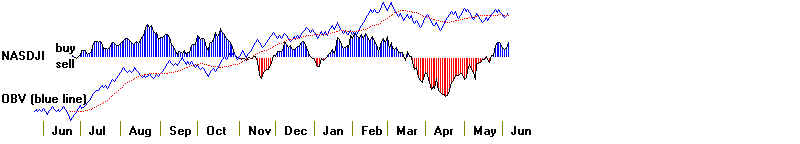
Most important, the NYSE A/D Line remains steeply up. Historically
this is the most important bullish sign the market can make.
A very visible A/D non-confirmation of a new DJI high is the most
frequent technical warning the market gives at major tops.
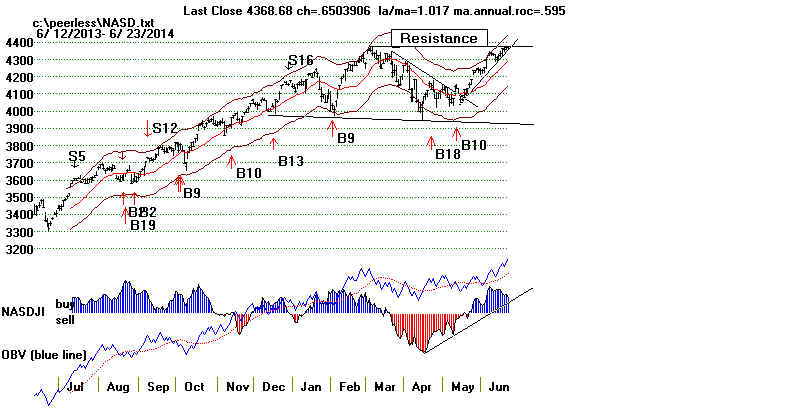
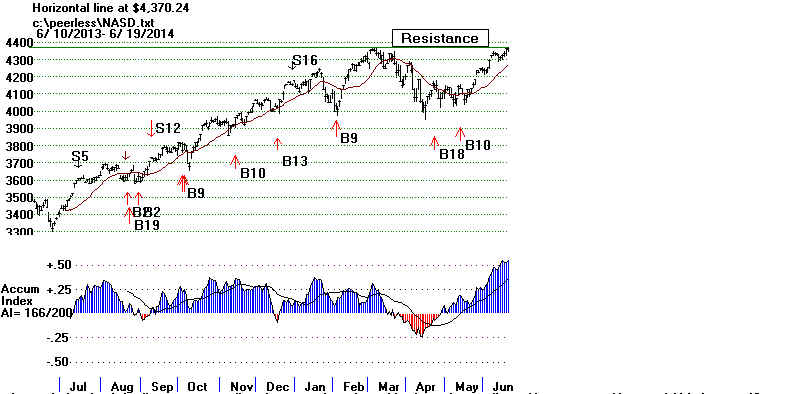
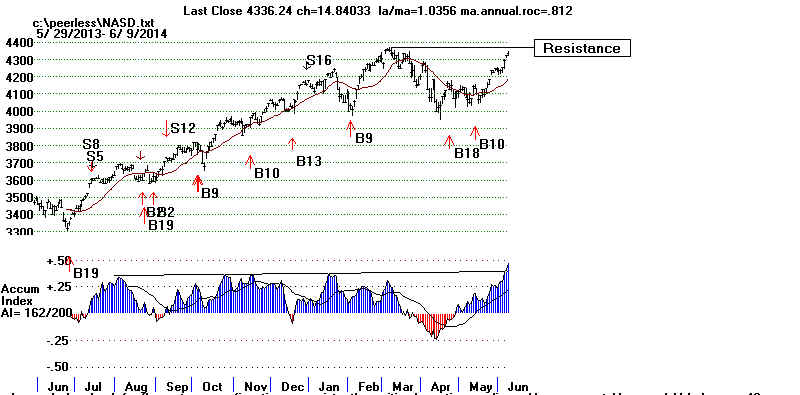
A NASDAQ breakout now would be very bullish. It would remind
older traders of how the NASDAQ launched past take-offs with
breakouts above flat resistance propelled by very high Accumulation.
as in February 1995, April 1996, June 1997, December 1998, November
1999, August 2003, July 2009, July 2014. See
these NASDAQ charts here.
The market has held up well, considering how badly Iraq could blow
up and how readily American Presidents usually are in involving
the American military in civil wars all around the world. Certainly,
the way oil stocks are rising tells us the new Iraq civil war will probably
get much worse. Being long oil stocks and oil/drilling ETFs and short
their leveraged inverts remains recommended. Moves in oil
stocks can often take place over extended periods when any of
the many Mid-East political volcanoes become active and erupt.
================================================================
OLDER HOTLINES
================================================================
6/20/2014
Still No
Peerless Sell and none looks
likely or imminent.
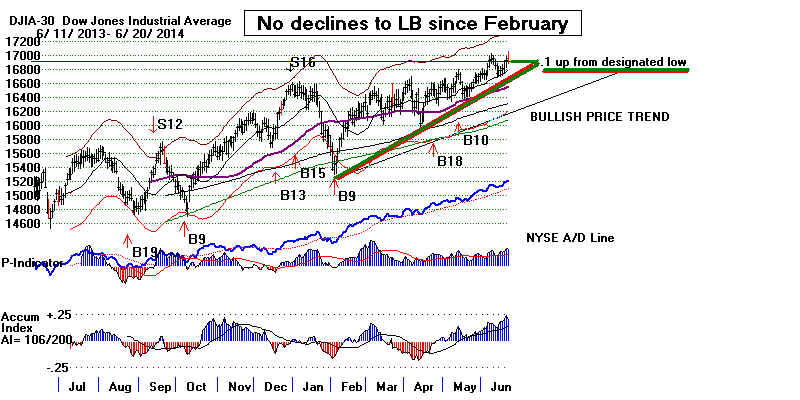
There's more bullish evidence about the market now.
A steady advance from February to June without a decline
to the lower band is ordinarily bullish. So are the very high
OBVPct readings from the DJI (See tonight's new research)
and the very high IP21 levels on the NASDAQ, OEX and SP-500.
July may be a problem Significant tops did occur in July
when Peerless gave a Sell Signal in 1943, 1957, 1975, 1983
and 1990 despite a strong February to July advance.
Steady Feb-July Advances
1943
July 14 S4 a week earlier. DJI reached 2.5% upper band before selling off to
LB.
1954
DJI rose steadily all year.
1957
July 5 Sell S4, S9, S7 DJI reached 2.5% upper band before selling off. Bear Mkt.
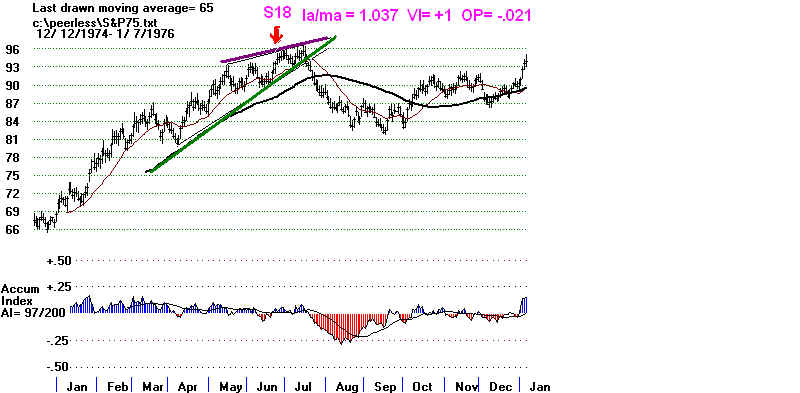
1975
June 23 Sell S18 (OPCT NNC at 3.7% upper band.) DJI fell 10%
1983
July 26 Sell S9. DJI then fell to lower band.
1990
July 13 Sell S9 and S8. Big decline followed.
1993
DJI rose steadily all year.
1995
DJI rose steadily all year.

The Peerless internals all look
constructive. Before a top can be
made, I would expect there to
be one of five technical developments:
1) A new DJI high that is
widely unconfirmed by the NYSE A/D Line.
This would potentially bring
a Peerless P-Indicator negative non-confirmation
of a DJI new high and a Sell
S9. Presently, the A/D Line is leading the DJI,
not lagging.
2) A weakening in the
Accumulation Index (IP21) which would make it drop
below its 21-dma and give a
Sell S4. The IP21 now stands at .188. The
21-day ma of the IP21 stands
now at .14. We would need to see three of
four straight days of the DJI
closing near its low on high volume for
this to occur. As
I mentioned recently, the crossing of +.50 by the IP21
for the NASDAQ, OEX and
SP-500 are quite reliably bullish until a regular
Peerless Sell Signal occurs..
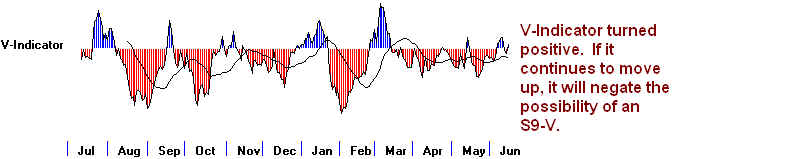
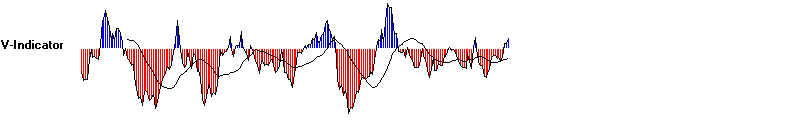
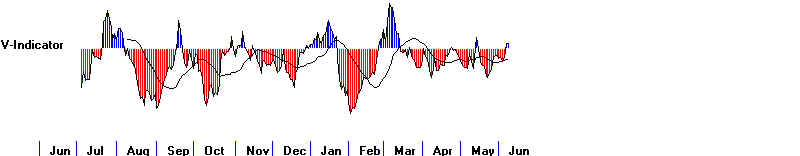
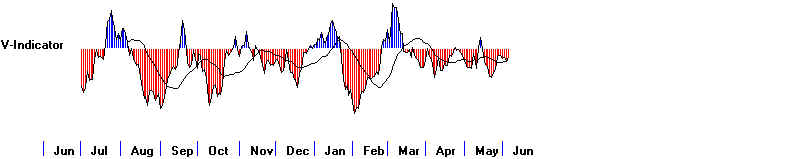
3) The V-Indicator would have
to turn negative as the DJI moves closer
to the upper band and produce
a Sell S9V. It now stands at +52. So,
this seems unlikely.
4) A DJI head and shoulders
would suddenly develop as a result of unexpected
bad international news or a
dramatic change in economic policies by the White House.
5) The OBVPct would have to
turn negative as the DJI rises to the 3%
upper band. This
can produce a rare Sell S18. The value for OBVPCT is now +.651
Such high readings are
usually bullish provided Peerless has not given
a sell. See the
new study below. In 8 of the 10 cases since 1928 where the
OBVPCT reached .65, the DJI
moved much higher.
DJI OPCT readings above +.65 and Subsequent DJI Action
1929-2014
1 7/9/1929 .732
DJI rose from 345.6 to 381.2 on 9/3/1929. Then t utterly collapsed.
(4/14/1930 .63 DJI peaked here and collapsed. IP21
was only .117 and VI was -94.)
2 8/8/1932 .676 DJI rose from
67.7 to 79.9 before declining 35%.
3 6/29/1938 .701 DJI rose from 135.9 to 158.1.
(10/13/1942 .624 DJI rose from 115
to 145.8 on 7/14/1943 before declining
to lower band.
Note that IP21 was +.251 and VI was +114.)
4 7/14/1943
.711 DJI immediately peaked and declined from 145.8 to 129.6
(There had just been a Sell S4 and a Sell S8 a month before. )
(12/7/1954 ,632 DJI rose from
393.9 to 419.7 on 3/4/1955 before falling
to lower band. )
5 6/22/1955 .712
DJI rose from 447.4 to to 468.4 on 7/26/1955 and falling to lower band.
(7/25/1958 .641
DJI rose from 501.8 to 5917.7 on 1/21/1959 and falling to lower band.)
6 6/9/1960 .651 DJI peaked and fell from
656.4 to 601.7 on 7/25/1960.
(There had been a Sell S2 on June).
7 8/20/1962 .650 DJI peaked and fell from 612.9 to 558.0 on
10/23/1962.
8 7/7/1964 .657
DJI rose from 844.9 to 891.7 on 11/18/1964 and falling to the lower band.
(4/30/1968 .637 DJI peaked and fell from 912.22 to 869.65 on 8/9/1968 )
9 12/3/1970 .655 DJI rose from 808.53 to
950.82 on 4/28/1971.
(5/23/1990
.637 DJI rose
from 2856.26 to 2999.75 on 7/17/1990.
DJI then fell to 2375 on 10/11/1990 )
10
7/19/2007 .719 DJI rose from 13105.5 to 14000.41 on
7/19/2007 and then fell back 10%.
6/20/2014 .651 outcome?
> To Key Index and Leading Stock Charts: DJI,
SP-500, etc.
Peerless DJI Chart SPY Chart NASDAQ Chart QQQ
Chart
IBB
Chart IWM Chart
Hourly DJI-OBV Hourly-MVM0735
FAS-3x Financials IBB-Biotechs
--> 201 + 19
MAXCP stocks
Bullish MAXCP Stocks (6/20/2014) Bullish plurality
--> 56 +25 MINCP stocks Bearish MINCP Stocks
(6/20/2014)
--> 88 +28 New Highs on NASDAQ 19 +7 new lows. Bullish plurality
--> 194
+28 New Highs on NYSE 18
+12 new lows. Bullish plurality
================================================================
6/19/2014 Still No Peerless Sell
A Peerless Sell is being made more unlikely by our
still improving
technical Indicators. More and more, a DJI of 17700-17800
seems a valid target, In particular, see from our rising Inverted
MKDS how NYSE volume is disproportionately high in rising stocks.
The Hourly DJI's DISI Line is now sending the same
message.
The FED's assurances that interest rates will remain low for the
foreseeable future plus what appears to be a stable Dollar make
US stocks an inevitable choice for most big investors.
> To Key Index and Leading Stock Charts: DJI, SP-500, etc.
Peerless DJI Chart SPY Chart NASDAQ Chart QQQ
Chart
IBB
Chart IWM Chart
Hourly DJI-OBV Hourly-MVM0735
FAS-3x Financials IBB-Biotechs
--> 182
MAXCP stocks
Bullish MAXCP Stocks (6/19/2014) Bullish plurality
--> 31 +7 MINCP stocks Bearish MINCP Stocks
(6/19/2014)
--> 60 -16 New Highs on NASDAQ 12 -3 new lows. Bullish plurality
--> 168
+27 New Highs on NYSE 6
+3 new lows. Bullish plurality
Dangers Inherent in The Feds' Policies
These are not long-term bullish signs, however. What we have now
is far from a fresh new bull market. Rather than a vibrant economic
recovery which lifts the incomes of the working middle class, we
have a a market whose rising prices have mainly been boosted
by the twin Fed policies of low interest rates and deliberate
"transparency". The latter offers very high predictability
and more investor confidence, but only for so long as rates are
seen as being kept low by an all-powerful FED. When rates
start to rise, the FED's transparency will back-fire.
As in the late 1920's, I have to think that the current Income inequality
in the US will eventually cause over-production, a lack of consumer
demand and then a fall in profits and stock prices. But first the DJI
may "melt up". This is exactly what happened between August 1928
(DJIA - 215) and September 1929 (DJIA - 382). It is exactly what
happened for the NASDAQ between October 1999 and March 2000.
Now with the Fed's help, we could see another "melt-up" bubble.
Early Warning
Signs
Today we saw the red high volume moves by Gold and Silver above their
falling 65-dma. (See also how these advances followed failures by their
Closing Powers to confirm recent lows.) This and rising
oil prices may
pose real problems for a stable Dollar and low interest rates by August or
September. If hot money starts selling currencies and the Dollar in favor
of oil, gold and silver, in part because of developments in Iraq, it will probably
force the Fed to allow interest rates to rise in order to protect the Dollar.
With
so much US indebtedness, the FED has sought to prevent higher interest rates
from producing runaway indebtedness. But it is not all powerful. International
pressures may build a lot more quickly than almost anyone may expect. A quick
rise in 10-yr interest rates from the 2.6% level now to a level clearly above 3.0%
(December's peak) to, say, 3.5% would bring out new fears that the Fed has
lost control. If rates do go up, dividends paying stocks will surely tumble.
Right now, these dangers and fears are only something to watch for.
Usually Gold and Silver must rise steeply by, say, 20% for at least 2 months
before the DJI sets up a significant top. (This was the case with the August
1987 DJI top before it fell 37% by the third week of October.)
But as long as the NYSE A/D Line keeps making new highs, most investors
still do not see a rise in interest rates as much of a threat. They trust that
the FED means what that they say and that they are all powerful. But they
wrong to think these things. The FED can change their minds. They have
made many, many mistakes over the years. And if international events
develop too quickly, they could lose control.
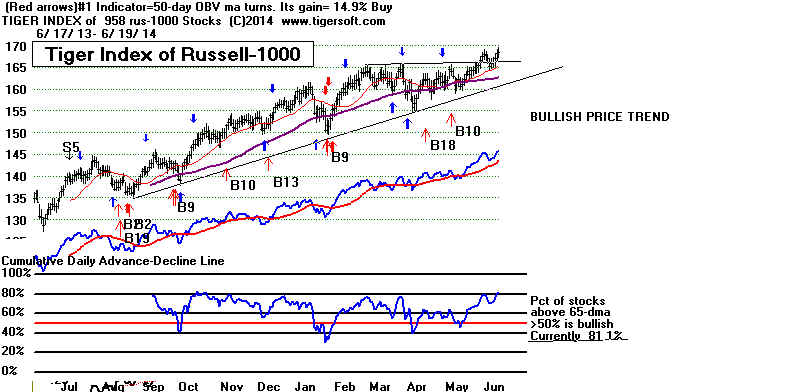
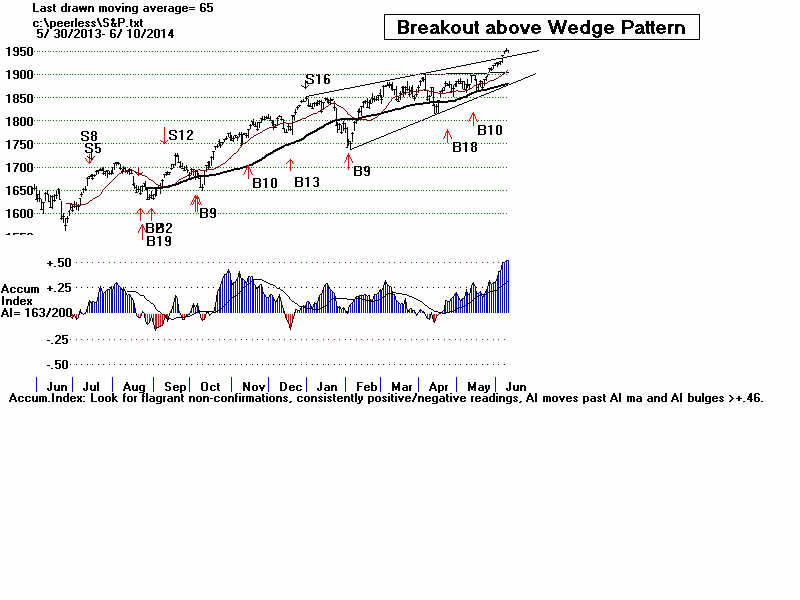
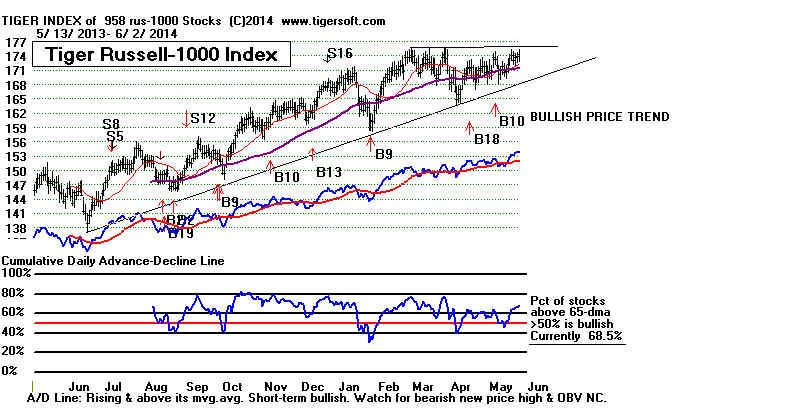
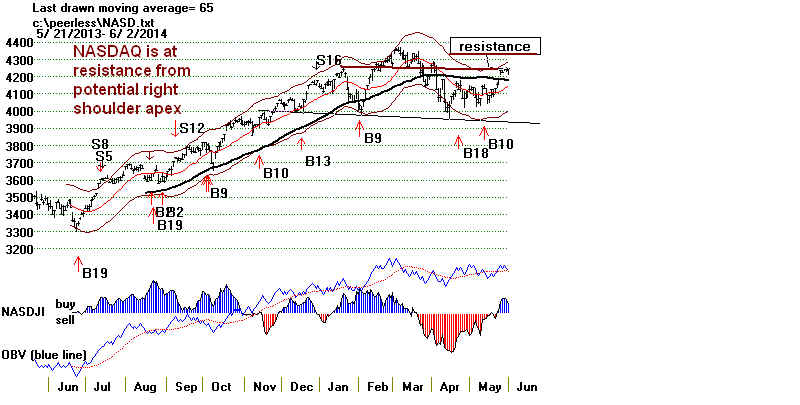
Breakouts now in the NASDAQ and our Tiger
Russell-1000
next would be a big boost to speculative interest in smaller
oil and tech stocks. See below how both are at their
resistance levels from their previous highs. These represent
the stocks that small investors watch. Typically, they need
to surge to a bubble before the bull market can climax.
================================================================
OLDER HOTLINES
================================================================
6/18/2014 Still No Peerless Sell
The bull market is broadening. Technology stocks and
foreign
ETFs are now
participating in the advance. Some heavily shorted
stocks are ralllying,
too, as shorts are getting nervous about the
strength the market is
showing despite the gathering Sunni threat to the
Iraq that America and
Britain set up after an expenditure of $3 billion.
With all he internal
strength indicators quite positive, it looks as though
the only way Peerless
will give a Sell will be when the P-Indicator
finally turns negative
after being positive for 5 straight months. That
signal, an Sell S19,
cannot occur before July 10th. Moreover, the DJI's
price objective, if it
can get past 17000 will be 17800 based on the
height of the previous
1200-point trading range and the breakout at
16600.
Bullishly, The SP-500, like the NASDAQ and OEX, now have IP21
readings
above +.50. Moves
by this indicator above +.50 have always been
bullish in the 5
previous cases since 1990. (See below). Once again
the NYSE A/D Line has
made a new high ahead of price. This is usually
a characteristic of a
very healthy bull market.
Foreign ETFs' ETF DZK
is the highest ranking leveraged ETF.
Its IP21 (Accumulation
Index) is a very high, +.774. DZK is now
challenging its old
highs of 84 in April 2011 and 90 in October 2010.
Iraq and Obama
The fight for the biggest oil refinery in Iraq continues and
Obama
has authorized
surveillance flights on the ISIS jihadists moving
south towards
Baghdad. The administration seems to be waiting for
al-Maliki to be
replaced or for him to agree to unspecified US
conditions before
using air power to stop the militant's convoys
moving South in
the deserts north of Baghdad.
(The CNN
campaign for removal of Al-Maiiki reminde me of the TV news
in 1963 in
the month before the CIA removal of Diem as President
of Viet Nam
in December 1963.)
> To Key Index and Leading Stock Charts: DJI, SP-500, etc.
Peerless DJI Chart SPY Chart NASDAQ Chart QQQ
Chart
IBB
Chart IWM Chart
Hourly DJI-OBV Hourly-MVM0735
FAS-3x Financials IBB-Biotechs
--> 182
+68 MAXCP stocks
Bullish MAXCP Stocks (6/18/2014) Bullish plurality
--> 24 -4
MINCP stocks Bearish MINCP Stocks
(6/18/2014)
--> 76 -8 New Highs on NASDAQ 15 -7 new lows. Bullish plurality
--> 141
-33 New Highs on NYSE 3
new lows. Bullish plurality
New Research
SP-500
IP21 Breakouts over +.50
SP-500
IP21 Subsequent OEX move
2/6/1991 358.07 .550 Advanced to 390.45 on 4/17/1991
(1/17/1991 418.86 .471 Declined to 394.50)
9/28/1995 585.87 .536 Advanced to 660.51 on 2/13/1996
2/7/1996 649.93 ,541 Advanced to 660.51 on 2/13/1996 and then fell to 631.18 on 4/11/1996.
1031/2006 1377.95 .501 Rose to 1459.70 on 2/20/2007 and then fell to 1374.10 on 3/5/2006
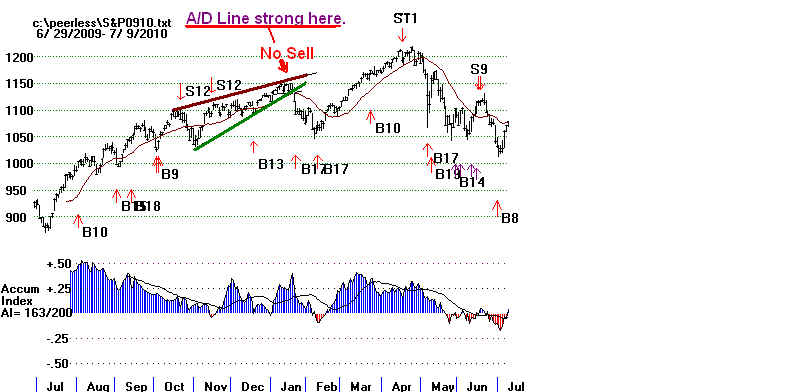
8/5/2010 1002.70 .535 Rose to 1148.45 on 1/14/2010 and then fell to 1056.75 on 3/5/2006.
(1/20/2012 1315.40 .499 Rose to 1419.04 on 4/2/2012.)
6/10/2014 1950.79 .516 ? sp-500 is now at1956.98 on 6/18/2014.
Power Ranking of Leveraged ETFs
Last AI/200 IP21 Closing Power
#1 3x Developing Markets, DZK
83.01
186 .774
New high
#2 3x Bullish Semiconductors, SOXL
111.81 169 .372
Lagging.
#3 Bullish
SP-500, UPRO
114.31 167 .471
Rising.
#4 Ultra Oil/Gas,
DIG
87.2 155 .221
Rising
#5 3x Technology, TECL
111.4 167 .344
Rising
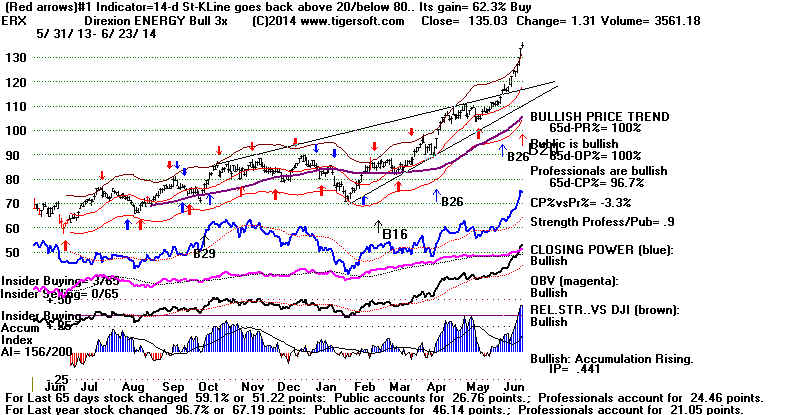
#6 3x Energy Bull, ERX
127.09 153 .323
New High
================================================================
6/17/2014 Still No Peerless Sell
Due to server problems, the www.tigersoft.com DATA
page is not working right now. It has been switched to
www.tigersoftware.com/114411 If
you have problems
with this new site, let me know.
Last night I showed how often is was bullish when
the
NASDAQ's IP21 rose clearly above +.50. The same thing
is true for the OEX (SP-100). Without a Peerless Sell
signal the current IP21 breakouts above +.50 in the
NASDAQ and OEX give us very good historical odds that
the markets will keep on rising.
OEX IP21 Breakouts over +.50
OEX
IP21 Subsequent OEX move (12/2/1987 240.95 .485 4% decline...then advanced to 293.63 on 4/6/87)
2/6/1991 330.75 .523 Advanced to 367.85 on 4/18/1991
9/25/1995 554.63 .529 Advanced to 634.64 on 2/12/1996
3/8/1996 630.38 .608 Went narrowly sidewise for 3 month before rising out of trading range
(7/16/1999 733.78 .477 OEX fell to 651.86 on 10/15/1999)
1/12/2004 559.42 .523 Rose to 573.44 on 1.26.2004 and then fell to 530.40 on 5/17/2004
10/26/2006 645.42 .511 Rose to 670.22 on 2/14/2007 and then fell to 630.48 on 3/5/2006
8/5/2010 466.22 .529 Rose to 529.60 on 1/14/2010.
6/10/2014 864.67 .522 ? OEX is now at 858.12 on 6/17/2014.
|
IRAQ's WOES HELP OIL STOCKS
The conflict in Iraq and Professional
cautiousness will temper
the bullishness of the excellent NYS A/D Line and the positiveness
of all the Peerless indictors now.
Also worrisome, the FED seems
on the verge of throwing its hands up in the air and saying "there's
nothing more we can still do to bring about a broad national economic
recovery. It's up to Congress to begin to rebuild the country's
public infrastructure."
The BBC reports:
"Islamist-led militants have
invaded Iraq's biggest oil refinery,
after pounding it with mortars and machine guns from two directions.
Miltants now control 75% of the Biji refinery (Iraq's biggest)
130 miles nore of Baghdad."
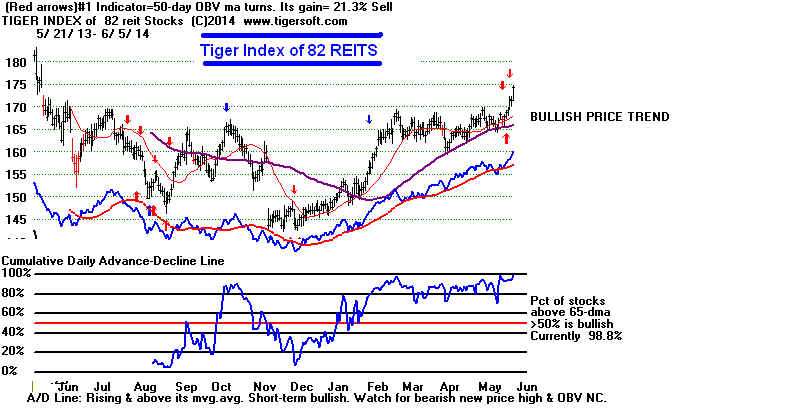
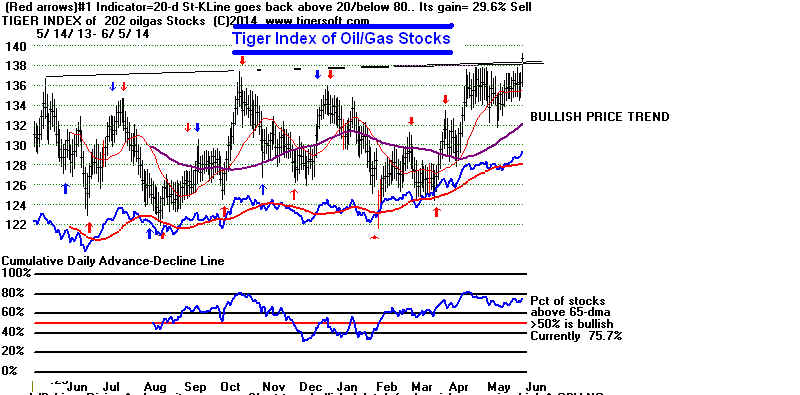
Leading oil stocks moved higher today. The Tiger Index of the
group shows its A/D Line has made another new high. 81.2%
of the 202 stocks we follow in the group are above their 65-dma.
11% (23) of these stocks are up more than 30% in the last 65 trading
days. Of these, very high IP21 readings (>.35) are seen in:
NFX 41.72 AI/200-132 IP21 =
.36 ( running above upper band.)
WFT 22.35 AI/200=166 IP21 = .38 ( nice pullback to rising 21-dma
seems over)
PDS 13.97 AI/200= 168 IP21 = .47 (comsolidating near upper band.)
SU 42.66 AI/200= 114 IP21 = .39 (Above upper band).
I remember how oil stocks rose in 1972-1973, in 1976-1977,
in 1979-1980
and in 2007-2008. They keep advancing until their low priced members
run up wildly in a fenzied bubble. We are nowhere near that point.
And these stocks rise even after the DJI has topped out. Owning
some of the bullish oil/gas MAXCP stocks seems appropriate now.
> To Key Index and
Leading Stock Charts: DJI, SP-500, etc.
Peerless DJI Chart SPY Chart NASDAQ Chart QQQ
Chart
IBB
Chart IWM Chart
Hourly DJI-OBV Hourly-MVM0735
FAS-3x Financials IBB-Biotechs
--> 114
+8 MAXCP stocks Bullish MAXCP Stocks (6/17/2014) Bullish plurality
--> 28 -15
MINCP stocks Bearish MINCP Stocks
(6/17/2014)
--> 84 +60 New Highs on NASDAQ 22 +16 new lows. Bullish plurality
--> 108
New Highs on NYSE 7
new lows. Bullish plurality
================================================================
6/16/2014 Still No Peerless Sell.
The NASDAQ
bullishly just crossed clearly above +.50 today.
Of the 8
similar cases in the past, in 6 the NASDAQ made
significant
gains. In the other two cases, Peerless
gave major
Sells and only then NASDAQ sold off badly.
Professionals remain cautious, but there appears to
be
very good support now for the DJI at its 21-day ma.
The IP21
has moved up quite a ways above its 21-day; so, that removes
the chances for now of a Sell S4. In addition, the V-Indicator
is up more in positive territory; so, that eliminates the chance
of a Sell S9V. The Hourly OBV (DISI) Line is very
bullishly
rising much faster than the DJI.
Bullishly, the Iraq Government claims it has turned back the
ISIS Sunni fighters, so that Baghdad and the US Embassy look
much safer than they did last week. As a result, the DJI and
the market looks like they may move back up to their recent highs
in search of resistance. Professionals will need to resume
their buying, for this to occur: the DJI must make further gains
after the opening. The DIA's Closing Power downtrend
needs to
be broken. .
> To
Key Index and Leading Stock Charts: DJI, SP-500, etc.
Peerless DJI Chart SPY Chart NASDAQ Chart QQQ
Chart
IBB Chart IWM Chart
Hourly
DJI-OBV Hourly-MVM0735 FAS-3x Financials IBB-Biotechs
--> 106
+50 MAXCP
stocks Bullish
MAXCP Stocks (6/16/2014) Bullish plurality
--> 43 -3
MINCP stocks Bearish MINCP Stocks
(6/16/2014)
--> 24 -9 New Highs on NASDAQ 6 new
lows. Bullish plurality
--> 61
+13 New Highs on NYSE 5 new lows. Bullish plurality
Oil stocks made additional gains today, as did many semi-
conductors. (See the pop in WMB today.) On the other
hand,
many retail stocks dropped to new lows. (PNRA, for example).
This shows that the broad mass of consumers are not in a
position to buy as might be expected if this were a solid
recovery. Eventually, profits' growth will no longer be
sustainable and there will be a big decline, perhaps like
in 2008, when oil stocks and AAPL were a big part of the stocks
having one "last hurrah". Rising oil stocks help hold up the
DJI via XOM and CVX, so: I
think we can continue to make money
being hedged, long bullish oil stocks and short bearish retail stocks
that are breaking down. This will probably be more lucrative
than trading the very small percentage moves in the major
ETFs.
What Is Significance of NASDAQ IP21 Clearly Rising above .50?
In 6 of 8 past cases the NASDAQ subsequently made very good gains.
In 1994 and 1998, the NASDAQ then sold off significantly.
4/19/1989 NASDAQ
rose from 421.91 to 453.99 on 6/8/1989 and the fell 5% and then rose to 485.73 on
10/9/1989.
5/21/1990 NASDAQ
rose from 452.89 to 469.60 on 7/16/1990 (Sell S9) and fell to 325.61.
11/11/1992 NASDAQ rose
from 634.92 to 707.16 on 1/26/93.
1/14/1994 NASDAQ rose from 792.31 to
797.24 on 2/1/1994 or 803.95 on 3/17/1994
and then fell to 705.52 on 4/20/1994.
7/7/1995 NASDAQ
rose from 969.76 to 1066.96 on 9/14/1995 and then fell back 8%.
7/17/1998 NASDAQ top.
It fell 30%. Peerless did give a S9 and S12 a week before NASDAQ peak.
5/27/2005 NASDAQ went sidewise
for 6 weeks and then rose 12% before falling 8%
8/6/2009 NASDAQ at 1973.16. It fell
back 3.5% and then rose to 2176.32 on 10/19/2009.
6/16/2009 IP21 rose to .549 today,
=================================================================
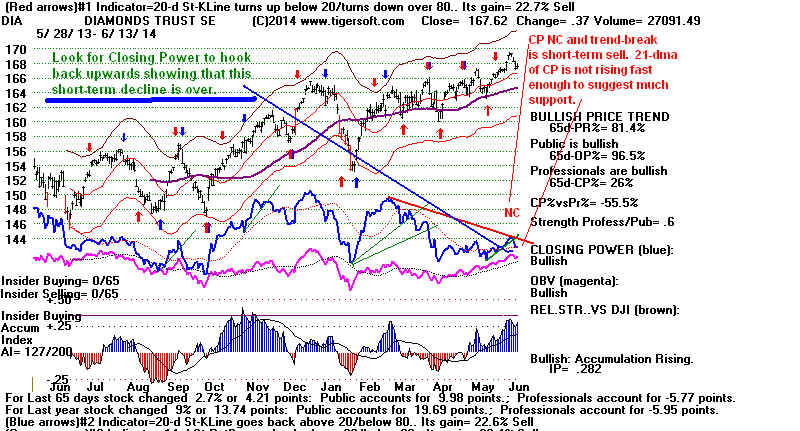
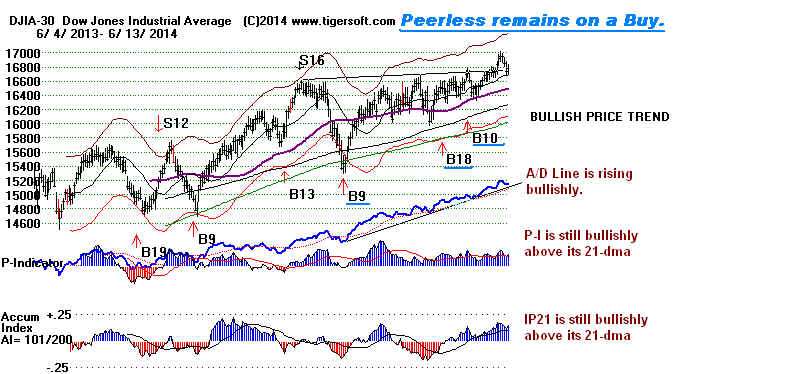
6/13/2014 Still No Peerless Sell.
Tiger's Closing Power on DIA has broken its uptrend
after failing
to confirm the last advance. This sets up a short-term Sell based
on Closing Power rules. Its 21-dma is not rising fast enough to
suggest reliable support. So, we need a hook back upwards
by the blue Closing Power before we can become bullish based
on what Professionals are doing.
It remains to be seen if the market can rally much
until Iraq
cools off. Watch the IP21 (Current Accumulation)
Index.
If it falls below its 21-day ma, I would think the
DJI will
fall to the lower band now at 16100. Normally
we would
suggest hedging with some bearish MINCP
stocks.
But buying some of the most Accumulated
Oil stocks
now may work out better.
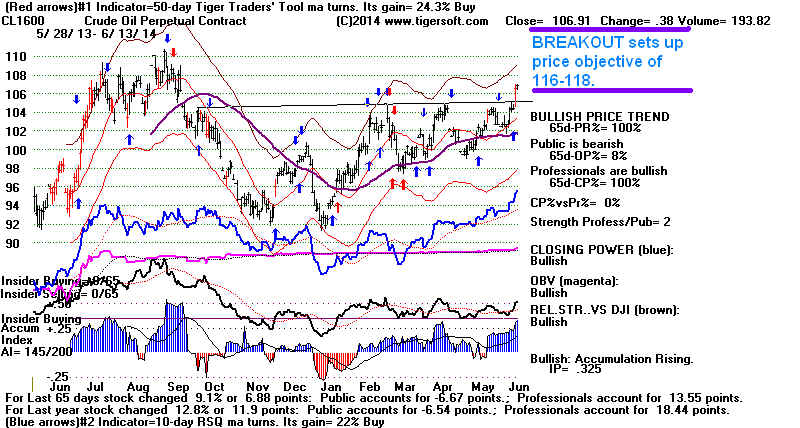
Crude Oil's High Volume Breakout
was confirmed by Closing Power,
Relative Strength, OBV and high Accumulation.
Now We Have To Worry about
A Dangerous Bubble in Oil/Gas Stocks
There is no question
but that traders must now
favor long positions in the many oil and gas stocks
among our Bullish MAXCP stocks.
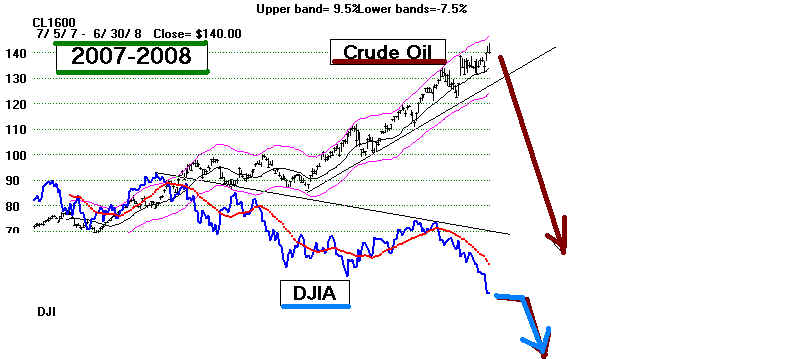
Oil and gas stocks have a quite a history of making
new highs even after the DJI has topped out. See the
chart fo Crude Oil in 2007-2008.

Oil and gas stocks are in considerable demand now.
The obvious explanation is the jump in Crude Oil
prices occasioned by a new investor appreciation of
the dangers that Iraq's oil production (the second biggest
in OPEC) will fall to the control of Sunni religious fanatics
who wish to set up a new Syrian-Iraq caliphate.
Such
a regime, it can be reasoned, would be very infriendly
to US and British control, given the lengthy effort Bush's
and Obama's armies went to eliminate them.
Most of the new highs made this week are oil and gas
stocks. This is reminiscent of the first half of 2008 and
also 1976-7 and 1980-1. Each of these bull markets in
oil stocks were followed bear markets in US stocks.
> To Key Index and Leading Stock Charts:
DJI, SP-500, etc.
Peerless DJI Chart SPY Chart NASDAQ Chart QQQ
Chart
IBB Chart IWM Chart
Hourly
DJI-OBV Hourly-MVM0735 FAS-3x Financials IBB-Biotechs
--> 56
+13 MAXCP
stocks Bullish
MAXCP Stocks (6/13/2014) Bullish plurality
--> 46 +7
MINCP stocks Bearish MINCP Stocks
(6/13/2014)
--> 24 -9 New Highs on NASDAQ 6 new
lows. Bullish plurality
--> 61
+13 New Highs on NYSE 5 new lows. Bullish plurality
IRAQ Simplified
The stock market recovered Friday as Iraqi government
forces stalled
the Sunni militants' forces 60 miles north
of Baghad.
Iraq's biggest oil refinery (300,000 bar/day)
is still
controlled by the government. See
my efforts
to simplify the reports of fighting now in
Iraq. Below is
a map showing
where the oil is and who controls it now.
More than 60% of
Iraq's oil is much further South in the
area that is
heavily Shiite and more easily government
controlled.
President Obama
is considering air strikes to support
the mainly Shiite
supported Iraq Government. In the
long run, it is
the people of Iraq who will have to decide
how they will be
governed and by whom. Facilitating
peace talks in
this most uncivil Civil War and helping
provide a safe
zone for civilian refugees, it can be argued,
would best serve
our long-range interests,
But the Obama
Government will make it's decisions
in the short run,
just like the Bush Government did, based
on how best to
sustain oil production and Anglo-American
corporate control
of the biggest share of it.
Listen to the
talking heads on CNN. They do not mention
"OIL".
Why not? What are they afraid of? Instead, they say
that ISIS may
attack America like Al Qida did. (Dick Cheney
is alive and
well!) And they say America has a duty as an
"Exceptional
Nation". (Does that mean Gods talks more
to us?)
"Iraq has always been
about the oil." Keep this in mind now.
This is what
controls our Government's policies and it
probably controls
the destiny of the market now.
I take the
current rise in oil and gas stocks to be based
not only on
higher Crude Prices but the Obama Administration's
latest show of of
loyalty to the interests of the oil and gas industry.
If I am right, we
will soon see the Obama Administration
open up more
off-shore drilling in US coastal waters and not
insist on British
Pete's full compensation for the lingering
costs of its
off-shore mega-drilling disaster.

================================================================
6/12/2014 Still No Peerless Sell.
The decline has been hastened by unexpected
civil strife in Iraq. As long as the US does not
militarily intervene, I doubt if the current bull market
will end. Oil stocks will likely get more of a boost as
the markets adjust to the new uncertainties about the
availablity of Iraq's oil. A hook back upwards by the
Closing Powers of the key ETFs will be a short-term bullish sign.
Examination of the Russell-1000's A/D Line shows
the underlying momentum of the market is still
upwards. Without an orthodox Peerless Sell signal,
any decline following an IP21 break of its 21-day ma
should be limited and shallow.
However, if there is
a further decline, the IP21 may break
its 21-day ma. With the V-Indicator negative as this occurs,
the historical odds back to 1929 are 85% that there will then
be a decline at least to the lower 3% band. Whether or not we get
a Peerless Sell signal, this occurrence is sufficiently bearish to
reduce long positions in over-extended stocks that are not REITs
or Oil/Gas stocks.
> To Key Index and Leading Stock Charts: DJI, SP-500, etc.
Peerless DJI Chart SPY Chart NASDAQ Chart QQQ
Chart
IBB Chart IWM Chart
Hourly
DJI-OBV Hourly-MVM0735 FAS-3x Financials IBB-Biotechs
--> 53
-34 MAXCP stocks Bullish MAXCP Stocks
(6/12/2014) Bullish plurality
--> 39 +19
MINCP stocks Bearish MINCP Stocks (6/12/2014)
--> 33 -6 New Highs on NASDAQ 6 -2 new
lows. Bullish plurality
--> 48
New Highs on NYSE 10
new lows. Bullish plurality
ERROR: I mistakenly said this might produce a Peerless Sell "S5".
In fact, it may well produce a Sell "S4". Regardless of what we
name this occurrence, it has a reliably bearish June track record,
as you can see below.
New Research:
How serious would a drop by the current Accumulation
Index (IP21) below its 21-day ma in the next few trading
days?
We can best answer that in advance. I think, by looking at
similar June IP21 trendbreaks (drops below its 21-dma),
paying special attention to cases where the internal
strength readings are like those now, especially where
the V-Indicator is negative as now.
There have been 39 June IP21 breakdowns since 1929.
I rate 71.8% (28) of the subsequent outcomes as being (red)
bearish. By this I mean the DJi fell at least to the lower 3%
band without rallying more than 5% first.
More relevant, I think, there have been 20
such breakdowns
with the V-I indicator in (red) negative territory. Of these
85% (17 ) were followed by bearish (red) outcomes. Nor
should
we worry if the DJI is as much as 1% below the 21-dma when
this IP21 break occurs. We should still do some selling.
There were 7 instances where the LA/MA (DJI close divided by 21-dma)
was below 1.0. In 6 of the 7 cases like this, a bearish outcome followed.
These cases are highlighted with Green LA/MA numbers.
Current DJI's Key Peerless ValuesDate LA/MA P^^ IP21 V-I OPct 65-dpct
6/12/2014 1.003 269 .114 -12 .324 .023
     IP21 Breakdowns below TISI in June.

       Subsequent declines are shown in RED.
       Negative internal strength readings are shown in red.
       DJI below its 21-day ma are shown in pink.

Date        LA/MA  P^^     IP21  V-I  OPct  65-dpct  Outcome
--------------------------------------------------------------------------
6/13/1933   1.081 1402     .111  772  .326   .805   94.8 to 88.7 and then up.
----------------------------------------------------------------------------
6/27/1933   1.057  671     .069  247  .292   .704   DJI rallied 98.7 to 108.7
-----------------------------------------------------------------------------
6/20/1934   1.024  -13    -.036  -17  .265  -.015   98.3 to  85.5
-----------------------------------------------------------------------------
6/24/1935   1.035  165    -.024  -76  .069   .203   DJI rallied 120 to 134.1
-----------------------------------------------------------------------------
6/18/1936   1.031  233    -.058   22  .337   .01    DJI rallied 157.4 to 169.1
------------------------------------------------------------------------------

6/23/1939   1.001   81     .047    -5  .418  -.016   137.4 to 130.1
------------------------------------------------------------------------------
6/19/1942   1.018  298     .090   24  .111   .034   104.8 to 102.7 then to 108.9
--------------------------------------------------------------------------------
6/4/1943    1.020   40     .085   -83  .173   .094   142.3 to 138.8 to 145.8
--------------------------------------------------------------------------------
6/16/1943    .995  133     .106  -29  .291   .070   DJI rallied 139.8 to 145.8
                                                    then to 134.0
--------------------------------------------------------------------------------
6/18/1945   1.00   239     .009    9 -.158   .052   166.9 to 160.9
----------------------------------------------------------------------------

6/27/1945   1.007  299     .016   28  .035   .108   168.8 to 160.9
--------------------------------------------------------------------------------
6/11/1946   1.001    1     .143    -55  .228   .079   209.1 to 163.1
----------------------------------------------------------------------------
6/9/1948    1.017  375     .162  119  .354   .148   192.6 to 176.0
--------------------------------------------------------------------------------
6/14/1950   1.001   17     .121   -94  .316   .099   223.3 to 197.5
---------------------------------------------------------------------------
6/27/1955   1.027  199     .062  -17  .664   .085  DJI rose 449.9 to 467.4
---------------------------------------------------------------------------

6/7/1957    1.006  -69     .035  -191  .098   .064  505.6 to 520.2 to 423.1
-------------------------------------------------------------------------------
6/17/1957   1.016 -149     .024  -247  .08    .082  513.2 to 520.2 to 423.1
--------------------------------------------------------------------------
6/16/1958   1.014  441     .039  177  .188   .038  DJI rallied very strongly.
--------------------------------------------------------------------------- ---
6/3/1959    1.02    13     .068 -196  .461   .084  678.1 to 616.5
-------------------------------------------------------------------------------
6/16/1960   1.02    88     .012 -158  .300   .058  648.3 to 601.7
----------------------------------------------------------------------------

6/27/1960      .999    67     .030 -172  .167   .029  642.4 to 601.7
-------------------------------------------------------------------------------
6/7/1963     .999   106     .042 -181  -.111   .081 722.4 to 688.7
-------------------------------------------------------------------------------
6/12/1978   1.009  136    -.008   2    .225   .142  856.72 to 805.79
-------------------------------------------------------------------------------
6/3/1980    1.015  401     .077   3    .273  -.023 DJI rallied strongly from
                                                   bear mkt bottom.
------------------------------------------------------------------------------
6/17/1980   1.027  443     .116   5    .452   .083 DJI rallied strongly.
----------------------------------------------------------------------------

6/23/1983   1.018   61     .051   1    .168   .105 1241.79 to 1189.90
---------------------------------------------------------------------------
6/25/1986   1.01   -91     .109      -2    .089   .057 1885.05 to 1766.87
--------------------------------------------------------------------------- --
6/27/1988   1.009  259     .122   20    .154   .041 2108.46 to 1989.33
---------------------------------------------------------------------------
6/14/1989   1.004  231     .105   13   .312   .085 2503.36 to 2440.06 then up.
------------------------------------------------------------------------------
6/7/1990    1.017  295     .119   19   .230   .082 2897.93 to 2999.75 to 2365.1
----------------------------------------------------------------------------

6/7/1995    1.009 184      .124    5   .327   .116 DJI rose 4462.03 to 4732.77
-------------------------------------------------------------------------------
6/26/1995   1.014 121      .114    5   .157   .113 DJI rose 4551.25 to 4732.77
-------------------------------------------------------------------------------
6/23/1996   1.011 428      .086   27   .275   .114 DJI rose 7604.26 to 8259.31
---------------------------------------------------------------------------- --
6/25/1999     .989 -45     -.012    -49    .044   .091 DJI rose 10552.55 to 11194
------------------------------------------------------------------------------
6/12/2000    .993  85     -.022     -38  -.004   .055 10564.21 to 10376.12
----------------------------------------------------------------------------
--
6/13/2001     .982 148      .057   -79   .189   .064 10871.62 to 8235.81
------------------------------------------------------------------------------
6/20/2003   1.022 476      .100  106   .54    .113 9200.75 to 8985.44 and then up.
----------------------------------------------------------------------------
6/3/2009    1.027 205      .008   -96  -.018   .282 8675.24 to 8183.17
--------------------------------------------------------------------------------
6/17/2009     .99  64      -.003   -150 -.033   .177 8497.18 to 8183.17
----------------------------------------------------------------------------
|
================================================================
6/11/2014 Still No Peerless Sell. Breadth was not
very bad today. The decline was almost entirely at
the Opening. That is ususually not the way a big decline
begins.
The SPY's blue Closing Power is above its uptrendline and all its main
indicators are considered "Bullish" by the Tiger charting program.
The DJI's Current
Accumulation Index (IP21)
is still above its 21-day ma. So, no Sell S5. But
now we also have to worry about a Sell S9V if a rally
above 17000 should occur; the V-I is now -.2. And eventually,
the Peerless P-Indicator (based on the A/D Line)
will turn negative. That would then bring a Sell S19
(or old S9B, using the pre-2014 parlance.)
More Sell S5 Research
Since 1928 there have been 4
Sell S5s in June after the 11th
when the DJI was not in a bear market. All four ended
up being profitable for the short seller. None occurred after
.1978, however. You can see these four charts below.
Conclusion
With the Hourly DJI's OBV or DISI line still uptrending, I
doubt
if we will get a Sell S5 tomorrow. In addition, the other internal
strength indicators may still be too positive to produce a Sell S5.
I could not produce an S5 tonight by dummying in hypothetical numbers
representing a steep decline tomorrow back to 16500. Still,
considering last night's study of IP21 peaks below .20, etc which showed how
reliably bearish breaks in the IP21's 21-day ma then have been,
I would certainly do some selling in over-extended stocks if that should
occur later in the week.
> To
Key Index and Leading Stock Charts: DJI, SP-500, etc.
Peerless DJI Chart SPY Chart NASDAQ Chart QQQ
Chart
IBB Chart IWM Chart
Hourly
DJI-OBV Hourly-MVM0735 FAS-3x Financials IBB-Biotechs
--> 87
-13 MAXCP stocks Bullish MAXCP Stocks
(6/11/2014) Bullish plurality
--> 20 -12
MINCP stocks Bearish MINCP Stocks (6/11/2014)
--> 39 -11 New Highs on NASDAQ 8 +1 new
lows. Bullish plurality
--> 47
-40 New Highs on NYSE 7 +1 new lows. Bullish plurality
Since 1965 the DJI has a slight tendency
to rise for the next
week
(53.2% probability), but only a 46.8% probability over the
next
two months.
June Peerless Sell Signals after the 11th of the
Month in Rising Markets
Two of the 12 would have brought a loss if
the DJI has been sold short.
Only
one would have brought a trading gain of more than 10%. The
median subsequent decline was only about 5%. 1 19290614 S9 313.7 -.047
19290617 S12 319.3 -.029
 2            19340619       S5             99            .098
              19340620       S9             98.3          .092
           (The DJI here was in an intermediate-term doowntrend.)
3 19480615 S2 193.2 .05
4 19500612 S5 228.4 .091
5 19750623 S18 864.83 .054
6 19760621 S5 1007.45 .047
7 19780606 S5 866.51 .05
8 19810615 S12 1011.99 .172
 9           19870610      S8             2353.61       -.039
             19870618      S8             2408.13      -.016
 10          20100616      S9             10409.46      .061
             20100616      S12            10409.46      .061
 11          20110630      S12            12414.34      .075

 12          20130604      S19            15177.54      .027
|
================================================================
6/10/2014 Still No
Peerless Sell. The A/D Line NC
today is short-term bearish. Watch NYSE breadth and
the DJI's Accum. Index. New Research Tonight
Warns Us That A Peerless Sell S5 Could Be Setting Up.
New research tonight shows that for
the past 30 years it has always
been bearish when the current DJI's Accumulation Index (IP21) for the
DJI peaks in June below .200 when the DJI is not more than 1.9% over
the 21-day ma. See the study below tonight. The conditions just mentioned
are highlighted in pink. Bearish outcomes are shown in red in the table.
These "pink" conditions all were applicable on the recent high of the IP21
indicator.
In addition, today the DJI made a very nominal new high with the
NYSE A/D Line lagging. By itself, this is only a mild warning sign.
Our way of knowing that an IP21 top has probably been made is for
the IP21 to fall clearly below its 21-day ma. That has not happened yet.
With the DJI up more than 10% in the last 3 months, it is quite possible
that we will see a reversing Peerless Sell S5 if the IP21 falls back below
its 21-day ma. Sell S5 signals are based on this concept. They average
8.7% DJI declines. Paper losses are usually very small. (More tomorrow
night).
30 Years' Peak IP21
Readings and Their Aftermath
Date IP21 Peak
CL/MA Outcome
--------------------------------------------------------------------------------
6/9/2014 .168
1.017
?
11/6/2014 .218
1.02
2 more
months' rally ahead
5/20/2013 .199
1.024
Top. Start of
5% decline was one week away.
7/3/2012 .235
1.026
3 more months'
rally ahead
2/22/2011 .223
1.007
Top. Start of
5% decline immediately.
8/4/2010 .294
1.031
Immediate top. 6%
decline.
8/5/2009 .303
1.050
5 more months'
rally ahead.
5/16/2008 .124
1.008 Major top.
4/17/2007 .223
1.024
3 more months'
rally left in bull market.
10/31/2006 .207
1.009
3.5 more
months' rally before decline to lower band.
5/27/2005 .187
1.017
two weeks'
more rise before decline to lower band
and 5-month trading range.
9/8/22004 .172
1.021
Top. DJI
about to decline to lower band.
6/23/2004 .166 1.018
Top. DJI about to decline to lower band.
9/4/2003 .214
1.026
Top. DJI
about to decline to lower band.
6/18/2003 .158
1.039
Top. DJI
about to decline to 2.5% lower band.
4/2/2003 .252
1.034
Beginning of bull
market.
11/7/2002 .256
1.03
Two
weeks before top and 20% final decline in bear market.
8/21/2002 .302
1.044
Top in bear
market. DJI failed to surpass 65-dma.
20% decline.
3/11/2002 .124
1.046
Top before
bear market resumes.
10/25/2001 .248
1.032
Top before brief
decline to 3% lower band.
5/4/2001 .203
1.048
Two weeks
before bear market resumes.
8/29/2000 .111
1.019 A week's rally before 12% DJI decline.
9/9/1999 .106
1.004
Top before 9%
DJI decline.
5/3/1999 .125
1.049 A week's
rally before DJI decline to lower band.
3/12/1998 .194
1.02
Five
weeks before DJI decline to lower band.
5/12/1997 .225
1.057
3 months' rally before
top that brought 13.5% decline.
2/14/1996 .41
1.039 DJI went
sidewise for 3 months before bull market resumed.
7/27/1995 .160
1.015
Top and 3% retreat before bull market resumed.
6/14/1994 .182
1.016 Top before decline to lower band.
1/31/1994 .195
1.028
Top before 11% DJI
decline.
9/17/1993 .164
.996 Immediate 3%
DJI decline followed by bull market.
8/5/1992 .116
1.008 Top before 7% decline.
2/13/1991 .303
1.068
DJI rose for 2 more
weeks and then went sidewise
6/4/1990
.216 1.04
5 more
weeks before top and start of bear market..
7/31/1989 .226
1.044
2.5 months' rally before decline to lower band.
10/21/1988 .253
1.027
Top before decline
to lower band.
6/22/1988
.202
1.042
Top before decline to
lower band.
8/20/1987 .268
1.041
Top before steep
37% bear market.
4/6/1987 .187
1.039 Top before decline
to lower band.
9/4/1986 .260
1.032
Top before 9%
decline.
6/6/1986
.207 1.034
Top before 7% decline.
2/21/1986 .292
1.058
Six weeks's rally before
decline to lower band.
11/22/1986 .241
1.038
Early in
bull-market take-off
7/22/1985 .198
1.016
Top before 5% decline
8/3/1984 .169
1.075
2 more weeks' rally before top
and decline to lower band.
5/5/1983 .228
1.031
Top before decline to
lower band.
> To Key Index and
Leading Stock Charts: DJI, SP-500, etc.
Peerless DJI Chart SPY Chart NASDAQ Chart QQQ
Chart
IBB Chart IWM Chart
Hourly
DJI-OBV Hourly-MVM0735 FAS-3x Financials IBB-Biotechs
--> 100
-23 MAXCP stocks Bullish MAXCP Stocks
(6/10/2014) Bullish plurality
--> 32 +6
MINCP stocks Bearish MINCP Stocks (6/10/2014)
--> 50 -53
New
Highs on NASDAQ 7
+3 new lows. Bullish plurality
--> 87
-60 New Highs on NYSE 6 +2 new lows. Bullish plurality.
================================================================
6/9/2014
Still No Peerless Sell.
__________________________________
Special
Notice to Tiger Data users:
Server problems tonight do not
allow me
to change the date on the Data
Page even
though all data has been added. Until
further please notice use
http://www.tigersoft.com/NEW114411/index.html
__________________________________
> To Key Index and
Leading Stock Charts: DJI, SP-500, etc.
Peerless DJI Chart SPY Chart NASDAQ Chart QQQ
Chart
IBB Chart IWM Chart
Hourly
DJI-OBV Hourly-MVM0735 FAS-3x Financials IBB-Biotechs
--> 123 -30
MAXCP stocks Bullish MAXCP Stocks
(6/9/2014) Bullish plurality
--> 26 -5
MINCP stocks Bearish MINCP Stocks (6/9/2014)
Mostly
bearish ETFs look good enough to short!
--> 103 -9
New
Highs on NASDAQ 4
-7 new lows. Bullish plurality
--> 147 New Highs on NYSE 4 new lows.
Bullish
plurality
As the
market rallies, it is only natural to consider when we might want
to take
profits. Here are the technical developments that we would
have to be
concerned about.
#1 The NYSE
A/D Line is rising strongly. Its advance is pushed upwards
by the many
dividend stocks and bond funds on the NYSE. Given the
FED's emphasis on
"transparency" and predictability, I think we can
safely bet that
there will be no untoward FED surprises until the NYSE
A/D Line uptrend
is broken.
#2 The
failure now of the NASDAQ to confirm the new highs made
by the DJI,
SP-500, NYSE and OEX. This would be a warning that
we will
have to continue to carefully limit the stocks we may want
to play on
the long side and focus rather exclusively on the dividend-rich
REITS,
oil/gas drilling and a few semi-conductor stocks that have
been
resiging in our Bullish MAXCP stocks.
#3
and #4 We must watch the V-Indicator and the current Accumulation
Index. Negative readings with the DJI 2.5% over the 21-day ma could
bring
a Sell S9V. Right now, the V-Indicator is positive and rising.
A
drop by the DJI's IP21 Indicator back below its 21-day ma could
bring
a Sell S4 signal. These are as bearish as Sell S9Vs are. The
IP21
(current Accumulation Index) is currently considerbly above this
IP21
21-day ma (which we call the "DISI").
5)
Though the IP21 readings for the NASDAQ and SP-500 are making
12-month highs and are way above +.40, the DJI's IP21, which is what
we
track the most, has not yet reached the +.30, or so, levels that
usually have allowed a "lift-off" in prices in the Summer.
Recent High IP21 Readings and Their Aftermath
Date IP21 Peak
CL/MA Outcome
--------------------------------------------------------------------------------
6/9/2014 .168
1.017
?
11/6/2014 .218
1.02
2 more months in rally ahead
5/20/2013 .199
1.024
Top. Start of 5% decline was one
week away.
7/3/2012 .235
1.026
3 more months in rally ahead
2/22/2011 .223
1.007
Top. Start of 5% decline
immediately.
8/4/2010 .294
1.031
Immediate top. 6% decline.
8/5/2009 .303
1.050
5 more months in rally ahead.
(More on this tomorrow night.)
================================================================
6/6/2014
Peerless Internal Strength Indicators
Remain Bullish.
But will V-Indicator remain positive?
The Very Positive
"IP21" Readings Are Bullish.
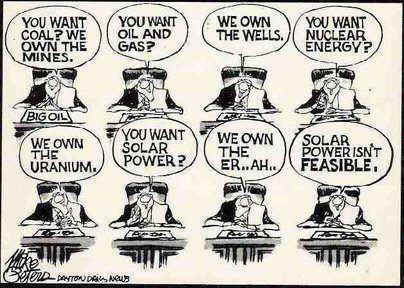
Global Warming
Also Means Cheaper Solar Energy.
Avoid Big
Electric Utilities.
> To Key Index and
Leading Stock Charts: DJI, SP-500, etc.
Peerless DJI Chart SPY Chart NASDAQ Chart QQQ
Chart
IBB Chart IWM Chart
Hourly
DJI-OBV Hourly-MVM0735 FAS-3x Financials IBB-Biotechs
--> 153 +2
MAXCP stocks Bullish MAXCP Stocks
(6/6/2014) Bullish plurality
--> 31 -6
MINCP stocks Bearish MINCP Stocks (6/6/2014)
Many
heavily distributed and shorted stocks remain very weak.
--> 112
New
Highs on NASDAQ 11
-15 new lows. Bullish plurality
--> 216
+100 New Highs on NYSE 6 -4 new lows. Bullish plurality
If the V-I slips back into negative
territory and the DJI rallies to 17000,
we may still get a Sell here. Fortunately, the high IP21 (current Accumulation
Index)
readings of the major market ETFs are in accord with a further advance. It is also
more
bullish that the DJI, OEX and SP-500 made all-time highs, as did the weekly NYSE
A/D Line.
IP21 Technical Condition
---------------------------------------------------------------------------------
DIA
+.29 BOTH UP: Public and Professionals are bullish.
OEX
+.488 BOTH UP: Public and Professionals are bullish.
QQQ
+.412
BOTH UP: Public and Professionals are bullish.
SPY
+.41 BOTH UP: Public and Professionals are bullish.
IWM
+.251 BOTH UP: Public and Professionals are bullish.
FAS
+.41 BOTH UP: Public and Professionals are bullish.
DJIA
Avoid Big Electric Utilities
Reits, oil/gas drilling and
semi-conductors remain the three most favored groups
populating our Bullish MAXCP stocks. Utilities are lagging somewhat for
good reason. Many
analysts
think the electrical utilities will inevitably fade
as
solar power storage comes down in price. The way Arizona and California
electric utilities are fighting the widespread use of solar panels on roof tops
suggests they are very fearful of a trend towards decentralized roof-top energy.
Electric utility stocks in Germany have fallen substantially as solar technology
has been much more widely adopted there. See:
How
Arizona Could Soon TAX Thousands of Residents For Going Solar.
Fight
over Solar Power Returns to White House Roof [Video) Scientific American.
Arizona
Fights for Its Solar Energy Rights
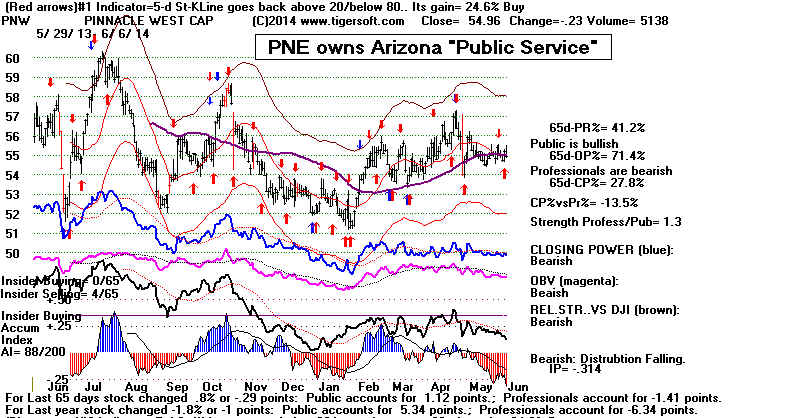
ARIZONA "Public Service" Co stock is not benefitting from the low
interest rates. The trend toward decentralized, roof-based solar energy
will surely take a big toll on electric utilities. The utility company there
considers Arizona's sun is a very threat to its profits and its CEO's pay.
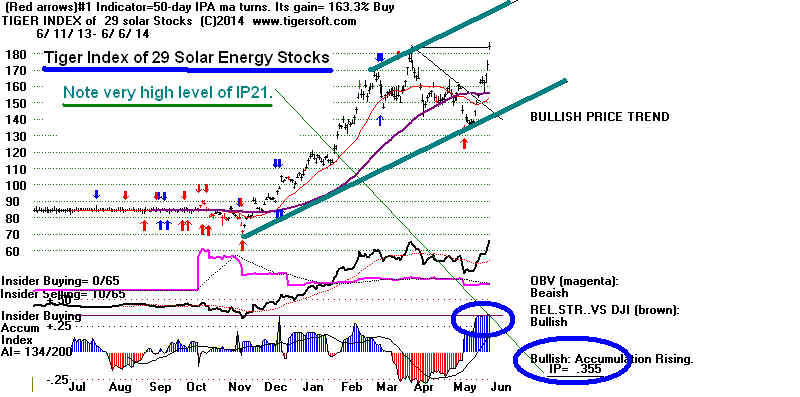
Solar Energy Stocks
Only 41.4% of the Solar Energy stocks are above their 65-dma. But there are
a handful of high
Accumulation stocks in the group showing very high relative
strength and
Closing Power new highs. The SOLAR stocks will be posted
on the Tiger Data
page tomorrow. New Issue ABGB looks great and its country
ETF (Spain) has
just made a breakout with very high Accumulation, too.
 .
.
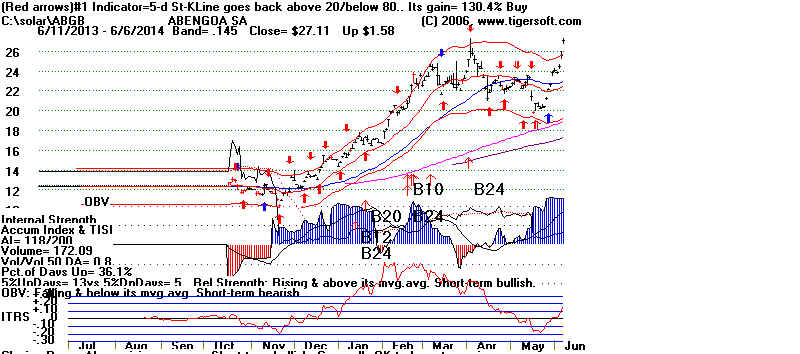
ABGB (Spain) designs
and constructs solar, ethanol, biodiesel, and biomass plants;
power transmission lines; conventional energy plants; and water treatment,
desalination plants, other hydraulic infrastructures, and industrial installations,
as well as provision of operation and maintenance services for conventional
and renewable energy power plants. Spain's ETF now looks quite positive, too.
=================================================================
6/5/2014 Central Bank Interest Rates below 0 in Europe.
High Accumulation and SP-500
Breakout. S9V seems unlikely.
A 1000-point DJI take-off
might be starting. A Peerless Sell seems
not very
close.
This Brings A Clear Breakout by OEX, SP-500 (below), QQQ and
NASDAQ. Shorts taken day or two ago because of
the SP-500's
Rising Wedge patterns should be covered. The V-Indicator
has turned positive and the Accum. Indexes have risen
sharply. REITs and other dividend stocks are in demand.
They
show lots of Accumulation and their Closing Powers are
making new highs.
I
would expect the present stock leadership from REITS, OIL/GAS,
SEMI-CONDUCTORS and BIG MILITARY STOCKS (especially GD)
to
become even more apparent if the market is taking-off here as it did
in
December 2004 or January 1986. For a broad market "take-off" to
occur
now, the NASDAQ will have to play catch up and be stronger than the
the
DJI
Interest Rates
below Zero for European Banks
The European Central Bank will now charge
Euro banks
for
depositing there money with the central bank. The theory
is
that this will give the Euro banks an added incentive to loan
reserves out. But they do not have to. They can just keep the
extra
funds in their vaults, in which case nothing happens.
One
country, Denmark, has tried setting its rates below zero
two
years ago and nothing much happened.
The new
policy in Europe will serve slightly to strengthen the US
Dollar
because the FED could end up getting more deposits made
indirectly
from European banks, as it actually pays big bank a very
small
amount for money they place on deposit with the FED.
As for the US stock market, the new
European policy of negative
interest
rates for big banks there is a big psychological boost for our
dividend-paying stocks, as it seems to put further out into
the future
the prospects of competing higher interest rates in the US.
> To Key Index and
Leading Stock Charts: DJI, SP-500, etc.
Peerless DJI Chart SPY Chart NASDAQ Chart QQQ
Chart
IBB Chart IWM Chart
Hourly
DJI-OBV Hourly-MVM0735 FAS-3x Financials IBB-Biotechs
--> 151 +56
MAXCP stocks Bullish MAXCP Stocks (6/5/2014) Bullish
plurality
--> 37 -34
MINCP stocks Bearish
MINCP Stocks (6/5/2014)
Many
heavily distributed and shorted stocks remain very weak.
--> 51 +15 New Highs on NASDAQ 26 -9 new
lows. Bullish plurality
--> 116
+34 New Highs on NYSE 10 -7 new lows. Bullish plurality
================================================================
6/4/2014
The markets remain divided and dull. The
SP-500's price pattern, a Rising
Wedge, mostly brings
7% declines not upward breakouts
even when Peerless
is on a Buy and breadth is good.
(See last night's Hotline.)
> To
Key Index and Leading Stock Charts: DJI, SP-500, etc.
Peerless DJI Chart SPY Chart NASDAQ Chart QQQ
Chart
IBB Chart IWM Chart
Hourly
DJI-OBV Hourly-MVM0735 FAS-3x Financials IBB-Biotechs
--> 95 +20
MAXCP
stocks Bullish
MAXCP Stocks (6/4/2014) Bullish plurality
--> 71 -40
MINCP stocks Bearish MINCP Stocks (6/4/2014)
Many
heavily distributed and shorted stocks remain very weak.
--> 51 +15 New Highs on NASDAQ 26 -9 new
lows. Bullish plurality
--> 116
+34 New Highs on NYSE 10 -7 new lows. Bullish plurality
Peerless is still on a Buy and the NYSE's
A/D Line uptrend
is intact. But, Bearish MINCP stocks remain unusually
weak.
Many Professionals see their downward moves as offering the
greatest potential for profits now available. Slower-moving
Dividend and REITs contine to be strong. We are seeing a few oil stocks
and semi-conductors making confirmed new highs, but not
enough yet to ignite another leg up in this bull market. The
example of 1986's second half may give us the best sense of what
lies agead. Back then, for six months, the DJI could not breakout
above its rising price channel and the weaker NASDAQ needed
to consolidate until early in 1987 they got back in synch and the
markets rallied 30% in 7 months.
The NASDAQ was lifted by advances of APPL and
the Biotech Index up past its expected resistance but
the SP-500 and DJI are still contained by their wedge
pattern's rising resistance lines.
The DJI (below) is 0.9% over its 21-day ma and shows
a negative V-I at -21. A 1.5% price advance from here that leaves
the V-I negative would probably bring a Sell S9v. For the bulls,
it would be better for the markets to show improving breadth
and volume before there is a breakout.
We also have to watch for a clear break in the A/D Line uptrend-line.
It is well-tested and its break would likely mean the DJI would
breakdown from its rising wedge pattern.
---------------------------------------------------------------------------------------------------------------------
6/3/2014 Do Some Selling and Short Selling
The absence of a Peerless Sell and a recently strong A/D Line should
protect us from a serious "June swoon", but the NASDAQ
could start
falling down from a perfectly symetrical head/shoulder pattern's right
shoulder apex. Moreover, IWM and IBB have dangerously stalled out
at their falling 65-dma. And even the safer OEX
and SP-500 show bearish
rising wedges. Meanwhile, we could be making good money shorting
heavily distributed stocks below their 65-dma that show Closing Power
new lows. If they cannot advance in a rising trend, what will they do
if the market sells off for a month. Even dividend stocks could be hurt
if the 10-year rates continue their short-term rise.
There is much evidence in Arthur Merrill's "Behavior of Prices on Wall
Street" that Junes in the second year of the Presidential cycle produce
sell-off bottoms from which come very good recoveries and Summer rallies.
(More on this in the new Peerless book). Fow the present, we know that
the next 4 weeks produce DJI gains only 46.8% of the time. since 1965.
> To Key Index and
Leading Stock Charts: DJI, SP-500, etc.
Peerless DJI Chart SPY Chart NASDAQ Chart QQQ
Chart
IBB Chart IWM Chart
Hourly
DJI-OBV Hourly-MVM0735 FAS-3x Financials IBB-Biotechs
--> 75 +4
MAXCP stocks Bullish MAXCP Stocks
(6/3/2014)
--> 121 +10
MINCP stocks Bearish MINCP Stocks (6/3/2014) Bearish
plurality
Many
heavily distributed and shorted stocks remain very weak.
--> 36 -4 New Highs on NASDAQ 35 +19 new
lows. Bullish plurality
--> 82
-29 New Highs on NYSE 17 + 3 new lows. Bullish plurality
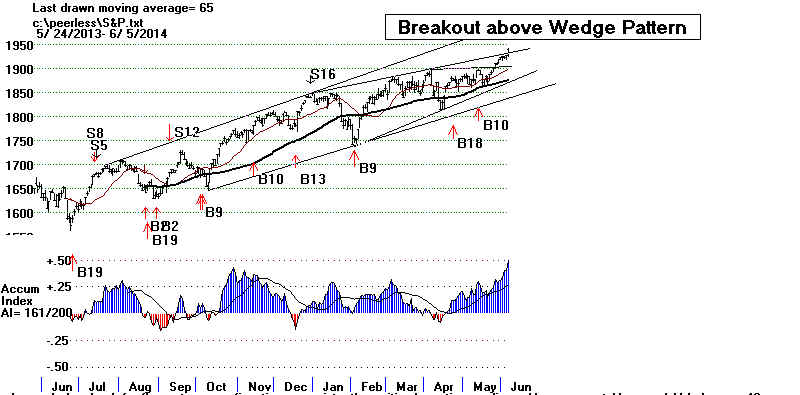
Will SP-500 be able to breakout above its rising
resistance line?
Rising Wedge Patterns in SP-500
usually nring price breakdowns.
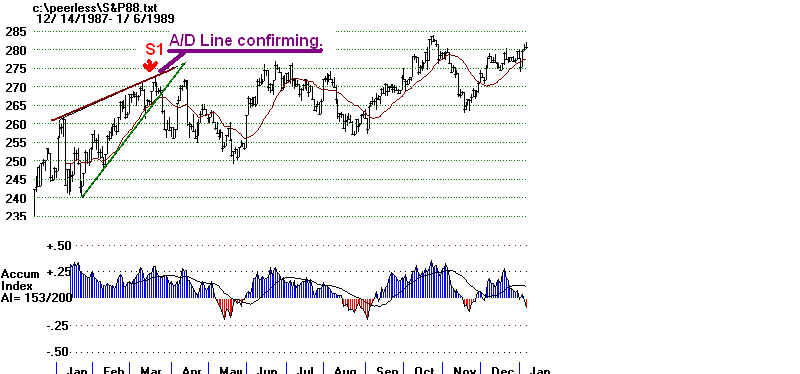
In fact, since 1970 even when A/D Line is strong (confirming)
and there is no Peerless Sell, the odds are still 3:1 against an upside
breakout and in favor of a DJI or SP-500 decline of about 7%.
See the new study below.
Shorting more Bearish MINCP stocks seems the
best
way to play the odds favoring a breakdown
in
the SP-500. Clearly, this is what
Professionals are doing
with stocks breaking down under the pressure of heavy institutional
and insider selling.
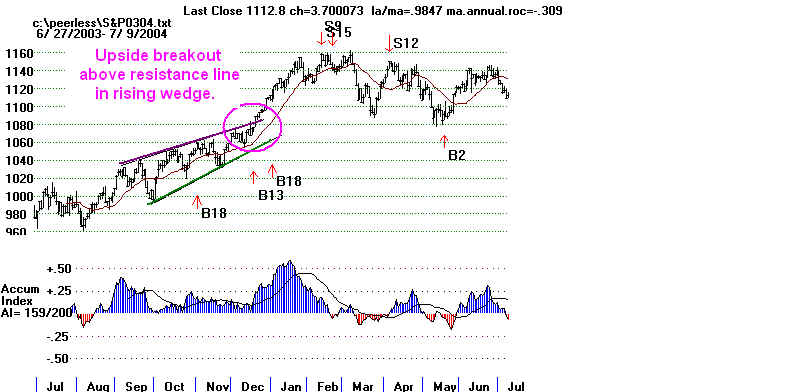
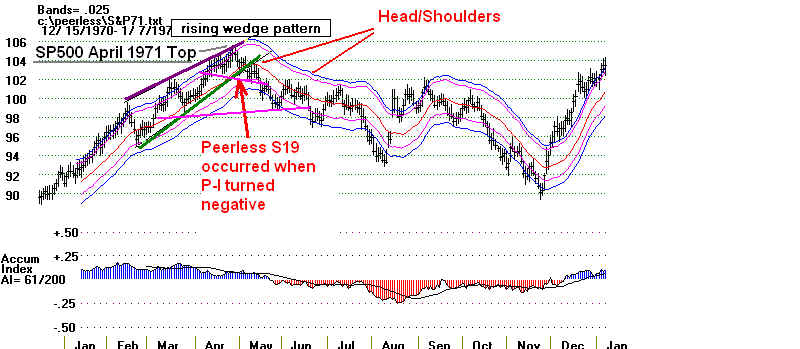
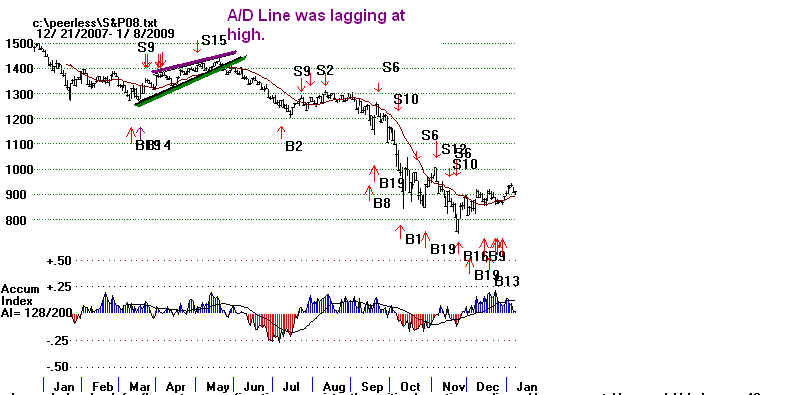
New Study: RISING WEDGE
SP-500 PATTERNS:
1970-2014
An upside breakout is a possibility, as
shown in the breakout of December 2003.
Here the NYSE A/D Line was very strong. Remember that this case occurred
only 9 months after a major bear market bottom. The new bull market then
was relatively young. It also occurred at the start of a new year after a strong
Santa Claus rally.
 |
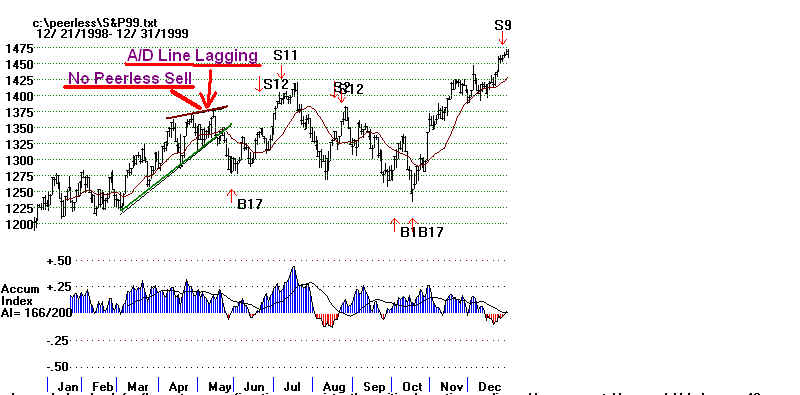
But mostly, breakdowns occur
from rising SP-500 wedge patterns
even when the operative Peerless signal is still a Buy
and the A/D
Line has been strong. Consider the technicals and the attitude of
Peerless in each case of a rising wedge in the SP-500. This pattern
combined with a confirming (strong) A/D Line and no Peerless Sell
has occurred only in 3 cases other than the bullish instance mentioned
above. In each of these other cases the SP-500 declined about 6%-7.5%
and the DJI a little less.
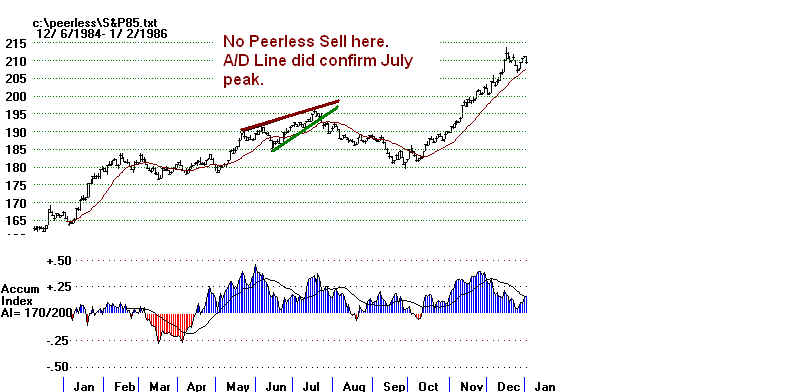
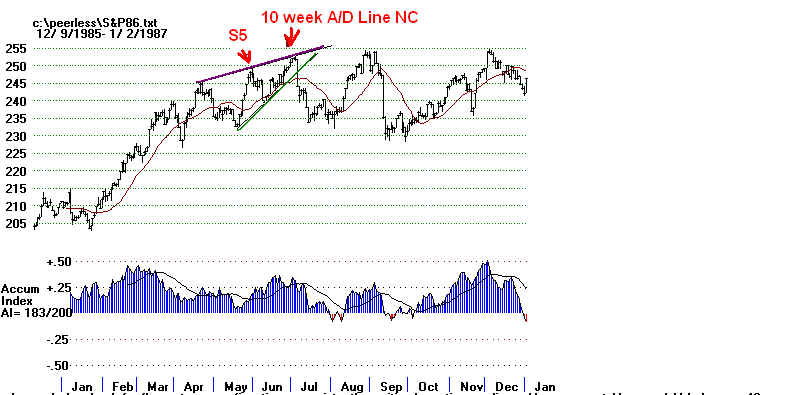
Bearish SP-500 Rising Wedge Patterns
with no Peerless Sell and a Strong A/D Line.
July 1985 7/22/1985 LA/MA = 1.016 V= +.11
5.0% DJI decline
7.5% SP-500 decline from 7/18/85 to 9/25/1985
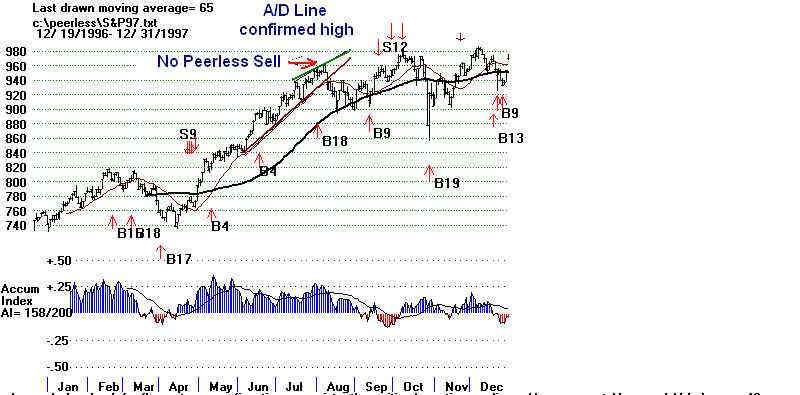
July 1997 7/31/1997 LA/MA=1.027 V= +.32
7.0% DJI decline
6.0% SP-500 decline from 8/6/87 to 8/29/1997
January 2010 1/25/2010 LA/MA = 1.017 V= +.16
7.5% DJI decline
7.5% SP-500 decline from 1/20/2010 to 2/8/2010
Like now, the NYSE A/D Line did confirm
the high here.
 |
Like now, the NYSE A/D Line did confirm
the high here.
 |
Like now, the NYSE A/D Line did confirm
the high here.
 |
 |
Like now, the NYSE A/D Line did confirm the
high here
 |
Like now, the NYSE A/D Line did confirm the high here
 |
 |
 |
Like now, the NYSE A/D Line did confirm the high here
 |
================================================================
6/2/2014
The Dull Slow-Moving Side-wise
Correction
in NASDAQ and many tech stocks continues. Without
a Peerless Sell, what we are seeing now should continue.
The Bearish MINCPs are a lot more numerous and
exciting than most of the Bullish MAXCPs. Small wonder
that Professionals are not playing the long side
as much right now. Shorting some of these Bearish
MINCP stock is recommended for hedging and for profit.
This remains a dividend-stock bull market. Thus, most bullish
REITs
again rallied today.
> To Key Index and
Leading Stock Charts: DJI, SP-500, etc.
Peerless DJI Chart SPY Chart NASDAQ Chart QQQ
Chart
IBB Chart IWM Chart
Hourly
DJI-OBV Hourly-MVM0735 FAS-3x Financials IBB-Biotechs
--> 71 -1
MAXCP stocks Bullish MAXCP Stocks
(6/2/2014)
--> 111 +30
MINCP stocks Bearish MINCP Stocks (6/2/2014) Bearish
plurality
Many
heavily distributed and shorted stocks remain very weak.
--> 40 +2 New Highs on NASDAQ 16 +6 new lows. Bullish plurality
--> 111
+6 New Highs on NYSE 14 + 2 new lows. Bullish plurality
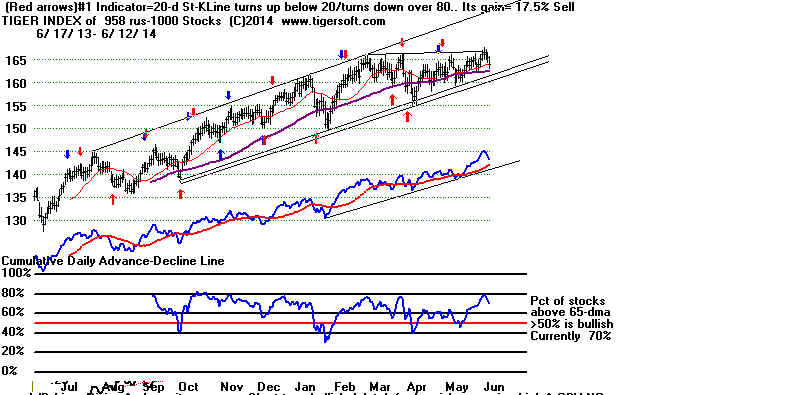
Today the dividend Stocks' grinding advance of late
was hurt somewhat by higher 10-year bond rates. Without
much momentum or volume, the overhead resistance
levels stopped many stocks not in SP-500 or DJI. See
below how the Tiger Index of the Russell-1000 has
held up well but still is unable to make a breakout past
its flat resistance. The steady uptrend of its A/D Line is
distincly bullish even as many of leading stocks and ETFs
we follow each night show uninspired Closing Power recoveries.
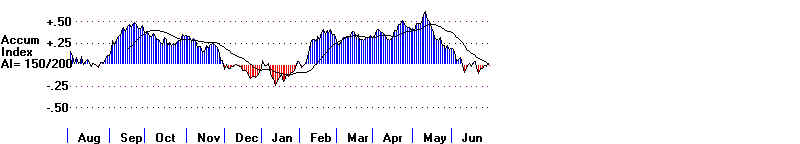
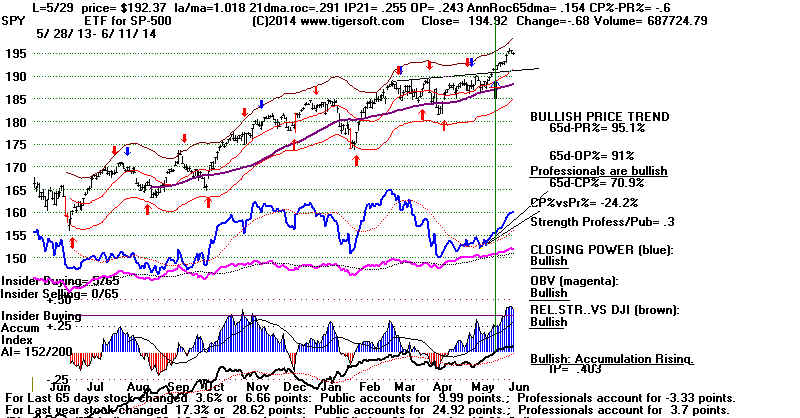
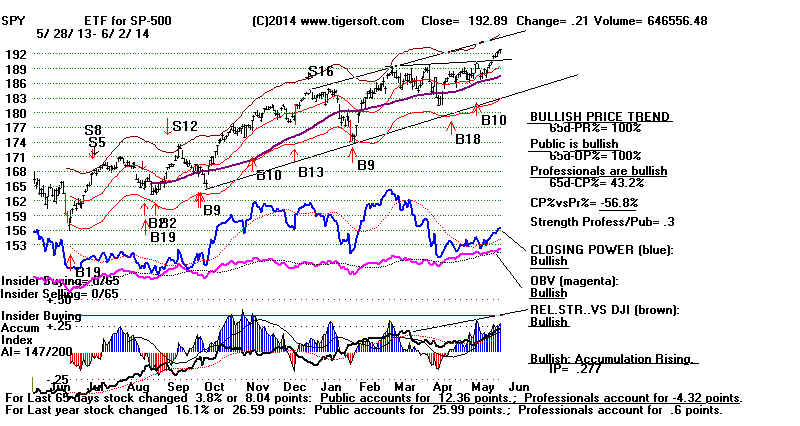
Peerless Signals on SP-500 ETF. Note bullish Accumulation
despite
lagging (blue) Closing Power. Professional wariness
(weak
CP%-Pr%) more than heavy institutional selling
(which
red and negative IP21 would show) is probably
the
biggest deterrent to a good rally now. The Accumulation
Index
readings on most of our indexes and ETFs are still quite positive.
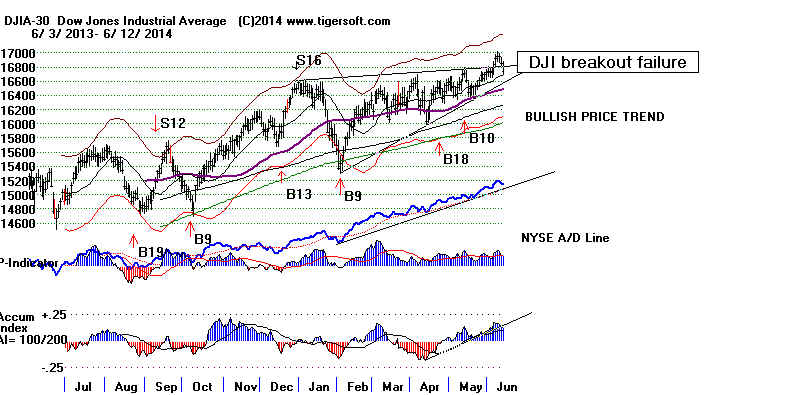
The DJI and SP-500's
Advance today was not confirmed by a corresponding
rise in NYSE A/D Line.
In the last six months this simple divergence
has tended to bring small retreats. Bigger, longer, more obvious NCs
(non-confirmations)
are needed to bring declines to the lower band and Peerless Sells. Note that
the DJI is now 1.0% over its 21-day ma. It's V-I remains negative, at -21. So,
any 1.5% DJI jump up from here would likely bring a Sell S9-V.
Seasonally, the rally would
seem to be running out of time. Since 1965, the
DJI has risen 59.6% of the time over the next three trading days, but thereafter
weakness tends to follow for the rest of June. The DJI produced a gain only
44.7% of the time for the 21 trading days after June 2nd.
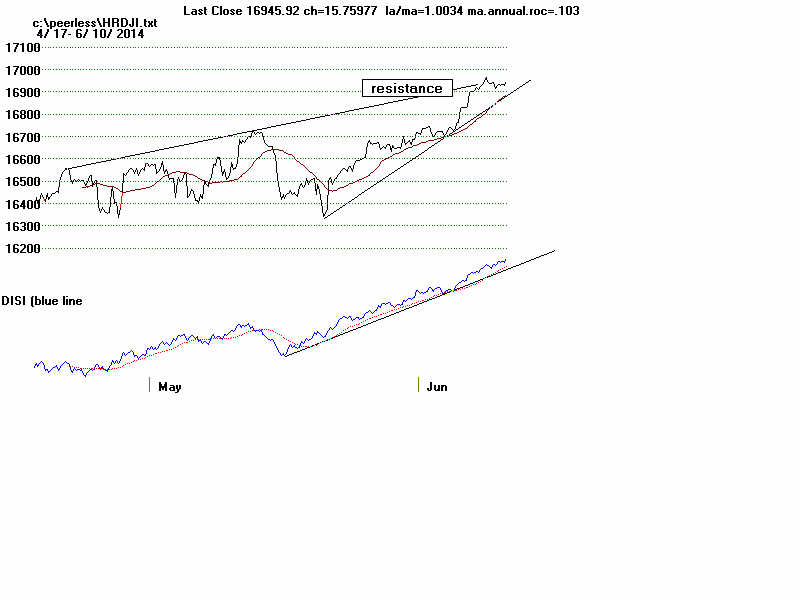
The Hourly DJI does show a steady uptrend
with confirming DISI (OBV).
A break in this uptrend will
likely bring a sell-off back to 16600. Because of
the absence of Peerless sells and still strongly uptrending A/D Line, 16600
will probably hold.
QQQ was again unable to make a new
high. Biotech IBB and
IWM (Russell-2000( retreated from 65-dma. The NASDAQ
has stalled at the resistance created by the left shoulder
apex of a potential head/shoulders pattern.
================================================================
5/30/2014
NYSE A/D Line keeps rising.
No Peerless Sell.
Only A Shallow Retreat Seems Likely.
The FED
has chosen not to risk a decline of more than 10%. They remain intent
on bolstering the market and thereby the economy as best they can with 10-year interest
rates below 3%. European interest rates and gold prices keep falling, so the Dollar
seems safe in their opinion and rates can be kept low without fear of inflation for now
Low rates keep the interest on the national Debt down. They also reflect a very
anemic economic recovery. So, history shows that 10-year rates could gradually
rise even to 4.5% without causing a market debacle.
But
resistance levels have been reached temporarily for the:
1) NASDAQ (the level that matches the apex of a potential
head/shoulder's right shoulder),
2) QQQ (the previous 12 month high),
3) Biotech's IBB (its falling 65-dma),
4) Russell-2000 (its falling 50-day ma) and
5) SP-500 (its 4x-tested resistance line starting in December
in a normally bearish
rising wedge pattern.
This means prices could turn down or breakout and run upwards a little more
Our target for the DJI would only be 16900 on such a move if
the V-Indicator
remains negative.
SP-500 New Highs but Rising Prices
Now Face Rising Wedge Pattern's Resistance.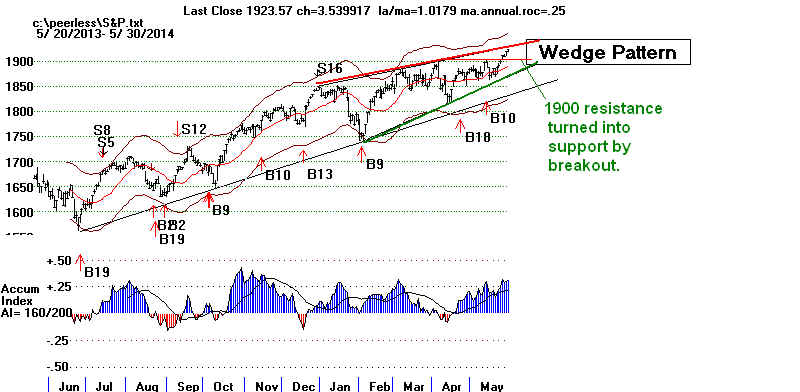
Government policies rather than a strong economy are creating the stocks' biggest
winners,
such as the big dividend plays like REITs and LNG, the liquefied natural gas exporter to
Europe.
See the classic flat topped breakout which LNG (below) just made, complete with red high
volume and an AI/200 above 146 and a current IP21 above +.375. Our research for
1900-2006 and since 2009 show stocks with internal strength readings above these
thresholds make very good 6-12 month investment plays, averaging +36% simply held
for a year. LNG's run is easy to understand. Russia's natural gas
contract with China puts
pressure on gas-fired European utilities to obtain liquefied natural gas by tanker from
the
US. Climate change may also make Europe colder if the Gulf Stream's warn currents
are
affected. Climate change will likely make summers much hotter, too. If so,
air conditioner and
electric use will jump up there and in the US. That could increase natural gas
prices
despite high production. But so far, natural gas price ETFs are below their
65-dma.
So, LNG is the best technical play now among oil and gas stocks. The best of these
may well continue to rise even if a bear market starts for the DJI, SP-500 and
NASDAQ.
I remember that was true in 1973, 1977, 1998, 2000and 2008, but not so in the crashes of
1987 and the second halves of 2002 and 2008.

Speaking of climate change, our favorite de-salinization stock, LIQT,
jumped 20%
this past week. I will keep posting it here each night. It has a number of bearish
posters on Yahoo. Right now,
Professionals and Insider are bullish, as judged
by our primary technical indicators. I would suggest always trusting our technical
tools more than the negative comments left on Yahoo by anonymous short-sellers.
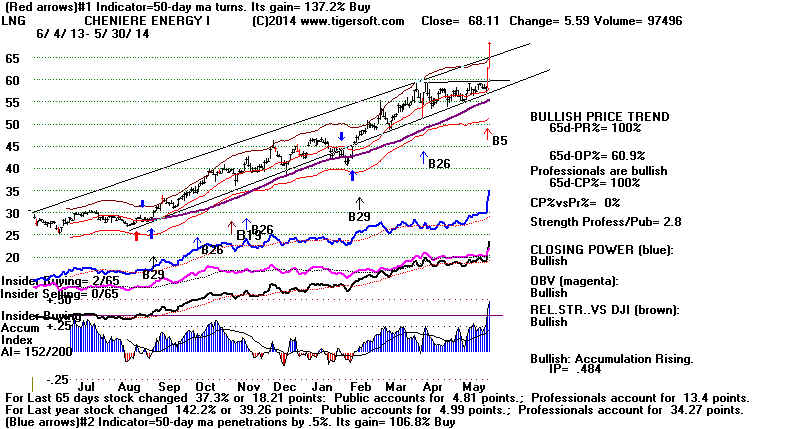
Similarly, government controls are breaking certain stocks down. Nowhere is
is this clearer than in controls on carbon dioxide. WLT
looks technically like it will go to
zero. We have been posting WLT on the Bearish MINCP list for more than
a year. Back then it was above 40. Coal prices have just broken down badly
with confirming red Distribution. See KOL below.
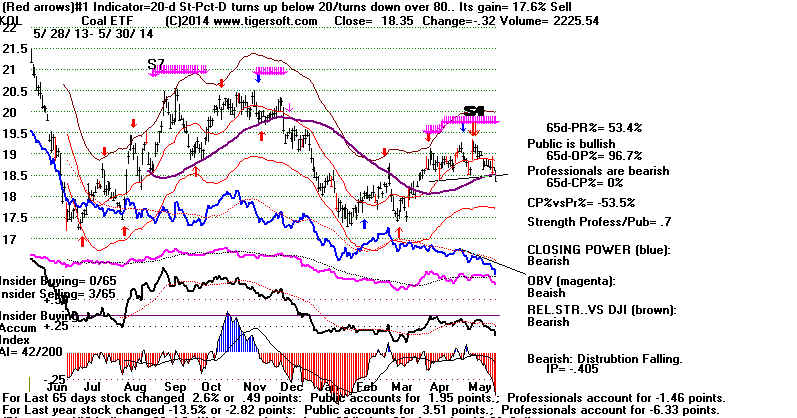
Otherwise, most other stocks are in need of digesting very big gains since the last 10%+
correction,
the 17% correction from April to October 2011, more than 30 months ago. Of
course, the
DJI can occasionally rise longer without a 10% correction from highest closings to lowest
closing.
That has happened 8 times since 1914. Looking at these 8 cases (shown in blue) we
see that
1946 was the only case which did not show obvious technical non--confirmations. In 3
of the 8 cases,
the DJI subsequently fell 11%, in 5 cases it crashed more than 20% and in 2 instances it
fell
about 17%.
LONGEST DJI RALLIES WITHOUT MORE THAN A 10% CORRECTION:
1915-2014
Bottom Top
Peerless Sells and Bearish Divergences
Consequence
Oct 1926 - Sept 1929 35 months
S7, S9, S12 and A/D Line, NNCs by P-I, IP21 and V-I
Crash
Sept 1934 - April 1936 - 19 months A/D
Line NC, S9, S12
11% decline
Nov 1943 - May 1946 - 31 months
Sell S4, S5 plus Head/Shoulders
23% decline
Sept 1953 - Aug 1956 - 35 months
Sell S2, A/D Line NC
11% decline
Dec 1957 - Jan 1960 - 25 months
Sell S12, A/D Line NC, IP21 and V-I
NNC
17% decline
Oct 1962 - May 1965 - 31 months
Sell S7 also at peak la/ma = 1.017
and V-I= -291 11%
decline
Aug 1982 - Jan 1984 - 17 months
Sell S12 and A/D NV and IP21
and V-I NNC
16% decline
July 1984 - Aug 1987 - 35 months
Sell S4, A.D Line NC at August peak
Crash
Dec 1987 - July 1990 - 31 months
Sell S9, A/D Line NC, NNCs- P-I and
V-I.
21% decline
Oct 1990 - Aug 1997 - 82 months
Sell S12 on 9/29
13.5% decline
Mar 2003 - Oct 2007 - 51 months
Sell S12, A/D Line NC
Crash
Oct 2011 - current - -30 months
> To Key Index and Leading Stock Charts:
DJI, SP-500, etc.
Peerless DJI Chart SPY Chart NASDAQ Chart QQQ
Chart
IBB Chart IWM Chart
Hourly
DJI-OBV Hourly-MVM0735 FAS-3x Financials IBB-Biotechs
--> 72
MAXCP stocks Bullish MAXCP Stocks (5/29/2014)
--> 79
MINCP stocks Bearish MINCP Stocks (5/29/2014) Bearish
plurality
Many
heavily distributed and shorted stocks remain very weak.
--> 39 -9 New Highs on NASDAQ 13 +1 new
lows. Bullish plurality
--> 105
-24 New Highs on NYSE 12 + 5 new lows. Bullish plurality
====================================================================
5/29/2014
NYSE A/D Line keeps rising.
No Peerless Sell.
Only A Shallow Retreat Expected.
The market's
advance continued today, as all the averages moved higher and
there
were more than 1000 up than down on the NYSE. The DJI has still
not
achieved its own breakout. Its rising resistance line through
previous theoretical
highs
crosses at approximately 16820, 122 points higher. That sets up a likely
objective for the current advance. Note how the Hourly
DJI's OBV (DISI) Line is
bullishly outpacing DJI prices and is still in an uptrend.
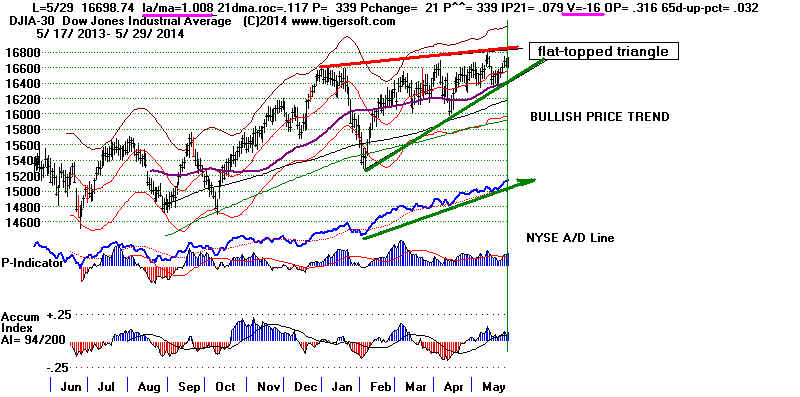
Without the DJI making a new closing high with it more than 2.5% over
the
21-day ma, it is highly unlikely Peerless will give a Sell signal. Since the
DJI
is only 0.8% over the 21-day ma, a Peerless Sell is two trading
days
away at a minimum. We must watch the Peerless V-Indicator.
It
now stands at -16. If it remains negative when the DJI reaches the
2.5%
upper band, we will almost certainly see a Sell S9V.
The
Stochastic-5-Ks for the DIA, SPY,
QQQ, IWM, IBB have each reached
levels above 90. A short-term pullback is therefore likely. But will probably
not
derail the current uptrend. Seasonality is still bullish for the next
two
weeks. Since 1965, the DJI has risen 61.7% of the time over this period
and
has averaged a gain of +.7%.
Why The A/D Liue's Strength Matters So Much
Peerless remains bullish. Since 1928 there has been only one important
major
top - the one in late 1976 - that occurred with the A/D Line as
strong as we see now. We do have to watch the DJI, however, in case it
forms
a head/shoulders pattern. These can bring major declines even when
the
last DJI high was confirmed by the A/D Line.
The
three major tops occurring with a confirming A/D Line at the last high
are
1946 (h/s), 1971 (h/s) and 1976 (9 months' of repeated failures to surpass
DJI-1000.) See their charts below.
1946 Head/Shoulders
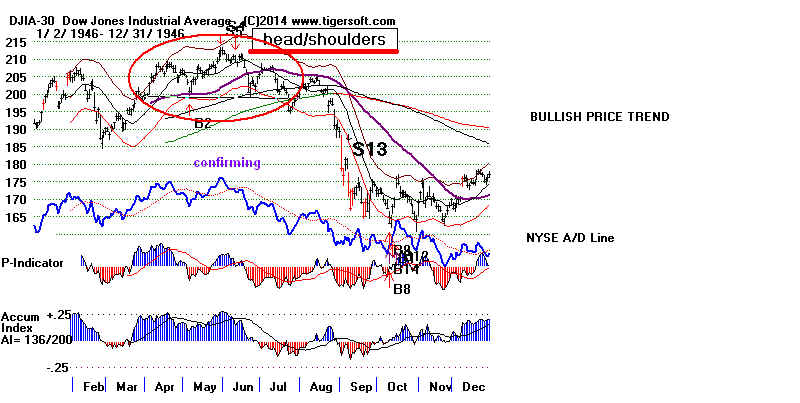
1971 Head/Shoulders
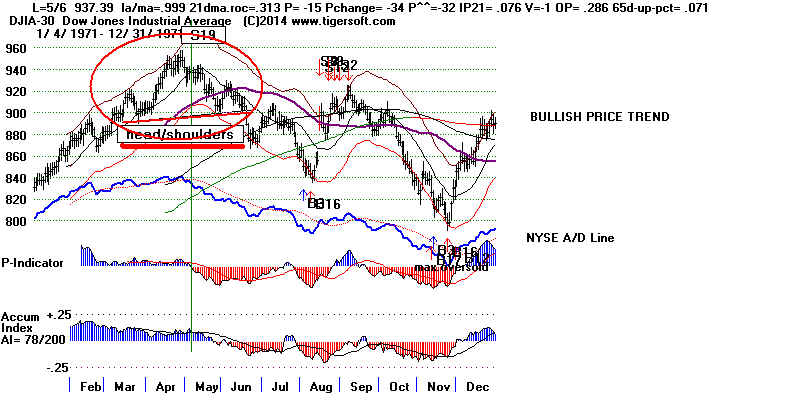
1977 Top
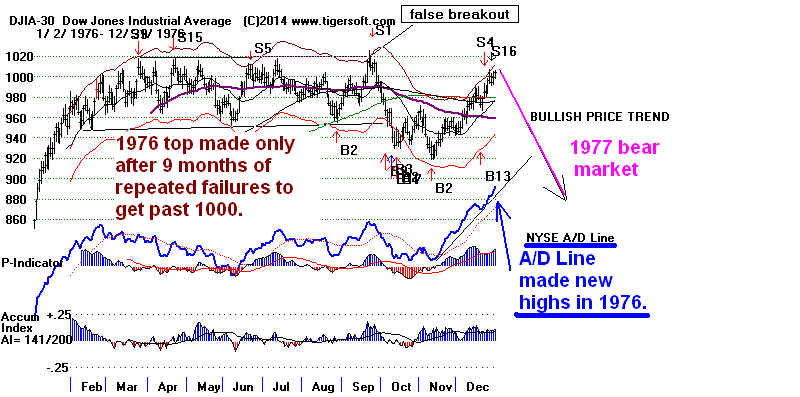
> To
Key Index and Leading Stock Charts: DJI, SP-500, etc.
Peerless DJI Chart SPY Chart NASDAQ Chart QQQ
Chart
IBB Chart IWM Chart
Hourly
DJI-OBV Hourly-MVM0735 FAS-3x Financials IBB-Biotechs
--> 60 +6
MAXCP stocks Bullish MAXCP Stocks (5/29/2014)
--> 71 -2
MINCP stocks Bearish MINCP Stocks (5/29/2014) Bearish
plurality
Many
heavily distributed and shorted stocks remain very weak.
--> 48 +17 New Highs on NASDAQ 12 new
lows. Bullish plurality
--> 129
New Highs on NYSE 7 -12 new lows. Bullish plurality
----------------------------------------------------------------------------------------------------------------------------
OLDER HOTLINES
----------------------------------------------------------------------------------------------------------------------------
5/28/2014 NYSE A/D Line
keeps rising.
No Peerless Sell.
Shallow Retreat Expected.
> To Key Index and
Leading Stock Charts: DJI, SP-500, etc.
Peerless DJI Chart SPY Chart NASDAQ Chart QQQ
Chart
IBB Chart IWM Chart
Hourly
DJI-OBV Hourly-MVM0735 FAS-3x Financials IBB-Biotechs
--> 54 -9
MAXCP stocks Bullish MAXCP Stocks (5/28/2014)
--> 73 +15 MINCP stocks Bearish MINCP Stocks (5/28/2014)
Bearish plurality
Many
heavily distributed and shorted stocks remain very weak.
--> 31 -36 New Highs on NASDAQ 12 -2 new lows. Bullish plurality
--> 58
-64 New Highs on NYSE 19 +7 new lows. Bullish plurality
Until Peerless gives a
Sell signal, I would expect the DJI to keep rallying
The key
indexes have reached their resistance levels. Some hesitation
now would
not be surprising. So, since the short-term Stochastic-5s have
reached
over-bought status (red K-Line over 90) and today turned down,
short-term
traders may want to take profits in deference to the overbought
conditions.
Selling short is defintely not recommended.
Peerless Signals Super-imposed on SPY
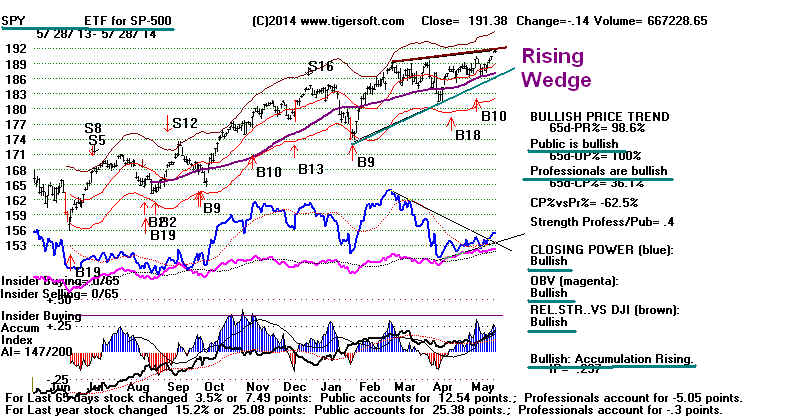
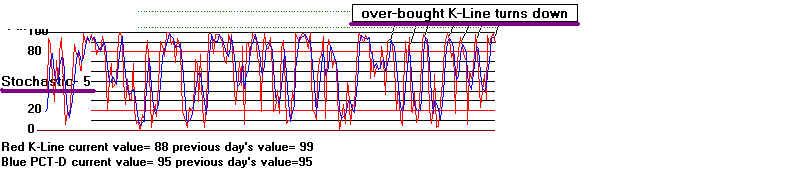
Intermediate-term
traders should hold and wait for a Peerless Sell signal
to sell.
There is a very good chance the markets will keep rising. Interest rates
are again
falling. See the 10-year interest rates' chart below. This will boost
enough NYSE
stocks, I suspect, to keep the averages rallying. In this
connection,
I want again to post again the Russell-1000 chart with its A/D Line.
See how strong
its A/D Line is. This seems an appropriately bullish antedote
to all the much
publicized bearish poison now readily seen on the internet.
Another bullish
sign is the continuing weakness in Gold. See chart below.
Very often Gold
rallies 20% or more just before the general market drops
significantly.
Ten Year Interest Rates
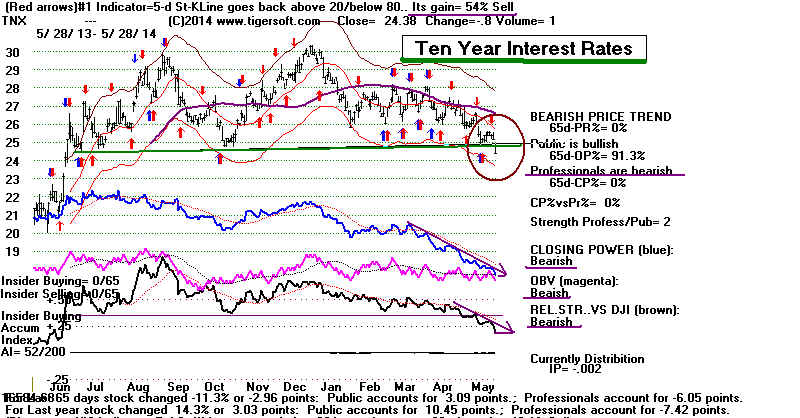
Tiger Index of Russell-1000 Stocks
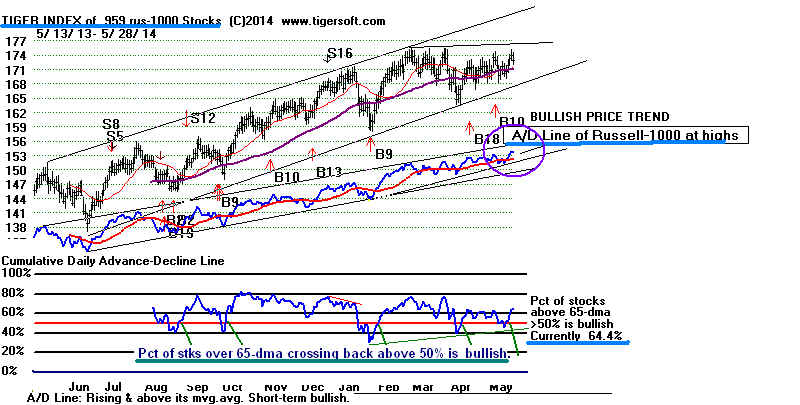
GLD's Price Breakdown is Confirmed.
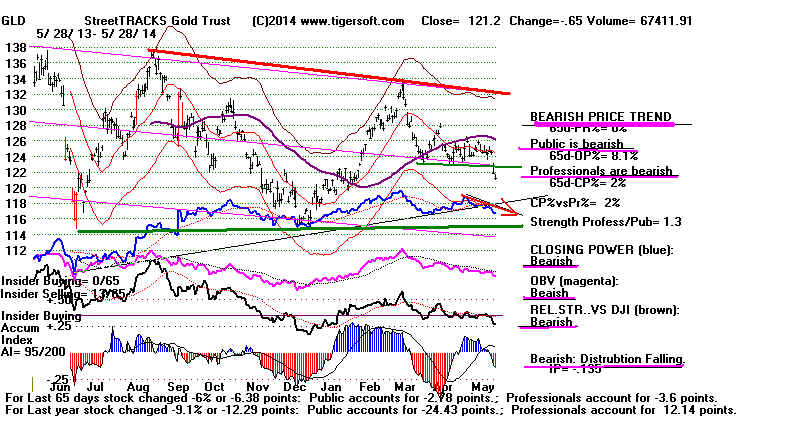
====================================================================
OLDER HOTLINES
====================================================================
5/27/2014 5/27/2014 KEEPS THE MARKETS RISING.
Until Peerless gives a Sell signal, I would expect the DJI to keep rallying
along
with the other
indexes. While prices have generally not been moving up much
recently after
elevated openings, they are also not fading. The early gains
are being held.
This shows that Professionals are holding their positions, not selling.
The strength of
the openings is occurring many hours before the opening in
NY. This
shows the buying is the result of overseas bullishness, not an over-zealous
"Public" in New York. This distinction fits and explains the pattern of
higher
openings
and the fact that overseas ETFs have moved up sharply in near unison
this last
month.
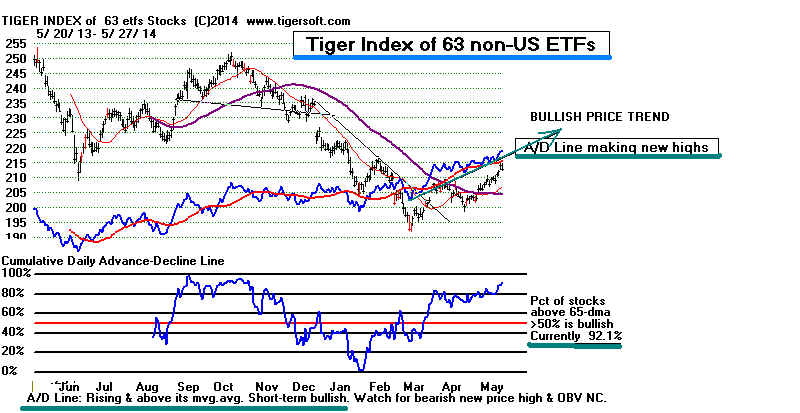
The Overhead Supply Is Not Yet Eaten Up
Look also at each
of the ETFs and Indexes using the links below. You will see
that the SP-500's
breakout past flat resistance still has not been translated
into breakouts by
any of the ETFs above their rising resistance lines in
their rising
wedge patterns. In addition, the Peerless V-Indicator remains negative,
thus setting up
the likelihood of a Peerless Sell if the DJI rallies up to 16900.
Today the DJI
closed at 0.8% over the 21-dma. It will need to rally at least
1.5% higher to
bring a Sell S9V.
As expected,
REITS, Bond Funds, dividend and utility stocks continue to do very
well as a result
of the FED's low interest rates. But now we also are seeing
exceptional
strength in foreign ETFS.
How Can Breadth Be "Bad" if the The A/D Line
for the Russell-1000 Keeps Making New Highs?
Most of the
stocks making up the heavily traded general market ETFs are
now above their
65-dma. This is true not just of the DJI and SP-500, it is
also true for
most of the NASDAQ-100 and RUSSELL-1000 stocks. Pundits
may complain that
the buying now is "not lifting enough boats". But I wonder
if they realize
that that the A/D Lines for the SP-500, the NASDAQ-100 and
the RUSSELL-1000
each made new 12 month highs today. Our TigerSoft
Index charts show
the A/D Lines for such groups. This is quite useful
in deciding what
groups to invest in AND if the key ETFs' price and breadth
behavior are in
synch.
On Tuesday,
Yahoo ran yet another bearish article on the market. Again, they
claimed
that "investors cannot afford to disregard" its content. The basic thesis
in it was
that the rally was now dangerously "narrow", i.e.. too many groups
of stocks
and too many individual stocks were being left out of the current
bull
market's good times.
We can see
further below what percent of each group's stocks are above
their
65-dma. What we find is that 19 groups have at least a majority of
their
stocks are above their 65-dma and 17 groups consist of a majority that
are not.
Participation could be better. But tops are usually better inferred
from such
readings only when the DJI is making new highs in isolation and
has risen,
say, 10% in the last 3 months. I think we are relatively safe despite
the ripe
old age of our bull market now.
STRONGEST GROUPS OF STOCKS
REITS
98.8%
BOND FUNDS 95.2%
FOREIGN ETFS 92.1%
PIPELINES 91.7%
BIGGEST FIDELITY HOLDINGS 81.5%
DJIA-30 76.7% A/D Line back to earlier highest level.
HIGHEST DIVIDENDS 73.4%
UTILITY 71.1%
RUSSELL-1000 70.7% A/D Line New High.
OIL/GAS 69%
SP-500 65.5% A/D Line NH.
INSURANCE 64.4%
BIG NASD BIOTECH 62.5%
TRANSP 62.1%
QQQ-100 59% A/D
Line at new high
BEVERAGES (19) 57.9%
AUTOS (47) 57.4%
SEMI-CONDUCTORS (48) 54.2%
CHEMICALS (56) 51.8%
LAGGING GROUPS OF STOCKS
RETAIL
46.2%
INDUSTRIAL
MATERIALS 45.8%
FINANCE
45.7%
MILTARY
44.4% .
SOFTWARE
43.1%
COAL 42.9%
NEW ISSUES
41.9%
COMPUTERS
38.2%
GREEN
36.8%
CHINA 33.9%
BIOTECHS
33%
LOW PRICED
32%
EDUC
30%
LOW
PRICED#2 (574) 29.4%
BIG BANKS
28.6%
REGIONAL
BANKS 24.4%
GAMING
8.3%
> To Key Index and
Leading Stock Charts: DJI, SP-500, etc.
DJI Chart SPY Chart NASDAQ Chart IBB
Chart IWM Chart
Hourly
DJI-OBV Hourly-MVM0735 FAS-3x Financials IBB-Biotechs
--> 63+8
MAXCP stocks Bullish MAXCP Stocks
(5/27/2014) Bullish plurality
--> 58 -13 MINCP stocks Bearish MINCP Stocks (5/27/2014)
Many
heavily distributed and shorted stocks remain very weak.
--> 67 +27 New Highs on NASDAQ 14 +1 new lows. Bullish plurality
--> 122
+ 50 New Highs on NYSE 12 +4 new lows. Bullish plurality
RANKING OF TIGER
GROUPS BY PCT. OVER 65-DMA
___________________________________________
5/28/2014
Group
(Number)
Pct over Comments
65-dma
--------------------------------------------------------------------
REITS (82) 98.8% Index below its 12-mo peak. A/D Line strong.
Power Ranked #1 PPS, ODFL, CDR. RQI,VNO. SLG
BOND FUNDS (145) 95.2%
A/D Line NH
FOREIGN ETFS (63)92.1%
A/D Line NH
Power Ranked #1 IEV (Europeon 350 Index)
PIPELINES (12) 91.7%
Prices below peak but A/D Line strong
BIGGEST FIDELITY HOLDINGS(27) 81.5% A/D Line NH
Power Ranked #1 QCOM
HIGHEST DIVIDENDS (289) 73.4% A/D Line new high.
Power Ranked #1 SAN, RPAI, ETY
---------------------------------------------------------------
---------------------------------------------------------------
UTILITY (45) 71.1%
Power Ranked #1 NRG
----------------------------------------------------------------
OIL/GAS (200) 69% A/D Line nack to earlier highest level.
Power Ranked #1 HP
---------------------------------------------------------------
SP-500 (466) 65.5% A/D Line NH.
----------------------------------------------------------------
DJIA-30 (30) 76.7% A/D Line back to earlier
highest level.
Power Ranked #1 CAT
----------------------------------------------------------------
RUSSELL-1000 (959) 70.7% A/D Line New High.
-------------------------------------------------------
INSURANCE (45) 64.4% A/D Line New High
Power Ranked #1 ORI
---------------------------------------------------------------
BIG NASD BIOTECH (16) 62.5% Prices just crossed 65-dma
TRANSP (29) 62.1% A/D Line is near old high.
QQQ-100 (100)
59% A/D Line at new high
Power Ranked #1 AMAT
BEVERAGES (19) 57.9% A/D Line fell today
AUTOS (47) 57.4% A/D Line NH
SEMI-CONDUCTORS (48) 54.2% A/D Line NH
CHEMICALS (56) 51.8% Prices below 65-dma
RETAIL (39) 46.2% Prices below 65-dma
INDUSTRIAL MAT (118) 45.8% Prices below 65-dma
FINANCE (105) 45.7% A/D Line almost at new highs
MILTARY (27) 44.4% A/D Line at old highs today.
SOFTWARE (65) 43.1% Prices below 65-dma
COAL (7) 42.9% Prices below 65-dma
NEW ISSUES (465) 41.9% Prices below 65-dma
COMPUTRS (34) 38.2% Prices below 65-dma
GREEN (38) 36.8% A/D Line not far below 12-mo high.
CHINA (62) 33.9% Prices below 65-dma
BIOTECHS (191) 33% Prices Below 65-dma
LOW PRICED (219) 32% Prices Below 65-dma
EDUC (10) 30% Prices Below 65-dma
LOW PRICED#2 (574) 29.4% Prices Below 65-dma
BIG BANKS (7) 28.6% A/D line just below 12mo high
REGIONAL BANKS (41) 24.4% Index crossed back above 65-dma today.
GOLD (77) 11.7% Price breakdown today despite rally.
GAMING (12) 8.3% Prices Below 65-dma |
====================================================================
OLDER HOTLINES
====================================================================
5/23/2014 SUPERB BREADTH KEEPS THE MARKETS RISING.
Until Peerless gives a Sell
signal, I would expect the DJI to rally along
with the other indexes.
The DJI's resistance line now crosses ar 16800.
I reckon the NASDAQ's is at
4250 and QQQ's at 91.25. The SP-500 is
on the verge of making a
breakout above its flat resistance. Its IP21
is amply positive and its OBV
Line has already made its own breakout.
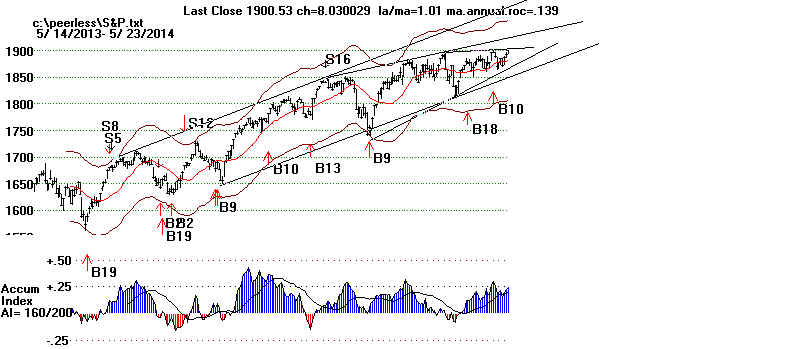
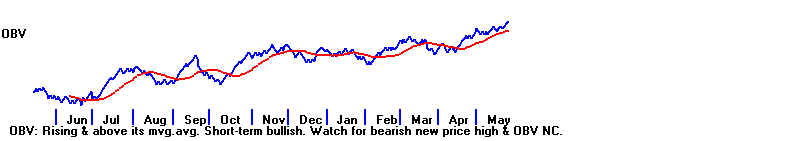
As long as
the key DJI remains confined to its rising wedge
pattern, I would not expect its
daily movements to stay relatively small.
Rising wedge patterns do more often
bring breakdowns than sustained
advances. So, with the
V-Indicator still negative, a rally to the vicinity of
the DJI's rising resistance line
will probably bring a reversing Sell signal.
Rising resistance lines can turn
back a DJI even though its new high
might seem to be a breakout.
Examples: May 1929, November 1950,
January 1981, December 1986,
September 2013. In these cases, the
DJI cannot clearly get past a
resistance line drawn through the hypothetical
highs. The DJI's P-Indicator is a healthy modestly +214 but
the V-Indicator
now stands at -46 and the IP21 is a sub-impressive +.065.
The DJI's seasonality is now
favorable for two weeks. Since 1965, the DJI
has risen 61.7% of the time in the
10 trading days following May 26th. Unfortunately,
the same statistics show the DJI
fell 59.6% of the time in the two weeks after
June 6th.
Some folks are looking for a
significant Summer top. There are a number
of cases in bull markets where this
happened AFTER there first was a July
breakout: 1929, 1937, 1941, 1957,
1987, 1990, 1997, 1998, 2007 and 2011.
But we should not just wait until
Jul. Junes can bring successful Peerless
Sells in on-going bull markets:
1934, 1939, 1943, 1948, 1949, 1951, 1975,
1978, 1981, 1986, 2010, 2011, 2013
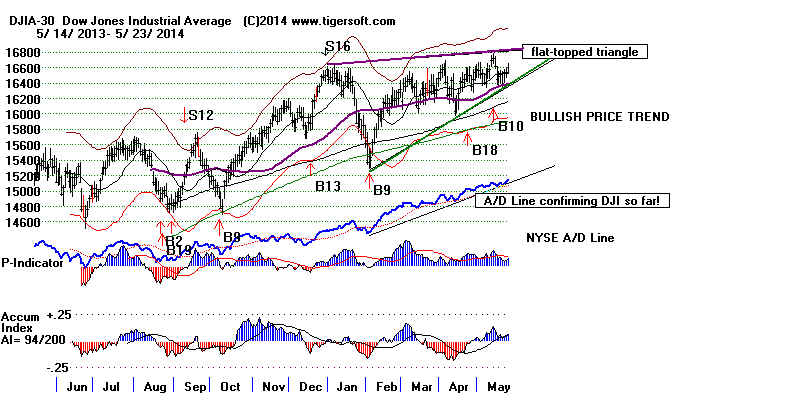
I think that there are good
historical reasons why we have not seen a major Peerless
Sell this year. Major
tops seldom occur when the NYSE A/D Line is as strong as it
is now. They typically occur
when the A/D Line starts lagging the DJI as it
makes new highs. Right now
the A/D Line is leading prices upwards.
Declines in this technical
envornment are apt to be small unless the DJI
completes a head/shoulders pattern
(as in 1946, 1962 or 1971) or fails
more than 7 times to get past a
landmark resistance level (such as 1000
was in 1976).
Professionals are also becoming somewhat
more net bullish, judging from the
rising Closing Powers of DIA, SPY and QQQ using 21-day ma of CP. And, also
without any fanfare, the
upward slope of the Hourly DISI (OBV) shows aggressive
buying is on the upswing.
DIA's Closiug Power is
on verge of breaking out
above its well-tested downtrendline.
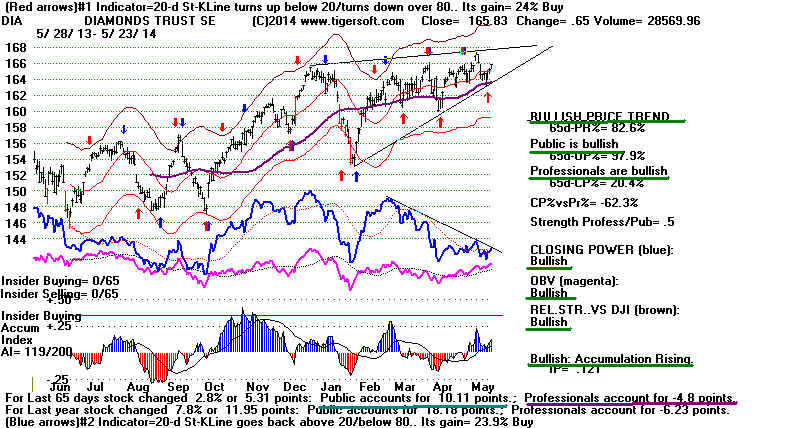
It's true that Professional
skepticism however remains high. We see this when
we study the basis of 65-day moves.
Though the CP 21-day ma are now rising,
the 65-day gains owe mostly to
jumps at the opening. In DIA's case, the
Tiger chart shows just beneath the
graph that the DIA has risen a net total of
5.31 points in the last 65 days.
Closings below the openings, however, lowered
that amount by 4.8 points while
price changes based only on Openings actually
gained 10.11 points. A
break in the well-tested CP downtrend could abruptly
change this picture.
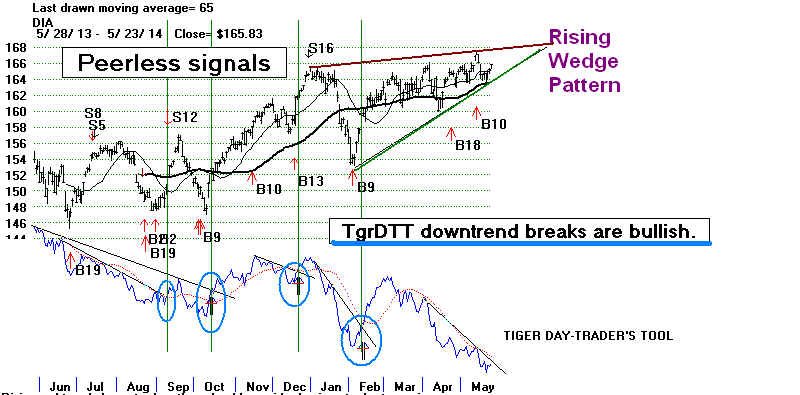
Professionals are opportunists.
They are not stubborn. Their skepticsm could
turn to short-term bullishness if
another of our tools changes direction. Watch
to see if DIA moves up sharply all
day from its opening. This could bring a break
in the Tiger Day Traders' Tool's current downtrend for DIA. In the
past, this
has signalled dramatic short-term
advances. See some examples.
> To Key Index and
Leading Stock Charts: DJI, SP-500, etc.
DJI Chart SPY Chart NASDAQ Chart IBB
Chart IWM Chart
Hourly
DJI-OBV Hourly-MVM0735 FAS-3x Financials IBB-Biotechs
--> 55 +8
MAXCP stocks Bullish MAXCP Stocks
(5/23/2014)
--> 45 -22 MINCP stocks Bearish MINCP Stocks (5/23/2014) Bullish plurality
Heavily distributed and shorted stocks remain very weak.
--> 40 +7 New Highs on NASDAQ 13 -11 new lows. Bullish plurality
--> 72
+ 5 New Highs on NYSE 8 new lows. Bullish plurality
==================================================================
OLDER HOTLINES
==================================================================
5/22/2014 THE MARKETS KEEP SLOWLY CREEPING
UPWARDS DESPITE WELL
PUBLICIZED SUPER BEARISHNESS
ON THE PART OF
WELL-KNOWN CONSERVATIVE PUNDITS
IN THIS ELECTION YEAR.
As long as
Professionals are net buyers and the Closing Powers
keep trending up,
the markets should keep rising. Historically,
since 1965, the
DJI tends to rise for the next 10 trading days... until
June 3rd. Our Stock' Hotline will cover some of the profitable
short sales near
their lower bands.
.
> To
Key Index and Leading Stock Charts: DJI, SP-500, etc.
DJI Chart SPY Chart NASDAQ Chart IBB
Chart IWM Chart
Hourly
DJI-OBV Hourly-MVM0735 FAS-3x Financials IBB-Biotechs
--> 47 +9
MAXCP stocks Bullish MAXCP Stocks
(5/22/2014)
--> 67
MINCP stocks Bearish MINCP Stocks (5/22/2014) Bearish
plurality
Heavily distributed and shorted stocks remain very weak.
--> 33 +13
New Highs on NASDAQ 24 -6 new lows. Bullish plurality
--> 67
New
Highs on NYSE 8
-8 new lows. Bullish plurality
The light pre-holiday trading has pushed the QQQ up past both its 65-dma and
its well-tested
resistance line. Gradually, the various major ETFs are moving up
to their rising
resistance lines. Having a few days ago tested the uptrend-support
lines, prices
must now find resistance. A DJI advance to 16900 would likely
bring a Sell S9V.
But the rising resistance-lines may well prevent such a
move.
I admit rising
wedge patterns like we now see in the DJI, SP-500, NYSE and
OEX are often
bearish and the negative V-Indicator non-confirmations are
capable of
dropping the DJI all by themselves as much as 17%, judging
from the 2011
experience. But we have no Peerless sells yet and my sense
is the FED is still in control. Moreover, after its failures in 2008,
the FED
is understandably
very wary of doing anything too quickly that might end
the current 62
month-old bull market.
2011 S9Vs dropped DJI 17%
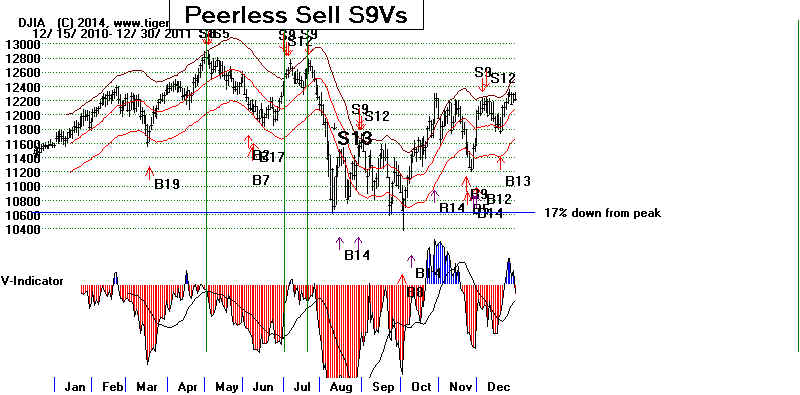
PROFESSIONALS versus BEARISH
PUNDITS
The Closing
Powers are rising for DIA, SPY
and QQQ. So, Professionals have
turned into
net buyers. True, they remain cautious, judging by how far below
the Closing
Powers are below their highs. But, for the time being CPs are in modestly
bullish
uptrends. This is remarkable because it is occurring in the face of a campaign
of
bearishness coming from market pundits who are continually being quoted
on Yahoo,
for example. Thus, tonight, we can read:
Beware:
2014 looking a lot like 2007 says Hugh Johnson
Such views
make too much of the divergences between the DJI and smaller stocks
in the
NASDAQ. Divergences like we have now more often call for consolidations,
not a
collapses. I have said that the market now is probably most like the market
in the
second half of 1986 when the DJI trended gradually up and the NASDAQ
trended
down. But what is even more significant is that the following year the
two indexes
got back into synch and both advanced strongly, more than 30%
over 7+
months. Real-time, Peerless, based mostly on the NYSE A/D Line,
had no
trouble figuring out these moves. See the Peerless signals below for
this
period.
In 1986-1987, DJI and NASDAQ Diverged and but
then got back into synch after 6 months' consolidation
and rallied 30% over the first 7+ months of 1987. 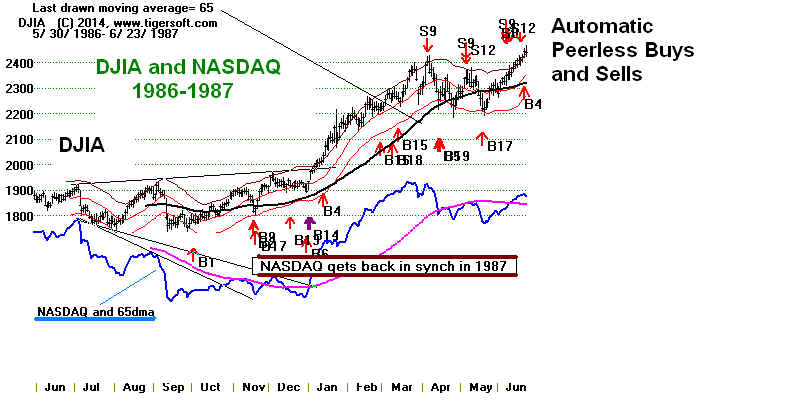
As for a
parallel with 2007. Decide for yourself. See first the DJI now and then
the
DJI back in
2007. Only when the NYSE A/D Line started falling behind the DJI
in 2007 did
we get Peerless Sell Signals at the twin tops of that year.
DJI NOW
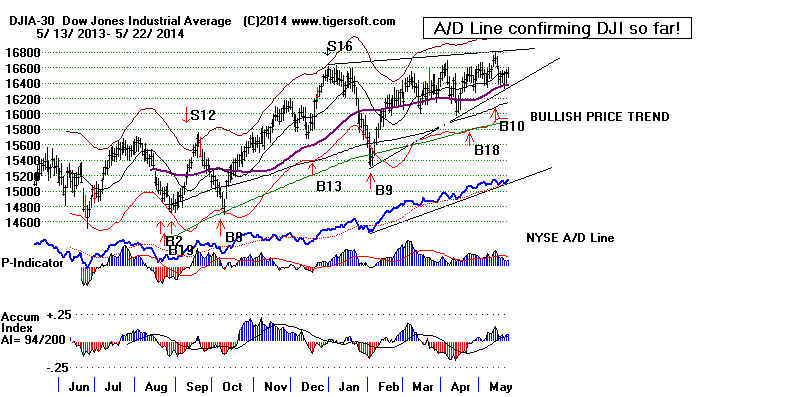 |
DJI IN 2007
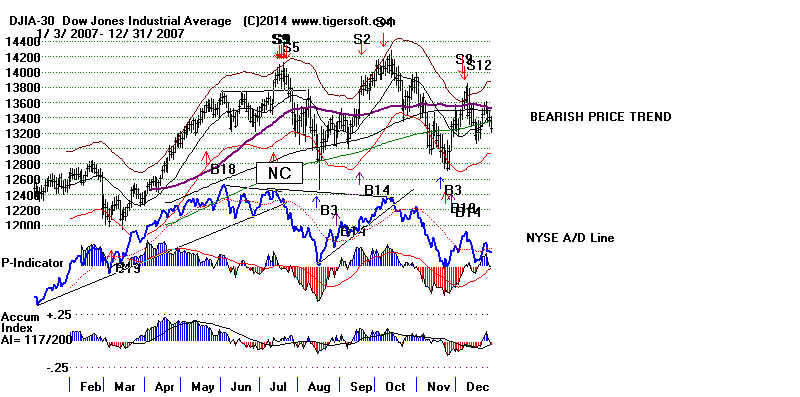 |
And as for
parallels with 1929, they seem ridiculous, quite frankly! See how deep
and red
were the negative divergences then. See all the Peerless Sell signals.
This is not
at all what our current chart looks like.
1929's TOP SHOWED EVERY
IMAGINABLE BEARISH WARNING!
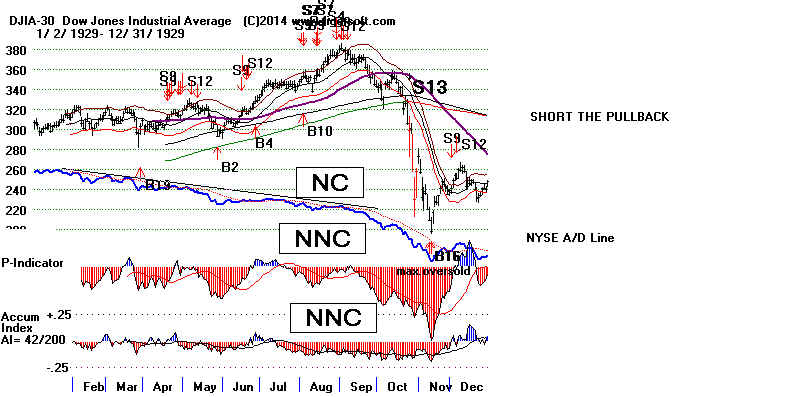
====================================================================
5/21/2014 Watch The
Well-Tested Trendlines of
Resistance and Support.
But at 16950, we have
to become concerned about a Sell
S9V. So, this
is likely to remain a market of
narrow swings a while
longer.
The DJI's rally from the support today of its uptrendline and
65-dma shows
that the FED does not
want the market to swoon now. It also shows that we
probably should not
make too much of price swings while prices remain stuck
in a narrow and
narrowing trading range. Within such patterns, prices can swing
back and forth
nervously with each Fed utterance. What will count most is
which way prices
ultimately break from the rising wedge patterns in
the DJI and SP-500.
The SPY is the closest
to breaking out to new highs. Apart from its falling
Closing Power trendline
and its overhead price resistance, its internal strength
indicators are now
rated "bullish" on a Tiger chart. Today, too, the QQQ got
back above its 65-dma
and seems ready next to breakout past its well-tested,
recovery flat-top.
That could then bring a challenge of the old highs, still
some distance away.
I would expect traders to jump aboard the impending
recovery-flat-top
breakout. The Hourly DISI (OBV) Line also seems much
stronger than we are
used to seeing. This should limit price declines in the DJI,
though I would rather
see higher IP21 readings from the DJIA than a mere +.057,
as now shown.
65d CP%-Pr%s
ITRS
IP21
Price
Flat Resistance
(50d Pct Change vs
DJI's)
5/21/2014
(unless otherwise specified)
----------------------------------------------------------------------------------------------------------------
DJIA
+.059 `16633.06
16800
(la/ma=1.001 VI = -71)
DIA
-56%
--- +.074
164.98
168.0
SPY
-62.3%
.00
+.156
189.13
191
QQQ
-45.9% -.03
+.171
88.94 89
IWM
+7.5%
-.08
+.009
109.62 112 downtrend-line
TNA
+.0.2%
-.23
+.039
65.14 68 downtrend-line
IBB
+14.5%
.12
+.061
229.74 235 flat, well-tested but
below 65dma
FAS
-31..5% -.08
+.164
88.95 94
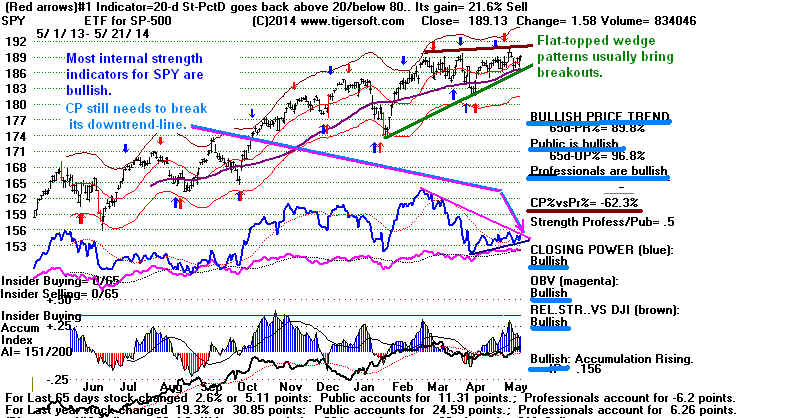 |
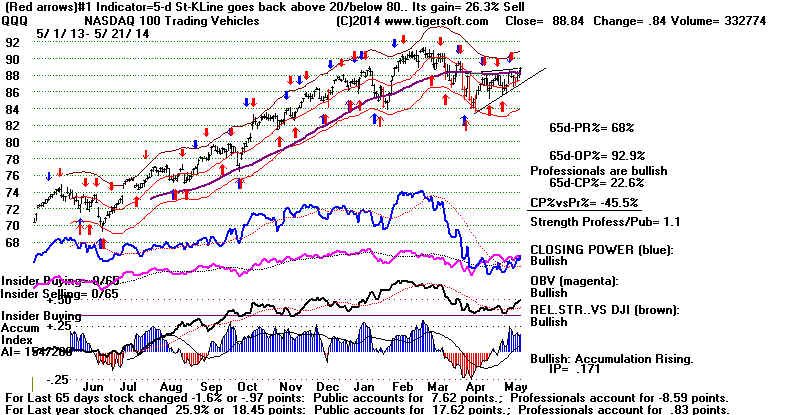 |
Sometimes we can predict
which prices will breakout to the upside if:
1) We see the operative Peerless signal is a Buy;
2) The trend of the NYSE A/D line is up;
3) The Accumulation Index is above +.15 and
4) The DJI shows a flat top (most flat top resistance levels are taken
out by breakouts.)
5) The Hourly DISI (OBV) is uptrending.
If these were the only
factors, it would be easy now to be bullish for the
market now. But
there are also bearish factors operating. They
are:
1) The NASDAQ is seriously under-performng the DJI and its RELDJI
indicator remains in
negative "red/sell" territory.
2) Though improving, the Closing Power remains weak relative to
price. The
CP%-Pr%s for 65 days are mostly quite negative for the
key ETFs:
65d CP%-Pr%s ITRS
IP21
Price
Resistance
(50 Pct Change vs
DJI's)
----------------------------------------------------------------------------------------------------------------
DIA
-56%
--- +.074
164.98
168.0
SPY
-62.3%
.00
+.156
189.13 191
QQQ
-45.9% -.03
+.171
88.94 89
IWM
+7.5%
-.08
+.009
109.62 112 downtrend-line
TNA
+.0.2%
-.23
+.039
65.14 68 downtrend-line
IBB
+14.5% .12
+.061
229.74 235 flat, well-tested but
below 65dma
FAS
-31..5%
-.08
+.164
88.95 94
3) The leadership now is "defensive". Dividend stocks normally
do not lead a bull
market very far.
4) The number of Closing Power new lows' stocks is far greater than
the number of Closing
Power new highgs.
5) We see compact head/shoulders patterns on the NYSE and OEX
which will take on
added bearishness if they break below their 65-dma.
And most important:
6) A run to
16950-17000 could easily bring a Sell S9V. The V-Indicator is
quiite negative.
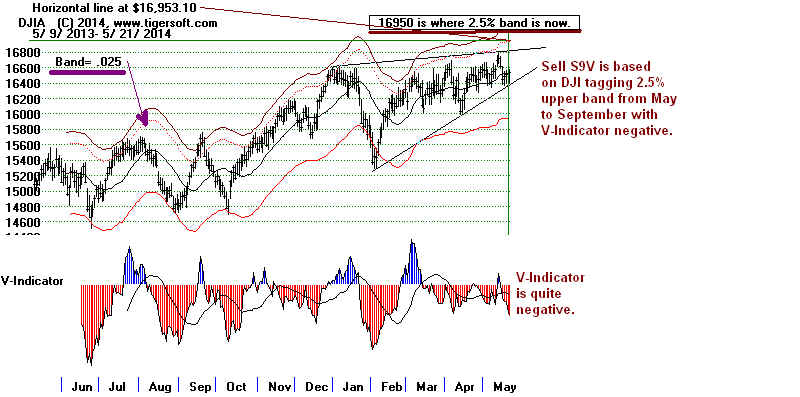
> To Key Index and
Leading Stock Charts: DJI, SP-500, etc.
DJI Chart SPY Chart NASDAQ Chart IBB
Chart IWM Chart
Hourly
DJI-OBV Hourly-MVM0735 FAS-3x Financials IBB-Biotechs
--> 38 -6
MAXCP stocks Bullish MAXCP Stocks
(5/21/2014)
Note the large number of REITS.
--> 113 -14
MINCP stocks Bearish MINCP Stocks (5/21/2014) Bearish
plurality
--> 20
+8 New Highs on NASDAQ 30 -6 new lows. Bearish plurality
--> 50
+18 New Highs on NYSE 16 -4 new lows.
Bullish
plurality
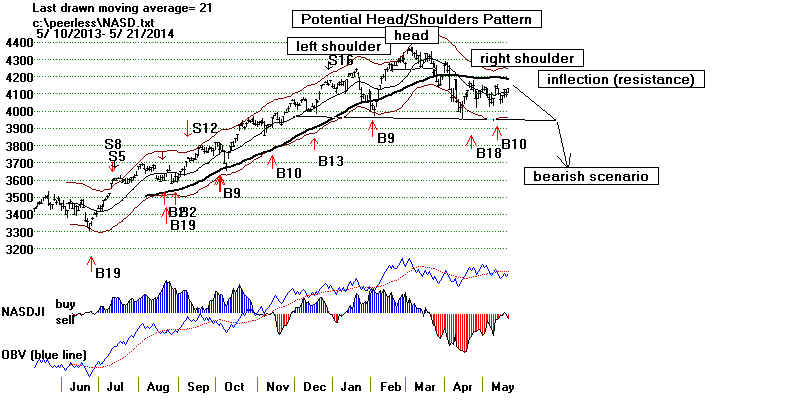 |
====================================================================
5/20/2014 Watch
The Well-Tested Trendlines of
Resistance and Support.
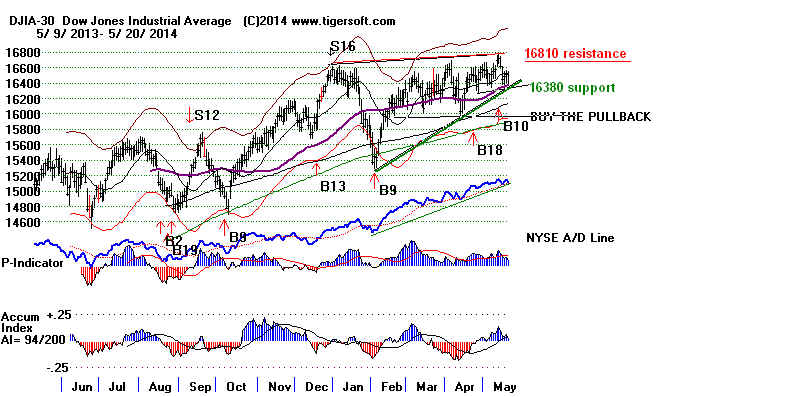
Our stocks' Hotline remains about evenly long REITs
and short Bearish MINCP stocks. The Buy B10 breakout
has quickly failed.
A test of the lower band is what
happens most often when flat topped
breakouts fail.
A break in the DJI's uptrendline on a closing basis will likely
bring
a drop by it back to
16000. Weakness is growing. The NYSE, OEX
and SP-500 have fallen
closer to important short-term support levels.

The NYSE, the home of most of the market's dividend
plays, has formed
a
quick head and shoulders pattern. Talk
of rising interest rates is
responsible
for this. Usually head/shoulders patterns that bring big
declines show ample red distribution on the right shoulder. Here that
indicator has remained quite positive and blue. In addition, the support
of
the rising 65-dma (not show here) at 10500 has not been overcome.
Many
incipient head/shoulder price patterns bring only declines to the
rising 65-dma.
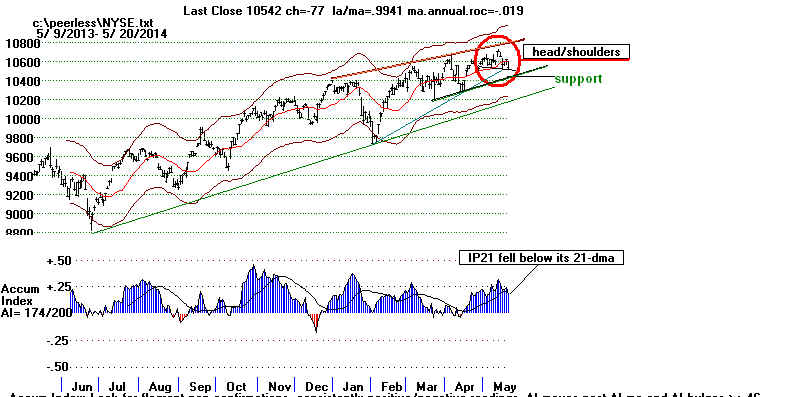
> To
Key Index and Leading Stock Charts: DJI, SP-500, etc.
DJI Chart SPY Chart NASDAQ Chart IBB
Chart IWM Chart
Hourly
DJI-OBV Hourly-MVM0735 FAS-3x Financials IBB-Biotechs
--> 44 -14
MAXCP stocks Bullish MAXCP Stocks
(5/20/2014) Bullish plurality
Note the large number of REITS.
--> 127 +63
MINCP stocks Bearish MINCP Stocks (5/20/2014)
--> 12 -14
New Highs on NASDAQ 36 +1 new lows. Bearish plurality
--> 32 New Highs on NYSE 20 +15 new lows. Bullish plurality
As the DJI moves closer to edges of its
pattern, there are apt to
be
quick swings up and down that are not significant in that they do not
tell
which way the DJI will jump. The market's main theme remains
unchanged. The favored stocks are mainly dividend plays and REITs,
and
the weakest sectors remain retailers, small caps and coal stocks.
The
market is a "tale of two cities", or groups going in opposite directions.

Contradictory directions for different
groups of stocks are common.
We
have learned to exploit this by using TigerSoft's Power Ranker applied to the
MAXCP
and MINCP stocks. That is the basis of the Bullish MAXCPs
and BEARISH MINCPs, which are posted here each night.
What's new is not that the FED will likely modestly raise rates in 2015,
provided there is no drastic change in the direction of the economy
or
the stock market, but that the Russians are forging
sizeable new economic
ties with China which
in the long run will reduce role of the Dollar and
weaken Wall Street
internationally. In this, we should keep an eye on
the
Dollar. A breakdown in the Dollar would quickly scare away lots
of
hot money from US stocks. Sharply rising rates will hurt business here
and
increase the national Debt. These things the current bull market could
not
long survive, though historically rates have to go above 4 1/2% to stop
a
strong recovery. A weakened Dollar would actually help American exports
and
boost manufacturing jobs. (On
Financial Warfare in the 1920s as waged
by the
Bank of England and London's financial center, the City.)
Surprisingly, much of Wall Street will cheer for higher rates. Even now
some
there complain about the dangers of inflation and how a weak dollar
hurts
Wall Street as it seeks to retain its supremacy as the World's financial
center using a "solid Dollar", much like England did in the 1920s and 1930s
when
Chancellors of the Exchequer demanded balanced budgets and a Gold
Standard to protect the "City's" dominance as the world financial
center.
More
than anything else, it may be a breakdown by the Dollar which
will
jeopardize the Fed's Bull Market. Gold remains weak.
That
gives
the Fed more time, I think, to keep the bull market alive, as measured
by
the DJI and dividend stocks.
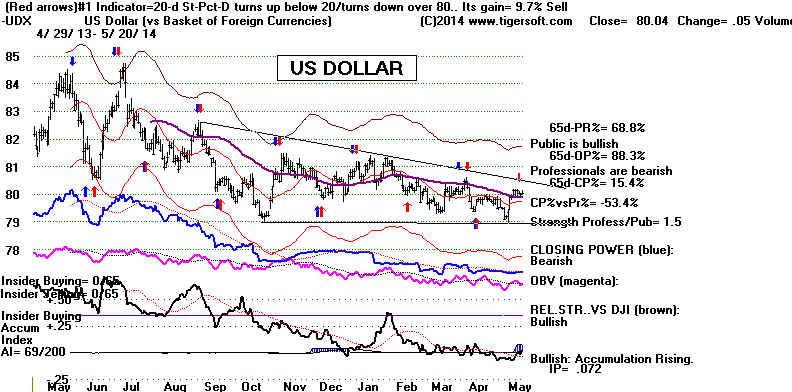
====================================================================
5/19/2014 Watch The
Well-Tested Trendlines of
Resistance and Support.
It has been the weakness in the NASDAQ and the QQQ (below) which has pulled down
the
market most since the beginning of the year. We should, I think, now
watch
to see if the QQQ will be able to surge upwards past the key resistance
it
has today reached or instead stumble badly, leaving the DJI the difficult task of
holding up the market and maintaining the appearance that all is still healthy
on
Wall Street and well for the the 2009-2014 bull market.
Looking at a sample of
rising wedges with flat tops below their recent highs,
such
as QQQ now shows, it seems that which way prices will breakout depend upon
3
factors. It seems to depend upon:
1) how high the IP21 (current Accumulation Index) is as prices
approach the wedge pattern's flat top,
2) whether the Closing Power's trend is rising bullishly or
falling bearishly within the pattern and
3) if the 65-dma rising bullishly or falling bearishly.
QQQ shows
an improving IP21, but it is not solidly positive or above +.23 which
is often
used to confirm breakouts. Meanwhile, the 65-dma is indecisively flat.
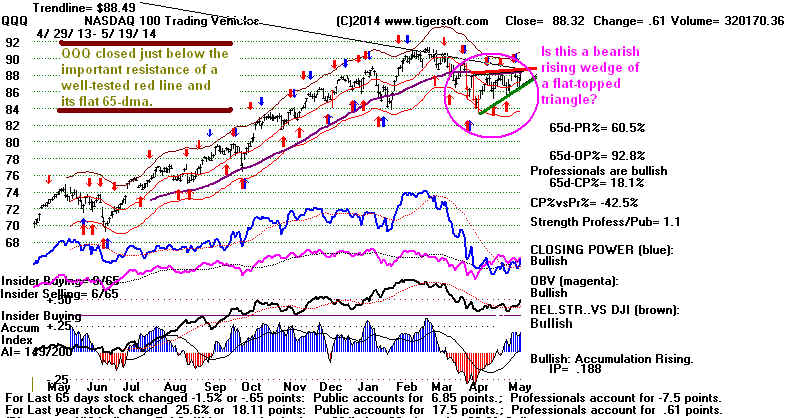
> To Key Index and
Leading Stock Charts: DJI, SP-500, etc.
DJI Chart SPY Chart NASDAQ Chart IBB
Chart IWM Chart
Hourly
DJI-OBV Hourly-MVM0735 FAS-3x Financials IBB-Biotechs
--> 58 +13
MAXCP stocks Bullish
MAXCP Stocks (5/19/2014) Bullish
plurality
Note the large number of REITS.
--> 64 -92
MINCP stocks Bearish MINCP Stocks (5/19/2014)
--> 26
New Highs on NASDAQ 35 -1 new lows. Bearish plurality
--> 69 +10 New Highs on NYSE 5 -10 new lows. Bullish plurality
5-Day Stochastics' Crossovers of 20 and of the D-Line for DIA, SPY
and other key ETFs
served to boost the markets technically short-term.
See the Stochastic-5 charts for the key ETFs here. They
should be used
by short-term traders
while the DJI stays locked in the narrow range shown
below by the rising
(green) up-trend support and the flat (red) resistance line.
The red resistance and
green support lines are now well-tested, i.e. they
have been tested three
or more times. Breaks up or down past well-tested
resistance and support
lines are much more significant than simple trend-breaks
Mostly, we must now
wait to see which way the DJI jumps. I have said that
false breakouts usually
bring a test of the lower band. Here a decline to 16000
may be all we will see
for the DJI, since the A/D Line uptrend remains strong
and the FED will
probably do what it can to prevent a more serious decline
because that could
snow-ball into something out of their control.
The DJI's advance today
put it 1.2% below the level of the Buy B10 of 4 days
ago. This is much
more respectable than it would have been had there been
a decline of, say, 1%
today.
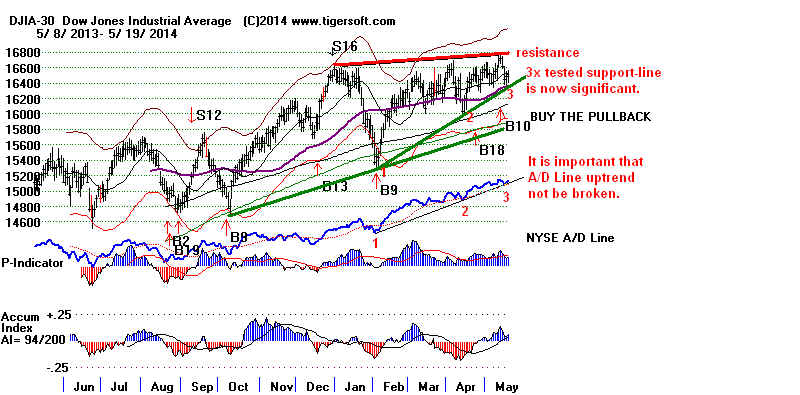
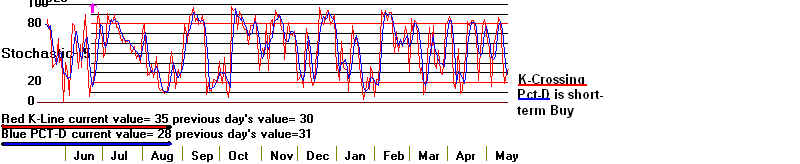
The risk now is not so much in the DJI
or SP-500, but in QQQ and IBB.
Each has
what I would call "recovery flat tops". This is a flat resistance
below the
highs of a few months' earlier. Such flat tops can bring breakouts
to the
upside, but they can also bring declines below their uptrendlines that
lead them
substantially lower. IBB's recovery flat top resistance is well-tested.
it is now
at 235. IBB closed 231.5 today. So the resistance is about 1.5%
higher.
How IBB handles this resistance will be very important.
The same is
true with QQQ. now. The well-tested recovery flat-top resistance
is at
88.49. This is less than .17 away.
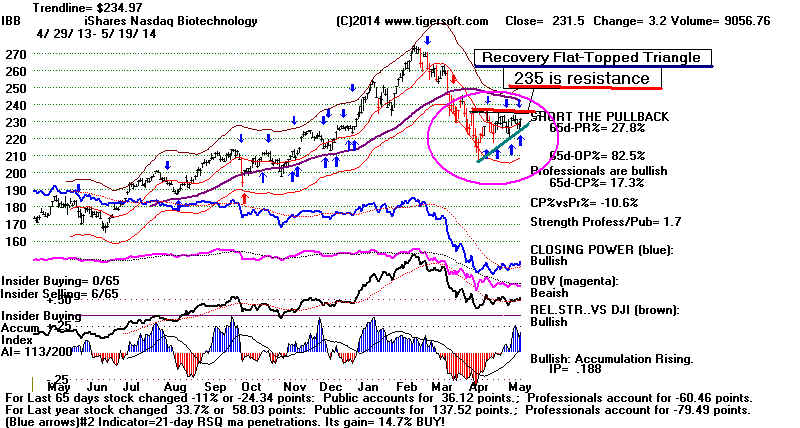
====================================================================
5/16/2014 The DJI's breakout past 16600 (Buy B10) has probably
failed.
A re-test by the DJI of 16000 seems
likely followed by more new highs
for the DJI while
the NASDAQ hesitates and small stocks continue
their downwards.
The DJI can hold up for months even as the broader
market declines.
Of course, the longer the divergence, the more bearish
the eventual
decline.
> To Key Index and
Leading Stock Charts: DJI, SP-500, etc.
DJI Chart SPY Chart NASDAQ Chart IBB
Chart IWM Chart
Hourly
DJI-OBV Hourly-MVM0735 FAS-3x Financials IBB-Biotechs
--> 45 +16
MAXCP stocks Bullish MAXCP
Stocks (5/16/2014) Bullish
plurality
Note the large number of REITS.
--> 156 -72
MINCP stocks Bearish MINCP Stocks (5/16/2014)
--> 5
New Highs on NASDAQ 36 -11 new lows. Bearish plurality
--> 59 New Highs on NYSE 15 new lows.
Bullish
plurality
FAS and FNA May Be The Best ETFs To Watch
Now
To See Where The DJI and SP-500 Will Next Go.
If the DJI next
rallies, it seems unlikely it will be able to surpass 16600.
A weak opening on
Monday will show Friday's rally was not significant.
New statistics below
tend to support the view that the DJI must retreat some more
and regroup. The
A/D Line has slightly broken its uptrend. Watch to see
if it weakens further.
Since its uptrend is one of the most important underpinnings
of the bull market, we
should be watching this statistic very closely. If the
FED loses control of
the bull market and big banks become the target of much
of this year's
political campaigns, the DJI will become much weaker than it is now.
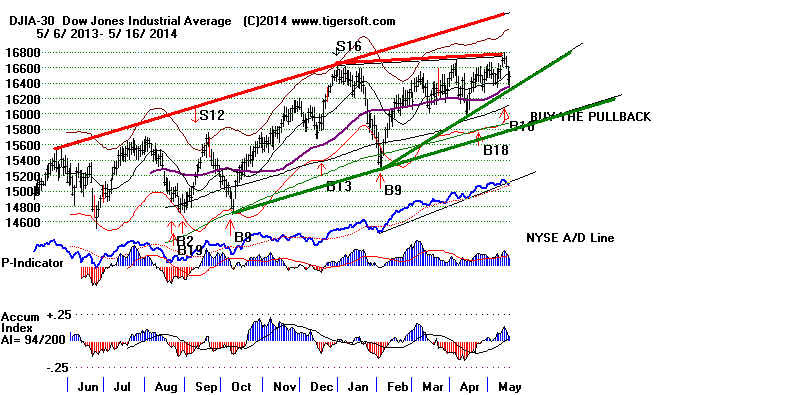
Hold short some of the low AI/200 (Accumulation) Bearish
MINCP
stocks and hold long some of most bullish REITs. ( 10-Year interest rates
are falling.)
Short-term traders should use short-term Stochastics
now with FAS, QQQ, DIA and SPY. I like the
K-Line crossing the Pct-D
after the K-Line has
dropped below 20. Watch to see if the big banks' ETF,
FAS, gives a short-term
Buy signal and recovers. Bigger breaks in big bank
stocks like BAC and GS would show the DJI is at
risk. Normally the reversing
Peerless buys and sells
work very well with the big banks and FAS. If FAS weakens,
the DJI will almost
certainly be under more pressure. Watch also TNA,
the leveraged ETF for
small caps. See below, It is moving down more and more through
its support. A
decisive breakdown by it below April support would weaken
the entire market and
the DJI would have to fall back more.
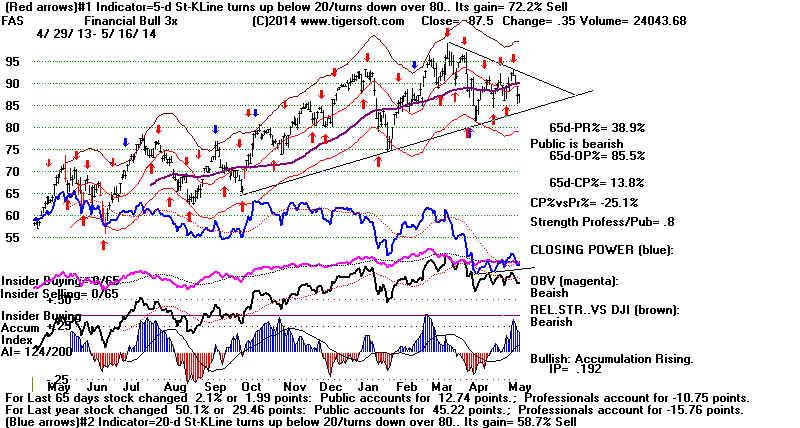
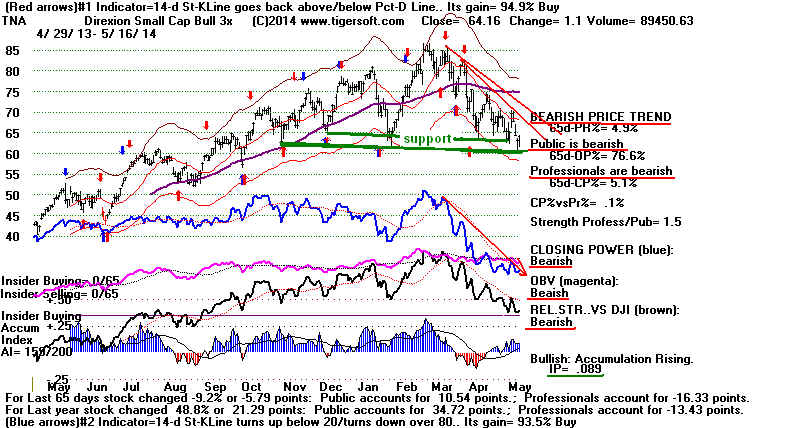
The basic concepts
behind Peerless Buy B10s are:
1) They signal breakouts from trading ranges with well-tested flat tops.
Therefore, the DJI should find lots of support at the point of breakout.
Pullbacks to the point of breakout are common, but with a valid Buy B10,
the DJI should not drop much below the point of breakout. Now after
3 days, the DJI is 1.3% below the level of the Buy B10.
Here the old resistance was at 16600. Clearly the DJI now is below
the level of expected support. 16600 will likely act as resistance to the
next rally.
2) The best Buy B10s produce breakaway moves. There have been
4 Buy B10s where the DJI gained more than 2% after just 3
trading days.
In the end, they gained +6.9% (1934), +12.3% (1976), +43.2% (1984)
and +17.4% (1996).
My long-time
friend and subscriber Paul in Connecticut suggested it would be
helpful to see how well
the DJI has behaved after a Buy B10. It's a good
idea. So I
produced today a table showing how the DJI did 1, 2, 3, 5, 7, 10, 15
and 20 days after a Buy
B10. The table lets us test and refine some of the
main ideas I have
offered since 1981. It also shows that now 3 days after
a Buy B10 the DJI is
down more than with any earlier Buy B10. It is down
1.3% since the Buy B10.
The "honors" for the previous deepest decline
3 days after a Buy B10
occurred in March 2005. Ultimately, that B10 signal
produced a 0.3% loss at
the time of the next Peerless Buy signal. The second
weakest 3-days after a
Buy was in January 1979. It ended up bringing a
Peerless user 4.4%
gain. In both cases low V-Indicator readings also were
warnings. The
first case also shows that a new Peerless Sell can quickly reverse
a Buy B10. See
these two Peerless Buy B10s.
(I'll write a program
to work with each of the other Peerless signals so that
users of our software
can see how well the DJI is doing compared to past
cases of the newest
signal. This and the other statistics I'm compiling are
getting quite lengthy.
I'll have to publish the full set of tables in a separate
book or download and
put my own distillation of them in the new Peerless
book I'm working on. )
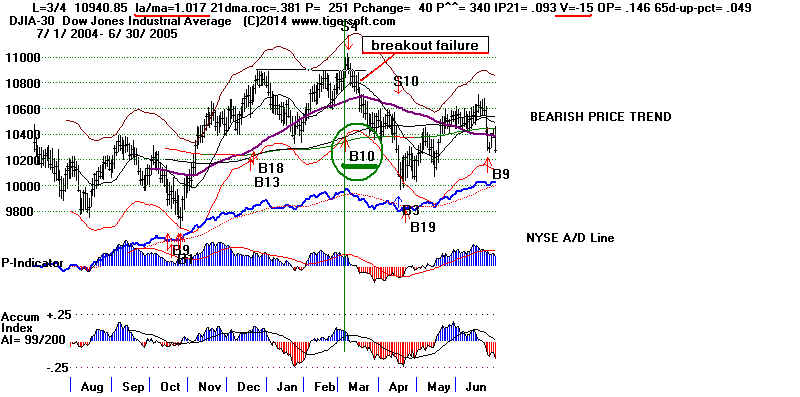 |
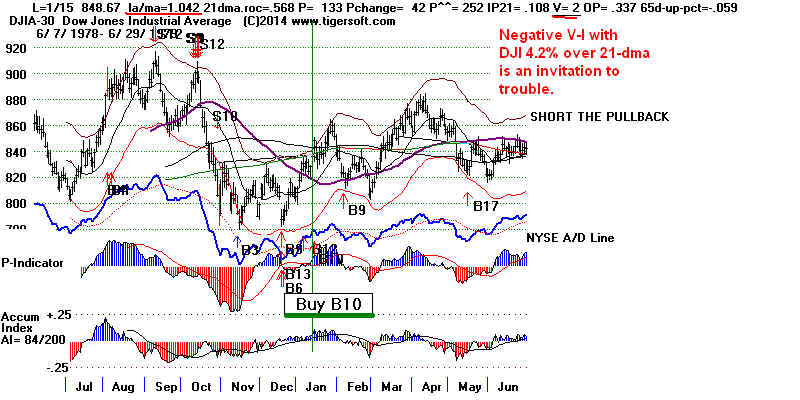 |
Table How Well The DJI Does Immediately
after a Buy B10
BUY B10s   ----------------- Pct.Gain -------------------------
           Next   Day  Day  Day   Day  Day  Day   Day   Day
           Sell    1    2    3     5    7    10    15    20
---------------------------------------------------------------
19341108   .069  .017 .02  .022  .022 .027 .044  .047  .057
19421008   .254  .003 .012 .010 -.003 .014 .011 -.001 -.031
19440308   .176 -.001 .004 .011  .009 .009 .003 -.014 -.009
19441208   .09   .007 .005 .001  .012 .007-.001   na    na
19450824   .172  .012 .014 .013  .026 .025 .042  .029  .057
19460528   .004  .004 .003-.001 -.009-.008-.013 -.028 -.045
19480519   .026  .005 .008 .008  .015 .013 .015  .022  .021
19490802   .242 -.002-.003 .008  .011 .014 .014  .005  .006
19500316   .061 -.001 0    .002  .008-.007-.009  .02   .036
19521128   .029  0    0   -.003 -.006 .005 .005  .010  .021
19540302   .575 -.002 0    .007  .007 .011 .003  .005  .011
19550415   .101  .007 .006 .007  0    .012 0    -.004 -.014
19560309   .042  .005 .003 .012  .02  .03  .031  .035  .042
19570611   .015  0    .004 .005 -.012-.012-.015 -.004  .020
19580203   .432  .01  .002-.002 -.018-.028-.026 -.037 -.023
19580502   .414  .003 .009 .007  .007 .001-.005  .003  .014
19611114  -.002  .002 .001-.004 -.005 0   -.007 -.003  .003
19621116   .488 -.007 .003 .010  .018 .033 .025  .023  .023
19640706   .112  .001 .002 .001  .002-.001 .006 -.004 -.005
19650817   .102  0   -.003-.005 -.008 .002-.001  .022  .032
19650916   .058 -.002 0   -.005 -.004 .007-.001  .003  .007
19670117   .052  .005 .003 .004  .005-.006 .007  .010  .016
19680930   .045  .007 .015 .018  .022 .015 .025  .027  .011
19730926   .04   .004-.003-.001  .016 .023 .012  .014  .024
19760107   .123  .010 .014 .026  .034 .034 .053  .059  .087
19790115   .044   -.015-.017-.011 -.012-.003 .008 -.029 -.028
                (lowest #s)
19790815    0   -.002-.003 .001  0    0   -.001 -.021 -.017
19840802   .432  .031 .032 .033  .050 .046 .037  .057  .049
19850605   .383  .005-.003-.002 -.011-.015-.018  .002  .004
19890112   .045  .002 .001-.003  .008-.002 .031  .050  .054
19910131   .106 -.002 .013 .019  .027 .061 .051  .056  .063
19950914   .156 -.001-.004-.007 -.007-.007-.003 -.008 -.008
19960912   .174  .012 .020 .020 .017 .017 .021  .017  .026
20030604   .085  0    .003-.007  .016 .009 .028 -.003  .011
20041108   .05   0   -.001 .008  .015 .015 .009  .004  .005
20050304  -.003  0   -.003-.012 -.015-.018-.028 -.042 -.047
20051121   .07   .005 .009 .010  .006 .009 .003  0    -.001
20060109   .051  0    .003-.004  .010-.012-.027 -.013 -.024
20061214  -.002  .002 .002 .004  0   -.001 na    na    na
20070712   .006  .003 .006 .008  .010 .006-.028 -.029 -.043
20101104   .12   .001-.002-.008 -.013-.020-.022 -.03  -.005
20120118   .043  .004 .011 .01   .014 .006 .011  .024  .016
20120314  -.005  .004 .003 .003 -.005-.009-.005 -.009 -.016
20130122   .107  .005 .008 .013  .018 .011 .019  .022  .016
20131113   .043  .003 .009 .010  .005 .015 .017  0     .002
20130513        -.006-.016   -.013
na = not available at this writing.
|
====================================================================
5/15/2014 The DJI's breakout past 16600 has failed.
A Re-test by the
DJI of 16000 seems likely.
Hold short some
of the low AI/200 (Accumulation) Bearish MINCP
stocks and hold long some of most bullish REITs. ( 10-Year interest rates
are falling.)
Short-term traders should use the optimized best short-term Stochastics
now with FAS, QQQ, DIA and SPY.
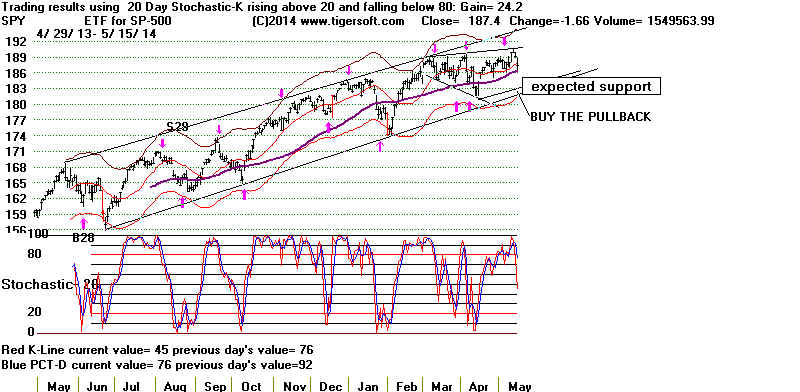
> To
Key Index and Leading Stock Charts: DJI, SP-500, etc.
DJI Chart SPY Chart NASDAQ Chart IBB
Chart IWM Chart
Hourly
DJI-OBV Hourly-MVM0735 FAS-3x Financials IBB-Biotechs
--> 29 -8
MAXCP stocks Bullish MAXCP
Stocks (5/15/2014) Bullish
plurality
Note the large number of REITS.
--> 228
MINCP stocks Bearish MINCP Stocks (5/15/2014)
--> 5 -8 New Highs on NASDAQ 47 +2 new lows. Bearish plurality
--> 28
-7 New Highs on NYSE 6 - 1 new lows.
Bullish
plurality
Breakout Failures
The best Buy B10s
start with as runaway moves. Prices should not fall
back below the
well-tested resistance of the previous pattern. When they
do fall back we
have a "failed breakout". See
http://tigersoft.com/PeerInst-2012-2013/FalseBreakouts/index.htm
Failed breakouts
should be considered a short-term Sell if they follow
soon after a Buy
B10. False breakouts without a Buy B10 normally retreat
to the lower 3.5%
band. Here Peerless gave a Buy B10. Failed breakouts
on a signaled Buy
B10 are usually limited. The biggest paper declines
after Buy B10s
have never been more than 4.0%.
Continue to avoid
all NASDAQ stocks below their 65-day ma. The NASDAQ
could still be
forming a very bearish head/shoulders pattern. The ETFs for
small stocks, IWM and FAS, could easily next
break below their April support
levels.
The closest
historical parallel I can find is in the second half of 1986 when
the DJI angled
upwards but was unable to break decisively above the
well-tested
resistance line drawn through a series of DJI theoretical highs.
That is true now.
Meanwhile, the NASDAQ, representing smaller stocks,
angled steadily
downward. That is true now.
Note how our use
of the DJI's theoretical highs and lows helps avoid
false breakouts.
When we began in 1981, there was no computerized
calculation of
the trading highs and lows as now. Compare the Tiger DIA's
chart with the
the Peerless chart of the DJIA. See how a few days
ago,
prices did
surpass the resistance line on the Tiger chart but they did
not on the
Peerless DJI chart. Buy B10s must do that. There must
be a
"clear" breakout with a close above the well-tested resistance line drawn
through the
theoretical highs. The same is true in reverse for Sell S10s.
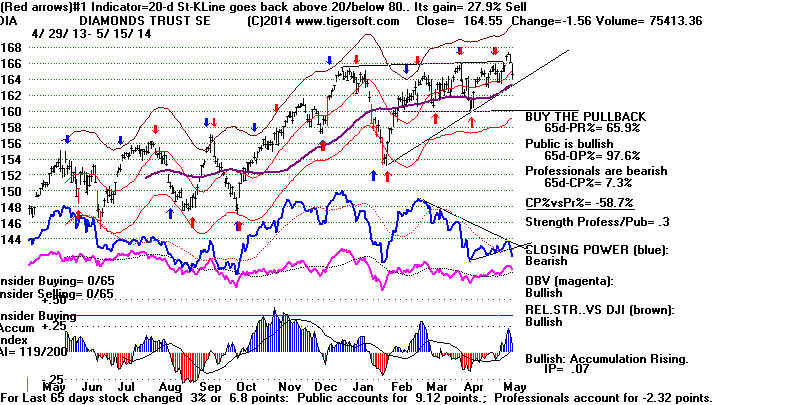
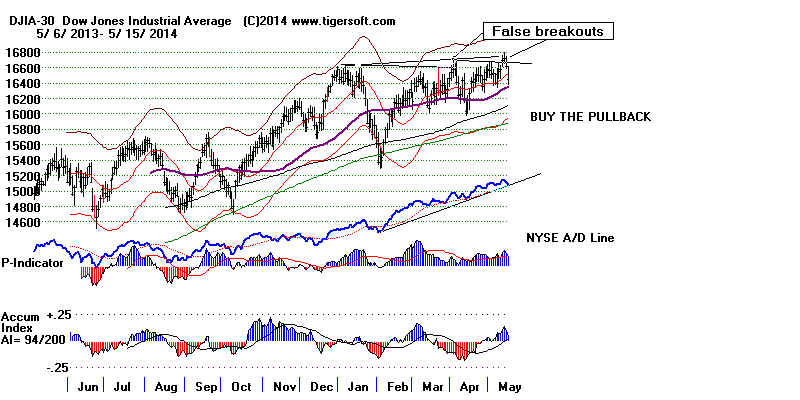
====================================================================
OLDER HOTLINES
====================================================================
5/14/2014
16600 Should Now Be Support
for DJI. If the DJI Drops
below 16550, then
16000 will likely be re-tested. Avoid all
NASDAQ stocks
below their 65-day ma.
Short some of the the Bearish MINCP stocks making ugly
new lows with red distribution and confirming Closing Power
weakness. Stay short as long as their CP downtrends are in place.
Only A Shallow 2%-3% Additional
DJI Retreat
Is Expected if the DJI cannot hold above 16550.
Despite today's 100 point sell-off, the DJI may not decline much
more.
A new rally that brings
a close clearly above its flat resistance would set it
on track to achieve
17800 in 10-12 weeks, provided the V-Indicator does stays
positive at the upper
band.
Previously since 1928, there have been 17 flat-topped DJI
trading ranges lasting
at least 4 months without a
decline of more than 10% within them. See Table 1 below.
15 of these 17 earlier flat
DJI trading ranges saw clear-cut breakouts. The breakouts
were not always very bullish.
Only 8 of the 15 breakouts saw a lengthy resumption
of the bull market.
But, the trading ranges are reliably bullish for traders when they
make clear-cut breakouts.
Marginal breakouts with or without Buy B10s that become false
breakouts are rare where the
P-Indicator and IP21 are very positive, as was true
yesterday on the Buy B10.
There was only one
serious false breakout in the 17 cases. That was in 2011 where the DJI
fell back 7.5% and then
resumed its upward trend. The nominal breakout by the
DJI in November 1986
only brought a 2 month further hesitation and only
a 3% decline.
These two cases are not bearish from an intermediate-term viewpoint.
They should give
intermediate-term traders some confidence to ride out whatever
dip may lie ahead.
Also keep in mind that there have only been 3 cases of 3.5%-4.0%
paper losses in the 46
earlier automatic Buy B10 cases.
However, if you are a
short-term trader (where positions are held normally for
only a few weeks), then
I would sell DIA if you have not already done so
if the DJIA closes
below 16560. A few days ago, I suggested using the
short-term 5-day
Stochastic K-Line either turning down above 80 or crossing below
its 5-day Pct-D in
those ETFs that can not breakout. This was the case
here with SPY, QQQ, OEX,
NYSE and FAS. When the
K-Line drop back below 20
and turn up, we can buy
them again. See the 5-day Stochastics for the DIA and FAS
just below.
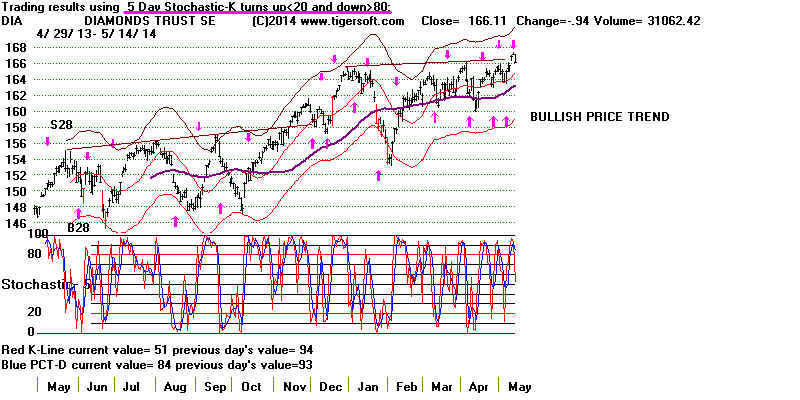
Table 1 DJI TRADING
RANGES with FLAT RESISTANCE
that were LONGER THAN 4
MONTHS.
Length of Consolidation
Outcome
------------------------------------------------------------------------------------------------------------------
Jan - June 1929 5 months and breakout.... Bear market started after
this rally ended.
Sept 1939 - April 1949 8
months and breakdown and bear market
June 1944 - Dec 1944 7 months
breakout.
Sept 1955 - March 1956 5
months breakout. 10% decline
began when this rally ended.
May 1968 - Sept 1968 4+
months breakout. Bear
market started after this rally ended.
April 1972 - Nov 1972 6+ months breakout. Bear market started
after this rally ended.
March 1976 - Jan 1977 10 months
months and breakdown and bear market.
August 1984 - Jan 1985 5+ months breakout. Bull market followed.
Jan 1985 - Jun 1985 4+ months breakout. Bull market followed.
July 1986 - Dec 1986 5+ months breakout. Bull market followed.
Oct 1989 - May 1990 7+ months breakout. Bear market started
after this rally ended.
June 1991 - Jun 1985 7 months
breakout. Bull market followed.
Sept 1994 - Feb 1995 5 months
breakout. Bull market followed.
July 1995 - Nov 1995 4 months
breakout. Bull market followed.
March 1996 - Sept 1996 6
months breakout. Bull market followed.
August 1997 - Feb 1998 6+
months breakout. Bull market followed.
March 2012 - Sept 2012 6
months FALSE BREAKOUT and 8% immediate
decline. .
May 2013 - Nov 2013 6
months breakout. 4% rally and then 7% decline. |
Small NASDAQ Stocks do not look very good as judged by this year's
large sell-off in
IWM and TNA. I have suggested they and the NASDAQ
are in for 6
months of downward pressure as they consolidate 2 years
of very big
gains. If this were like last half of 1986, the DJI would enjoy
a slightly rising
up-sloping consolidation.
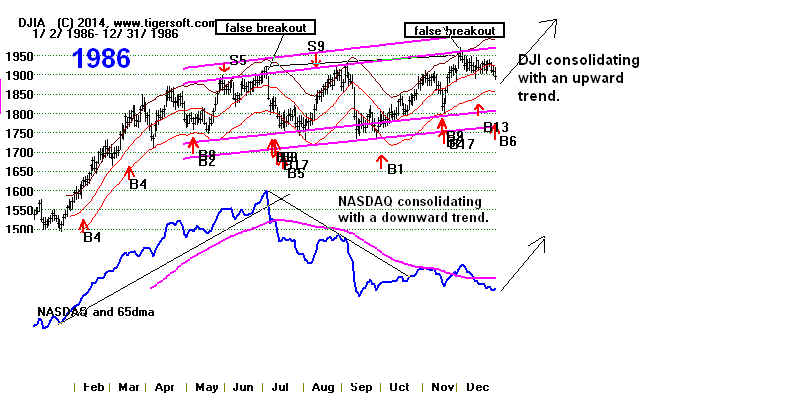
Surprisingly, the
avg price x avg volume Tiger Index for the Russell-1000
is holding up
well. So is its A/D Line. Though weak today, IWM and TNA
are still above
their April lows' support level. This tends to support the
July-Dec 1986
scenario's example for guidance now.
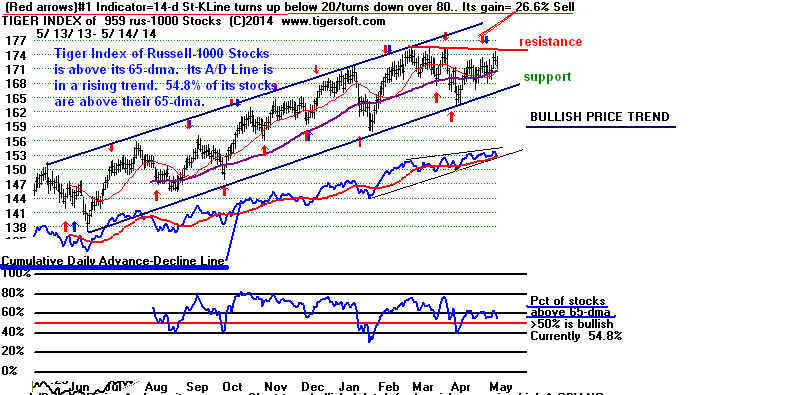
10-Year Rate
Trends and Stock Market Trends. (See below)
I take the recent dip in 10-year rates as
being bullish for stocks.
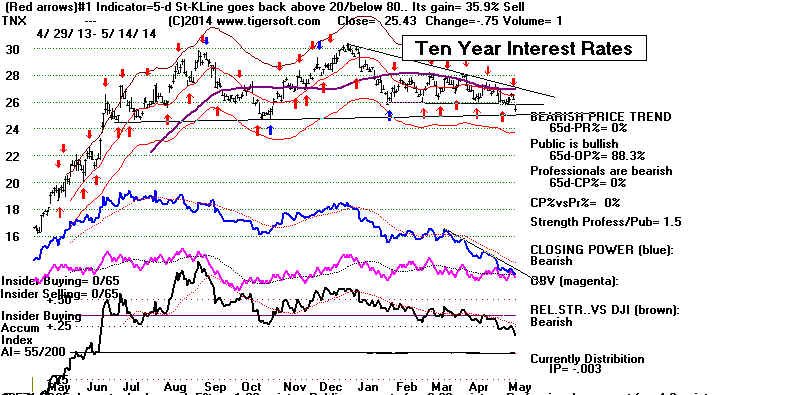 _______________________________________________________
> To
Key Index and Leading Stock Charts: DJI, SP-500, etc.
DJI Chart SPY Chart NASDAQ Chart IBB
Chart IWM Chart
Hourly
DJI-OBV Hourly-MVM0735 FAS-3x Financials IBB-Biotechs
--> 37 -35
MAXCP stocks Bullish MAXCP
Stocks (5/14/2014) Bullish
plurality
Note the large number of REITS.
--> 172 +124 MINCP stocks Bearish MINCP Stocks (5/14/2014)
--> 13 -35 New Highs on NASDAQ 45 +25 new lows. Bearish plurality
--> 35
-72 New Highs on NYSE 7 - 17 new lows.
Bullish
plurality
_______________________________________________________
10-Year Interest Rate Trends and The Stock Market's Trends
The study here of trends of interest rates and stock prices show:
> Rates establish multi-year trends
that do not match stock trends over
the whole length of interest rate trends.
> Steadily rising Interest rates are
bullish until they surpass 4.5% or 5%.
> Then additional rate increases are
bearish. The rising rates show
there is a strong demand for business and
investment loans. But
rates above 5% puts the stock market at
risk.
> Sudden, swift rises in rates often
causes steep sell-offs. 1978, 1979, 1987...
> Flat rates in a weak economy can
cause a very big decline.
> Flat rates in a strong economy
are bullish.
> I see no evidence here in US
rates that shows low rates
cause stock market declines!
Clearly, they have boosted
stock prices since March 2009.
> A steadily rising 10-year rate now
would actually be bullish.
> The recent current drop in
10-year rates back down from 3%
is not enough to reach any conclusions
from. But it does show a less
than vigorous business loan demand.
It also shows the Central Bankers
here and in Europe do not want to make
the same mistakes made by
their predecessors from 1930 to 1933 when
they mainly held rates
steady rather than lowering the cost of
borrowing to encourage business
and investment loans.
From 1915-1916 interest rates rose slowly from 4% to 5% and the stock market rose.
From 1917 to 1920 Interest rates rose from 5% to 7.22% and DJI fell.
From 1921 to 1929 interest rates fell steadily and DJI rose steadily..
In 1930 rates briefly spiked up above 5% and DJI collapsed.
From 1930 to 1932 interest rates held steady at 4% and DJI collapsed.
From 1933 to 1937 interest rates fell to 3 .5% and DJI rebounded.
In 1937 interest rates briefly jumped 1/2% and DJI collapsed.
From 1938 to 1945 interest rates fell 3.5% to 2.1% and DJI rose except at WWI's start for US.
From 1947 to 1960 interest rates rose from 2.1% to 4.2% and DJI rose steeply.
In 1960 rates rose steeply for 6 months and and DJI
fell.
From 1963 to 1966 interest rates held steady at 4% and DJI rose.
From 1968 to 1980 interest rates rose from 4.5% to rose 14.14%
and DJI suffered
many sell-offs and bear markets.,
never surpassing 1000
by much.
From 1982 to the present rates fell steadily to below 2% in 2012
with a big jump in 2009 as stock market rebounded.
From 2012 to 2014 rates have risen from under 2% to almost 3% now. DJI rose, too.
See http://www.tigersoft.com/tiger-blogs/8-18-2003/index.htm
http://www.ritholtz.com/blog/2012/01/222-years-of-long-term-interest-rates/
====================================================================
5/13/2014
New Peerless Buy B10
16600 Should Now Be
Very Good Support for DJI.
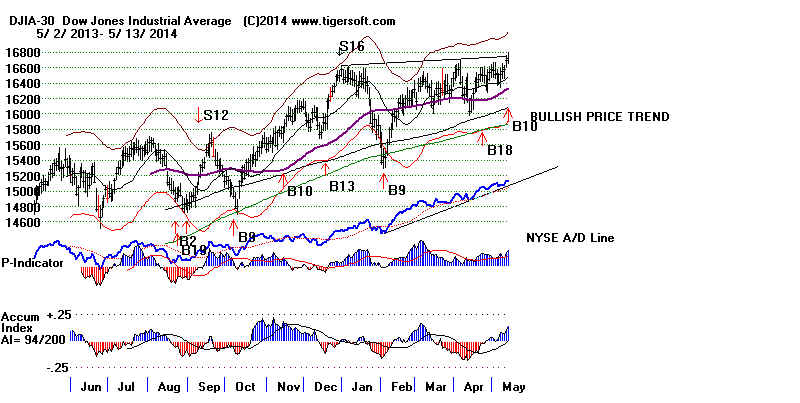
None of the key indexes and ETFs have
clearly moved up past their resistance
lines
drawn through their previous highs. Sellers are still evident. The Buy B10
breakout has failed to produce the runaway advance that such a breakout should.
So, a
pullback seems likely. Look at DIA, SPY, QQQ and FAS. See how the resistance
lines
all held against today's early rally. The NASDAQ and IWM much weaker.
This
is still a very defensive market, artificially being boosted by low interest rates.
Seasonality remains bearish, too. Avoid most NASDAQ small caps for now.
The
NASDAQ could still be forming a bearish head/shoulders top. It is below
its
65-dma and its RELDJI (relative strength versus the DJI) is
negative, though improving.
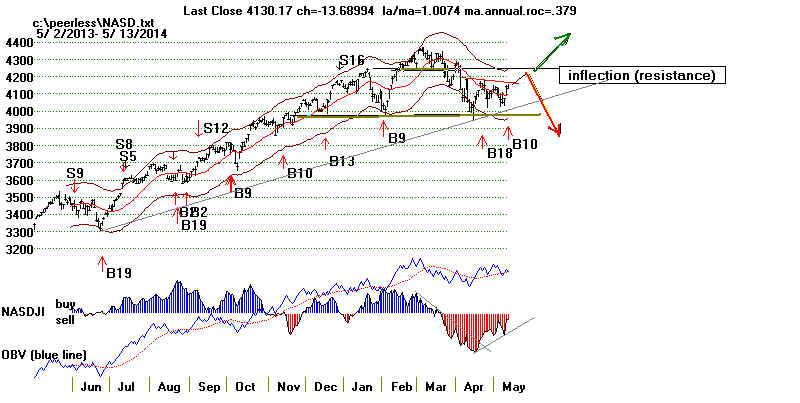
There
were two other signs of technical weakness technical in today's trading that
should make us concerned: there were more down than up on the NYSE
and new
lows
got the better of new highs on the NASDAQ.
The Buy B10 shows us
the DJI is still functioning well as market leader and reminds
us
how determined the FED is not to let the market, as represented by the DJI, NYSE,
OEX and SP-500, to start a big
decline in this year of Mid-Term Elections.
Buy
B10s are reliable. (See below.) Paper losses are normally small. In 46
cases,
there
was only three instances of paper losses between 3.5% and 4.5%.
Strictly on a charting basis, 16600 level should be very good support
for
the DJI. Meanwhile, classic technical analysis presents us with a very
favorable risk: reward ratio here for the DIA, OEX and probably the SP-500.
The
width of the trading ranging is about 1200 points. That allows us to project
an
upside target of 17800, 1100 points above where we are now, assuming
this
is not a false breakout.
Paper losses are kept small on Peerless Buy B10s. Besides the
breakout past
well-tested flat resistance, they require quite positive P-I and IP21
readings.
Note that the current key values are not very different than the
average key values
for
all Buy B10s since 1965. That should also give us some confidence.
Peerless Key Values on Buy B10s
Buy B10s: 1965-2013             Current Key Values
Number of Trades  =  27
Avg.Gain          = .077
Avg.Paper Loss    = .007
Avg.LAST/21DMA    =  1.03          1.014 (low)
Avg.PI            =  239.8         425
AVG.PI Change     =  35.0          47
AVG.Adj.PI        =  324.1         425 (high)
AVG.IP21          =  .113          .136 (above average)
AVG.V-I           =  23.8          23.0
AVG.OBV-Pct       = .268           .394 (above average)
AVG.65-dPctCh.    = .054           .058
> To
Key Index and Leading Stock Charts: DJI, SP-500, etc.
DJI Chart SPY Chart NASDAQ Chart IBB
Chart IWM Chart
Hourly
DJI-OBV Hourly-MVM0735 FAS-3x Financials IBB-Biotechs
--> 47 -25
MAXCP stocks Bullish MAXCP
Stocks (5/13/2014)
Note the large number of REITS.
--> 53 MINCP stocks Bearish MINCP Stocks (5/13/2014) Bearish
plurality
--> 19 New Highs on NASDAQ 22 new
lows. Bearish plurality
--> 47
-60 New Highs on NYSE 7 new lows. Bullish plurality
BUY B10s
Number Avg. Gain Avg. Paper Loss
Buy B10s since 1928
46
.117
.0089
Buy B10s since 1965
27
.077
.007
Buy B10s since 1984
19
.085
.008
Buy B10s since 2000
5
.062
.020
Mid-Term Election Yr. 11
.224
Mays
3 .147
From 11th to 20th of Month 19
.073
Mid-Terms ElYrs 2nd Qtr B10s None
with Democrat in White House since 1946
Buy B10s with LA/MA <1.03 and IP21> .10 <.15 are
rare
Gain Paper Loss
LA/MA
IP21
 441208     .09    .012    1.0216    .134
 540302     .575   .003    1.0167    .135
 140513      ?       ?     1.014     .136
|
====================================================================
OLDER HOTLINE
====================================================================
5/12/2014 The DJI has moved up past the 16000
round-number resistance,
but
it has not yet "clearly" closed above the well-tested resistance line going
through the DJI's previous hypothetical daily high peaks. Importantly, the Peerless
internals are improving enough to give us hope now that there will be no
Peerless Sell signal simply on another 150 point rally. Instead, there
may
even be a Peerless Buy B10. This would give us reason for thinking
the
DJI could rise another 1200 points in 2 months.
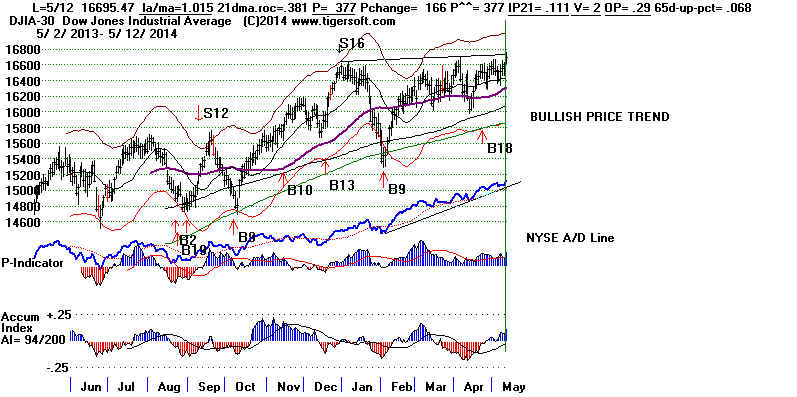
The OEX and SP-500 moved up, but they,
too, have not clearly broken out.
The
QQQ has risen back to the resistance of it's 65-day ma. We will want
to
watch it tomorrow. A continuation of its advance would give us confidence
that
the rally's participation is expanding.
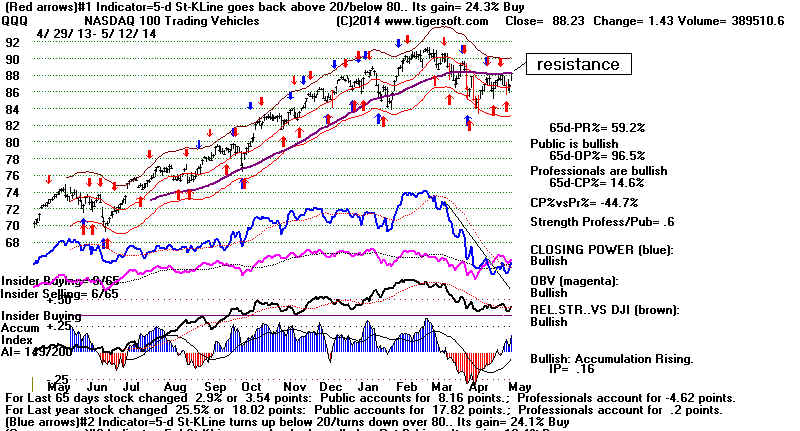
TNA and NASDAQ are quite a ways
below their 65-dma. So, their rally still
looks
like a technical rebound from an oversold condition. And if the NASDAQ does
not
surpass its key inflection point at 4250, there is a good chance its next decline
from
4200 will be steep and deep because of the head/shoulders pattern which will then
become more evident to traders.
Once
again the gains were made mostly at the openings. Some will
say
this was because of overseas buying. Cynics like me will say it
is
the result of a rally which is being "rigged" to permit Professional
at
advantageous prices. But, at least, the opening gains were held.
The
Closing Powers for the key ETFs are bullishly back above their 21
day
ma.
Though this
may be only a technical rebound for many NASDAQ stocks, there are
a
half-dozen, or so, attractive flat top breakouts among the
bullish MAXCP stocks.
Because
their numbers are small, they will each get more aggressive trading
money put
into them now and that could lead to some quick and exciting advances.
Reits are
favored. They combine volatility and susceptibility to
the benign influences
of low
interest rates. Despite the breakout, many of the lowest AI/200 stocks
remain
weak.
The Peerless DJI key values keep improving. The V-Indicator is now
slightly
positive.
The IP21 is above +.10. The A/D Line soared to another new high.
Instead of
a Sell S9V, we may see a Buy B10 tomorrow if we get another good
DJI move
upwards with the ratio of NYSE advancers outnumbering decliners by
3:1, like
today. This is partly because the numbers the 21-day may moving
averages
are quite negative.
The Stochastic-5 day K-Lines for DIA and FAS are still above their Pct-D Lines.
The best
trading system for FAS is shown below. The 5-day K-Line for FAS (below)
has risen
above 80. Its best trading system will call for a Sell if the K-Line
simply
turns down, but our rules require not to sell too quickly if there
is a
breakout above a well-tested resistance line. You can see in the
chart below
that FAS closed right at this resistance line. So, a further
rise should
cause us to just "hold" while a reversal tomorrow would be a
"sell".
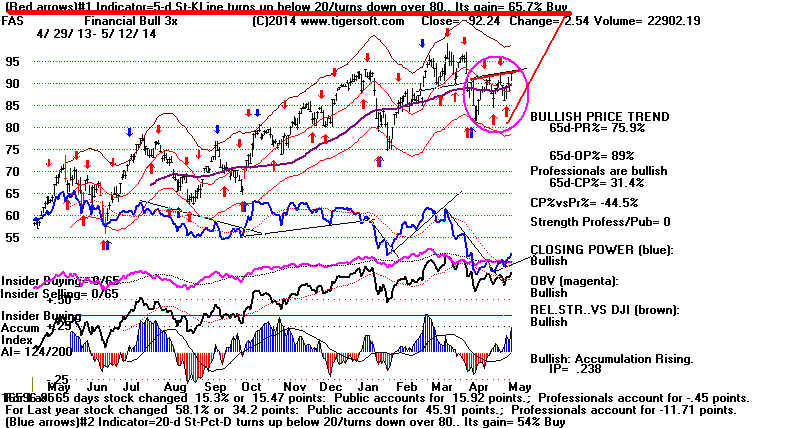
The advance
today certainly would have been more convincing if there had been
higher
volume. But the "dark pools" absorb and hide much of the trading volume.
So, the
excellent breadth, I think, is more important. In addition, breakouts like ours
here into all-time high territory tend to have more bullish potential.
If the DJI, REITs
and
dividend stocks do keep rising, speculative money will surely come
back into
many of the NASDAQ and biotech stocks that have recently
fallen back
15%-30%. Examples: AMZN, GOOG and YHOO. For now, it
seems
safer to
focus on stocks above their 65-day ma. Though beaten down, it is
bullish
that IWM and TNA have not broken
below their early April lows.
If they
won't decline, they will likely next rally to test the resistance of their 65-dma.
> To Key Index and
Leading Stock Charts: DJI, SP-500, etc.
DJI Chart SPY Chart NASDAQ Chart IBB
Chart IWM Chart
Hourly
DJI-OBV Hourly-MVM0735 FAS-3x Financials IBB-Biotechs
--> 72 +31
MAXCP stocks Bullish MAXCP
Stocks (5/12/2014) Bullish
plurality
Note the large number of REITS.
--> 48 MINCP stocks Bearish MINCP Stocks (5/12/2014)
--> 48 +38 New Highs on NASDAQ 20 -25 new lows. Bearish plurality
--> 107
+67 New Highs on NYSE 7 -15 new lows.
Bullish
plurality
====================================================================
OLDER HOTLINES
====================================================================
5/9/2014 DJI's 16000-16600 Trading Range Continues.
REITs are
probably the best industry group to trade long now.
.
Peerless Remains on a Buy. The Dollar jumped up today.
That
should mean that Yellen's low interest rate policy is safe for a
while
longer from a challenge by the forces of inflation (Gold, Oil
and
Food Commodities).
Seasonality remains bearish. Since 1965, the DJI has risen only
40.4%
of
the time in the week following May 11th. It falls an average of
0.5%
over the next two weeks. Based on seasonality, it may be
best
to wait until the end of June to buy. Arthur Merrill's research
showed that to be the best time to buiy if one is looking for a Summer Rally
in
the year of Mid-Term Elections.
> To Key Index and
Leading Stock Charts: DJI, SP-500, etc.
DJI Chart SPY Chart NASDAQ Chart IBB
Chart IWM Chart
Hourly
DJI-OBV Hourly-MVM0735 FAS-3x Financials IBB-Biotechs
--> 41 -27
MAXCP stocks Bullish MAXCP
Stocks (5/9/2014)
Note the large number of REITS.
--> 155 MINCP stocks Bearish MINCP Stocks (5/9/2014) Bearish
plurality
--> 10 -6 New Highs on NASDAQ 45 new
lows. Bearish plurality
--> 40
-11 New Highs on NYSE 22 -7 new lows. Bullish plurality
Still, the market's internals are improving noticeably.
The
Hourly DISI (OBV Line) is auspiciously angling up now. Yellen's
dovishness has clearly boosted the DJI and NYSE up-hour volume
compared to the hourly chart back in January.
HOURLY DJI
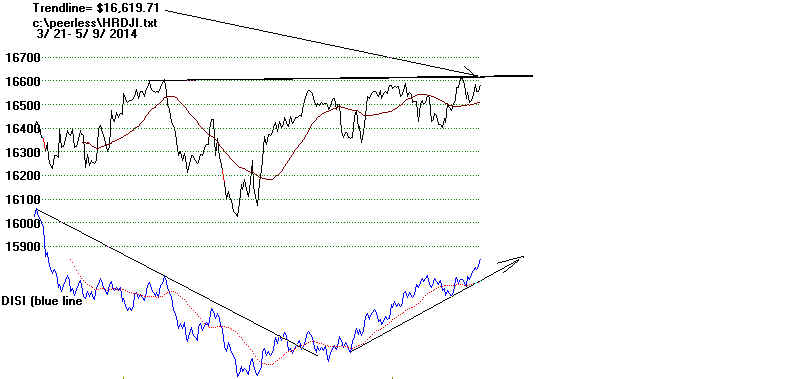
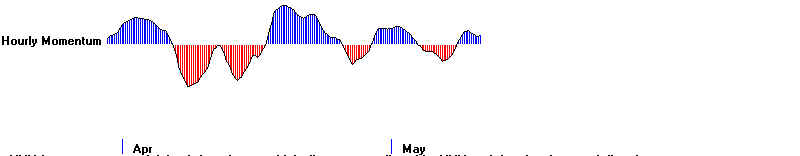
Both
the Opening Power and Closing Power are rising for DIA and
flat
tops "beckon for breakouts". Prices do not usually fall back
more
than 8% from DJI flat tops that have lasted 4 months. (See
Table
1 on the 5/2/2014 Hotline below). A clear breakout from the
12-point wide DJI trading range would set up a new target of 178
for
DIA or 17,800 on the DJI.
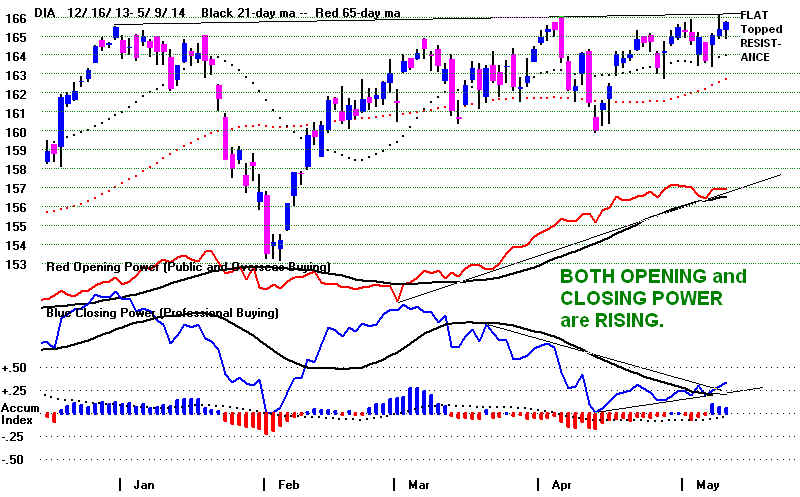
An Imminent Breakout?
Given
the Peerless Buy signals, it seems likely that the DJI will
breakout past 16600. When this will happen cannot be said with
any
confidence. Trading ranges have a way of lasting longer than
eager
buyers want. How far will prices go? The one in 1976 lasted
9
months. But in that case, the DJI was turned back at the pschologically
significant round number resistance of 1000.
Unfortuately if a breakout does occur soon the V-Indicator may be
negative on a rise to the 2.5% upper band. That will probably bring
a
Sell S9V, though we cannot be certain until all the data is obtained.
The "YES" referendum in
Eastern Ukraine to associate with Russia
should not cause immediately cause much trouble by itself for the market.
The
vote to disassociate from Ukraine was expected. But things
could
become dangerous in a few weeks. The Obama Administration's judgement
from
13,000 miles away that the Russian-speaking people there are engaging in
"an illegal act" by choosing the government they want seems weak and
ludicrous.
But
it may still have impact if it emboldens the Kiev controlled armies to march
forcibly into the Dontesk and Luhansk regions. German
intelligence sources claim
that
are 400 Blackwater mercenaries under the pay of the CIA are there
"advising"
the Kiev military. (We all remember that this is exactly how the
US
war on VietNam started.) In these curcumstances, Putin will be under great pressure
to
protect Russian speaking people there from the ultra-nationalists of the
Kiev
junta, What's more, he will surely do all he can to prevent NATO missiles
from
being pointed at Moscow from merely 300 miles away.
|
TRADING TACTICS FOR NOW
I
have suggested playing DIA and FAS long while their red 5-day Stochastic
K-Lines are above their blue smoothed 5-day Pct-D Stochastics. This
should keep us in synch with the short-term trends.
Good
stocks to buy are hard to find. I would normally want a good long candidate
to
show a Closing Power at least as strong as Price. (Keeping this simple,
the
Pr%-CP% ought not be be lower than, say, -.10). We want to see
a
Closing Power uptrend and recent very high Accumulation. And we want
to
see a rising trend of Relative Strength (RSQ vs the DJI). These
we
usually find in the Bullish MAXCP group.
But
that group shows only a handful of dividend and REIT stocks.
Consider the REITs. They will benefit from a
continuation of low
interest rates and, historically, the best of them can make nice advances.
NASDAQ plays are probably still there if the NASDAQ participates
well
in any DJI breakout. Unfortunately, the apex of the right shoulder
in
the potential NASDAQ head and shoulders pattern should restrain
any
advance there. That barrier would seem to limit the NASDAQ now
to
only a 2%-3% rise just ahead.
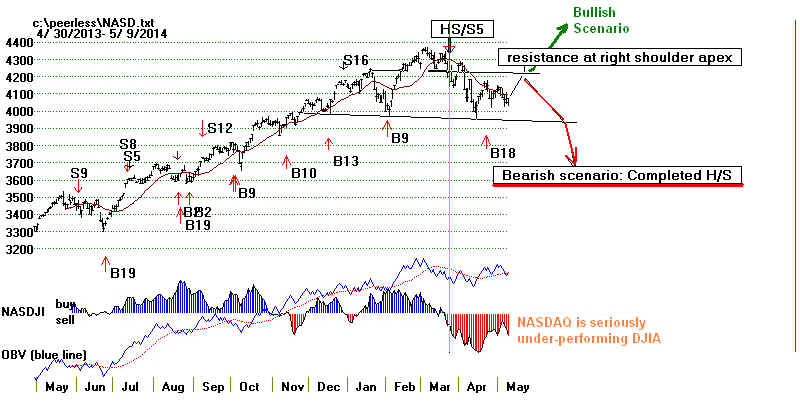
Flat Topped
Breakouts
Even when a stock's Closing Power
and Accumulation Index are weak,
it
can still be a good Relative Strength play if it hesistates just beneath
a
flat resistance area. Price breakouts in these case still can make
for
very nice trades. See the charts of GILD below and IBB in mid January.
See Flat-Topped
Breakout Study by TigerSoft (Apr 12,
2008)
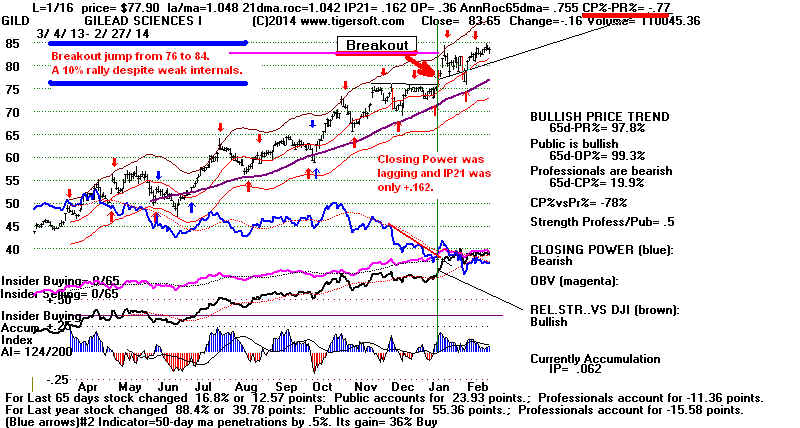
Here is a flat topped
breakout that made a good trade recently.
Closing Power was strong and the breakout surpassed a level
that had recently held back 3 separate tests. The problem
here was that you had to be watching this and buy it close
to the breakout. I would also be glad to accept 10% gains
at this stage of the market.
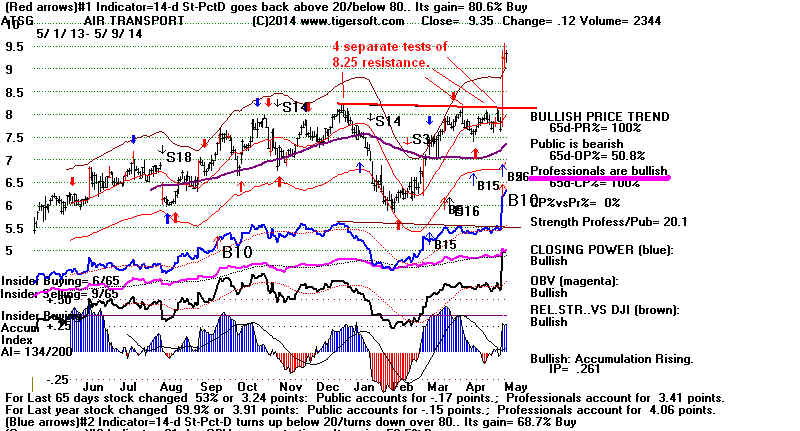
CURRENT POTENTIAL BREAKOUTS.
The
Power Ranker will find stocks hovering just below their highs.
But currently we have to then examine them to see if they measure up.
Here are a few now that might make good breakout 10% jumps.
Note that the automatic red and blue arrows are rendered
void by a clear beakout
above a flat top.
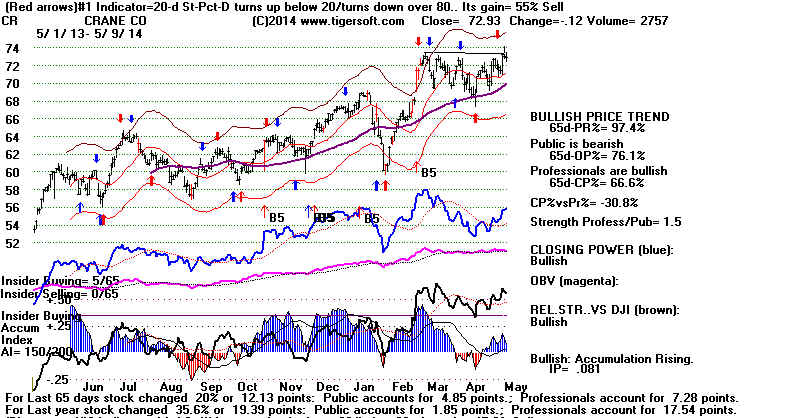
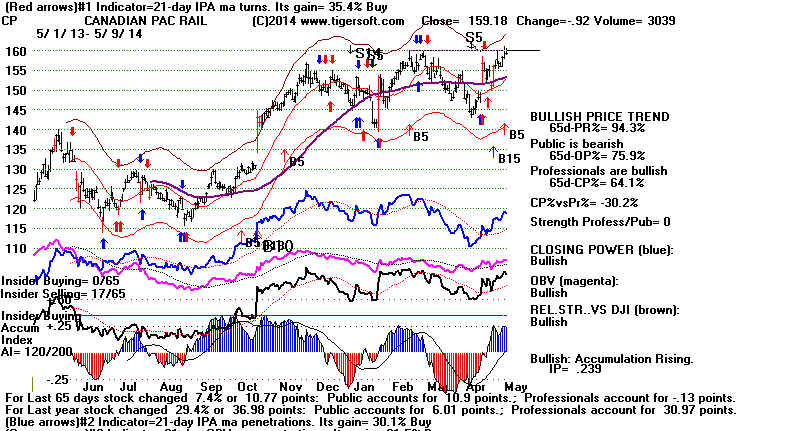
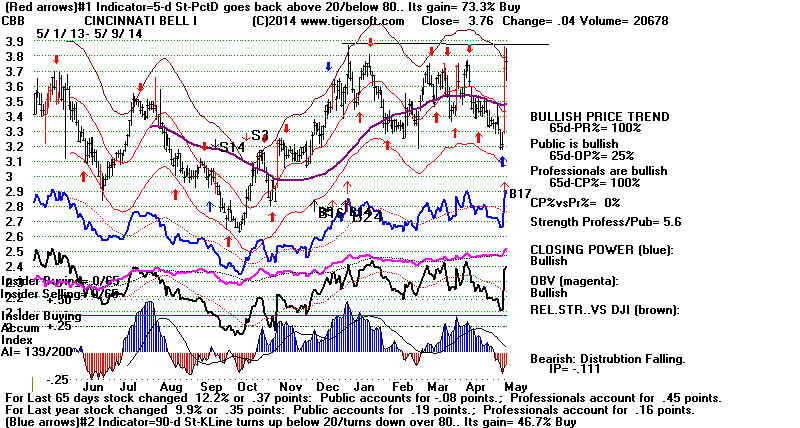
|
WATCH FOR CHANGES IN DIRECTION OF
65-DAY MA
IN PREVIOUSLYSTRONG STOCKS.
INSTITUTIONS OFTEN
DECIDE TO SELL WHEN THEY SEE THIS.
At this late
stage in the bull market, it pays to be cautious and
avoid most stocks
with falling 65-dma.
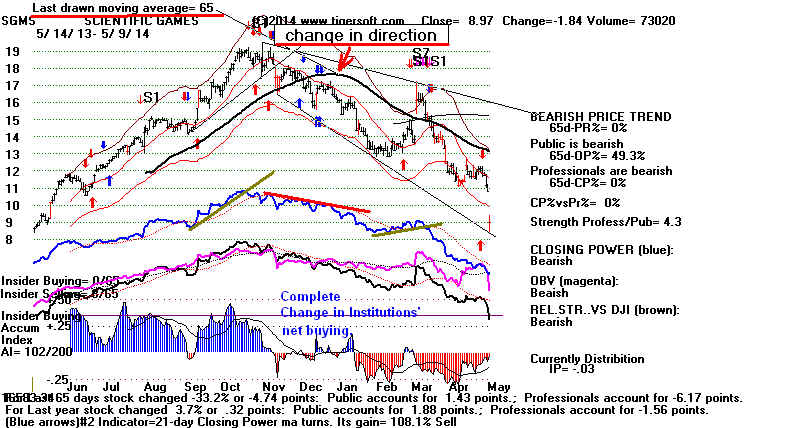 |
====================================================================
5/8/2014 DJI's 16000-16600 Trading Range
Continues.
Peerless Remains on a Buy. As predicted, the Dollar did
not
breakdown despite Yellen's assurances that rates would stay low
for a
long time.
As a
result, the A/D Line kept rising and trading long the most
bullish
REITs should work now. Short-term traders might want to
be long DIA, SPY and FAS
as
long as their 5-day Stochastics stay above their 5-day K-Line.
There
is a chance that the market will confound chartists and
make
a breakout. Not the improvement in th DJI's IP21 indicator.
This
shows that there is less over-head suppl of stock. Seasonality
does
work against the chances of much of a breakout. The DJI
typically falls off over the next two weeks. Since 1965, it has risen only
44.7%
of the time and falls on average 0.6% over the next two weeks.
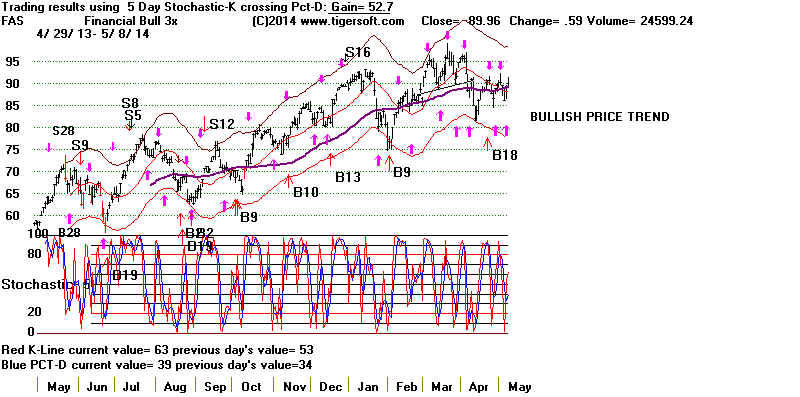

It doesn't take much for a Fed Chairman
to send stocks down.
Yellen commented: “There are pockets where we could potentially
see
misvaluations in smaller-cap stocks.” Oblique as this was, it resulted
in a
further decline in TNA and the NASDAQ.
It is not often that a
Federal Reserve Chairman singles out a particular group of stocks as
being
in a "bubble". Imagine how weak the market would be if the
Fed
made such a comment about the general stock market. The market
is
hooked on the mother's milk of the FED like never before.
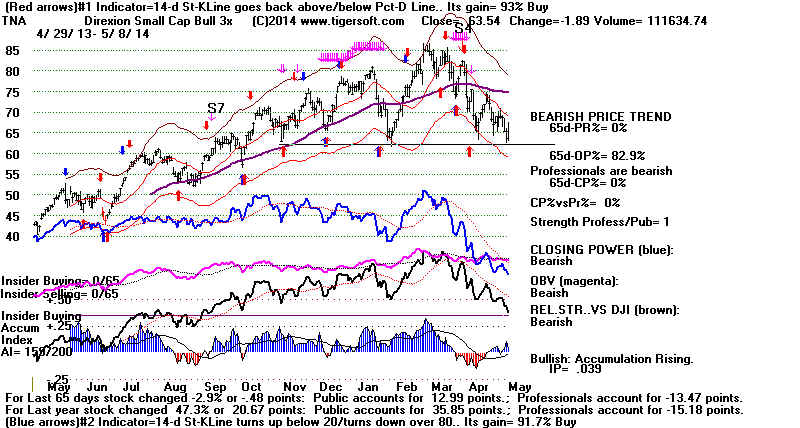
Meanwhile, our, Low ACCUM and BEARISH MINCP stocks keep
falling.
> To Key Index and Leading Stock Charts: DJI, SP-500, etc.
DJI Chart SPY Chart NASDAQ Chart IBB
Chart IWM Chart
Hourly
DJI-OBV Hourly-MVM0735 FAS-3x Financials IBB-Biotechs
--> 68
MAXCP stocks Bullish MAXCP
Stocks (5/8/2014)
Note the large number of REITS.
--> 338 MINCP stocks Bearish MINCP Stocks (5/8/2014) Bearish
plurality
--> 16 -4 New Highs on NASDAQ 89 -9 new
lows. Bearish plurality
--> 51 New Highs on NYSE 29 new lows. Bullish plurality
====================================================================
5/7/2014 DJI's 16000-16600
Trading Range Continues.
Peerless Remains on a Buy. The Short-term technical
outlook has improved. I doubt if the worsening Ukraine Civil War
will
hurt the US markets.
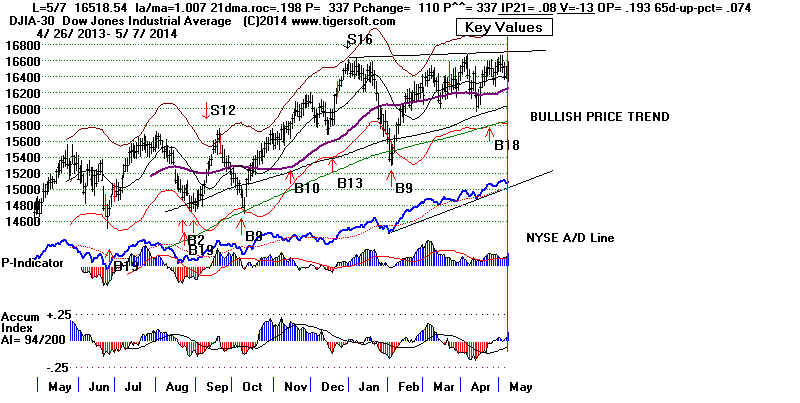
Yellen's remarks to Congress lifted the
DJI by 117 back above 16500,
thereby possibly preparing another challenge of the flat 5x tested
resistance at 16600. Her acknowledgement that there has been excessive
speculation in some smaller companies hurt the NASDAQ which
fell by more than 13.
The NASDAQ Biotech ETF (IBB) declined. The leveraged
small cap TNA
was unchanged. Its Closing Powers is still zig-zagging lower.
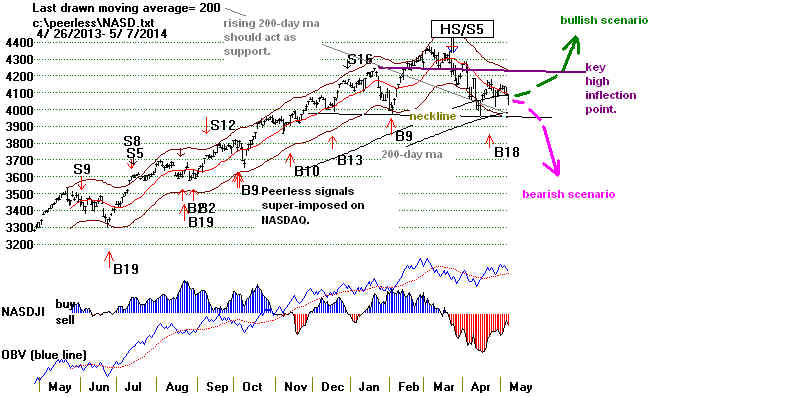
> To Key Index and Leading Stock Charts: DJI, SP-500, etc.
DJI Chart SPY Chart NASDAQ Chart IBB
Chart IWM Chart
Hourly
DJI-OBV Hourly-MVM0735 FAS-3x Financials IBB-Biotechs
--> 86
+32 MAXCP
stocks Bullish
MAXCP Stocks (5/7/2014)
Note the large number of REITS.
--> 297 +55
MINCP stocks Bearish MINCP Stocks (5/7/2014) Bearish
plurality
--> 20 New Highs on NASDAQ 98 +33 new
lows. Bearish plurality
--> 95 +62 New Highs on NYSE 41 +14 new lows.
Bullish
plurality
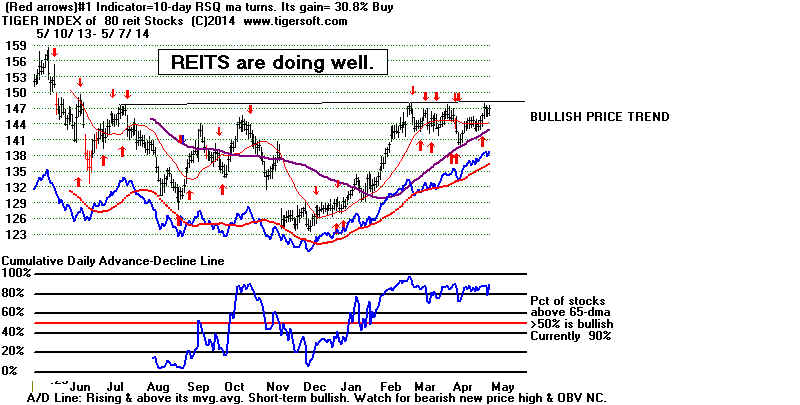
Not surprisingly. bank stocks and REITs got a big lift from Yellen's testimony.
FAS'es Closing Power is now back above its 21-dma. In
addition, the current best
trading system for FAS (a 5-day Stochastic K-Line) gave a new short-term Buy
signal.
FAS is bullish now that it is back in synch with major Peerless BUYs on the DJI.
But moves now are very short-term because of the narrow trading range and
the growing weakness in small caps on the NASDAQ. The advance now could
easily turn out to be just another minor "lurch" in a trading range. The
1976 DJI
trading range no fewer than 10 reversals at its flat resistance.
Breadth was excellent. Once again the dividend stocks outperformed most growth and
speculative stocks. Thus, though the NASDAQ remained weak, there were some new
Bullish signs. In addition, to those mentioned, we saw today.
1) a big jump in the DJI's IP21 (Current Accum.),
2) a big improvement in the V-I (which might prevent a sell
on the DJI
if it turns clearly positive,
3) the Hourly DJI's Momentum (7vs35) has turned up.
4) Both Opening and CLosing Power are above their 21-dma for DIA
and SPY
5) the QQQ's current best trading system (5-day Stoch) gave
new buy today.
Using 5-Day Stochastic K-Line
with DIA and FAS
In a trading range like this, minor moves can easily fool and whip-saw traders.
Right now I would, despite the Buy B16, prefer to be hedged by being short the weakest
MINCP and LOWACCUM NASDAQ stocks. Since finding stocks to play on the
long side has become so hard, very short term traders may want to go long DIA and FAS,
provided they heed 5-day Stochastic K-Line crossings of the Pct-D for buys
and sells until there is a DJI breakout past 16600 or a breakdown below 16000.
To be more aggressive, use the K-Line simply turning up below 20 for a buy
or turning down above 80 for a Sell.
See the FAS and DIA charts below with 5-day Stochastics and
their cross-over
buys and sells. The readings for the red K-Line and the 3-day smoothed K-Line, the
blue Pct-D are shown at the bottom of the Tiger charts. The top line shows the
trading results with this tool. The red arrows show the signals. Experienced
Tiger traders understand already that these are often very short-term and
the Sells are most likely to fail when there is a clear breakout above well-tested flat
resistance, such as the DJI and SP-500 now show.
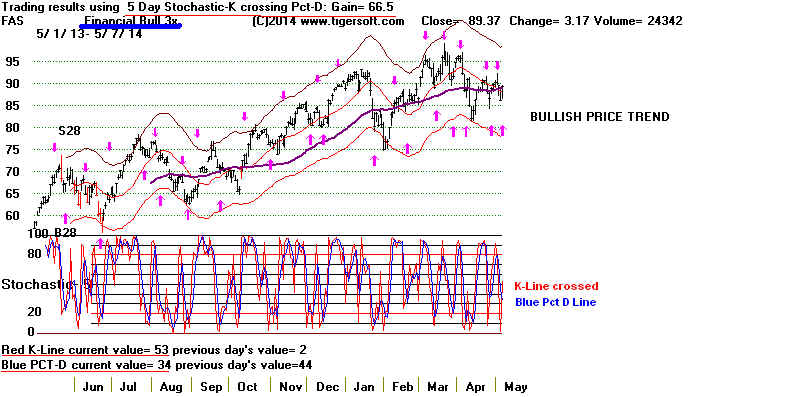
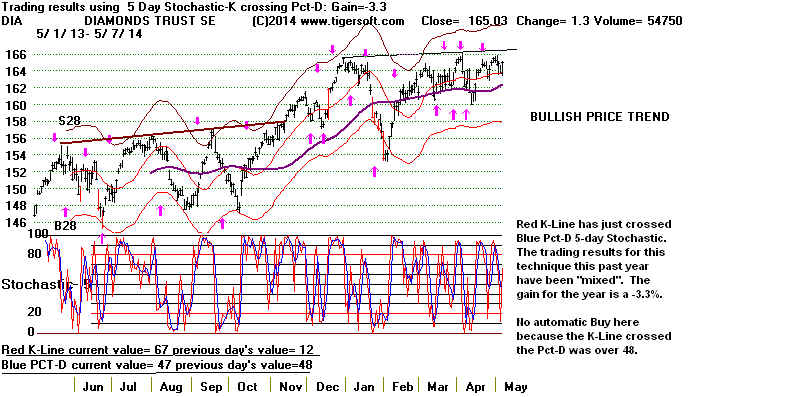
====================================================================
OLDER HOTLINES
====================================================================
5/6/2014
The DJI's 16000-16600 Trading Range
Dictates the
Action Short-term. Short-Term
Stochastics That
Test Well Should Work Here
for the Major
Market ETFs.
The DJI, having failed to surpass 16600
for the fifth time, now looks like it
will have to retest 16000. The NYSE and SP-500
will probably not be
affected much by a small 2%-3% additional decline in DJI. However,
many NASDAQ stocks look much more vulnerable. These are the BEARISH
MINCP stocks and the LOW ACCUM stocks that are falling back from
resistance.
Hedging now by shorting some of them is
suggested. See how
clear-cut
their technical weakness is as we measure it.
> To Key Index and Leading Stock Charts: DJI, SP-500, etc.
DJI Chart SPY Chart NASDAQ Chart IBB
Chart IWM Chart
Hourly
DJI-OBV Hourly-MVM0735 FAS-3x Financials IBB-Biotechs
--> 54
-10 MAXCP
stocks Bullish
MAXCP Stocks (5/6/2014)
--> 242 +130
MINCP stocks Bearish MINCP Stocks (5/6/2014) Bearish
plurality
--> 18 New Highs on NASDAQ 65 +30 new lows. Bearish plurality
--> 33 -14 New Highs on NYSE 27 +14 new lows.
Bullish
plurality
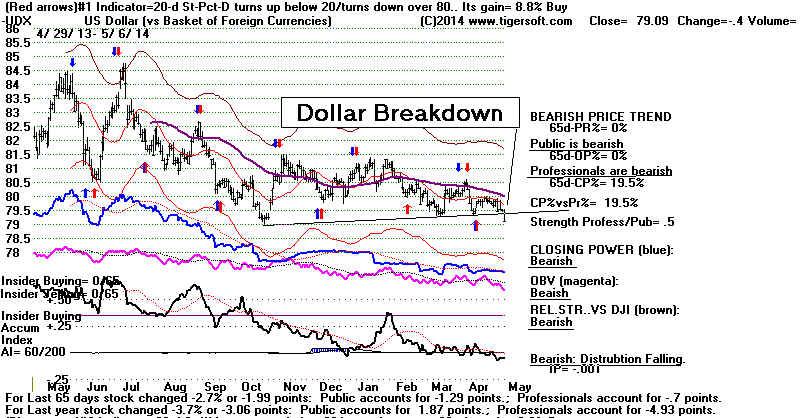
Has The FED Finally Pushed Low Rates
Too Long?
Yellen will testify tomorrow before
Congress. She might well be pressed hard to
justify FED policies that mostly seem to help Wall Street. 46
hedge fund managers
now
are worth more than a billion, apiece. Meanwhile, average real wages are going
nowhere for a 144 million American workers. And, of course, real unemployment is
much higher than the official numbers that the Administration claims.

Count on this: Yellen will hear from the right the very same warnings
Bernanke lomg encountered, namely that the FED's cheap money policies, its very red
balance sheet and the country's 17.5 trillion dollar deficit will surely eventually
bring the total collapse of the Dollar. The
risk of steep inflation
is
just too great to continue pursuing"dovish" policies. Conservatives
may also charge
that low interest rates have now helped achieve the stated objective of
Unemployment below 6.5%. So, it's high time to tighten up. Yellen's low
interest rates
are dangerous. The worth of the savings of those living on fixed incomes
must not be jeopardized! Etc...

Yes, I expect some Congressmen to make these criticisms. That could perturb the
market
for a day or two. But such criticisms are disengenuously made, I think. They
are made
for public consumption. Congressmen are personally quite pleased that the market
has done so well. Truth be told, they do not
want to risk its sudden collapse by "rocking the
monetary boat". Besides, too many of their biggest campaign contributors hail
from
Wall Street.
So is the new low in the Dollar the "beginning of the end"? This all seems
a
a little extreme, very premature and very political. GLD (-.24), SLV (-.04) and
Crude Oil all fell today. If the Dollar were about to collapse, they would be rising!
Still, Dollar weakness may briefly spook the market and cause more easy
profit-taking
in the DIA, SPY, NYSE which are still at their highs essentially. A retest of 16000
on the DJI would seem to be consistent with trading range behavior, the fact that
May and June are seasonally bearish and the Peerless V-I and Accumulation Index
are way too low to suggest that a breakout above 16600 would bring gains of more
than 2%.
The NASDAQ and secondary stocks are weaker than the DJI. Low interest rates
are not enough to hold them up. See below how the NASDJI Indicator in the NASDAQ
chart is quite red. This shows the its relative strength is negative versus the DJI.
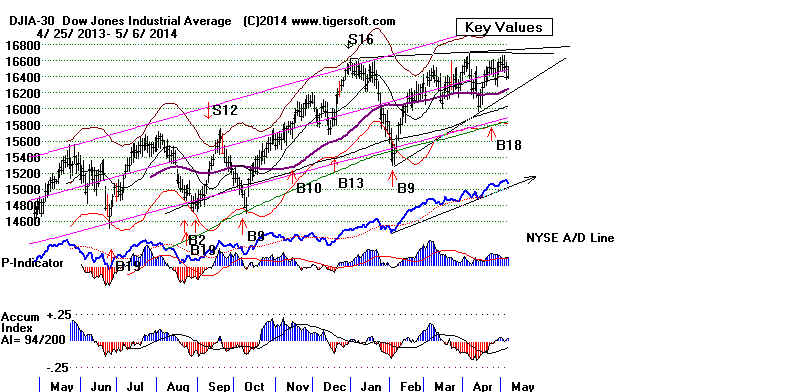
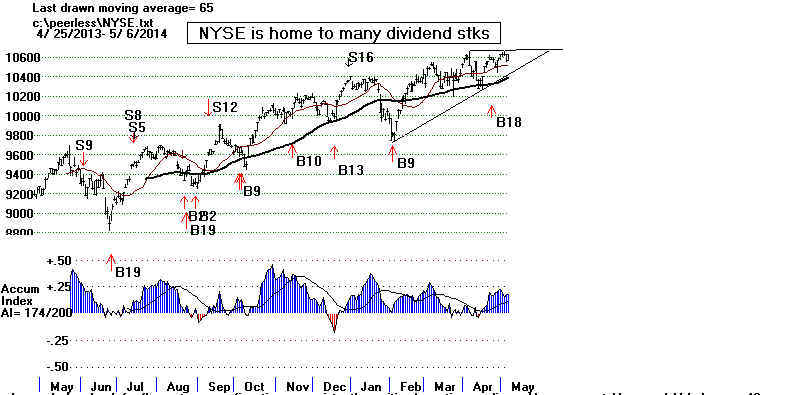
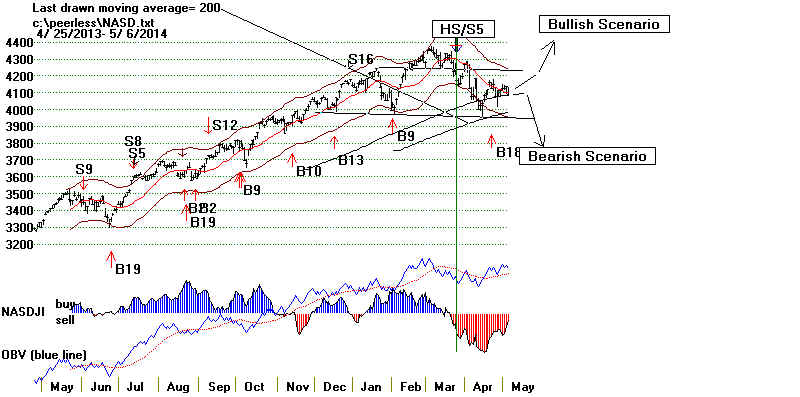
====================================================================
OLDER HOTLINES
====================================================================
5/5/2014 Janet
Yellen To The Rescue Again!
 The early morning decline today was
quickly reversed
The early morning decline today was
quickly reversed
when
traders saw that the Administration decided not to "shoot from the hip" and
took a more
"wait and investigate" attitude toward the latest horrors and killing
now in
Southern Ukraine. But more important, I think, traders realized that
the
super-dove Janet Yellen would be testifying on behalf of the FED both
Wednesday
and Thursday before Congress. As a result, the 80-point DJI
reversed
back upwards after a weak opening today and this served to lift our
Closing
Power for DIA, SPY and QQQ back above their CP 21-day mvg.avgs.
NYSE
breadth remained negative. That is a warning. But immediately
ahead,
prices should move higher. The crossing of the CP back above its 21-day
ma is
short-term bullish. Today's switch in the juxtaposition of the CP versus its
ma means
about +0.2% average daily difference in what the DIA will do between the
opening and
close.
Note below
also that the optimized system is now on a sell. Such 5-day Stochastics
usually
work well, but a breakout past a flat top is considered by us to void such sells.
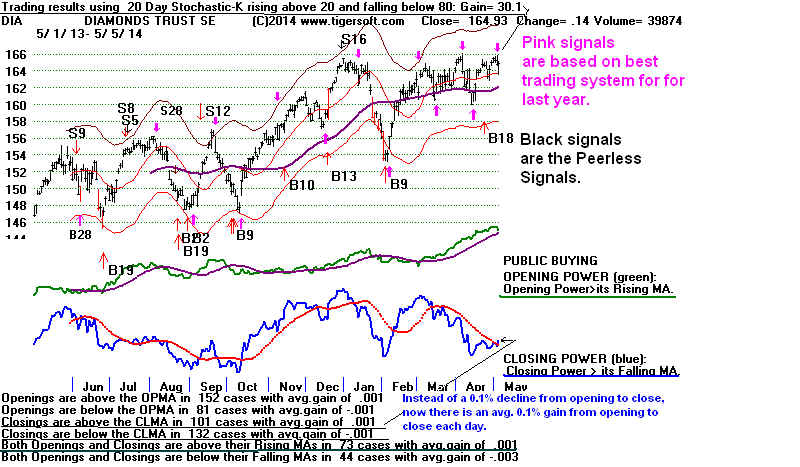
Given that
the current DJI's IP21 is still barely above 0, it is not clear that the
institutional distribution will be curtailed enough as the DJI and SP-500 prices approach
their
yearly highs to permit clear breakouts.
Our target
if there is a breakout past the flat resistance at 16600 is the DJI's
upper 2.7%
band, near 16850. This is because the V-Indicator is quite negative.
A Sell S9V
will likely result on any DJI close 2.5% over its 21-day ma. (See
the notes
on this in the last few hotlines.)
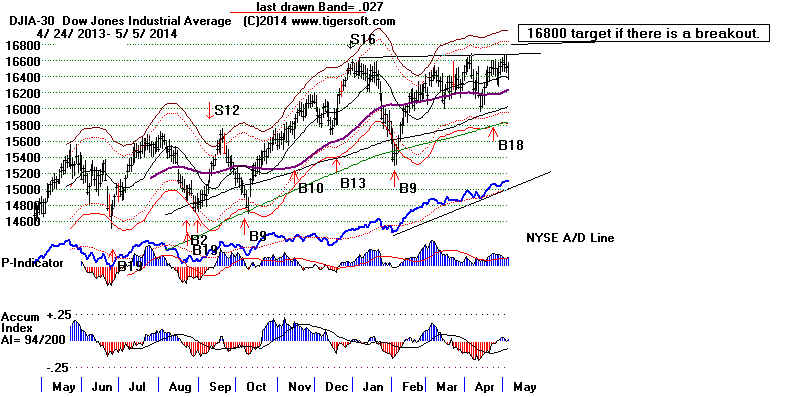
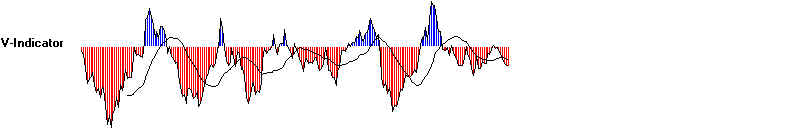
Picking Good Stocks Has
Gotten Much More Difficult
Than at Any Time in the Last Two Years
I am struck
by the general absence of attractive BULLISH MAXCP
stocks and
the abundance of BEARISH MINCP stocks now. I think
what
this is
saying is that Yellen and the Fed will be able to prop up the market only for
a short
while longer using low interest rates. Bullish dividend stocks cannot
bring a new
bull market. Meanwhile, there are many speculative
stocks that
are still in the process of digesting very big gains from
the last
two years, since QE-II began in 2011. That is why the NASDAQ
might be
forming a bearish head/shoulders pattern and both TNA and
IWM have Closing Powers that are still below their 21-day ma.
(When
the DJI and
the NASDAQ de-coupled in 1986 like we see now, the
NASDAQ
swooned for 6 months while the DJI hovered near its highs
without
breaking decisively out of its 9% trading range.)
> To Key Index and
Leading Stock Charts: DJI, SP-500, etc.
DJI Chart SPY Chart NASDAQ Chart IBB
Chart IWM Chart
Hourly
DJI-OBV Hourly-MVM0735 FAS-3x Financials IBB-Biotechs
--> 64 +14
MAXCP
stocks Bullish
MAXCP Stocks (5/5/2014)
--> 112 -36
MINCP stocks Bearish MINCP Stocks (5/5/2014) Bearish
plurality
--> 14 -8 New Highs on NASDAQ 35 -2
new lows. Bearish plurality
--> 47 -13 New Highs on NYSE 13 +4 new lows.
Bullish
plurality
Finding Good Stocks To Short
Many of the weakest stocks today were those showing very high long-term
red distribution. See the top
of the BEARISH MINCP stocks tonight.
I suggest studying these charts.
In many cases, they show the limits to
which short covering rallies can
go.
Reversals down from the falling
65-dma often make excellent short sales
when there has been a long period
of red distribution. Low levels of AI/200
(below 60) show this. I would also
want to see the Closing Power hook down
and the IP21 be below zero.
Red popsicles on the TigerSoft candlestick charts
are another bearish factor as is
increased daily down volume (Tiger S14).
Sometimes you will also
continuation head and shoulders patters. In
addition, the Tiger Day Traders'
Tool and Relative Strength Quotient will
be in steep downtrends.
AI/200
Day's Decline Technical development
OLED 59
-9%
new 12 month low with Closing Power leading prices down.
JIVE 35
-8%
Reversed
down from falling 65-dma
VHC 44
-7%
Reversed
down from falling 65-dma
NKA 53
-6%
reversed down from resistance of
recent highs. Tiger S14 high downside volume.
IRDM 39
-6%
reversed down from resistance of
recent highs. Tiger S14 high downside volume.
SHOS 52
-5%
Reversed down from falling 65-dma
WLT 16
-4%
ONE
55 -4%
HMST 44
-4%
Reversed down from falling 65-dma on Friday. Completed head/shoulders
GFF
47 --4%
Reversed down from falling 21dma
BIOS 58
-4%
Reversed down from falling 65-dma on Friday
The Tiger Power Ranker presently finds
the stocks that have just dropped below
their 50-day ma. This is a
TigerSell S29 and is flagged as 269 in the Tiger Amalysis
Lists, "CRUND50DA".
This is a useful tool. Here is what it produced tonight in
the NASDAQ-100
ATW
47.64 AI/200= 44 but both Closing Power is now above its CP MA.
AXL 18.35 AI/200=54 CP is bearishly below its
falling CP MA.
See the chart below. The 5-day Stochastic red signals have gained
95% this past year long and short. Traders can put extra trust
in signals that are this profitable, especially when other technicals
concur.
GM 34.75 AI/200=58 IP21=-.159 Closing Power is now above its CP
MA.
....
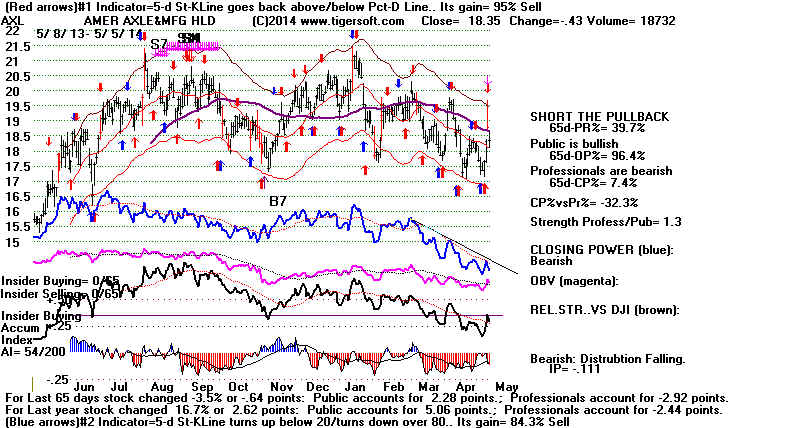
(Finding stocks in a directory that just penetrated below their 65-dma still needs to be
programmed. In the next Peerless
Update, we will use the commands.
PEERCOMM + Charts-2014 + Runs/Setups
(upper left) + Flag ...65dma penetrations + OK
(This will load up a list of
such files in the Analysis List CRBELOW65.)
To see their graphs use:
PEERCOMM + Charts-2014 + Pick
"CRBELOW65" in the middle section displayed + OK.)
====================================================================
OLDER HOTLINES
====================================================================
5/2/2014 Another
Pull-back to DJI 16000 seems likely.
Instead of
shorting DIA or QQQ, traders should consider buying the
leveraged short
ETFs SDOW or SQQQ. The Closing Powers for
these are way
above the levels that would be predicted by their price alone.
(See their charts
at the bottom of this page.)
There is probably
limited upside potential. A 2% DJI rally from here
could easily
bring a Peerless Sell S9V. We note that early May Peerless
sells are
particularly reliable and the existing B18 is weakened by the
negative IP21
when it occurred last month.
> To Key Index and
Leading Stock Charts: DJI, SP-500, etc.
DJI Chart SPY Chart NASDAQ Chart IBB
Chart IWM Chart
Hourly
DJI-OBV Hourly-MVM0735 FAS-3x Financials IBB-Biotechs
--> 50
MAXCP
stocks Bullish
MAXCP Stocks (5/2/2014)
--> 148 MINCP stocks Bearish MINCP Stocks (5/2/2014) Bearish
plurality
--> 22 -7 New Highs on NASDAQ 37 +1
new lows. Bearish plurality
--> 60 -9 New Highs on NYSE 9 -9 new lows.
Bullish
plurality
Any Decline Should Be Shallow.
The Peerless Buy
B18 that operates for the DJI suggest there will still be a breakout.
But B18s with low
Accumulation Index readings nearly always bring very modest
gains.
It's bearish when
the market cannot rise on such a good Job's Report as we got on Friday.
If it cannot rise on such news, what will it do on bad news? We're told the
weakness owed
to the escalating
violence in the Ukraine. But I doubt that. Americans are very tired of
wars 12,000 miles
from home and other than a lot of talk and some sanctions, there's little
the
Administration can do to hurt Russia, assuming that Russia is actually to blame for most
of
the fighting in
Eastern Ukraine and now Odessa. (This assumes that the US is smart enough
to distance
itself from the fascist nationalist Svoboda Party in
the Ukraine, which
would love
nothing more than to bring in the US military to fight its battles to achieve
its openly racist
ends.)
A Shallow Decline back to 16000 Seems Likely
The DJI
having failed to breach 16600 will probably have to plumb for support.
16000 seems
the nearest support. Keep in mind that May and June's
seasonality have
bearish
since 1965.
Avg DJI Pct Decline Pct of Year DJI Rose.
3 trading days after May 4th
-.2%
.383
5 trading days after May 4th
-.1%
.426
10 trading days after May 4th
-.3%
.404
21 trading days after May 4th
+.1%
.532
42 trading days after May 4th
-.6%
.404
It's not likely that we will see a big DJI decline below 16000 before
there is a breakout
above
16600. This is because of the powerfully confirming A/D Line we are still seeing 5+
years into
our bull market now. Of the 16 DJI declines since 1945 of more than 15%, only
3
did not
show a NYSE A/D Line non-confirmation of DJI new highs over more than 3 weeks,
What about
the exceptions? Might their technicals apply now. The exceptions were the tops
of May
1946, December 1976 and May 2009.
1)
The May 1946-June top could easily have been avoided by noting its classic head/shoulders
top.
The DJI
shows no head/shoulders pattern now. But the NASDAQ does. That suggests we
may now see
the DJI hold up well but also see he NASDAQ weaken as in the second half
of 1986.
2) The
December 1976 top was made on the 12th failure to get past the 1000-1010
resistance
over 11 months. The DJI has only been trapped in its current trading range
4 months.
The odds heavily favor a breakout from this type of price pattern.
See this in
the Table 1 below. It shows all the cases where the DJI was caught in flat-topped
trading
ranges of at least 4 months (like now) where the DJI did not have an intervening
decline of
more than 10%.
3) The July
2011 top did see a minor A/D Line NC just before a 18% sell-off. The real
trigger to
sell for us was the Sell S9V. The DJI approaches the upper band with the V-Indicator
negative.
(Normal S9s occur when the DJI tags upper band with the P-Indicator negative.)
Table 1 DJI TRADING RANGES
with FLAT RESISTANCE
that were LONGER THAN 4 MONTHS.
Historically 15 of
17 saw breakouts. Only 8 saw strong resumption of the bull market.
Jan - June 1929 5 months and breakout.... Bear market started after
this rally ended.
Sept 1939 - April 1949 8
months and breakdown and bear market
June 1944 - Dec 1944 7 months
breakout.
Sept 1955 - March 1956 5
months breakout. 10% decline
began when this rally ended.
May 1968 - Sept 1968 4+
months breakout. Bear
market started after this rally ended.
April 1972 - Nov 1972 6+ months breakout. Bear market started
after this rally ended.
March 1976 - Jan 1977 10 months
months and breakdown and bear market.
August 1984 - Jan 1985 5+ months breakout. Bull market followed.
Jan 1985 - Jun 1985 4+ months breakout. Bull market followed.
July 1986 - Dec 1986 5+ months breakout. Bull market followed.
Oct 1989 - May 1990 7+ months breakout. Bear market started
after this rally ended.
June 1991 - Jun 1985 7 months
breakout. Bull market followed.
Sept 1994 - Feb 1995 5 months
breakout. Bull market followed.
July 1995 - Nov 1995 4 months
breakout. Bull market followed.
March 1996 - Sept 1996 6
months breakout. Bull
market followed.
August 1997 - Feb 1998 6+
months breakout. Bull
market followed.
March 2012 - Sept 2012 1998 6
months false breakout and 8% immediate decline. .
May 2013 - Nov 2013 6
months breakout. 4%
rally and then 7% decline. |
Professionals Are Mostly Net Sellers
Below I show a
technique for reckoning the likely behavior of key ETFs based
on their Closing
Power, Openings Power and current Accumulation Index (IP21).
This does not
factor in Peerless, the automatic Buys/Sells, price formations or
where the ETF is
in relation to its likely support and resistance based on earlier
highs and lows or
where the important 65-dma was. A table of these other
considerations
could also be prepared. But, I think what follows will help, too.
Professionals, I
repeat are mostly net sellers here. The Closing Powers for the all the key
ETFs, except SPY,
are below their 21-day ma and most have not broken their downtrend lines.
This is important
because it means market makers and big banks (backed by the FED)
are
"rigging" higher openings so that they can sell short and await the heavy
institutional
selling that has
been dominant and which we can spot by noting the negative Assumption
Index readings.
The numbers in parentheses are the average gains for the last year
when the
specified conditions were true. For example, the average daily gain for IWM
when the Closing
Power was below its CP ma was -.003 or -0.3%. But when IWM's
Closing Power was
above its 21-day ma, the average daily gain was +.002. The daily
gain is
approximated by adding avg. over-night gain (Value 1) to the change after
the opening
(Value 2). We will generally want to trade when average daily gain is
higher, as with
TNA which falls an average 0.6% per day when the Closing Power
below the CP MA
despite its average overnight gain of 0.5%. The biggest
and quickest
gains when the both Opening Power and Closing Power are above
their MAs.
This is the the BOTHUP condition. The biggest losses often occur when
the both Opening
Power and Closing Power are below their 21-dma.
IP21 OpPower
ClPower Avg
Daily
vs its MA vs
its MA Change when
(Value 1)
(Value 2)
this CP and OP
are BASIS of
MOVEMENT
(Value 1 + Value 2)
------------------------------------------------------------------------------------------------------------------------------------------------
DIA 164.79 -.43 -.056
Above (+.001)
Below (-.001)
0 - flat (88 cases)
QQQ 87.49 -.16 -.022
Above (+.002)
Below (-.002)
0 - flat (87 cases)
SPY 188.06 -.23 +.069
Above (+.001)
Above (.002)
+.003 (83 cases)
IWM 112.03 +.19 -.02
Above (+.002)
Below (-.003)
-.001
(88 cases)
FAS 90.18 ---- +.001
Above (+.005)
Below (-.005)
0 - flat (106 cases)
TNA 68.97 +.39 -.019
Above (+.005)
Below (-.011 )
-.006
Leveraged Short ETFs Show
A Bullish CP Divergences from Price Buys
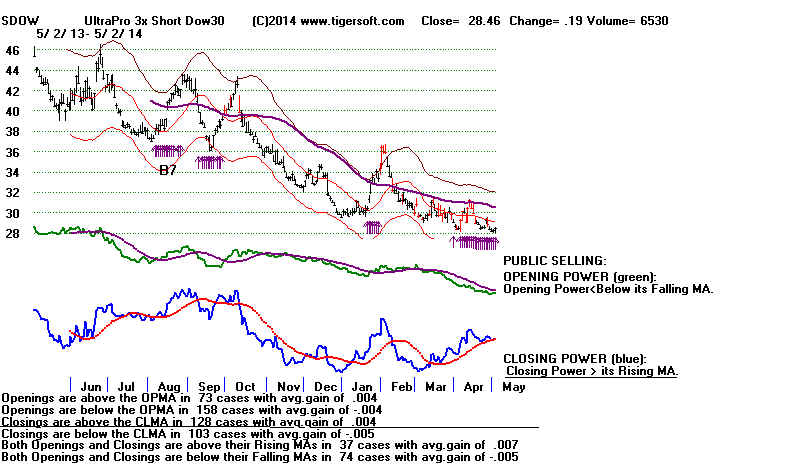 |
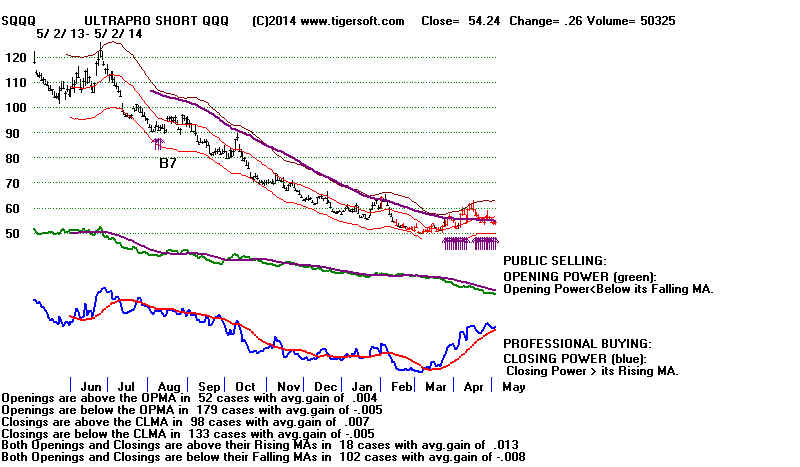 |
====================================================================
OLDER HOTLINES
====================================================================
5/1/2014 Be careful here. A 2% DJI rally could easily bring a Peerless
Sell. Early May Peerless sells are particularly reliable.
A surprisingly good jobs report tomorrow, more than 150,000 new jobs
could give the DJI the impetus it needs to breakout over the
16600 resistance.
The Peerless Buy B18 and good breadth has been suggesting
a DJI breakout
despite the glaring weakness in the NASDAQ, small caps and Biotechs. These
growth and speculative segments have been gradually improving. Their Closing
Powers have now risen back the resistance of their falling 21-day ma. A DJI breakout
could be the boost they need to begin their rallies back to their falling 65-day ma.
Unfortunately, a breakout tomorrow even if accompanied by strength in the
NASDAQ, could easily produce a new Peerless Sell S9-v based on the fact
that the V-Indicator would probably still be negative if the DJI closes 2.5% over
the 21-day ma. Compare the Peerless key values now with what they were
on May 2nd, 2011
when Peerless produced a successfully bearish Sell S9-V
as well as a Sell
S8 and a Sell S5.
The key values now are all lower, except
the P-Indicator which is the same. Note that the momentum of the DJI's 21-day
ma (aroc -.019) is nearly flat. As little a DJI rally as 200 points from here could
easily
bring a Sell S9V.
5/2/2011
key values on a successful S5, S8 and S9
la/ma= 1/028 aroc=.467 P= +212 Change=-50 IP21=.146
V=-17 OP=.349 65duppct=.068
5/2/2014 key values:
la/ma= 1/01 aroc=.019 P= +212
Pchange=-43 IP21= .025 V=-40
OP=.083 65duppct=.039
> To Key Index and Leading Stock Charts: DJI, SP-500, etc.
DJI Chart SPY Chart NASDAQ Chart IBB
Chart IWM Chart
Hourly
DJI-OBV Hourly-MVM0735 FAS-3x Financials IBB-Biotechs
--> 43 +8
MAXCP stocks Bullish MAXCP
Stocks (5/1/2014)
--> 143 - 57
MINCP stocks Bearish MINCP Stocks (5/1/2014) Bearish
plurality
--> 22 -7 New Highs on NASDAQ 37 +1
new lows. Bearish plurality
--> 60 -9 New Highs on NYSE 9 -9 new lows.
Bullish
plurality
Early May Peerless Sells
Peerless Sells in the first ten days of May are reliable. Each brought of a
decline of 4.8%, at least. None brought a loss. Most did not even bring a paper
loss.
May Peerless Sells
Subsequent Reversing Peerlesss Buys
Gain Paper
Gain
Loss
-------------------------------------------------------------------------------------
19290507 S9 321.9
.089 .011
19290527 B2 293.4 .069
bear mkt
19320509 S6 57.0 .170 none
19320602 B16 47.3 .597
19510503 S3 263.1 .078 none
19510629 B17
242.6 .134
bear mkt M 19660505 S10 899.
7 .138 .004 19660830 B19 775.72
.039
19690501 S9 949.22 .174 .021 19691218
B13 783.79 .033
19710506 S19 937.39 .093 none
19710803 B3
850.03 .046
bear
mkt
19840501 S5 1182.89 .081 none
19840724 B2
1086.57 .187
19870506 S9 2342.19 .052 none
19870519
B17 2221.28 .059
M 20020517 S9 10353. .209 none
20020724 B19 8191.29 .064
20060505 S9 11578 .049 .006
20060615 B14 11015.19 .126
bear
mkt
20080501 S15 13040 .127 .0016 20080708 B7
11384.12 .022
20110502 S8, S9 12808 .051 none
20110603 B2 12151.26 .022
20120501 S7 13279.32 .089 none
20120604 B3 12101.46 .122
----------------------------------------------------------------------------------------------------------------------------
OLDER HOTLINES
----------------------------------------------------------------------------------------------------------------------------
4/30/2014
The DJI is still locked in
the narrow trading range, 16000-16600.
The Peerless Buy B18 tells us the DJI will break out
before it breaks down. A
DJI breakout jump, however could easily produce a Sell S9-V, which is based
on the V-Indicator being below 0 with the DJI 2.4% over the 21-day ma. See
how close we are to a Sell if the DJI keeps moving up. Compare the Peerless
key values now with what they were on May 2nd, 2011
when Peerless
produced a successful Sell
S9-V as well as a Sell S8 and a Sell S5. Only
the
P-Indicator is more positive now than it was at the start of May 2011. As little
as a DJI rally of 200 points from here could easily bring a Sell S9V.
5/2/2011
key values on a successful S5, S8 and S9
la/ma= 1/028 aroc=.467 P= +212 Change=-50 IP21=.146
V=-17 OP=.349 65duppct=.068
4/30/2014 key values:
la/ma= 1/011 aroc=.089 P= +255 Pchange=-29 IP21=.031
V=-28 OP=.178 65duppct=.046
PEERLESS DJIA CHART, SIGNALS and CURRENT KEY VALUES
Look at the way the A/D Line is rising to new highs ahead of price. Since 1928
this goes a long ways toward precluding a major bear market (DJI decline of
more than 20%) as long as there also is no completed DJI head/shoulders pattern, too.
The top at the end of 1976 that led to the 1977-1978 bear market is the only
exception. However, because of how the FED is boosting the many dividend stocks
on the NYSE, looking only for A/D Line warnings now seems risky. Clearly
Professionals are not so optimistic. And when we consider the 1937 example,
we see how vulnerable a weak economic revovery is to premature austerity
and a premature tightening monetary policy early in 1937. Carter's austerity
policies in 1977 created a second 1970's recession where none was necessary.
With good reason in my opinion, the Public has very limited faith in Washington DC.
The counter-productive blustering over far-away Crimea only reinforces these fears.
.
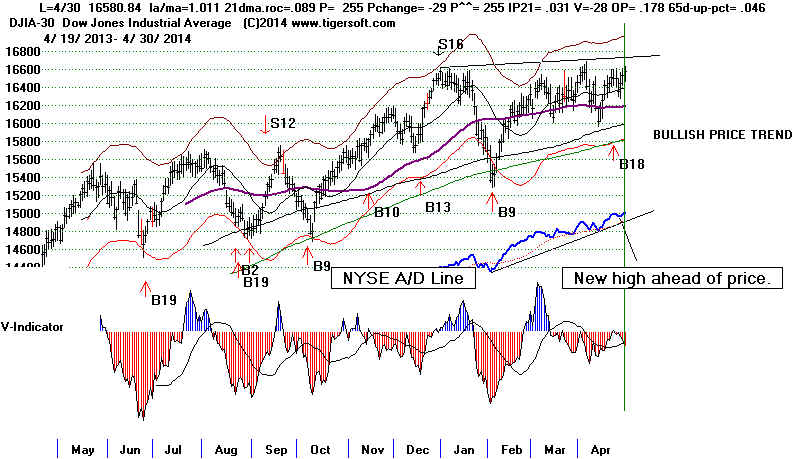
NASDAQ, PEERLESS SIGNALS and Currently Bearish RELDJI Indicator.
The
NASDAQ will need to advance above 4250 to start the bullish scenario shown below.
Until
then, it look like it is trapped in a large head shoulders pattern.
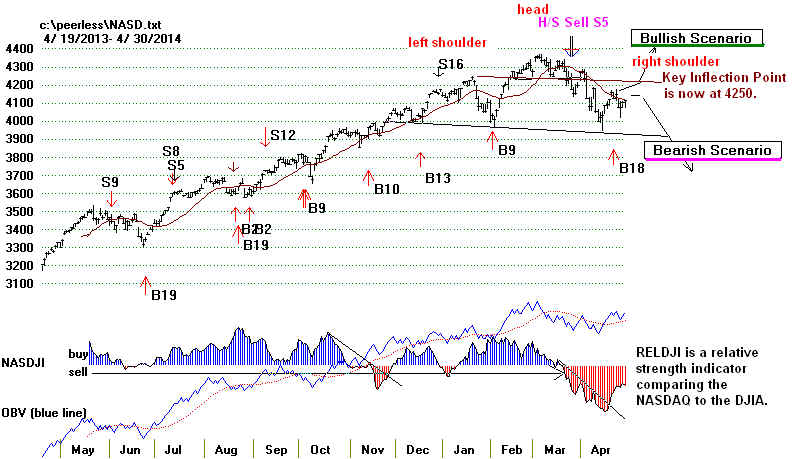
> To Key Index and
Leading Stock Charts: DJI, SP-500, etc.
DJI Chart SPY Chart NASDAQ Chart IBB
Chart IWM Chart
Hourly
DJI-OBV Hourly-MVM0735 FAS-3x Financials IBB-Biotechs
--> 35 +6
MAXCP stocks Bullish MAXCP
Stocks (4/30/2014)
--> 200 - 197
MINCP stocks Bearish MINCP Stocks (4/30/2014) Bearish
plurality
--> 29 +19 New Highs on NASDAQ 36 +3
new lows. Bearish plurality
--> 69 +30 New Highs on NYSE 18 new lows.
Bullish
plurality
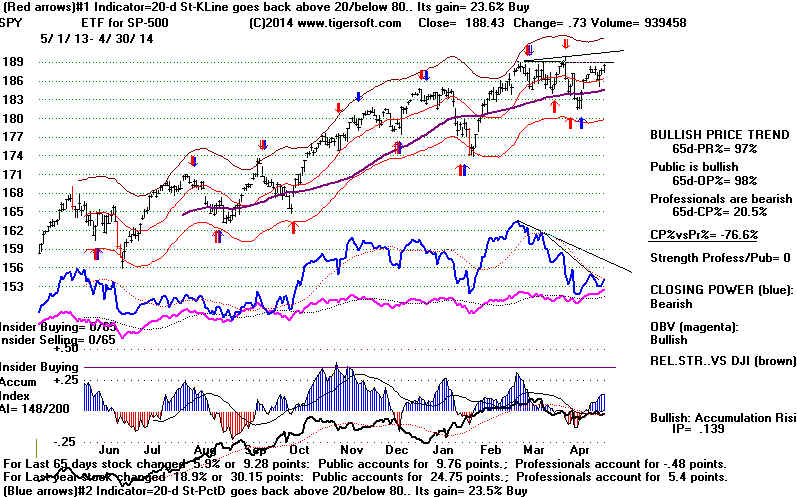
The Lagging Closing Power
The
Closing Powers for the DIA and SPY have now penetrated their CP downtrend-
lines but have not risen back above their falling CP moving averages. Because
of how far these CPs are lagging the DIA and SPY prices, I think we have to wait
for more convincing evidence of breakouts to consider these BUYs. This is also
true for the other key ETFs, QQQ, IWM, MDY, FAS and IBB. At the same time,
their charts still do not show automatic Red Sells. So, it does appear that they
will
move higher.
The Treacherous Month of May
The DJI has only risen 48.9% of the time over the next month since 1965
and 46.8% of the time over the next 2 and 3 months. There typically are 3-5 more
days
of bullishness left.
Peerless Sells in May are usually quite profitable on the short side. There
have been 28 May Peerless Sells in the 83 years from 1928-2013. There
were 2 small losses. There would have been 7 short sale gains of more than
10% and 10 that brought gains between 5% and 10%. In 9 cases the gains
were between 1% and 9%. If there is a May Sell, this study would make it
seem that the odds are 64.2% that there would be a decline of at least 4.8%
at the time of the next Peerless Buy signal. Sell S9s were the most common
Sell. occurring in 9 cases.
Sells is years of Mid-Term elections were somewhat more bearish. in 3 of
the 6 cases, the DJI fell more than 10%.
May Sells
Reversing Buys
Gain
Gain
19290507 S9 321.9 .089 19290527 B2 293.4
.069
M
19300529 S9 275.1
.375
19310123 B7 171.8 .032
19320509 S6 57.0 .170
19320602 B16 47.3 .597
M
19420511 S9 99.2
-.018
19420528 B4 101.0 .041
19450515 S19 164. -.002
19450705 B11 164.3 .212
19500518 S8 220.6 .058
19500721 B12 207.7 .247
19510503 S3 263.1 .078
19510629 B17 242.6 .134
19600519 S9 624.6 .013 19600721 B2
616.6 .029
19610518 S4 701.1 .014 19610925 B2
691.2 .058
19650513 S7 938.9 .075
19650630 B19 868.04 .135
M
19660505 S10 899.7 .138
19660830 B19 775.72 .039
19690430 S9 950.18 .175
19691218 B13 783.79 .033
19710506 S19 937.39 .093
19710803 B3 850.03 .046
19720522 S9 965.31 .05
19720713 B2 916.99 .033
M
19820528 S10 819.54 .019
19820607 B3 804.03 .026
19840501 S5 1182.89 .081
19840724 B2 1086.57 .187
19870506 S9 2342.19 .052
19870519 B17 2221.28 .059
19910531 S3 3027.5 .038 19910624 B2
2913.01 .033
19930519 S7 3500.03 .005 19930702 B11 3483.96 .139
M
19940518 S15 3732.89 .026
19940624 B2 3636.94 .068
19960520 S2 5748.82 .041 19960712 B2 5510.56 .035
20010605 S11 11175.84 .263
20010921 B16 8235.81 .228
M 20020517 S9
10353.08 .209
20020724 B19 8191.29 .064
20060505 S9 11577.74 .049 20060615 B14 11015.19 .126
20080501 S15 13040 .127
20080708 B7 11384.12 .022
20090511 S3 8418.77 .011 20090623 B5
8322.91 .234
20110502 S8, S9 12807.36 .051 20110603 B2 12151.26 .022
20120501 S7 13279.32 .089
20120604 B3 12101.46 .122
====================================================================
OLDER HOTLINES
====================================================================
4/29/2014 The DJI is still
locked in a narrow trading range, 16000-16600.
The Peerless Buy B18 does suggest the DJI will break out
before it breaks down.
While volume has been too low to allow a breakout so far this year (See the Hourly
DJI chart.), there has been some improvement there. Bullishly, too, the NYSE A/D
Line is making 12-month highs due to the FED's boosting of
dividend stocks
with its low interest rates. Although the pattern of higher openings and lower
closes
is usually bearish, Professionals can shift rapidly and become net buyers. We
must watch to see if the Closing Power downtrends are broken in the key
ETFs. A very strong up-day tomorrow, possibly caused by new "dovish"
comments
from the FED could cause this. Yesterday, the SEC Chairwoman denied that the markets
are rigged by Wall Street. She was never asked if the market
was being rigged
by the Fed.
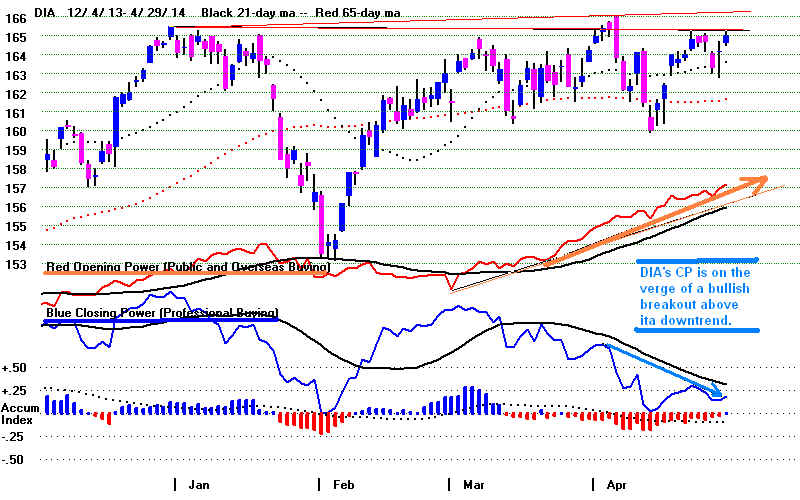
> To Key Index and Leading Stock Charts: DJI,
SP-500, etc.
DJI Chart SPY Chart NASDAQ Chart IBB
Chart IWM Chart
Hourly
DJI-OBV Hourly-MVM0735 FAS-3x Financials IBB-Biotechs
--> 29 -3
MAXCP stocks Bullish MAXCP
Stocks (4/29/2014)
--> 397 MINCP stocks Bearish MINCP Stocks (4/29/2014) Bearish
plurality
--> 10 New Highs on NASDAQ 33
new lows. Bearish plurality
--> 39 New Highs on NYSE 19 new lows.
Bullish
plurality
What Is The Significance of A Stream of Higher
Openings?
Our Closing Power trends remain intact for all the key major market ETFs.
See DIA, SPY, QQQ, MDY, IWM,
FAS and IBB. Our theory
holds that this mostly happens
when market makers choose to open prices above the previous close to make profitable
the shorts they then take. After the opening, they allow prices to fade for much of
the
the rest of the as Professionals work out from under large net sell orders.
Mary Jo White, the US Exchange
Commission Chairwoman would likely not agree.
She told Congress yesterday that "the markets are not rigged."
Apparently, she
has been assured of this by many leading Wall Street figures. She sounds more like
a spokesmen for Wall Street than its lead regulator.
I would not trust her. Critics say that she is one of the main reasons
"Why Wall
Street Isn't In Jail".
Her biography suggests that
she is far more qualified to prosecute Mob figures like John Gotti and
Mid-Eastern terrorists than go after Wall Street financial terrorists,
fraudsters, insiders, crooks, and stock manipulators. As an appointee of
Obama, she has done his bidding and not bit the hands of his biggest
campaign contributors. "No drama!" Her background shows that
she
is hardly an even-handed regulator.
In 2005,
she was engaged by Morgan Stanley to nix an investigation into insider trading
allegations
against its new CEO, John Mack. A week ago, a senior SEC
trial attorney quit the agency in disgust, saying that the SEC’s upper management
policed “the broken windows on the street level” but ignored the “penthouse
floors.”
James Kidney explained: “On the rare occasions when Enforcement does go
to the penthouse, good manners are paramount. Tough enforcement – risky enforcement
– is subject to extensive negotiation and weakening.” Specifically, he was
referring
to the fraud committed by Goldman Sachs in 2007 in setting up a Fund to short
mortgages at the same time they were selling them. He added the SEC's
revolving door to Wall Street had demoralized SEC enforement personnel.
(See http://wallstreetonparade.com/2014/04/insiders-tell-all-both-the-stock-market-and-the-sec-are-rigged/
)
My own experience working on
Wall Street opened my eyes quickly. I learned
early-on that trusting Wall Street is the last thing we should do if we wish to be
prudent with our money. Insider trading was rampant. The mafia ran low priced
stocks up and down at will. NYSE Specialists visiting us at the NY Institute of
Finance
openly bragged about their ability to control the stocks' prices they made markets
in.
Where was the government in all this? The head of the margin department made
clear to me that numbered Swiss bank accounts were vital to the firm. The import of
his message to a young stock broker: "Make no waves. Jump in the
money-pool.
Get all you can and we'll put it in a Swiss bank."
"Over Night" Trading Is Very Profitable Again.
I take it as very significant now that nearly all the gains for the major ETFs
over the last 65 trading days have come at the opening. Another way of saying
this is that if we sold short at the opening all the key ETFs and covered at the close,
we would be way ahead over the last 65 trading days. The TigerSoft charts show
at their bottoms what proportion of the changes in price can be ascribed to
higher openings versus higher closings than the openings. (They also compute
the gains from over-night versus day-trading.)
----------------------- Source of Gains of Last 65
Trading Days -----------------------------
ETF
Points Gained
Points Gained
Points Gained from
over last 65 days from Higher Openings
Opening to Close (same day)
------------------------------------------------------------------------------------------------------------------------------
DIA
+ 3.29
+7.41
-4.12
SPY
+ 4.91
+ 8.78
-3.87
QQQ
-1.31
+7.08
-8.39
MDY
-0.11
+14.49
-14.6
IWM
-5.18
+5.24
-10.42
FAS (3x big banks) 0.47
+14.4
-13.93
TNA (3x small caps) -11.18
+11.96
-23.14
IBB
-23.65
+53.46
-77.11
This table shows how steadily profitable it would have been to:
1) Buy FAS, TNA and IBB at every closenight and selling
at the next day's opening.
2) Sell short at each opening IWM, FAS, TNA and IBB and
cover at the close.
Will this pattern continue? Our charts show that this
approach works
much better when the Opening Power is above its 21-day ma and the
Closing Power is below its 21-day ma. See BIB below
Price breakouts above well-tested resistance will usually cause
Professionals to trade stock on the long side for a while during the day.
Price break downs have the opposite effect. The same is true of Closing Power
trendbreaks. The gains vary from one investment tool to another.
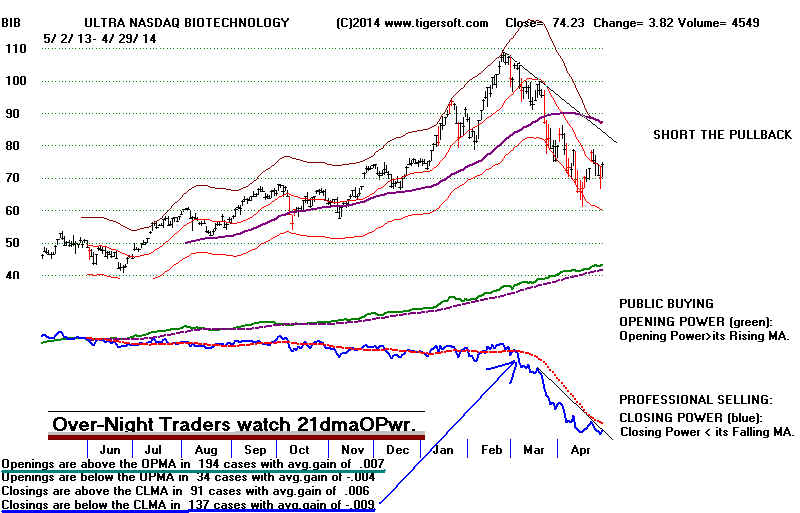
If these ETFs' Closing Powers do break their downtrends, expect these to rally from
openings to closes for at least a week. Sometimes, prices with this pattern
can
rise as long as two months. The point here is that Professionals can and do
change their mind and work the "long side" if they think that will be more
profitable. They are stubbornly inflexible.
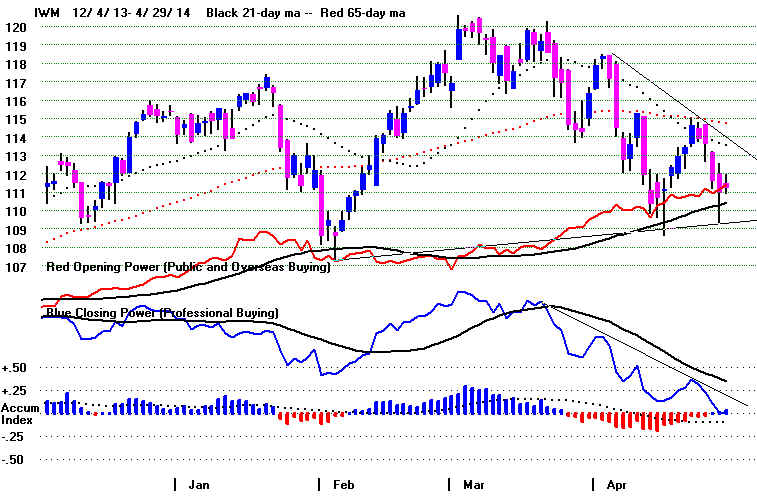
The Public Is
Usually Wrong.
For Us, Market Makers and Professionals Act
in a Surprisingly Predictable Way.
The pattern now is disturbing. It shows nothing has changed on
Wall Street. The markets are, in fact, just as rigged as ever. And the
pattern now is distinctly bearish. This trading pattern is exactly the
same one that prevailed in June 2000. That was one of the main themes
of our Tiger Day Trading Seminar in Las Vegas. Its portent was bearish:
in two years the speculative stocks that showed this pattern were all
much lower.
So, most of the gains for the first four months of 2014 have been made at the
openings. This is particularly true among bank stocks, if FAS is any guide.
With all the Fed "backup" of the big banks and all the informal
"heads-up/leaks"
the Fed provides the biggest banks, there can be little doubt that banks stocks
are being rigged with the help of the FED.
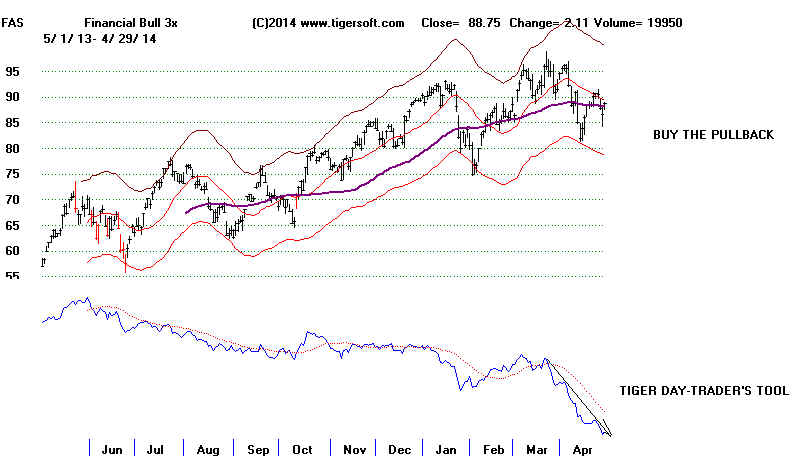
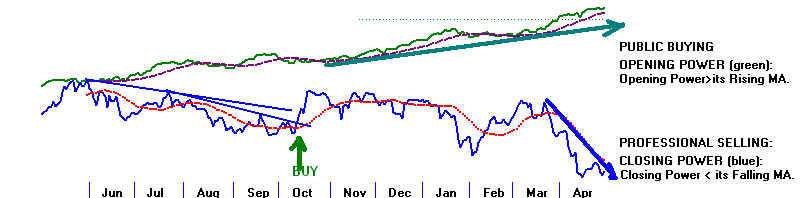
I would go even farther. Perhaps, the FED itself is trading the Futures
market
to help boost prices to try to prevent a much bigger decline. But wouldn't we
find out if they were doing this? Not necessarily. Whistle-blowers are
not treated
kindly by the Obama Administration.
How Profitable Is Over-Night Trading?
60%/year with FAS and TNA
TigerSoft
gives you the answer. in several ways. When you display Opening and Closing
Power together using Indc.3 + Tiger Basis of moves, you will see a report showing you the
average daily rate of return for overnight trading.
Over-Night Trading
Over-Night Trading
when Opening Power is above
Buying and Selling
its 21-day ma: 2013-2014
1000
shares allowing
$40/commission/slippage
per trade.
Avg Gain
Gain over all of last 65-trading days.
BIB n = 194 .007 (+.7%)
$38930 on 1000
shares of now $74.23 stock (+52.4%)
FAS n = 172 .005
(+.5%)
$13,750 on 1000
shares of now $88.75 stock (+15.4%)
TNA n = 167 .005 (+.5%)
$10,320 on 1000
shares of now $67.53 stock (+15.3%)
====================================================================
OLDER HOTLINES
====================================================================
4/28/2014
Will Higher Openings Really Be Enough to
Boost The Market or Even Hold It Up Much Longer?
For the DJI, the answer appears to be "Yes". For the NASDAQ and
many "growth" and speculative stocks, the answer now is probably "No".
The DJI remains locked in a narrow trading range, 16000-16600. Trade it
with the Hourly DJI and short-term Stochastics.
Without a completed head and shoulders pattern in the DJI or a new Peerless Sell
signal, it is very unlikely the DJI will retreat more than 10%. It may not even
decline
more than to 16000. Buy B18s in rising market have
not allowed deep declines.
The NASDAQ, however, does sometimes become independent of the DJI and can become
much weaker than this blue chip average. That is what happened in 1986 and seems
to be happening now as institutions and professionals lock in the profits from several
years of advances in more speculative stocks. While the DJI is
rising and the NASDAQ
is badly lagging, any DJI move to the upper band will probably bring a Peerless
Sell.
> To
Key Index and Leading Stock Charts: DJI, SP-500, etc.
DJI Chart SPY Chart NASDAQ Chart IBB
Chart IWM Chart
Hourly
DJI-OBV Hourly-MVM0735 FAS-3x Financials IBB-Biotechs
--> 32 -2
MAXCP stocks Bullish MAXCP
Stocks (4/28/2014)
--> 487 MINCP stocks Bearish MINCP Stocks (4/28/2014) Bearish
plurality
--> 13 New Highs on NASDAQ 60
new lows. Bearish plurality
--> 53 New Highs on NYSE 35 new lows.
Bullish
plurality
Interest rates should remain very low for as long as the Dollar
does not crack
below 78, the 2-year price support, I would think that aggressive money
will continue to be placed in good dividend paying and defensive stocks.
But if there is new weakness in the Dollar below 78, that could make the
FED much more vulnerable to critics who say it is risking serious inflation.
There is also a bigger problem which is not getting proper attention. It is
Fed's increasing of big banks' reserve requirement. Clearly the Fed does
not want to have to bail out any more big banks. One of its "fixes" in
this
may have just made matters much worse. Raising reserve requirements
of big banks has a bearish track record (See Arthur Merrill, Behavior of
Prices on Wall Street.) and is clearly a deflationary policy. It should also
be noted that the FED doubled Reserve Requirement between August 1936
and May 1937. Along with FDR's new deflationary 1937 Budget, this helped
produce the savage 47% decline by the DJI from August 1937 to March 1938.
(See chart at bottom of tonight's Hotline.)
Bank of America's breakdown below its price support today, complete with
red high volume and a breakaway gap is definitely a sign of danger.
JPM and GS have also broken below
their 200-day ma and have Closing
Powers which are much weaker than their prices are.

In the past, BAC has often been the "canary in the mine". When it
finally breaks its price uptrend and support, the general market
quickly becomes much more vulnerable. A declining BAC/DJI
Relative Strength Qutient led the general market down in 1987, 1990,
2007-2008 and 2011.
BAC's Bearish Breakdown with Gap and Red High Volume.
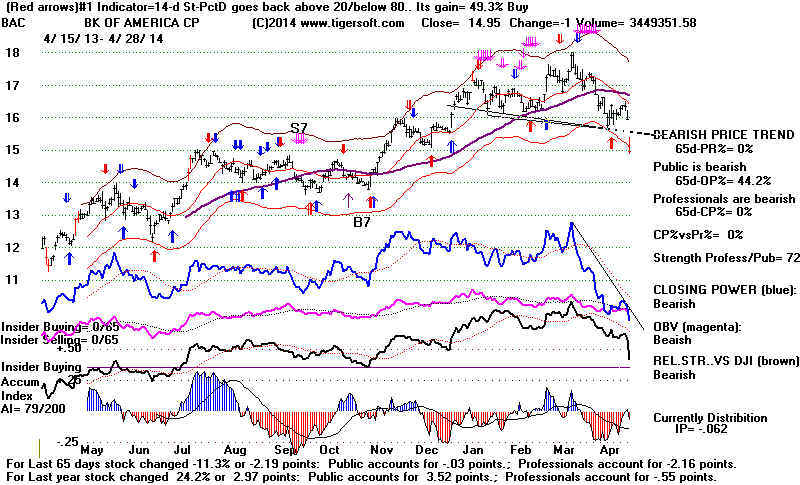
The Best Dividend Stocks
I don't think a new bull market can be started by Utility and dividend paying Oil
and Gas stocks. But they may be able to impart enough of the appearance of
strength to hold the stock market up for another few months. "San Diego
Dan" was
kind enough to provide me with a list of 288 stocks reportedly now paying more
than 4% in dividends. Just because a stock pays a high dividend, does not mean
it is a good buy. Many cannot
sustain such high dividends and offer them to
lure in
unsuspecting investors right before bad things happen. The Tiger Power
Ranker reports these three as being the most technically bullish of the 288
in this new Tiger UTILFOUR directory:
PWR
AI/200 IP21 Last
MACD OP trend CP
trend Company and Yield
SRC 467 188 .05
10.74 Buy U
? Spirit Realty Capital 6.30%
SAN 449 181 .22 9.8
SELL ?
U Banco Santander, S.A.
6.60% (Spain)
ORI 401 168 .18 16.27
BUY U
D! Old Republic (Insurance) Corp 4.0%
Banco Santander, S.A.
6.60% (Spain)
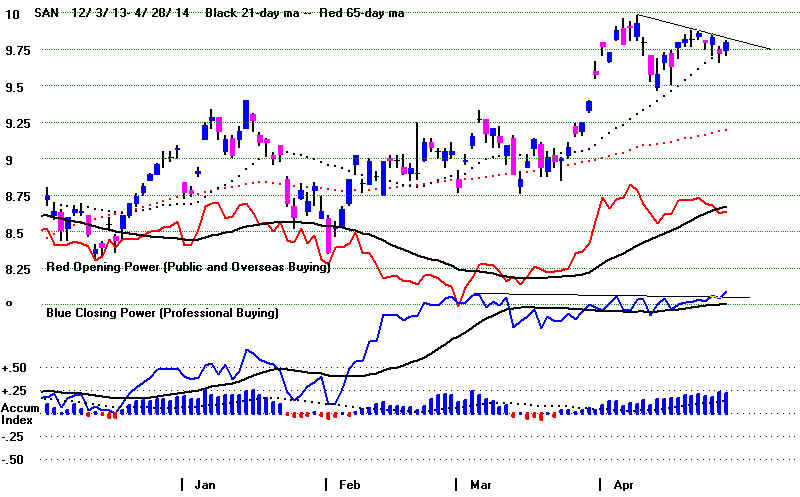
The Russell-2000 (IWM) and Biotech
(IBB) ETFs still show falling Closing
Powers even though they are testing their rising 200-day ma. I think they
must be held as shorts.
Let's Hope The FED Knows What It Is Doing/
Don't expect the FED to scare the stock market in 2012. This
is an Election
Year. They do not want to have their actions or inactions become a main part
of the political campaigns of this Fall. The FED has looked back with horror
on the Crash of 2008 and they seem committed to avoid allowing such an event
to occur. This is their rationale for pumping so much liquidity back into big banks.
Of course, in doing this they have produced a stock market boom which seems
unsustainably far ahead of Main Street. The FED members know this, but they
do not see any other choice besides very loose and easy monetary policies.
Surely, the understand that if they pullback prematurely from these
monetary policies, which we know as QE-III and a Fed Funds rate of .10, the risk is
a second big market sell-off will soon follow as in 1937. This terrifies them;
it would likely end the control the big banks have of the FED; it would
bring vast changes in how Wall Street and Big Banking are regulated
and a new flood of populist politicians would come to Congress.
But what if they make a mistake. In the Spring of 1937, fearing over-speculation
and inflation(!?), the Fed Governors imposed much higher margin requirements
on NYSE member firms and increase bank reserve requirements. In many ways,
this is similar to what Yellen is doing now by raising the banks' reserve requirements.
Banks are the biggest stock traders around now.
1937 Crash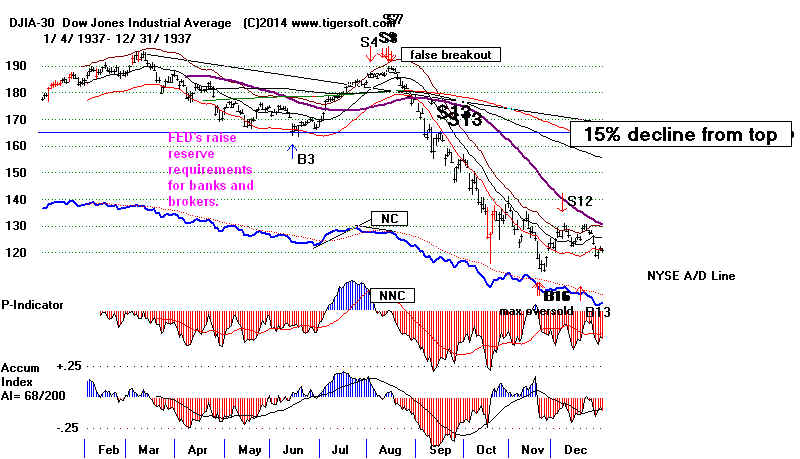
====================================================================
OLDER HOTLINES
====================================================================
4/25/2014
The DJI remains locked in a narrow trading range, 16000-16600.
The new Buy B18 only tells us that the P-Indicator has
been positive for more
than 8 weeks, something the A/D Line's steady rise been telling us for many
weeks. It is not a reliable call for an immediate buy, but because its paper losses
are all small, it does suggest that a re-test of 16000 will probably be a good place
to buy. With 16600 acting as such sturdy resistance, it will probably be better to
buy when there is more head-room.
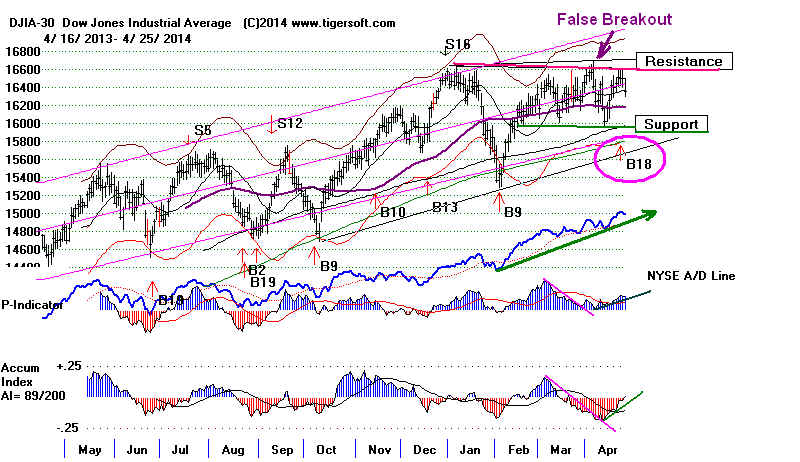
The bearishness in many highly vocal quarters now, mostly among those that are
more afraid of inflation than longer term high unemployment and low wages, is just
not supported by Peerless at this time. Without a new Sell S9, S12s or S15, or
a bearish NYSE A/D Line divergence for a few weeks, at least, or a completed
DJI head/shoulders pattern, Peerless cannot predict a major top and a big decline
based on the history of the market since 1928. Read the materials I used in a
recent report on this subject that
I gave at Mesa College here in San Diego.
The most bearish scenario I can develop now from market history is what happened
in the second half of 1986 when the DJI gyrated back and forth in a 10% wide
trading range while the NASDAQ steadily fell until Janaury 1987.
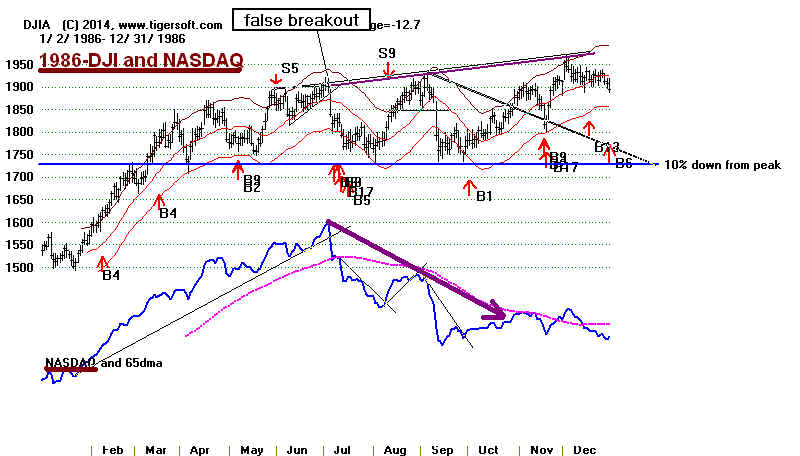
The Defensive Consolidation in Market Means
More Selectivity Is Needed.
Though the last Peerless signal is a Buy, the main prop underneath
the market now is utilities. There is too much weaknesss
in biotechs (IBB), small caps (IWM) and the NASDAQ to generate
much enthusiasm about buying right now. A better area to buy would be
on another successful test of the DJI of 16000 and SP-500 of 1750.
Meanwhile, the Closing Powers are very weak. The DIA's CP%-Pr%
is a very negative -.71. Except in August, November and December,
such low levels for DIA and SPY are reliably bearish, provided there is
no breakout surge. See past cases.
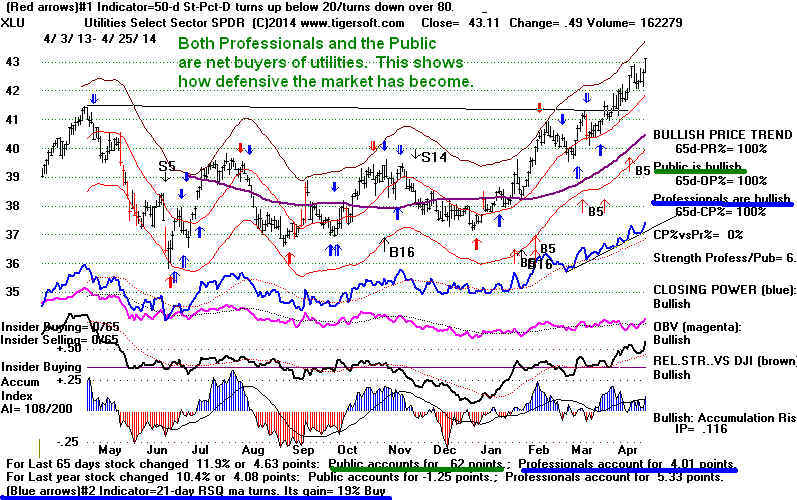
Look on Monday night for a Tiger Data Download of the utilities
reportedly
are paying more than 4%. We owe a "thanks" to Dan of San Diego for
researching and providing this list. It will be called "UTILFOUR".
> To Key Index and Leading Stock Charts: DJI, SP-500, etc.
DJI Chart SPY Chart NASDAQ Chart IBB
Chart IWM Chart
Hourly
DJI-OBV Hourly-MVM0735 FAS-3x Financials IBB-Biotechs
--> 34 -23
MAXCP stocks Bullish MAXCP Stocks
(4/25/2014)
--> 429 +146 MINCP stocks Bearish MINCP Stocks (4/25/2014) Bearish
plurality
--> 9 -14 New Highs on NASDAQ 41
-31 new lows. Bearish plurality
--> 42-15 New Highs on NYSE 17 new lows.
Bullish
plurality
Selectivity
IBB (Biotechs) and IWM
(Russell-2000) show CP downtrends.
These ETFs
must be expected now to test their rising 200-day ma
again.
Without a new Peerless Sell, the next tests by IBB
and QQQ
should hold up, despite the Closing Power weakness.
But we
ought to wait to see the CP turn up as they test support to
cover our
short sales. A break in the CP downtrends would
also be
grounds to cover them.
Wall Street
is said to be worried about events in the Ukraine.
But unless
Obama knows nothing of the Cuban missile crisis,
I would
think he and Putin will reach an accord in which
both
super-powers do not themselves escalate matters.
Wall
Street, I think, is more afraid of election year populism,
as
introduced by Senators
Warren and Sanders
and the
possible
policy proposals steming from the new book "Capital"
by
the French economist, Pikkety. But these people are actually
forces
which serve to hold the market up. The powers-that-be know
full well
that as long as the stock market does not collapse
and cause a
new deep recession, the populists do not have any chance
of changing
the political status quo. Neither mainstream Democrats
nor
Republcians are going to jepoardize their connections
to the
really big money that Wall Street offers. Instead everything
possibe
will be done in Washington to hold the market up.
-------------------------------------------------------------------------------------------------------------------
OLDER HOTLINES
-------------------------------------------------------------------------------------------------------------------
4/24/2014
It's getting quite uncomfortable
trying to get the
last
100 points in the DJI's move to the expected 16600 resistance. As I've
noted
in the past, it is often quite bearish when the DJI closes
unchanged as it did today after a nice rally. (Look back at October
1987 for example.) Professionals are heavy net
sellers. Why?
They
must think that the Fed has run out of ways to prop up the
market and good economic news will be insufficient to do the job.
I
think we should do some profit-taking, too. The treacherous
month
of May is not far away. Consider shorting some of the bearish
MINCP
stocks or IWM while its Closing Power is declining and it stays
below
its 65-dma. Generally speaking, it's a good idea to short
bearish-high distribution stocks that have recently given red
automatic optimized Sells and whose Closing Powers have turned
down
sharply.
> To Key Index and
Leading Stock Charts: DJI, SP-500, etc.
DJI Chart SPY Chart NASDAQ Chart IBB
Chart IWM Chart
Hourly
DJI-OBV Hourly-MVM0735 FAS-3x Financials IBB-Biotechs
--> 35 -9
MAXCP stocks Bullish MAXCP Stocks
(4/24/2014)
--> 173 +113 MINCP stocks Bearish MINCP Stocks (4/24/2014) Bearish
plurality
--> 23 +12 New Highs on NASDAQ 10
-1 new lows. Bullish
plurality
--> 56+4 New Highs on NYSE 5 new lows.
Bullish
plurality
Only the DJI's theoretical high reached the target of 16000
today,
despite the lift that AAPL's earnings and split announcement
gave
its own stock and the NASDAQ and QQQ,
of which it is a big part.
Instead, the Closing Powers turned down for the key ETFS, DIA,
SPY,
QQQ, IWM, FAS
and IBB. They each also showed bearish popsicles
on
their TigerSoft candle-stick charts.
Our Tiger graphs track the divergences between
Closing Power and
Price
over 65 days, as "CP%-Pr%". These numbers now are quite
bearish for all these key ETFs. Professionals clearly are busy selling.
Now
that the DJI has tagged the 16600 resistance, I think we have
act
more defensively. Adding some shorts among the Bearish MINCP
stocks is one approach that seems justified. Another, if you trade
the
Closing Power trend-reversals, would seem to be shorting IWM.
ETF
CP%-Pr%
Status of Autom.
Bearish Red
of Optimized Signal
Popsicle today?
---------------------------------------------------------------------------------------------
DIA
-74.7% (S4)
no red Stoch-20 sell yet. Yes
SPY
-74.1% (S4)
no red Stoch-20 sell yet. Yes
QQQ
-49.0%
red Stochastic-5 sells Yes
IWM
-36.0%
no
red Stoch-14 sell yet. Yes
FAS
-58.8%
no
red Stoch-20 sell yet. Yes
IBB
-20.1%
red 21-day RSQ sell
Yes
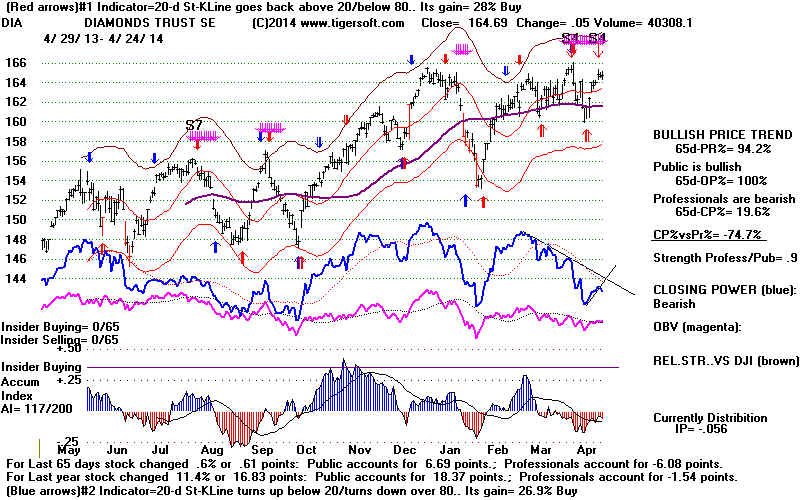 |
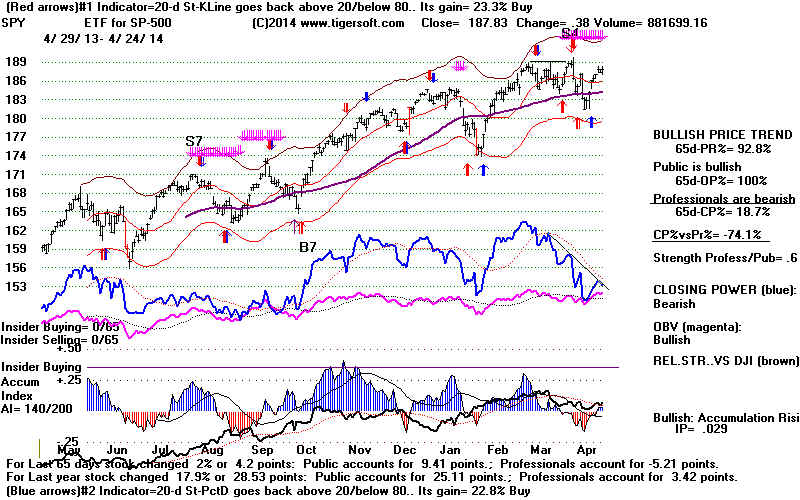 |
While there may be another 100 points of upside potential,
these
Closing Power divergences are distinctly bearish, especially as
they
apply to each of the big gaining ETFs of the last three years.
Professionals clearly are not waiting until May to go away. And
with
a weekend coming, they note that Russia is expanding its "military
exercises" not two hundred fifty miles from the hot-spots in Eastern
Ukraine, where the civil unrest is worsening.
Up
volume according to our Hourly DJI chart has been much lower
than
Down volume for many weeks. Subdued strength in dividend
stocks is not encouraging enough to justify many long positions,
except perhaps oil stocks with good yields.
Aggressive traders, see how the Closing Power trends are all
falling for these key ETFs and how they could not surpass
resistance of overhead-supply or their 65-day ma. If Peerless
were
on a Sell signal, short sales would certainly be justified
in
them.
As I read it the latest Buy B18 is not a "call to action". Some of you
noted
in emails to me, the V-Indicator is quite low now. That could
bring
a Sell S9V if it stays negative and the DJI were were to rally to
16750
in May. In my opinion, there are just too many cases where the
DJI
retreats 3%-5% immediately after a Buy B18 to trust it.
Instead, the Buy B18 should give us some comfort to buy once the
DJI
has dipped back again to the 16000 support. Big paper losses
are
rare with it.
Aggressive traders, however, may want to short IWM or IBB with
the
idea of staying short only until it breaks its Closing Power downtrend.
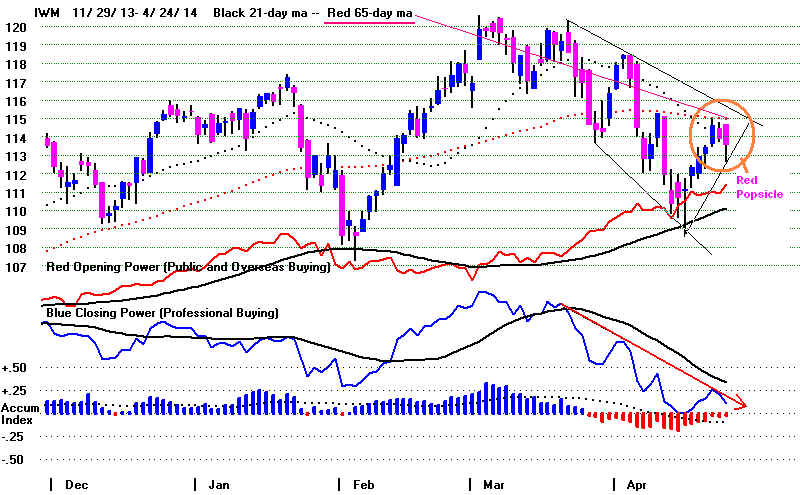 |
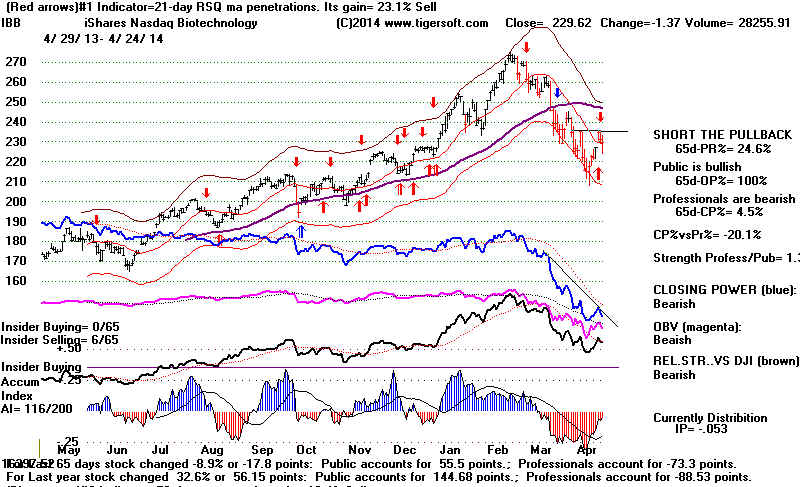 |
-------------------------------------------------------------------------------------------------------------------
OLDER HOTLINES
-------------------------------------------------------------------------------------------------------------------
4/23/2014 16600 is still the DJI target I
have set. The simple
dynamics of trading range will probably bring a
reversal once the
DJI makes a nominal
closing high at or above 16600. The good news
is that the retreat
from there is not expected to break the 16000 support.
Utilities, reits,
dividend stocks and oil and gas producers paying dividends
may not fall back much,
at all.
The Hourly DISI Line is very, very weak. If this is still
reliable in the
current era of
"dark pools" and computerize front-running,
then the market would
seem to be in big trouble. But it may no longer
indicate market
weakness now. Breadth certainly has been good.
Fighting the Fed seldom
pays when it comes to trading the DJIA.
That is why there are
so few tops before bear markets without first
a notable A/D Line
divergences. Except for 1977, other DJI tops
seemed only to occur
after Peerless Sells and DJI head/shoulders'
tops.
Note that the
V-Indicator and OBVPct have both turned positive.
This will make it
somewhat harder to get a new Peerless Sell.
The market is gaining
strength. Perhaps, Republicans will outflank
the Democrats and
advocate a patriotic infrastructure re-building
program as they did
under Coolidge and IKE. They appear to
need something to
regain popular appeal.
Peerless today
produced a new, reinforcing Buy B18.
This is a
momentum-based signal. Though reliable, it should
not be used to
buy on strength. Too often there are pull-backs
to the 21-day ma
or even lower after it. In addition, since the
1998 its gains
have generally been modest. Only 2 of the last 12
occurrences
brought gains of more than 5%. (See in the new
Buy B18 write-up all the statistics I am putting together
for this
and each of the
other Peerless Buys and Sells. It is this which
is taking so much
time!)
Generally
speaking, momentum-based Buys in the year of a
Mid-Term Election
with a Democrat in the White House have not brought
very good results
since before 1980 . Much bigger gains momentum gains
were obtained
when a Republican sat there: viz. 1954, 1958, 1982, 1986 and
2006.
People remember Clinton's bull market years, but 1998 brought
a 20% decline in
the Fall and Obama's 2010 yielded a 14% sell-off
from April to
July.
So we have to
worry about the NASDAQ and the QQQ turning down
next week and
forming what will then appear to be bearish head and
shoulders
patterns. Mays can be treacherous. And we've just had a
taste of how the
NASDAQ can become weaker than, and move separately
from, dividend
and blue chips stocks. I've previously noted the mid-1986
to Dec-1986
period, as another extended period of NASDAQ weakness
in the face of
DJI strength. It is not for nothing, I think, that we've seen
Closing Power
become particularly weak for IWM, QQQ and IBB. Professionals
want the safety
of blue chips and FED-backed dividend stocks, at least
until the NASDAQ
can digest its big gains since 2011.
Today things got
very interesting. Biotechs were quite weak. Their
Closing Powers
turned back down. This is short-term bearish. But
on the positive
side AAPL
reported much better than expected earnings,
renewed share
buy-backs and a 7:1 stock split. This should send AAPL's
bears into a
covering frenzy tomorrow. Because of AAPL's size, it
should bring the
QQQ and NASDAQ up to the resistance levels
represented by
right-shoulder pinnacles in potential head and shoulders
patterns.
(See their charts below.) I reckon the NASDAQ right
shoulder
apex-resistance to be at 4240, 117 points above today's close.
QQQ's resistance
is at 89, 2.24 points above today's close.
BUY B18s since 1987
Gain Paper Loss
 1           19980317      B18      8749.99    .049      none
----------------------------------------------------------------------
 2           20020103      B18     10172.14   -.006      .054
----------------------------------------------------------------------
 3           20030514      B18      8647.82    .134      .018
----------------------------------------------------------------------
 4           20031217      B18     10145.26    .047      none
----------------------------------------------------------------------
 5           20041221      B18     10759.43    .014     .036
----------------------------------------------------------------------
 6           20060111      B18     11043.44    .048     .034
----------------------------------------------------------------------
 7           20060315      B18     11209.77    .033      none
----------------------------------------------------------------------
 8           20061005      B18     11866.69    .045      none
----------------------------------------------------------------------
 9           20061204      B18     12283.85    .009      none
----------------------------------------------------------------------
 10          20070518      B18     13556.53    .029     .021
----------------------------------------------------------------------
 11          20130201      B18     14009.79    .083     .016
----------------------------------------------------------------------
 12          20130502      B18     14831.58    .023      none
----------------------------------------------------------------------
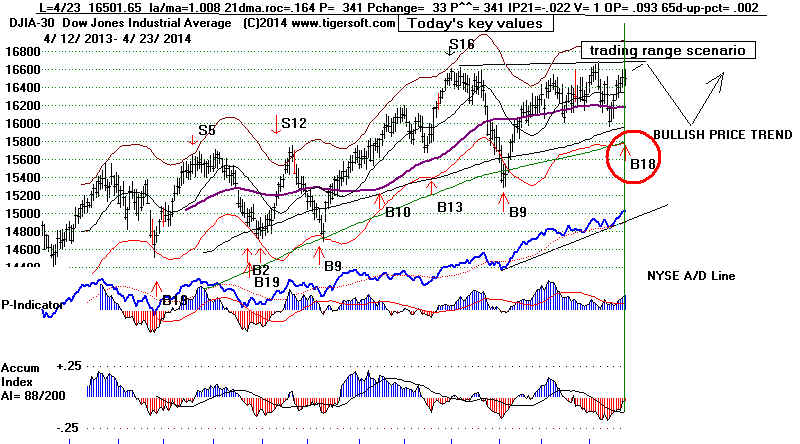
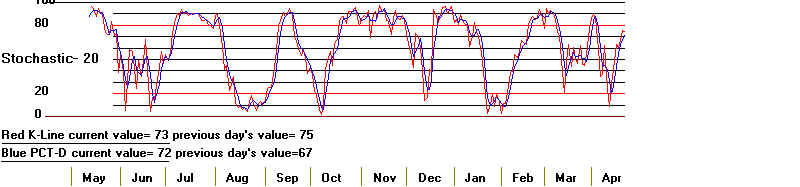
> To Key Index and
Leading Stock Charts: DJI, SP-500, etc.
DJI Chart SPY Chart NASDAQ Chart IBB
Chart IWM Chart
Hourly
DJI-OBV Hourly-MVM0735 FAS-3x Financials IBB-Biotechs
--> 44 +1 MAXCP stocks Bullish MAXCP Stocks
(4/23/2014)
--> 60
-39 MINCP stocks Bearish MINCP Stocks (4/23/2014) Bearish
plurality
--> 11 -19 New Highs on NASDAQ 11
+5 new lows. Bullish
plurality
--> 52
--14 New Highs on
NYSE 3 new lows. Bullish plurality
==============================================================
OLDER HOTLINES
==============================================================
4/22/2014
The Hourly DJI reached
16569. Without a new Peerless Sell
signal, we should, I think, expect the DJI to close at, or slightly above, 16600.
6%-8%
DJI trading range moves from support to resistance and back down are
fairly common in long bull markets, showing that tops usually take months to
form.
Earlier examples: May 1929, Feb 1935,
Nov 1950, August 1972, July 1976,
September 1976, October 1980, November 1980, September 1986, May 1996,
July
1998, July 1999, August 1999, May 2012, August 2013, September 2013.
The
DJI 20-day Stochastic-K-Line has not yet reached 88. This is the least
the
fast red Stochastic-20 has risen to on each rally in the last year before then
declining.
Breadth is excellent, but the DJI's IP21, V-I and OBVPct are all still
negative.
The
DJI closed today at the 1% upper band (la/ma=1.01). If these stay negative
or
nearly so with the DJI rising to the 2.6% (la/ma=1.026), Peerless will probably
give
a sell signal. The DJI could then go a little higher, but the 2 months of May
and
June are "treacherous". Since 1965, Mays are up only 48.9% of the
time.
The
next two months (April 30th to June 30th) are up only 46.8% of the time.
All
of these two month periods produce an average DJI decline of 0.5%. Another
thing
to worry about: negative V-I readings can start to give Sell S9V signals in May.
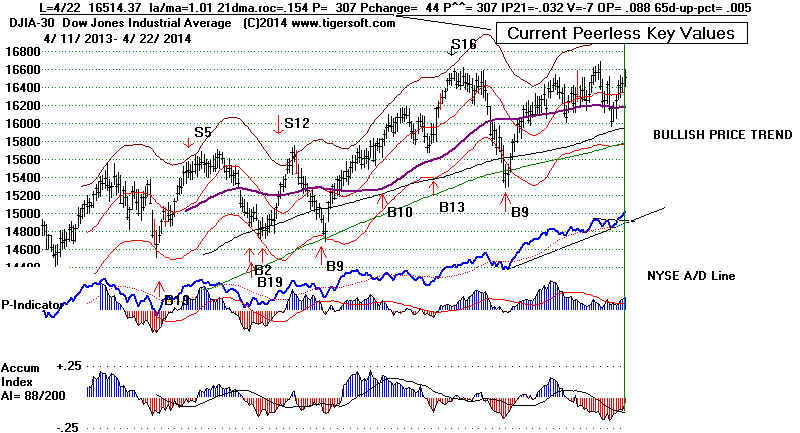
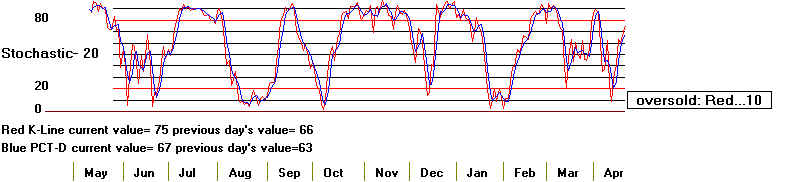
> To Key Index and Leading Stock Charts: DJI, SP-500, etc.
DJI Chart SPY Chart NASDAQ Chart IBB
Chart IWM Chart
Hourly
DJI-OBV Hourly-MVM0735 FAS-3x Financials IBB-Biotechs
--> 44 +1 MAXCP stocks Bullish MAXCP Stocks
(4/22/2014)
--> 60
-39 MINCP stocks Bearish MINCP Stocks (4/22/2014) Bearish
plurality
--> 30 -5 New Highs on NASDAQ 6 -11
new lows. Bullish
plurality
--> 66
-+14 New Highs on
NYSE 1 -5 new lows. Bullish plurality
The NASDAQ's rally has not yet reached the apex of
its potential new right
shoulder
head. A reversal from
near this level will be bearish. On the other
hand, a
rally past that level will probably bring short-covering and a quick jump
to new
highs.
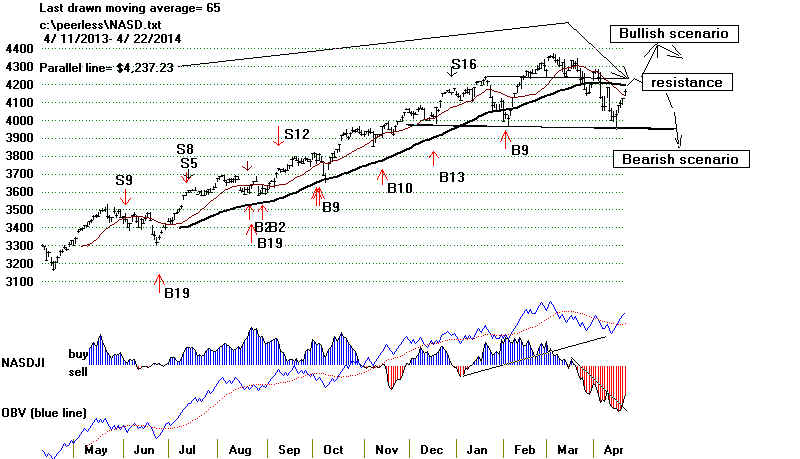
|
The key ETFs' Closing Powers (DIA, SPY, QQQ, IWM, IBB, FAS)
are in
minor uptrends but all are still below their 21-day ma. This means
they are at
risk when the Closing Power turns back down. |
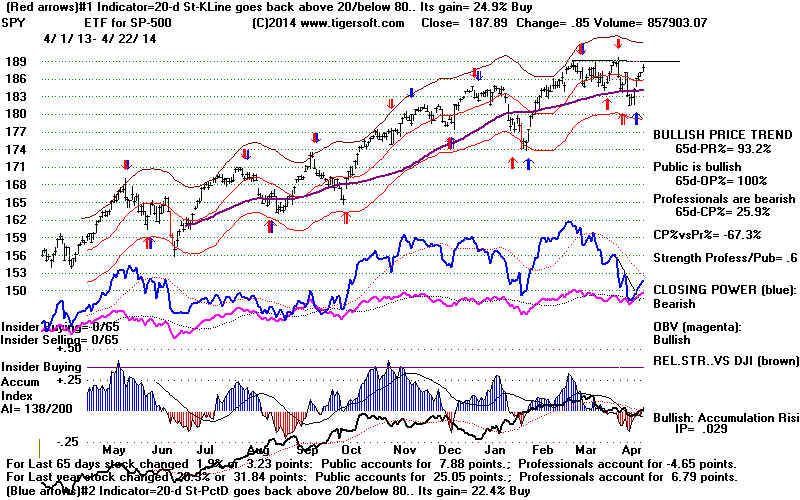 |
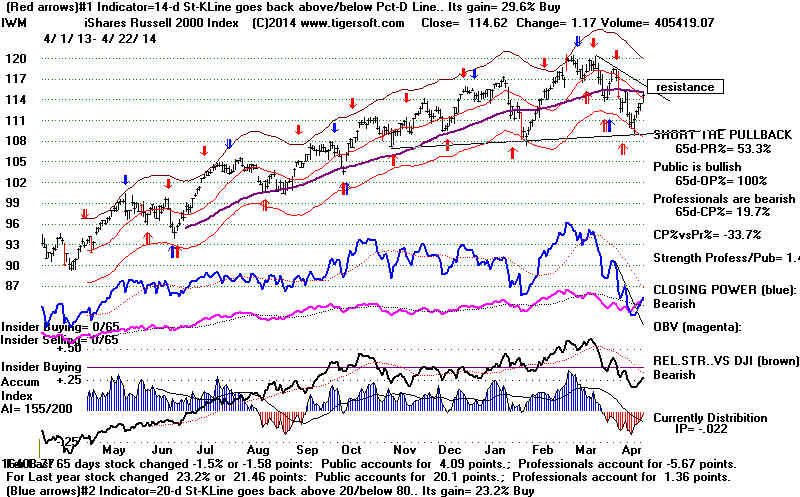 |
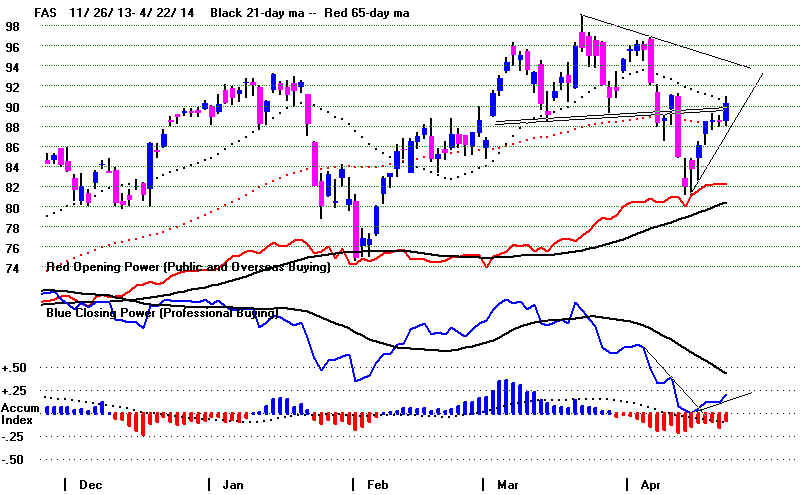
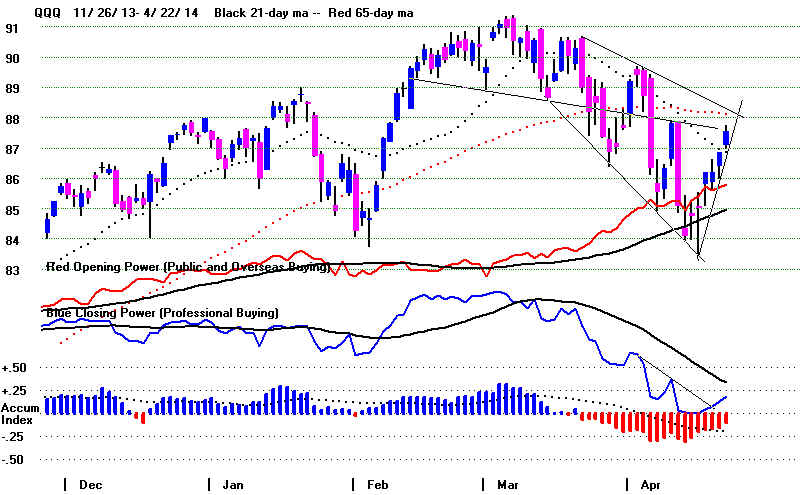 |
================================================================
OLDER HOTLINES
================================================================
4/21/2014
There is
probably more upside potential, but not a lot more, most
likely.
Immediately ahead, the Hourly Momentum Indicator has stopped rising. A few
days' pause seems
likely before the DJI reaches 16600. After April 25th, the
DJI has risen
68.1% of the time for the next week since 1965.
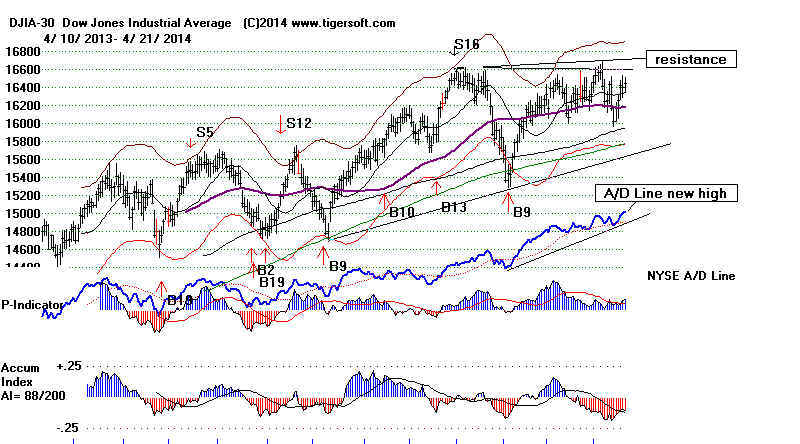
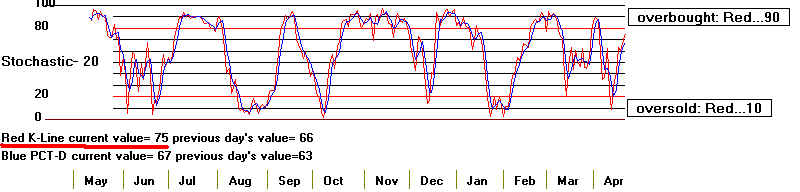
16600 is our
target for the DJI this month. 4250 is as
high as I expect the NASDAQ
will go if the
DJI does rally to 16600. Note the new head and shoulders pattern that
would be forming
if the NASDAQ tops out around 4200.
Showing the
attention that dividend paying stocks are getting, the NYSE A/D Line
made a new
12-month high today. This is far ahead of the DJI. Unfortunately, the
Tiger
Accumulation Index remains quite negative. So a Sell S12 or S15 will probably
occur if the DJI
were to advance 2% higher. New research tonight shows that since
1965 in 5 of 6
cases where the A/D Line made a new 40-day high and the Accum. Index
was negative with
the DJI above the 2.6% band, the DJI's next significant move was
down. (See
the statistics at the bottom of tonight's Hotline).
We saw modest
improvements today in the QQQ's, IWM's
and IBB's Closing
Powers. But
their CP intermediate-term trends are still down and they are below their
falling CP 21-day
ma.
Another Oil
Bubble like in 2008? No. Probably not.
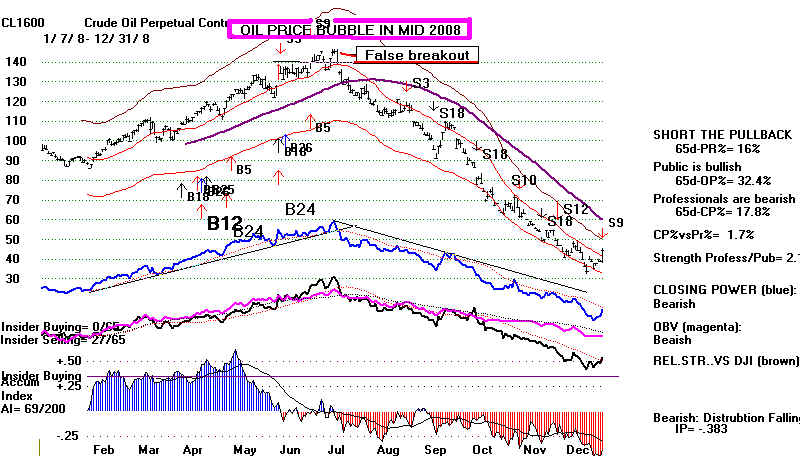
We are seeing
good advances in Bullish MAXCP oil and gas stocks.
They can
go quite a bit
higher before they look frothy, if we make comparisons with 2008.
They seem to be
responding to the rising prices of both Crude and Natural Gas.
Too much move
upwards in the price of oil is bearish for the market as a whole.
But Crude Oil now is nowhere near the levels reached in 2008 yet.
It would have to
rise 40 more
dollars. This may seem like a lot, but it only took 5 1/2 months for
it to jump from
the same level it is now to its peak in mid 2008. So, we want to watch
to see if oil and
oil stocks take over the leadership role in the market as they
did in 2008. Back then coal stocks also were
very strong. The opposite is true
now. Gold
and Silver were not particularly strong then. So, the absence of their
strength now is
not particularly significant, except that it tends to give the FEDs
more time to keep
rates low.
I suggested that
we watch closely the big Bank Stocks that are heavily weighted
in the 3x
leveraged Financials' ETF FAS. This ETF will need to
get past the resistance
of its flat
65-dma for the general market to rally much further. The Hourly DISI or
OBV Line remains
in a downtrend. I take this to be a sign that is simply much
under-counted on
up-days because of the widespread use of the "dark pools".
> To Key Index and Leading Stock Charts: DJI, SP-500, etc.
DJI Chart SPY Chart NASDAQ Chart IBB
Chart IWM Chart
Hourly
DJI-OBV Hourly-MVM0735 FAS-3x Financials IBB-Biotechs
--> 43 +7 MAXCP stocks Bullish MAXCP Stocks (4/21/2014)
--> 99
-42 MINCP stocks Bearish MINCP Stocks (4/21/2014) Bearish
plurality
--> 35 + 8 New Highs on NASDAQ 17
+3 new lows. Bullish
plurality
--> 52
-14 New Highs on NYSE 6 +1 new lows.
Bullish
plurality
NEW STUDY
A/D Line New High vs Negative Accum.
Index (IP21)
with DJI 2.6% or more over the
21-day ma
All Cases: 1928-2014
7/6/1933 104.9
rallied to 108.7 and then down to 88.7
6/17/1935 118.7
Strong Rally! (after only declined to two days to 117.2)
10/14/1935 135
...DJI kept rallying.
11/8/1954
369.3 ... DJI kept rallying
11/7/1955 470.6
DJI rallied to 488.4 on 12/30/1955 then fell to 562.4 on 1/23/56
4/24/1967 887.53
to 909.63 and then fell to 847.77 (This was an S12)
4/10/1986 1849.4 fell to 1750.18 on 5/19/1986
10/6/1997 8100.22 fell to 7161.15 on 10/27/1997
4/22/2003 8404.99 fell to 8306.35 on 4/25/2003 and then up strongly.
7/1/2011 12502.77
to 12724.41 on 7/21/2011 then
fell to 10655.30 on 10/3/2011
12/26/2014 16479.88
rose to 16576.66 (12/31/2013) then fell to 15372.8 (2/3/2014)
------------------------------------------------------------------------------------------------------------------
OLDER HOTLINES
------------------------------------------------------------------------------------------------------------------
4/17/2014
There is more upside
potential, but probably not a lot,
maybe 2% more.
16600 is our target for the DJI this month.
4250 is
as high as I
expect the NASDAQ will go if the DJI does rally to
16600.
As has been
happening more and more before holidays, the market turns
up a few days
early than the day before the holiday. The pre-Easter rally
looks somewhat
tired now. It is not, at all clear, that the tech stocks
that led the
market last year are only having a simple correction. Dividend-paying
plays along with
selected oil and gas stocks are now the apparent
leaders. Rising oil and gas
prices are not helping the US economy,
but they are
boosting CVX and XOM
in the DJIA, thereby giving the
market the
appearance of strength.
> To Key Index and Leading
Stock Charts: DJI, SP-500, etc.
DJI Chart SPY Chart NASDAQ Chart IBB Chart IWM Chart
Hourly DJI-OBV Hourly-MVM0735 FAS-3x Financials
--> 36
-6 MAXCP stocks Bullish MAXCP
Stocks (4/17/2014)
--> 141
-71 MINCP stocks Bearish MINCP Stocks (4/17/2014) Bearish
plurality
--> 27 + 10 New Highs on NASDAQ 14
new lows. Bullish
plurality
--> 66
-1 New Highs on NYSE 5 -1 new lows.
Bullish
plurality
Our Hourly DJI Momentum Indicator shows momentum has just
started to turn down.
The DJI is 0.4%
above its 21-day ma. If it were to rally another 2%, given
the quite
negative IP21, V-I and OBVPct, we likely get a Sell S12 or a S15.
The Hourly DJI's DISI (OBV) chart shows the up-hour volume
is very low compared
to the down hour
volume. This may be because the computerized trading is routed to
to the NYSE on
down-days and to the "dark pools" on up-days. No one can
know, because
such numbers are kept secret. These "pools" are unregulated.
Be that as it
may, in the past, usually rising volume is required to allow the markets
to chew up
over-head resistance and make a breakout. So, I doubt if the DJI will get
much past 16600.
If it does, Peerless probably will give a Sell which we should
respect.

Stock Market "Cozenry"
and Chicanery.
Our historical
findings suggest that higher Openings, like now, without
accompanying
higher Closings are not to be trusted.
Advisory Pink Closing Power S7s at ETF at
top since 1994
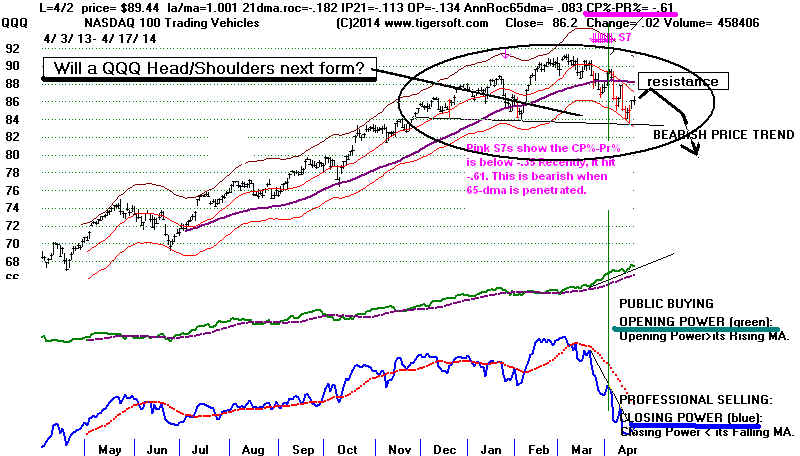
Professionals
(i.e.Closing Powers) are only half-heartedly seeking to repair
the technical
damage done in the April decline. It is the higher openings
which have
brought the last 3 days' recovery. If the Opening Powers were next
to turn down, I
would think the markets cannot not make much more upside progress.
A decline is also
possible. In such a decline, we might or might not find
much Professional
buying support. That remains to be seen
See in the QQQ,
IBB (biotech) and TWN (3x leveraged Small Cap) charts
below how strong
the green Opening Powers has been recently compared to
the blue Closing
Powers.
It is the
over-night changes (higher Openings) which account for nearly all the
gains this year.
Many of us believe
that these higher openings are often rigged
to allow market
making Professionals to reduce their inventory of shares.
I would not put it above the Federal
Reserve itself to be secretly orchestrating
such buying.
This is probably done informally, with nothing being in writing.
No law prevents
Fed Governors from telling their favorite banks what they
will say
publicly.
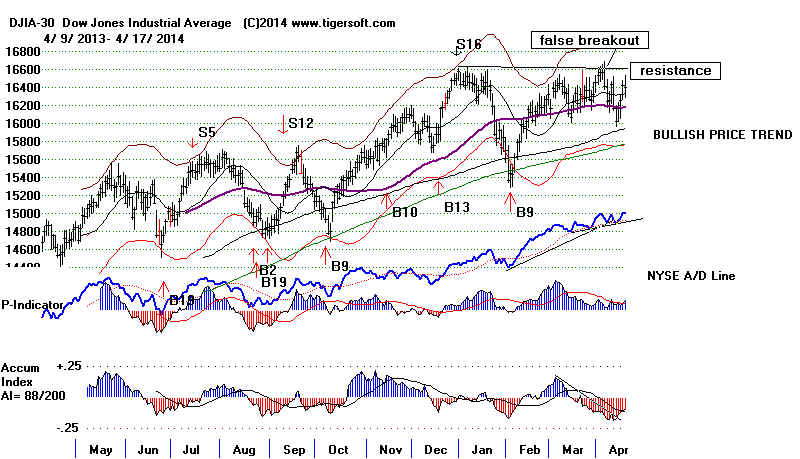
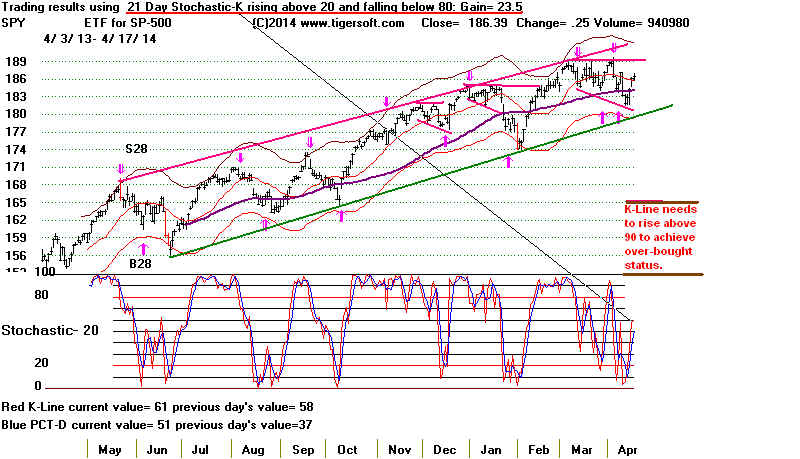
-------------------------------------------------------------------------------------------------------------------
OLDER HOTLINES
-------------------------------------------------------------------------------------------------------------------
4/16/2014 The uptrends have reasserted themselves
for the DJI and
SP-500. The NASDAQ's is doubtful. It seems less likely to catch up
than
form a new and larger head and shoulders pattern. This is also true
for
QQQ, which has not yet broken its Closing Power downtrend.
> To Key Index and Leading Stock Charts: DJI, SP-500, etc.
DJI Chart SPY Chart NASDAQ Chart IBB Chart IWM Chart
As
long as the DJI stays locked in its trading range, the 20-day Stochastic K-Line
crossing Pct-D and the and Tiger Hourly Momentum (7/35) is expected to
work
for successful short-term trading of the DJI. Look also for the Stochastic-based
red
arrows on the DIA and SPY charts, too. We start to highlight these graphs
in
the evenings to come so long as the DJI is trapped in its relatively narrow trading
range.
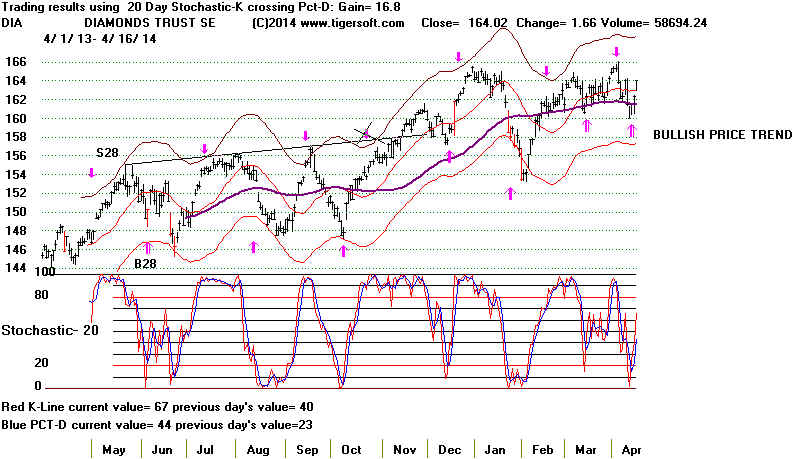
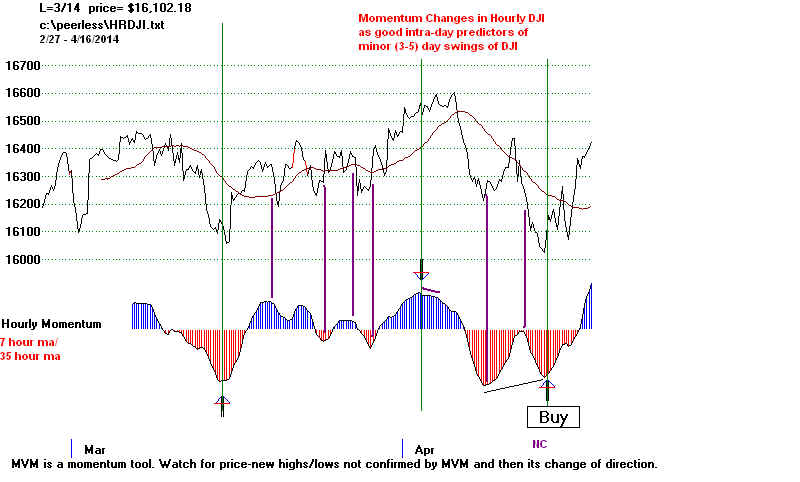
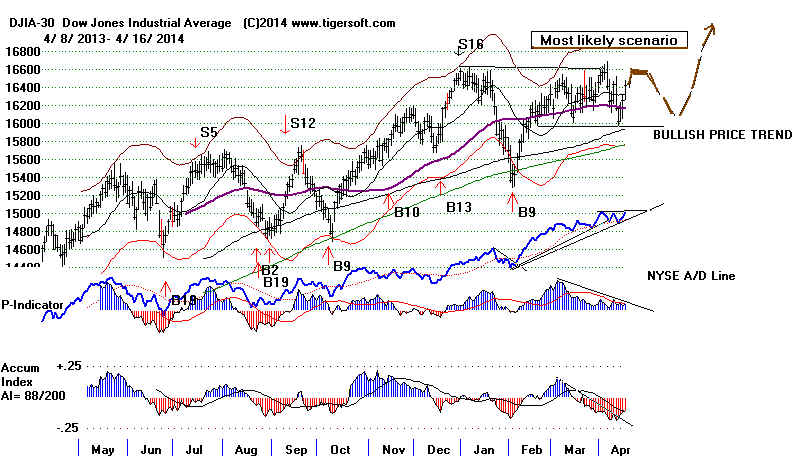
For
the DJI and SP-500, higher prices must be expected, based on the
history of Buy B9s and, more simply, the theory that prices generally
go
from support to resistance and vice verse. Having found support at 16000,
the
DJI must now rally to until it finds resistance. The recent false breakout
at
16600 is its most likely target. Within a trading range, prices rise and
fall
easily. But a breakout seems unlikely. DIA's Closing Power shows a
broken downtrend; however, it is still badly lagging prices. Its Closing Power is
now
only 17.5% of the way up from its 65-day low to its 65-day high while prices
are
89.5% of the way up. The resulting CP%-PR% is a bearish -70.9% for DIA.
SPY's
CP still needs to break its downtrendline, but at least it has gotten
back
above its 65-dma. A small retreat by SPY tomorrow seems a good
bet.
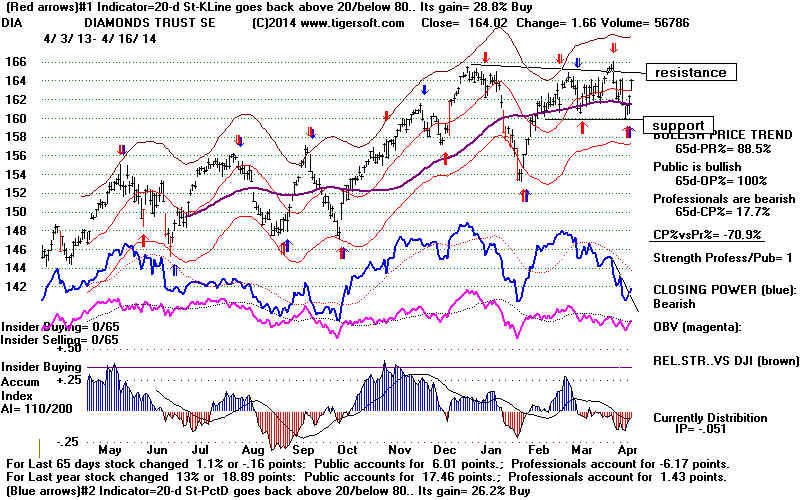
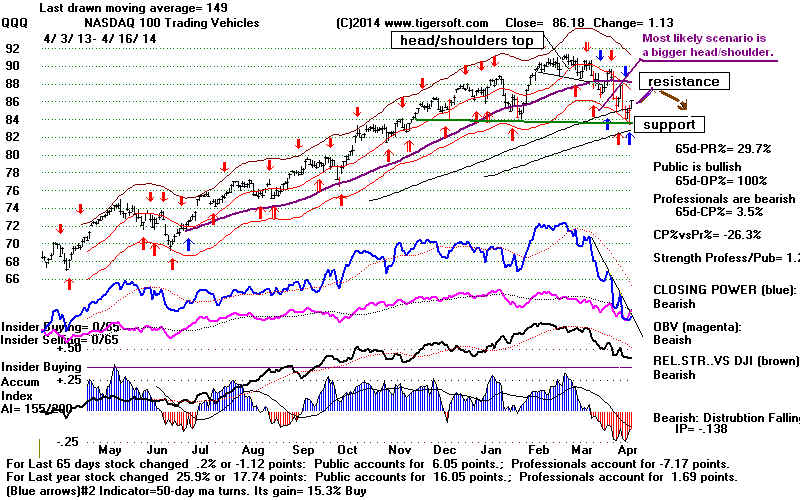 |
--> 42 + 3 MAXCP stocks Bullish MAXCP
Stocks (4/16/2014)
--> 212
MINCP stocks Bearish MINCP Stocks (4/16/2014) Bearish
plurality
--> 17 New Highs on NASDAQ 1
-31 new lows. Bullish
plurality
--> 67 New Highs on NYSE 6 -15 new lows. Bullish plurality
-------------------------------------------------------------------------------------------------------------------
OLDER HOTLINES
4/15/2014 In the last 3 hours of trading the DJI
rose 191 points.
Two Fed Governors called for interest rates to stay
near zero for a long
time. They did not mention any
"bubble" in stocks. This over-shadowed
warnings
from Russia that the Ukraine was close to civil war and Russia must
protect
Russians there.
The Buy B9 still operates for the DJI because the false
breakout and short-term
DJI-head/shoulders Sell S5 failed to break the DJI below the 16000 support.
The Buy B9
is a major and strategic signal. The others are short-term and
tactical
signals. So, the DJI is apparently still stuck in its 16000-16600 trading
range.
It is doing its job of bolstering the market when people get scared very
well with
the help of computerized trading and repeated Fed reminders that
low
interest rates are here to stay. The Red and Blue Stochastic buys on DIA
are
probably reliable here. (Blue and Red signals coming together are more reliable
than just
the red signal by itself.) Still, all in all, a break in DIA's CP downtrend
is what is
really needed technically to ratify the prospects of a rally back up to 16600.
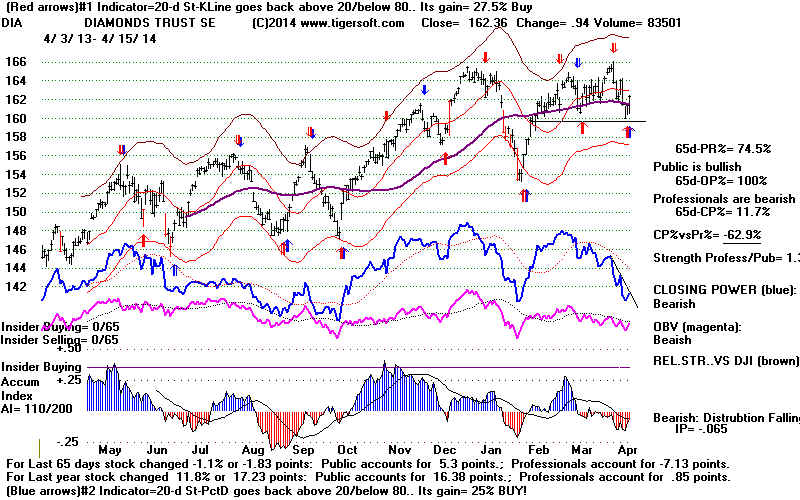
.
> To Key
Index and Leading Stock Charts: DJI, SP-500, etc.
DJI Chart SPY Chart NASDAQ Chart IBB Chart IWM Chart
--> 39
+ 15 MAXCP stocks Bullish MAXCP
Stocks (4/15/2014)
--> 374
MINCP stocks Bearish MINCP Stocks (4/15/2014) Bearish
plurality
--> 13 New Highs on NASDAQ 44
-6 new lows. Bearish plurality
--> 33
+9 New Highs on NYSE 21 new lows. Bullish plurality
Warning for Fed Watchers.
Very "dovish" Fed
pronouncements and even very "dovish"
monetary
policy does NOT cause new business investments if too many
people are
"scraping by" and Aggregate US Demand less Government Spending
will not
support an expansion. So, can the Fed hold the market up if the
US economy
is still quite weak? The late 1920s in the US show it can for a
year or
two. But eventually stocks go up too much. Earnings can't justify the
gains on
Wall Street. When lay-offs come, the economy gets weaker and investors get
worried and
sell their shares. A financial panic can cause a near Depression.
If stocks
were again to collapse as in 1907, 1929, 1937 and 2008, the economy
would
suffer very badly and unless the FED can make interest rates go below
zero (!?),
very bad times would likely follow. We want to start comparing
earnings
reports with signs of big lay-offs.
So, I agree
with the pundits, we need some very positive earnings reports
in here and
fewer announcements of lay-offs.
It remains
to be seen if the probable rally tomorrow will swoop up the most
beaten down
stocks of the last few weeks. Most of the high-fliers
on the
NASDAQ ignored the blue chip and dividend-paying
stocks' rally today,
as did most
of our Bearish MINCP stocks.
With volume low and most of the ETF's Closing Powers still
declining,
the rally
in the NASDAQ, QQQ and biotechs will most likely be
limited.
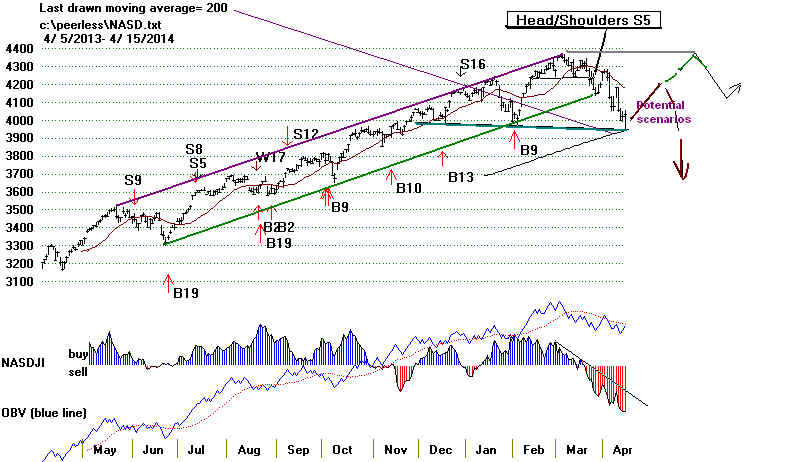
I realize the ride is bumpy, but my advise
still is to wait for the Closing Powers
to hook up and
break the CP down-trends before closing out the QQQ
and FAS short
sales. It's true: the NASDAQ and QQQ rebounded from
expected support.
That was the zone between the rising 149-day (30-wk)
and 200-day ma
usually bring some kind of rallies. But we want confirmation
of that by seeing
the Closing Powers turn up with some conviction. The
technical problem
for the NASDAQ now is that it could be forming a
bearish
head/shoulders pattern.
QQQ rebounded from support
but its Closing Power did not rise at all.
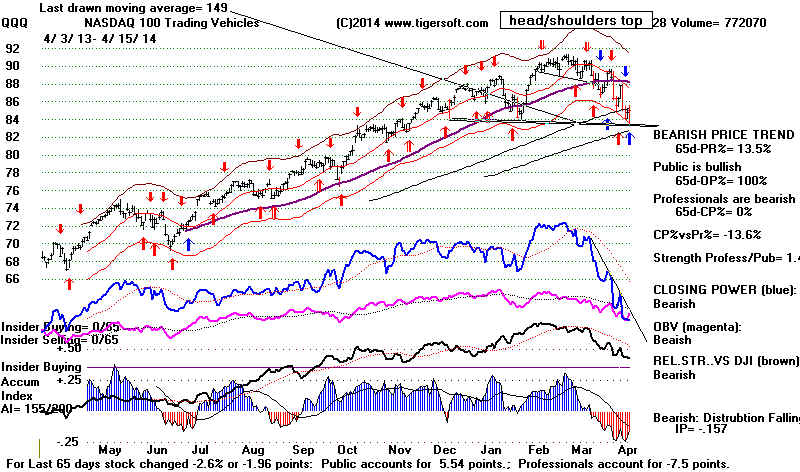
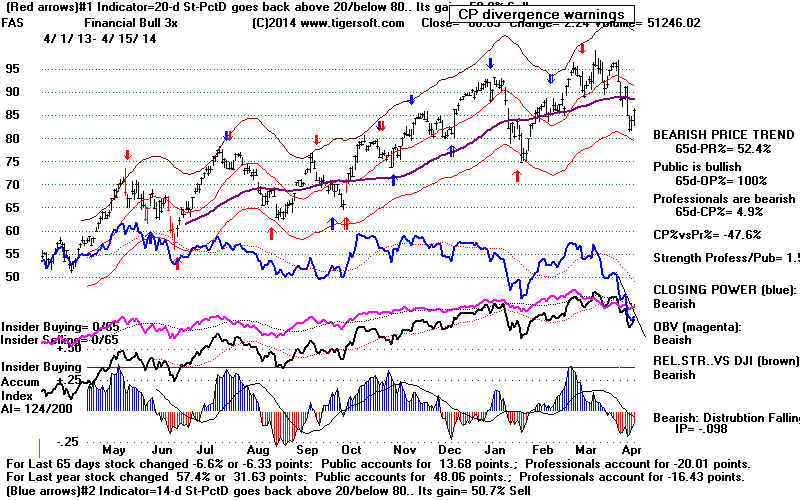
-------------------------------------------------------------------------------------------------------------------
OLDER HOTLINES
www.tigersoftware.com/115HL
-------------------------------------------------------------------------------------------------------------------
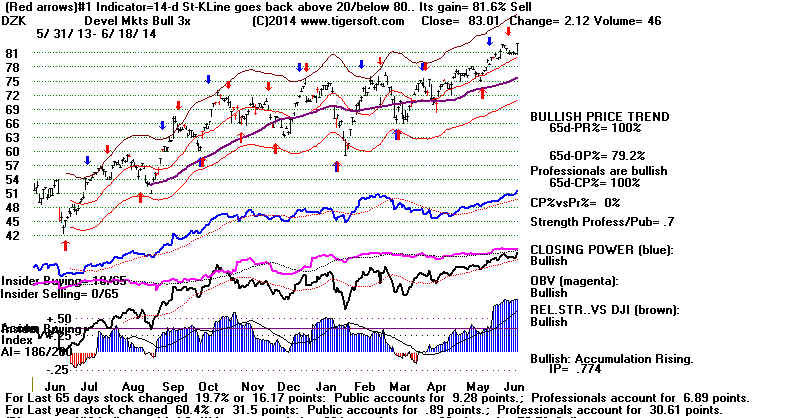
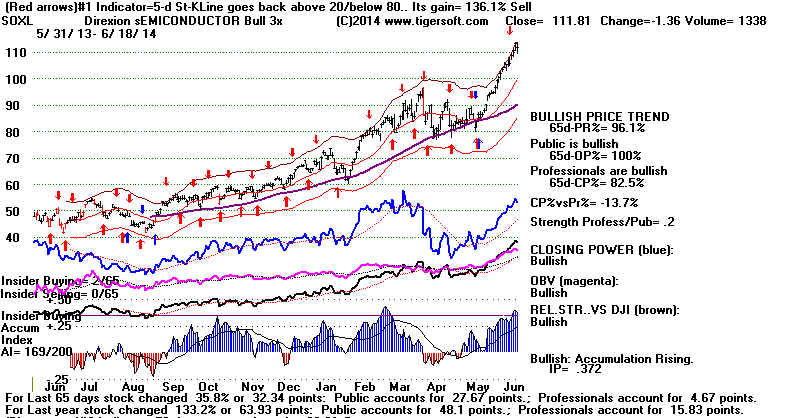
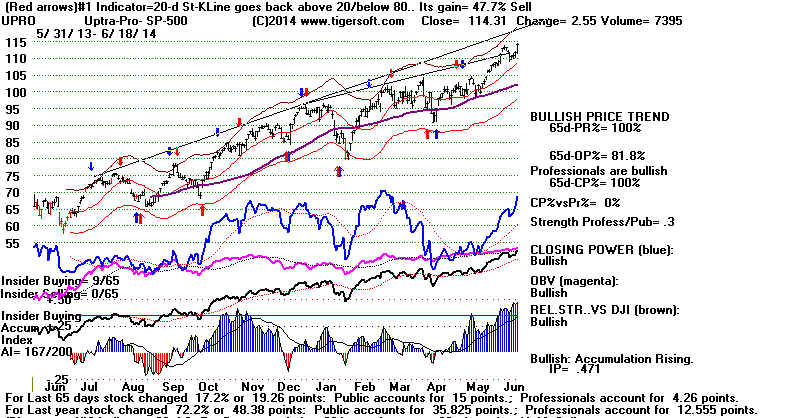
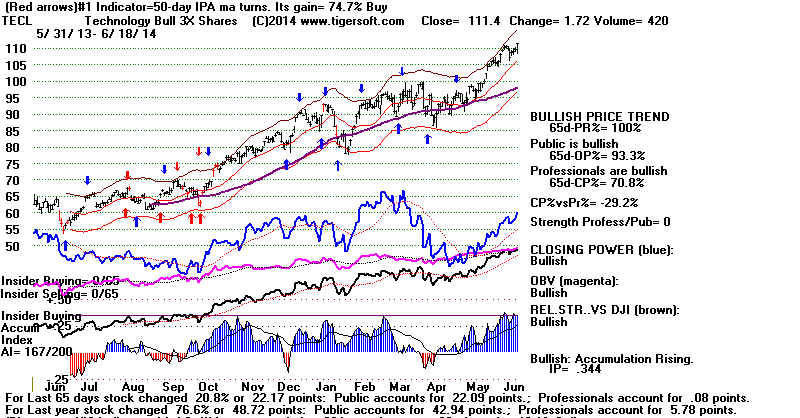
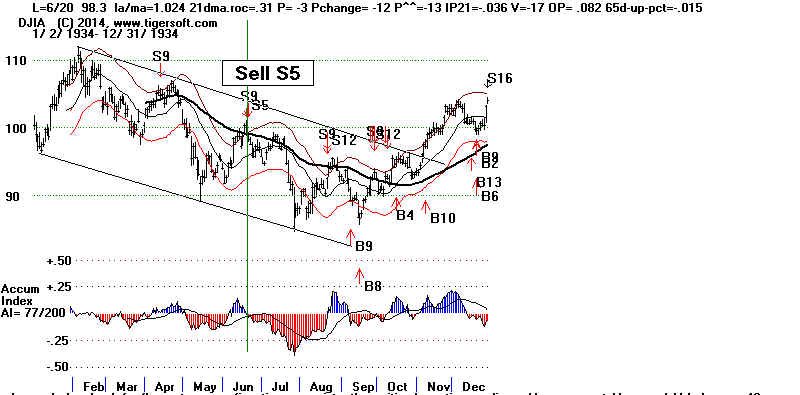
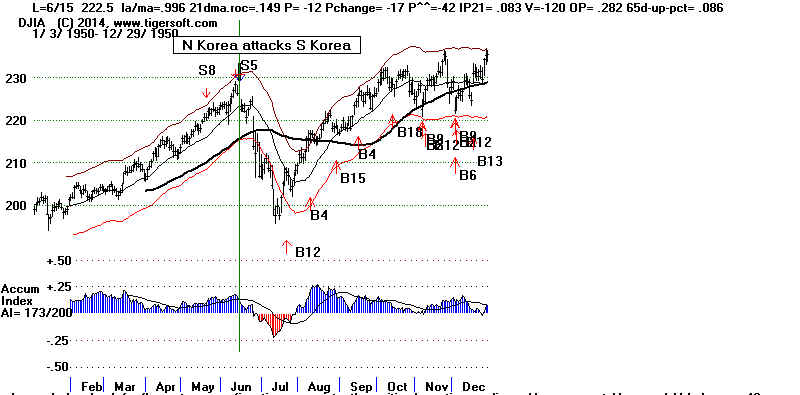
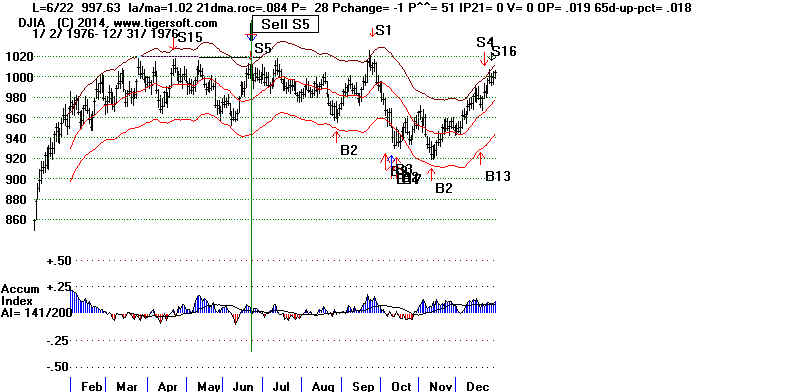
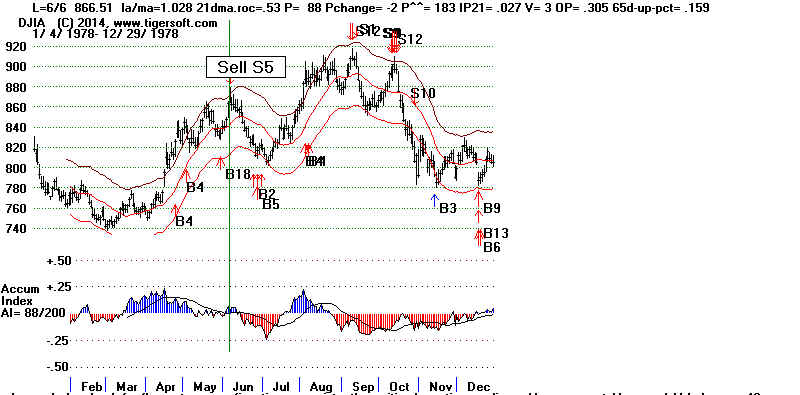
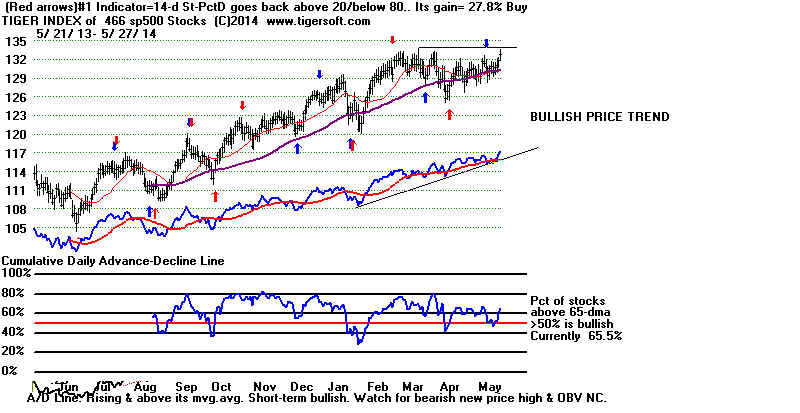
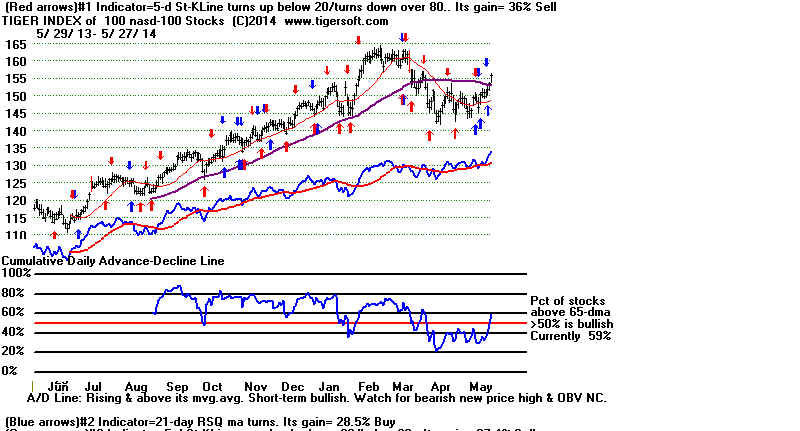
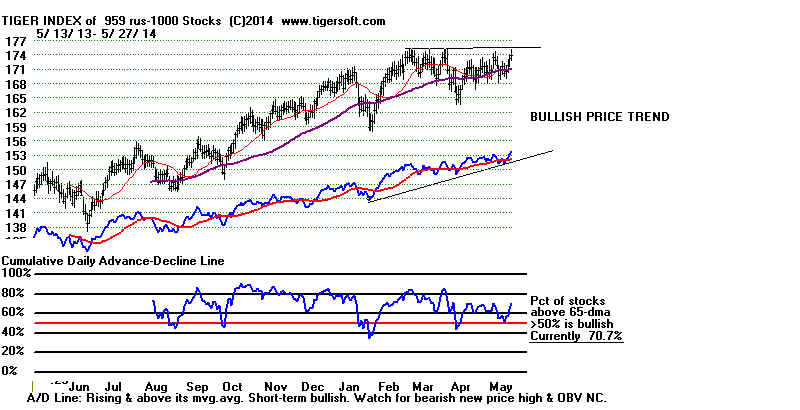
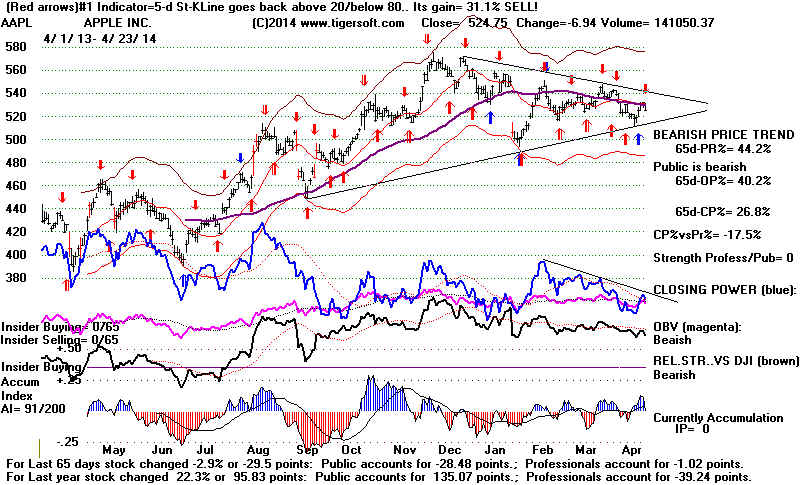
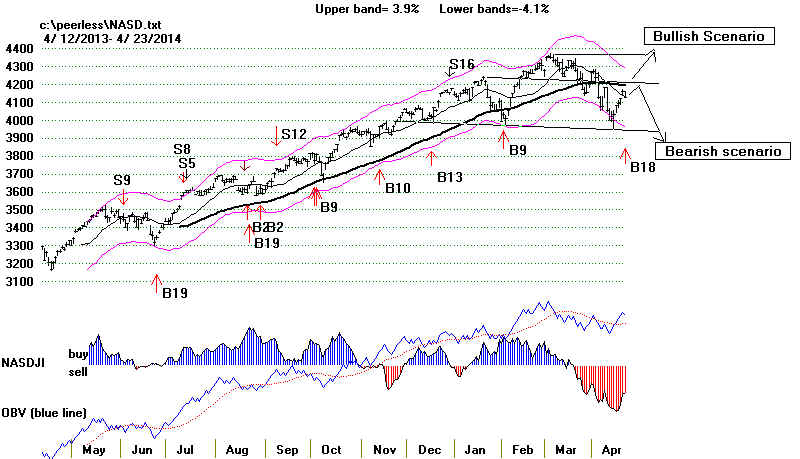
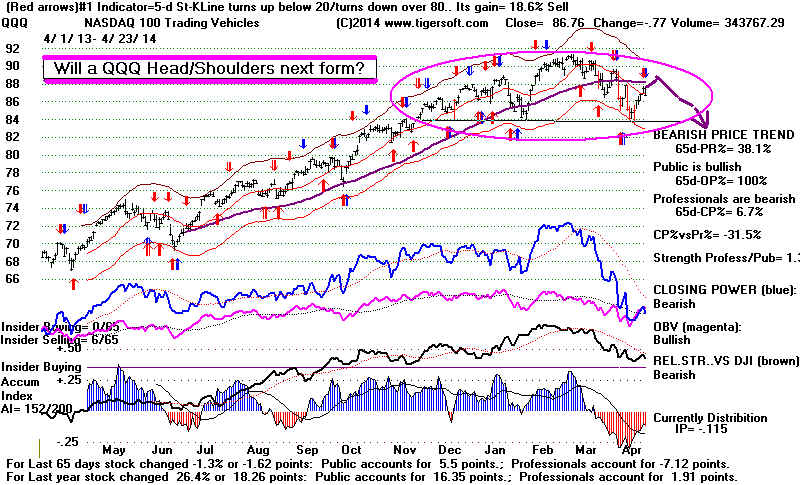
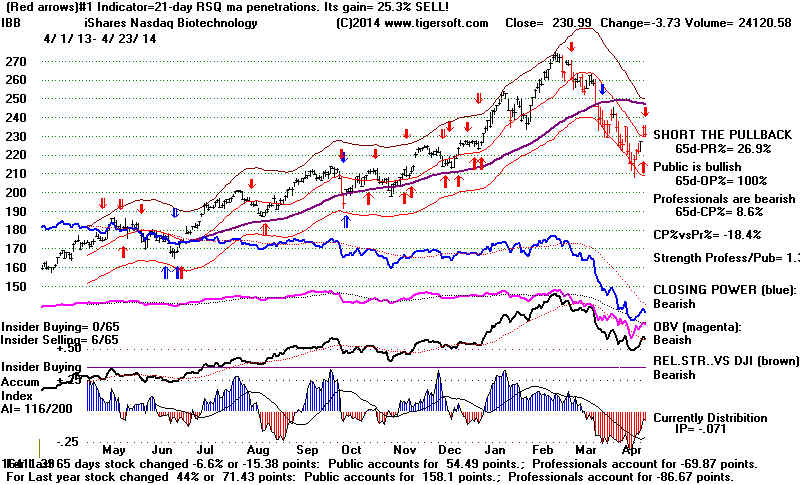
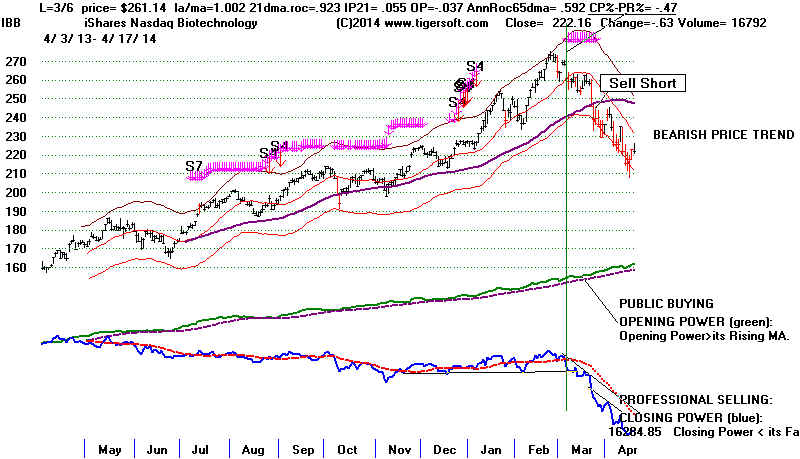
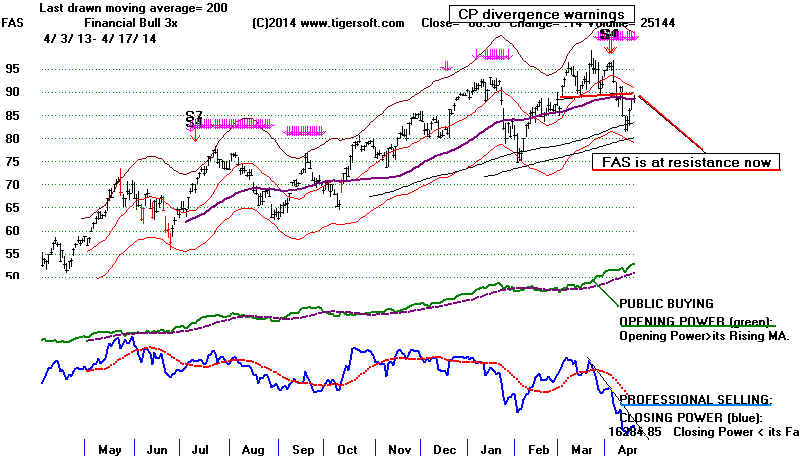
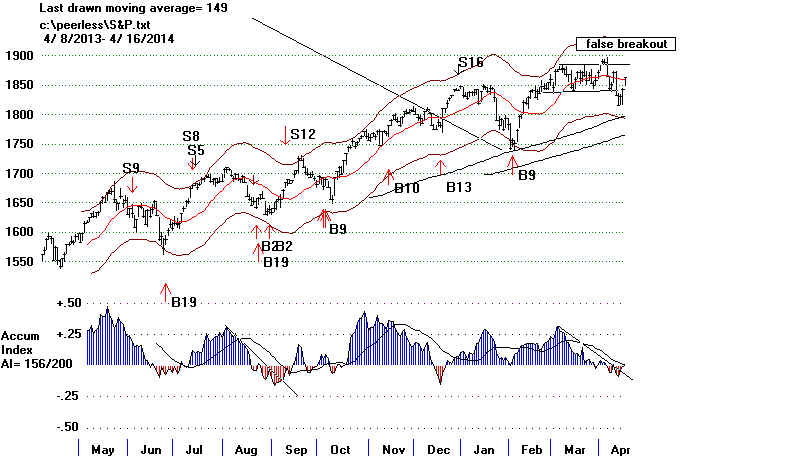
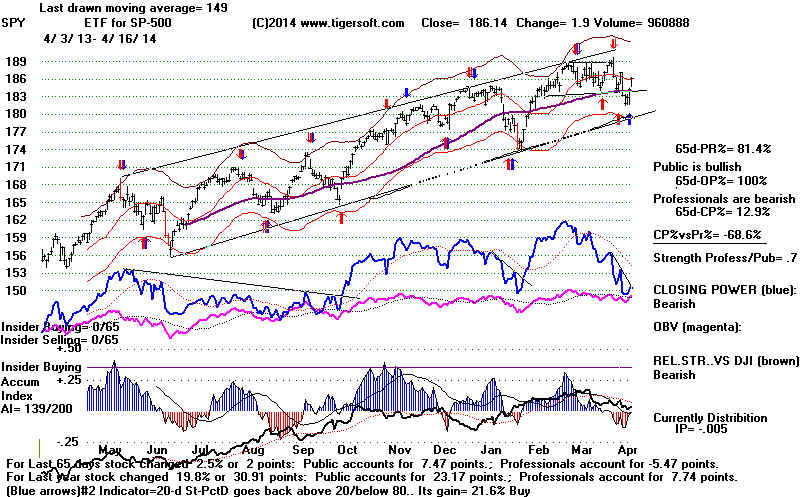
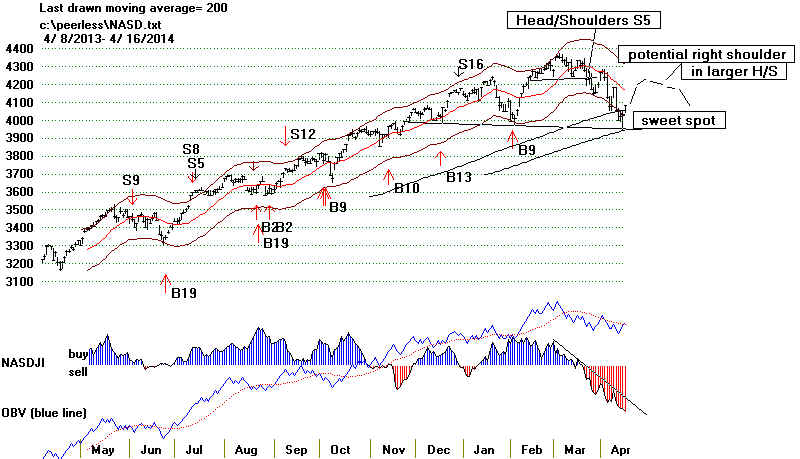
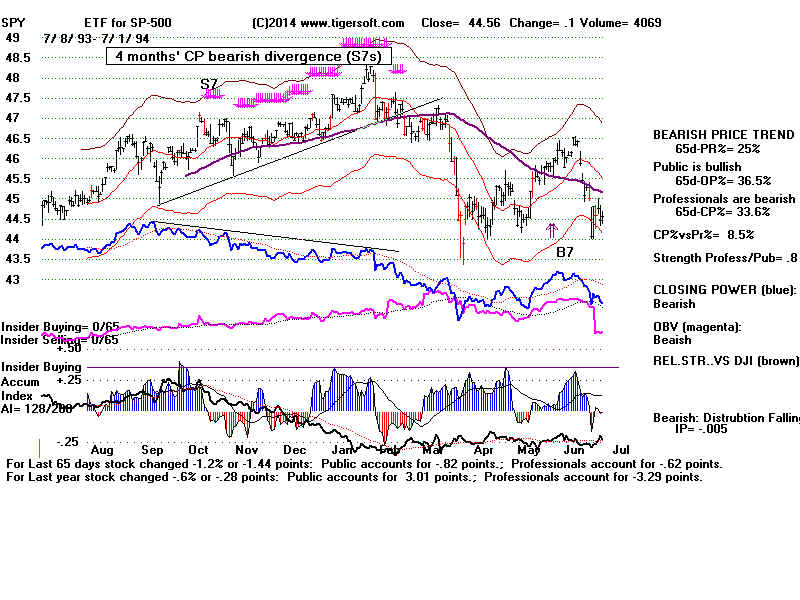
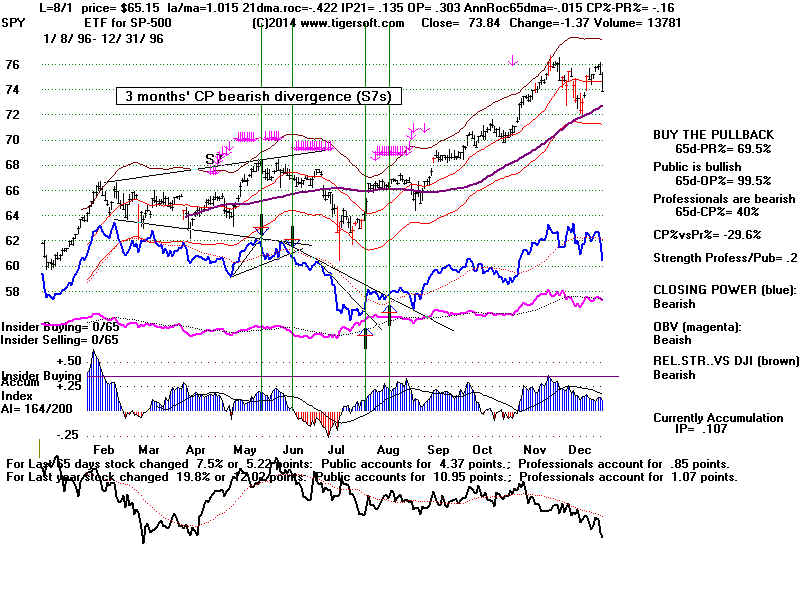
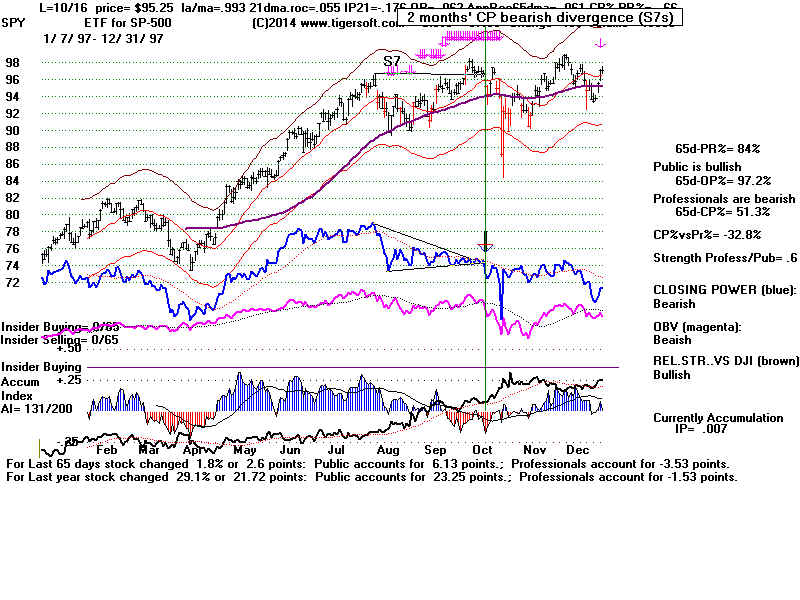
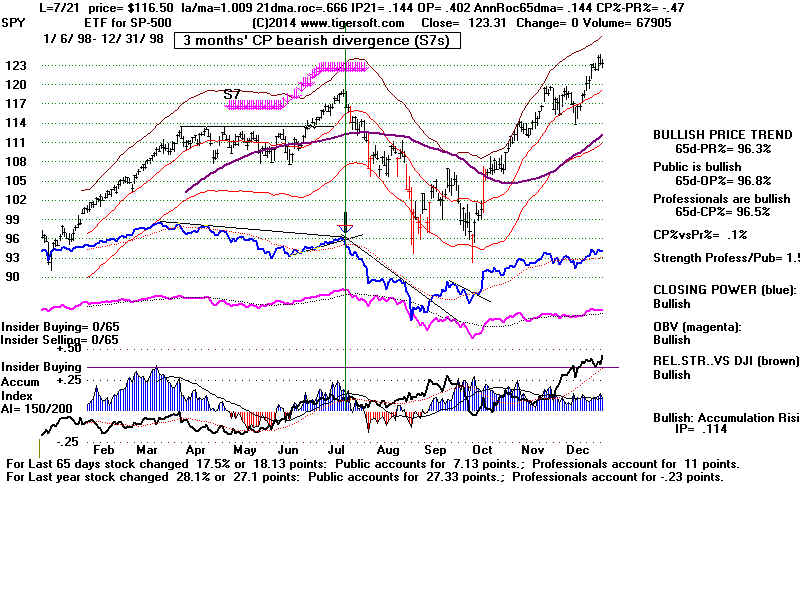
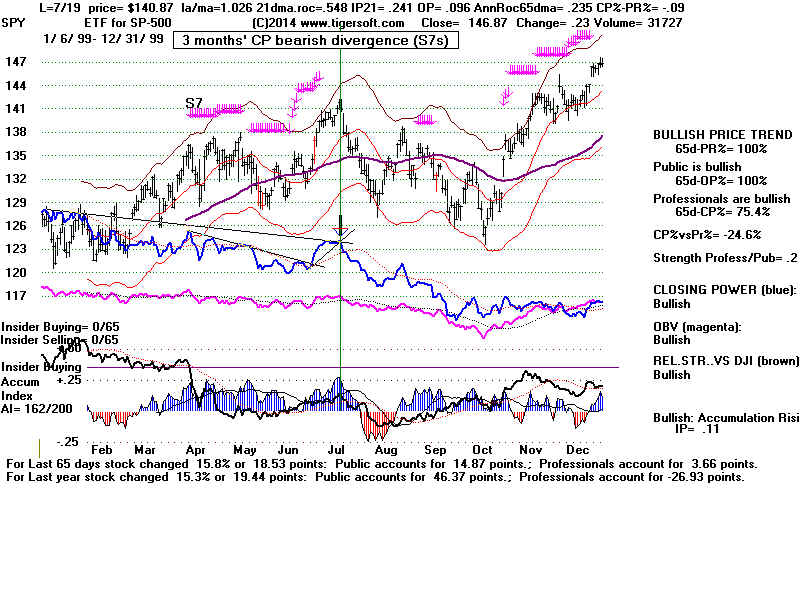
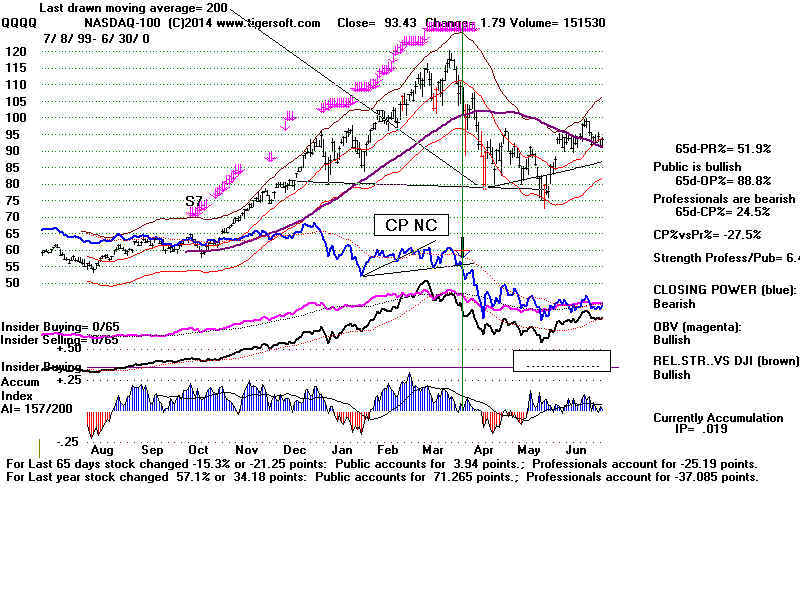
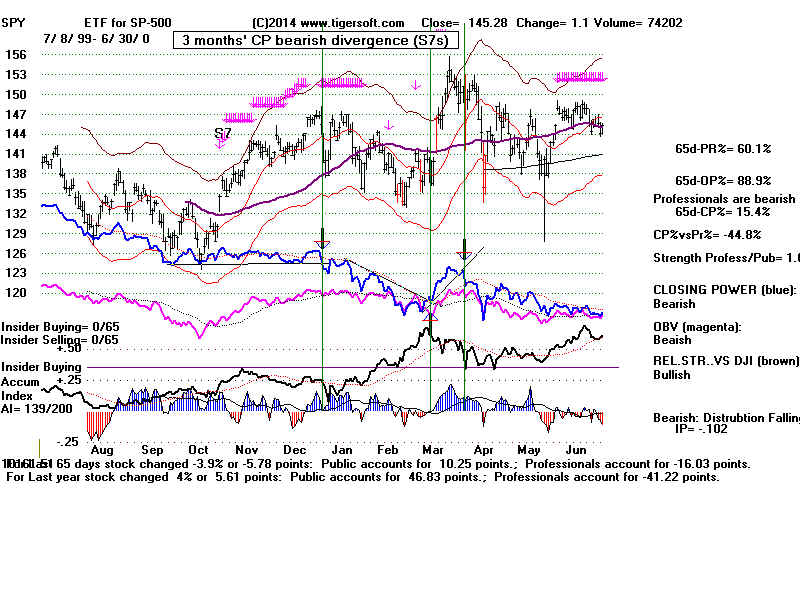
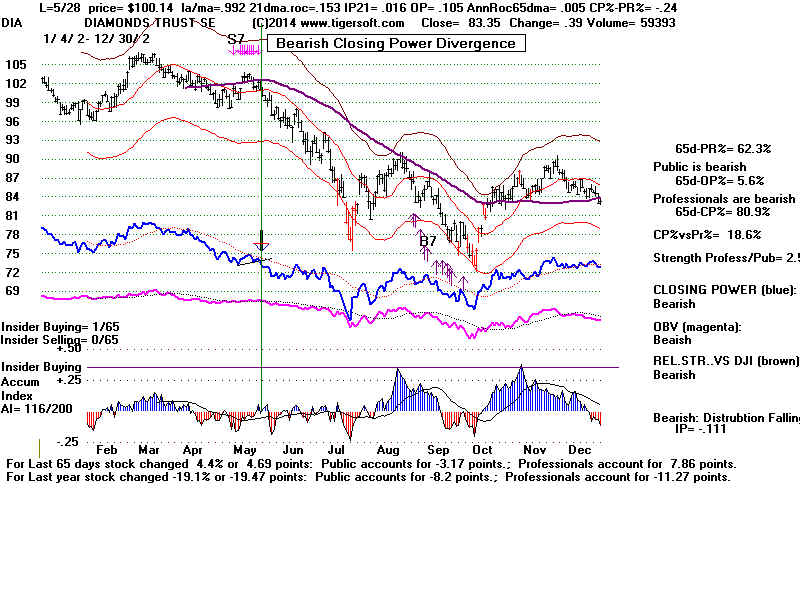
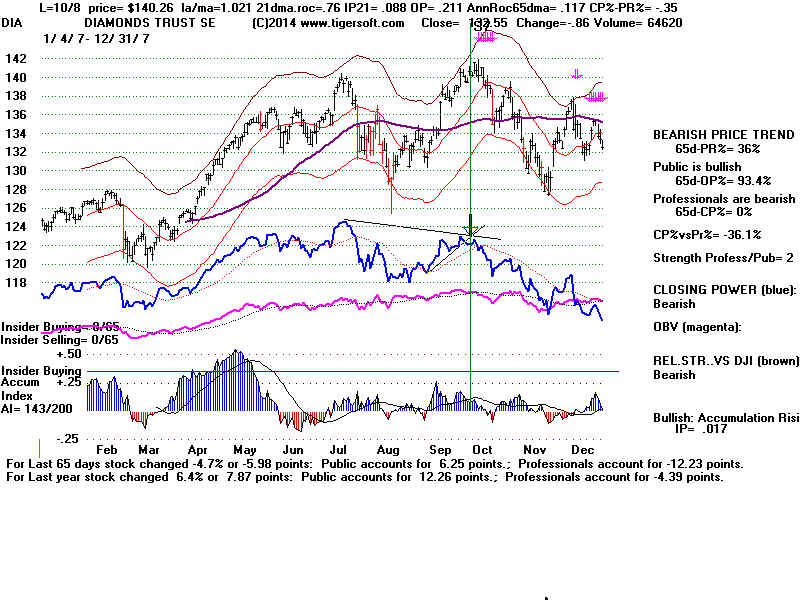
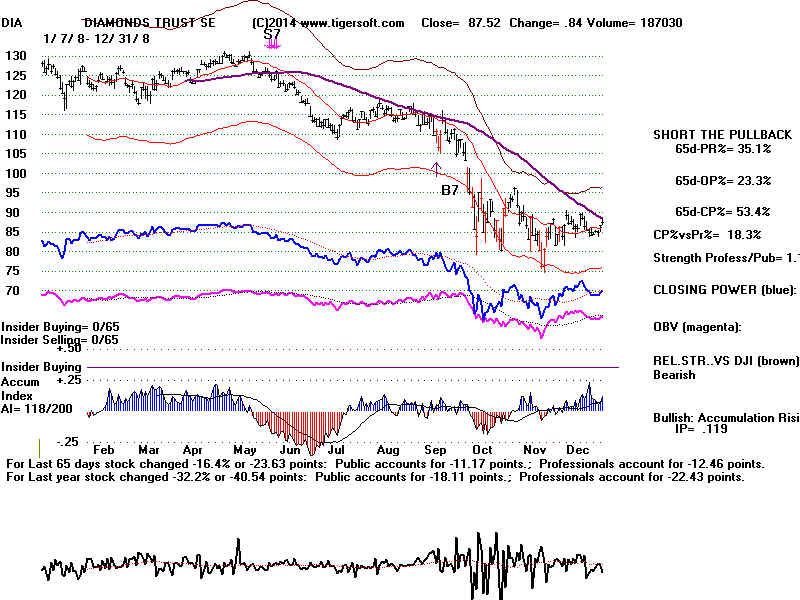
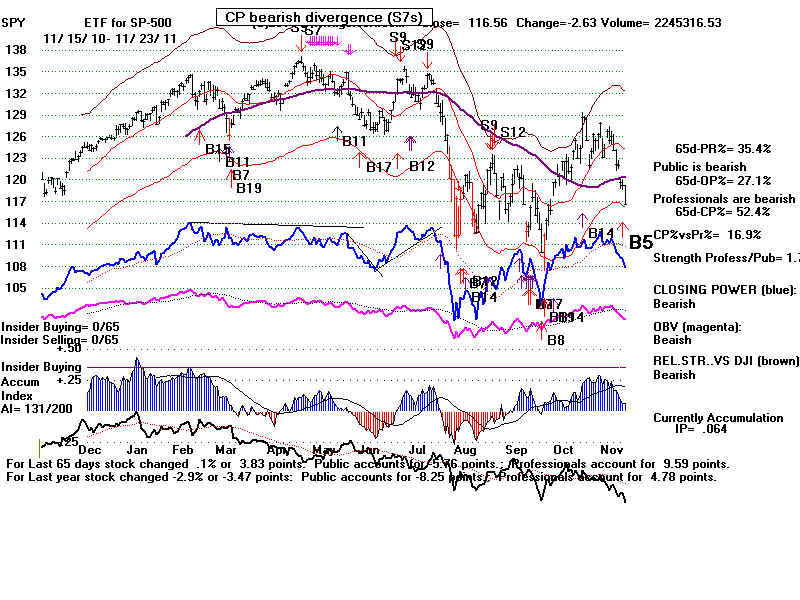
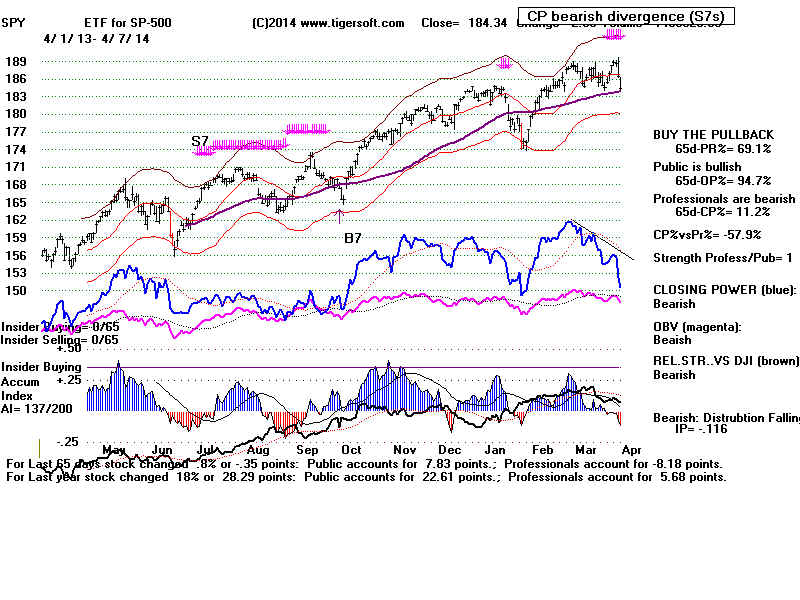
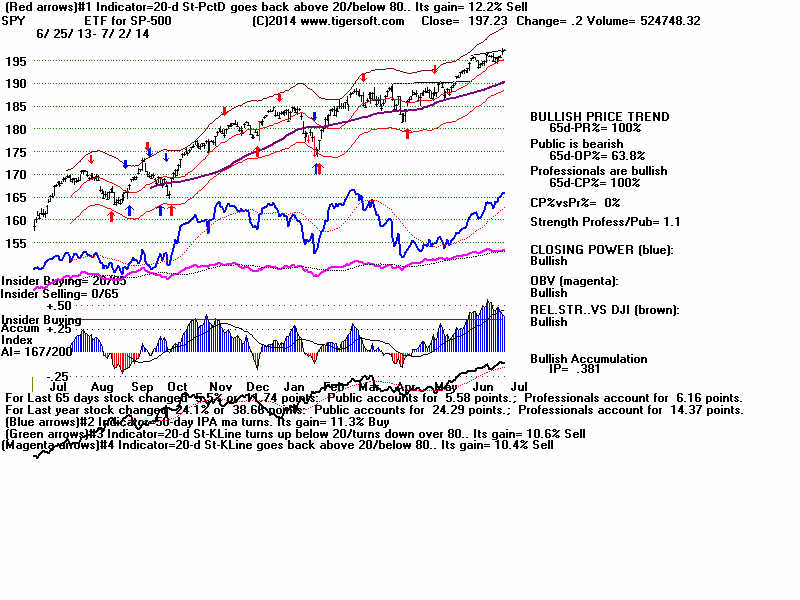
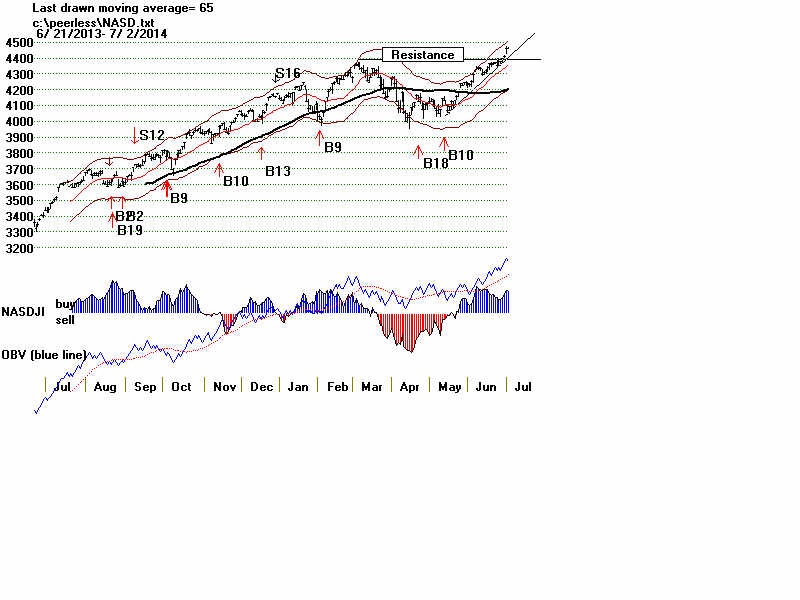
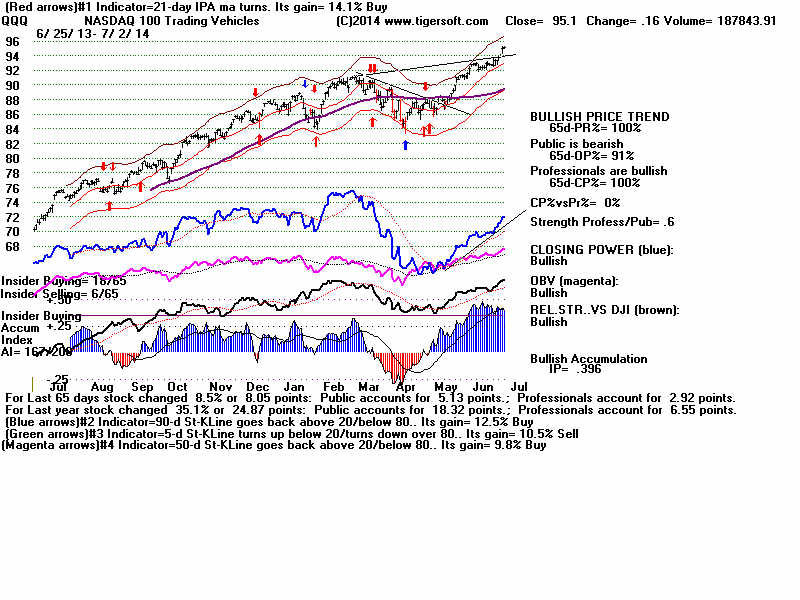
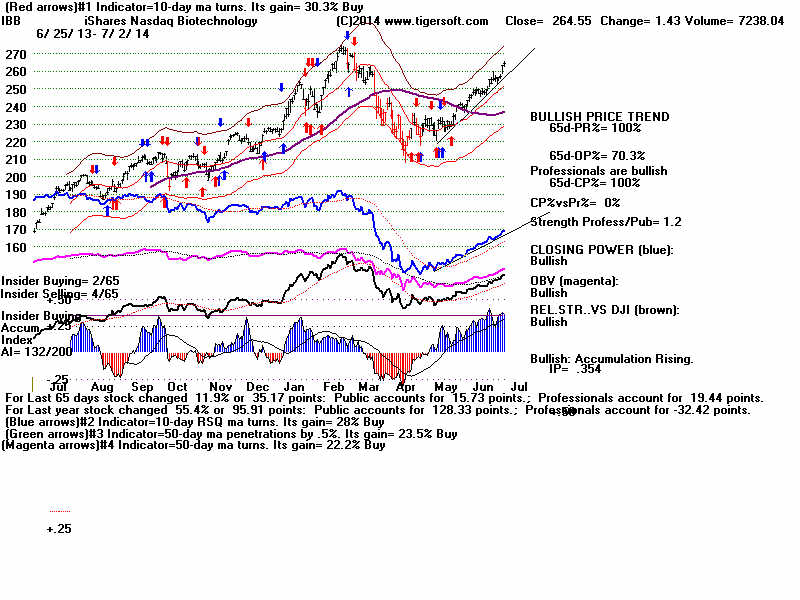
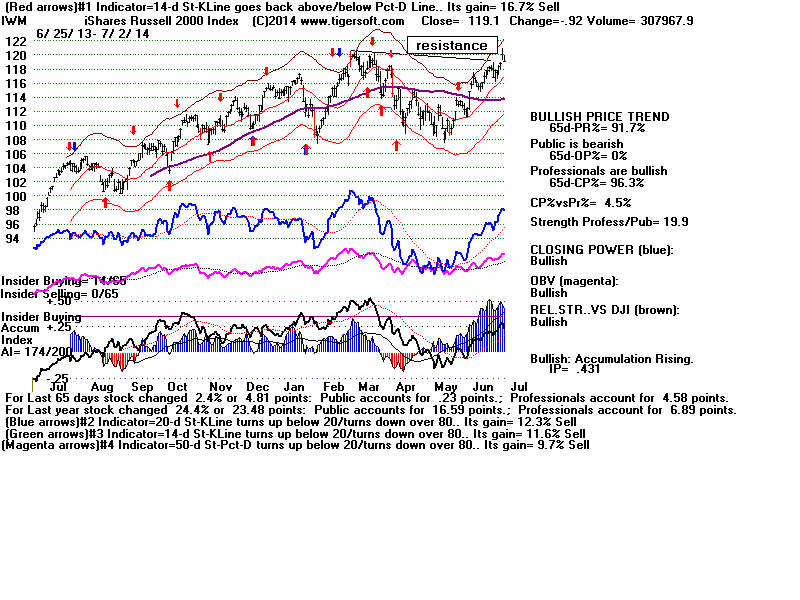
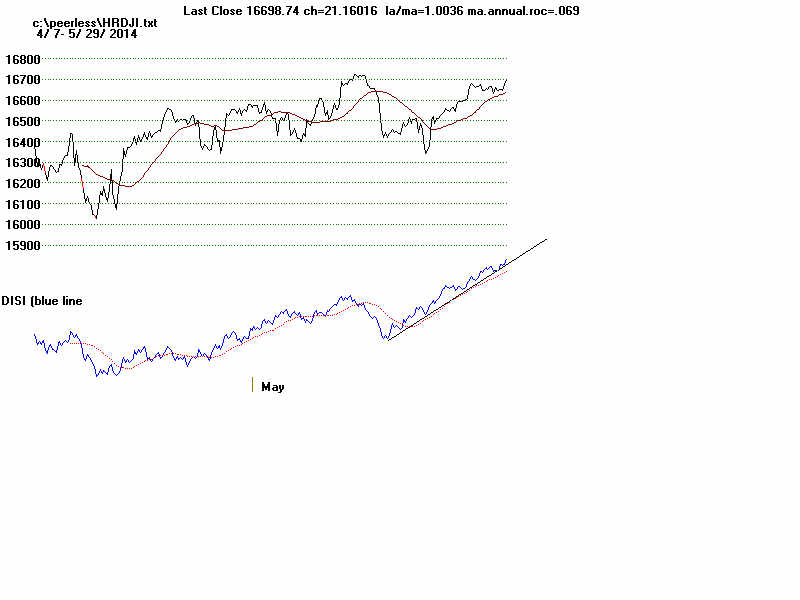
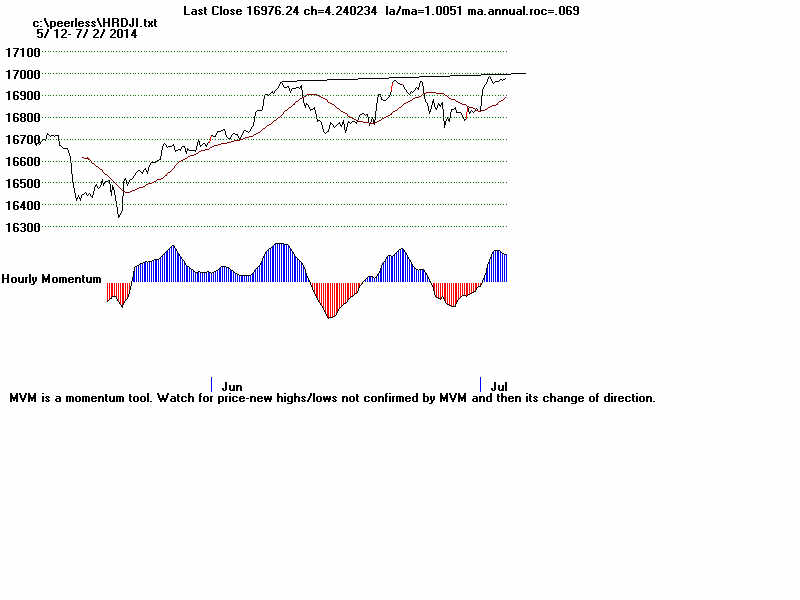
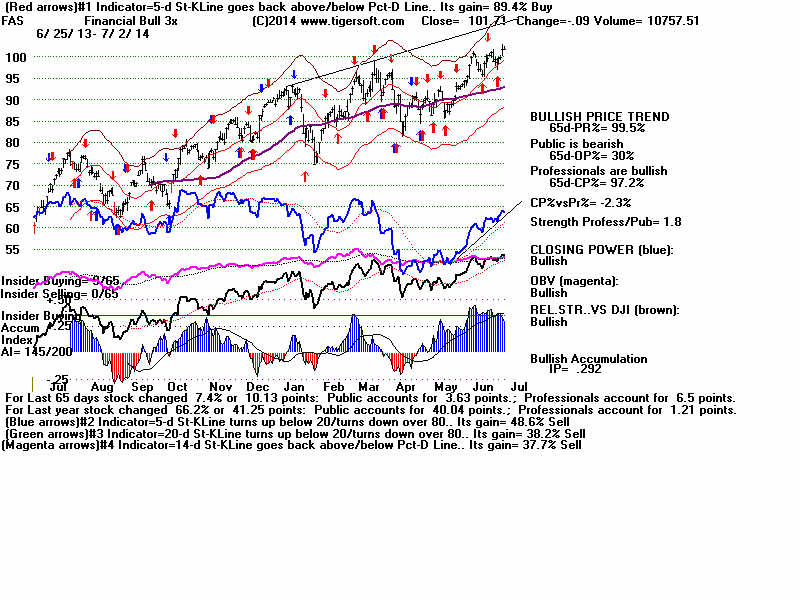
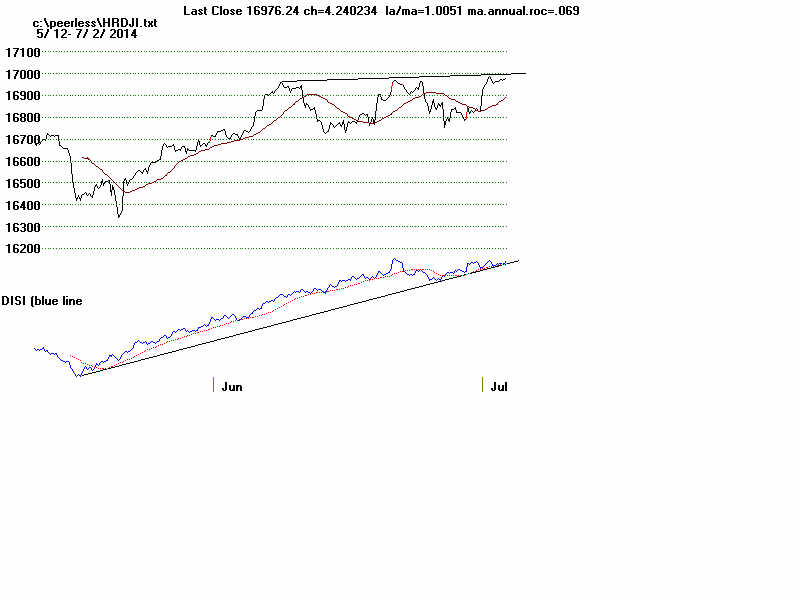
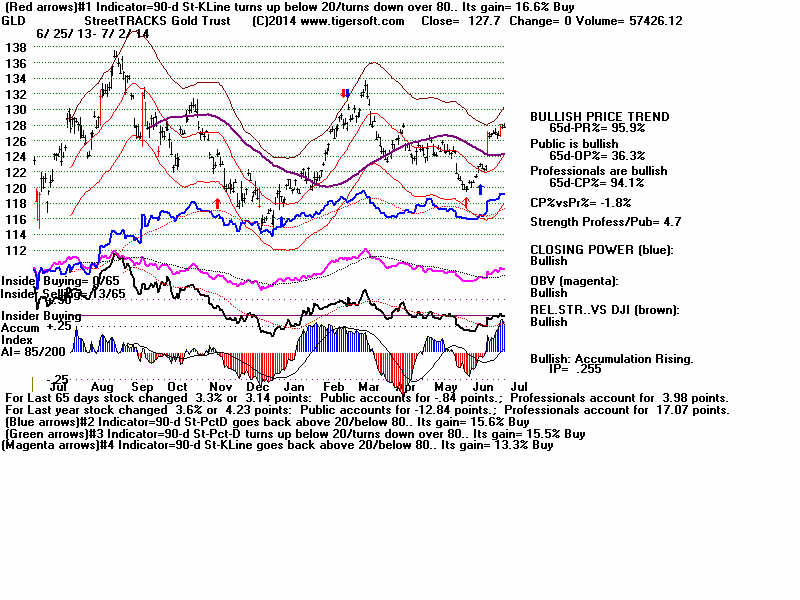
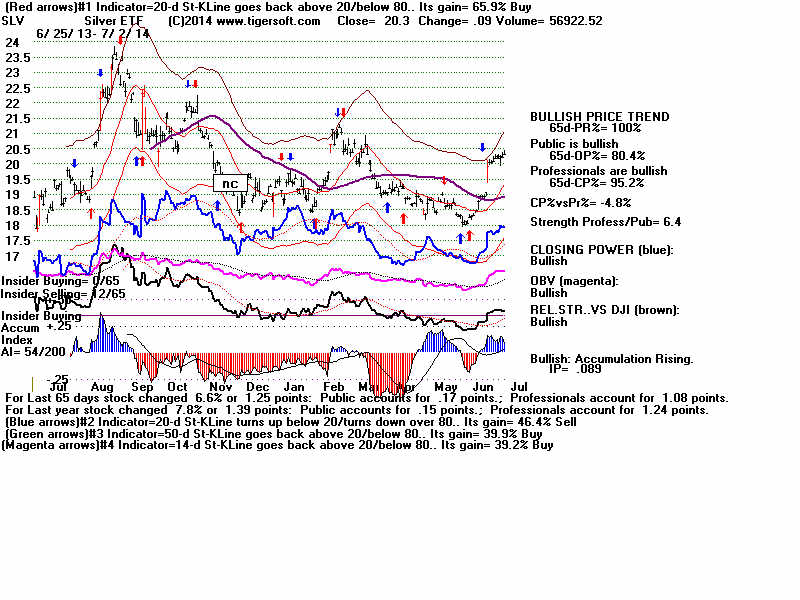
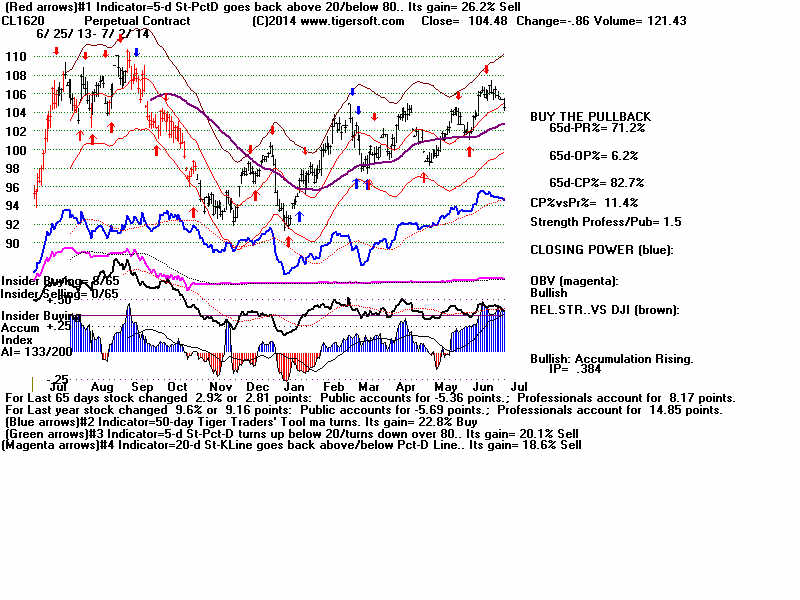
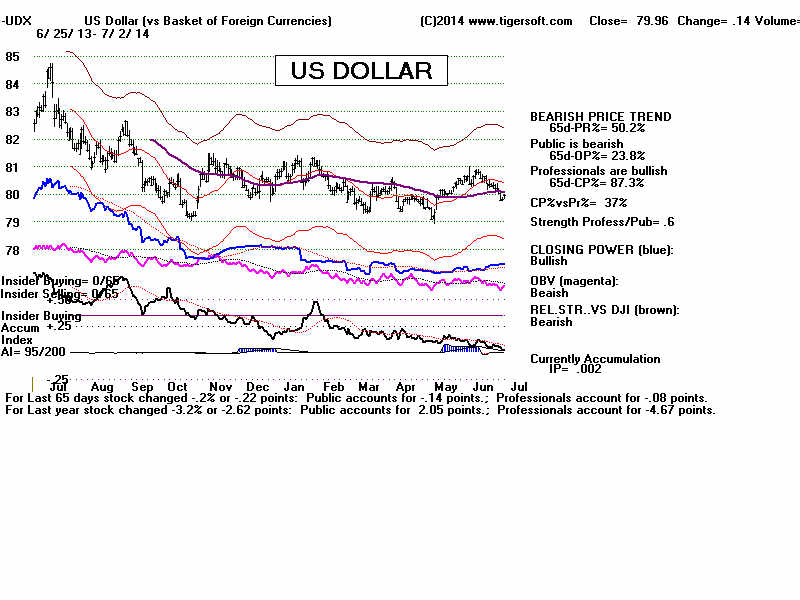
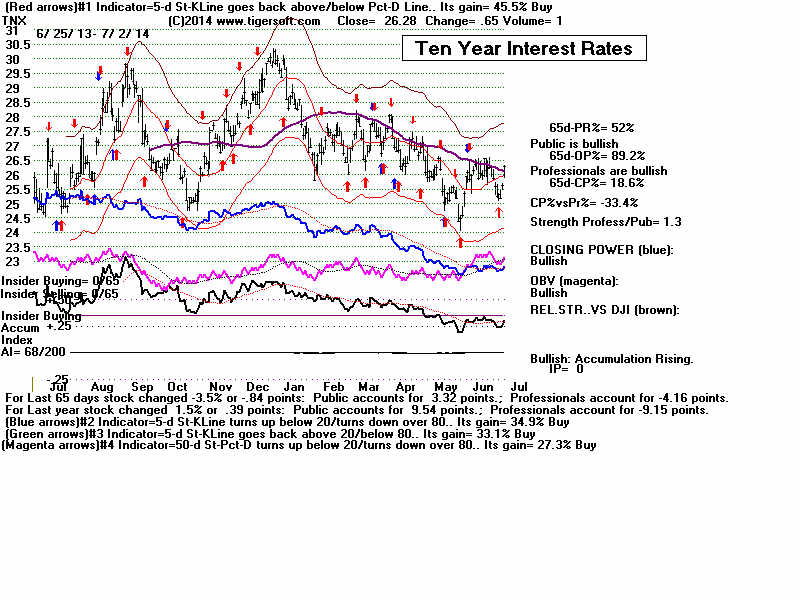
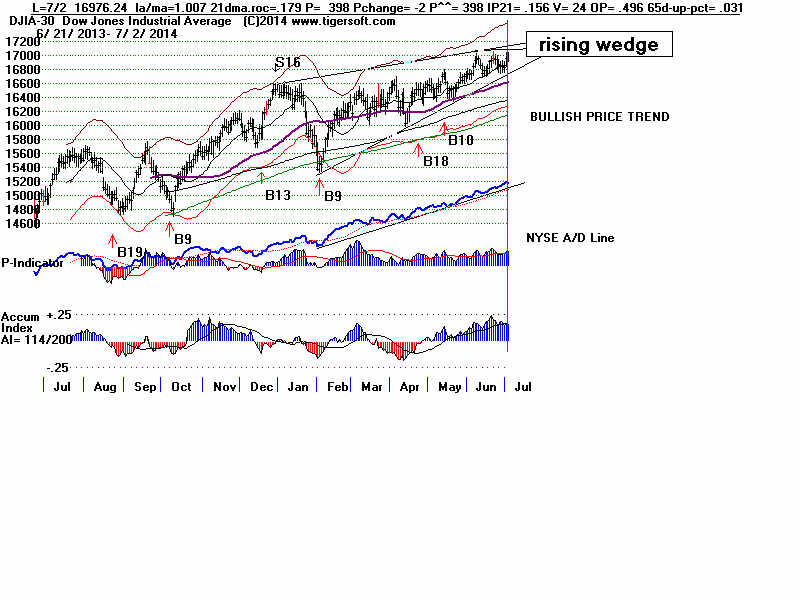
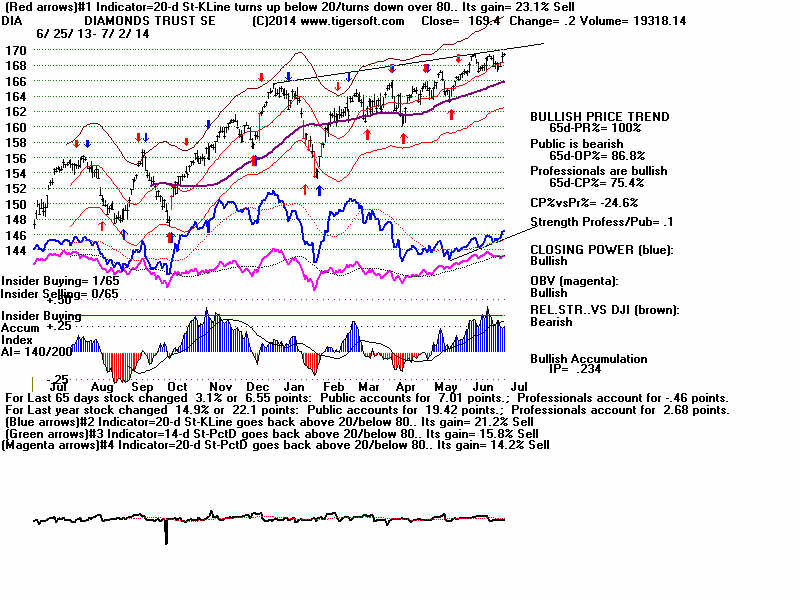
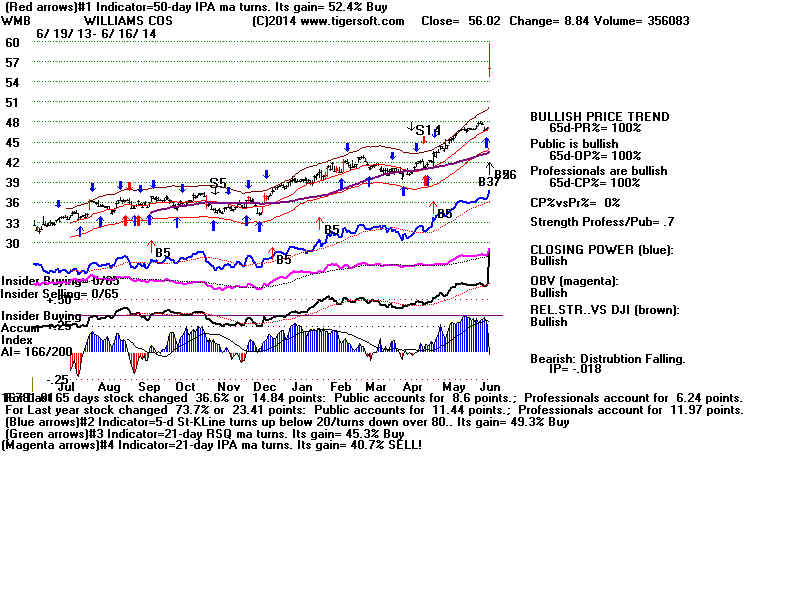
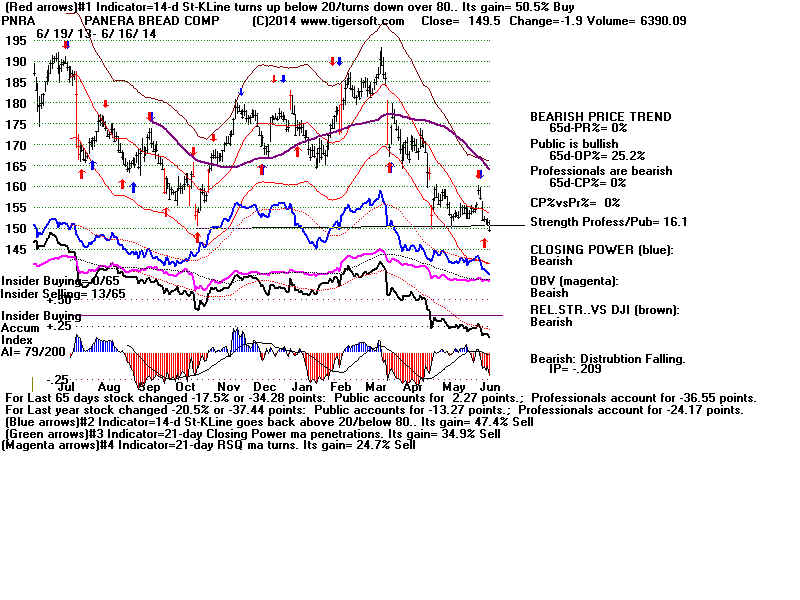
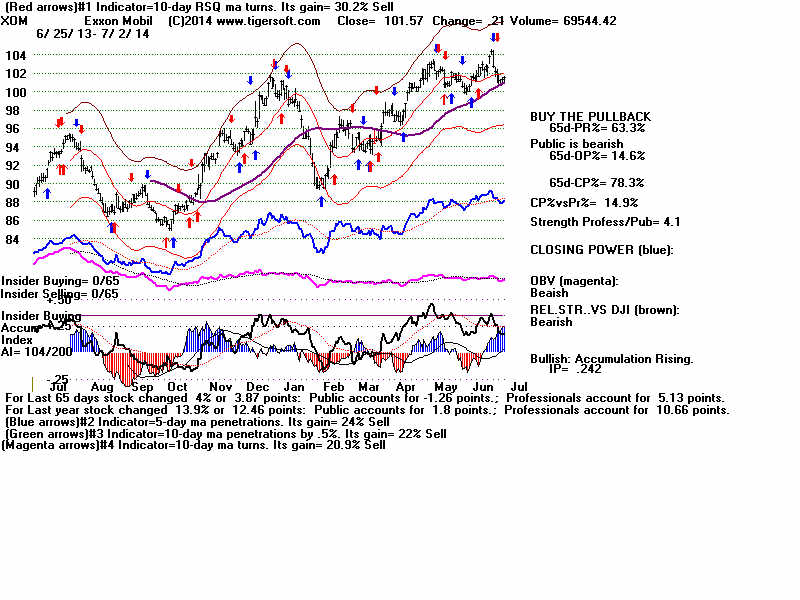
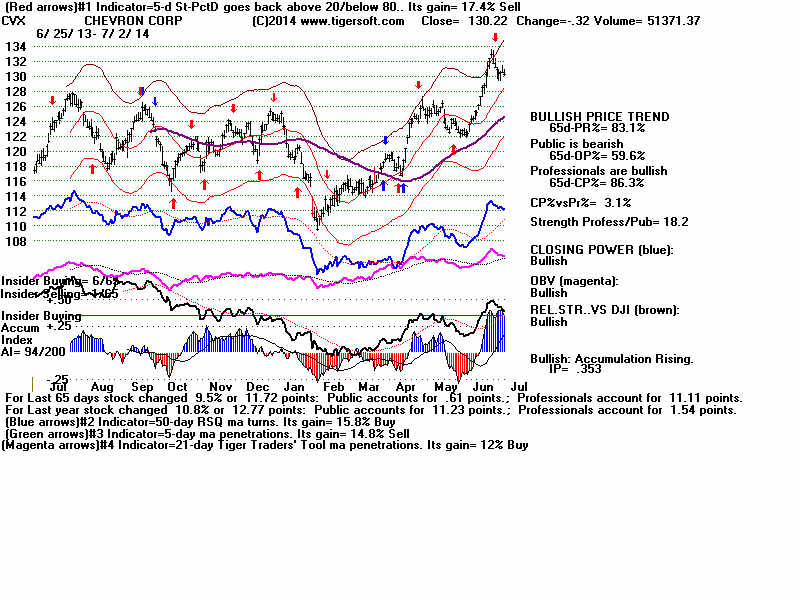
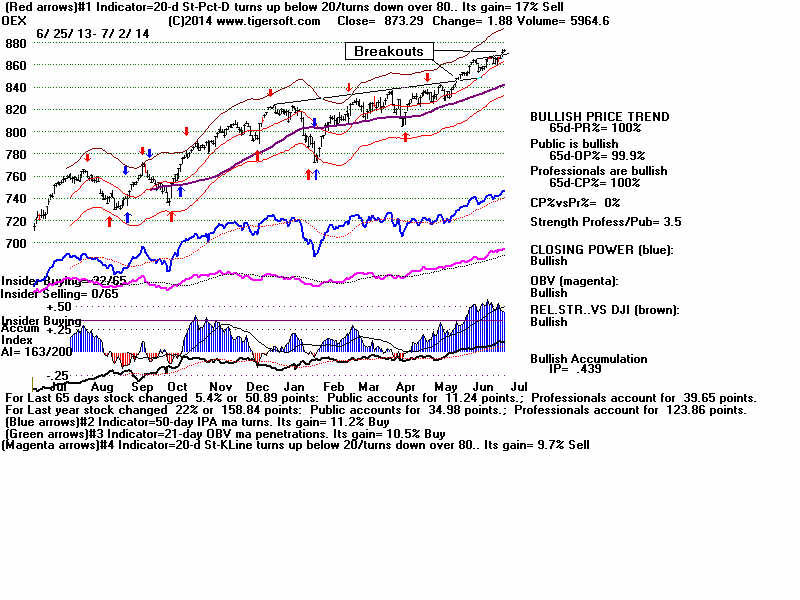
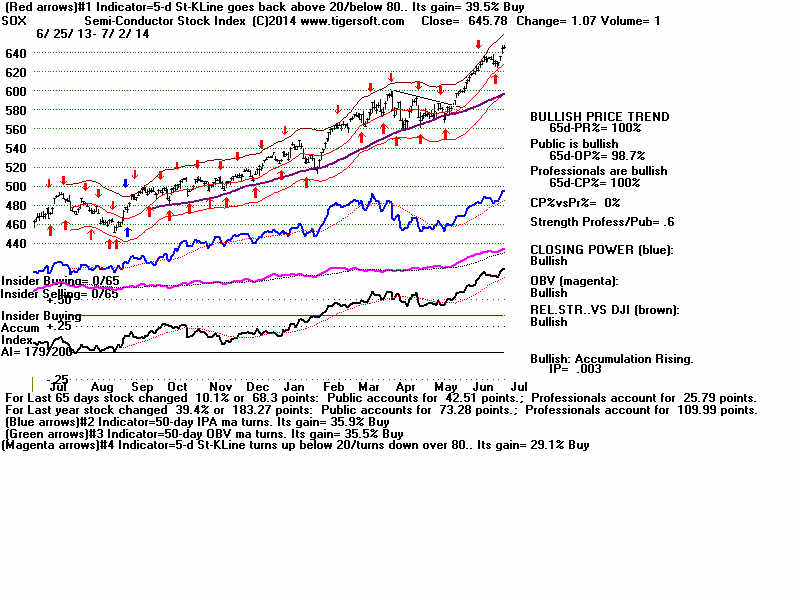
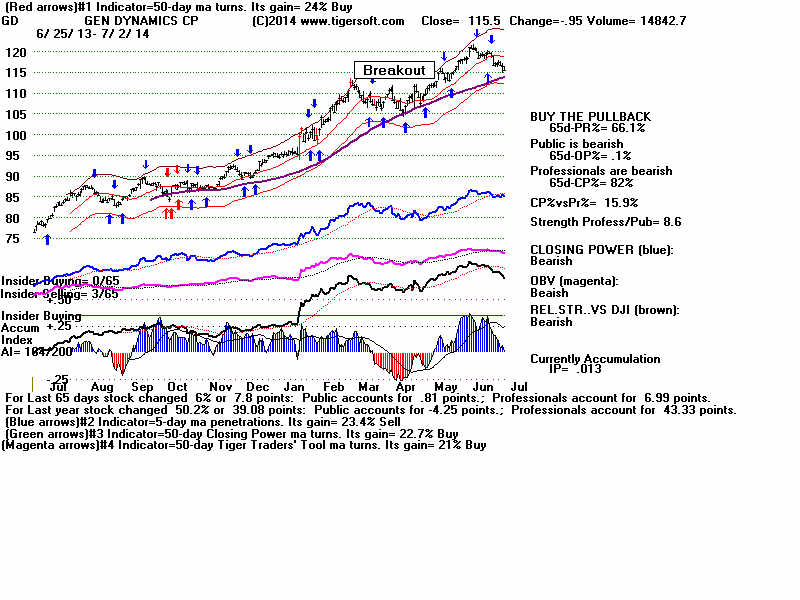
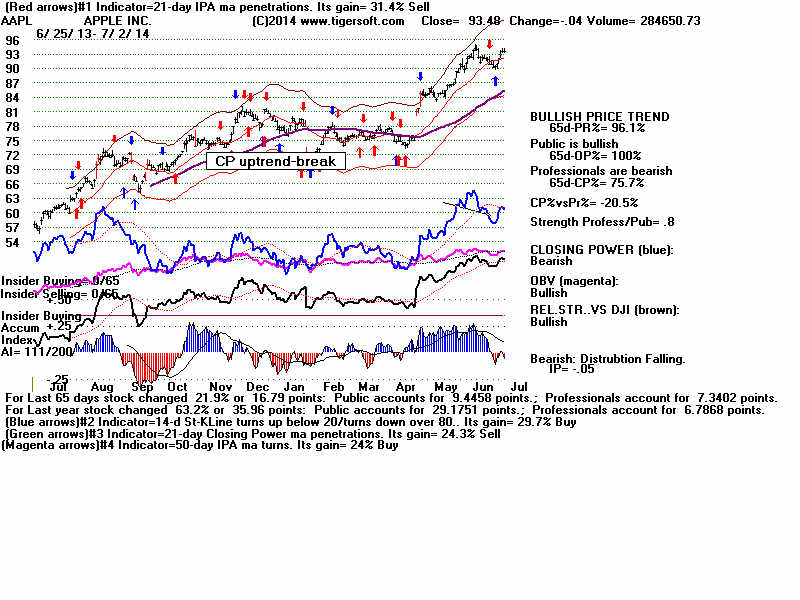
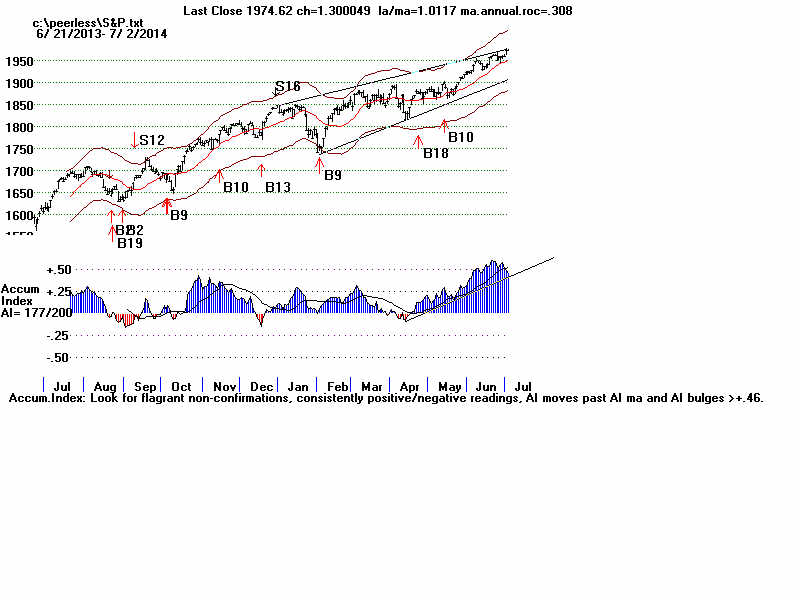
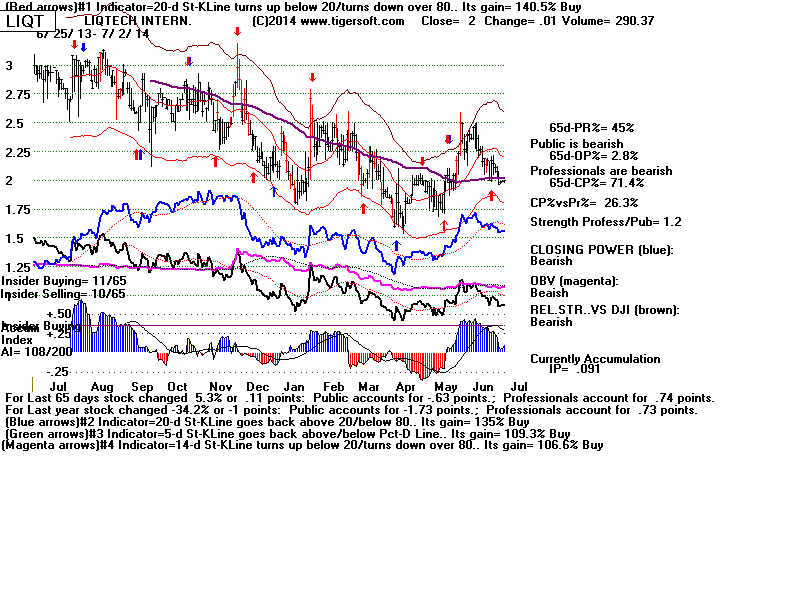
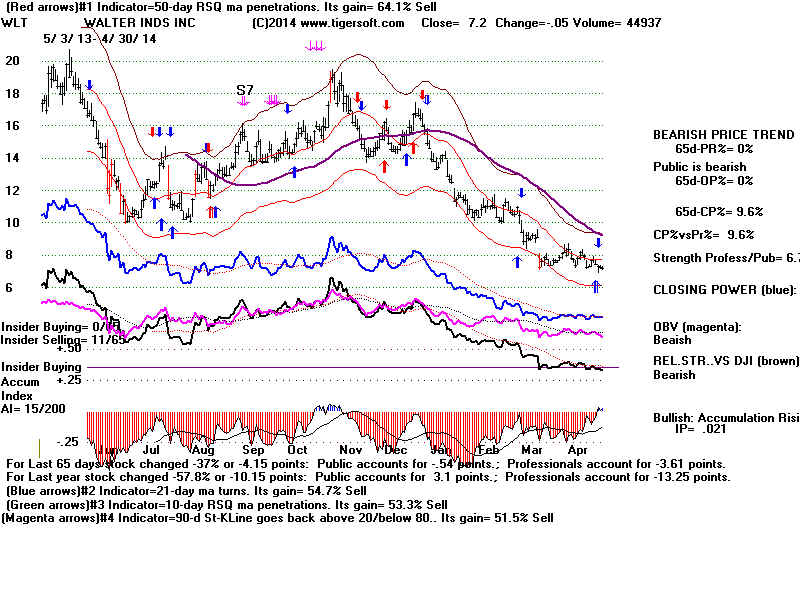
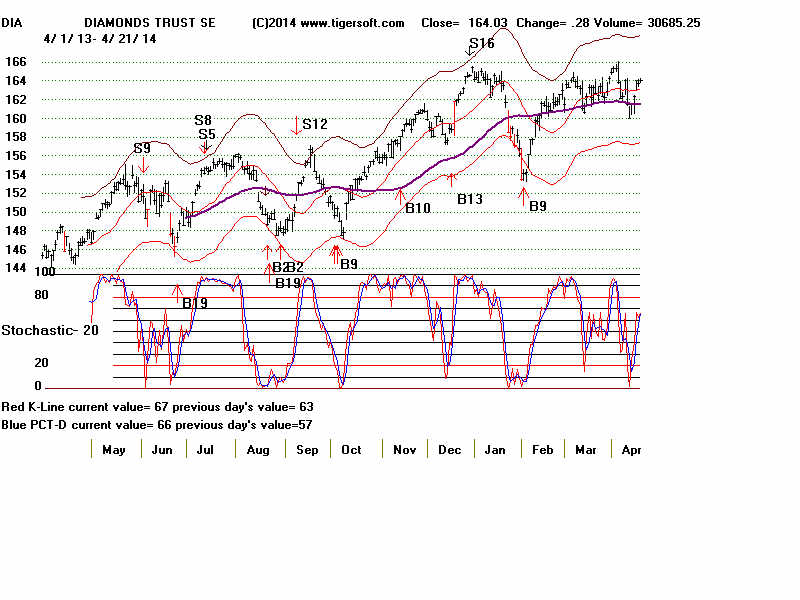
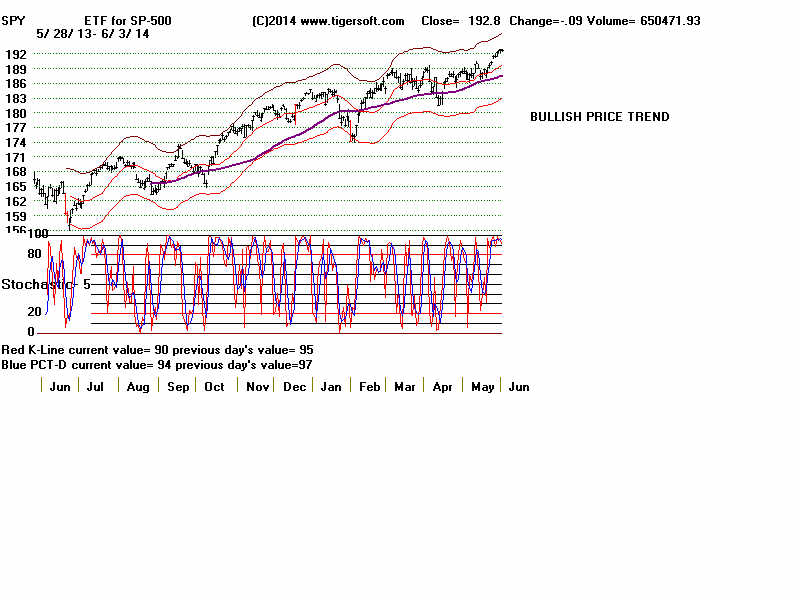
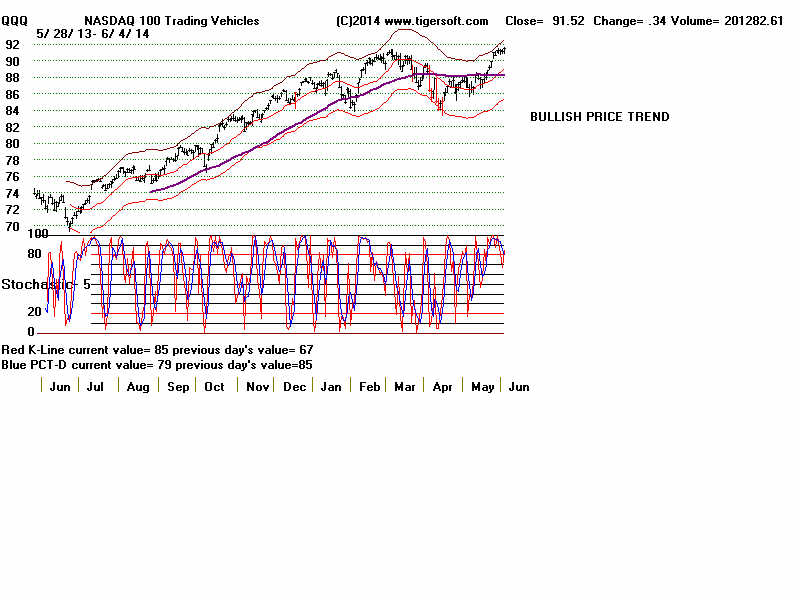
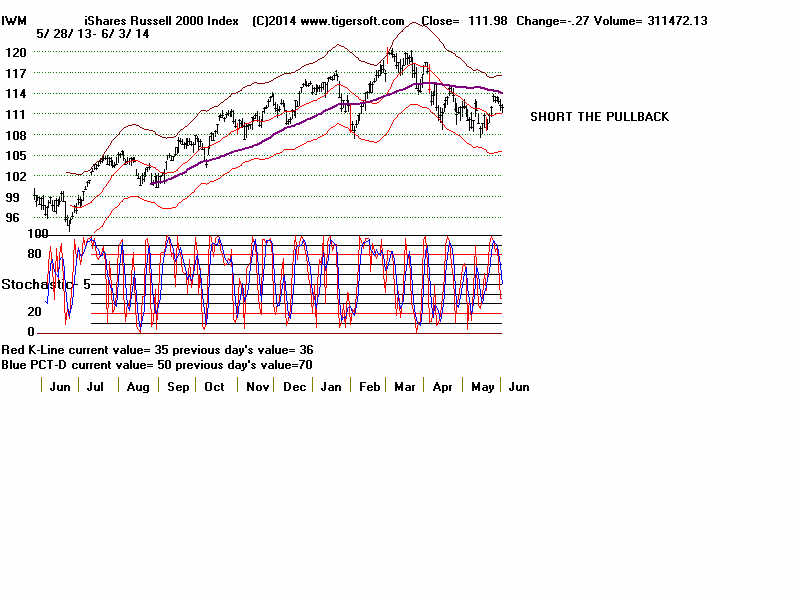
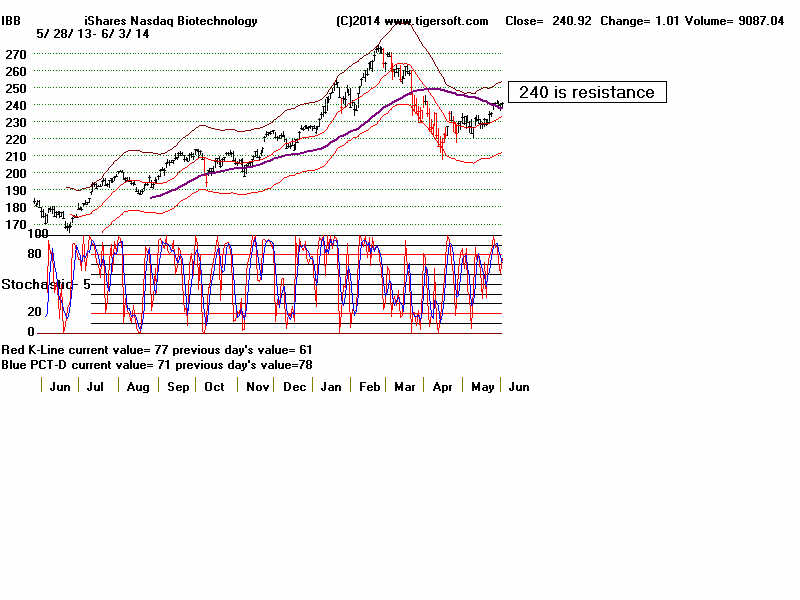
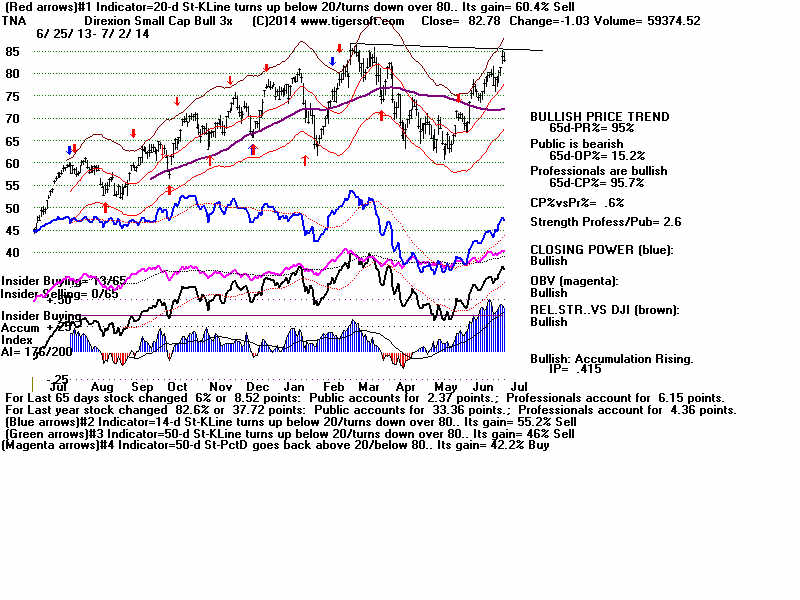
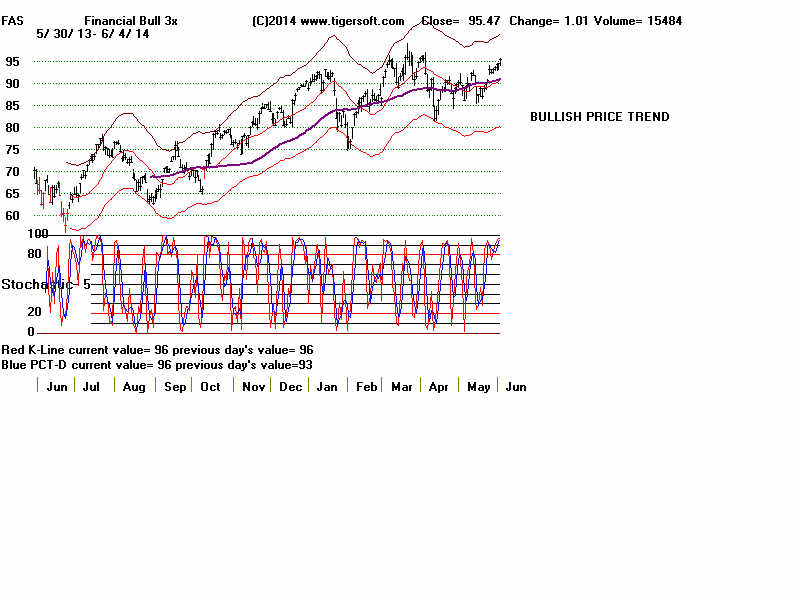
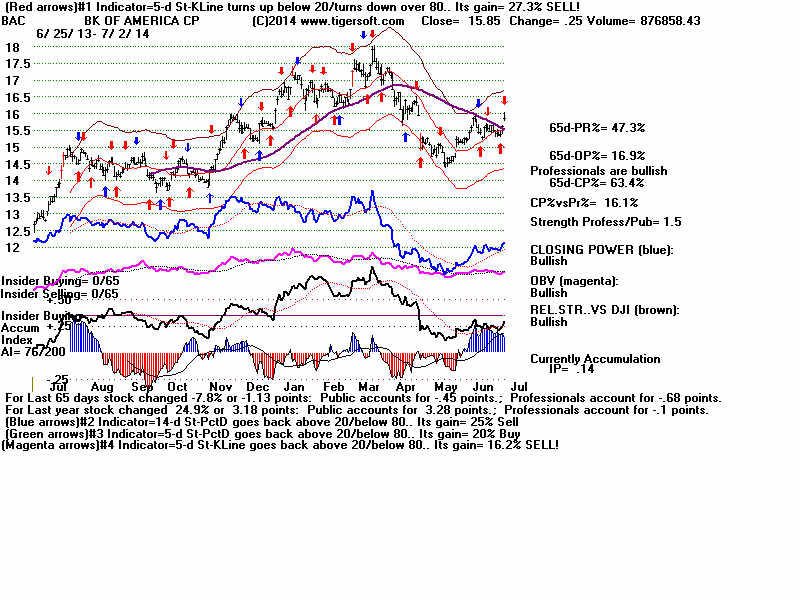
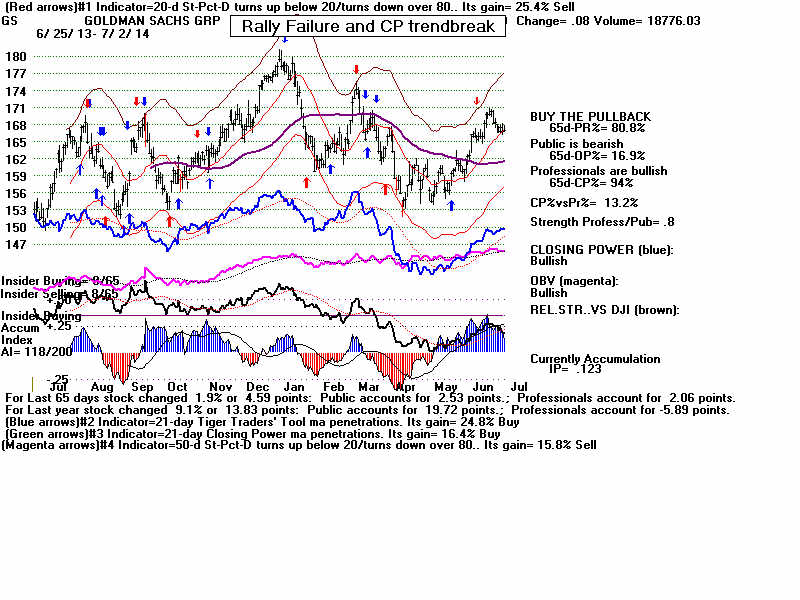
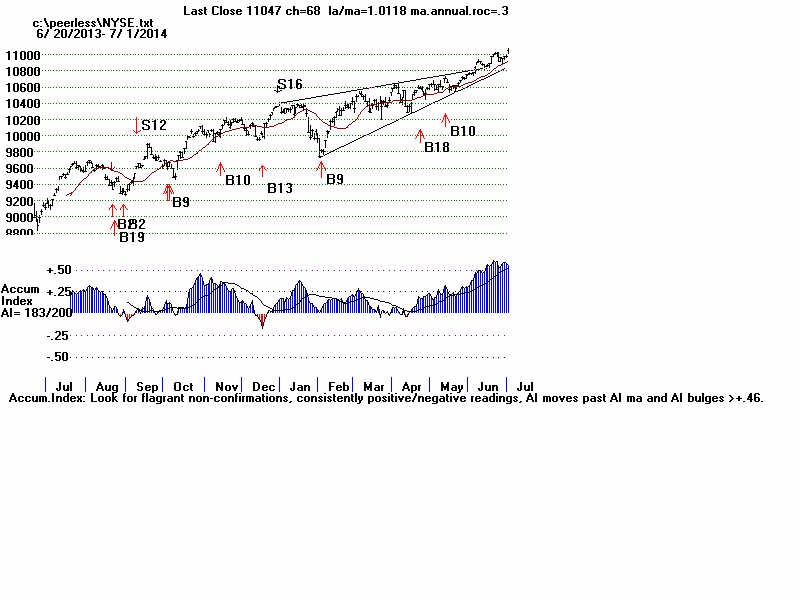
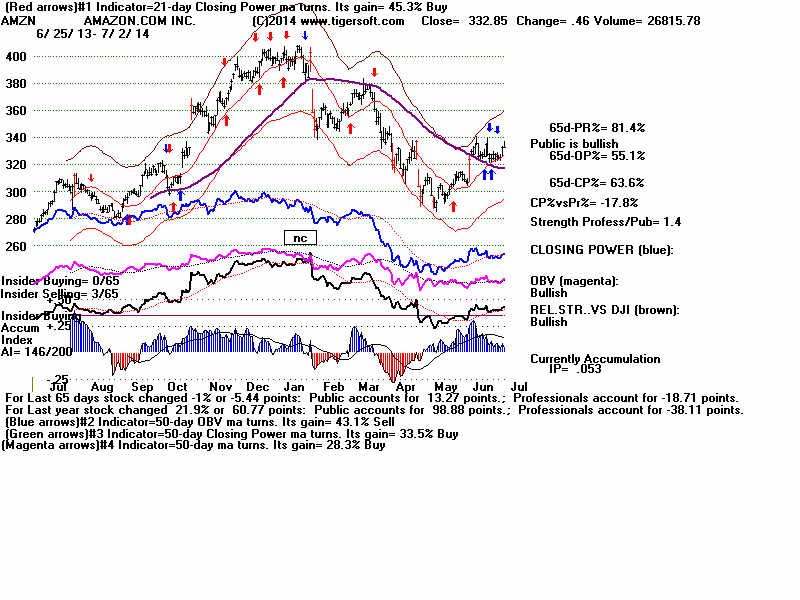
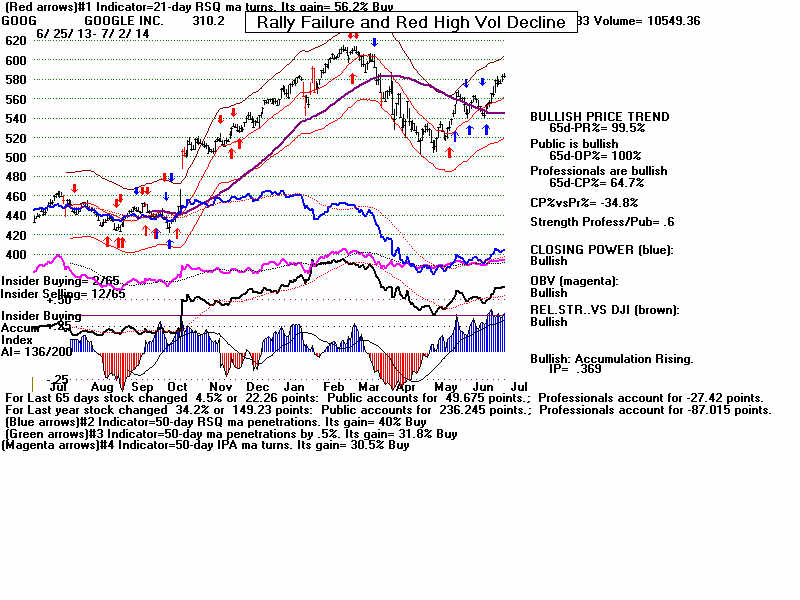
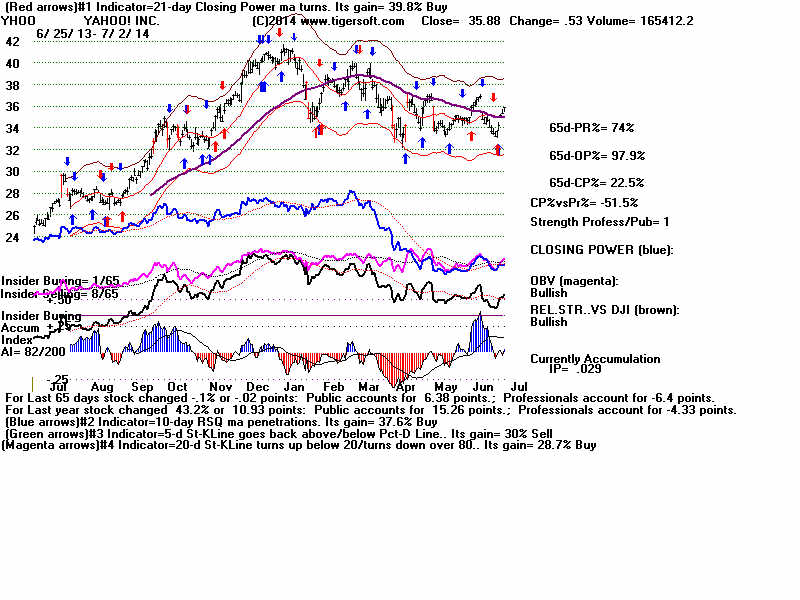
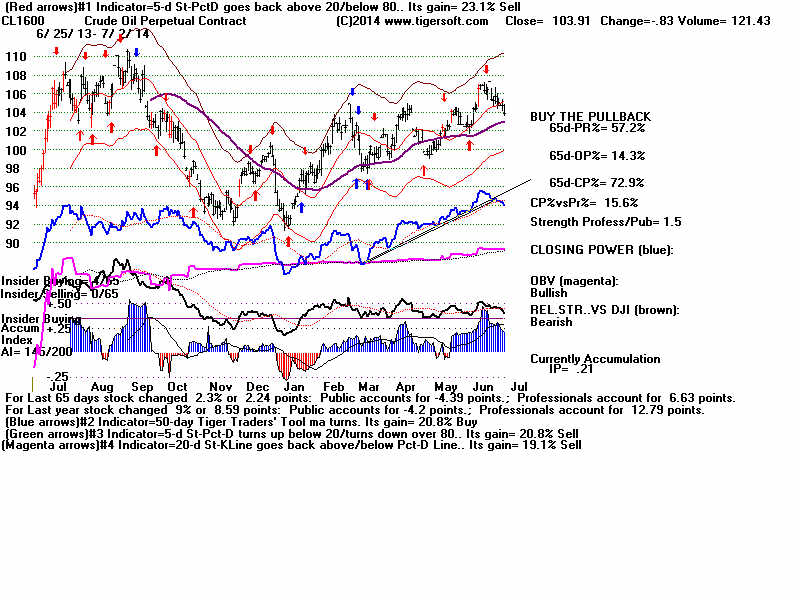
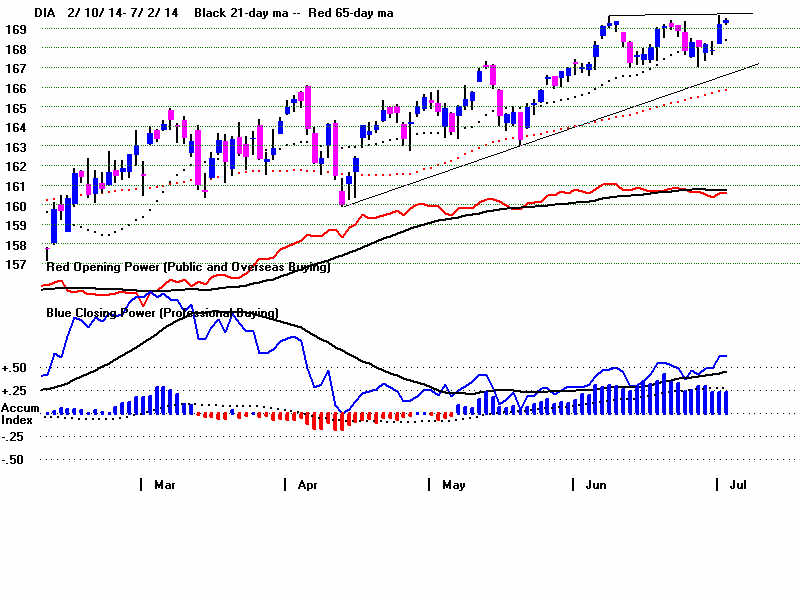
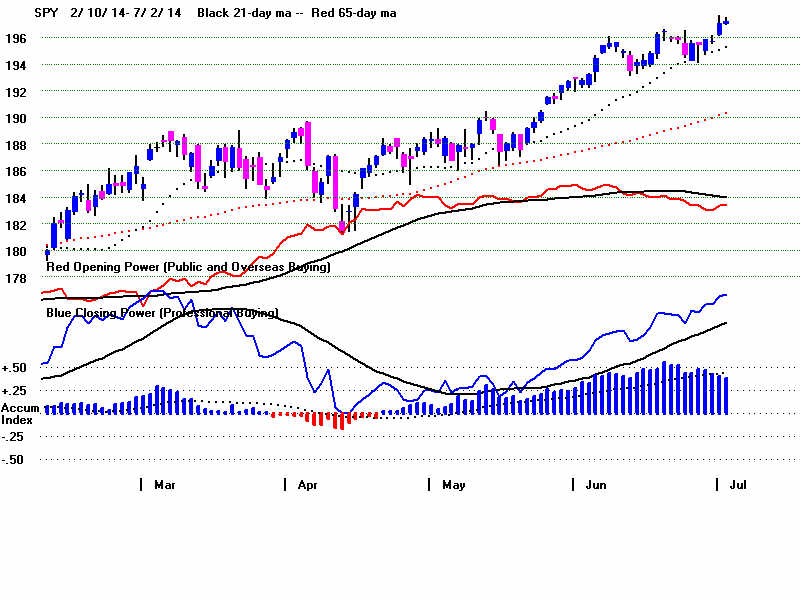
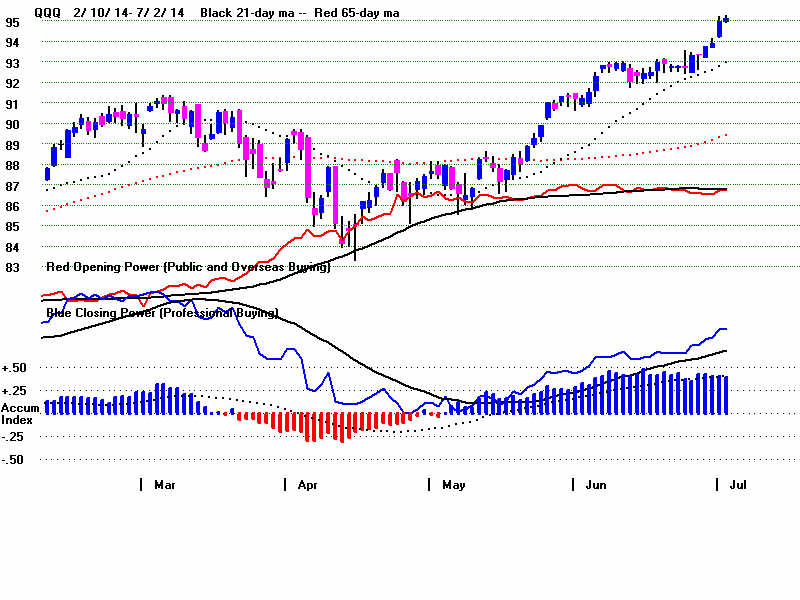
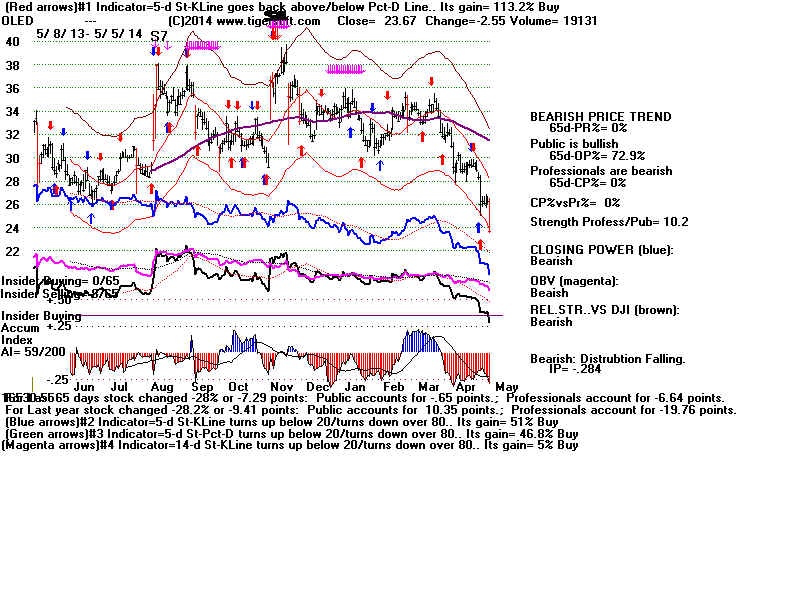
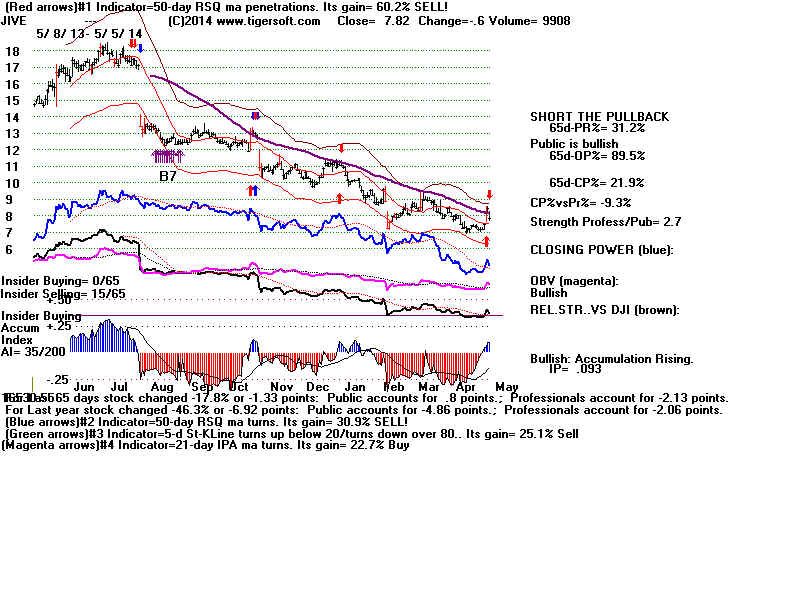
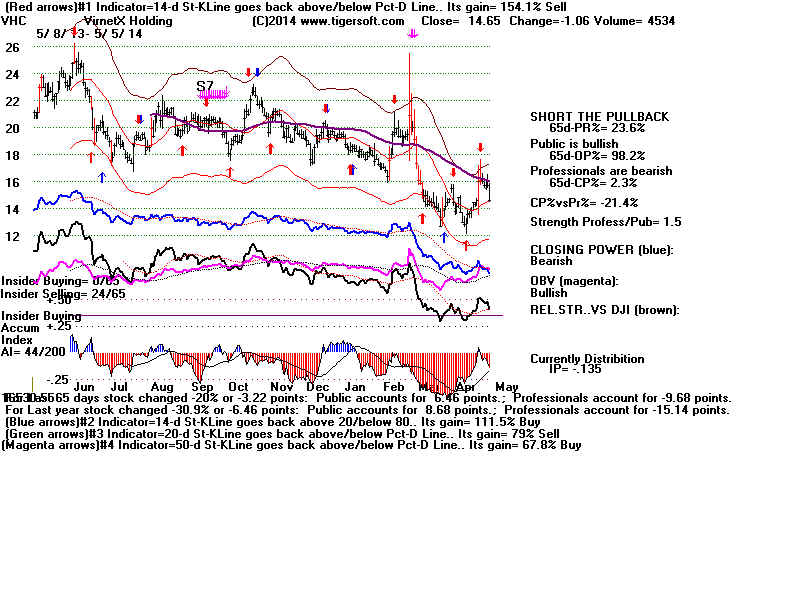
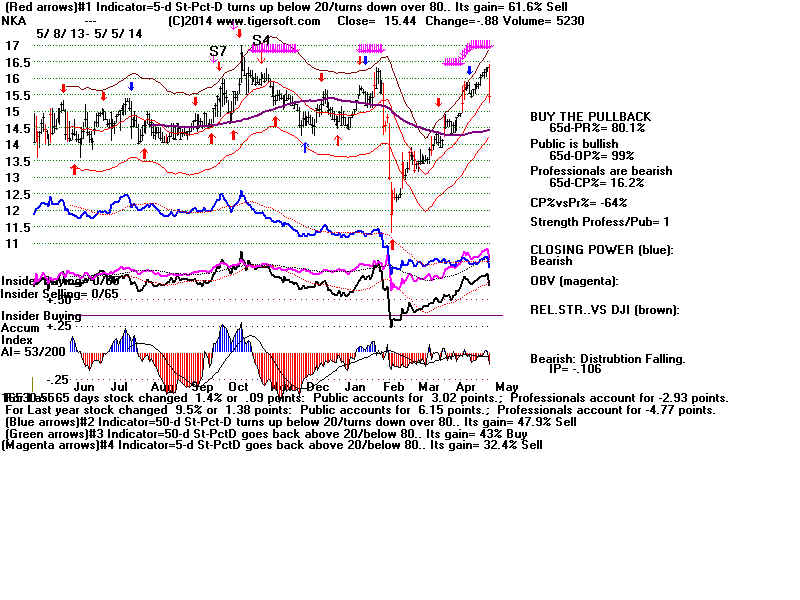
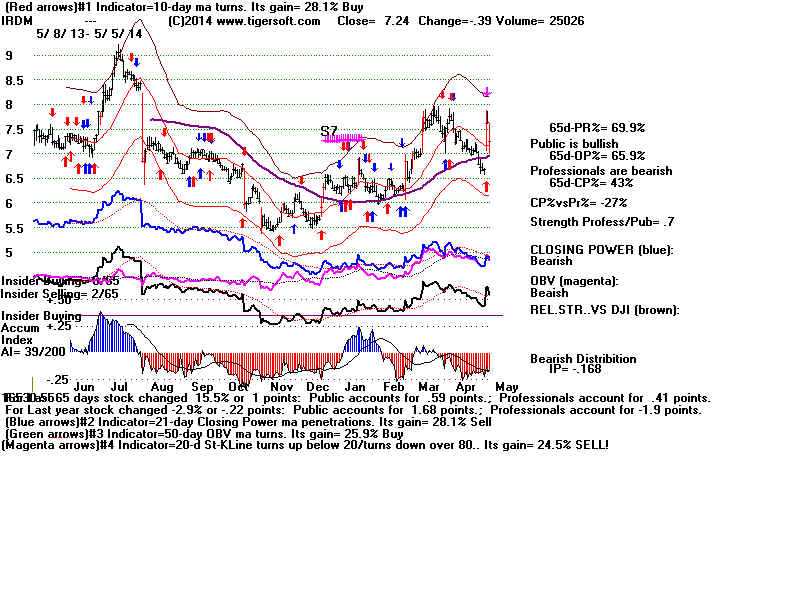
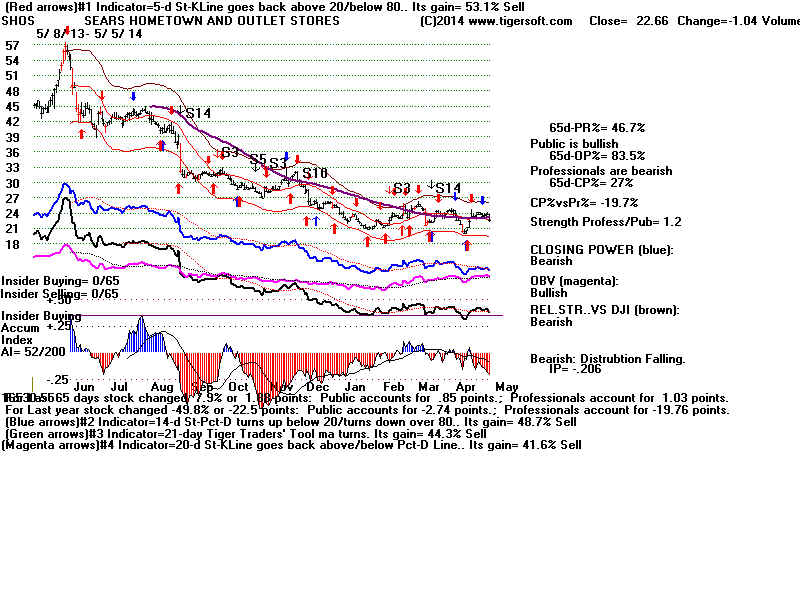
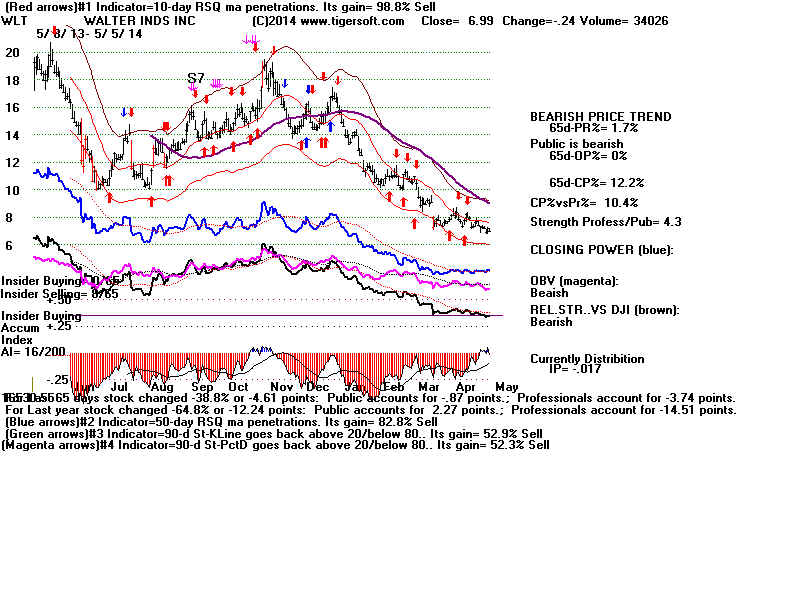
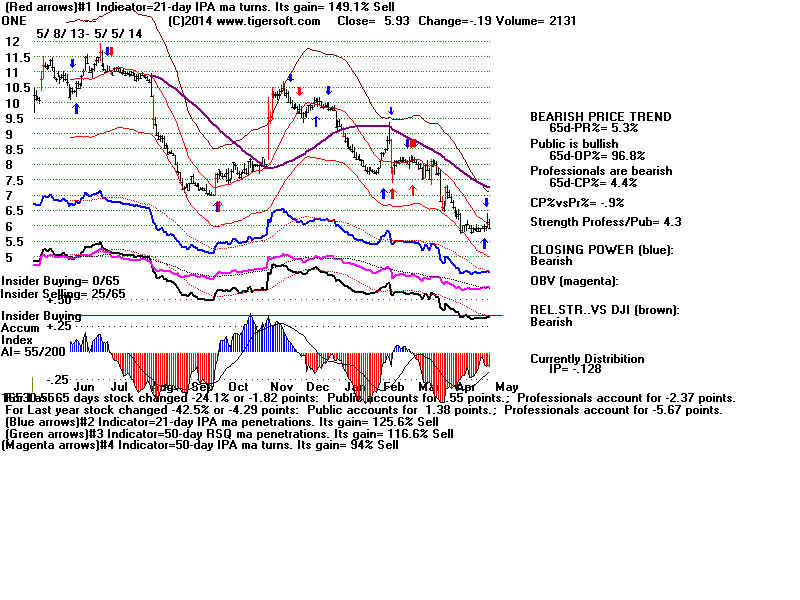
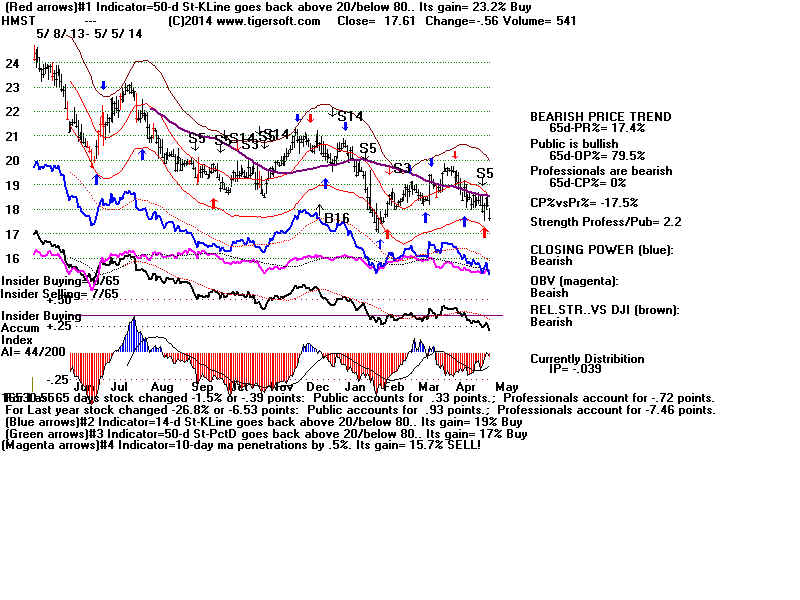
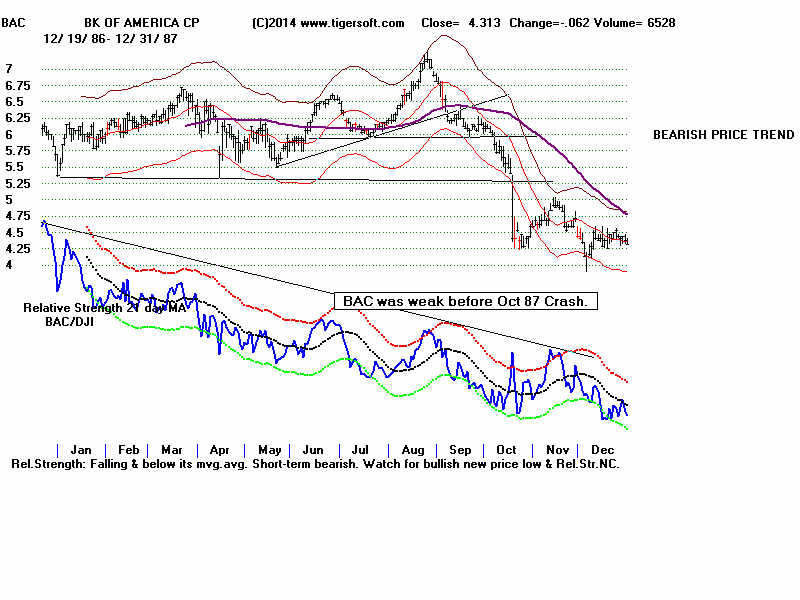
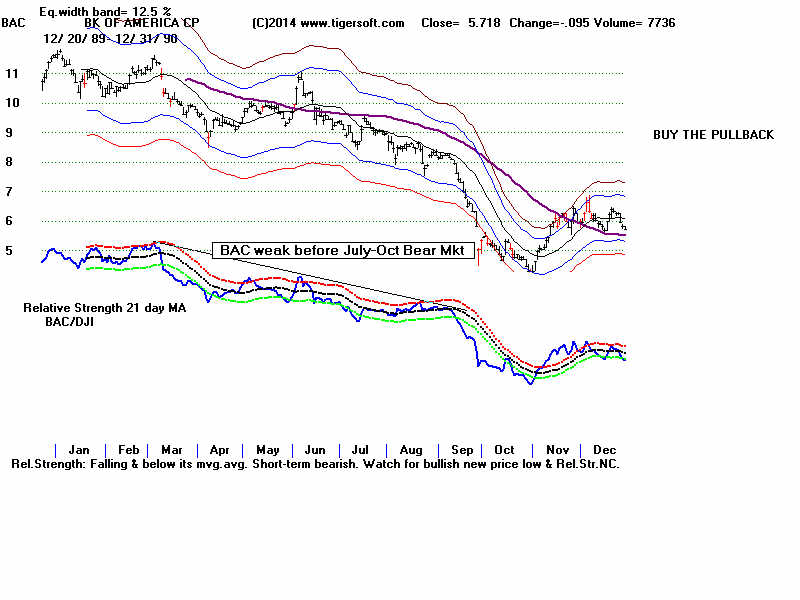
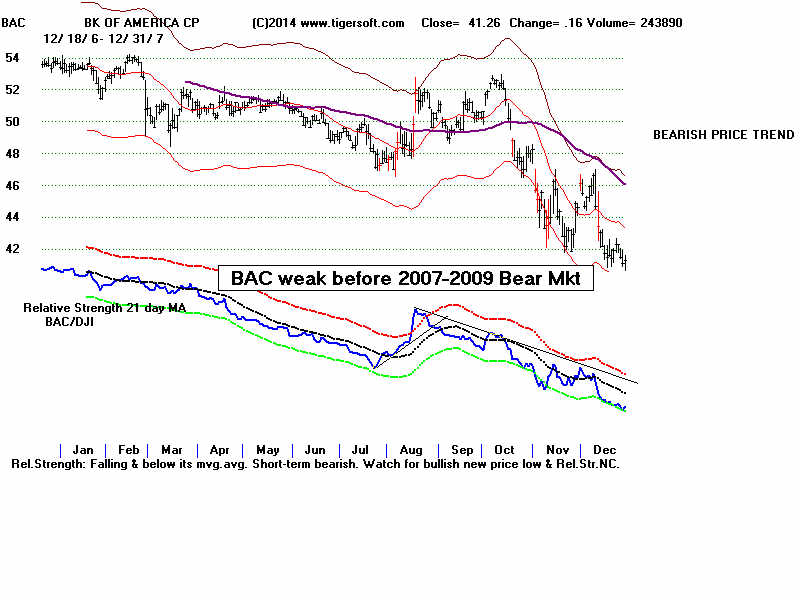
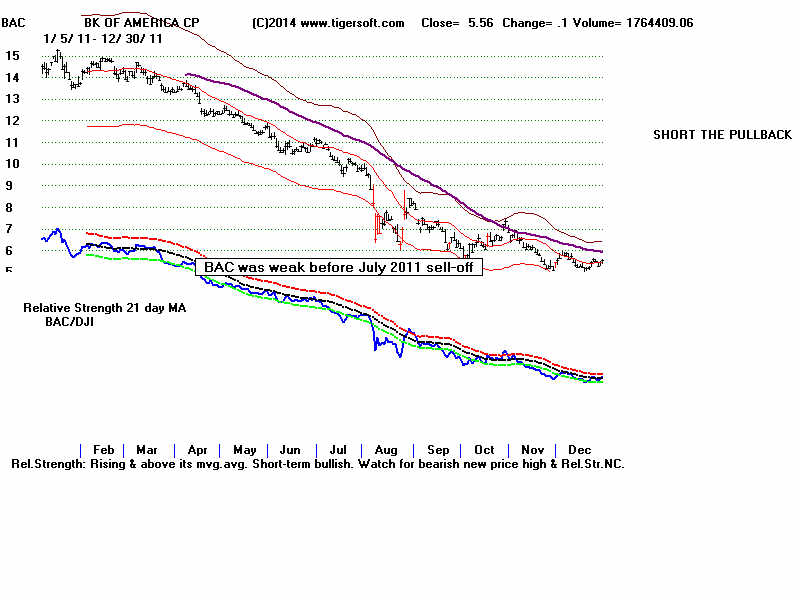
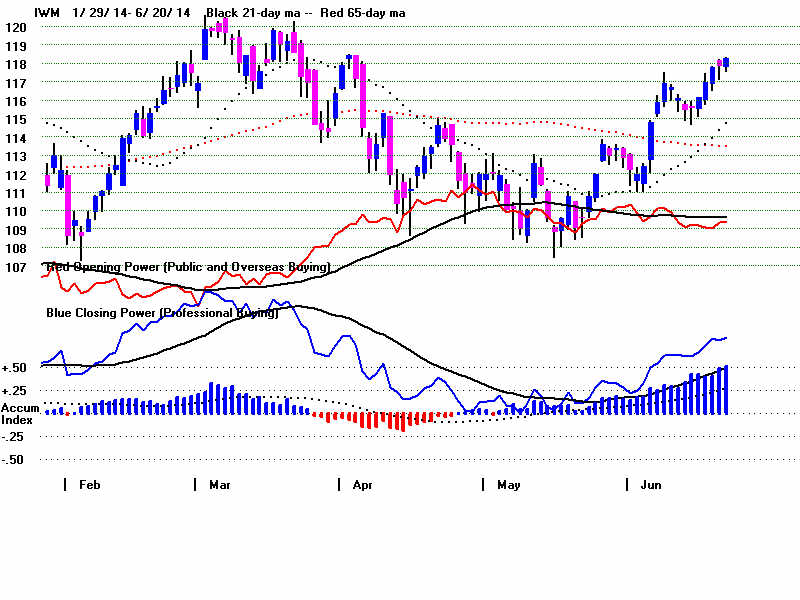
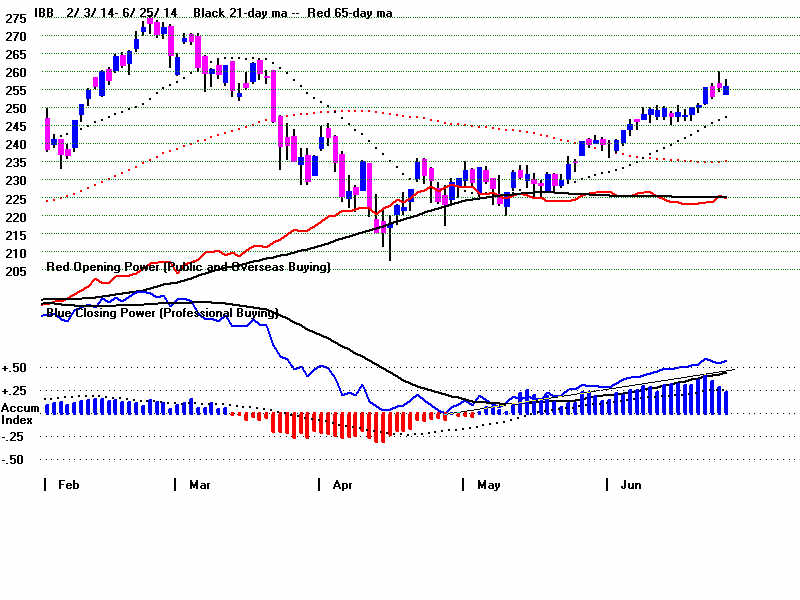
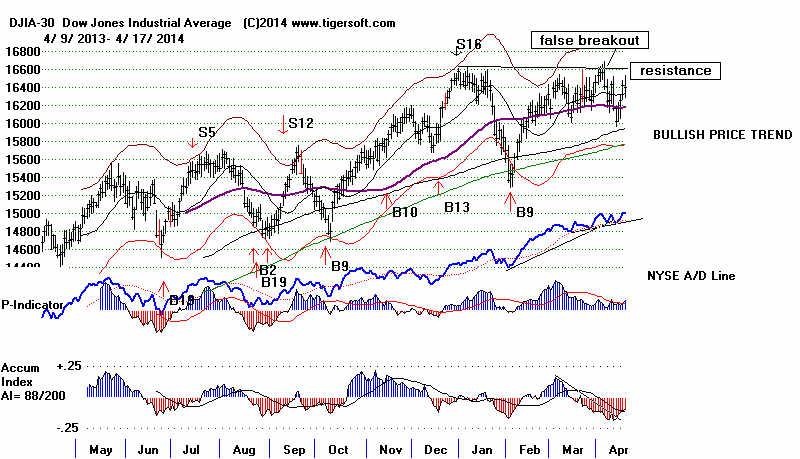
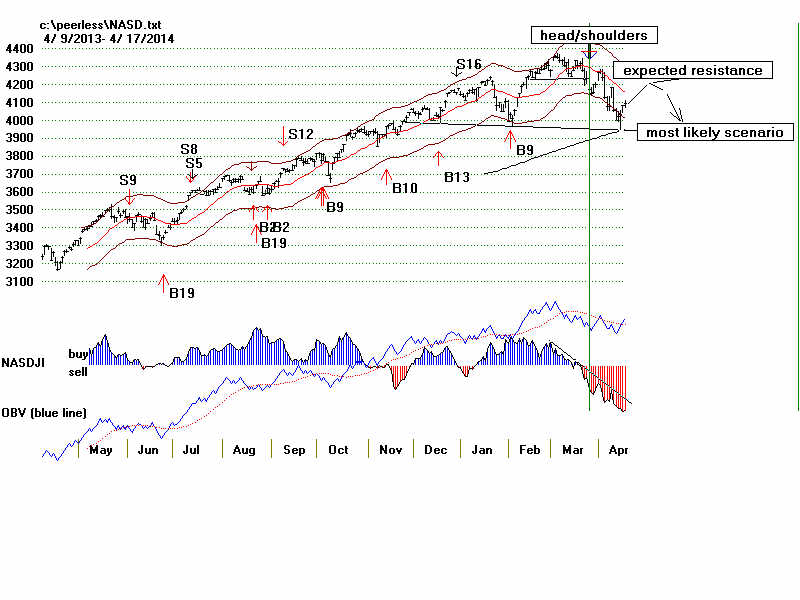
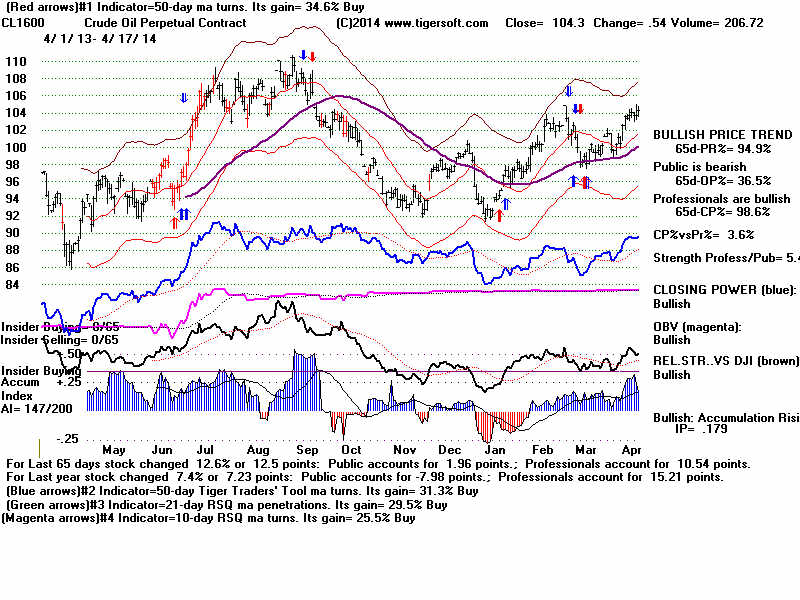
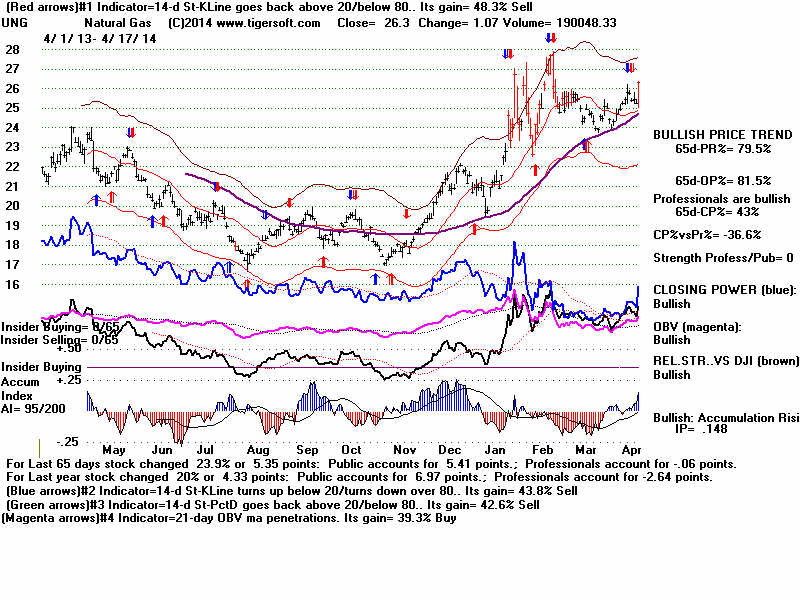
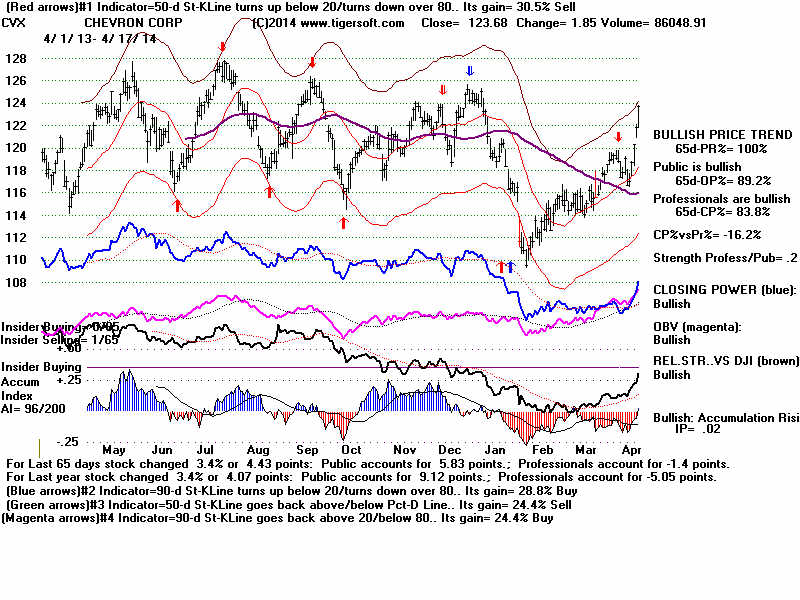
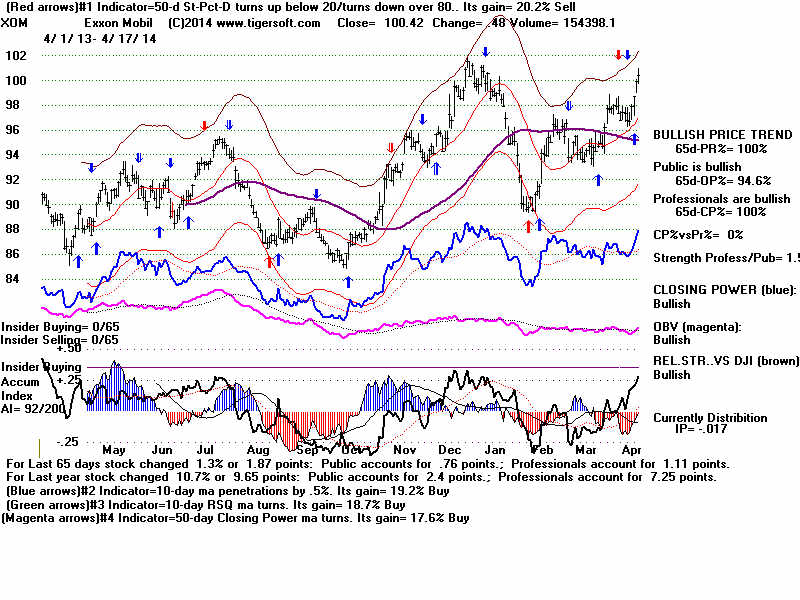
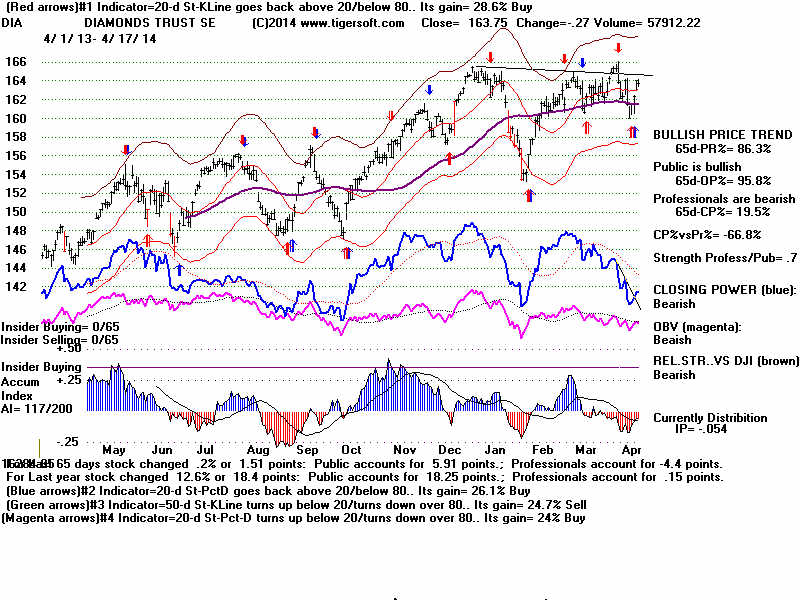
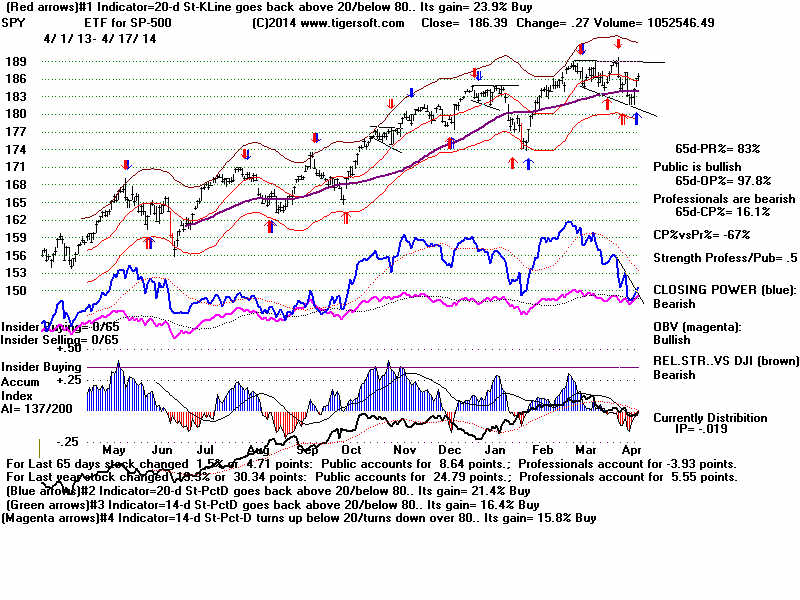
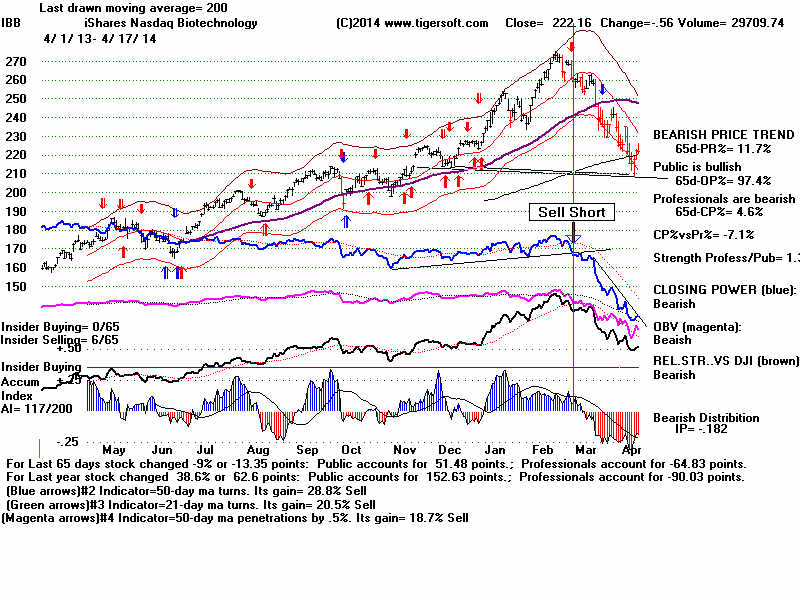
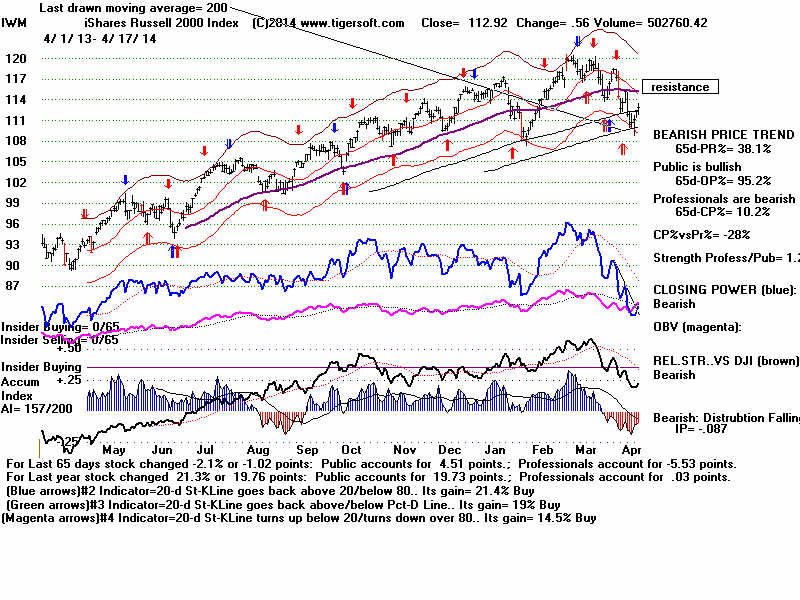
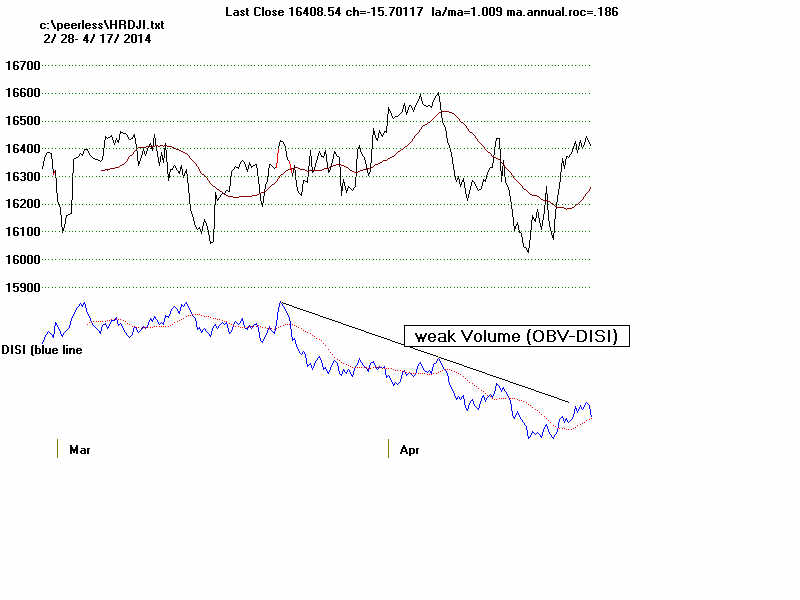
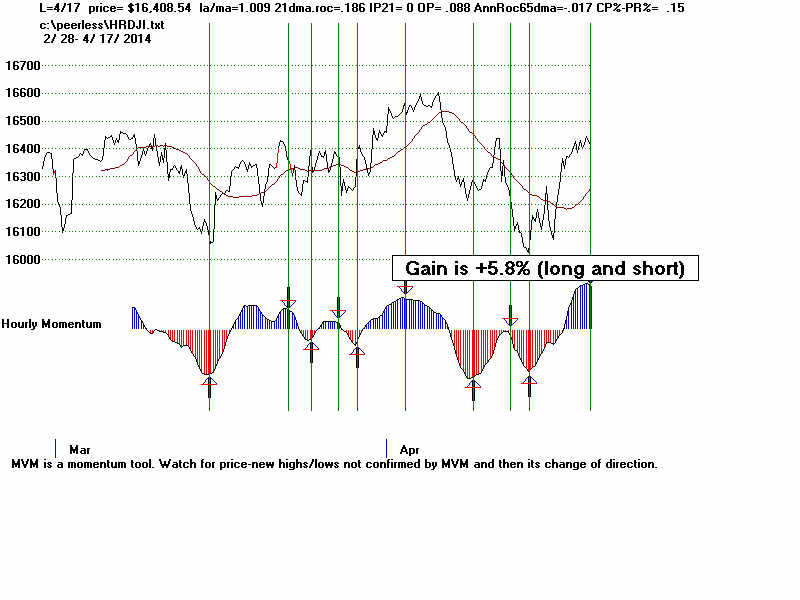
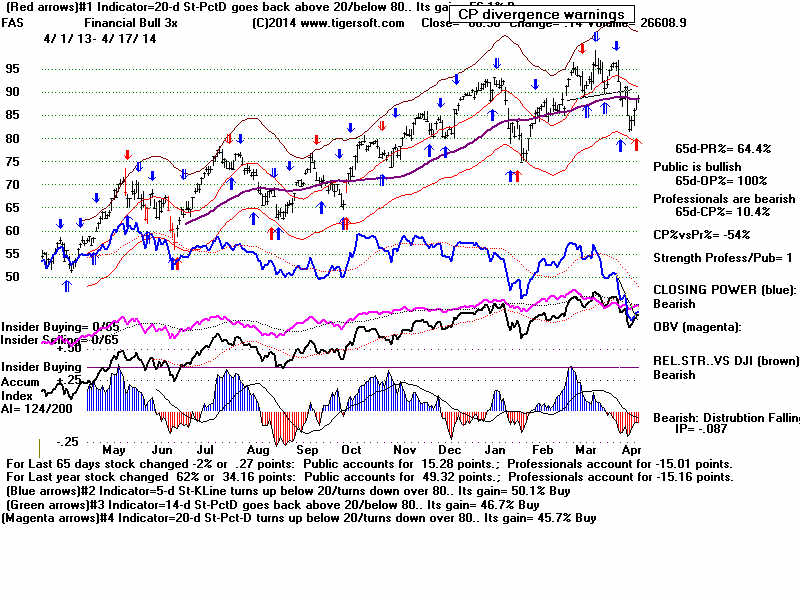
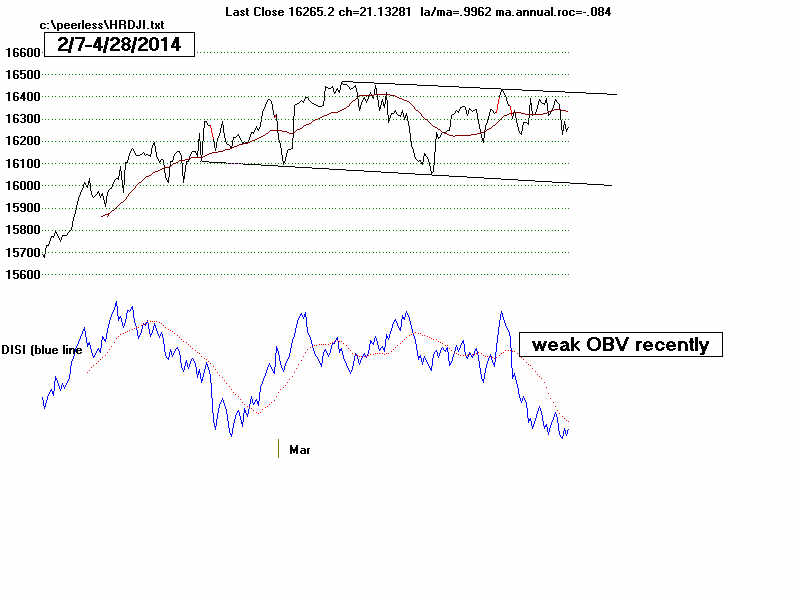