CP%-PR%<-.70
DIA
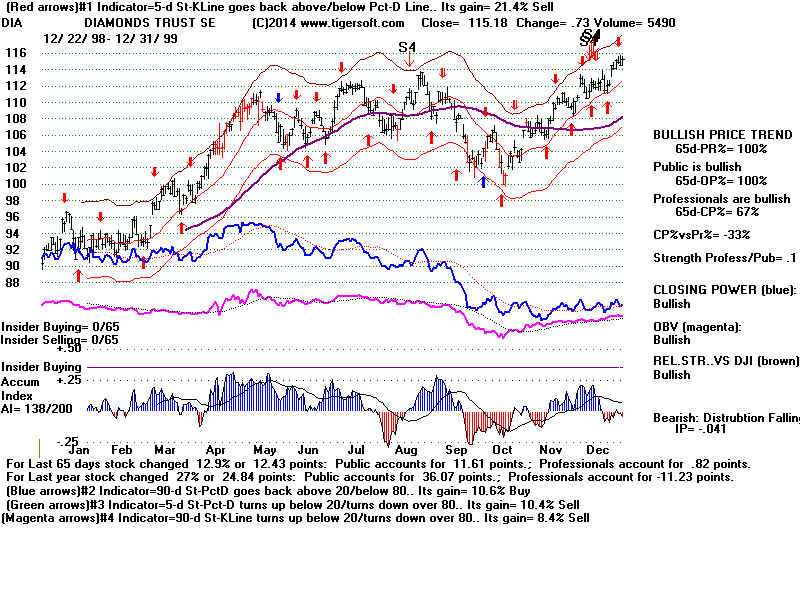
August 1999 - 2% rally and then 12% decline.
November 1999 - 5% rally and then 17% decline in January.
January 2000 - 15% decline.
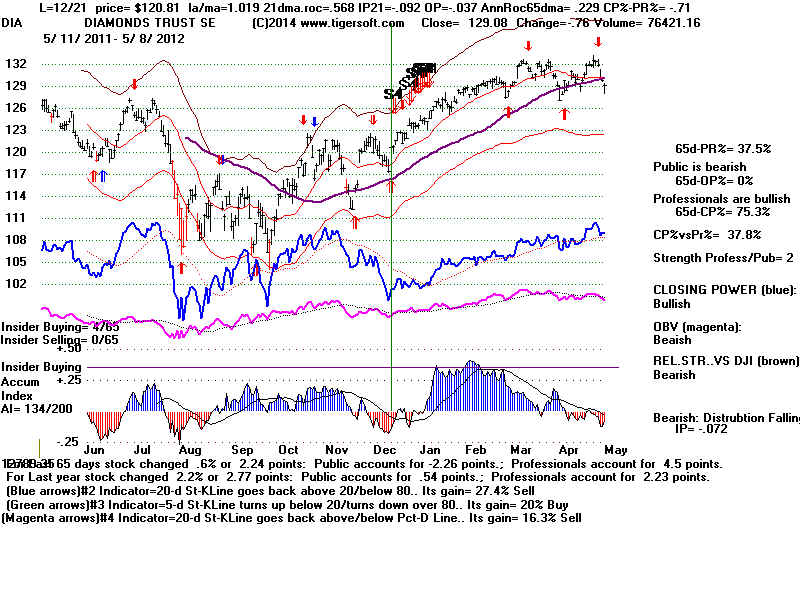
December 2012 - No decline. Strong rally followed.
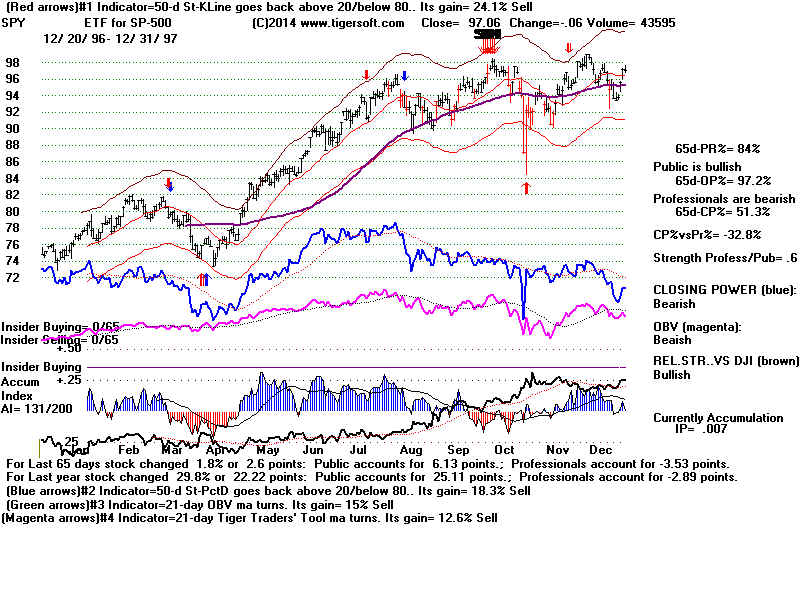
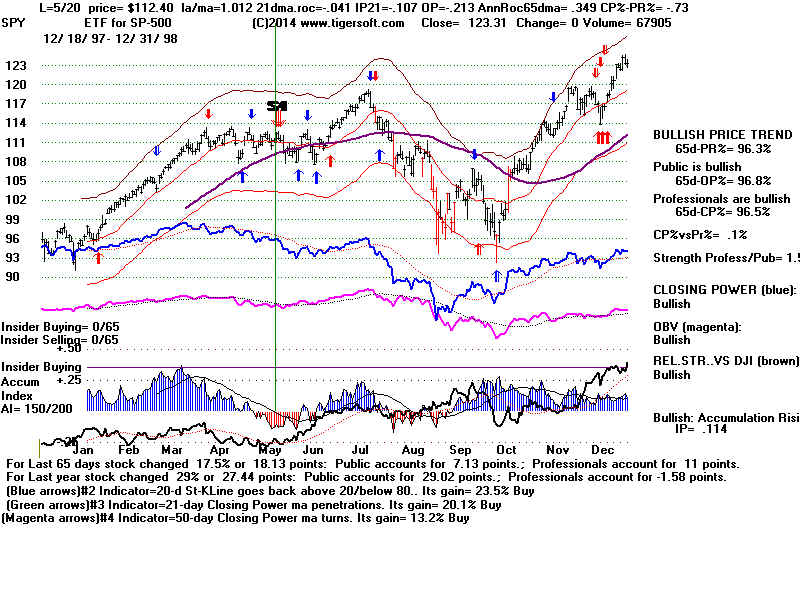
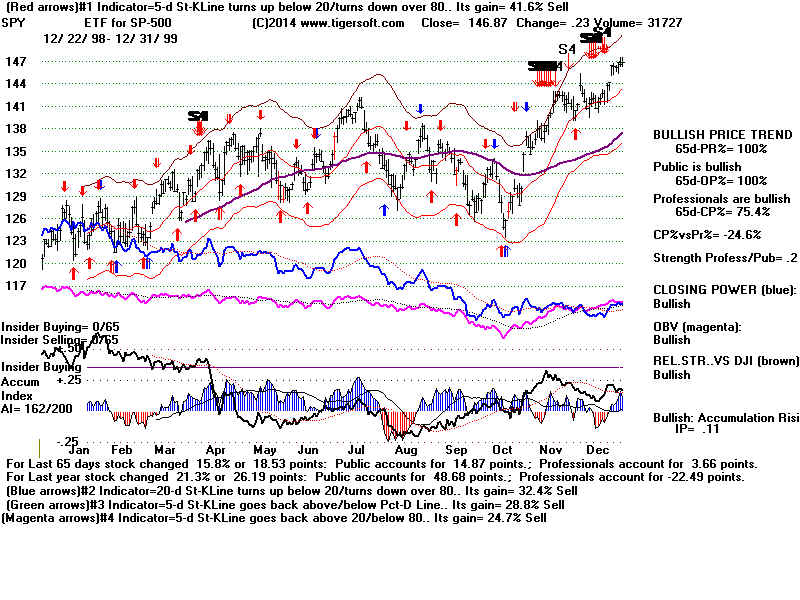
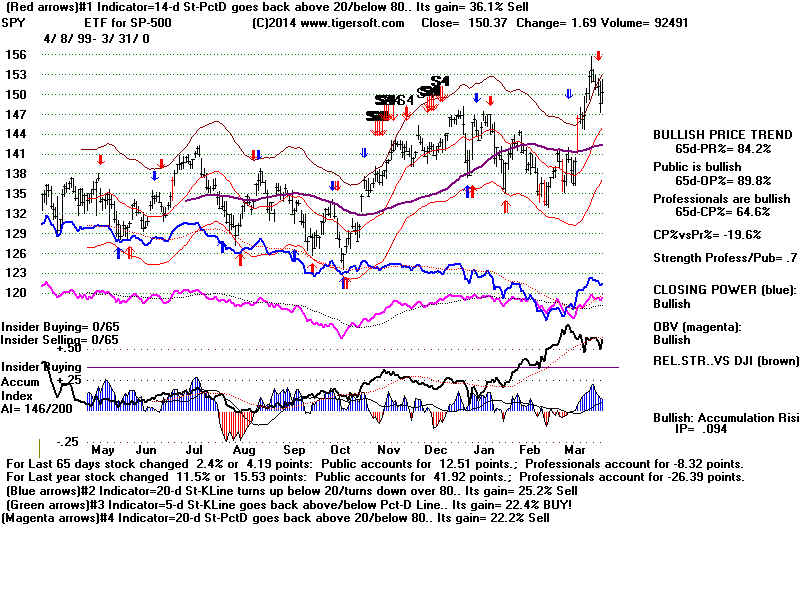
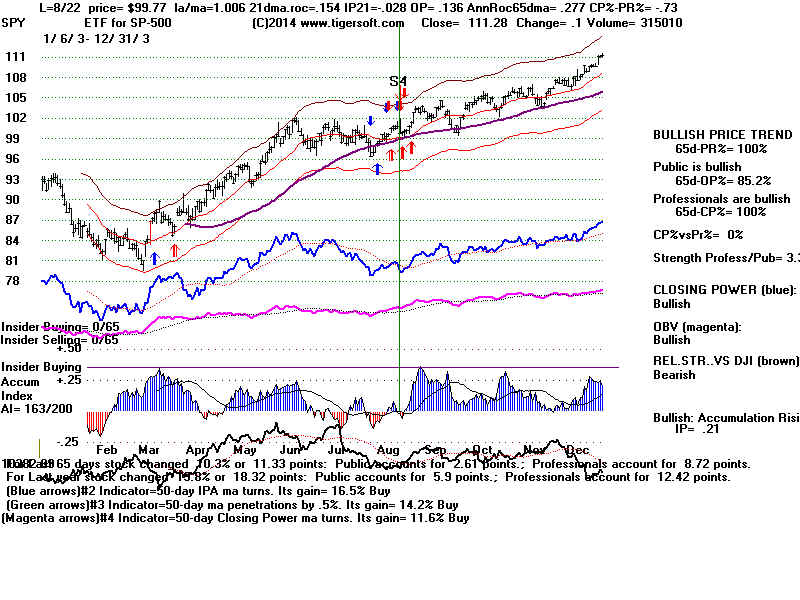
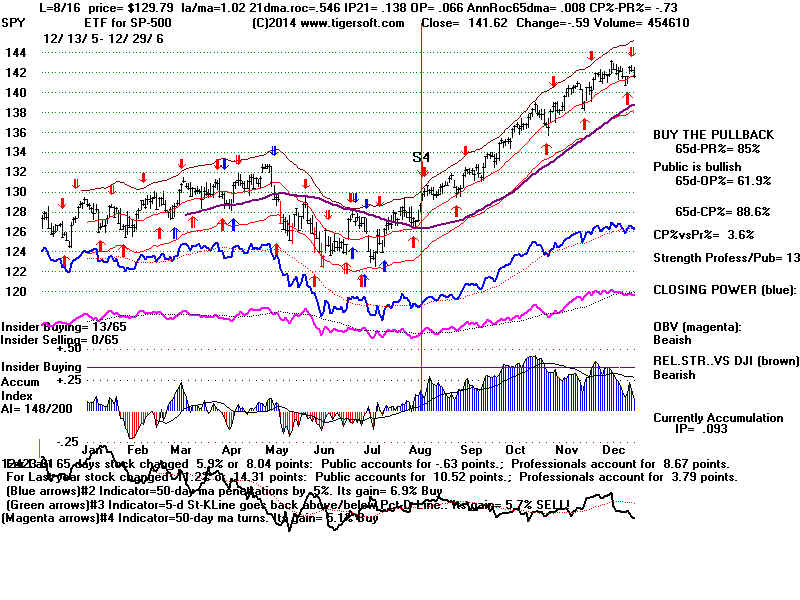
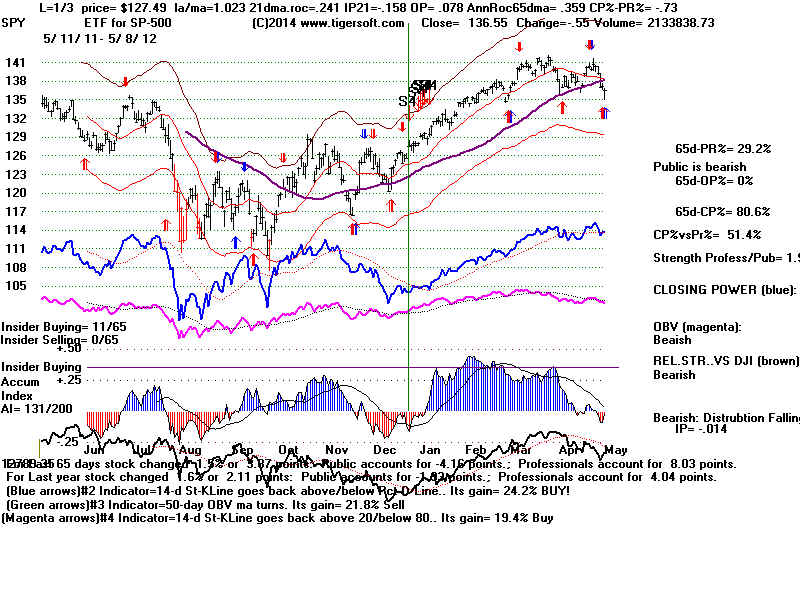
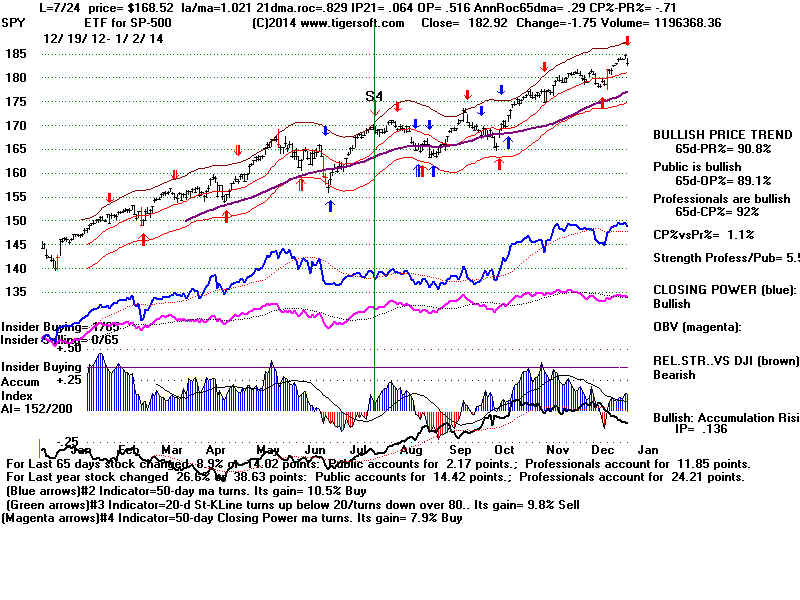
SPY
Sept 1997 - 10% sell off in two weeks
May 1998 - shallow decline, 8% rally and then 13% decline.
Oct-Dec 1999 - 5% rally and then 10% declinein the next year
August 2003 - No decline. 65-dma held. Rally followed.
August 2006 - No decline. Strong rally followed.
December 2012 - No decline. Strong rally followed.
July 2013 - 4% sell off and then strong rally.
Conclusion:
Don't use in Nov-Decmber (Santa Claus Rally) and August (Summer Rally).
Best to use when bull market has lasted a long time. (Not in 2003)
 |
 |
 |