
A Guide:
Getting the Most out of
The Tiger Nightly HOTLINE
====================================================
Here is what our Tiger
Hotline seeks to do and how we can help your investing and
trading be more profitable.
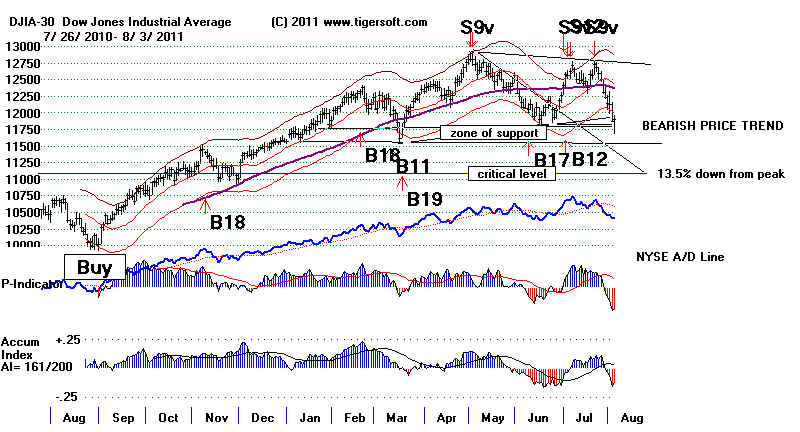
The Hotline's most important task is researching and predicitng
the general market and the
DJI-30, in particular. What happens to the DJI
usually happens to most other markets around
the world, though we still have to watch for divergences and
unusual strength and weakness.
You will regularly see historical studies of what the market has done
in the past when unusual
circumstances and technicals occur in the present that can be
back-tested. Looking for new
Peerless signals and refining existing signals is a key part of the
Hotline's research.
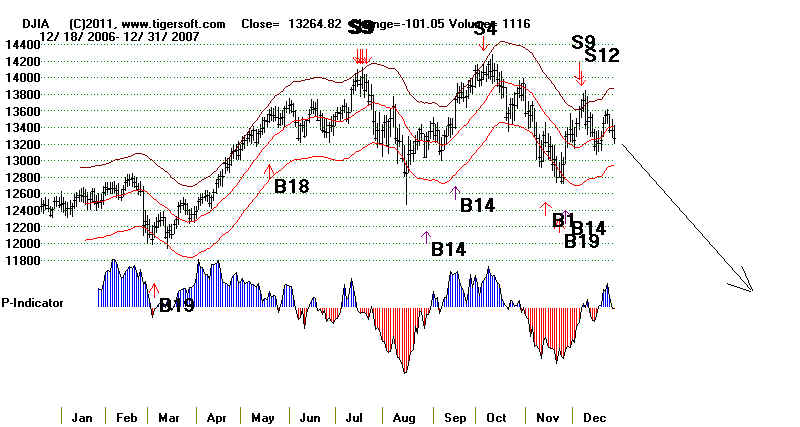
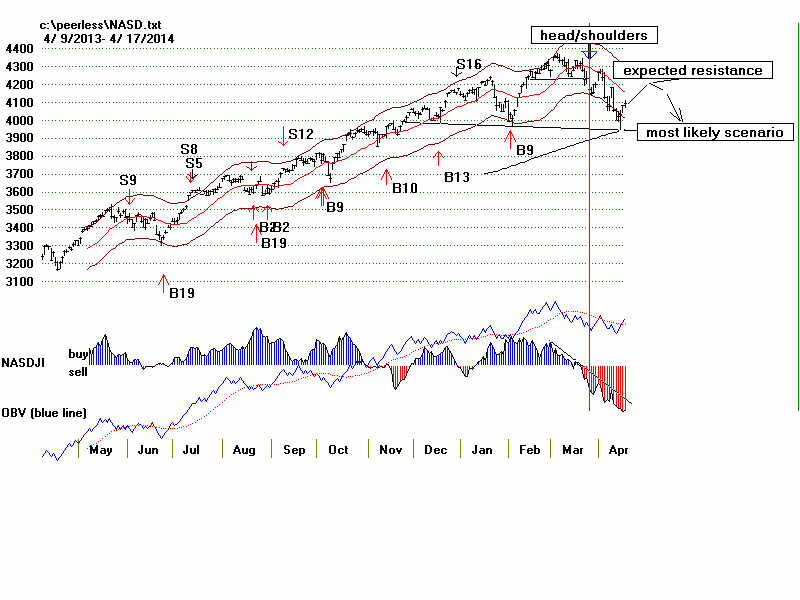
Example: the Sell S9Vs of the Summer of 2010 were researched and first
reported here in
plenty of time for our subscribers to make excellent profits selling
out and selling short.
See the Peerless DJI chart below:
TigerSoft's Hotline helps your investing in a number of ways.
1.) Just below the heading, above the Daily
Hotline are
Background
Studies. These show older charts
of many of
the trading vehicles our investors use most, such as the SPY, SPY
Candlestick charts,
QQQ, Euro and NASDAQ.
The basis for Rules for
trading Closing Power and
the role of the Accumulation Index and
head and shoulders patterns are discussed there.
2.) Usually the headline mentions the current signal.
If not,
the Current DJI chart shows the operative Peerless signal,
a Buy or a Sell. Contradictory signals the same day cancel
each other out. The links to it always appears as
follows:
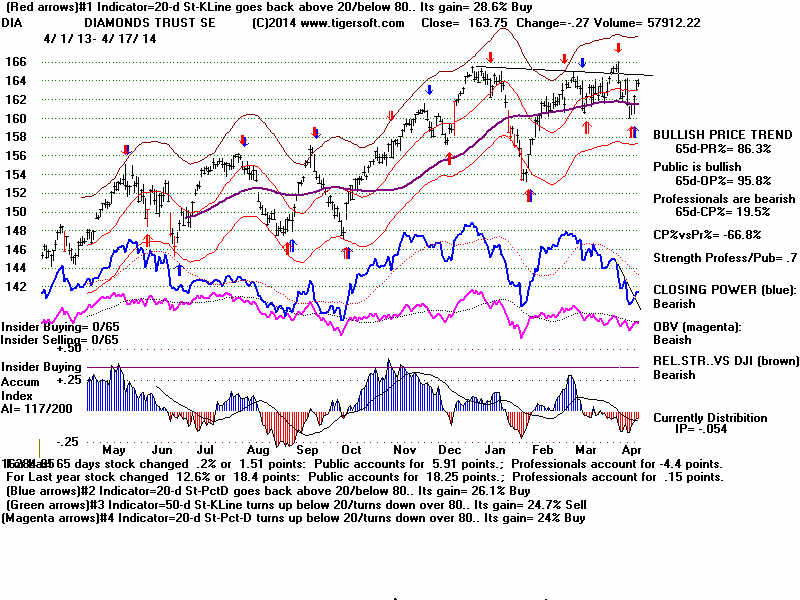
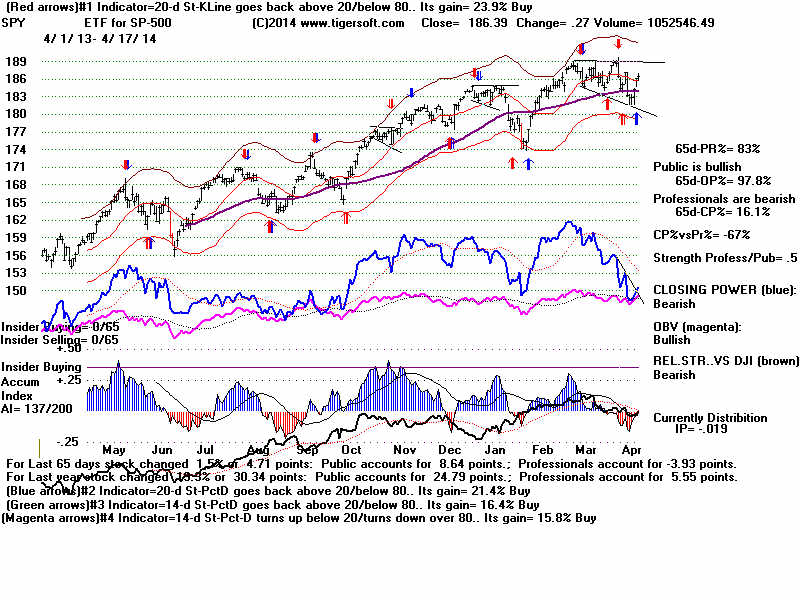
--> To Key Index and Leading Stock
Charts: DJI, SP-500, etc.
DJI Chart
SPY Chart
NASDAQ
Chart IBB
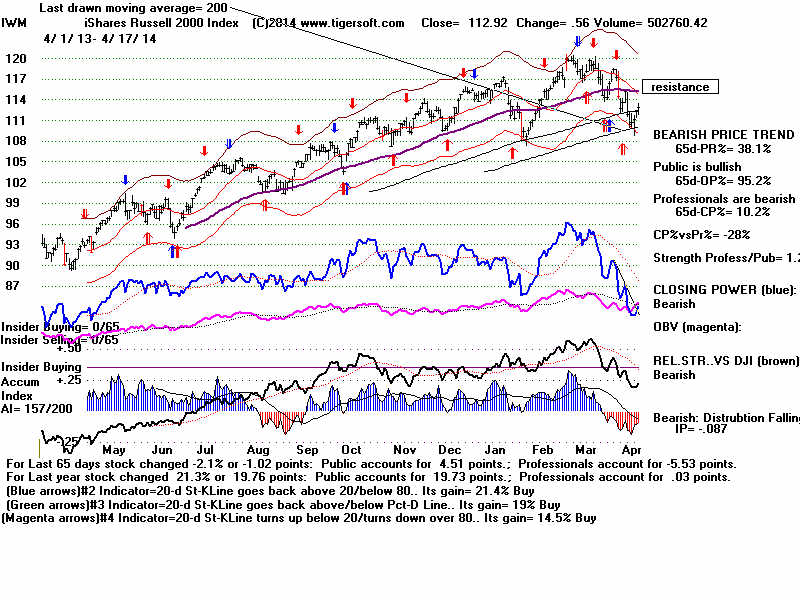
Chart IWM Chart
3) The next section gives some key technical
statistics on the DJI.
Example:
7/12/11 DJI = 12446.88 la/ma= 1.016 21-dmaROC= .482 P = 343 (+65) IP21=-.071 V=- 23 OP=
.193
------------------------------------------------------------------------------------------------------
Interpretation:
"la/ma=" 1.016 means 1.6% over
the 21-day ma. 1.035 is overbought. .965 is oversold
"21-dmaROC=" .482 means the
21-day ma is rising at an annualized rate of +48.2%. Above +.60
is usually bullish.
Below -.60 is usually bearish. It over takes a 21-dmaROC under +.07 to bring
a break of the 21-dma.
"P =" 21-dma of
NYSE Daily Advances-Declines" This is a key indicator for Peerless automatic
Buys and Sells.
Negative readings with the DJI approaching the upper band are bearish. Positive
with the DJI reaching
oversold are bullish.
"(P daily change)=" Example (+ 100) = P Indicator rose for the day.
Reversals usually show the
daily change of
the P-Indicator confirming the new move.
"IP21 =" Current Tiger's Accumulation Index" This is a key indicator
for Peerless automatic
Buys and Sells.
Negative readings with the DJI approaching the upper band are bearish. Positive
with the DJI reaching
oversold are bullish.
"V ="
21-dma of 85% of Up Volume - 100% of NYSE Down Volume." This is a less important
tool. Volume is
of reduced value because so much volume now takes place off the NYSE.
"OP =" 21-day ma of Tiger's OBV PCt." This is used with Tiger
Automatic Buys and Sells.
Readings above +.50
show over-bought conditions except at the start of bull markets. Negative
readings
with the DJI
approaching the upper band are bearish. Positive with the DJI reaching oversold are
bullish.
4.) Number of MAXCP and MINCP stocks:
A
ratio of 2:1 is bullish. 10:1 is overbought .
This shows the degree to
which Professionals are aggressively net
buyers or new sellers.
HEDGE by Buying the Bullish MAXCP Stocks
and Shorting the
Bearish MINCP Stocks. The value of this can easily be tested by looking
at the older Hotlines'
Bullish and Bearish stocks and compare their performance.
5.) Bullish MAXCP Stocks Link
- These are the most bullish stocks I
can find
each evening. They
mostly come from stocks showing high Accumulation
(Insider Buying) and Closing
Power new highs (Professional Buying)
. Try to buy these on price breakouts above flat,
well-tested resistance and when
their Closing Powers turns
back up after a test of support. Note Buy signals,
red high volume and gaps,
which confirm the breakout.
Take profits when Closing
Power fails to confirm a new high and then breaks its
steep uptrernd-line.
Closing Power
uptrendlines will let you safely stay aboard
the strongest stocks while
you let your profits run. The degree to which they rally
depends a lot on general
market conditions, whether the market is starting a new
move or is already in a
trading range. Adjust your goals accordingly.
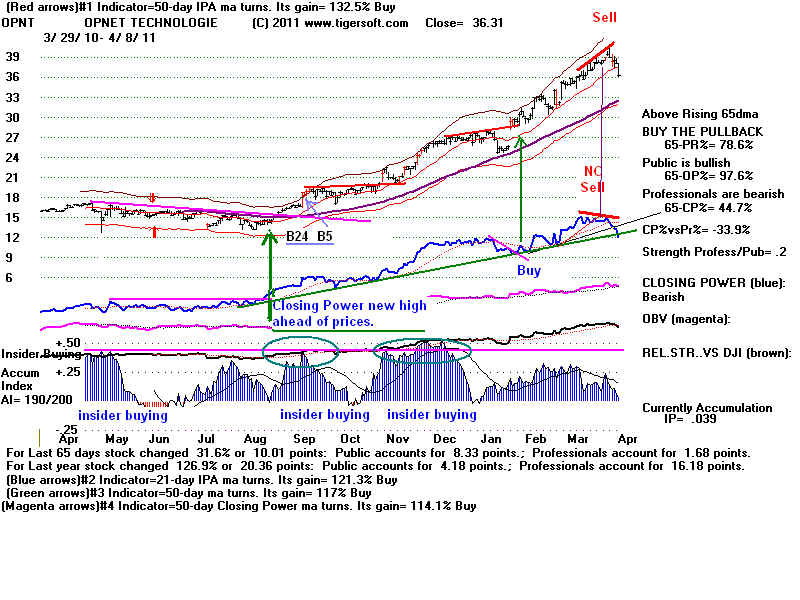
Buying:
Watch for a Bulge of
Accumulation and then buy on the next Closing Power's
turn back upwards. Use CP trendlines here. Selling:
Take profits when Closing Power
fails to confirm a new high
and then broke its steep uptrernd-line.
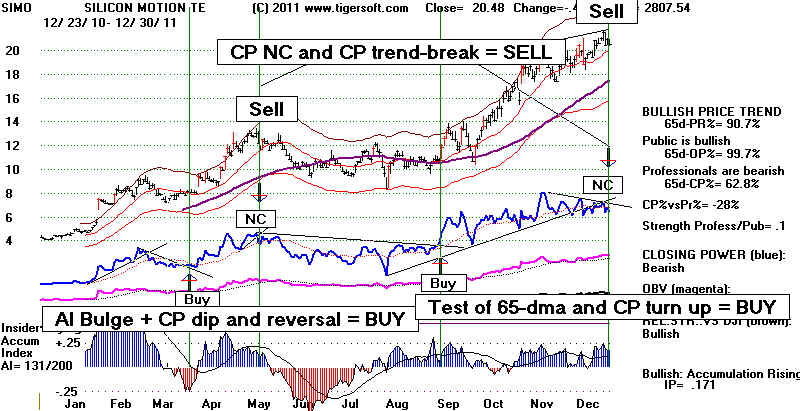
Buying: After a big advance and sell-off to the 65-dma, look for a
successful test of
support, such as a testing of
the rising 65-dma, and then a CP turn upwards or a CP
breakout above its
well-tested resistance. See SIMO
below.
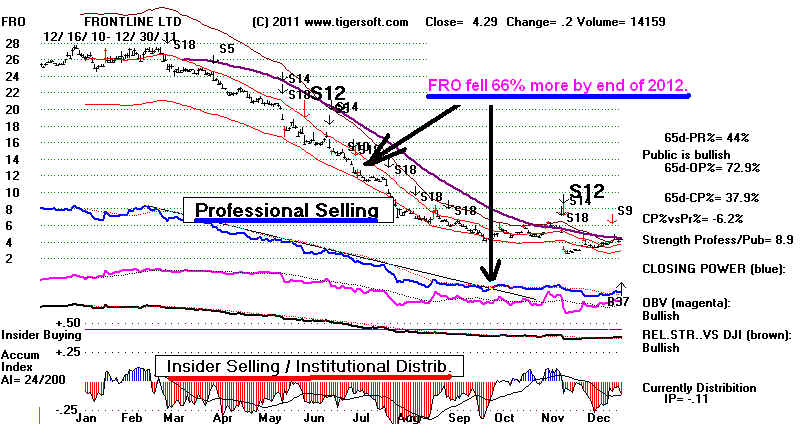
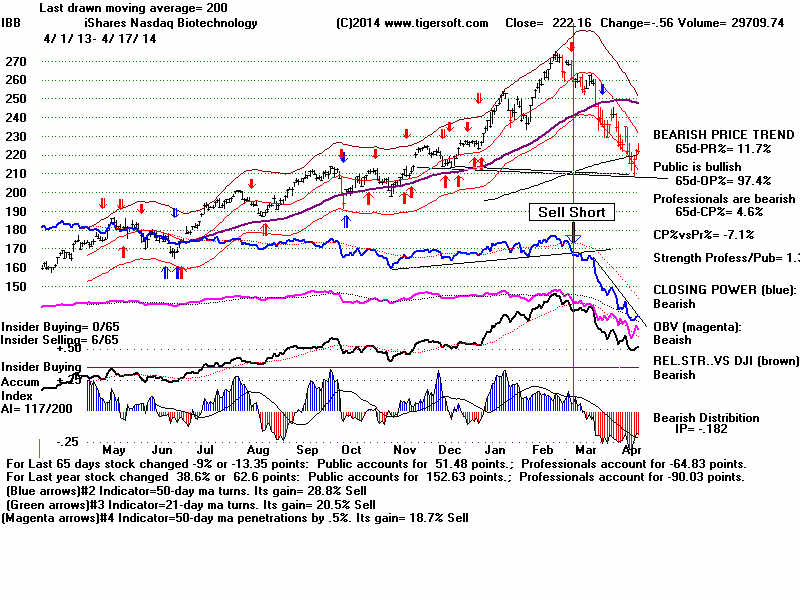
6.) Bearish MINCP Stocks Link - These are the most bearish stocks I can find
using the Tiger Power Ranker
with MINCP and NEWLOWS stocks each evening. They
mostly show heavy red
Distribution and Closing Power new low. Try to sell short
these on price breakdowns
below flat, well-tested support and when their Closing
Powers turns back down after
a test of resistance. Draw Closing Power downtrendlines on
these stocks to see when to
cover. The degree to which they fall only partly depends
a lot on general market
conditions, i.e. whether the market is starting a new move or
is already in a trading
range. Many of these bearish MINCP stocks will go down even in
an up-market.
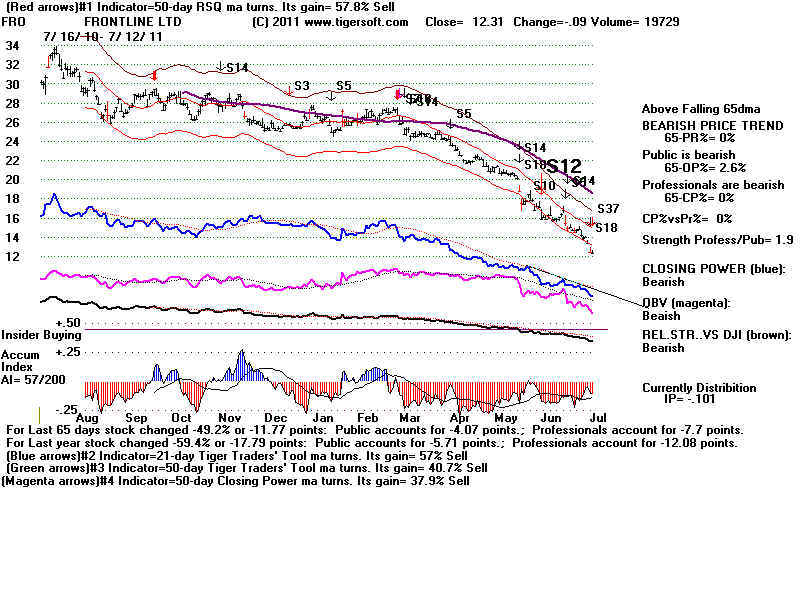
Just because a stock is already down a
lot, do not dismiss it as a short sale.
Shorting FRO above at 13 in July would still have gained you 66% more by
the end of
2011. See its chart below.
7.)
TIGER INDUSTRY STRENGTH
Being long the
strongest stocks in or ETFs representing
the strongest industries helps you make
money less stressfully
and much more easily. The bearish
MINCP stocks in the
weakest industries usually work out well
as short sales.
Click on the links to the industries where you see
the
Date in Red and the following link:
7/12/2011 ===> See Key Peerless
TigerSoft Index Charts: Industry Groups and ETFs
EXAMPLE ======= 7/12/2011 =======
.
Pct of Stocks over
65-dma - Daily Change
7/12/2011
7/5/2011
6/27/2011
6/20/2011
6/13/2011
------------------------------------------------------------------------------------------------------------------------------------------------------------------------------
B Bond Funds
92%
93% +1%
90% -1%
85% +1%
88% -4%
B REIT Stocks
86%
82%
32% +5%
68% +13%
59% +4%
B Biotech (XBI and IBB)
71%
86% +7%
50%
+7%
50%
57%
S Utility Stocks
69% +8%
76%
51% +4%
57% +8%
44% +4%
S Auto Stocks
66%
65%
-6%
54%
14% +6%
19%
-3%
S Gaming Stocks
64%
64%
29% --7%
29% +8%
14%
S Industrial Materials
55% +5%
58% +1%
30% +9%
20% +4%
22% +1%
S Food Commodities
55%
46% +4%
27% -9%
36% +9%
55%
B QQQ-100 stocks
53% -5%
62% -2% 33% +8%
25% +8%
28% -1%
B Retail stocks .
50% +4%
41% +5%
27%
23%
14%
B Gold Stocks
50% +14%
30% +12%
8% +2%
10%
14% +7%
-----------------------------------------------------------------------------------------------------------------------------------------------------------------------------------------
S DJI-30 stocks
47% -3%
60% +10%
13% +2%
23%
23% +3%
highest AI = CVX AI/200=184
S SP-500 stocks
47% -4%
66% +11%
31% +5%
31% +5%
25% +1%
S Finance Stocks
42% +1%
48%
-5%
32% +8%
30% +6%
21%
+7%
B Transportation Stocks 41% -2%
47% -3%
26% +4%
17% +1%
11%
-2%
B Oil stocks
37% -38%
47% +11%
17% +1%
12% -6%
16% -10%
S Green Stocks
32% -4%
44%
17%
12%
11% -5%
S Homebuilding Stocks
25% -4%
42% -4%
33% +12%
13%
+5%
4%
S Foreign ETFs' Stocks
18%
-3%
44% -9%
10%+2%
3%
10% -5%
S Chinese Stocks
18% -2%
28% +1%
14% +2%
7%
7% -5%
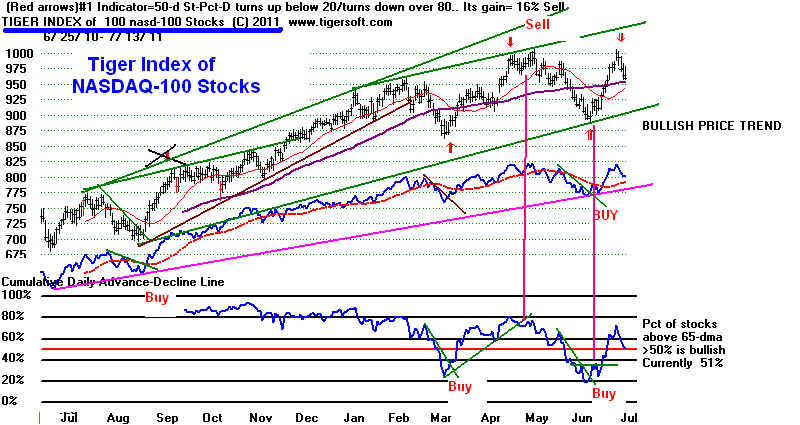
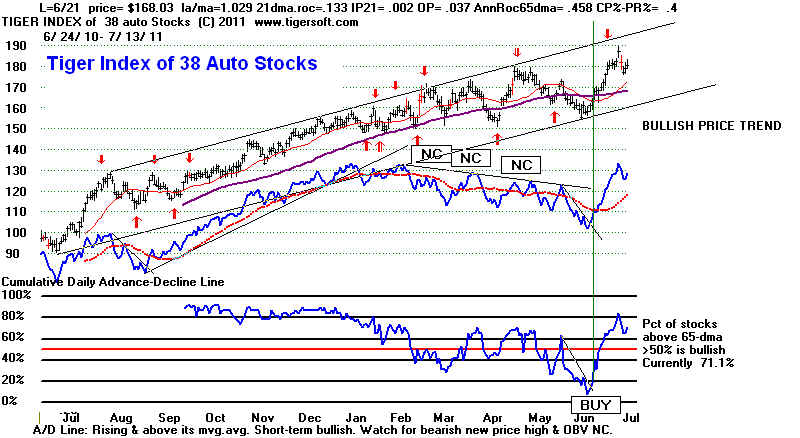
8) TigerSoft Industry and Sector Charts.
On the same page that shows the Industry Rankings, we post the Tiger Indexes of
key sectors and stocks
making up an Industry. Our program wights each stock by
average trading price
times volume. These Tiger Industry charts highlight the
Advance-Decline Line
for these groups and show the percentage of stocks above
the 65-day ma.
Draw the trendlines on these charts, not just of prices, but for the
its A/D Line and the
percentage of stocks above the 65-day ma.
Here are two examples:
First the NASDAQ-100 or QQQ and second Auto Stocks.
Trade the price and
internal strength trendlines, the automatic Buys and Sells, especially
after the A/D Line
fails to confirm a move.
The Actual Nightly Hotline pulls all these factors together
and discusses the operative Peerless signal and what
it
might take to reverse it.
9) The operative Peerless signal, example combined Sell S9/S12,
is very important.
The last and operative Peerless signal
appears among each day's Hotline's charts and
is specified as
text, near the top of the narrative or in the heading.
Many traders simply
work with the Peerless signals, buying a major market ETF on
and buy and selling
only on a Sell. This has a great track record.
Multiple Peerless Sell
signals tell us to Sell, Sell Short and avoid all long commitments,
especially if a
well-tested support level like 12500 is violated, as we saw in 2007. On the
other hand, Peerless
Buy signals provide an overall trading strategy, in that when we
are on a Buy, and even
more so when there are multiple Buys, we have to expect higher
prices even when a
decline is occurring. The Peerless Buys' track records should give us
the confidence we might
need to buy on this weakness, especially when the Tiger
Closing Power breaks
its downtrend and Professionals resume their buying..
The first thing we want to do when there is a new
Peerless signal, is to check out the
link in the Hotline to
that particular signal's history. Here we see how powerful in
history, back to 1929,
the signal is. How has it worked out in a rising market? In a
a bear market? At
this time of year? In the 4-year Presidential cycle? Are the current
key Peerless statistics
(la/ma, ann-roc, P-I, IP21, V-I, Opct) within the normal range
for this signal?
If there are enough cases, how does the signal work out when the
key Peerless indicators
were quite comparable? Should we be prepared for a paper loss?
How large? How often do
they occur? Are there past cases that seem quite similar?
Or is this a case that
is very different?
10) Within an on-going uptrend, there are minor declines and trading range
tops.
Traders should, I think, use the Closing Power trends to see these
short-term reversal points. Pay most attention to breaks in extended,
well-tested
CP trendlines when the CP has
not confirmed a move and when prices have just
tested support or resistance.
The Closing Power charts on key ETFs,
SPY, QQQ, IWM, FNA, TNA and
DIA are vital. See how the CP trendbreaks predict significant price
trend changes.
There are links to these each night. Often their charts
appear on the Hotline Page.
11) Historical
Parallels and Seasonality are
emphasized in TigerSoft
hotlines. TigerSoft,
more than others, looks at the 4-year Presidential
cycle. It works.
Peerless uses it. And as a trained historian and ex- political
economist, this cycle offers
us a lot.
12) Earlier Hotlines appear underneath the current one. Links
to even earlier hotlines
going back to 2009 can also be found on
the Hotline Page.
13) Political Economy.
It helps to be very cynical,
too. Most stocks
are owned and dominated
by the very wealthy, most of the time. 1999-2000 was an
exception. Public
buying and speculation ruled many tech stocks.
To see how the market
will likely move, we seek to anticipate the futures perceptions
of the very wealthy
about investing, profits and the market. Consider our Hotline
an antidote to the
mainstream media, which is full of useless and even misleading
news stories. The
conservative media's touting of silver all the way down from
48 to 20 is as
disturbing as it is typical. At best, its purpose is to sell copy. At
worst, it is to dupe
the public into buying when the insiders the media represents
want to sell.
Thus, it plays up the dramatic, the personal, the scary and the sensational.
This is the reason,
when professionals often are buying when the headlines are
bleakest and selling
when everything seems rosiest.
Tiger's Blog and Hotline show the importance of political economy.
There is a lot of
evidence that Obama has reinforced, not changed, the
control by, of
and for the American Plutocracy. That is a key reason
the stock
market has done so well, despite high unemployment and widespread
mortgage defaults
on Main Street.
Only Tiger's
Hotline has the Peerless back-tested Buys and Sells
of 74 years
experience. I've been writing a Hotline since 1986.
Our Closing and
Opening Powers are unique. I believe our
unique
perspectives will show you how Wall Street really works
and how to make
money like the Pros do....
Ask questions, too. The answers
we provide to you, may also help others.
william_schmidt@hotmail.com