


TigerSoft and Peerless Daily
Hotline
http://tigersoftware.com/115HL/index.htm
This is new Hotline IP address.
-----------------------------------------------------------------------------------------------------------------------
(C) 1985-2014 William Schmidt, Ph.D. www.tigersoft.com
All rights strictly reserved.
Tiger Software 858-273-5900
PO Box
22784 San Diego, CA 92192
Email william_schmidt@hotmail.com
Previous Hotline -http://tigersoftware.com/112211-H/index.htm 11/22/2013-3/20/2014
http://tigersoft.com/1111-HL/index.html
10/22/2013-11/21/2013
----------------------------------------------------------------------------------------------------------------------
----------------------------------------------------------------------------------------------------------------------
 Shhh.
Sharing this hotline address with non-subscribers is a violation of our contract
Shhh.
Sharing this hotline address with non-subscribers is a violation of our contract
with you and a violation of copyright laws. I work hard for you. Respect that
effort!
---> To
renew this Hotline, order
here $350 (check) - $360(Visa/MC)
www.tigersoft.com/-2GBL13HL/index.htm
-----------------------------------------------------------------------------------------------------
 http://tigersoft.com/-HL42013/index.html
http://www.tigersoft.com/-2GBL13HL/index.htm
http://tigersoft.com/-HL42013/index.html
http://www.tigersoft.com/-2GBL13HL/index.htm
 A Guide To Profitably Using The
Tiger Nightly HOTLINE
A Guide To Profitably Using The
Tiger Nightly HOTLINE
 Peerless Signals: 1915-2013

New Peerless
Signals and DJI Charts - version 7/4/2013
1965 1965-6
1966
1966-7
1967
1967-8
1968
1968-9
1969
1969-70
1970
1970-1
1971
1971-2
1972
1972-3
1973
1973-4
1974
1974-5
1975
1975-6
1976
1976-7
1977
1977-1978
1978 1978-79
1979
1979-80
1980
1980-1
1981
1981-2
1982
1982-1983
1983
1983-1984
1984 1984-1985
1985 1985-1986
1986
1986-1987
1987
1987-8
1988 1988-9
1989
1989-90
1990 1990-1
1991
1991-2
1992
1992-3
1993
1993-4
1994
1994-5
1995
1995-1996
1996
1996-7
1997
1997-8
1998
1998-1999
1999
1999-2000
2000
2000-1
2001
2001-2
2002
2002-3
2003
2003-4
2004
2004-5
2005
2005-6
2006
2006-7
2007
2007-8
2008
2008-9
2009
2009-10
2010
2010-11
2011
2011-12
2012
2012-2013
Background and New Studies
4/15/2014 Introduction to Tiger/Peerless Buys and Sells.
Peerless Charts and Signals
Different Types of
TigerSoft/Peerless CHARTS, Signals and Indicators
Documentation for
TigerSoft Automatic and Optimized Signals.
How reliable support
is the DJI's rising 200-day ma?
SPY Charts since 1994: Advisory Closing Power S7s, Accum.
Index, 65-dma, Optimized
Signals.
4/7/2014 Advisory Pink Closing Power S7s at ETF at top since 1994
1994 1996
1997 1998
1999 2000 QQQ SPY
DIA 2002 2007
2008 SPY 2011
2013-2014
The New 2014 Peerless.exe Software has now been posted on the Elite Stock Professional
Page.
-------------------------------------------------------------------------------------------------------------------
 On Monday night, the Tiger/Peerless Hotline
ADDRESS will CHANGE.
Look for an Email from us on Saturday
giving the new address.
------------------------------------------------------------------------------------------------------------------
4/17/2014 There is more upside potential, but
probably not a lot,
maybe 2% more.
16600 is our target for the DJI this month. 4250 is
as high as I
expect the NASDAQ will go if the DJI does rally to 16600.
The recent
pattern has been higher openings and mostly consolidations
for the rest of
the day. There are cases in the past when the DJI can rally
all the way from
the lower band to the upper band in this fashion. But a move
beyond the upper
band with trading like this is doubtful.
As has been
happening more and more before holidays, the market turns
up a few days
early than the day before the holiday. Besides strong closings,
right now the
market needs more Bullish MAXCP stocks and greater
volume to be
impressive. The "saving grace" technically is the rising
NYSE A/D Line,
which primarily reflects the FEDs' low interest rate policies.
This is a
defensive market. It is not, at all clear, that the biotech stocks
that led the
market last year are only having a simple correction.
Dividend-paying
plays along with selected oil and gas stocks are now the
apparent
leaders. Rising oil and gas
prices are not helping the US economy,
but they are
boosting CVX and XOM in the
DJIA, thereby giving the
market the
appearance of strength. If these trends continue, it will become
harder for the
FED to deny that inflation is a risk to the Dollar. An inflationary
scenario that
changes FED policies seems less likely than a scary Deflationary
scenario in which
the US economy stalls out because of the limited buying
power of the
weakening Middle Class which causes lay-offs and decreasing
investor
confidence in lofty priced stocks.
4/17/2014 > To Key Index and
Leading Stock Charts: DJI, SP-500, etc.
DJI Chart SPY Chart NASDAQ Chart IBB
Chart IWM Chart
Hourly
DJI-OBV Hourly-MVM0735 FAS-3x Financials
--> 36
-6 MAXCP stocks Bullish MAXCP Stocks
(4/17/2014)
--> 141
-71 MINCP stocks Bearish MINCP Stocks (4/17/2014) Bearish
plurality
--> 27 + 10 New Highs on NASDAQ 14
new lows. Bullish
plurality
--> 66
-1 New Highs on NYSE 5 -1 new lows.
Bullish
plurality
Our Hourly DJI Momentum Indicator shows momentum may start to turn down.
The DJI is 0.4%
above its 21-day ma. If it were to rally another 2%, given
the quite
negative IP21, V-I and OBVPct, we likely get a Sell S12 or a S15.
Why Is Up-Hour and Up-Day Volume
Low?
The Hourly DJI's DISI (OBV) chart shows the up-hour volume is very
low compared
to the down hour
volume. This may be because the big banks' and brokerages'
computerized
trading is mostly routed in rising markets to the "dark pools" that
do not report
volume. The NYSE and NASDAQ are more likely to be used
on down-days.
Leveraged short-ETFs make this practical. No one can know
for sure, because
such numbers are kept secret. These "pools" are unregulated.
Be that as it
may, in the past, usually rising volume is required to allow the markets
to chew up
over-head resistance and make a breakout. So, I doubt if the DJI will get
much past 16600.
If it does, Peerless probably will give a Sell which we should
respect.

Stock Market "Cozenry"
and Chicanery.
Our historical
findings suggest that higher Openings, like now, without
accompanying
higher Closings are not to be trusted.
Advisory Pink Closing Power S7s at ETF at top
since 1994

Professionals
(i.e.Closing Powers) are only half-heartedly seeking to repair
the technical
damage done in the April decline. It is the higher openings
which have
brought the last 3 days' recovery. If the Opening Powers were next
to turn down, I
would think the markets cannot not make much more upside progress.
A decline is also
possible. In such a decline, we might or might not find
much Professional
buying support. That remains to be seen
See in the QQQ,
IBB (biotech) and TWN (3x leveraged Small Cap) charts
below how strong
the green Opening Powers has been recently compared to
the blue Closing
Powers.
It is the
over-night changes (higher Openings) which account for nearly all the
gains this year.
Many of us believe
that these higher openings are often rigged
to allow market
making Professionals to reduce their inventory of shares.
I would not put it above the Federal
Reserve itself to be secretly orchestrating
such buying.
This is probably done informally, with nothing being in writing.
No law prevents
Fed Governors from telling their favorite banks what they
will say
publicly.


-------------------------------------------------------------------------------------------------------------------
OLDER HOTLINES
-------------------------------------------------------------------------------------------------------------------
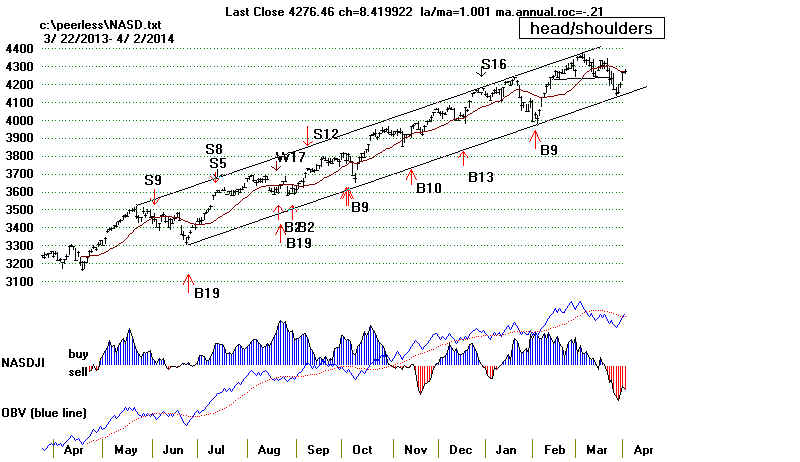
4/16/2014 The uptrends have reasserted themselves
for the DJI and
SP-500. The NASDAQ's is doubtful. It seems less likely to catch up
than
form a new and larger head and shoulders pattern. This is also true
for
QQQ, which has not yet broken its Closing Power downtrend.
> To
Key Index and Leading Stock Charts: DJI, SP-500, etc.
DJI Chart SPY Chart NASDAQ Chart IBB
Chart IWM Chart
As
long as the DJI stays locked in its trading range, the 20-day Stochastic K-Line
crossing Pct-D and the and Tiger Hourly Momentum (7/35) is expected to
work
for successful short-term trading of the DJI. Look also for the Stochastic-based
red
arrows on the DIA and SPY charts, too. We start to highlight these graphs
in
the evenings to come so long as the DJI is trapped in its relatively narrow trading
range.


For
the DJI and SP-500, higher prices must be expected, based on the
history of Buy B9s and, more simply, the theory that prices generally
go
from support to resistance and vice verse. Having found support at 16000,
the
DJI must now rally to until it finds resistance. The recent false breakout
at
16600 is its most likely target. Within a trading range, prices rise and
fall
easily. But a breakout seems unlikely. DIA's Closing Power shows a
broken downtrend; however, it is still badly lagging prices. Its Closing Power is
now
only 17.5% of the way up from its 65-day low to its 65-day high while prices
are
89.5% of the way up. The resulting CP%-PR% is a bearish -70.9% for DIA.
SPY's
CP still needs to break its downtrendline, but at least it has gotten
back
above its 65-dma. A small retreat by SPY tomorrow seems a good
bet.

 |
--> 42 + 3 MAXCP stocks Bullish MAXCP Stocks (4/16/2014)
--> 212
MINCP stocks Bearish MINCP Stocks (4/16/2014) Bearish
plurality
--> 17 New Highs on NASDAQ 1
-31 new lows. Bullish
plurality
--> 67 New Highs on NYSE 6 -15 new lows. Bullish plurality
-------------------------------------------------------------------------------------------------------------------
OLDER HOTLINES
4/15/2014 In the last 3 hours of trading the DJI
rose 191 points.
Two Fed Governors called for interest rates to stay
near zero for a long
time. They did not mention any
"bubble" in stocks. This over-shadowed
warnings
from Russia that the Ukraine was close to civil war and Russia must
protect
Russians there.
The Buy
B9 still operates for the DJI because the false breakout and short-term
DJI-head/shoulders Sell S5 failed to break the DJI below the 16000 support.
The Buy B9
is a major and strategic signal. The others are short-term and
tactical
signals. So, the DJI is apparently still stuck in its 16000-16600 trading
range.
It is doing its job of bolstering the market when people get scared very
well with
the help of computerized trading and repeated Fed reminders that
low
interest rates are here to stay. The Red and Blue Stochastic buys on DIA
are
probably reliable here. (Blue and Red signals coming together are more reliable
than just
the red signal by itself.) Still, all in all, a break in DIA's CP downtrend
is what is
really needed technically to ratify the prospects of a rally back up to 16600.

.
> To Key Index and
Leading Stock Charts: DJI, SP-500, etc.
DJI Chart SPY Chart NASDAQ Chart IBB
Chart IWM Chart
--> 39
+ 15 MAXCP stocks Bullish MAXCP Stocks
(4/15/2014)
--> 374
MINCP stocks Bearish MINCP Stocks (4/15/2014) Bearish
plurality
--> 13 New Highs on NASDAQ 44
-6 new lows. Bearish plurality
--> 33
+9 New Highs on NYSE 21 new lows. Bullish plurality
Warning for Fed Watchers.
Very "dovish" Fed
pronouncements and even very "dovish"
monetary
policy does NOT cause new business investments if too many
people are
"scraping by" and Aggregate US Demand less Government Spending
will not
support an expansion. So, can the Fed hold the market up if the
US economy
is still quite weak? The late 1920s in the US show it can for a
year or
two. But eventually stocks go up too much. Earnings can't justify the
gains on
Wall Street. When lay-offs come, the economy gets weaker and investors get
worried and
sell their shares. A financial panic can cause a near Depression.
If stocks
were again to collapse as in 1907, 1929, 1937 and 2008, the economy
would
suffer very badly and unless the FED can make interest rates go below
zero (!?),
very bad times would likely follow. We want to start comparing
earnings
reports with signs of big lay-offs.
So, I agree
with the pundits, we need some very positive earnings reports
in here and
fewer announcements of lay-offs.
It remains
to be seen if the probable rally tomorrow will swoop up the most
beaten down
stocks of the last few weeks. Most of the high-fliers on
the
NASDAQ ignored the blue chip and dividend-paying stocks' rally
today,
as did most
of our Bearish MINCP stocks.
With volume low and most of the ETF's Closing Powers still
declining,
the rally
in the NASDAQ, QQQ and biotechs will most likely be
limited.

I realize the ride is bumpy, but my advise
still is to wait for the Closing Powers
to hook up and
break the CP down-trends before closing out the QQQ
and FAS short
sales. It's true: the NASDAQ and QQQ rebounded from
expected support.
That was the zone between the rising 149-day (30-wk)
and 200-day ma
usually bring some kind of rallies. But we want confirmation
of that by seeing
the Closing Powers turn up with some conviction. The
technical problem
for the NASDAQ now is that it could be forming a
bearish
head/shoulders pattern.
QQQ rebounded from support
but its Closing Power did not rise at all.


-------------------------------------------------------------------------------------------------------------------
OLDER HOTLINES
-------------------------------------------------------------------------------------------------------------------
4/14/2014 Hold Your Shorts while the Closing Powers
are
in falling
trends. This is a very defensive market. Folks are
turning to
Utilities with very good results. Credit the Fed with
this.
See also
how impressively the Peerless signals track
the ups and
downs of the Tiger Index of Electrical Utilities.
Before rate
go back up, we should see another Peerless Sell.
But watch
the Dollar. It held at support today
We have to
always be looking for new trends. Buying and
Short-Selling on the Peerless BUY and SELL signals would have
gained more
than 31% over the last 11 months. A good many of
the
advancing stocks on the NYSE on days like today are defensive,
dividend
paying stocks. They may seem pretty sleepy, but right now
they are in
favor.

> To Key Index and
Leading Stock Charts: DJI, SP-500, etc.
DJI Chart SPY Chart NASDAQ Chart IBB
Chart IWM Chart
Peerless
will probably need to give a new Buy signal to turn
the general
market around. Though breadth (advances-declines)
was
bullish, volume was low today. Our Hourly DJI shows a
woefully weak and bearishly diverging DISI (OBV) Line.
Without
higher volume, the overhead resistance will not easily
be
overcome, especially with red Distribution still apparent.
--> 24 + 8 MAXCP stocks Bullish MAXCP Stocks (4/14/2014) (nothing significant found here.)
--> 469 +
99 MINCP stocks Bearish MINCP Stocks (4/14/2014) Bearish
plurality
--> 11 New Highs on NASDAQ 50
-13 new lows. Bearish plurality
--> 24
+15 New Highs on NYSE 19 -16 new lows. Bullish plurality
The DJI did what was expected of it.
The DJI stabilized the market
and brought
a relief rally up from 16000 to a point just below the
falling
65-dma, which must be expected to act as resistance now.

If we were only looking at the DJI, I
would be much more
bullish and look
forward to a new buy near the lower band.
But the Closing
Powers remain very weak for many very
important bank
stocks like BAC, Visa, MA and GS. Peerless
since 1986 has
generally correlated most closely with bank
and finance
stocks. So, I think we will do well to watch their 3x-leveraged ETF,
FAS. Its
Closing Power did not turn up today, even though it
has fallen to
what should be support. Note its rising green uptrend-line-
support and the
rising-200-day ma. If the CP does turn up in here,
that could
suggest a minor, but perhaps tradable, rally will be starting.
On the other
hand, if it does not turn up, it will certainly not be a good
sign.
Watch the Financials' ETF, FAS.
head/shoulders
The
small caps (IWM), QQQ and most of
the leading
NASDAQ stocks I follow show very usually weak Closing
Power, too.
IWM, shown below, has fallen to its rising
200-day ma.
Normally, this should bring a recovery. But
we must be very
careful here because of the completed
head/shoulders
pattern and the Closing Power new 12-month
lows. QQQ's
Closing Power also did not turn up today, even
though it has
reached a potentially effective support level.


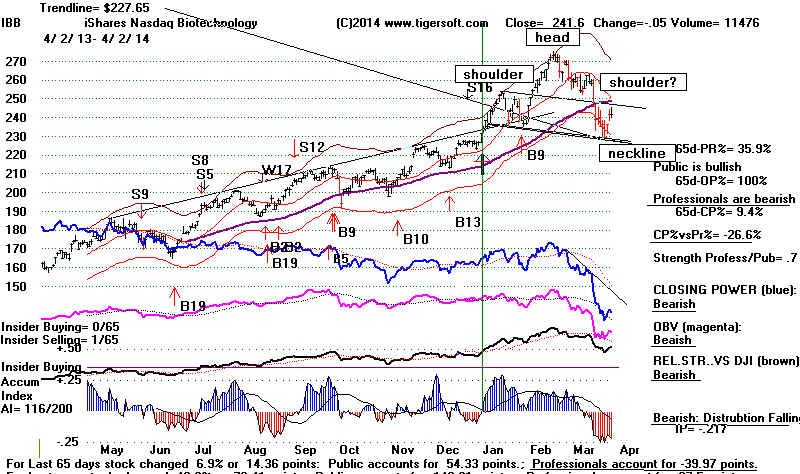
Biotechs were the leaders up in the bull market. It seems reasonable to think
now that their Closing Powers should stop falling, before most stocks
can turn
around. Put
another way, if this is only an intermediate-term correction, they
should set up soon to
make another good advance. Another good way to spot a bottom
in them will probably
be to watch FBIOX (Fidelity Biotech)'s RSQ (Relative Strength
Quotient vs. the DJI)
and wait for it to stop falling.

===============================================================
OLDER HOTLINES
===============================================================
4/11/2014
New Tiger Sell S5s on DJI and
SP-500.
Hold Your Shorts while the Closing Powers are falling.
There is
some hope here. QQQ is at potential support. FAS in the sweet spot zone
of support between the rising 30-week and 65-dma. IWM is holding at its rising
200-day ma, but IBB (biotechs) broke
below their 200-day ma and the DJI
and SP-500 fell through their support.
Closing Power Leads Prices at Market Turns.
The
weakness in Closing Power for many volatile high-caps and ETFs
is quite
profound. The CP charts of AMGN, AMZN, BAC, BBH, BIIB,
BMRN, CMCSA, DAL, FAS, GE,
GILD, GOOG, GS, HD, IBB,
MA,
NKE, PCYC, TNA, YHOO, VRTX as well as ADP, ATVI, CA, CTRX,
EQIX, FOSL,
MNST, NFLX, PCLN, PRGO, ROST, SBUX, TSLA
and VIAB in
QQQ-100 all show Closing Power new lows even though
their
prices are far from making 12-month lows.
Tiger's Closing Power
TigerCP is
the cumulative daily difference between the close and the opening.
CP(i) = CP(i-1) + LastPrice(i) - OpeningPrice(i)
Our on-line
book on Closing Power is available here.
It is copyrighted.
The very
weak CP now shows that Professionals (computerized trading systems,
market
makers, hedge funds and aggressive funds) are still aggressively selling
the high
caps and technology stocks that are components in leveraged ETFs.
Right now
the selling is focusing on leveraged ETFs. But other groups will
probably be
affected if the selling continues.
Pink Advisory Sell S7s
On the
Tiger charts note the pink advisory Sell S7s. These and the new S4s
are
warnings. They become recommended Sells when the stock or ETF
subsequently closes below the 65-dma. Sell S7s show more extreme CP
divergences
and very weak volume and Accumulation internals. We compare
the levels
of price and Closing Power in their 65 days range. See the QQQ
chart
below. The CP%-PR% was -.56 where the vertical line
crosses below.
Sell S7s
occur when CP%-PR% is below -.38. (Continue reading for a better
definition.)

New Tiger Sell S4s
This weekend I
searched for past cases where ETFs' Closing Powers show
such extreme
bearish divergences as we are seeing now. At no time since 1990
have so many
leading stocks shown such wide and bearish divergences. To do
the study, I
created a new Tiger Sell S4. It shows where the 65-day Closing
Power Percent -
65-day Price Percent is below -.47 with the stock or ETF also one pct.
over the 21-day
ma and IP21 and OBVPct both less than zero. When the ETF breaks the
65-day ma after
one of these new Sell S4s, much bigger declines usually followed.
---> The
interesting thing I discovered was that in nearly every Sell S4 case, to make
a good short sale trade
all one has to do was to go short on the violation of the 65-dma
and cover the S4 short
when the steep Closing Power down-trend was broken.
The "65-day
...Percent shows how far up from their 65-day low to their 65 day high,
Closing Power,
Price and Opening Power are. Our Tiger charts show this mumber on
the right side
and at the top when a vertical line is shown. Below are the charts of
DIA and FAS along
with the new Sell S4.


If The Decline Is Not Soon Stopped...
The broken
bubble of March 2000 suggests that the first decline in BBH (biotechs)
and QQQ
(large Nasdaq technology stocks) could be 50% and 37.5% respectively
in 2 months
if Professionals keep driving prices lower. This is not so far-fateched.
The 1987
Crash shows a decline of 34% in the indexes is possible when leveraged
derivatives
are wildly traded by computers. As in 1987, Professional Traders now
see added
risks because the DJI has been rising for 5 years without a 20% decline.
They
probably also know that the DJI fell 47% in 10 weeks in 1929, 40% in 14
weeks in
1937 and 27% in 13 weeks in 1962. In all these earlier periods, short sales
were not
officially allowed on down-ticks. Now they are. Showing what puppets they
are of Wall
Street, the SEC back in 2007 legalized short-selling on down-ticks very
conveniently weeks before the market's peak and 52% decline.
What's
worse? We still don't know what bad news is coming down the pike
to hit the
market. But we do know that completed head/shouldrs patterns usually pose
some
unexpectedly grim news, like invasions (1950, 1990), attacks (1941, 2001),
major
economic news (1971), Presidential assassination/hear attack (1963, 1955)
and
super-power stand-offs (1948, 1962).
--> 16 MAXCP stocks Bullish MAXCP Stocks (4/11/2014) (nothing significant found here.)
--> 370
MINCP stocks Bearish MINCP Stocks (4/11/2014) Bearish
plurality
--> 6
New Highs on NASDAQ
63 new lows. Bearish plurality
--> 9
New Highs on NYSE 36 new lows.
Bearish
plurality
> To Key Index and Leading Stock Charts: DJI, SP-500, etc.
DJI Chart SPY Chart NASDAQ Chart IBB
Chart IWM Chart
Tiger Sell S5s - Support Failures
The DJI
broke its head/shoulders neckline. If you request a Tiger S5s
(support
failures) on your Peerless chart, you see a new Sell S5
There is
still some support at the round number 16000, but if that level is
closed
below, it will look like the DJI will have to test its rising 200-day ma
and its
uptrendline at 15700. There is still hope for the bulls in that the
NYSE A/D
Line did not confirm the new low.
The SP-500
broke its well-tested support, too. Now we should expect it
to fall
back to its rising 200-day ma, too. A Tiger Sell S5 also shows the
neckline-support failure.
The much
weaker NASDAQ has now fallen to within 50 points of its rising
200-day ma.
Ordinarily, we would expect 3950 to be a point of reversal.


===============================================================
OLDER HOTLINES
===============================================================
4/10/2014 Today was a terrible day for the Bulls.
Yesterday's
rebound was completely
swallowed up by today's decline. Traders
IMMEDIATELY took
advantage of the rally to dump shares. They
did not even wait to
see if there would be any more of a rally. This
is a characteristic
most commonly seen in Extreme Bear Markets.
--> 19 MAXCP stocks Bullish MAXCP Stocks (4/9/2014) (too few tonight).
--> 421 MINCP stocks Bearish MINCP Stocks (4/10/2014) Bearish
plurality
--> 8 New Highs
on NASDAQ 35 new
lows. Bearish plurality
--> 13 New Highs on NYSE 22 new lows.
Bearish
plurality
> To Key Index and Leading Stock Charts: DJI, SP-500, etc.
DJI Chart SPY Chart NASDAQ Chart IBB
Chart IWM Chart

If The DJI Continues To Fall...
If the DJI should close
below 16000, it will bring a Tiger Sell S5 (just as
occurred in May 2010.
See the 2010 chart below. Such a decline will break
the well-tested
horizontal support there and complete a head/shoulders pattern.
That would cause us to
judge a Peerless Sell S10, whether or not Peerless
automatically generates
a Sell S10.
Compare Top Now with the DJI's in May
2010.

Professionals Are Particularly Heavy-Handed
Sellers Now
The weak Closing Powers
got much weaker today. A real panic is
shaping up.
Professionals are rushing to the exits. They are
using leveraged short
ETFs to sell short large numbers of shares
without having to wait
for an up-tick. Where you find a leveraged short
ETF, you will also find
a big decliner. Now it is not only QQQ, biotechs
and small-caps that show plunging Closing Powers. Banking stocks also
have collapsing Closing
Powers. The group's 3x leveraged
ETF, FAS, has completed a classic head and shoulders pattern.
There will be more bad
days ahead if computerized trading
coupled with leveraged
Short ETFs create another Flash Crash,
as in 2010.
Because regulators seem so clueless and sheepish,
I cannot rule out
another Crash like the 35% DJI decline of
October 1987, which
lasted just 3 weeks.
I have no wish to scare
folks. But this a dangerous market given
how far and long the
DJI has risen without a 20% bear market.
It has been rising for
5 years. The DJI is up 150%. Profits
are always very
clumsily taken when a bubble breaks. The first
break in biotechs in
2000, dropped BBH by 50% in 10 weeks.
Trading the Closing Power downtrends now is
recommended. This
should allow us to play
the downtrend for as long as it is likely to
continue. This
approach will help us avoid emotional mistakes.
It worked well with the Bearish MINCP short sales we picked in
2008. Right now
our Stocks' Hotline is short 3x-4x more than it is long.
I have recommended
shorting Biotechs and QQQ here.
Bank stocks
should probably be
added to that list, at least, for so long as the
Closing Power of FAS
(below) is falling.

Let's hope the FED
knows what it's doing. In 2008, they did not.
. My sense is that the FED is
fighting the last war again in focusing mainly on
interest rates.
They should be limiting computer driven short sales of
leverage ETFs on
down-ticks. Even now, they should be increasing
margin requirements.
They should enforce the Volcker Rule. But
I don't wish unduly to
blame the Fed. They are not in charge of fiscal policy.
Deliberate deficit
spending, a la Keynes, is politically out of the question.
The FED cannot create a
massive infrastructure re-building/jobs program.
If there is another
bitter bear market, it is Congress and the Presidency
that deserve the real
blame.
The US's Handing of The Ukraine Is A Trigger for
The Decline
My fear is what the
4-month strength seen in Gold,
Crude Oil, Food Commodities,
Natural Gas are suggesting. The Dollar may become too weak
in a few months
to let the Feds
continue their policy of low interest rates.

A New Cold War's Costs
America's confrontation
with Russia over Crimea has probably
exacerbated selling in
the Dollar by China and Russia. By secretly
encouraging the
right-wing nationalists to overthrow the democratically
elected (if also very
corrupt) Ukraine government, the US
has unleashed forces
that could well break up the Ukraine just as
Yugoslavia was.
The end result of this will be a new cold war between
Russia and America.
Russia cannot tolerate anti-Russian missiles
pointed at Moscow
anymore than the US could tolerate Soviet
missles pointed at the
US from Cuba. Russia denies moving troops
into a position where
it could act "to defend" the Russians of Donetsk
and Kharkov. But
perception is what will rule the day. NATO says
there are new troops
there. So, a new cold war is growing in intensity.
Europe is caught in the
middle of this struggle. Europe wants
Russian natural gas and
a continuation of good economic ties with
Russia. America
can strong-arm some of the more conservative
Europeon governments,
but an anti-America backlash is developing
even in Germany, which
is usually very pro-American.
The main consequence of
this back-lash against American cold-war
thinking could be a
sharp drop in the Dollar if China and Russia
continue to dump it.
A Dollar decline would be very hard to stop
without the Fed
imposing much higher interest rates in the US.
That would unwind all
the rise in stock prices that the Fed has
accomplished since
2010, when the DJI was about 10,000.
Worse, it could create
another 1937-like 47% decline in the DJI.
The American middle
class is weaker and smaller now, so with rich folks
abruptly cutting back
their spending, we may see a Wall Street Panic,
perhaps like in 1907,
back in the gilded age.
===============================================================
OLDER HOTLINES
===============================================================
4/9/2014 The Fed Does Not Want A Market Decline.
But Are They Still in
Control? The Weak Closing Powers
Show Professionals Have
Lots of Doubts.
Cover Shorts if their steep Closing Power
downtrends are violated.
We will likely short
them again if they fail at their overhead resistance,
either their old highs
or their falling 65-day ma.
What happens
after a much higher opening day, like we saw today, is a
good way to
distinguish a developing bear market from a healthy correction.
See research
below comparing the post-gap behavior of the NASDAQ in
2000, 2001, 2002,
2008 (which were tops) with those of 2003, 2006, 2012 and
2013-2014 (which
saw mostly minor corrections).
--> 33 +15 MAXCP stocks Bullish MAXCP Stocks (4/9/2014)
--> 76 MINCP stocks Bearish MINCP Stocks (4/9/2014) Bearish
plurality
--> 28 New Highs
on NASDAQ 6 new
lows. Bullish Plurality
--> 53 New Highs on NYSE 2 new lows.
Bullish Plurality
> To Key Index and Leading Stock Charts: DJI, SP-500, etc.
DJI Chart SPY Chart NASDAQ Chart IBB
Chart IWM Chart
Peerless signals rely more upon breadth than distribution or
volume:
thus the
importance of our P-Indicator, the 21-day ma of NYSE advances
minus declines.
It and the NYSE A/D Line have been holding up better
than our other
key Peerless indicators because the Fed's low interest
rate policies
boost the many dividend plays on the NYSE. Today's much higher
opening and broad
surge are yet another example of how determined
the FED is to
prevent even a modest decline, presumably for fear that
any market
decline could quickly get out of hand. I take this close concern
by the Fed to be
a distinctly bearish warning.
.
The Fed Minutes
emphasized their unanimity that interest rates should be
low.
This provided the excuse for today's sharp rebound from key support levels:
for the DJI, DIA, SP-500
and SPY from their rising 65-dma,
for the QQQ and NASDAQ from their rising
rising 30-wk (149-day ma.) and
for the
biotech ETFs, BBH and IWM, from
their rising 200-day ma).
Those indexes and stocks that are below now falling
65-day ma,
like QQQ,
NASDAQ, BBH and IWM will now face resistance at their 65-dma.
This
technical rule also applies now to stocks that have had big sell-offs recently.
Watch IWM
tomorrow. It closed just below its 65-dma. See also how very weak
its Closing
Power is. Avoid buying at openings stocks or commodities showing
such weak
Closing Powers.
The expanded Peerless Buy B9 reflects the Fed's determination
to prop up he
market. Market Professionals are skeptical about
how powerful the
FED still is. We see this in the collapsed
Tiger Closing
Powers, which were making new 6-month lows
on Monday.
But Pros are not
stubborn and inflexible. Undoubtedly, they appreciate
the gaps upwards
in the openings such as we saw on the NASDAQ
have had a
bullish track record for the last few years.
What Happens after A
Price Gap Says A Lot
about whether The Market Is Topping out
or Simply Experiencing a Healthy Correction.
The problem with
higher openings when the market is turning
over is that they
are often followed by much lower closing. We
should be
cautious that this pattern may assert itself. We can
see that it is
usually bearish when higher opening gaps do not bring
higher prices at
least for a few days. When there were bullish
follow-throughs
after a gap-NASDAQ opening, I have circled the
charts below in
GREEN. When there was no upwards follow-through
and prices
quickly declined, you will see red circles around the
gaps. RED
circled gaps are much more common when the market was about
to suffer a
serious drop, as in 2000, 2001, 2002, 2007 and 2008
then when the
gaps are circled in green as in 2003, 2006, 2012, 2013-2014.
Post-Gap Behavior of NASDAQ (Tops)
2000 2001 2002 2007 2008
Post-Gap Behavior
of NASDAQ (Ending Corrections)
2003 2006
2012 2013-2014

-------- Peerless Internal Strength Key Values ---------
Date
DJIA LA/MA
ANN.ROC
P-I
P-I ch
IP21 V-I
OPct
65-day Pct Change
4/9/2013 16437 1.007 +.063
+ 246 +119 -.125 -20
-.151 0.0
4/8/2013 16256 0.996 -.118
+ 126 +71 -.173 -46
-.236 -.013
4/7/2013 16246 0.995 -.151
+ 55 -44
-.170
-65 -.326 -.012
4/4/2013 16413 1.004
-.007
+ 99 -66
-.145
-47 -.228 -.01
4/3/2013 16573 1.014
.155 +165
-23
-.109
-25 -.135
.004
4/2/2013 16573 1.015
.129 +188
-77
-.116 -18
-.136
.005
4/1/2013 16533 1.013
.266 +264
+110 -.108
-1
-.121 .005
3/31/2013 16458
1.009 .099 +154
+47 -.109
-29 -.211
.006
===============================================================
OLDER HOTLINES
===============================================================
4/8/2014 False Breakout by DJI.
DJI should now retest 16000.
--> 18 +10 MAXCP stocks Bullish MAXCP Stocks (4/7/2014)
--> 268 -146 MINCP stocks Bearish MINCP Stocks (4/7/2014) Bearish
plurality
--> 15 New Highs
on NASDAQ 22new lows.
Bearish plurality
--> 21 New Highs on NYSE 10 new lows. Bullish Plurality
Declining Closing Powers, negative Accumulation Index readings and numerous
head/shoulders patterns in key indexes taken altogether should keep us
mostly short now. Peerless is officially still on an expanded Buy B9. But
this
can be over-ridden by judged Sell S10s from completed head/shoulders
patterns, such as shown by the NASDAQ and QQQ. It is also reasonable
to
sell when the DJI makes an obvious "false breakout" above well-tested
flat
resistance. Experience suggests we should not be afraid to judge these
Sells
when they occur.
I
take the absence of a Peerless Sell signal to mean the DJI and dividend stocks
will
probably hold up reasonably well, not dropping more than 7%, at which
time
we will probably get a new Peerless Buy.
Waiting for Professionals to show that they are net buyers again when key
support has been tested is recommended. This will be noted when the
key
ETFs Closing Powers turn up after testing their key support, in this
case,
most likely the zone of support between the rising 149-day (30 week)
ma
and the 200-day ma.
> To Key Index and Leading Stock Charts: DJI, SP-500, etc.
DJI Chart SPY Chart NASDAQ Chart IBB
Chart IWM Chart
Raising Bank Reserve Requirement is Bearish.
Now
we know why financial stocks have hastily formed a bearish head
and
shoulders.

The
Fed has announced it is raising the reserve requirements for big banks.
Typically, this cuts into their more speculative loan-making. It slows down
the
economy especially in cyclical sectors. In our market, it should cut into
their
derivatives trading. It may force them to sell some stocks. So, it is
bearish. Reserve requirements are not often changed by the Fed because
they
are believed to have a disproportionately large effect on the national
economy. Why would the Fed do this now, when they say the economy is
still
weak? I think it's because they think the market has become quite
vulnerable, though this is not what they are saying publicly. They want to try
to
ensure that the big banks have plenty of time to raise capital to become
more
solvent in case there is another financial crash.
I
cannot find a list of the times in the past when the Reserve Requirement
Percentage was raised. But I remember that my basics ECON 101 books
all
mentioned how powerfully deflationary and bearish for stocks this was,
though I don't think they gave any examples after 1945. Let's watch tomorrow
to
see if the Wall Street Journal presents such historical data.
Watch Biotechs; They Must Hold
Biotechs led the
market down. They are weakly trying to find a bottom at their rising
200-day ma. If they break down from here, a new head/shoulders pattern will be
completed.
Much
lower prices will then become the minimum price objective. This is not so
far-fetched.
Historically, it is usually quite bearish when a group's Closing Power falls this fast and
makes
12 month new lows far ahead of price. we

-------- Peerless Internal Strength Key Values ---------
Date
DJIA LA/MA
ANN.ROC
P-I
P-I ch
IP21
V-I
OPct 65-day Pct Change
4/8/2013 16256 0.996 -.118
+ 126 +71 -.173 -46
-.236 -.013
4/7/2013 16246 0.995 -.151
+ 55 -44
-.170
-65 -.326 -.012
4/4/2013 16413 1.004
-.007
+ 99 -66
-.145
-47 -.228 -.01
4/3/2013 16573 1.014
.155 +165
-23
-.109
-25 -.135 .004
4/2/2013 16573 1.015
.129 +188
-77
-.116 -18
-.136 .005
4/1/2013 16533 1.013
.266 +264
+110 -.108
-1
-.121 .005
3/31/2013 16458
1.009 .099 +154
+47 -.109
-29 -.211
.006
===============================================================
OLDER HOTLINES
===============================================================
4/7/2014 False Breakout by
DJI. DJI should now retest 16000.
> To Key Index and Leading Stock Charts:
DJI, SP-500, etc.
DJI Chart SPY Chart NASDAQ Chart IBB
Chart IWM Chart
For
the DJI and Peerless, only the P-I is still positive among our internal strength
indicators. A new study tonight suggests that the key major market's TigerSoft
Closing Power making a 6-month low ahead of declining prices
is quite bearish.
Last
night's study of DJI false breakouts shows
that the lower band is quite possibly
where
the DJI must now go to find support. (Programming for false breakouts is
tricky. So, for now, we will have to spot them ourselves.)
-------- Peerless Internal Strength Key Values ---------
Date
DJIA LA/MA
ANN.ROC
P-I
P-I ch
IP21
V-I
OPct 65-day Pct Change
4/7/2013 16246 0.995 -.151
+ 55 -44
-.170
-65 -.326 -.012
4/4/2013 16413 1.004
-.007
+ 99 -66
-.145
-47 -.228 -.01
4/3/2013 16573 1.014
.155 +165
-23
-.109
-25 -.135 .004
4/2/2013 16573 1.015
.129 +188
-77
-.116 -18
-.136 .005
4/1/2013 16533 1.013
.266 +264
+110 -.108
-1
-.121 .005
3/31/2013 16458
1.009 .099 +154
+47 -.109
-29 -.211
.006
"The Buy B9 is still the operative signal. But it should
be applied right now
mainly to dividend paying NYSE stocks and the DJI. We have apparently
reached the point that commonly occurs in a long bull market where the
broader, more speculative market separates from and starts to lag the DJIA."
(See the example of 1986).
SPY has reached the support of its recent lows and its rising 65-dma. A rally
attempt may be made. But any rally right now will probably be very brief
and limited. There is too much internal strength weakness in the speculative,
growth and technology stocks.

Bull markets die slowly over
time and in segments.
The Peerless internal strength indicators, except for the the breadth P-I are
are all quite negative. With the bull market now more than 5 years old, there
are lots of anxieties that the advance cannot continue. But bull markets
die slowly over time and in segments, not all at once. With each group and
ETF, the rising 200-day ma should act as support one more time. Be careful, however,
the many head/shoulders in important stocks, ETFs and indexes like NASDAQ,
tell us there is more unexpected very bearish news coming our way that the market
is quickly trying to adjust, too. Not for nothing are Professionals are rushing
to the exists, judging from the very rapid declines in Closing Powers.
Professionals are agile. They may turn bullish only for a few days. They
change their mind quickly. Some will try to play a rally when the rising 200-day
ma are reached in IBB, BBB, QQQ, TNA and FAS. But for most of us,
until the Closing Power downtrends are violated, there is no hurry to buy.
Professionals will tell us when to expect a good reversal. And for most
of us, except the very nimble, it will be a lot safer if we wait for either a new Peerless
Buy or the Accumulation Index also turn positive.
--> 8 -11 MAXCP stocks Bullish MAXCP Stocks (4/7/2014)
--> 414 +92 MINCP stocks Bearish MINCP Stocks (4/7/2014) Bearish
plurality
--> 12 -1 New Highs on NASDAQ 53
+13 new lows. Bearish plurality
--> 10 -19 New Highs on NYSE 17 new lows. Bearish plurality
===============================================================
OLDER HOTLINES
===============================================================
4/4/2014 False Breakout by
DJI. DJI should now retest 16000.
The Buy B9 is still the operative signal. But it should be applied right now
mainly to dividend paying NYSE stocks and the DJI. We have apparently
reached the point that commonly occurs in a long bull market where the
broader, more speculative market separates from and starts to lag the DJIA.
The failure on Friday of the DJI to stay above the 16600 resistance created a
bearish "false breakout".
This is a reliable short-term sell even if Peerless
did not give a new Sell signal. So a decline to 16000 would
seem a good bet.
Remember that only be stretching the Peerless rules did we get the early
February Buy B9. Now with both the 20-day Stochastic K- and Pct-D Lines
have dropped below 80, the DJI will likely have to plumb for support now.
That means the dividend stocks and the DJI will have to work very hard
to hold the market up.
But that's not the problem now. For the many reasons mentioned below,
the NASDAQ, the QQQ, Biotechs and smaller stocks seem to be
at
considerable risk.
--> To
Key Index and Leading Stock Charts: DJI, SP-500, etc.
DJI Chart SPY Chart NASDAQ Chart IBB
Chart IWM Chart
Peerless Key Values
Date
DJIA LA/MA
ANN.ROC
P-I
P-I ch
IP21
V-I
OPct 65-day Pct Change
4/4/2013 16413 1.004
-.007
+ 99 -66
-.145
-47 -.228 -.01
4/3/2013 16573 1.014
.155 +165
-23
-.109
-25 -.135 .004
4/2/2013 16573 1.015
.129 +188
-77
-.116 -18
-.136 .005
4/1/2013 16533 1.013
.266 +264
+110 -.108
-1
-.121 .005
3/31/2013 16458
1.009 .099 +154 +47
-.109 -29
-.211 .006
--> 18 -41 MAXCP stocks Bullish MAXCP Stocks (4/4/2014)
--> 322 +218 MINCP stocks Bearish MINCP Stocks (4/4/2014) Bearish
plurality
--> 13 -14 New Highs on NASDAQ 40
+30 new lows. Bearish plurality
--> 29 -34 New Highs on NYSE 7 +3 new
lows. Bearish plurality
We are getting closer to a violent shake-out. Confidence in the stock market has
been
eroding. Remembering 2008, even many long-term investors are not going
to want to just buy and hold if the market behaves badly.
There is a lot of talk now about a COMPUTER DRIVEN FLASH CRASH.
That
may put the flash boys on good behavior for the time being. But it is not only that
much of the market's trading is now driven by computers following automatic
instructional codes and acting in unregulated and opaque "dark
pools". That
problem is now compounded by all the new leveraged short ETFs which permit
very quick short-selling on a scale much larger than ever seen before. No
up-tick or borrowing of stock is needed now to go short. In addition, the price
uptrend-breaks now will take away many of the bids and cause many stop sell orders
to be invoked one after another. "Gunning for the stops" could take on a
whole
new meaning now. In many ways,
de-regulation and derivative trading have set the stage
for another
computer driven debacle not unlike the one that occurred in October 1987.
Such a decline early or late in the day could bypass past Exchange's circuit-breaker
rules.
I suggest staying hedged, especially with shorts in biotechs. Close out
most NASDAQ and smaller stock positions if their Closing Power uptrends
are broken. Shorting QQQ or IBB even now may seem reckless,
but as long
as you use our Closing Power's downtrend to guide you in knowing how long to
stay short, the risk:reward ratio is still favorable.
Note below the QQQ's bearish head and shoulders pattern and its
price trend-break on
red high volume Friday. The Tiger Closing Power is plunging. NY Professionals
are hurriedly selling to the Public and to overseas buyers. The Tiger Accumulation
Index
has fallen to the lowest levels for the last year. After an advance for 5 years
this is very dangerous. There will not be much support until the QQQ reaches
83.50 and that may not hold.
Current QQQ

The DJI's intra-day false breakout over 16600 Friday suddenly invites
a comparison with 1986. To Tiger users, "False
Breakouts" are a familiar
concept. They are dangerous. They are even more dangerous when they
produce
breaks in well-tested price-uptrendlines going back more than 6 months, especially
with a bull market that has been rising for 4 or 5 years. What's worse?
Add into that risky mix the possibility of another "Flash Crash" as in 2010,
such as Michael Lewis has been talking about, or another Computer Driven
Crash based on derivatives as in October 1987 with OEX puts and calls. (The
good news is that the breadth is much better now than in either 2010, 1987
or 1986. The bad news is that without a Peerless Sell in 3 cases the DJI
fell to the lower band after a false breakout.)
Current DJI and NASDAQ


What if the Fed cannot hold up the market? Greenspan lowered rates in 2001
and 2002, but that did not held the NASDAQ or QQQ very much. With average
wages now falling, where is the consumer demand going to come from if a
declining stock market clips the buying of the well-to-do? Another big stock
market
decline would have devastating effects on the US economy and elsewhere.
Will We Get
Another 1937?
The deflationary Republican resistance to a badly needed public works and
highway/infrastructure re-building programs, such as the Republicans Coolidge
and Eisenhower sponsored could, I'm afraid, be setting up another 1937-like
Crash which even a loose monetary policy may not be able to prevent. The 1987
Crash resulted from FDR's efforts in 1937 to balance the budget in the middle
of an on-going Depression. He mistakenly started to listen to his Treasury
Secretary (Morgenthau) who told him that the rising stock market from
1933 to early 1937 had become too speculative. (FDR should have listened
to Keynes at this point. His mistake in 1937 can be
compared with Chruchill's
choosing to take ngland
back on the Gold Standard in 1925.)
If the NASDAQ breaks down badly, as it did in 1986 or 1987, under the pressure
of stop-loss orders, clumsy profit-taking and computerized sell orders in a market
without many bids, it could fall 20-30% in the next few months. Is that too
scary? Internals other than the A/D Line are weaker now than in 1986. Prices
have risen further, by comparion. Remember that Biotechs fell
50% in their first decline after they broke their bubble in March 2000.
the coming week. That is why we have been advocating hedging with Bearish
MINCP stocks.
Current DJI and NASDAQ

Usually the different markets,
DJI and NASDAQ move together in direction
and magnitude. But that is not always true. The closest parallel I can find
now is
1986. By the middle of 1986, the DJI had been rallying for almost four years.
In our case, it has been rallying five. But then the DJI made a false breakout
over 1900 and in the sell-off that followed, the NASDAQ broke its 6-month+
uptrendline. This turned the NASDAQ down for 6 months. Its decline was
much longer and deeper than the DJI's. The NASDAQ fell 16% in 10 weeks,
compared to the DJI's 8%.
1986 DJI and NASDAQ


Bearish Insider, Institutional and Professional Selling
The NASDJI and QQQ are much weaker than the DJI. This is what the very negative
Tiger relative strength NASDJI indicator shows. There is heavy distribution
by institutions and insiders. The negative Accumulation Index shows this.
The completed head/shoulders patterns in NASDAQ, QQQ and IBB show
institutions are very hastily selling because there is unexpectedly bearish news
coming. Look at the swift declines in the Tiger Closing Power for the
QQQ, IWM and IBB. Why are professionals in such a hurry to sell now?
This cannot be anything but bearish. Given all the attention that Michael
Lewis'
Flash Boys has received in the media for last few days, the market seems
perfectly set up to show significant weakness on Monday.
I fear the recovery rallies in QQQ, IBB and IWM will be quite limited until
we see an end to the TigerSoft Closing Power and Accumulation Index downtrends
come to an end.
Can The FED and Peerless Still Prevail?
Peerless has not given a Sell and Janet Yellen is the most dovish Fed Governor
ever. That should still give us some hope that after the current sell-off has
played itself out, the DJI will make more new highs before its bull market
comes to an end. Since 1928, Peerless charts have nearly always gives a timely
sell before a big decline below of more than 7%. But, if the NASDAQ does
break down really badly, the DJI's decline will likely be more like 10%.
15000 would have to be re-tested.
Why has there been no Peerless Sell? No Peerless sell has occurred because
the DJI did not recently rise to a point more than 2.5% over the 21-day ma
with negative readings from the IP21 (Accum. Index), V-I and OBVPct. If it
has we would have seen a Sell S12 or a Sell S15. At its recent highest
closing,
it did reach 1.6% above the 21-day ma. But the P-Indicator waspositive.
Positive breadth (P-I) coupled very negative volume readings like this are
very rare. I can find only two previous cases since 1928 where this occurred.
In one case, selling short then would have produced a big loss. In the other
case,
December 1982, after a 3% paper loss, the short selling of the DJI would have
gained 2.5%.

-------------------------------------------------------------------------------------------------------------------
4/3/2014
The "expanded
Buy B9" and usual bullishness of
flat tops cause us to expect a DJI breakout. The Jobs'
Report tomorrow
could well be the pretext for that jump. Bad economic news would be
interpreted to mean the Fed cannot back away anytime soon from
its low interest rates while good economic news would still not change
Yellen's deep-rooted commitment to "dovishness".
However, a failure by the DJI to breakout soon will show resistance now is
too great for the bulls to over-come. When this is
perceived, the
market usually declines and starts to plumb for new support. With
Peerless still operating under a Buy, I would think the DJI will not
fall below 16000 before trying for a breakout again.
The bulllisness of the Buy B9 does not extend now to
the NASDAQ
or Biotechs. The smaller cap IWM is also in doubt.
Its Closing Power
is falling. Our Stocks' Hotline remains hedged, long
some of the Bullish MAXCP
stocks and short about an equal number of the Bearish MINCP stocks.
--> To Key Index and Leading Stock Charts: DJI, SP-500, etc.
DJI Chart SPY Chart NASDAQ Chart IBB
Chart IWM Chart
The Buy B9s bullishness is limited now
mostly to dividend paying stocks and semi-conductors.
The problem now is that if there is a decisive
breakout by the DJI past 16700,
the upper band would probably be as much as we can hope for. There probably
will not be much follow-through on a breakout: volume is too low and
among the Peerless key values, the IP21, V-I and OPct remain quite negative.
We could easily get a new Sell S12 or Sell S15. These will signal negative
non-confirmations by these indicators with the DJI more than 2.5%
above the 21-day ma.
Peerless Key Values
Date
LA/MA ANN.ROC
P-I
P-I ch
IP21
V-I
OPct 65-day Pct Change
4/3/2013 1.014
.155 +165
-23
-.109
-25 -.135 .004
4/2/2013 1.015
.129 +188
-77
-.116 -18
-.136 .005
4/1/2013 1.013
.266 +264
+110 -.108
-1
-.121 .005
3/31/2013 1.009 .099
+154
+47 -.109 -29
-.211 .006
The healthiest thing the market could do now would be consolidate
and for its various components to get back into synch. Its weakening growth/
speculative components are out of synch with its strengthening dividend-paying
components. That was clear today. Utilities were strong. The market
is becoming much more defensive.
Let's See if Utilities Can Breakout Past Their
Resistance.

The NASDAQ and Biotechs like GILD
or IBB were much weaker
than the DJI or NYSE again today. As a result, there more than 540 down
than up on the NYSE. This has made the P-Indicator fall back and makes it
even more likely that any DJI rally to 16700-16800 will easily bring a
Peerless S12 or S15.
See the DJIA chart. Under Peerless rules, it should be noted that if
there is a Buy B10 on the breakout as well as a simultaneous Sell S12 or S15,
the new Buys and Sells would cancel each other out and the Buy B9
would remain, intact. In this unusual case, the DJI will probably rally up
more and reach the 3.5% upper band where there will likely be new Sells.
Professionals are still net sellers in DIA, SPY, QQQ and IWM as
well as with the IBB (NASDAQ Biotechs). We
cannot recommend
them while their Closing Powers are in downtrends. Studying the earlier
cases of SPY where Closing Power has bearishly lagged prices, one
comes to see that this by no means guarantees a substantial decline.
Normally, we just wait for the CP downtrends to end before buying.
Rarely is there a big rally until the Closing Powers break their downtrends.
Note that when these ETFs (or stocks) show pink Sell S7 Closing Power
divergence-warnings, as they all do now, their CP weakness typically only becomes
a serious problem when they break below their 65-dma. That's the point at
which we sell them short. (You can download such stocks each night, under
the name of "AUGSEL7", from our Data Page).
When Financial
Stocks Breakdown,
the DJI usually becomes much weaker.

Watch now the Big Banks like BAC and FAS,
the 3x-Leveraged Bullish Bank ETF.
These are still well above their 65-dma, so they still should have ample
underlying support. (After all, the FED is still there to backstop them).
But they do show head/shoulders-like price patterns emerging. If they
break their neckline, they should then decline 5% further down. At that point,
they must find support or the market will be in trouble.
--> 59 -29 MAXCP stocks Bullish MAXCP Stocks (4/3/2014)
--> 104 +54 MINCP stocks Bearish MINCP Stocks (4/3/2014) Bearish
plurality
--> 27 -39 New Highs on NASDAQ 10
+4 new lows. Bullish plurality
--> 63 New Highs on NYSE 4 new
lows. Bullish
plurality
-------------------------------------------------------------------------------------------------------------------
OLDER HOTLINES
-------------------------------------------------------------------------------------------------------------------
4/2/2014
No New Sell. The flat DJI top
"beckons for a breakout".
--> To Key Index and Leading Stock Charts: DJI, SP-500, etc.
DJI Chart SPY Chart NASDAQ Chart IBB
Chart IWM Chart
The first half of Aprils most often brings a nice advance,
presumably
so that we all can have more money to pay our taxes with. More important,
Janet Yellen's speech Monday was the "most dovish" ever delivered by
a head of the Fed, says the Wall Street Journal. "Don't fight the Fed"
has been indelibly imprinted on my mind. As a result, the ratio of NYSE
(which has the most dividend stocks) new highs to new lows is 101:1.
If breadth can stay positive, we should see the DJI surpass 16600 for a
breakout above well-tested resistance into all-time high ground.
The NYSE, OEX and SP-500 made marginal new highs today. Normally,
with a Peerless Buy signal still operating, all this would provide us
a very bullish outlook even with volume lagging a little.
But how far up can any breakout advance go? IP21, V-I and OPct
are each
quite negative. Not only that, but the weak Biotech ETFs
have formed
their own potential head and shoulders pattern. They must keep advancing
now to destroy these patterns.
Another concern: it's getting much harder to find attractively Accumulated
Closing Power new highs to buy. Professionals and Insiders are turning
quite cautious.
--> 88 +13 MAXCP stocks Bullish MAXCP Stocks (4/2/2014)
--> 50 -1 MINCP stocks Bearish MINCP Stocks (4/2/2014) Bullish plurality
--> 66 -15 New Highs on NASDAQ
6 -7 new lows. Bullish plurality
--> 111 New Highs on NYSE 1 new
lows. Bullish
plurality
My guess is the Jobs' Report on Friday morning will bring a breakout
surge. But it may also bring a Peerless Sell S12 or S15. So, stayed hedged
and watch the NASDAQ biotech ETF, IBB, to see if it can rally and destroy
its nascent head/shoulders or if it will turn sharply down.
Peerless Key Values
Date
LA/MA ANN.ROC
P-I
P-I ch
IP21 V-I
OPct
65-day Pct Change
4/2/2013 1.015
.129 +188
-77
-.116 -18
-.136 .005
4/1/2013 1.013
.266 +264
+110 -.108
-1
-.121 .005
3/31/2013 1.009 .099
+154
+47 -.109 -29
-.211 .006
Lagging Closing Power
Closing Power Divergence Sell S7s are warnings. But until the SPY breaks
below
its 65-dma, the situation is not precarious. Even then, if Closing Power
belatedly turns up and breaks above the CP well-tested resistance, there
is a
good chance SPY will move up quickly. Professionals do not make
the
mistake of being net short when prices start a big advance. They somehow
know
in advance and they are not stubborn.
Please see the SPY charts since 1994 to get a better sense
of this.

The Biotech and NASDAQ Head/Shoulders Patterns
are scaring away chart-minded traders. Watch to
see if the patterns are aborted or play out bearishly.
Moves above the right shoulder apexes usually
destroy the pattern and allow prices to advance quickly
as shorts are forced to cover.
-------------------------------------------------------------------------------------------------------------------
4/1/2014
No New Sell. The flat DJI top
"beckons for a breakout".


But how far up can it go? The Peerless DJI chart shows lots of red
Distribution. IP21 is -.093. Volume
appears to be too low to sustain
a breakout advance. The negative -.121 is particularly low for a
DJI trying to breakout. It is likely we will get a
Peerless Sell signal
in April if the P-Indicator falls back a little and the DJI rises from
1.6% above the 21-day ma to 3% above the 21-day ma. This will be
based on the negative volume key values for IP21, V-I and OBVPct.
For example, if the DJI were to spike up tomorrow to 16750 with
flat breadth and internals, which would leave the volume indicators
negative and drop the P-Indicator, we would get a Sell S15.
Peerless Key Values
Date
LA/MA ANN.ROC
P-I
P-I ch
IP21 V-I
OPct
65-day Pct Change
4/1/2013 1.013
.266 +264
+110 -.108
-1
-.121 .005
3/31/2013 1.009 .099
+154
+47 -.109 -29
-.211 .006
--> To Key Index and Leading Stock Charts: DJI, SP-500, etc.
DJI Chart SPY Chart NASDAQ Chart IBB
Chart IWM Chart
Janet To The Rescue
What the market has going for it now is very low interest
rates and a
Fed Chairwoman who is a very devout "dove". The Wall Street Journal
Tuesday morning called her speech yesterday "the most dovish"ever
heard from the head of the Federal Reserve. The force of this should
not be underestimated. Dividend stocks are attractive in this environment.
And the Fed has removed one of the sources of uncertainty that holds
back speculators from pushing prices up, up and up even further.
OEX Seems Best ETF To Buy if There is A Breakout.
The OEX (SP-100) is the strongest of the major ETFs. It
has already
very marginally broken out with a confirming Closing Power. This shows
the strength in dividend and some of the highest quality oil/gas stocks.

Technical Rebound?
The NASDAQ today did get back above
its rising 65-dma. It will need to
keep advancing. So will the biotechs. Only a NASDAQ high high will
really
destroy its potentially bearish head/shoulders pattern. The leading
biotechs saw big technical bounces today from support levels and rising
longer term mvg .avgs. Their very steep Closing Power downtrendlines
were broken, but their CPs will now face resistance at their falling 21-day
ma. Continued strength after the openings will show Professionals are
doing more than trading them for a quick over-sold bounce.
Hedging with our bullish MAXCPs and bearish MINCPs still
seems advised.
--> 75 +22 MAXCP stocks Bullish MAXCP Stocks
(4/1/2014)
--> 51 -69 MINCP stocks Bearish MINCP Stocks (4/1/2014) Bullish plurality
--> 81 New Highs on NASDAQ
13 new lows. Bullish plurality
--> 115 New Highs on NYSE 3 new
lows. Bullish
plurality
Highest Power Ranked Stocks/ETFs at Start of 2nd Quarter
Leveraged ETFS - UWM AI/200=155 IP21 = .299 65-day Opening Power
100% 65-Closing Power 42.2% New red Buy.
SOXL NH...
AI/200=141 IP21 = .12 65-day Opening Power 100% 65-Closing Power
75.7% on red Buy.
DJI-30 - UTX has highest AI/200 but IPA%-Pr% is -35 making it
ineligible to be a Tahiti stock.
SP-500 - HP AI/200-176 98.42

-------------------------------------------------------------------------------------------------------------------
3/30/2014
No New Sell. STAND-OFF. More backing
and filling
by the DJI between 16000 and 16600 seem likely.
Peerless Key Values
Date
LA/MA ANN.ROC
P-I
P-I ch
IP21
V-I
OPct
65-day Pct Change
3/31/2013 1.009 .099
+154
+47 -.109 -29
-.211 .006
--> To Key Index and Leading Stock Charts: DJI, SP-500, etc.
DJI Chart SPY Chart NASDAQ Chart IBB
Chart IWM Chart
The blue-chip DJI-30 will not easily top out when interest rates are so low.
The stock market really likes the new Fed Chairwoman. It's easy to see
why. Low interest rates are expected for a long time. The
FED, she explained, was
in
agreement that there was way too much "slack" in
the economy. The official
Unemployment
rate significantly overstates the present recovery. Consumer buying
needs
encouragement. As a result, inflation was not expected. She avoided
talking about stock bubbles.
The market's bullish April seasonality (DJI rises in 71% of Aprils since 1965)
will help, too. Last Friday's and today's excellent Breadth are impressive.
Dividend
stocks are favored. They are taking away the leadership from the NASDAQ,
apart from chip-makers. Good breadth can overcome the NASDAQ
head/shoulders
and the BioTech breakdown.
Is Trading Volume Really This Low?
The lack of up-volume could be a problem, however, if a breakout above 16600 is
attempted. Breakouts can be manipulated using Opening Price jumps. But it
takes volume to make prices continue to rise. 100-point higher openings can also be
staged to bring a relief rally, as when Yellen is expected to chirp her dovish
message.
But what will happen when she is not on stage? Worse, what would happen when
Professionals decide to rig or over-extend and exploit a bear market?
Why is reported volume so low? Because many institutional trades are now sent to the
murky "black
pool" operators who do not have to report trading or follow any regulations.
See the lengthy piece in the New York Times on Flash Trading and "black pool"
operators. Real trading volume is much higher. Including "dark
pool" trading
would require including nano-second flash trading numbers. This would make
a revised volume figure quite useless. (Better to tax such trading away and continue
to use NYSE numbers. If Obama could break away from his role as puppet to
Wall Street, we might actually see reform here.)
So there could be a DJI breakout past 16600. In fact, flat DJI tops usually
beckon for a price breakout. But we will need to see an increase in volume
and breadth will need to be positive to avoid a reversing Sell. If breadth
deteriorates,
a price breakout past 16600 to the upper 2.5% band will likely bring a Peerless Sell
and a dangerous false breakout.
Breadth is still the key. If the excellent breadth continues on the breakout, an
early
April Sell can be prevented.
Our Stocks' Hotline added a few more Bullish MAXCPs and closed a few of
the Bearish MINCPs. But it remains essentially hedged.
There were some
attractive high volume, high Accumulation breakouts tonight. If all is well,
they should move higher. If they quickly fall back below their breakout point,
it will be a sign that breakouts now are bearish traps. We will watch them
and report what we see.


The
negative V-Indicator and very weak Hourly OBV are warnings that
a DJI breakout past 16600 will probably not rise past the upper band.

But first we may see such a breakout. That is the significance of the
"expanded Buy B9". It is also the conclusion I reach based on the
discovery a few years ago that negative V-I non-confirmations (S9Vs)
are not reliable until late April or May. In other words, the Bullish
seasonality of April ordinarily trumps low volume. April can produce
Sell S12s and S15s 2.5% over the 21-day ma where the P-Indicator is
not too positive. (More on this tomorrow night.)
--> 53 +18 MAXCP stocks Bullish MAXCP Stocks (3/302014)
--> 110 -81 MINCP stocks Bearish MINCP Stocks (3/30/2014) Bearish plurality
--> 46 New Highs on NASDAQ
8 new lows. Bearish plurality
--> 88
New Highs on NYSE 6 new
lows. Bullish
plurality
April Peerless Sells in Bull Markets
With
our P-Indicator positive now, I have highlighted in blue
the past
non-Sell S9s where the P-Indicator was positive and
the volume
indicators were mostly negative (3 of 3 or 2 of 3).
19290418 S9 311.9 .059
19290426 S9 314.2 .066
19290430 S12 319.3 .081
LA/MA ANN.ROC
P-I
IP21 V-I
OPct
65-day Change
1.036 .732 -3 -.038 -216 .066
.031 8.1% gain
19360401 S15 158.9 .058
1.010 .206 -40 -.097 -265 .063 .111
4.9% gain 3% paper loss
19360402 S9 160.4 .067
19360402 S1 160.4 .067
1.026 .282 -27 -.089 -231 .047 .113
19510430 S9 259.1 .064
1.024 .50 16
.179 -23 .363 .0619530423 S10 270.7 .027 Support Failure
19560404 S5 518.7 .079
LA/MA ANN.ROC
P-I
IP21 V-I
OPct
65-day Change
1.024 .636
39 .144 -79 .468 .062
19560409 S2 518.5 .079
LA/MA ANN.ROC
P-I
IP21 V-I
OPct
65-day Change
1.016 .61
12 .109 -147 .455 .071
19620409 S10 692.9 .131 Support Failure
19670424 S12 887.53 .015
LA/MA ANN.ROC
P-I
IP21 V-I
OPct
65-day Change
1.026 .15
33 -.02 1
.19 .048
19670427 S3 894.82 .027
LA/MA ANN.ROC
P-I
IP21 V-I
OPct
65-day Change
1.032 .326
45 .05 3
.284 .055
19690430 S9 950.18 .175
LA/MA ANN.ROC
P-I
IP21 V-I
OPct
65-day Change
1.025 .189 -30 .083 -1 .219
.01
19720406 S15 959.44 .025
LA/MA ANN.ROC
P-I
IP21 V-I
OPct
65-day Change
1.02 .159
-70 .036 -1 -.09 .075
19720412 S9 966.96 .033
1.023 .403 -2 .087 0
.246 .064
19720418 S7 968.92 .035
LA/MA ANN.ROC
P-I
IP21 V-I
OPct
65-day Change
1.019 .327 -20 .054
-1 .155 .068
19760421 S15/S7 1011.02 .05
LA/MA ANN.ROC
P-I
IP21 V-I
OPct
65-day Change
1.019
.345 -1 .038
-1 .074 .071
19810424 S15/S7 1020.35 .046
LA/MA ANN.ROC
P-I
IP21 V-I
OPct
65-day Change
1.018 .061
1
-.012 -1 .114 .078
19860429 S19 1825.89 .028
19870406 S9 2405.54 .063
19920415 S9 3353.76 .03
LA/MA ANN.ROC
P-I
IP21 V-I
OPct
65-day Change
1.03
.358 =56 /-49 =11 .249 .033
19920421 S5 3348.61 .028
19970422 S9 6833.59 -.049
19980422 S15 9176.72 .168
LA/MA ANN.ROC
P-I
IP21 V-I
OPct
65-day Change
1.021 .478
17 .057 -8 .053
.183
20000425 S2 11124.82 .049
LA/MA ANN.ROC
P-I
IP21 V-I
OPct
65-day Change
1.015 .013 -25 -.034 -43 -.096 -.012
20040405 S12 10558.37 .056
Close Parallel.
LA/MA ANN.ROC
P-I
IP21 V-I
OPct
65-day Change
1.027 -.043
24 -.069 -145 -.152
.009
20080402 S9 12608.92 .097
20080421 S4 12825.02 .112
LA/MA ANN.ROC
P-I
IP21 V-I
OPct
65-day Change
1.024 .442
281 .027 4 -.012 .028
20100416 S11 11018.66 .086
LA/MA ANN.ROC
P-I
IP21 V-I
OPct
65-day Change
1.009 .311
185 .061 -65 .304 .036 |
-------------------------------------------------------------------------------------------------------------------
OLDER HOTLINES
-------------------------------------------------------------------------------------------------------------------
3/27/2014 Friday was a good day
for the market. There were 1300 more up
than down on the NYSE. The weekly NYSE A/D Line
made a new all-time high,
far ahead of the DJI and the other indexes. Good breadth like this goes
a long way among dividend plays to counteract the unusual weakness
in leading biotechs. So, the DJI's trading range between 16000 and 16600
should persist, though we should keep an eye on the big bank stocks, Visa and MA.
These will probably tell us when the DJI is going to become weak enough
to take out the 16000 support.
The ETFs are not safe yet. With the Closing Powers still falling for
DIA, SPY, QQQ, TNA and IWM, it's probably not safe to buy these yet.
The NASDAQ's head/shoulder is fair warning and the very
negative NASDJI
reading is too bearish for the present to fight.
In this environment, it is much safer to buy when the Closing Power downtrend
has been broken and the current Accumulation Index (IP21) is positive.
See this in the BBH charts since 2000.

Buyers might consider some of most bullish oil/gas and drilling stocks. They
are over-represented among the Bullish MAXCP stocks: HP (Helmerich Payne),
PHX (Panhandle Oil/Gas) and SGY (Stome Energy). Our Stocks' Hotline will
stay hedged with some of the most heavily distributed Bearish
MINCP stocks.

--> To
Key Index and Leading Stock Charts: DJI, SP-500, etc.
DJI Chart SPY Chart NASDAQ Chart IBB
Chart IWM Chart
--> 35 +10 MAXCP stocks Bullish MAXCP Stocks (3/282014)
--> 191 -78 MINCP stocks Bearish MINCP Stocks (3/28/2014) Bearish plurality
--> 11
New Highs on NASDAQ
24 new lows. Bearish plurality
--> 36
New Highs on NYSE 6 new
lows. Bullish
plurality
The Biotech Collapse
What
makes the current decline of so much concern is how far up Biotechs leaders
have
risen without the benefit of Professional Buying, as would normally be represented
by a
rising Closing Power. See how awful and ugly are the now entirely red
candle-stick charts of such leaders in the group as PCYC and GILD. When the
Public keeps buying on up-openings and prices then sell off all day, it is because
of
heavy Professional selling. In my Closing Power book I have shown that this
is
exactly how the first declines from a major top normally behave. The public
does
not perceive that a top has been made. They keep buying on dips because
they
have been conditioned to think that all dips are buying opportunities.


How much more will Biotechs decline?
Biotechs: A 50% decline has precedent.
Wait to Buy until the CP downtrend is broken and IP21>0
In March 2000, a biotech bubble broke. BBH (a broad-based ETF for biotechs)
promptly fell 50% and then rose 60% from its bottom.
New research on BBH since 2000 shows that over and over, the easiest way to
have spotted the impending collapse in prices was to have acted as soon
as the over-extended CP uptrend-line was broken and stayed short or away
from BBH until the CP downtrend was broken and the Tiger Accumulation
turned positive. See BBH Charts:
2000-2014.
Biotech 2000
Top

Why is it happening?
ObamaCare has made the Federal Government responsible for some
very expensive health care, as it subsidizes lower income, working
people's health insurance costs. The new treatments that some of the
biggest biotechs now offer are very expensive. Some
in Congress are
suggesting
GILD's billionaire CEO is over-charging for his company's
new
hepatitis treatment. GILD's very effective treatment for hepatitis
now costs $1,000/day. The US has no laws under Medicare or Medicaid
to negotiate drug prices. In Europe, governments do negotiate the prices
for drugs. In Europe, prices are 25% to 50% less. This has not be widely
publicized by the US corporate media. But these costs are so high, the issues they
present seem unavoidable. On the other hand, Republicans will not agree
to "socialistic" price-fixing. And Rep. Henry Waxman, the leading Democrat
in the field of drug regulations, will retire in 2015. So, why are insiders
and professionals selling? (PCYC
insiders have sold 144,000 shares in the
last
30 days.)
=============================================================================
3/27/2014 Peerless has given no
Sell Signal. The DJI's neckline at
16000
has not even been challenged on this decline. So, a breakout above
16600
would still seem to be quite likely in the next few months. For
now
Closing Powers are very weak. Professionals still expect lower prices
as a
result of the completed head/shoulders patterns. Watch AMZN, BA
and MA to see if they can hold up at support and Professionals switch
to
buying mode with them. This should help us call a bottom to the present
decline.
If we
trust the Peerless finding in Table 1 below that 15 of the 21 major
tops
since 1928 occurred only after there had been a bearish NYSE A/D Line
divergence for a minimum of 4+ months from a DJI making new highs,
then
we should still believe the DJI's uptrend is probably not over and
we
will see more new DJI new highs this year. Of course, at that point the
other
indexes may lag and fail to confirm such DJI new highs. That is the type
of
major divergence that usually kills bull markets.
Still the current decline
is likely to continue a while longer.
These
head/shoulders patterns have formed for some good reason (though
it is
not obvious yet what that reason is). Professional selling is now quite
pronounced. They are usually right, especially when the 65-dma averages
are
broken.
Since
1965, the DJI has risen 70.1% of the time over the next month. Even
when
January is weak, since 1965 the DJI has risen more than 70% of the time
in
April. It is, however, up only 42.6% of the time over the 2 trading days
following March 27th.
Expect more weakness in the NASDAQ, QQQ
and IWM. Their Closing Powers are
still
in downtrends. Their head/shoulders patterns have not yet fallen enough
to
fulfill their patterns' minimum objectives. So, I would prefer to give
the market
a
little more time to correct itself. After all, it has been rising for more
than 5 years,
so
there are a lot of profits that a decline now can coax folks to take. Head and
shoulders
patterns in the NASDAQ which see their necklines and 65-dma taken out almost always
see
bigger declines than we have seen so far. See how the
NASDAQ has
topped out since 1972
STOCKS TO WATCH NOW
Below
are some three key stocks to watch. See if they can hold at the support
levels that they are now testing. Professionals have been selling a lot of shares
to
the public in recent weeks in these. But we know that Professionals are fickle.
They
often change their mind very quickly when they sense a rally is coming.
Breaks in the Closing Power downtrends of these stocks should tell us when a
general market rally is coming.
--> 25 MAXCP stocks Bullish MAXCP Stocks (3/272014)
--> 268 MINCP stocks Bearish MINCP Stocks (3/27/2014) Bearish plurality
--> 10
New Highs on NASDAQ
33 new lows. Bearish plurality
--> 22
New Highs on NYSE 15 new lows. Bullish plurality
| Table 1 Tops before DJI Declines of More Than 20%: 1928-2014
(C) 2014 William Schmidt, Ph.D. www.tigersoft.com
See www.tigersoft.com/Intro materials
for new Peerless book.
Length of A/D Resulting Bear Market
Divergence
---------------------------------------------------------------------------------------------------------
1 7 months 1929-1932
9/3/1929-7/8/1932 (35 months) 381.2 to 41.2
9/3/1929-2/27/1933
381.2 to 98.1
Sells at top: Sell S7,S12, S9
4/30/1969: la/ma 1.051, P=
-14, IP21 =-.126, V= -351 Opct= + .146, 65-day
pct ch= .281
---------------------------------------------------------------------------------------------------------
2
6 months
1937-1938 8/13/1937-
3/31/1938 (7 months) 189.3-98.9
Sells at top: Sell S4,S7,S9,S8
8/13/1937: la/ma 1.024, P= -2 , IP21 = .042, V=
-43, Opct=+.279, 65-day pct ch= .099
---------------------------------------------------------------------------------------------------------
3 8 months
1939
11/9/1939 - 4/11/1939 ( months) 158.1- 123.8
No Sell at top:
Later S16 12/30/1939 - 4/11/1939
154.4-123.8
and later still: S12, S3
12/30/1939: la/ma 1.029, P= --4 , IP21 = .046, V= 0, Opct=- .28, 65-day pct ch= .151
----------------------------------------------------------------------------------------------------------
4 8 months
1939-1942
9/12/1939-4/28/1942 (31 months) 155.9-92.9
Sell at top: Sell S9...later S16, S1
9/13/1937: la/ma 1.095, P= -43 , IP21 = .138, V=+56, Opct=+.326, 65-day pct ch= .107
---------------------------------------------------------------------------------------------------------
5 None
1946
5/29/1946-10/9/1946 (5 months) 212.5-163.1
H/S
Sell S5,S4
529/1946: la/ma 1.029, P= +64 , IP21 = .269, V=+43, Opct= +.375, 65-day pct ch=
.142
----------------------------------------------------------------------------------------------------------
6 16 months
1957
7/12/1957- 10/22/1957
520.8-419.8
Sell S7, S9, S4
7/12/1957: la/ma 1.022, P= -40, IP21 = .062, V=
-214,
Opct=- .248, 65-day pct ch= .078
----------------------------------------------------------------------------------------------------------------------------
7 8 months 1960
1/5/1960 - 10/25/1960
685.5 - 566.0
Sell S12, S16, S15, S1
7/12/1957: la/ma 1.018, P= +4, IP21
=-.038, V= -170, Opct=+ .099, 65-day pct ch= .085
----------------------------------------------------------------------------------------------------------------------------
8 5 months
1961-1962
11/16/1961-5/25/1962
734.3 - 536.7
Early S9, S16 (nearly perfect)
8/3/1961: la/ma 1.025, P= +34, IP21 =- .042, V=
+6, Opct= + .378, 65-day pct ch= .058
-----------------------------------------------------------------------------------------------------------------------------
9 22 days
1966
2/9/1966-10/7/1967
995.15-744.32
Sell S4, S12
1/6/1966: la/ma 1.025, P= +34, IP21 =- .042, V=
+6, Opct= + .378, 65-day pct ch= .058
-----------------------------------------------------------------------------------------------------------------------------
10 none at top
1968-1970 12/3/1969-5/26/1970
985.21 - 631.16
Sell S1
4 months 1969-1970
5/14/1969-5/26/1970
968.85 - 631.16
Sell S9,
S3
4/30/1969: la/ma 1.025, P= -30, IP21 =+ .083, V= -1, Opct= +
.219, 65-day pct ch= .01
----------------------------------------------------------------------------------------------------------------------------
11 7 months
1972-1973
1/11/1973 -
12/6/1974
1051.7 - 577.6
Sell S1, S9, S4, S12
1/11/1973: la/ma 1.024, P= -96, IP21 =+ .002, V= -2, Opct= +
.059, 65-day pct ch= .117
----------------------------------------------------------------------------------------------------------------------------
12
none
1976-1978
9/21/1976 - 2/28/1978
1014.79 - 742.12
Sell S1, S4, S16
9/21/1977: la/ma 1.033, P= +178, IP21 =+.181, V= +2, Opct= + .18,
65-day pct ch= .012
---------------------------------------------------------------------------------------------------------------------------
13
6 months 1980
2/13/1980 -
3/27/1980 903.84 -
759.98
Sell S4, S9, S15
2/13/1980: la/ma 1.028, P= -26, IP21 =- .01, V= -1, Opct= +
.212, 65-day pct ch= .12
----------------------------------------------------------------------------------------------------------------------------
14
7 months 1981-1982
4/27/1981 - 8/11/1982
1024.05 - 777.21
Earlier S9s, Sell S4, S7, S15
4/27/1981: la/ma 1.02, P= +11, IP21 =+.026, V= 0, Opct= + .217, 65-day pct ch=
.098
---------------------------------------------------------------------------------------------------------------------------
15
7 months 1984
1/9/1984 - 7/24/1984
1286.22 - 1086.57
Sell S4, S12
1/9/1984: la/ma 1.021, P= +36, IP21
=+.007, V=-1, Opct= - .169, 65-day pct ch= .04
--------------------------------------------------------------------------------------------------------------------------
16
5 months 1987
8/25/1987-10/19/1987
2722.42 - 1738.74
Sell S4
Later S8, S9, S12 10/2/1987-10/19/1987
2640.99 - 1738.74
10/2/1987: la/ma 1.026, P= -56, IP21 =- .017, V= -7, Opct= +
.072, 65-day pct ch= .095
----------------------------------------------------------------------------------------------------------------------------
17
7 months 1990
7/17/1990-
10/11/1990 2999.75
- 2365.1
Sell S9,
S8, S5
7/17/1990: la/ma 1.032, P= -1, IP21 =+ .024, V= -4, Opct= +
.414, 65-day pct ch= .09
---------------------------------------------------------------------------------------------------------------------------
18
4 months 1998
7/17/1998 - 8/31/1998
9337.97 - 7539.07
Sell S9, S12
7/8/1998: la/ma 1.03, P=+2, IP21 =- .025, V= -17, Opct= +
.061, 65-day pct ch= .021
---------------------------------------------------------------------------------------------------------------------------
19 18 months
2000-2003
1/14/2000 - 3/11/2003
11722.98 - 7286.27 (10/9/02)
Sell S9, S12. S15, S4
1/7/2000: la/ma 1.021, P=-23, IP21 =- .028, V= -59, Opct= +
.356, 65-day pct ch= .088
----------------------------------------------------------------------------------------------------------------------------
20
4 months 2007-2009
10/9/2007 -
3/9/2009
11722.98 - 6547.05
Earlier Sell S9 and S5; concurrent S2, S4
7/19/2000: la/ma 1.028, P=-51, IP21 =+ .024, V= -131, Opct= +
.054, 65-day pct ch= .096
----------------------------------------------------------------------------------------------------------------------------
21
none
2011
5/2/2011 - 10/3/2011
12807.36 - 10655.3
Sell S5, S8, S9V
5/2/2010: la/ma 1.028, P=+212,
IP21 =+ .147, V= -17, Opct= + .349, 65-day pct ch= .068
Later S9V
7/21/2010: la/ma 1.025, P=+269, IP21 =+. 085, V= -51, Opct= +
.005, 65-day pct ch= .042
---------------------------------------------------------------------------------------------------------------------------- |
Table
2
Is April Still Bullish When January
Is Weak?
Instead of rallying 70.2% of the time in all Januarys
since 1965, when January saw the DJI down more than 4%,
the DJI rallied 71.4% of the time in April.
I should add that if we include the period between 1928 and 1965,
Aprils were up only 50% of the time when Januarys fell more than
4%,
2/31 1/31
Change 3/31
4/30 Pct
Change
-----------------------------------------------------------------------------
2011 16576.66 15698.85 5.2%
?
?
2009 8776.39 8000.86 8.8%
7608.92 8168.15 rose
7.3%
2008 13264.82 12650.36 4.6% 12262.89
12820.13 rose 4.5%
2000 11497.12 10940.53 4.8% 10921.92
10733.91 fell 1.7%
1990 2753.20 2590.54 5.9%
2707.21 2656.76 fell 2.9%
1978 831.17 769.92 7.4%
757.36 837.32
rose 10.6%
1977 1004.65 957.53 4.7%
919.13 926.9
rose 0.8%
1970 800.36 744.06 7.0%
705.57 733.63
rose 4.0%
1960 679.3 622.6 8.3%
616.6 601.7
fell 2.4%
1941 131.1 124.1 5.3%
122.7 115.5
fell 5.9%
1939 154.4 143.8 6.9%
131.8 128.4
fell 2.6% |
=============================================================================
3/26/2014 Professionals
hurried to the exits today as the NASDAQ,
QQQ
and IWM completed bearish head/shoulders patterns. Wait for the
Closing Power downtrend to end before doing any buying. Hold
your short
sales
and sell MAXCP stocks that see breaks in their Closing Power uptrends
and
now their 65-dma.
"Something Wicked This Way Comes"
The
quick formation of these head/shoulders patterns is telegraphing that
there
is some seriously bearish news coming which the market is hastily
adjusting to. It could be from the Fed. It could be from weak
Citibank.
It
could be from pressures within Eastern Ukraine to break away from
Western Ukraine. It could be that economic sanctions will worsen and
some
big companies in unexpected ways. It could be Western
Europe's austerity programs in Spain, Greece and Italy will lead to
a
breakup in the EEC. Official unemployment is 26.7% in Spain,
27.3%
in Greece, 15.3% in Portugal and 12.5% in Italy. It could be
the Brezinski-Obama-Clinton
grand plan to isolate, surround
and
fragment Russia will be openly challenged by Socialist parties in Western
Europe, as it has already by the German
SPD. It could be a new economic
Bloc
will be formed, including Russia, China, Brazil... to challenge the
American-Western European economic bloc. It could be a number of
very
big market players are taking large short positions and the market
is
spooked by this. Who knows? I don't know. But something bearish
is
coming closer. That is why these head and shoulders patterns have appeared.
Beyond this, don't underestimate these patterns' self-fulfilling bearish effects.
The
previous good breadth and low interest rates could not prevent, A
the
NASDAQ, QQQ and IWM from completing bearish head and shoulders
patterns today. They now present lower downside objectives. (See their charts
below.)
I
would expect the DJI to hold up here and not crack below its 16000 support.
Avoid
being fooled by Opening strength. There is probably more downside
risk
at that point than upside potential. That is what the Tiger Day Traders'
Tool
shows even in the DIA chart.

--> To Key Index and Leading Stock Charts: DJI, SP-500, etc.
DJI Chart SPY Chart NASDAQ Chart IBB
Chart IWM Chart
--> 19 -13 MAXCP stocks Bullish MAXCP Stocks (none - 3/26/2014)
--> 286 +106 MINCP stocks Bearish MINCP Stocks (3/26/2014) Bearish plurality
--> 18
New Highs on NASDAQ 28 new lows. Bearish plurality
--> 23
New Highs on NYSE 21 new lows. Bullish plurality
The
DJI is doing its best to hold up the appearance that all is still well with
the
60-month year old bear market. Many bull markets end with the DJI being
the
last index to make a new high. In fact, it is often the failure of the other indexes
and
breadth indicators to make an accompanying new high that brings the final
Peerless Sell S9.
This
allows the trajectory and momentum of the individual indexes like the NASDAQ's
to
separate from the DJI's. So, we must not only watch for DJI head and shoulders'
patterns, but also those by the NASDAQ and the other indexes. They are independently
important and should be heeded, especially with the markets now offering so much
that
could be retraced. You can see this in tonight's study of how
the NASDAQ has
topped out since 1972. The NASDAQ has just completed a
head and shoulders pattern
with
its index closing below the 65-dma. In addition, the RELDJI and IP21 are negative.
The
21-day/65-day momentum is falling, as would be expected here.
Look
next at QQQ and IWM below. The Closing Powers are falling rapidly while the
Opening Powers remain in uptrends. This is bearish. It is what one would
expect
at a
significant market top. The Public thinks that each new decline represents
a
good buying opportunity. Professionals take advantage of that notion and distribute
on
weakness as bull markets end.
As in
March-April 2000, leading biotechs are breaking down. But the NASDAQ
Biotech ETF, IBB, now has not yet broken below its January lows or their 9-month uptrend.
I
think this is the key support we will now need to watch.
If we
take the "expanded Buy B9" as the operative Buy signal, we should see the
DJI
hold steady here as it prepares for an April rally to new highs. If the
"expanded
Buy
B9" was nothing more than a signal to cover shorts, then the DJI will follow
the
other averages to new lows for 2014. My judgement now is that we should
stick
with the rising 12-month NYSE A/D Line uptrend. Most bear markets cannot
start
until there has been a more or more lag by the A/D Line or the DJI.
=============================================================================
OLDER HOTLINES
=============================================================================
3/25/2014 Still no reversing Peerless Sell. Al DJI breakout early next month
past 16630
would be in keeping April's bullish seasonality and with the DJI's
long
tradition of being the "last man standing", i.e. the last major Index to top
out.
Continue to watch the NASDAQ, QQQ and IWM to see if they break down below
the
necklines in their emerging head/shoulders. That would be bearish, at least,
short-term,
until they fulfilled their downside price objectives.

Meanwhile,
we are apt see more backing and filling. Hedging seems prudent
given the
potential of QQQ and the NASDAQ for completing bearish head and
shoulders'
patterns. Watch them closely, they are are the key
support of
nested
necklines and their 65-dma. Stop sells will play a big short-term role
if they
break downward.


The DJI is
making the market look stronger than it really is. The DJI's jump of
91 was less
impressive than it appeared, at first. Half the gain owed to a single component,
IBM, which jumped up to its upper band with a negative
Accumulation index.
The NASDAQ and QQQ were not able
to rally enough to void their emerging head/shoulders patterns.
It is not
just the high priced biotechs which are in trouble. A number of leading high priced
stocks
(therefore
institutional favorites fell today: NFLX (-8.06 today), MSTR (-2.4 today),
PCLN (
-4.25 today with completed head/shoulders), V (-2.35 and
at neckline
of
head/shoulders) and MA(-2.12 with a now falling 65-dma.)
The Closing
Powers of DIA, QQQ, SPY, IWM, FAS and TNA are all falling.
Professionals
are selling
to overseas and public buyers. That there are so many more MINCP
stocks
than MAXCP stocks, convinces me we must remain hedged.
Even if the
DJI were to breakout above 16600, the breakout rally might
be quite
limited,
With both the P-I and Accumulation in downtrends, it could bring a major
Sell if the
DJI were to approach the upper band.
My
judgement is that the market needs to do some more backing and filling.
Note how
bullish the seasonality since 1965 has been for the DJI starting on March 28th;
10-trading days after March 28th, DJI is up 1% on average
21-trading days after March 28th, DJI is up 70.2% of the time and averages +2.1%
gain.
--> To
Key Index and Leading Stock Charts: DJI, SP-500, etc.
DJI Chart SPY Chart NASDAQ Chart IBB
Chart IWM Chart
--> 32 +7 MAXCP stocks Bullish MAXCP Stocks (3/25/2014)
--> 180 +7 MINCP stocks Bearish MINCP Stocks (3/25/2014) Bearish plurality
--> 17 +11 New Highs on NASDAQ 12 -12 new lows. Bullish plurality
--> 46
+28 New Highs on NYSE 7=8 new lows. Bullish plurality
=============================================================================
3/24/2014 Beware of Completed Head/Shoulders Patterns in QQQ or
the NASDAQ.
These typically lead to ruptures of the 65-dma and long
price
uptrends, which then sets off another round of selling. The DJI is still
expected,
however, to consolidate between 16000 and 16600 for the next two weeks.
The heavy
red Distribution in the DJI chart shows how much resistance there is overhead
now.
If the DJI cannot rally, it will probably retreat, too. But the DJI is starting to
assume its
"proper" role as the blue chip index: it is holding up the appearance of market
strength
even as the
A/D Line weakens and other indexes turn weak. JPM in
the DJIA
even made a
new high today.
Be careful,
the declining ETFs' Closing Powers are warnings that we must
not be
fooled into buying on early strength. It is apt to give way to another wave
of selling.
See further below how the Tiger Day Traders' Tool for IWM is
showing how
much more weakness there is now after the opening than strength.

QQQ/NASDAQ Head/Shoulders?
We need to watch
the to see if the neckline of QQQ and the NASDAQ are broken
tomorrow.
The considerable weakness in the Biotechs Friday and
today make
these Tech
indexes particularly vulnerable if their neckline-supports give way.
The real
danger is that they will break their year-long price uptrends. With the
markets
generally having risen for 5 years, there are a lot of profits that will be
taken very
quickly and clumsily without regard to price concessions if the long
price
uptrend is broken. In April 2000, it was the breakdown of the tech leaders
of the day
then that started the long sell-offs in the over-extended QQQ and
NASDAQ.
So far, QQQ and the NASDAQ are still above these uptrendlines.
If they do
breakdown, reduce the number of long MAXCP stocks you hold.
Our Stocks'
Hotline has already shorted many of the weakest MINCP and
biotechs.
Hedging with shorts will very much help us if the broader market
turns
weaker, while the DJI does what it does best at the end of a bull market,
namely
maintain the appearance that "all is well" and that "all dips are buying
opportunities". We must use head/shoulders
patterns to supplement Peerless
automatic signals and watching
for NYSE A/D Line non-confirmations.
Sometimes a
tops are quickly formed because of unexpected events. We must
respect
them. They occur when the market must rapidly adjust to bearish
news, such
as an invasion, an attack, a massive oil spill, a Presidential heart attack,
an
impending assassination or the President suddenly pursues a dramatic change
in economic
policy.
http://www.tigersoftware.com/TigerBlogs/June-28-2009/index.html
http://www.tigersoft.com/PeerInst-2012-2013/HS-SellS10/index.html

--> To
Key Index and Leading Stock Charts: DJI, SP-500, etc.
DJI Chart SPY Chart NASDAQ Chart IBB
Chart IWM Chart
--> 25 -108 MAXCP stocks Bullish MAXCP Stocks (3/24/2014)
--> 173 +53 MINCP stocks Bearish MINCP Stocks (3/24/2014) Bearish plurality
--> 6 -50 New Highs on NASDAQ 24 +7 new lows. Bearish plurality
--> 18
-45 New Highs on NYSE 15 +2 new
lows. Bearish plurality
 
|
=============================================================================
OLDER HOTINES
=============================================================================
3/21/2014 The
"Expanded Buy B9" has not been reversed,
but more
consolidation is very likely.
--> To
Key Index and Leading Stock Charts: DJI, SP-500, etc.
DJI Chart SPY Chart NASDAQ Chart IBB
Chart IWM Chart
--> 133 -19 MAXCP stocks Bullish MAXCP Stocks (3/21/2014) Bullish plurality
--> 120 +50 MINCP stocks Bearish MINCP Stocks (3/21/2014)
--> 56 -36 New Highs on NASDAQ 17 +7 new lows. Bullish plurality
--> 63
+3 New Highs on NYSE 13 -1 new
lows. Bullish
plurality
Options
Expiration Day, biotech dumping and fears of what an
economic
war with Russia all worked to turn the DJI down sharply
from its
early advance up to the well-tested resistance at 16450-16500.
There was
no Peerless Sell, but the negative Accumulation
should
prevent a breakout a while longer. Seasonality does not turn
turn
bullish for another week or two. The Biotech Index BBH
is at key
support.
Without biotech leadership, the NASDAQ will be more
vulnerable,
though some
of the money coming out of the high fliers there may continue
to go into
low-priced stocks. This normally occur late in a bull market.
At 60+
months, our bull market ranks among the best in history. As long
as the DJI
does not complete a head/shoulders pattern, the uptrending
NYSE A/D Line should prevent a big sell-off. In that
connection, we still
have to
watch the QQQ. Its price pattern still has that
potential.

Assuming
Putin and Obama are rational, the new economic "cold war" will
be
carefully contained. Putin has to make Russia's financial and business elites
happy, too.
We will want to watch V and MA to see when their Closing Powers
turn up.
Russia's ETF, RSX, did not make a new 12 month
low.
Our DJI statistics since 1965 show: the next month will probably see
the
DJI rally,
but more consolidation for the next two weeks. (Since March 21-April 20
shows DJI
is up +1.6% on average and rose 66% of the time, but over two weeks it
rose only
.2% on average and only 53.2% of the time.
Biotechs
broke down badly Friday. The Biotech Index BBH broke
below its 65-dma and now
shows red
distribution and a Closing Power at its yearly lows. More weakness and
profit-taking is likely among biotechs; that should hold back the QQQ
and NASDAQ.
Leaders in
the group like CELG, GILD and PCYC show this bearish pattern. Looking
for
head/shoulders patterns and recent heavy red Distribution I found some biotechs
that could
make very good short sales while their Closing Powers continue in downtrends.
CELG, CEMP, CLDX, CLVS, CURE, GILD, HALO, INCY, ISIS, JAZZ, MDVN,
NPSP, OSIR and PCYC. That
so many over-extended Biotech leaders look this bearish
is both a
warning and a short sale opportunity, I believe.

The DJI's hourly chart shows its trading range.

The Peerless internals are highlighted by a strongly uptrending A/D Line
which is counter-balanced by heavy red readings from our Accumulation Index.
In additon, (blue) up-day volume has been consistently lower than red (down-
day volume. The turning negative by the AI has worked out bearishly 4 of 5
times this past year despite a rising market and strong breadth. This type
of overhead selling is disconcerting and usually brings a decline back to
support. In the DJI this means 16000.


How important a predictor is
riple-witching Friday?
Where Did The DJI Go Next?
Septembers
are particularly bearish. Decembers are bullish.
Marches remain slightly bullish and Junes
are slightly bearish.
March
June
Septembert December
11 declines
14 declines
18 declines
9 declines
13 gains
12 gains 9 gains
16
gains
(Codes: "LxB = Lower x% band. "UB" = Upper Band, underlines = very
high volume).
March
June
September December
1987
LB
+10%
UB
LB
1988
LB
LB
+5% +9%
1989 brief,small
decline L 3% Band UB
UB
1990 L 3% Band
UB
-5%
LB
1991
UB
LB
L 3% Band +10%
1992 L 3% Band
U 3% Band
LB
L 2% Band
1993 L 3% Band
+5%
+10% +7%
1994
-7%
LB
LB
up steadily for a year+
1995
+10%
UB L 2% Band L 3% Band
1996
LB
LB
+10% +10%
1997
-6%
+5%
-10%
flat for a month
1998
+5%
UB
LB
+6%
1999
+12%
L 2% Band
-5%
+5%
2000
+6%
UB
-10%
UB
2001
+20%
LB
major bottom LB
2002 LB -20%
-8%
UB
2003 -5%
flat
U 3% Band +5%
2004
U 3% B LB
LB
+4%
2005
UB
L 2% Band L 2% Band
L 2% Band
2006 flat
for a month LB
+7% flat for a month
2007
+10%
UB
-10%
-10%
2008
UB
-8
-30%
-25%
2009 +20%
LB
L 3% Band flat for a month
2010
+5%
LB
+5%
+8
2011
UB
UB
LB
+10%
====
2012 LB
UB
-8%
L 2%
Band
====
====
2013 flat
for a month
UB
LB
UB
===========
====
===
=================================================================
11 declines
14 declines
18 declines
9 declines
13 gains
12 gains 9 gains
16
gains |
==================================================================================
OLDER HOTLINES
==================================================================================
3/20/2014 If news of a more hawkish Fed cannot bring about a
correction,
the market's bullishness must be respected. In addition,
today's DJI
rally makes it appear that the "expanded Buy B9" will
probably
not be reversed by the head/shoulders pattern in the DJI.
Hold IWM
and a mix of Bullish MAXCP stocks along with some of
the weakest
Bearish MINCP stocks. Coal
stocks fell sharply today
among the
bearish MINCP stocks. This illustrates the advtange of
hedging
particularly by shorting any group that is heavily represented
among the
bearish MINCP stocks. Bullishly, a number of semi-conductor
stocks like
ADEP, ADI and AMAT are now Bullish MAXCP
stocks.
--> To Key Index and Leading Stock
Charts: DJI, SP-500, etc.
DJI Chart
SPY
Chart NASDAQ Chart
IBB Chart
IWM Chart
--> 152 +49 MAXCP stocks Bullish MAXCP
Stocks (3/20/2014) Bullish
plurality
--> 70
-9 MINCP stocks Bearish MINCP Stocks (3/20/2014)
--> 92 +9 New Highs on NASDAQ 10 new lows. Bullish plurality
--> 60
-18 New Highs on NYSE 14 +9 new
lows. Bullish
plurality
Head/Shoulders? The DJI rallied 109 up to the apex of the right
shoulder in the
potential
head/shoulders pattern mentioned last night. The Hourly DJI chart
shows this
most precisely. Now an hourly reading much above 16360 would
destroy the
symmetry of the pattern and thereby render more impotent its
bearishness. Additional strength in the DJI will force shorts in the
general
market ETFs
to cover. The DJI would next be expected to challenge 16600.
and the
flat resistance there. Surprisingly, breadth was negative today. That
and the low
up-day and up-hour volume will work against a DJI breakout past
16000.
We will also want to watch to see if the other general market indexes'
key ETFs
can bullishly destroy their own head/shoulders pattern.
SPY's
Closing Power has broken its downtrendline. it closed at 187.75.
It seems
bound to make a nominal new low above 190. QQQ's Closing
Power has
not yet been pentrated. QQQ, now 90.29, will need to rise past
91.00 to
abort its Head/Shoulders. IWM shows the most underlying
Accumulation. Its Closing Power is bullishly angling up. But its rise
today
was
very small. It needs to surpass 10.5 to make a new high.
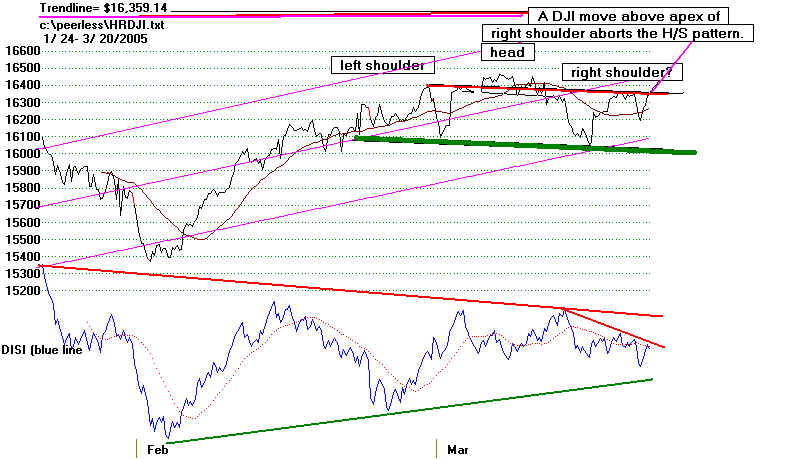
While a DJI
breakout above the flat overhead resistance seems unlikely
based on
the up-day volume being lower than down-day volume this year,
a valid
breakout to 16800 would then be headed for its minimum upside
objective
of 17800.
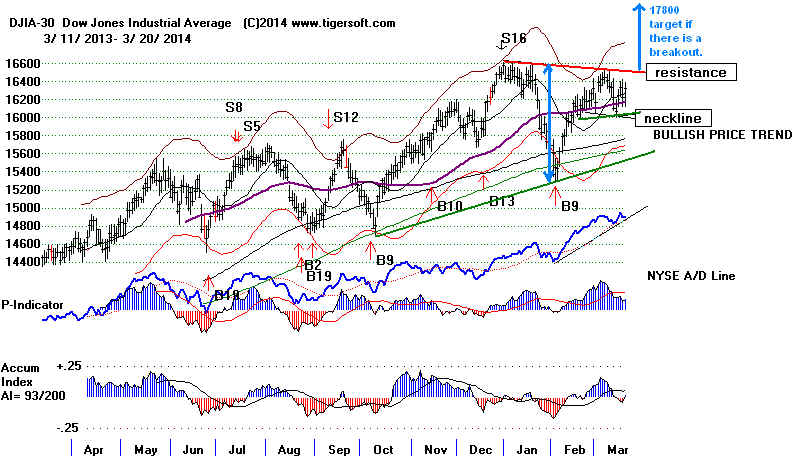
==================================================================================
OLDER HOTLINE
==================================================================================
3/19/2014 The DJI seems
locked in a narrow trading range: 16000-16600.
Small caps
are favored now. A bearish head/shoulders in the DJI must be watched
for.
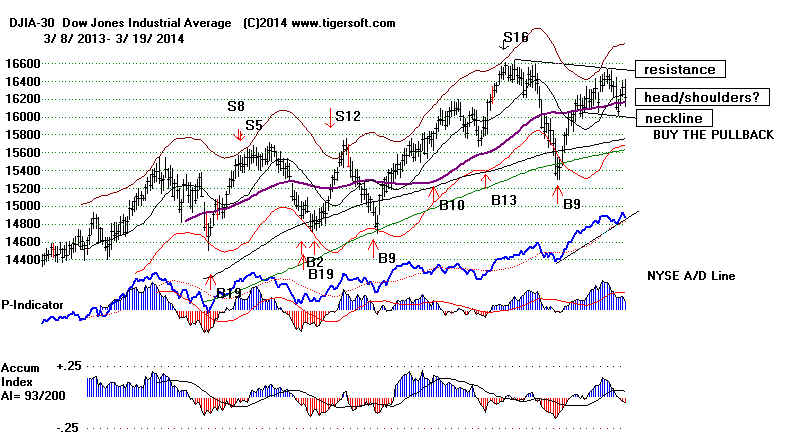
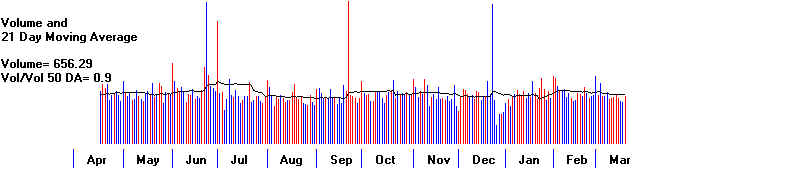
Stay
Hedged. The bearish scenario of a Head/Shoulder Pattern
got new
life today from a very cautious Janet Yellen today. (At one point, it almost seemed
that she
had the same scared look in her eyes that Hank Paulson showed in
October
2008.) She was no Wall Street cheer-leader today. Professionals
lnew in
advance. That was why the Closing Powers of DIA, SPY and QQQ
could not
break their recent downtrend.
No upside
breakout likely. Yellen badly disappointed the Bulls today. Now we have
to worry
about sudden head shoulders patterns suddenly appearing. This is the
way Wall
Street quickly re-adjusts to unexpected bearish news. There are many
examples of
this. This is an important part of Peerless. DJI head and shoulders
can and do
bring big market declines. We must heed a break in the DJI neckline
as a judged
Sell S10 if one occurs. A strong A/D Line helps deter such a bearish
development, but it cannot, by itself, prevent such a breakdown, especially
if there is
a sudden and unexpected change of economic policy. This is what
causes the
head/shoulders.
Usually,
such H/S Sell S10s involve invasions (North Korea-1950, Iraq-1990),
impending
attacks (Pearl Harbor-1941 and 9/11/2001) and impending assasinations
(JFK-1963)
heart attack (Eisenhower-1955). Berlin Blockade of 1948 is another
example.
Bearish
head/shoulders can also occur because of important economic developments
and policy
changes in DC (notably, Nixon's 1971
cessation of selling Gold
on demand
for Dollars), Truman's reluctance to quickly stop the many labor strikes
of 1946 and
British Petroleum's massive oil spill's threat to the Southern Gulf's
economy
and ecology. Another example: in early 1994, the Fed suddenly
boosted
short-term
rates. A quick head/shoulders appeared and the DJI dropped 10%.
Yellen
might today have taken the opportunity of speaking today to allay investor fears
that about
a stock market bubble. Instead, she
suggested interest rates might go
up
sooner than was expected. When pressed, she said the FED would probably
end QE-III
(Fed bond buying) completely in 6 months and start raising interest rates
6 months
later. This was not at the end of 2015, as Bernanke had previouly laid out
as the Fed
plan, or 2016 as has widely been assumed by Wall Street economists
going into
the meeting.
The Public
is still in a mood to speculate. High Accumulation, smaller stocks may
be the last
to top out. IWM's Closing Power is in an uptrend. Bearishly,
the CP of DIA, SPY and QQQ are falling. DIA is
the weakest. Note its negative
Accumulation Index, too.
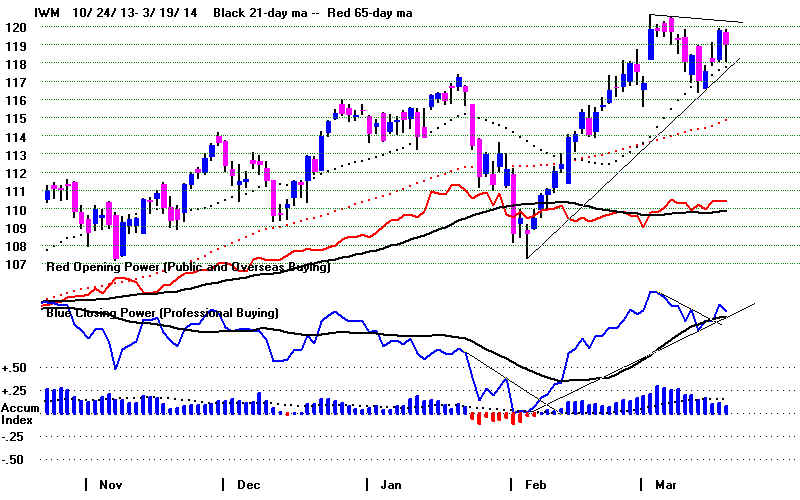
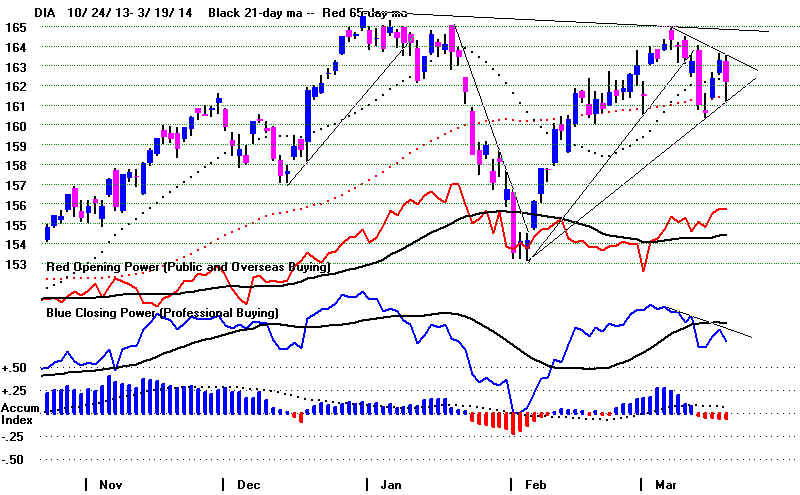
Our
Stocks' Hotline is hedged, long about the same number of Bullish MAXCPs
as it
is short Bearish MINCPs.
IMPORTANT. We see that the market becoming much riskier.
This is what one
must expect
after 5 years of a bull market without more than an 18% correction.
In this
context, consider hedging like our Stocks' Hotline is doing. In addition,
know when
Tiger advises selling individual stocks. See some examples here.
1) Closing Power non-confirmations followed by CP trend breaks.
2) Peerless Sells followed by CP trendbreaks.
3) Very big advances followed by high volume reversal days (big red popsicles)
4) Very big advances followed by CP trendbreaks.
5) Very big advances followed by OBV NCs, IP21 NNCs and CP trendbreaks.
6) Very big advances followed by head/shoulders patterns.
7) Very big advances followed by breaks of their 65-dma with IP21<0.
--> To Key Index and Leading Stock
Charts: DJI, SP-500, etc.
DJI Chart
SPY
Chart NASDAQ Chart
IBB Chart
IWM Chart
--> 103 -51 MAXCP stocks Bullish MAXCP
Stocks (3/19/2014) Bullish
plurality
--> 79
+52 MINCP stocks Bearish MINCP Stocks (3/19/2014)
--> 83 +8 New Highs on NASDAQ 10 new lows. Bullish plurality
--> 78
+27 New Highs on NYSE 5 -3 new
lows. Bullish
plurality
==================================================================================
OLDER HOTLINES http://tigersoftware.com/112211-H/index.htm
==================================================================================


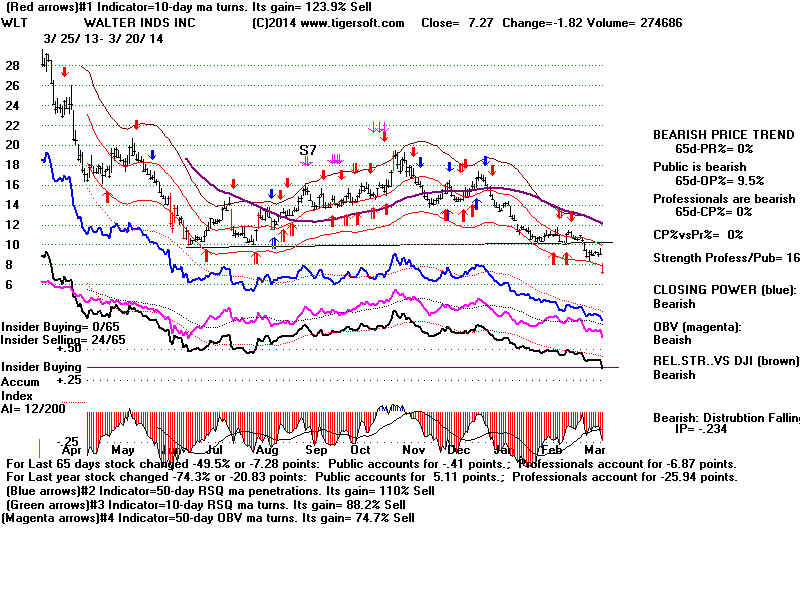
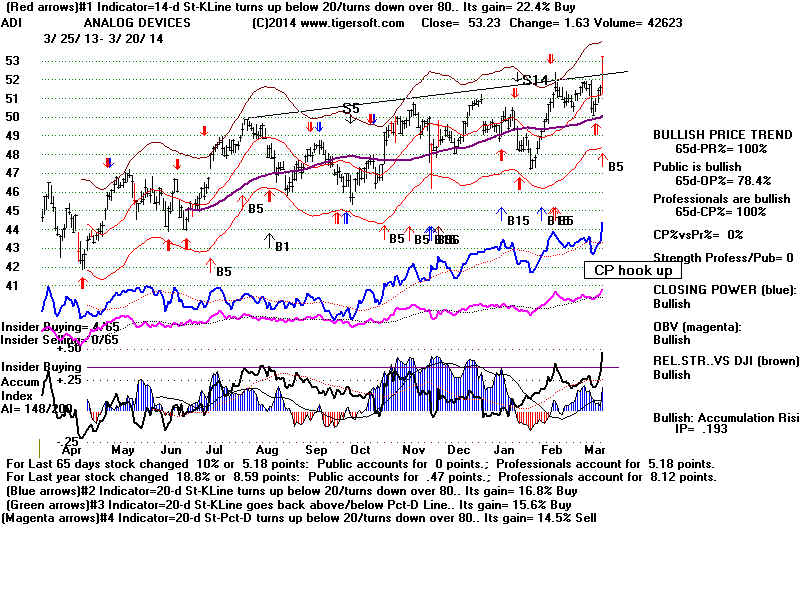
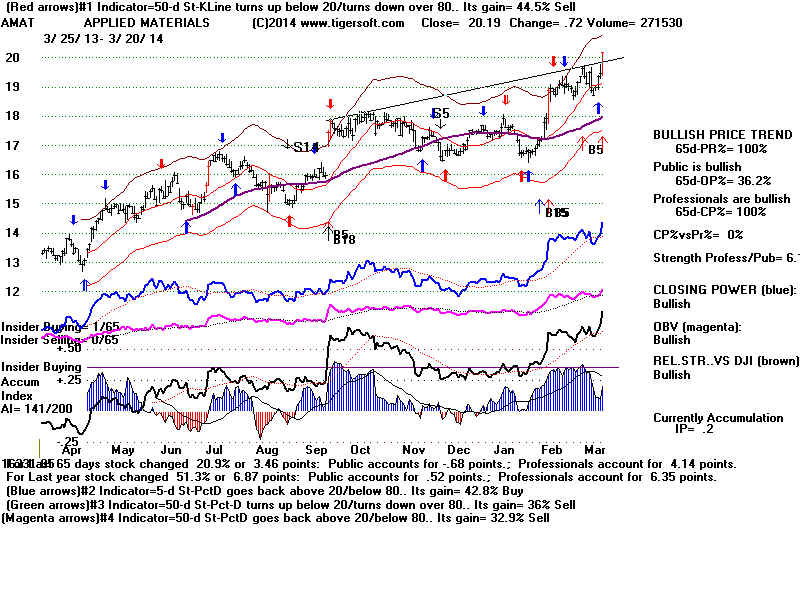
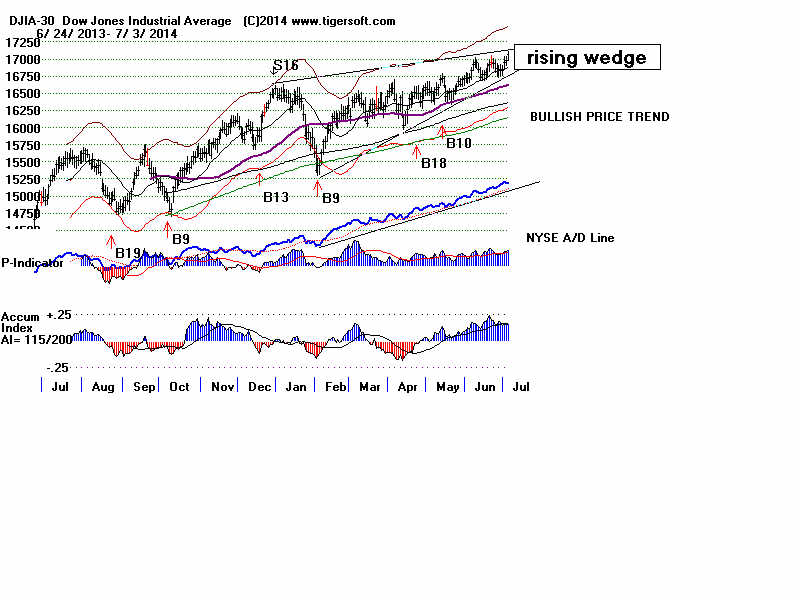
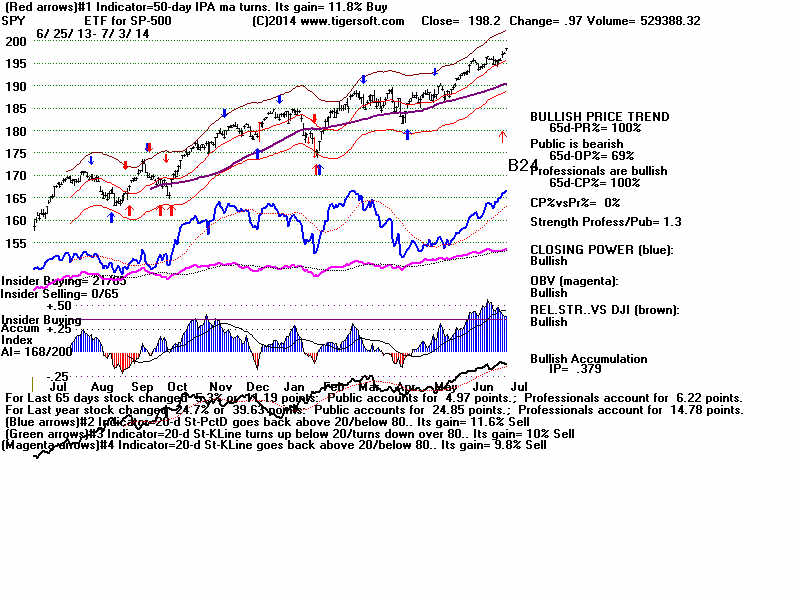
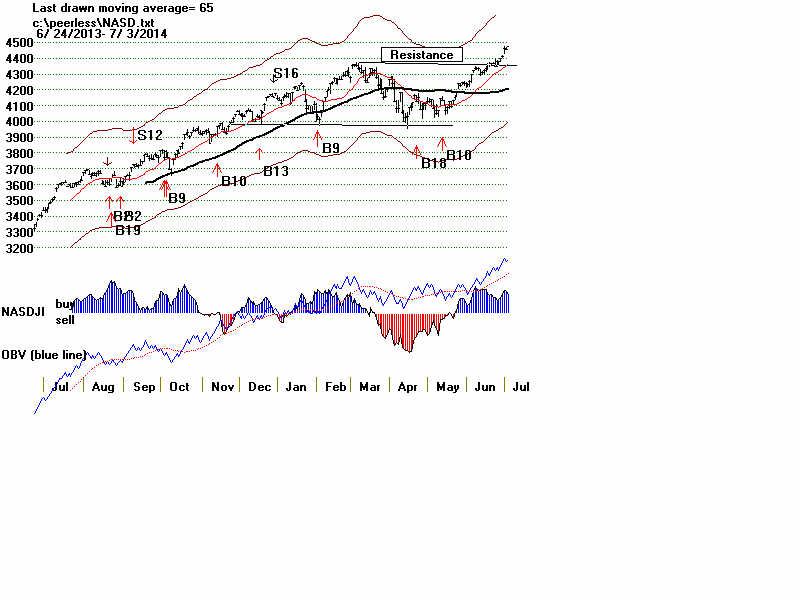
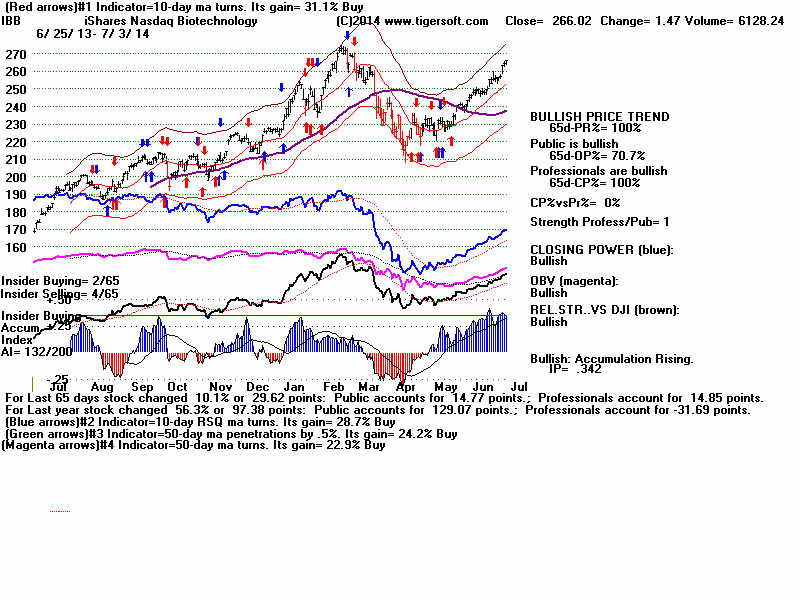
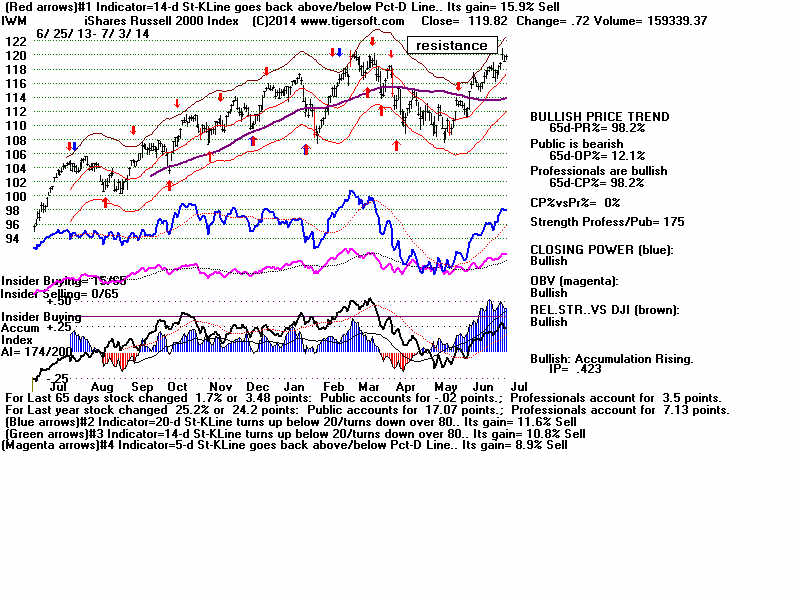
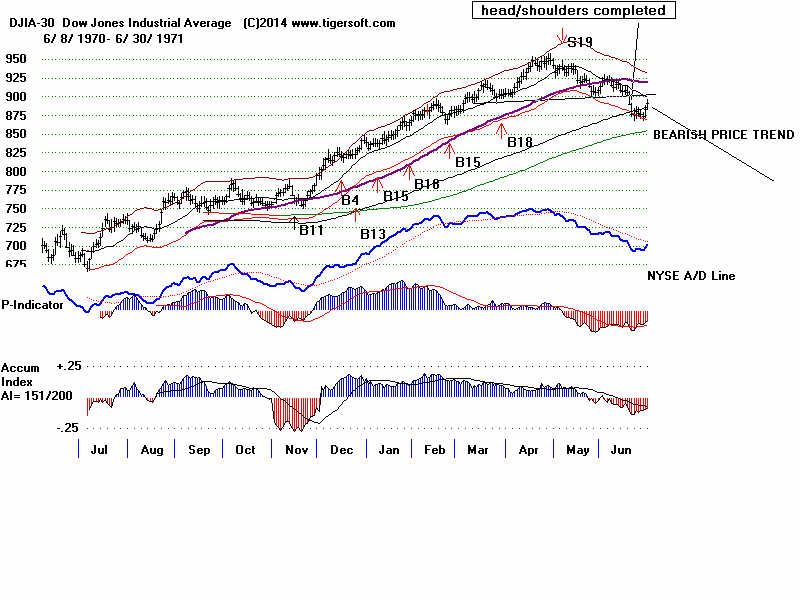
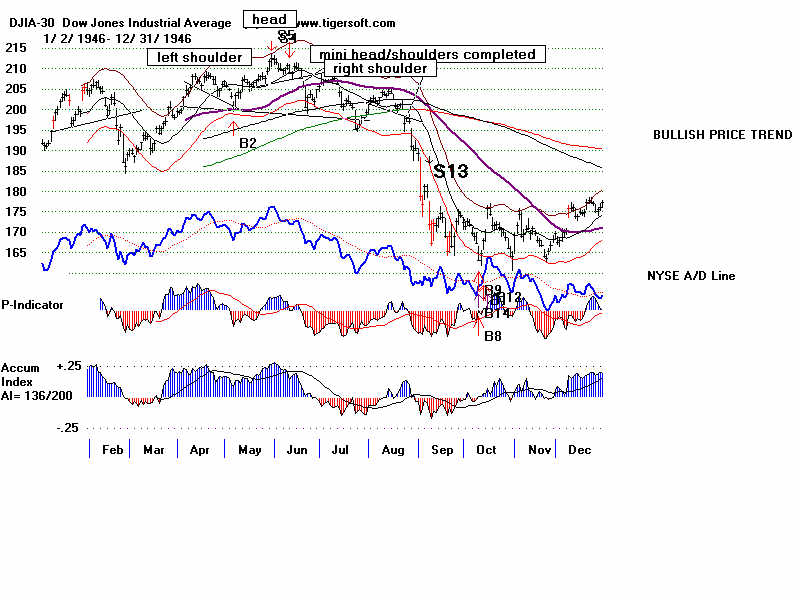
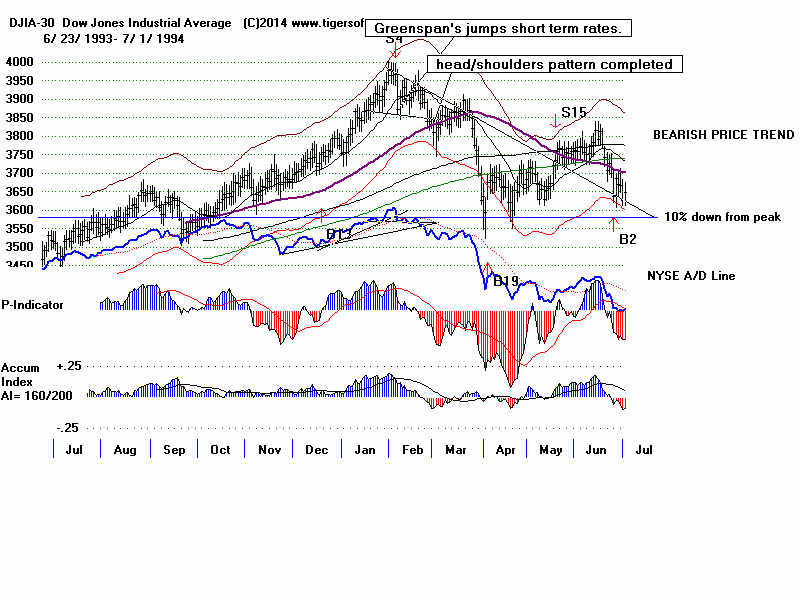
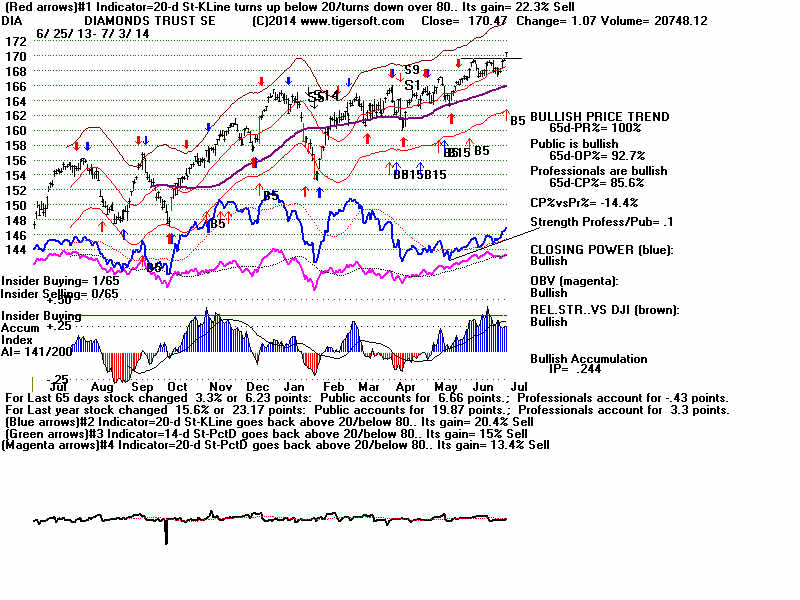
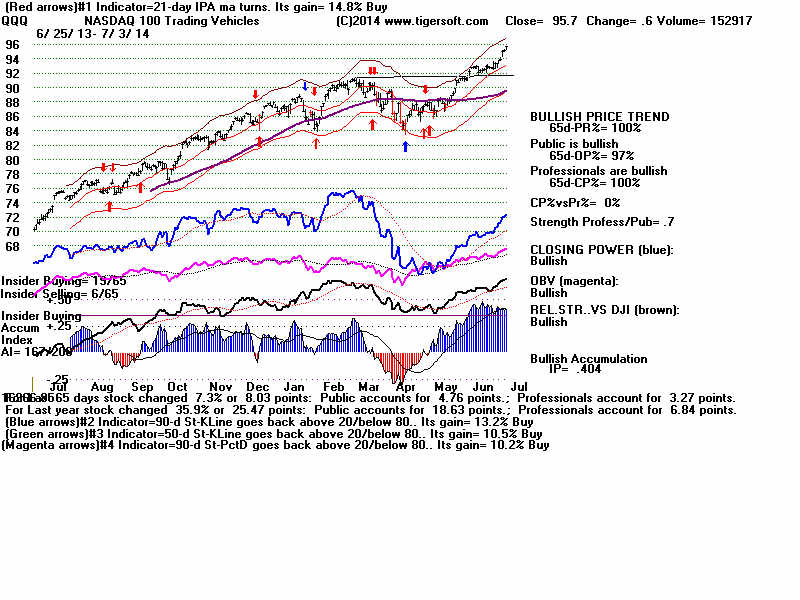