

TigerSoft and Peerless Daily
Hotline
-----------------------------------------------------------------------------------------------------------------------
(C) 1985-2014
William Schmidt, Ph.D. www.tigersoft.com
All rights strictly reserved.
Tiger
Software 858-273-5900
PO Box
22784 San Diego, CA 92192
Email william_schmidt@hotmail.com
Previous Hotline -http://tigersoftware.com/112211-H/index.htm 11/22/2013-3/20/2014
http://tigersoft.com/1111-HL/index.html
10/22/2013-11/21/2013
Past Hotline Predictions http://tigersoft.com/-HL42013/index.html
http://www.tigersoft.com/-2GBL13HL/index.htm
----------------------------------------------------------------------------------------------------------------------
PLEASE...Sharing this hotline address with
non-subscribers is a violation of our contract
with you and a violation of copyright laws. I
work hard for you. Respect that effort!
---> To
renew this Hotline, order
here $350 (check) - $360(Visa/MC)
www.tigersoft.com/-2GBL13HL/index.htm
--------------------------------------------------------------------------------------------------------------------
A
Guide To Profitably Using The Tiger Nightly HOTLINE
Peerless Signals: 1915-2013
New Peerless
Signals and DJI Charts - version 7/4/2013
1965 1965-6
1966
1966-7
1967
1967-8
1968
1968-9
1969
1969-70
1970
1970-1
1971
1971-2
1972
1972-3
1973
1973-4
1974
1974-5
1975
1975-6
1976
1976-7
1977 1977-1978
1978 1978-79
1979
1979-80
1980
1980-1
1981
1981-2
1982
1982-1983
1983
1983-1984
1984 1984-1985
1985 1985-1986
1986
1986-1987
1987
1987-8
1988 1988-9
1989
1989-90
1990 1990-1
1991
1991-2
1992
1992-3
1993
1993-4
1994
1994-5
1995
1995-1996
1996
1996-7
1997
1997-8
1998
1998-1999
1999
1999-2000
2000
2000-1
2001
2001-2
2002
2002-3
2003
2003-4
2004
2004-5
2005
2005-6
2006
2006-7
2007
2007-8
2008
2008-9
2009
2009-10
2010
2010-11
2011
2011-12
2012
2012-2013
Background and New Studies
Announcement:
The address for this Hotline will change Thursday AM, Pacific Coast Time.
Current
subscribers should have received a notice giving the new address today.
But we may have
made a mistake in your email address, so just let me
know and I will
send you the new address or tell you if your subscription
has expired
according to records here.
The On-Line Explosive Stocks
is finished.
The On-Line Killer
Short Sales book is also finished, but
some re-editing is being done this coming week.
I call your attention now to the many new concepts and
the considerable new research in these on-line books: "
For example:
1) A very good New Tiger Buy B12 for Low Priced Stocks
2) Red high volume reversal days
3) Buy the stocks the Federal Govt wants you to buy
4) 100-Day Power Rankings...
5) Using Closing Power Hooks after Buy B26s and B20s.
6) How A Stock Reacts to Its Earnings Report Is Very important.
7) TigerSoft Major Buy Signals' Combinations
Which are most Powerful? Reliable?
8) Augmented Buy B20s' Independent Success Rate.
9) What factors warn a rising 65-dma will not hold?
Purchase each all new book by CC for $42.50 or send a check
for $37.50 to me: William Schmidt, 5970 Gullstrand St., San Diego, CA 92122.
4/15/2014 Introduction to Tiger/Peerless Buys and Sells.
Peerless Charts and Signals
Different Types of
TigerSoft/Peerless CHARTS, Signals and Indicators
Documentation for
TigerSoft Automatic and Optimized Signals.
How reliable support is the
DJI's rising 200-day ma?
SPY Charts since 1994:
Advisory Closing Power S7s, Accum. Index, 65-dma, Optimized
Signals.
New Fine-Tuning TigerSoft Buy Signals:
9/1/2014 - 2014 Tiger B19s - Steady rallying and no pullbacks
below the 21-day ma.
4/7/2014 Advisory Pink Closing Power
S7s at ETF at top since 1994
1994 1996 1997 1998 1999
2000 QQQ SPY
DIA 2002
2007
2008
SPY 2011 2013-2014
The New 2014 Peerless.exe Software has now been posted on the Elite Stock Professional
Page.
---> To Older Hotlines
Lines
====================================================================================
9/2/2014
Important: 1) Hotline's address will change Thursday AM.
2) Also sometimes, the full Hotline disappears. It may have
happened last night. I'm sorry. It may be because I saved the full
changes under the name index.html but not under index.htm
So, if it appears to be unusually short in the future,
try both of the names below www.tigersoftware.com/XXXXXX/index.htm
and www.tigersoftware.com/XXXXX/index.html,
but substitute the
new address, of course.
The Closing Powers did not break their uptrends, so I would give the
NASDAQ, QQQ, IWM and IBB more time to advance
despite the frequent
bearishness of September. The new
Buy B20 is reliable. The previous Sell S19.
is not a particularly strong. There are still a number of Bullish
MAXCP
stocks. The DJI definitely is weaker. But no
Peerless Sell seems close.
Most of the market internals, our Peerless key values, improved today
despite the pullback.
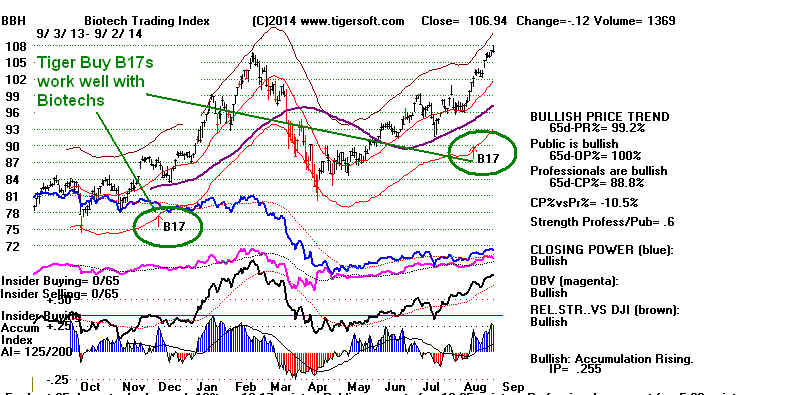
Tiger Buy B17 - Sudden Rise in "IP21",
TigerSoft's Accumulation Index
I spoke today with a former stock broker who has been a regular Tiger customer
and Hotline subscriber for more than thirty years. As the manager of a large
office of stock brokers, his words were most important. His view is that if
someone really wants to make a lot of money in the stock market, he or
she should concentrate on individual stocks. Peerless is great he says,
but we should also be looking for bulges of Insider Accumulation and watching
what Professionals are doing using the TigerSoft's charts.
I was pleased he said this, because I wanted to ask him about the value of
the new research I am doing for this Hotline on the Tiger Buy and Sell
(not Peerless) signals for individual stocks. He was glad to see it. It
would help others.
In this connection, I posted research this weekend of Tiger Buy B19s -
relentless upward momentum signal. I showed that certain accompanying
key values gave these B19s success rates of 80% or higher.
Tonight, I want to post the preliminary results for Tiger
Buy B17s -
sudden increases in Accumulation (IP21). You can see the sampling
methodology I used. The success rate here also is close to 80%,
especially, when the Buy B17 occurs while the stock appears to
be innocently sitting in a base. To show this, I want to make a list tonight
of the B17s in the past 11 months with biotechs. I will just go through
the biotechs we have on our data page and show the first 25 B17s.
Sampling this many cases gives us a reliable result. You can readily produce
the B17s exactly like I show here using the commands:
PEERCOMM + Charts-2014 + Daily Stocks + All Stks + Signals1 +
Display User Selected TigerSoft Signal + enter B17 + OK + 2 (right side
of keyboard to go to next stock. Num-lock must be OFF.)
18 of the 25 (72%) gained at least 10 before a loss of much more than 10%
occurred. Looking at these charts will show you that most of the losses
could have easily been avoided by not buying just below the resistance of
a 65-dma or where the stock's IP21 was still quite negative despite being
far above the 21-dma. I will work on these B17s studies some more
and you can view more complete studies in links I will provide in a few days.
Click on the links to see the charts of these 25 B17s stocks.
Buy B17s in Biotechs:
November - August 2014
la/ma 21-dma
Price Next Low
Next High
ROC
---------------------------------------------------------------------------------------------------------------------------
ACAD
4/23/2014 .941
-2.261 20.55
18.05
26.61 5 months later. Success
ACHN 11/22/2013
1.174 2,112
3.07
4.12 in six weeks. Success
ACOR
6/5/.2014 1.102
1.165
34.96
18.45
Loss
ACRX 11/13/2013
1.034 - .518
7.82
--------
12.69 in two months Success
ACST 11/27/2013
.688 -5.18
1.20
-------
1.50 in 6 weeks
Success
AEGR
1/8/2014 1.074
1.092 73.23
56.54
Loss
(At falling 65-dma resistance. Avoid these.)
AFFX 12/23/2913
1.066 1.414
8.85
7.90
9.75
Success
AFFY
12/27/2013 .946 -.142
0.79
-----
1.18 in 5 days
Success
AGEN 12/11/2013
.993 .093
2.54
------
5.10 in 19 weeks
Success
ALNY
5/19/2014 1.077 .972
58.26
------
70 in a month
Success
ALXN
12/23/2013 1.051 .921
130.90
------
183 in 2 months
Success
AMAG
1/15/2013 .988 -.123
22.99
19.97
Loss
(Just bekow 65-dma resistance. Avoid these.)
AMED
6/27/2014 1.247 2.404
17.46
15.49
22 in 5 weeks
Success
(Best to wait for a pullback and CP hook up when stock spikes up like this.)
AMGN 12/9/2013
1.000 .31
113.99
129 in 3 months Success
AMRI 12/23/2013
.959 -1.234
20.31
-------
2o in 3 months
Success
ANAC 12/9/2013
1.236 3.945
16.98
--------
22.75
Success
ANIK 11/27/2013
1.111 2.438
34.30
---------
39. in 6 weeks Success
AOLS 11/19/2013
1.015 -.134
0.27 ---------- .40 in 2
months Success
APDN 11/12/2013
.935 -2.144
0.11
---------- 0.19 in one
month Success
APH
4/28/2014 1.018
.506
94.73
.............. 104.9 in 5 months
Success
ARIA 1/28/2014
1.146 1.777
8.04
6.88
9..23 n 3
weeks Success
(Dangerous because IP21 was -.074 with stock 14.6% over 21-dma)
ARNA 1/15/2014
1.224 3.536
7.31
6.0
(7.97)
Success
(Just bekow 65-dma resistance. Avoid these.)
ARQL 2/19/2014 .96
-1.535
2.22
1.30
Loss
-------------------------------------------------------------------------------------------------------------------------------------
> To
Key Index and Leading Stock Charts: DJI, SP-500, etc.
Peerless DJI Chart
SPY Chart NASDAQ Chart QQQ
Chart
IBB Chart
IWM Chart
Hourly DJI-OBV Hourly-MVM0735
FAS-3x Financials IBB-Biotechs
-----------------------------------------------------------------------------------------------------------------------------------
-->113 +17 MAXCP stocks Bullish MAXCP Stocks (9/2/2014) Bullish
plurality
Highest A/I 200 DJI-30 Stock - CAT
--> 62
+20 MINCP stocks Bearish MINCP Stocks (8/29/2014)
-->
83 +33 New Highs on NASDAQ
21 +8 new lows. Bullish plurality
--> 107 -11
New Highs on NYSE 6 new lows. Bullish plurality
-------------------------------------------------------------------------------------------------------------------------
Why The Market Could Drop Soon.
 The sabre-rattling is getting scary.
Putin, in an effort
The sabre-rattling is getting scary.
Putin, in an effort
apparently to show his "restraint" says that Russia could take Kiev "in two
weeks
if it wanted to". Not to be outdone, America must pound on its chest,
too.
The the US Army's 173rd Inantry Brigade will participate in "training exercises"
with Polish and Ukrainian forces close in Eastern Poland in two weeks. This
can
only increase the new cold war tensions.
Why do we care about whether Eastern Ukraine's Russian-speaking population
rejoins Russia or becomes an independent country? Hillary says Putin is another
Hitler about to invade the Sudetenland. He would restore the Tsarist Empire
if he could. But just as likely, many think NATO in the absence of a Red Menace
simply needs an opponent to justify their existence and we are now playing a very
, dangerous game, because no Russian government could tolerate missiles pointed
at it from neighboring Uraine.
Lech Walesa, a Nobel Peace Prize winner, is someone who knows something
about Russia. He says that NATO's involevment with and arming Ukraise
"could lead to a nuclear war... Must we then destroy each other?
Among the Yahoo comments at
http://news.yahoo.com/arming-ukraine-could-lead-nuclear-war-lech-walesa-183453862.html
Sic Semper Tyrannis
Guest
It is good that anti-communist hero like Lech Walesa has said this. Anyone else would be
attacked as communist or Russian sympathizer. Some people don't understand the seriousness
of nuclear war. Just because we avoided nuclear war in the past doesn't mean we will never
have one. We have to constantly work and remain vigilant to avoid nuclear war. Taking
anti-missile systems close to Russian border makes no sense. Russia is so big
geographically and they have so many nukes that even if they decide to nuke themselves,
the whole world will be radioactive. If we nuke Russia, we have to use so many nukes that
whole world will be radioactive and everyone will eventually die. Question is why
are we interested in Ukraine ? It makes no sense to fight nuclear war over Ukraine.
====================================================================================
OLDER HOTLINES
====================================================================================
9/1/2014 We should keep
watching to see if the NASDAQ, QQQ,
BBH and
IBB breakouts can bring big gains, as they did in 1999-2000
to climax a five
year-long bull market. Very bullish biotech announcements are being issued
more and more frequently. How can this not bring a breakout-run by
leading biotechs? And how can this not boost QQQ and the NASDAQ?
See the Bullish MAXCPs and Biotechs tonight and the Novartis
breakthrough
story of this weekend.
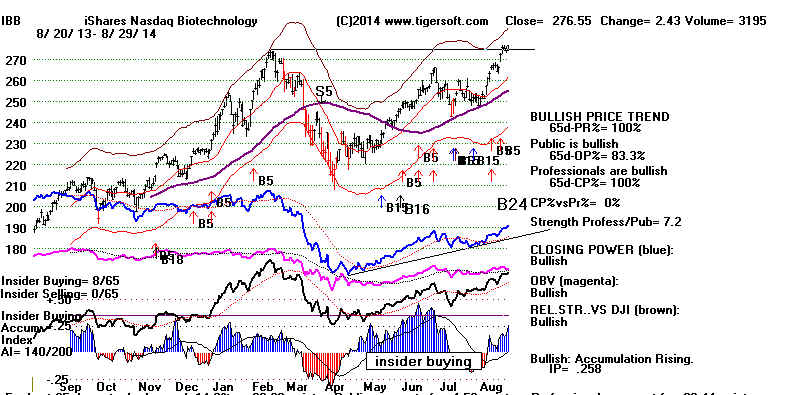
IBB - Tests of previous highs with IP21
above +.25
are more likely to bring breakout-runs.
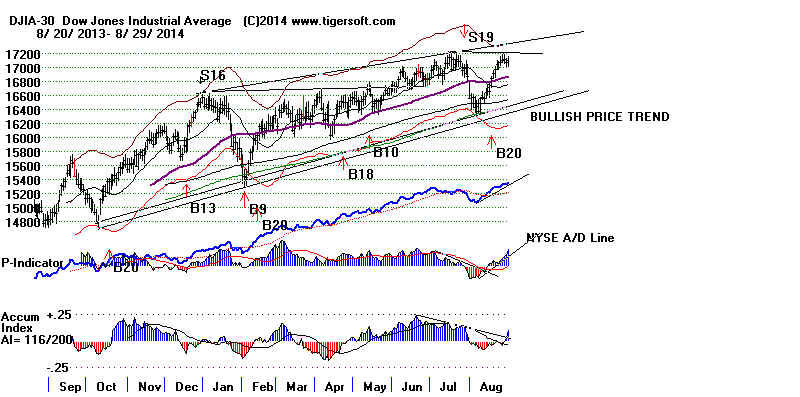
The DJI's IP21 below is well below the
+.23 I like to see on confirmed
new highs which are apt to become breakout-runs.
The New Peerless Buy B20 Still
Looks Good
(It should be posted tomorrow afternoon on the
ESP Page for downloading,
otherwise send check for $75 to William Schmidt, 5970 Gullstrand Street,
San Diego, CA 92122).
Still no new Peerless Sell and SPY's
Closing Power uptrend was not violated.
Also important, the the IP21 (Accum. Index) jumped sharply on
Friday. This is important because it weakens the Tiger S9 on SPY and
because a sharply rising IP21 plus excellent momentum could bring a Peerless
Buy B4. It will all depend on whether institutions and Professionals become
September sellers. This remains uncertain as the DJI only rises 42.6% of
the time in the 21 trading days following September 1st. Worse is September's
track record for the 21 trading days after the 3rd. For this segment of time,
the DJI only rises 38.3% of the time! So, we have to avoid being fooled by
the market's behavior for the next two days if it rises.
Only time will tell if Friday's strength will prove to be significantly bullish and
lead to an IP21-based Buy B4 or if Friday's was merely an un-representative
pre-holiday rally before a post-Labor Day swoon. But at the very least,
.
Friday's volume did rise and the market was not un-nerved by threating developments
in the middle-East and the Ukraine.
A Take-Off Is Needed.
Now we need a pick-up in upside momentum. The annualized rate of change of
the 21-day ma needs to move up a lot. The DJI will need to surpass the
2.7% upper band without bringing in more institutional selling into strength,
as happened last week.
What is needed now can be seen by studying how close we are to Peerless
Buy B4. A Peerless Buy B4 based on a steep jump in the IP21 could be
shaping up here. But momentum will need to accelerate up and the
IP21 (current Accumulation Index) will need to keep rising and not flatten out.
The IP21 will have to be above +.07, which it is now, and have jumped by +.08
over its levels a week earlier. IP21-based Buy B4s (as opposed to breadth-B4s)
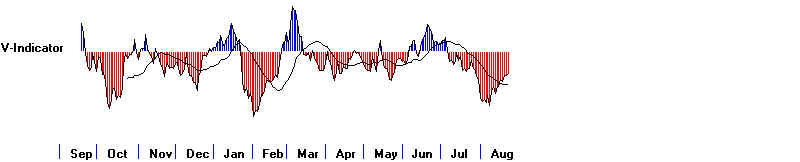
can bring superb DJI rallies even when the internal strength indicators are much weaker
than they are now. For example, B4s appeared on 6/26/1929 with the adjusted P-I
only 115 and the V-I was a -81 with and on 5/28/1942 when the V-I was only +8.
We might want to compare the IP21-based Buy B4s' requirements with
the key values we see now.
Current
Required Key Value
Key Value for Buy B4
based on imporoving IP21
--------------------------------------------------------------------------
1.019
LA/MA must be above 1.027
0.287
OBVPct must be +.32
0.38
The Annualized 21-day ma rise must be above 1.10
-.019 --> .097
IP21 must be +.045 higher than 5 days ago.
.097
The IP21 must be above +.07
---------------------------------------------------------------------------------------------------------------
> To
Key Index and Leading Stock Charts: DJI, SP-500, etc.
Peerless DJI Chart
SPY Chart NASDAQ Chart QQQ
Chart
IBB Chart
IWM Chart
Hourly DJI-OBV Hourly-MVM0735
FAS-3x Financials IBB-Biotechs
-----------------------------------------------------------------------------------------------------------------------------------
-->96 +33 MAXCP stocks Bullish MAXCP Stocks (8/29/2014) Bullish
plurality
Highest A/I 200 DJI-30 Stock - CAT
--> 42
-1 MINCP stocks Bearish MINCP Stocks (8/29/2014)
-->
50 +7 New Highs on NASDAQ
13 new lows. Bullish plurality
--> 118
New Highs on NYSE 3 new lows. Bullish plurality
-------------------------------------------------------------------------------------------------------------------------
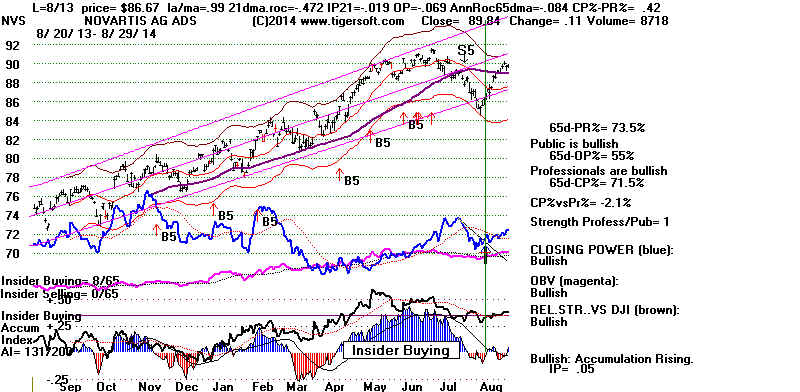
Biotechs Boom
The NASDAQ should get a lift if Biotechs are applauded for yet another drug
break-though. This one by Novartis, which this weekend, announced a 20%
improvement in the treatment of congestive heart failures over existing therapies.
Heart
drug launch could be 'most exciting ever', says Novartis
====================================================================================
OLDER HOTLINES
====================================================================================
8/28/2014 Still no new Peerless Sell and SPY's Closing
Power uptrend
was not violated. With neither sell signal, I think we have to give the market
a
chance to move higher.
I'm longer-term optimistic first because, swaggery aside, I cannot see the ever-cautious
Obama launching a war with Russia over the eastern-most part of Ukraine,
a faraway land whose Russian-speaking people not surprisingly do not want to be
controlled by a Kiev government that is willing to killing them to keep them loyal.
Secondly, it seldom pays to fight the Fed. They clearly want to prop up the market
and keep rates low. I expect the dividend and NYSE to hold up well in
here.
Respecting SPY's Sell S9 last night, I have suggested on the Tiger Stocks' Hotline
that we take some profits in a few of the NASDAQ stocks that have recently made
nice advances and add some new short sales from among the recent Bearish
MINCP stocks. I've just seen too many September declines not to see the need
to be cautious now.
Bearish September Seasonality
Seasonality will probably limit any rally. Since 1965, the first 10 trading
days of
September have seen the DJI rise only 34.8% of the time.
The market's behavior in September in years of Congressional Elections
since 1946 is worth noting too. When the DJI was in a rising market in
these years, Septembers brought 4 declines and 3 advances. In all types
of markets since 1946, there were 11 declines and only 6 advances.
How The DJI Does in Year of Congressional Elections
since 1946
Aug 31 Sept 31
1946 Market had been falling.
189.2 172.4
1950 Market reversed downtrend in July
216.9 225.4
1954 Rising market
341.3 330.5
1958 Rising market
507.7 532.1
1962 Bear market rally
609.2 578.1
1966 Bear market
788.1 774.22
1970 Rising market
764.58 760.68
1974 Bear market
678.58 607.87
1978 Rising market
876.82 865.82
1982 Rising market
893.3 896.25
1986 Rising market in trading range
1900.2 1767.6
1990 Bear market
2614.4 2452.48
1994 Trading range
3913.4 3843.2
1998 Bear market
7539.1 7842.6
2002 Bear market
8663.5 7591.9
2006 Bull market
11381.2 11679.1
2010 Broad trading range
10009.7 10788.1
2014 Bull market
----------------------------------------------------------------------------------------------
6 up
11 down
---------------------------------------------------------------------------------------------------------------
> To
Key Index and Leading Stock Charts: DJI, SP-500, etc.

Peerless DJI Chart
SPY Chart NASDAQ Chart QQQ
Chart
IBB Chart
IWM Chart
Hourly DJI-OBV Hourly-MVM0735
FAS-3x Financials IBB-Biotechs
-----------------------------------------------------------------------------------------------------------------------------------
-->75 +12 MAXCP stocks Bullish MAXCP Stocks (8/28/2014) Bullish
plurality
Highest A/I 200 DJI-30 Stock - CAT
--> 51
+8 MINCP stocks Bearish MINCP Stocks (8/28/2014)
-->
20 New Highs on NASDAQ
25 new lows. BEARish plurality
--> 75
New Highs on NYSE 3 new lows. Bullish plurality
-------------------------------------------------------------------------------------------------------------------------
====================================================================================
OLDER HOTLINES
====================================================================================
8/27/2014 Consider a break in the Closing Power Uptrend of SPY
a
short-term Sell even if Peerless gives no Sell. A shallower 3%-5% SPY
decline would be typical without a Peerless Sell.
See new SPY Tiger-S9 study below. (This is not a Peerless Sell S9.)
With the major markets' prices so little changed the last day or two,
it's only natural to worry if the loss of momentum here is like a ball that
has been tossed in the air and then stops still for an instant before falling
back down. Peerless actually has a Sell signal for this contingency and it
has not been triggered. I think it's safe to assume volatility will increase
after Labor Day, this coming Monday.
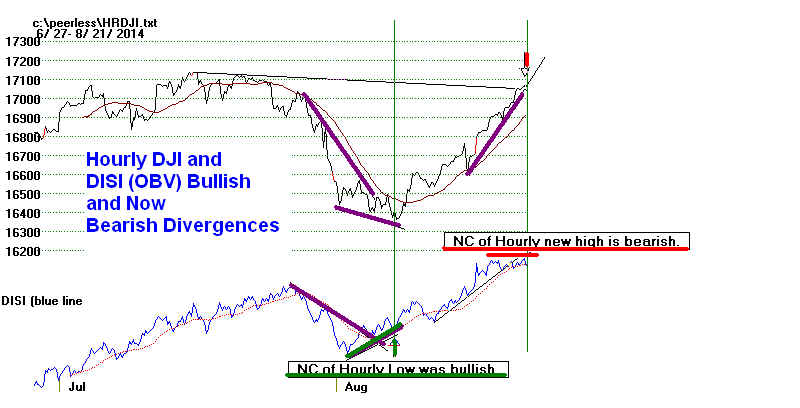
The Hourly DJI's chart shows that short-term traders have
shifted to selling
Note the OBV divergence from its price action recently.
Any Decline Now Should Be Shallow
The DJI keeps avoiding a Sell S9v or Sell S12 by staying away from
the
electrified hot rail, the 3%-3.5% upper band. Though the indexes
seem stalled, there were a healthy margin of 421 more up than down
on the NYSE.
Every day Yahoo publishes the views of another billionaire super-bear. So how
can the market keep rallying? Momentum is king, I think. This is a
bull market
that apparently never corrects. Professional money managers who get out of position
are quickly punished by having prices run away from them if they trade the
major market ETFs. They mostly have become well trained now to "hold" and
"buy all dips". Perhaps, too well trained?!
"Can the FED really keep interest rates so low much longer?", you ask.
"Yes" is Janet Yellen's answer looking at the slack in many labor
statistics and
remembering what happened in mid-2008 when the FED failed to foresee the horrible
October debacle that befell the market later that year.
Now we have Europe shifting to an easier set of monetary policies. That's a
big boost for the Dollar. This along with falling oil, gas and food prices "
coupled with a neutral gold price trend, all give the Fed
lots of freedom
to keep rates almost as low as they want for the foreseeable future!
And as we know, the strong Dollar and low interest rates make US NYSE
dividend
stocks very attractive. The latter also invites corporate buy-outs, too, so long
as the DC government chooses not to fuss much over how big and monopolistic
corporations are getting.
These underlying forces remain bullish enough, I think, to limit any
decline
that lies immediately ahead.
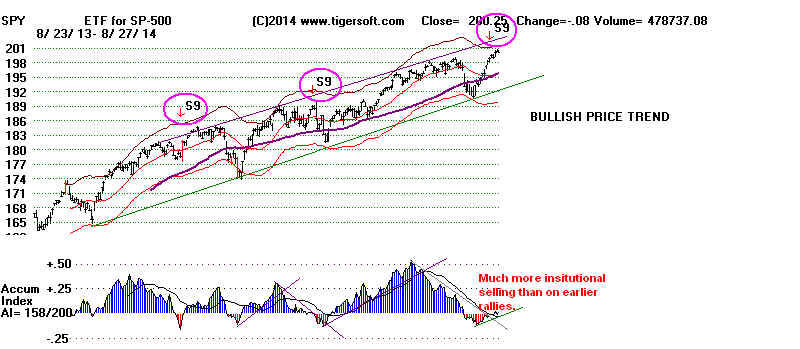
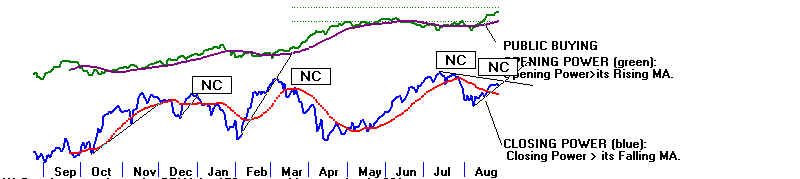
SPY's Negative Accumulation and Closing Power
Non-Confirmation
of the new at 2000 are clearly bearish.
Consider it a short-term Sell if the current Closing Power
Uptrend is violated
even if Peerless gives no Sell. Non-November S9s have produceds very tradeable
declines in 85% of their cases since 1993. See below.
Still, I think we should be concerned. The market could be badly surprised and
all those sellers could become much more aggressive if prices turn down as they often
do in September. Let's consider the most actively traded ETF. SPY has
just produced a TigerSoft "S9", its Accumulation Index was negative a few days
ago with it 2% above its 21-day ma.. Let me look back to 1993, when SPY was created,
and show readers what happened in the past when there were earlier TigerSoft
"S9s".
(Note these are not the same as Peerless S9s.)
TigerSoft S9s: 85% Reliable for SPY, apart from
Novembers.
November TigerSoft S9s did not work out well. The bullish seasonality of
the market turning up in November and rallying in December overcome
November S9s. But the TigerSoft S9s worked out satisfactorily in 17 other
cases and failed only 3 times in the non-November cases. Note that I included
among the successes three instances where the SPY rallied 2-3% and then
sold off 5.5%, 7.4% and 12%.
TigerSoft
S9s 1.5%-3% over 21-day ma
1 May
1993 SPY quickly fell to 1.5% lower band
2 Oct
1993 Quick decline to 1.5% lower band
Nov 1993 decline only back to rising 21-dma and 65-dma
3 Oct
1994 declined in a month to lower 3.5% band.
Nov 1996 SPY rallied from 71.46 to76 and then fell back to rising
65-dma at 72.
4 Oct
1997 SPY declined 10% in a month.
Nov 1999 SPY kept rallying for six more weeks, from 137 to 147.
5
Dec-Jan 1999 SPY 144.18 fell 8% in 2 months.
6 Jul
2000 SPY fell 5% to lower 3.5% band.
Nov 2003 SPY kept rallying for 7 more weeks., from 106.45 to 116.
7 Feb
2004 SPY fell to lower 3.5% band, a 5.8% decline.
8 Jan
2005 SPY fell to lower 1.5% band.
9 Feb
2005 SPY rallied from 119.27 to 122.79
and then fell 7.4%.
10 Jan 2006 SPY only fell to lower 1% band. (failure
#1)
11 Mar 2006 SPY only fell to rising 65-dma, from 129 to 127.5 (failure #2)
12 Jun 2007 SPY fell 3.4% to rising 65-dma.
13 Apr 2008 SPY rose from 138.55 to 143 over next 3 weeks and then fell 12% to 121.
Nov 2009 SPY rose from 111.21 to 114.5 and then fell to 106.66.
14 Jan 2010 SPY fell from 113.33 to 106.66 in a month, This was lower 5.5% band.
15 Jan 2012 SPY rose for 10 weeks without pulling back.
16 Oct 2012 SPY fell 7% to lower 3.5% band
17 Jul 2013 SPY only fell to rising 65-dma (failure #3)
18 Sep 2013 SPY quickly fell 4.5%
19 Dec 2013 SPY rose from 181.70 to 184 and then fell to
175,
20 Apr 2014 SPY quickly fell 3.8%
Aug 2014 ???
See all these SPY charts with TigerSoft
S9s here.
---------------------------------------------------------------------------------------------------------------
> To
Key Index and Leading Stock Charts: DJI, SP-500, etc.
Peerless DJI Chart
SPY Chart NASDAQ Chart QQQ
Chart
IBB Chart
IWM Chart
Hourly DJI-OBV Hourly-MVM0735
FAS-3x Financials IBB-Biotechs
-----------------------------------------------------------------------------------------------------------------------------------
-->63 -4 MAXCP stocks Bullish MAXCP Stocks (8/27/2014) Bullish
plurality
Highest A/I 200 DJI-30 Stock - CAT
--> 43
+2 MINCP stocks Bearish MINCP Stocks (8/27/2014)
-->
43 -11 New Highs on NASDAQ
7 new lows. Bullish plurality
--> 101
New Highs on NYSE 1 new lows. Bullish plurality
-------------------------------------------------------------------------------------------------------------------------
====================================================================================
OLDER HOTLINES
====================================================================================
====================================================================================
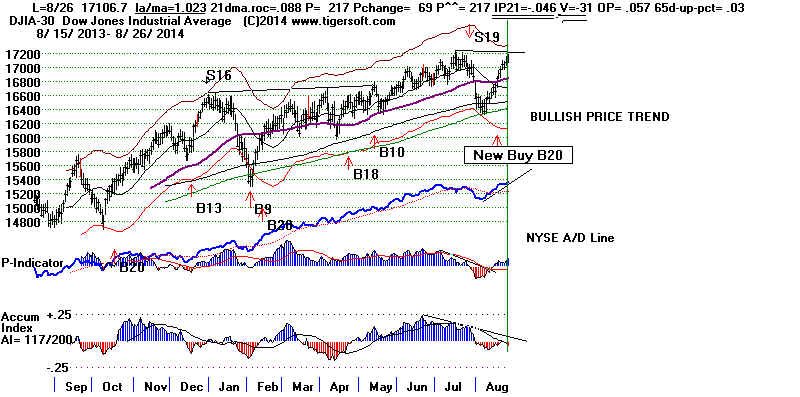
8/26/2014 The DJI is
getting very close to a Sell S12 or a Sell S9V
because it closed 2.3% over the 21-day ma with the both the IP21 and V-I
negative. Breadth remains quite positive, however. Today there were more
than 1000 advancers on the NYSE than decliners. The DJI needs to rally a little
closer
to the upper band for Peerless to give a Sell.
Don't lament the absence of a Sell or the failure to hit the upper band.
This may allow the market to survive this September and rally more substantially
at the end of the year. On the other hand, a DJI rally to 17250 or higher with
the present key values would very likely give a Sell S12.

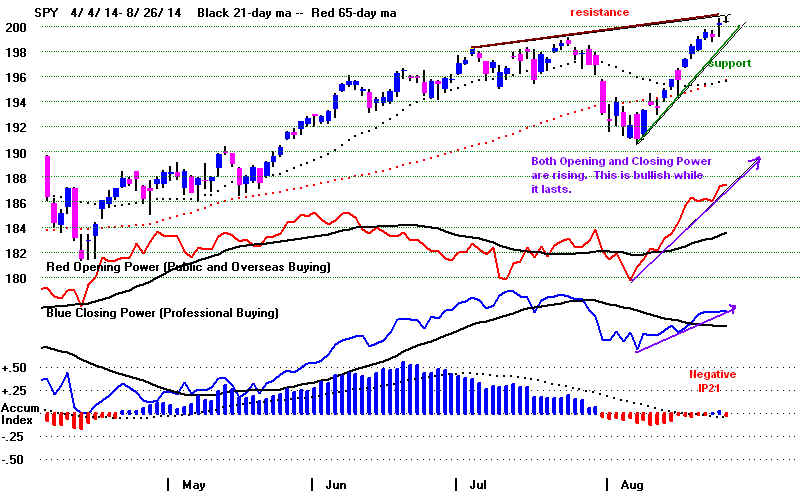
Still No Clear SPY Breakout
Tiger candle-stick chart shows both Opening and Closing Power are rising.
But Overseas' over-night and Public buying are stronger than US domestic
Professionals' net buying trend. The negative readings from the Accumulation
Index are clear warnings that many institutions are taking profits ahead of
the start of September, the most bearish month of the year.
The Impacts of A Strong Dollar:
Higher Stock Prices, Higher Unemployment and
Eventually Another Round of Cuts in US Interest Rates
You'd never know it from Conservatives' loud cries that Obama is setting up
a Weimar or Argentine run on the Dollar, but today the Dollar made a 12 month high.
With the EURO testing its 12-month lows and Japanese Yen breaking down again
on heaavy red Distribution now, we can well understand that some of the buying
of US equities now taking is hot international money playing the markets with the
strongest currency. As long as the Europe Union struggles to boost its
weakening
economies with looser monetary policies, the Dollar should keep rising.
These dynamics may breakdown if the FED chooses to prevent the Dollar
from getting too strong. Why would it do this? Because as the the Dollar
rises vis-a-vis other key currencies, imports of manufactured goods will tend
to increase into the US versus exports. The result will be still higher
unemployment in US manufacturing, such as still remains. That will encourage
Yellen and the doves on the FED to pursue looser monetary polcies themselves
in an effort to prevent the economy from stalling out.
.
---------------------------------------------------------------------------------------------------------------
> To
Key Index and Leading Stock Charts: DJI, SP-500, etc.
Peerless DJI Chart
SPY Chart NASDAQ Chart QQQ
Chart
IBB Chart
IWM Chart
Hourly DJI-OBV Hourly-MVM0735
FAS-3x Financials IBB-Biotechs
-----------------------------------------------------------------------------------------------------------------------------------
-->67 MAXCP stocks Bullish MAXCP Stocks (8/26/2014) Bullish
plurality
Highest A/I 200 DJI-30 Stock - CAT
--> 41 MINCP stocks Bearish MINCP Stocks (8/26/2014)
-->
54 New Highs on NASDAQ
12 new lows. Bullish plurality
--> 96
New Highs on NYSE 2 new lows. Bullish plurality
-------------------------------------------------------------------------------------------------------------------------
====================================================================================
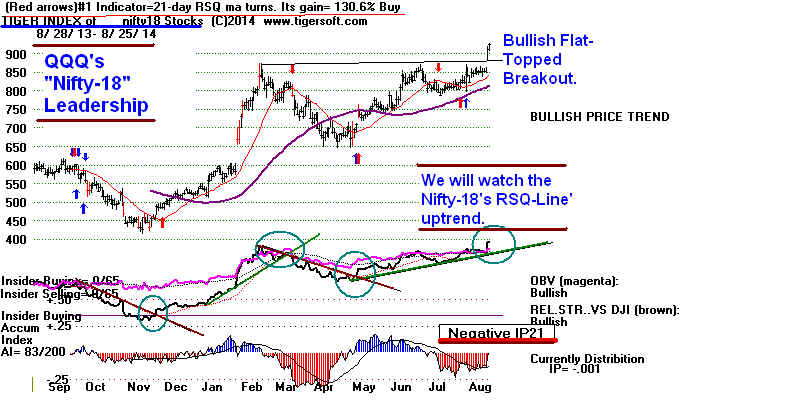
8/25/2014 It was break-out
day for the NASDAQ and QQQ. They are charged
up and seem bound to reach their highs in the year 2000, possibly with or without
any help from the DJI-30.
Reaching their 2000 high closings would still boost the QQQ up more than 15%,
assuming it can get past the round number resistance at 100. At 4556.35, the
NASDAQ now is 498 points (11%) below that target.
The QQQ and NASDAQ are being led by a nifty-18 not unlike the nifty-50 of
late 1972). Each of these nifty-18 are up more than 25% this year:
GMCR, TSLA, MU, AVGO, GILD, SNDK, FB, INTC, FFIV, BRCM,
NFLX, ATVI, AKAM, ALXN, GOLD, MNST, AAPL and EXPE.
See below the Tiger Index of the QQQ's NIFTY-18 and the recent breakout into
all-time high territory. Their Relatuve Strength Quotient based on their index
divided
by the DJI appears to be a great way to watch their momentum swing up and down.
I will report on that regularly here. But we also must note now how their
Accumulation Index is quite negative. Lots of traders and institutions are selling
these stocks on this rally. They are not accumulating. At this late stage in
in the bull market, bulls would like to see internally stronger leadership.
The Market Is Being Led by a Nifty-QQQ-18
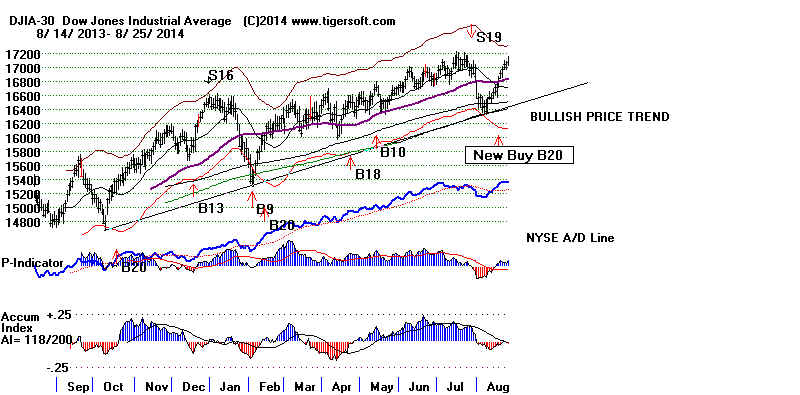
Will We Get A September Sell S12 or S9v?
Breadth continues to be bullish, with 700 more up than down on the NYSE today.
Since the market reversed upwards, we have seen 9 of the last 12 trading days
showing 600 more daily NYSE advancers than decliners. And, as I've pointed
put, the new Buy B20 is particularly reliable, always producing a profit at the
time of the next Peerless Sell and seldom showing a paper loss provided the
B20 occurs, as it did here, within 1% of the 21-day ma.
Still, the Buy B20 cannot prevent a Sell signal at the upper 2%-3.5% band.
It may prove significant that the SP-500 could not overcome the selling at 2000.
This could be a warning, as the DJI is now 2.1% over the 21-day ma with a negative IP21
(-.019) and V-I (-43). A DJI jump of 100 points higher from here which does not
improve
these internals will likely bring a Peerless Sell S12. As we know, September
Peerless
Sells are reliably bearish.
That seems to be where we are headed. Going back to 1950, there is a bullish
tendency for the DJI to rise in the week before Labor Day (this Monday)
and the day afterward. Then the bearishness of September often stops a rally.
The
DJI has rallied just 36.2% of the time since 1965 in the 21 trading days following August
31st.
DJIA, Signals and Internals

---------------------------------------------------------------------------------------------------------------
> To
Key Index and Leading Stock Charts: DJI, SP-500, etc.
Peerless DJI Chart
SPY Chart NASDAQ Chart QQQ
Chart
IBB Chart
IWM Chart
Hourly DJI-OBV Hourly-MVM0735
FAS-3x Financials IBB-Biotechs
-----------------------------------------------------------------------------------------------------------------------------------
-->66 -2 MAXCP stocks Bullish MAXCP Stocks (8/25/2014) Bullish
plurality
Highest A/I 200 DJI-30 Stock - CAT
--> 56
+19 MINCP stocks Bearish MINCP Stocks (8/25/2014)
-->
68 +28 New Highs on NASDAQ
14 new lows. Bullish plurality
--> 98 +41 New Highs on NYSE 13 new lows. Bullish plurality
--------------------------------------------------------------------------------------------------------------------------
====================================================================================
OLDER HOTLINES
====================================================================================
8/22/2014 The leading
indexes and ETFS, the NASDAQ, QQQ and SPY
cannot seem to get past their rising resistance levels, even though their leaders,
high priced AAPL and GILD are
having no problems continuing to rise.
Weak internals for the DJI now are facing off against the recent very good breadth
and bullish seasonality. The DJI is 1.7% above the 21-day ma, but the
P-Indicator
stands at only +66 and both the IP21 (-.015) and V-I (-60) are negative. I would
think the market may need to pull back and prepare for another rally into
September. With the Buy B20 and rising Closing Powers, at most, only a shallow
retreat seems likely for the indexes.
---------------------------------------------------------------------------------------------------------------
> To
Key Index and Leading Stock Charts: DJI, SP-500, etc.
Peerless DJI Chart
SPY Chart NASDAQ Chart QQQ
Chart
IBB Chart
IWM Chart
Hourly DJI-OBV Hourly-MVM0735
FAS-3x Financials IBB-Biotechs
-----------------------------------------------------------------------------------------------------------------------------------
-->68 -28 MAXCP stocks Bullish MAXCP Stocks (8/22/2014) Bullish
plurality
Highest A/I 200 DJI-30 Stock - CAT
--> 37
-5 MINCP stocks Bearish MINCP Stocks
(8/22/2014)
-->
39 -3 New Highs on NASDAQ
16 new lows. Bullish plurality
--> 47 New Highs on NYSE 12 new
lows.
Bullish plurality
--------------------------------------------------------------------------------------------------------------------------
Seasonailty is bullish now. The DJI has rallied 57.4% of the time since
1965 in the ten trading days after Augsut 24th. Historically,
the market now is much more likely to
rally until a Sell signla in September
or keep on rallying than make a top now
in August.
The Buy B20 is a reliable signal. Seldom are there any paper losses with it
when it occurs within a percent of the 21-day ma. In 10 cases, there were no paper losses.
In the other two cases, the paper losses
were under 2%.
Buy B20s are nice, but the fact remains that it's hard right now to find attractive
stocks to buy. This is a reflection of the low IP21 levels for different major
market
ETFS: But, at least, the Closing Powers are rising:
LA/MA IP21 CP%-Pr% CP trend
Automatic Red Signal Chart
DIA 1.018 -.06
-27.5
UP
New
Red Sell
QQQ 1.027 +.187
0
UP on
Buy
At resistance
SPY 1.019 -.005
-20.2
UP new Blue
Sell At
resistance
IWM 1.018 +.035
+1.9%
UP
on
Buy
Just above rising 65-dma.
====================================================================================
OLDER
HOTLINES
====================================================================================
8/21/2014 The DJI is
approaching the 2.5% band with the V-I
and IP21 negative. A minor retreat here would not be surprising.
The Hourly DJI's OBV (DISI) is losing momentum. It led the rally,
now it is weakening.
I dummied in numbers with the DJI up variously 50, 100 and 150
points for tomorrow, but Peerless did not give a new Sell. There
are two explanations.
Septembers are much more dangerous than late Augusts and Breadth
now is excellent. The A/D Line usually produces Sells by not confirming
a DJI new high. Right now, it is the other way-around. The excellent
breadth brought a new Buy B20 a few days ago. Its fine track record
over a meaningful number of cases makes it worth trusting, I think.


A top is most likely to be made, if at all, in September.
The A/D line and the various key ETFs' Closing Powers keep rising,
thereby dumbfounding those who trusted the super-bearish articles Yahoo
and others put on-line, liberally dropping the names of the billionaires and
market gurus who were sure the market was about to plunge.
I guess it still might, I think that it is September and October that we have
to worry about. Since 1965, the DJI has risen 60% of the time over the
10 trading days after August 21st.
September Peerless Sells Are What We
Must Worry About.
By itself, this B20 would not prevent a Peerless Sell at the upper
band. But this is a bullish time of year. In on-going Bull markets,
most market
tops wait until September to be made, even when a Sell occurs in August.
There have been 15 successful September Peerless Sells, 7 of
them
coming in the first nine days. There have been only 3
successful late August
Peerless Sells, In just as many cases, the Augusr Sell
did not "kick in"
until it was reinforced by a September Peerless Sell.
Late-August/September Market Tops
in On-Going Bull Markets
1929 - Aug 28 Sell S12 - DJI rallied
until September 3 and famous Sell S9-Crash!
1935 - Sept 9 - Sell S2 - 3.3% DJI drop to next
Peerless Buy
1943 - Sept 20 - Sell S2 - 7.1% DJI drop to next Peerless Buy
1946 - Sept 9 - Sell S13 - 5.2% DJI drop to next Peerless
Buy.
1951 - Sept 17 - Sell S4 - 5.3% DJI drop to next Peerless
Buy.
1955 - Sept 20 - Sell S8 - 5.3% DJI drop to next Peerless
Buy.
1967 - Sept 14 - Sell S7 - 7.5% DJI drop to next Peerless
Buy.
1975 - Aug 29 Sell S9/S12 - DJI rallied until September 4 when S9 brought 5.2% DJI
decline to next Buy.
1976 - Sept 24 - Sell S1 - 4.2% DJI drop to next Peerless
Buy.
1978 - Sept 8 - Sell S12 - 12.7% DJI drop to next Peerless
Buy.
1979 - Aug 22 - Sell S8 - DJI rallied until September 20 and S7 which brought 9.5% DJI
decline to next Buy.
Exception 1987 - Aug 26 - Sell S4 brought DJI drop of 5.2% on
next Peerless Buy.
1991 - Sept 5 - Sell S1 - 4.0% DJI drop to next Peerless Buy.
1994 - Sept 2 - Sell S1 - 2.3% DJI drop to next Peerless Buy.
Exception 1999 - Aug 20 - Sell S9 - 9.7% DJI drop to next
Peerless Buy.
2007
- Sept 19 - Sell S2 - 6.2% DJI drop to next Peerless Buy
Exception 2011 - Aug 30 - Sell S12/S9 - 7.8% DJI drop
to next Peerless Buy
2012
- Sept 19 - Sell S8 - 5.6% DJI drop to next Peerless
Buy
---------------------------------------------------------------------------------------------------------------------------------
> To
Key Index and Leading Stock Charts: DJI, SP-500, etc.
Peerless DJI Chart
SPY Chart NASDAQ Chart QQQ
Chart
IBB Chart
IWM Chart
Hourly DJI-OBV Hourly-MVM0735
FAS-3x Financials IBB-Biotechs
-----------------------------------------------------------------------------------------------------------------------------------
--> 96 +3 MAXCP stocks Bullish MAXCP Stocks (8/21/2014) Bullish
plurality
Highest A/I 200 DJI-30 Stock - CAT
--> 42
-11 MINCP stocks Bearish MINCP Stocks
(8/21/2014)
-->
42 New Highs on NASDAQ
16 new lows. Bullish plurality
--> 79 New Highs on NYSE 5 new
lows.
Bullish plurality
-----------------------------------------------------------------------------------------------------------------------------------
The New Buy B20
The new Buy 20 has a very good track record. In fact, it it better than I thought.
It works quite well even when the DJI is farther away from the 21-day ma
than I mentioned last night, provided the DJI is not in, or close to being in,
a bear market. See notes on the Buy
B20 signals for more details.
Forgetting the current bullish seasonality, just on its own merits, I think we
have to accord a Buy B20 to the recent
very good breadth. I will work on
the programming, the paper loss details for the signal and some other Tiger
(not Peerless) signals' refinements and then place the update on the "
Elite Stock Professional Page in a few days. (Others wanting it can email me.
The charge is the usual $75.).
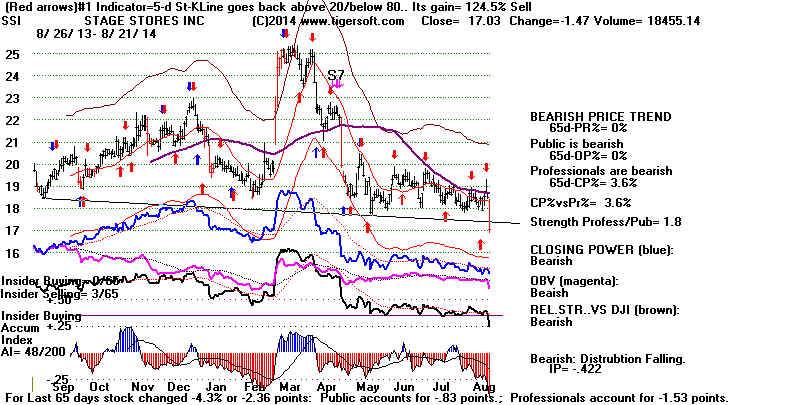
Classic Heavy Red
Distribution and
Flat Bottomed, Well-Tested Support Failure
If there were many stocks that looked as bad as this stock does now,
we would be great trouble. Fortunately, there are not very many,
except others in the Retail Sector. Analysts blame poorer than expected
earnings, I blame the very weak technical pisture here, especially the
utter absence of any Insider or Professional buying. This is a big head and
shoulders pattern that has just been completed. The oattern is 7-8 poijts high.
This produces a minimum downside target of 10-12.
====================================================================================
OLDER HOTLINES
====================================================================================
8/20/2014 The Closing
Powers are rising. So, is the NYSE A/D Line and
the US Dollar, thereby giving the Fed more freedom to keep
interest rates low.
(This also invites shorting the weak Japanese Yen ETF, FXY).
New and Relevant Peerless Research Tonight
The unusually positive breadth we have seen on this recovery has a reliably bullish
track record. Don't sell too quickly. The DJI should reach the upper band.
See below how positive the track record of a new Buy signal is. It is based
simply on looking back over any 8 trading days' period and counting the
number of the days in this period that the ratio of NYSE advancers to decliners
is better than 2.5:1. When there are 4 or more such days, it is a bullish
sign.
There are a lot fewer cases of this than I expected. Testing shows the trading
results can be further improved by requiring the DJI's LA/MA
(close divided by 21-dma) to be between .982 and 1.007.
Good results are also generally seen if one allows these signals to occur
down to an LA/MA of .96. An LA/MA above 1.007 often also works, but too
often there subsequently is a pullback from the upper band, thereby making
signals this high up off the 21-day ma more likely to be un-timely. As a
measurement of real and underlying market strength, a high percentage of
these signals are very good. (More on this tomorrow night.)
Historical Cases of New Signal (not yet
numbered)
Date
Gain La/Ma
65-day pct change
of
at time of
Buy
next
Signal
Peerless
Sell
---------------------------------------------------------------------------
8/10/1933 +1.8%
1.005
+.264
9/21/1938 +13.1%
1.000
+.174
2/2/1939 +3.5%
.989
-.056
5/29/1947 +8.9%
1.004
-.045
7/20/1950 +24.7%
.994
-.035
7/27/1950 +25.7%
1.004
-.030
11/9/1950 +14.0%
.996
+.052
long period of time no signals
7/16/2010 +4.4%
.996
-.093
10/5/2011 + 10.6%
.985
-.130
7/1/2013 +3.3%
.996
+.027
2/13/2014 +6.0%
1.005
+.016
8/18/2014 open
1.006
+.023
More on this signal tomorrow night. One thing that should be mentioned is
that this is also a good signal even when one expands the bands that I've
used above. .
---------------------------------------------------------------------------------------------------------------------------------
> To
Key Index and Leading Stock Charts: DJI, SP-500, etc.
Peerless DJI Chart
SPY Chart NASDAQ Chart QQQ
Chart
IBB Chart
IWM Chart
Hourly DJI-OBV Hourly-MVM0735
FAS-3x Financials IBB-Biotechs
-----------------------------------------------------------------------------------------------------------------------------------
--> 93 MAXCP stocks Bullish MAXCP Stocks (8/20/2014) Bullish
plurality
Highest A/I 200 DJI-30 Stock - CAT
--> 53 MINCP stocks Bearish MINCP Stocks (8/20/2014)
-->
37 New Highs on NASDAQ
23 new lows. Bullish plurality
--> 92 New Highs on NYSE 9 new
lows.
Bullish plurality
-----------------------------------------------------------------------------------------------------------------------------------
Bull Market and Low Interest Rates Predictably
Increase The Urge To Merge
A big semi-conductor, IRF, is being bought out. Mergers
are a major bullish
force for now. And they very often come in bunches in a particular industry.
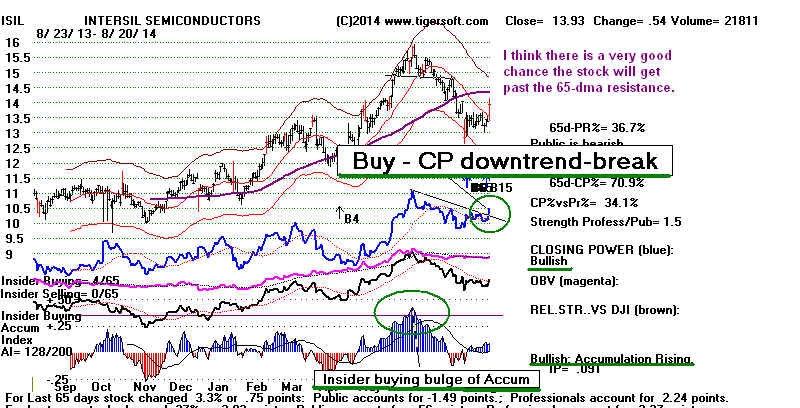
My guess is that semi-conductor ISIL (chart below) will get a sympathetic bounce
here, at the very least. See how its chart shows a recent bulge of intense
Accumulation (IP21>+ .375). By classic Tiger Closing Power theory, this makes
the stock a good one for traders to buy when its Closing Power's downtrend-line
is broken and the CP hooks back up. This shows us that Professionals are again
becoming aggressive buyers of the stock along with Insiders.
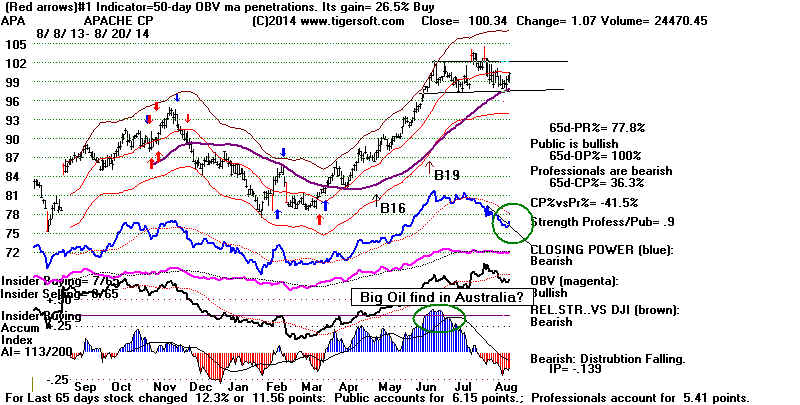
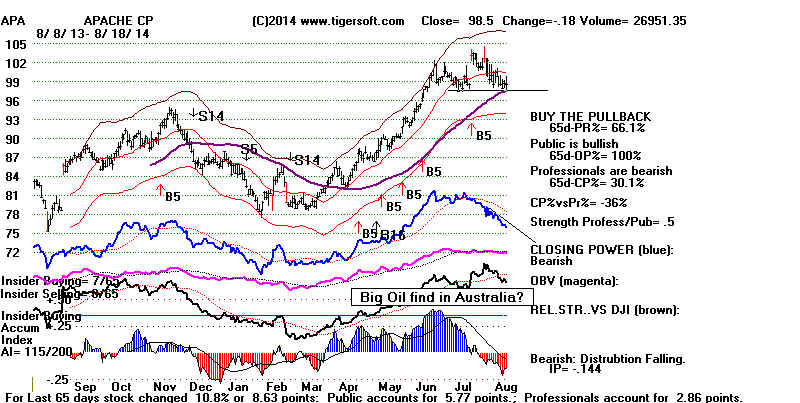
Compare ISIL's chart with APA's similar chart. APA has made a very big
discovery of oil in Australia. Special situations like this are very attractive
now. The news on ISIL gives it additional reasons to be bullish.
- Intersil (ISIL) Launches Power Management Integrated CircuitZacks(Tue,
Aug 19)
- Intersil Announces Single-Chip Display Power and LED
Driver for SmartphonesGlobeNewswire(Mon, Aug 18)
- INTERSIL CORP/DE FinancialsEDGAR
Online Financials(Fri, Aug 15)
Closing Power Downtrend-Breaks
after A Bulge of Insider Buying
Intersil - Another Semi-Conductor Buy Out Play?
Apache Oil - Rising despite falling Crude and Gas Prices.
Warning about One-Day Surges of 20%
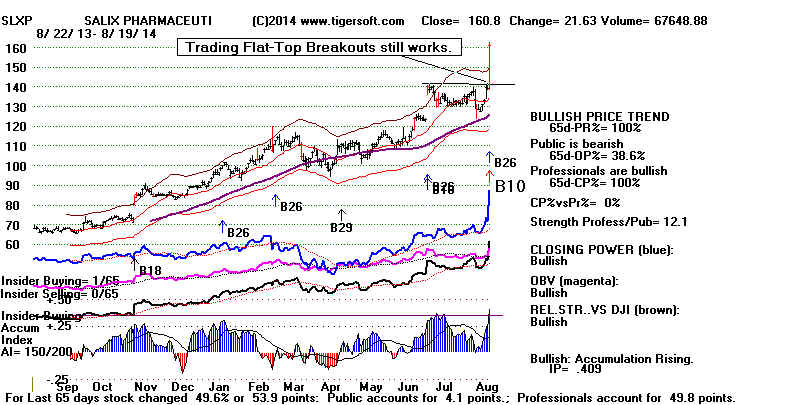
or More
My inspection of thousands of
charts for 2014 convinces me that it is much more
common for a stock that rises 20%
or more in one day, to pull-back than
to continue to surge. But
wait for the Closing Power to hook down.
These rules would apply now to
SLXP, which was mentioned here last night.
SLXP hopes to benefit by moving
off-shore to escape US taxation. Doing this
increases neither tax-paying
investor confidence nor tax-paying customer appeal.
Such "side-stepping" may
also be made more difficult by Congress in the
not-too-distant future.
====================================================================================
OLDER HOTLINES
====================================================================================
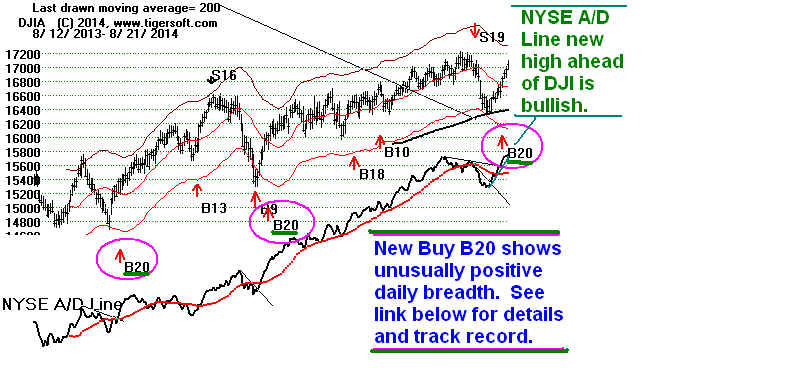
8/19/2014 Look
at the NYSE A/D Line soar. It has reached its 12-month
highs way ahead of the DJIA. I would think any retreat now will be minor.
As long as the Closing Powers for the key ETFs are rising,
I think there's a good chance the NASDAQ will see 5000 and the SP-500
will challenge 2000 this Fall. Such round numbers make good headlines
and are seen as a way to bring new money into the market.
-----------------------------------------------------------------------------------------------------------------------------------------------------
> To
Key Index and Leading Stock Charts: DJI, SP-500, etc.
Peerless DJI Chart
SPY Chart NASDAQ Chart QQQ
Chart
IBB Chart
IWM Chart
Hourly DJI-OBV Hourly-MVM0735
FAS-3x Financials IBB-Biotechs
-----------------------------------------------------------------------------------------------------------------------------------------------------
The next two weeks have a strongly upward seasonal bias. Since 1965,
the DJI has risen 63.8% of the time on the 10 trading days following
August 19th.
NYSE breadth did weaken a little today. The ratio of advancers to decliners
was still better than 3:2. Since August 8th, 7 of the last 9 days have seen
more
than 1992 NYSE advancers. I will test such numbers tomorrow night and
see how close we are to a Buy B4. This Peerless Buy is based on a sudden
big improvement in the A/D Line. It can signal a new leg up in a long bull
market. See June of 1987 for example.
The A/D Line is very closing to making a new high. Usually tops in September
and October occur with the A/D Line lagging. This strength in the A/D Line,
of course, owes a lot to Janet Yellen's "dovishness" as head of the Fed.
Since we
do not now see rising gold, oil or commodity prices, she will probably be in a
strong position to keep rescuing the market when it starts to succumb to profit-taking
and bearish fears. Speculators have been cautious and somewhat slow to appreciate
just how wedded she is to low interest rates. If the SP-500 and NASDAQ can get
past their round number barriers, we may yet see a wild and climactic, vertical ascent,
not because the economy is getting stronger, but precisely because it is not, and
folks therefore need a better way to make more money.
--> 78
MAXCP
stocks Bullish MAXCP Stocks (8/19/2014) Bullish
plurality
Highest A/I 200 DJI-30 Stock - CAT
--> 54
MINCP stocks Bearish MINCP
Stocks (8/19/2014)
-->
58 New Highs on NASDAQ
23 new lows. Bullish plurality
-->104 New Highs on NYSE 12 new
lows.
Bullish plurality
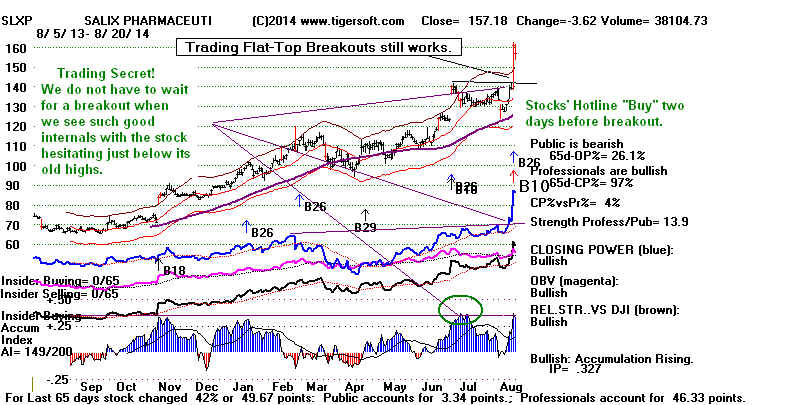
SLXP (below) Seems To Be A Classic Flat-Topped
Breakout:
1) Multiple Buy Signals
2) Red High Volume Breakout.
2) Very High Accumulation even before the breakout.
4) Closing Power new high.
5) Relative Strength new high.
The Public are not buyers here. That should make a new Closing Power uptrend
work well once it is established. If a new buyer for the company enters the
picture, the stock will really take-off.
SALX's 20% run-up today shows the virtue still of looking for stocks at
flat topped resistance with relatively high Accumulation. If
after breaking
out, such stocks stall at their upper bands with red high volume, churning and
reversal days, they probably should be sold when their Closing Power uptrends
are broken. 2014 has had an abormally high number of big 20% jumpers that
quickly faded. This is especially true in low priced stocks with
relatively
weak Closing Power and Accumulation. I see no reason to be a
"buy and
holder" at this late point in the bull market.
====================================================================================
OLDER HOTLINES
====================================================================================
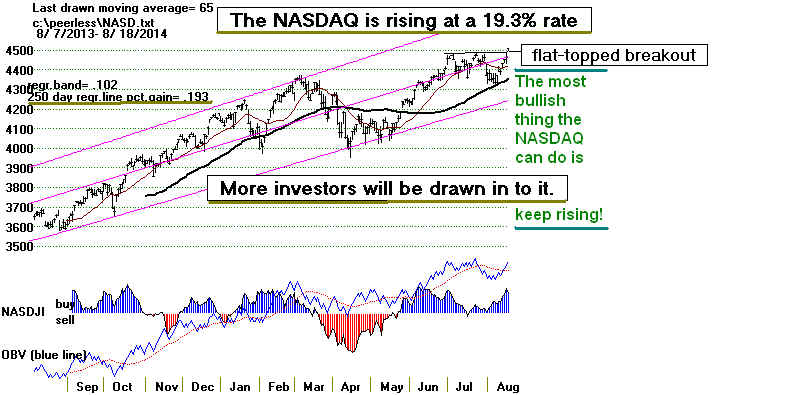
8/18/2014 Lots of
Bullish Technical Signs. We should be
flexible here. The NASDAQ is now breaking above flat, well-tested
resistance. It could be on its way to challenge its high just above
5000 way back in the year 2000. Peerless was also on a Sell Signal
back then. So long as the key ETFs' Closing Power trends are up,
expect higher prices. This speed of this reversal is bound to cause
some grief among short sellers.
Yellen's Definition of "Full Employment"
The FED remains a very bullish force. We've seen many cases when
the FED has quickly intruded and prevented an incipient market decline from
getting much worse. Just a few "hints" about the need to keep
rates low until the employment picture is better does the job. And now
if rates are not raised until Janet Yellen's definition of "full
employment"
is reached, the bull market could continue much longer than folks expect.
The change that Yellen brings to the Fed in this respect is all-important.
See
http://www.moneynews.com/Economy/Federal-Reserve-Janet-Yellen-Full-Employment-Jobs/2014/05/20/id/572269/
> To
Key Index and Leading Stock Charts: DJI, SP-500, etc.
Peerless DJI Chart
SPY Chart NASDAQ Chart QQQ
Chart
IBB Chart
IWM Chart
Hourly DJI-OBV Hourly-MVM0735
FAS-3x Financials IBB-Biotechs
-----------------------------------------------------------------------------------------------------------------------------------------------------
--> 48
-24 MAXCP
stocks Bullish MAXCP Stocks (8/18/2014) Bullish
plurality
Highest A/I 200 DJI-30 Stock - CAT
--> 95
+41 MINCP stocks Bearish MINCP
Stocks (8/18/2014)
Retail Stocks with Multiple Pot-Holes of Insider Selling
AEO, EXPR, CHS,
ASNA, SSI, ANN
Sharp declines Friday by DDS (Dillards) and JWN (Nordstroms)
-->
28 New Highs on NASDAQ 22 new lows. Bullish
plurality
--> 45 New Highs on NYSE 13
new lows. Bullish plurality
The Bullish Technical Signals
That Traders Must Be Able To Spot
The Peerless Sell was a weak signal. That was our best clue that a
reversal could come. But there were many others. They must be factored
in if we want to trade aggressively and avoid some big losses by being short
in violent up-drafts that often come late in a bull market.
For the fifth time in the last 7 days, there were more than twice
as many advancers on the NYSE as decliners. Orthodox Peerless users
should know that we could be getting a Buy B4 soon. This is based on a
dramatic improvement in either NYSE breadth or the IP21.
But even if we do not get a Buy B4 signal, there have been lots of technical signs
recently that have suggested a spirited rally. Whether you're looking at
individual stocks, ETFs or indexes, know that a reversal upward can take
place when:
1) The DJI rallies up from or back above its rising 200-day
ma with a big
move and excellent breadth.
2) Earlier bulges of Accumulation (above +.375) tell us that Closing
Power downtrends are usually reliable Buy signals. See the many
ETF's IP21 bulges in July and recent CP trend-breaks. SPY, IWM, DIA, QQQ
etc.
3) The rising 65-day is closed above with the P-Indicator or IP21 positive.
DJI and QQQ show examples of
this.
4.) Broken well-tested resistance (neckline in H/S patterns) should reverse
the next rally. When instead prices quickly get back above the H/S neckline
and the 65-dma resistance, at a minimum, expect a short-covering rally.
This seems to be developing now in MDY.
5.) The apex of the right shoulder in the current head shoulders pattern
is broken above. This appears to have happened, for example, with QQQ
and very important stocks like AAPL and CAT.
6.) The DJI, SP-500 or NASDAQ make breakouts above well-tested resistance.
That is what NASDAQ is doing now.
Look for A Reversal back Upwards
by Oil Stocks
Keep an eye on APA (Apache, which has just discovered a very large deposit of
oil in Australia). It is holding at its rising 65-dma and shows a recent bulge of
Accumulation. By our Closing Power rules, any CP hook back up will be a
good buy signal.
====================================================================================
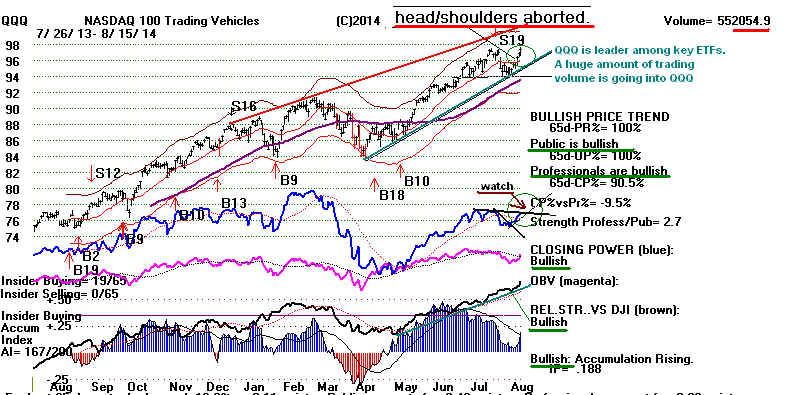
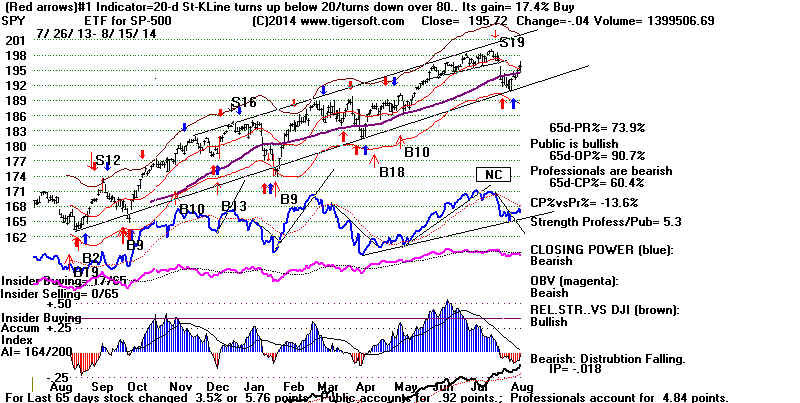
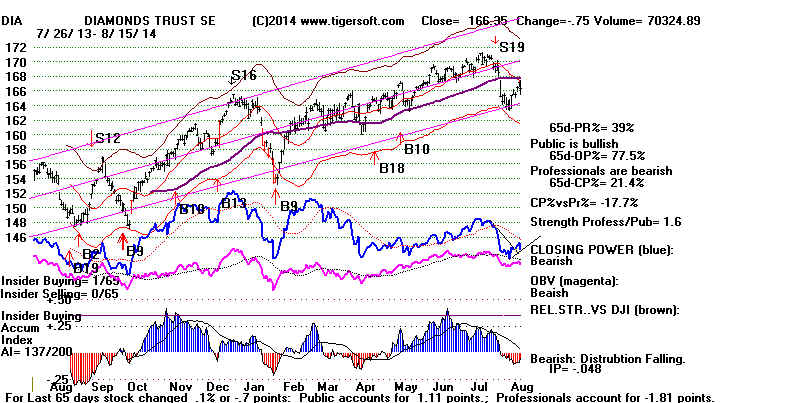
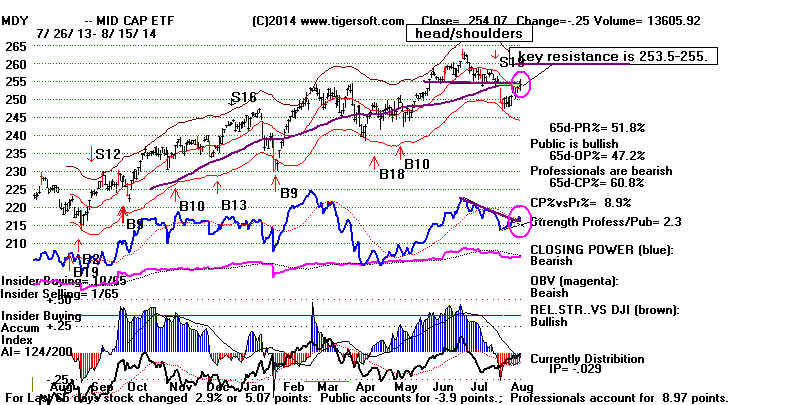
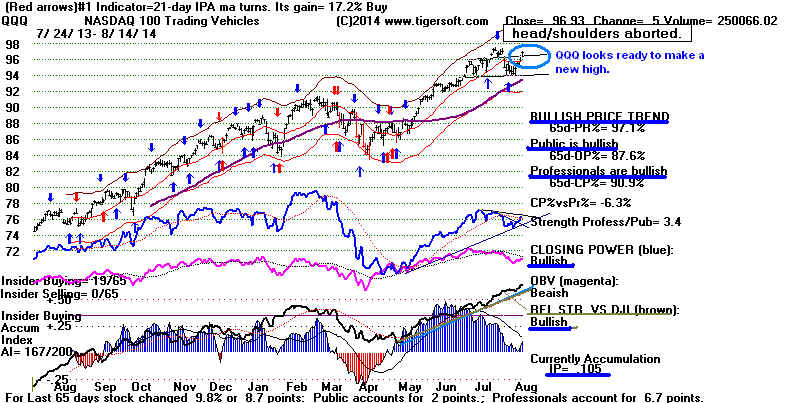
8/15/2014 The
QQQ seems ready to make new highs now, but DIA and
MDY are still below key resistance. This is not strange or without precedent.
In the final stage of the 1994-2000 bull market, performance driven funds ran
up QQQ and BBH a long ways in the three months after the DJI topped out.
The low interest rates now add an additional complication as NYSE dividend stocks
continue to hold up well now even as other consumer-based groups, like Retail
stocks, show signs of starting a new leg down. Biotechs also have the appeal
of not being directly dependent on the economic cycle.
Friday's downturn owed to misconstrued reports that Russia and Ukraine were
on the verge of war. Since these fears were over-exaggerated, I would think the
markets will rise strongly on Monday. In this way, the market keeps eating
away
the over-head supply of stock.
It will help, as I've said, to emphasize sectors now. Peerless is based on and
predicts
the DJI best. So, it's still approriate that Peerless has not yet reversed the
Sell S19.
The market does usually gets a seasonal boost as it goes into September. But be
careful.
Despite the low interest rates, there are many more bearish looking MINCP stocks
than bullish looking MAXCPs.
Retail stocks were hurt on Friday as Dillards and Nordstrom's fell sharply.
Many of them show steady insider selling. Shorting some of them now seems a good way
to stay hedged while being long QQQ.
COMBINATIONS

I had lunch last week with a professional boxer. I asked him what was the biggest
difference between a Pro and an Amateur. He said many things. But what made
an impact on me, was how a Professional Boxer learns and practices combinations.
Ever since then, I've been thinking about how Tiger's major Buy signals combine
in different situations. And I've now examined 2000 charts to better understand
how the Buy B10-B12-B20-B24 combinations.
This weekend's study of biotechs is cautious. It concludes that we must trade
these now with new Tiger rules (linked to below), rather than trying to find some
big winners and holding tightly. What's also dismaying now is the absence
of good biotechs now with fresh major Buy signals.
New Study Today - Trading Tactics
for Biotechs Using Major Tiger Buy Combinations,
This makes use of Closing Power Hooks, Red High Volume Reversals at Upper Band
and Head/Shoulders tops. For much more information (theory, trading tactics and
examples), get TigerSoft's new Explosive Super Stocks.
-----------------------------------------------------------------------------------------------------------------------------------------------------
> To
Key Index and Leading Stock Charts: DJI, SP-500, etc.
Peerless DJI Chart
SPY Chart NASDAQ Chart QQQ
Chart
IBB Chart
IWM Chart
Hourly DJI-OBV Hourly-MVM0735
FAS-3x Financials IBB-Biotechs
-----------------------------------------------------------------------------------------------------------------------------------------------------
--> 48
-24 MAXCP
stocks Bullish MAXCP Stocks (8/15/2014) Bullish
plurality
It's hard to see a sector pattern right now
among the leading Bullish MAXCPs.
That begs the question of whether bullish special situations are enough to lead
prices
much higher.
Highest A/I 200 DJI-30 Stock - CAT
--> 95
+41 MINCP stocks Bearish MINCP
Stocks (8/15/2014)
Retail Stocks with Multiple Pot-Holes of Insider Selling
AEO, EXPR, CHS,
ASNA, SSI, ANN
Sharp declines Friday by DDS (Dillards) and JWN (Nordstroms)
-->
28 New Highs on NASDAQ 22 new lows. Bullish
plurality
--> 45 New Highs on NYSE 13
new lows. Bullish plurality
====================================================================================
OLDER HOTLINES
====================================================================================
Give The Market More Chance To Advance
8/14/2014
The market keeps eating away the over-head supply of stock and refuses to
sell-off. Usually, a close back above a rising 65-dma is bullish. That
is what the SP-500
has just done. Usually, a close above a tentative head/shoulders pattern's right
shoulder
apex is bullish. That is what QQQ has accomplished today.
Both Professionals and The Public Are
Bullish Now on QQQ.
The DJI May Continue To Lag QQQ
The weak Peerless S19 on the DJI has not been reversed.
Rather I would say it has
been "suspended" in dererence to the obvious short-term bounce we have seen
up off the DJI's rising 200-day ma. In addition, we know from the period Janary-
March 2000, that the QQQ can rally very strongly even with a more powerful
Peerless Sell S9 is in place in the final stages of a bull market.
Given the length of the current bull market 's rise without as much as a 10% correction,
it is probably best to trust the Professionals's skepticism of the advance and stay
short a few of the Bearish MINCP stocks.
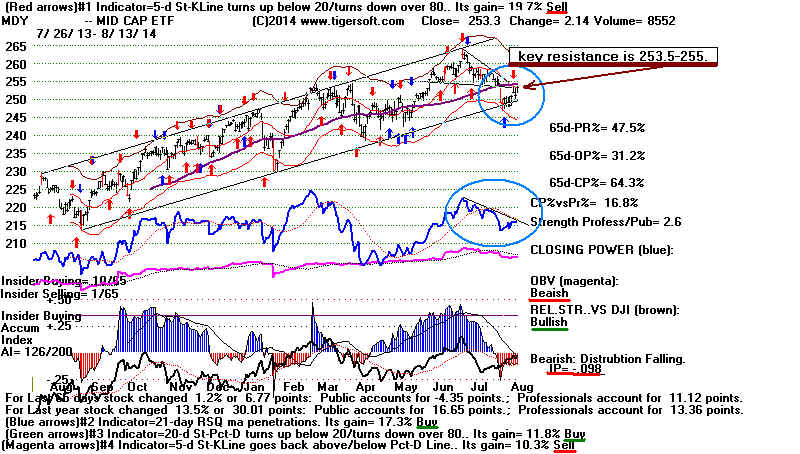
The bullishness in SPY and QQQ has to tempered because we
note that the DJIA and DIA
are not back above their flat 65-dma resistance and because MDY
(representing the mid-caps)
has only just reached its 65-dma and the neckline resistance of its classic head/shoulders
pattern. But as long as the short-term Closing Powers keep rising, I would stay
bullish QQQ and SPY. Keep in mind that Friday's have produced daily gains
59.6%
of the time over the last year for SPY.
Gold (GLD) has not had a big surge, thereby warning us of a
market top. It is the same level
it was a year ago, 6 months ago and also 3 months ago. In addition, Oil prices are falling again.
This puts money in the pocket of consumers. The yield on 10-year
Treasuries is again under
2.4%. Food prices continue to drop, judging by looking at DBA.
This, too, makes it harder
for the Hawks in the FED to argue that inflation (apart from in stocks) is a big
enough
threat to raise interest rates.
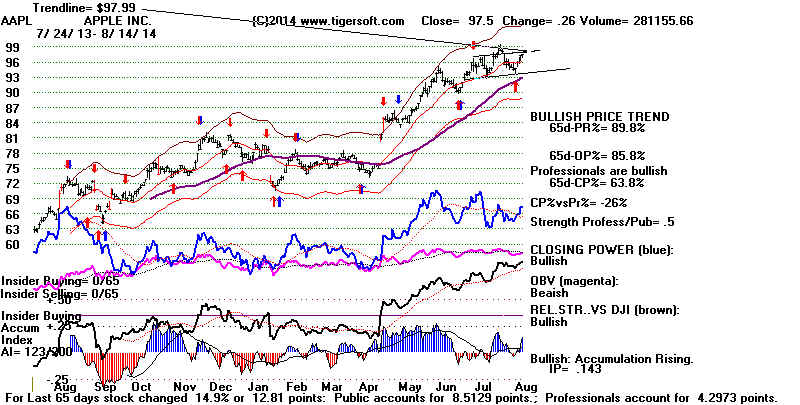
Watch AAPL...
Let's watch AAPL (below) to see if it can keep rallying, thereby destroying its
potential head/shoulders. A jump in AAPL next would likely cause a burst of
short-covering in it and also in QQQ.
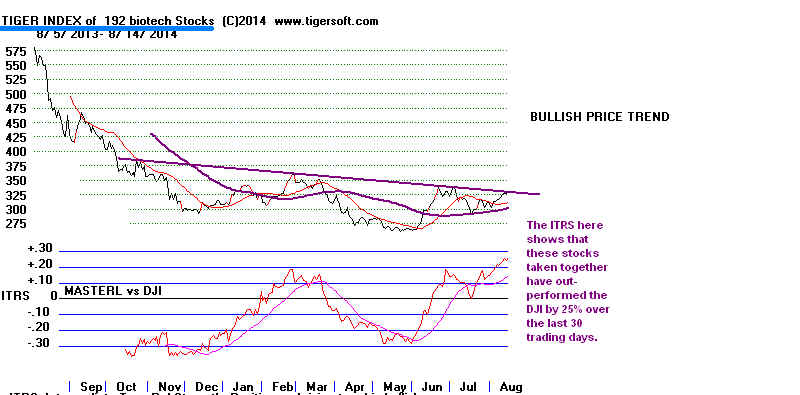
And Biotechs
We see now a handful of bigger biotechs like AMGN and GILD lifting QQQ.
The Ebola crisis will likely intensify public and private investment in biotechs.
Let's watch the upswings in FBIOX and BBH to see if they continue and if this
bullishness then spreads to smaller biotechs. Look for more on specific biotechs
this
weekend. It should be noted now that our broadly based Tiger Biotech Index has
out-performed the DJI by 25% over the last 50 trading days.
> To Key Index and Leading Stock Charts: DJI, SP-500, etc.
Peerless DJI Chart SPY Chart NASDAQ Chart QQQ
Chart
IBB Chart
IWM Chart
Hourly DJI-OBV Hourly-MVM0735
FAS-3x Financials IBB-Biotechs
--> 72
-2 MAXCP
stocks Bullish MAXCP Stocks (8/14/2014) Bullish
plurality
It's hard to see a sector pattern right now
among the leading Bullish MAXCPs.
That begs the question of whether bullish special situations are enough to lead
prices
much higher.
Highest A/I 200 DJI-30 Stock - CAT
--> 54
-23 MINCP stocks Bearish MINCP Stocks
(8/14/2014)
--> 29 New Highs on NASDAQ 27 new lows. Bullish
plurality
--> 48 New Highs on NYSE 11
new lows. Bullish plurality
====================================================================================
OLDER HOTLINES
====================================================================================
8/13/2014 The DJI
moved up 91 on the best breadth so far in this 4-day rally
up from the rising 200-day ma. Low interest rates continue to be an elixir for
many, many dividend stocks. But now the market's rally will start facing much
keener resistance. It should will take more than higher openings to advance
the market. The recovery must now get past the selling by NY based institutions
and professionals at the classic short-term resistance levels now presented.
> To Key Index and Leading Stock Charts: DJI, SP-500, etc.
Peerless DJI Chart SPY Chart NASDAQ Chart QQQ
Chart
IBB Chart
IWM Chart
Hourly DJI-OBV Hourly-MVM0735
FAS-3x Financials IBB-Biotechs
--> 74
+17 MAXCP
stocks Bullish MAXCP Stocks (8/13/2014) Bullish
plurality
It's hard to see a sector pattern right now
among the leadin Bullish MAXCPs.
That begs the question of whether bullish special situations are enough to lead
prices
much higher.
Highest A/I 200 DJI-30 Stock - CAT
--> 66
+2 MINCP stocks Bearish MINCP Stocks
(8/14/2014)
--> 32 New Highs on NASDAQ 23 new lows. Bullish
plurality
--> 46 New Highs on NYSE 17
new lows. Bullish plurality
Distribution Is Still Apparent
I noticed that of the 38 Russell-1000 stocks that were up by more than 5% in the last
4 days, a majority, 20, have negative Accumulation Index readings (IP21). If
the rally's
leaders are facing so much distribution, can it keep going? I think the answer is
"YES" because it is the the Dark Pool buying in the major market ETFs which
is most doing the heavy lifting in here; in effect, the derivatives' tail is quite ready
to wag
the dog, the rest of the market. But now we will see just how determined the
boosters of ETFs really are.
Over-Head Resistance Now Facing the Key ETFs
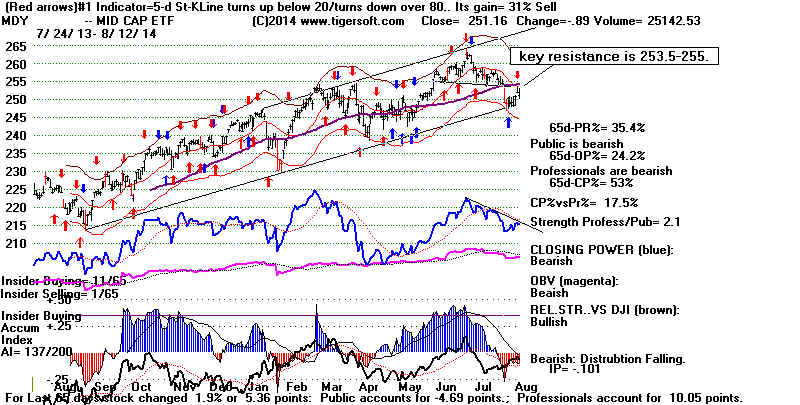
MDY 253.3 Even though its volume is the lowest of the
ETFs, this is arguably the most
important ETF now. It has formed a classic head and shoulders pattern. And now
it has rallied
up to the combined resistance of (1) its neckline, (2) its its 65-dma, (3) its
price-downtrendline
and (4) its falling Closing Power. A breakout here above so much nested resistance
at
255 combined with its Closing Power rising up past its down-trendline should be quite
bullish and give it a new start, I think, especially considering the very high level of
Accumulation
it showed in June. But if it reverses back down from here, prices could break their
year-long
uptrend and all the institutions that bought above 260 will have to make the key decision:
"Do they want to cut their losses or "double-down"?
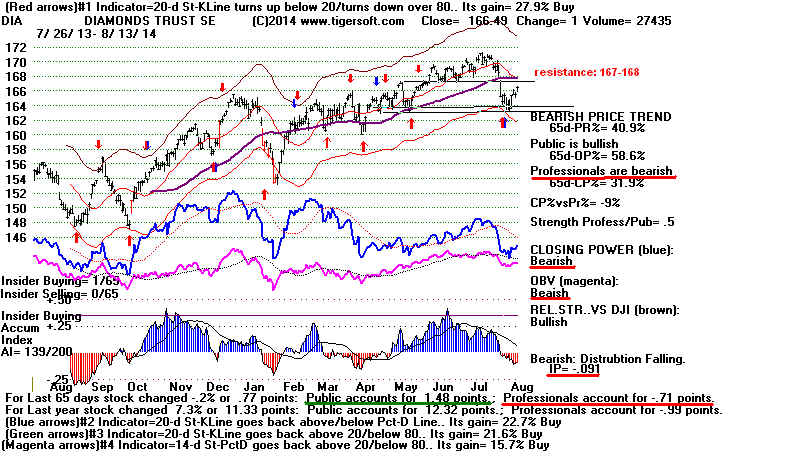
DIA 166.49
Resistance here from a right shoulder apex and the 65-dma will be
keenest between 167 and 168, only
1% away. Our Tiger chart shows that IP21= -.091.
The 100-day Closing Power is
lagging Opening Power. This means that the
Public is net bullish, but
Professionals are still net bearish. All the DIA's optimized
short-term Stochastics remain on
Buys for the present. We must give the DIA
more opportunity to keep rising.
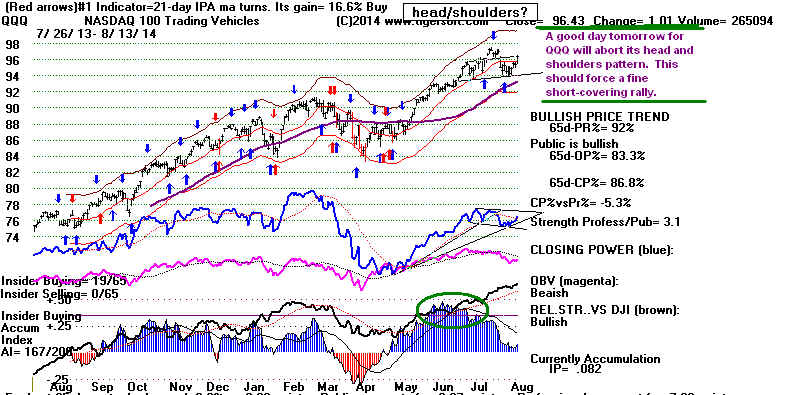
QQQ
96.43 Watch to see if the QQQ can destroy its bearish looking head/shoulders
pattern by
rallying above its theoretical right shoulder apex. Given all the earlier
Accumulation, I
would think that the QQQ should then quickly jump to new highs,
even if DIA and
MDY do not breakout. In the case of the QQQ, it will particularly
bullish if the
Tiger chart of the Russell-1000 (shown below) can also get past
its 65-dma and
have its A/D Line downtrend be broken.
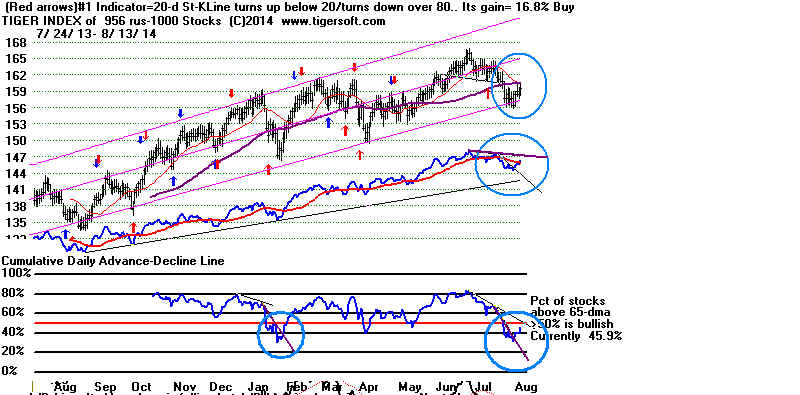
TigerSoft Chart of Russell-1000
====================================================================================
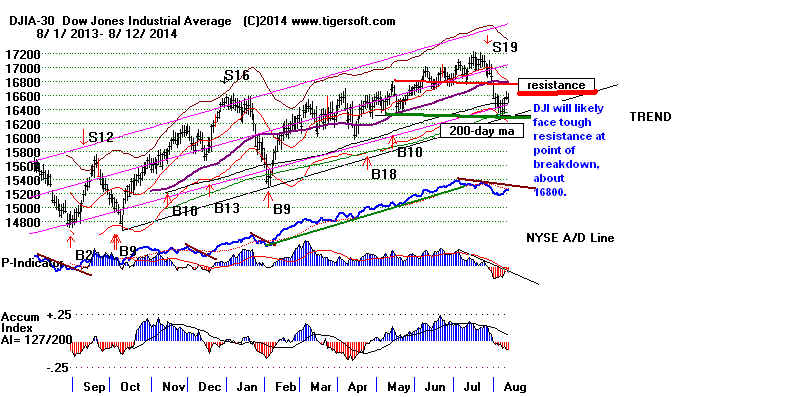
8/12/2014 The Peerless Sell S19 is un-reversed. But S19s are not powerful
sell signals, only averaging 3.4% at the time of its reversal. (1971 is an
exception;
there a bearish DJI head/shoulders pattern also unfolded.)
The DJI has now rebounded up from its rising 200-day ma. In the last few years,
such rebounds have each continued higher and been profitably traded on the long side.
Word is getting out that the FED is in no position to stop supporting the market.
Leading economists are now calling the current US economy a "secular
stagnation".
This, they say, is not self-correcting. And with government frozen, real economic
growth is not foreseen.
http://www.econ.brown.edu/fac/gauti_eggertsson/papers/Eggertsson_Mehrotra.pdf
http://krugman.blogs.nytimes.com/2014/05/07/three-charts-on-secular-stagnation/?_php=true&_type=blogs&_r=0
So, even though there is no Buy signal, I have suggested covering most short sales
and going long a few bullish special situations. The rebound statistics suggest the
odds are a little better than even that the DJI will directly recover back to its 2.5%
band.
But we can watch the various markets' progress as they challenge resistance levels
overhead. Today's decline did not end at the day's lows. Buyers have not
exhausted
their capital yet.
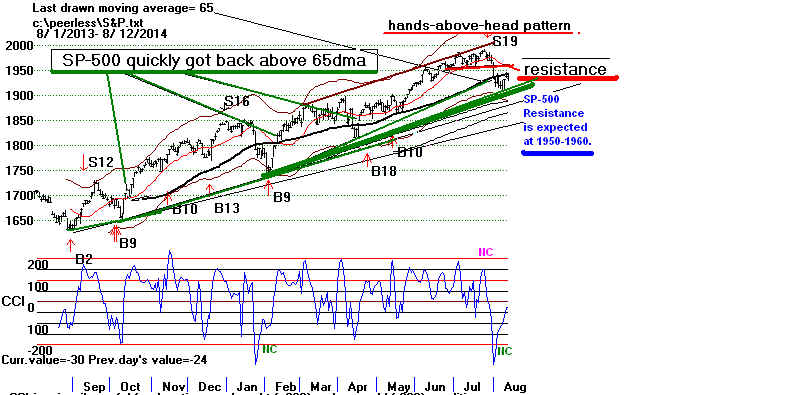
To do this, we will see the SP-500 quickly get back above its 65-dma, just like it
has on three other occasions this past year. If it can do that, it should rally to
1950-1960.
-----------------------------------------------------------------------------------------------------------------------------------------------------
> To
Key Index and Leading Stock Charts: DJI, SP-500, etc.
Peerless DJI Chart SPY Chart NASDAQ Chart QQQ
Chart
IBB Chart
IWM Chart
Hourly DJI-OBV Hourly-MVM0735
FAS-3x Financials IBB-Biotechs
--> 57
+2 MAXCP
stocks Bullish MAXCP Stocks (8/12/2014)
Highest A/I 200 DJI-30 Stock - CAT
--> 64
+23 MINCP stocks Bearish MINCP Stocks
(8/12/2014) Bearish plurality
--> 28 New Highs on NASDAQ 33 new lows. Bearish
plurality
--> 25 New Highs on NYSE 17
new lows. Bullish plurality
-----------------------------------------------------------------------------------------------------------------------------------------------------
Index Benchmarks To Watch
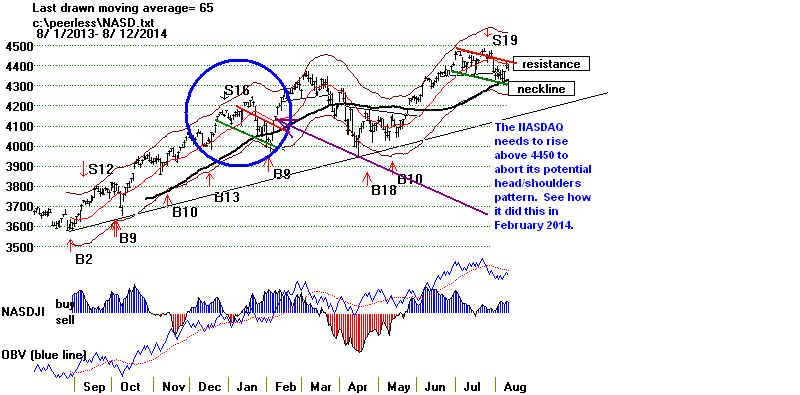
It is in the NASDAQ that we may see the biggest advance provided it
can destroy its potential head/shoulders pattern by surpassing 4450.
See below how it rose sharply up for two more weeks when it got past
the potential resistance of a right shoulder apex in February 2014.
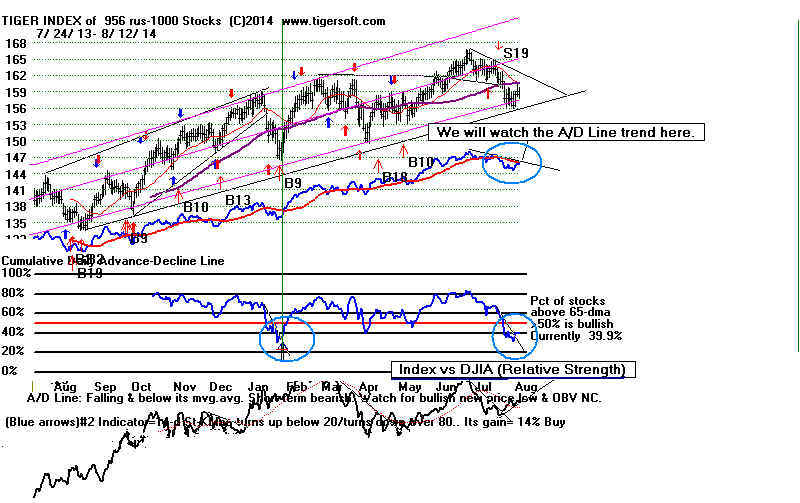
Our Tiger Index of the Russell-1000 (actually only 956) stocks shows
the key A/D Line downtrend that must be broken to boost this index
up past the resistance of its purple 65-dma. We will report on it each
night until its emergent pattern becomes clearer.
The Midcaps' ETF - MDY - shows the technical problems with this advance
most clearly. See its classic head/shoulders pattern. The neckline of the
pattern has already acted as resistance. To make a bigger move higher,
watch to see if MDY's Closing Power can break its downtrend. Since there
was previously a bulge of intense Accumulation, such a CP breakout
above its downtrendline will be quite bullish, especially if MDY can get
back above its 65-dma.
====================================================================================
OLDER HOTLINES
====================================================================================
8/11/2014 The Peerless Sell S19 is un-reversed. That suggests that
the current DJI rally may not get past the 65-day ma without a re-testing of the
lows of early last week. However, I have shown rebound statistics which set the
odds of a direct recovery back to the 2.5% upper band (about 4% higher than now)
at slightly better than 50%.
In addition, let's recall that there have been three recent very good rallies
up off the DJI's rising 200-day ma in the last two years. Their key values were
comparable to now. In fact, as you can see below in Table 1, the P-I daily change
was
higher Friday on its rebound than on any of the three recent successful
"bounce-days".
Moreover, on the three earlier bounces up off the rising 200-day ma, the
V-I was lower as was the 65-day pct change. So, more of a recovery should
not come as a surprise, though I think we have to consider the key ETFs one by
one.
-----------------------------------------------------------------------------------------------------------------------------------------------------
> To
Key Index and Leading Stock Charts: DJI, SP-500, etc.
Peerless DJI Chart SPY Chart NASDAQ Chart QQQ
Chart
IBB Chart
IWM Chart
Hourly DJI-OBV Hourly-MVM0735
FAS-3x Financials IBB-Biotechs
--> 55
+11 MAXCP
stocks Bullish MAXCP Stocks (8/11/2014)
Highest A/I 200 DJI-30 Stock - CAT
--> 41
-32 MINCP stocks Bearish MINCP Stocks
(8/11/2014)
--> 35 New Highs on NASDAQ 21 new lows. Bullish
plurality
--> 42 New Highs on NYSE 8 new lows. Bullish plurality
-----------------------------------------------------------------------------------------------------------------------------------------------------
------------------------------------------------------------------------------------------------------------------------------------------------
Table 1
Key Values of Days of Recent Bounces up off the Rising 200-dma
la/ma ann-roc P-I
PIch IP21
VI OPct 65-dat
Pct Change
6/6/2012 12414.79 .992
-.563 -266 +97 -.027 -191
-.485 -.04
10/10/2013 15126.07 .992 -.156
-11 +11 -.116 -108 -.234
-.011
2/6/2014 15628.53 .973
-.667 -16 +27 -.095 -121
-.0357 0
current 8/8/2014
16553.93 .983
-.255 -154 +135 -.049 -91
-.066 .002
------------------------------------------------------------------------------------------------------------------------------------------------
Consider The Major Market ETFs Individually.
DIA 165.55 Its CP turned down (bearish). I
reckon its resistance now
at 167.16 and at 168, where its 65-dma now crosses.
SPY 193.79 Its CP turned flat today. It
closed at its low after being turned back
at its still rising 65-dma. Normally, I would expect a CP breakout here to be
bullish for SPY since there has recently been a great bulge of Accumulation.
MDY 252.05. It also closed at its low for the day
after tagging the resistance
of the combined 65-dma and the head/shoulders neckline. Its CP is still
in a downtrend. Shorting at the neckline at 249 might seem reasonable here.
However, there is also a previous bulge of intense Accumulation which would make
any CP trend-break look quite bullish were it not for the head/shoulders pattern.
A close by MDY by +.40 above its opening would break the CP downtrend.
QQQ 95.46. It has broken its short-term CP downtrend
following a big bulge of
insider buying (IP21>.375). This is reliably bullish. Now it must surpass
96.4 to destroy
the potential head/shoulders here. AAPL should be
watched in this connection, as
it is the biggest component of QQQ. It is possible that it may be forming a bearish
head/shoulders pattern.
IWM 113.34 It has broken its short-term CP
downtrend following a big bulge of
insider buying (IP21>.375). This is reliably bullish. Now it must surpass
114.5 to
get back above the resistance of its flat 65-dma.
Conclusion
Our Tiger Stocks' Hotline is still a few stocks, but has covered 80% of
the previously shorted positions. I would buy a few more of the Bullish
MAXCP stocks posted tonight and await developments regarding the
major market ETFs.
Speculators Are Busy Just Now
Watching and Trading a Small
Canadian Drug Company.TKMR
with a promising new treatment against
the Ebola Virus.
http://finance.yahoo.com/news/tekmira-pharma-soars-fda-announcement-193002556.html.
15 hours ago.
30
might seem to be a natural price magnet for the stock. But I would prefer to trade
with
a better defined Closing Power trend.
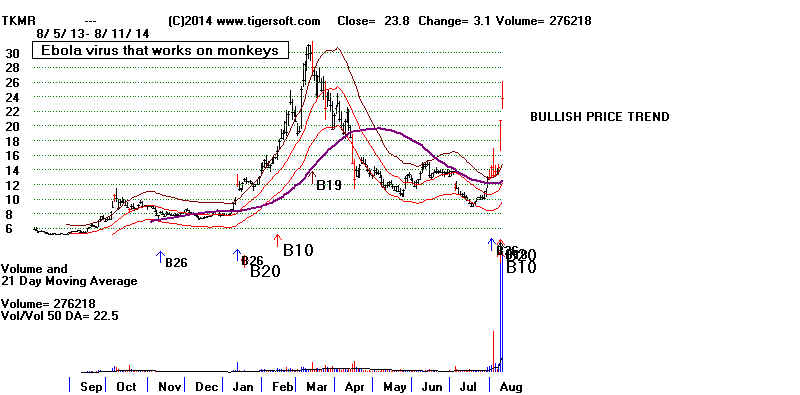
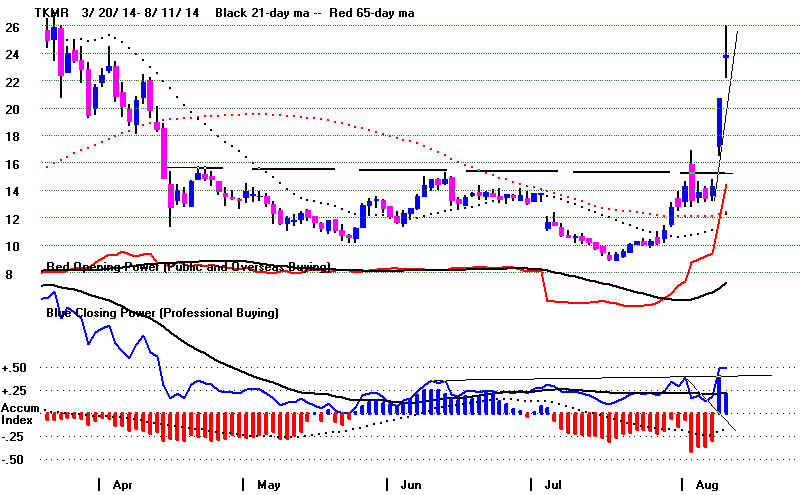
====================================================================================
OLDER HOTLINES
====================================================================================
8/8/2014 The Peerless Sell S19 is un-reversed. Falling 10-year interest rates
plus a grim
determination by the President finally to curb ISIS cruel jihadism led to
a patriotic rally
by the DJI up off its rising 200-day ma. Unfortunately, the Eastern
Ukraine violence
and the Israeli-Palestinean war continue to over-hang the market.
The DJI rose 1.4%
on Friday after retreating more than 4% from its recent high.
I looked back at
other earlier cases like this since 2000. There were 26 cases. In one
case it went
sidewise for a month. The other 25 cases saw more decisive moves:
in 14 instances, the DJI immediately rose more than 5%. (53.8%)
in 5 instances, the DJI fell between 1%
and 4% before rallying 5% (19.2%)
in 6 instances, the DJI fell more than
5% or had started a bear market. (23.1%).
See this study of strong DJI rebounds since
2000.
We have covered most of our short sales on
our Tiger Stocks' Hotline. With the
Closing Power
downtrendlines violated in Friday's rally, covering shorts of IWM or
MDY seems
advisable if it was not done Friday as the SP downtrends were violated.
Another bullish factor seems woth mentioning. The size of the change between
Friday's
opening and
Friday's close gave a bigger blue bar on the Tiger Candle-Stick chart of the
DJI than any of
its recent red bars. This is seen often enough in breakout moves to
make me not want
to be short until we see the rally curbed. .
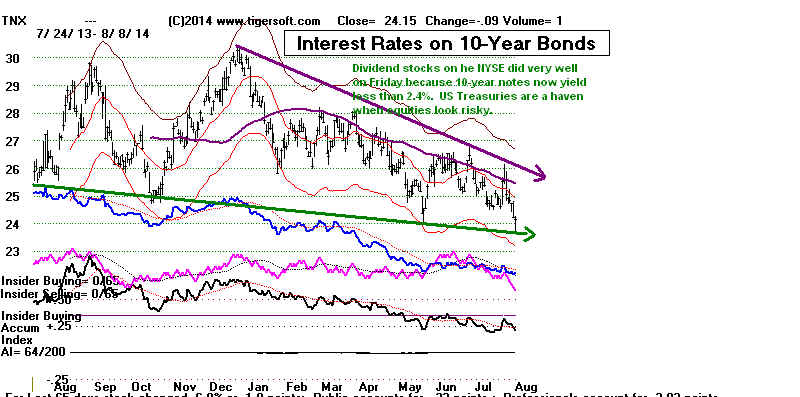
Limited Upside Potential
The problem with
becoming bullish now is how limited the upside potential seems.
Since 1965, the
DJI has risen only 48.9% of the time for the next two weeks since 1965
and 53.2% of the
time over the next two weeks. Interestingly, for the last year DIA has risen
a whopping 63.4%
of the time on Friday compared to 52%, 55.5%, 50% and 47.1% of the
time on Mondays,
Tuesdays, Wednesdays and Thursdays, respectively. Moreover,
there are many
more bearish MINCP stocks than bullish MAXCPs.
Support at the DJI's Rising 200-dma
Is Now Taking on Major Importance.
We know support
often comes in at the rising 200-day ma. But by itself such rebounds
do not always
rise enough to produce reliable Peerless intermediate-term Buy signals. A rally
back to the
167-168 level on DIA now seems quite possible, but that is hardly enough to
play. Some
of the Closing Powers did broke their steep downtrends. After a bulges
of Accumulation,
such breaks usually bring good advances, provided the stock or
ETF can het back
above thr 65-dma. In the candle-stick charts below you can spot
the resistance of
the RED dotted 65-dma and see the breaks in the blue Closing Power
downtrend at the
bottom of the charts.
A breaking by the
DJI of the rising 200-day ma will take on more significance now
that there has
been a rebound from it.
For now, DIA seems to be setting up for a rebound to 167.7
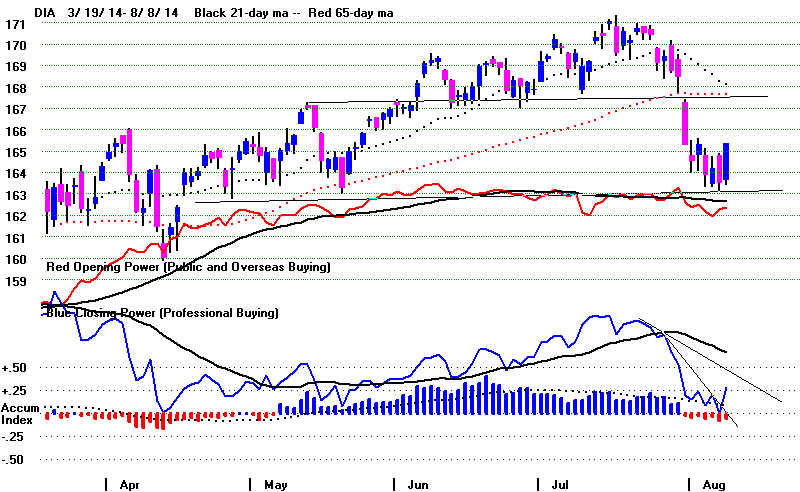
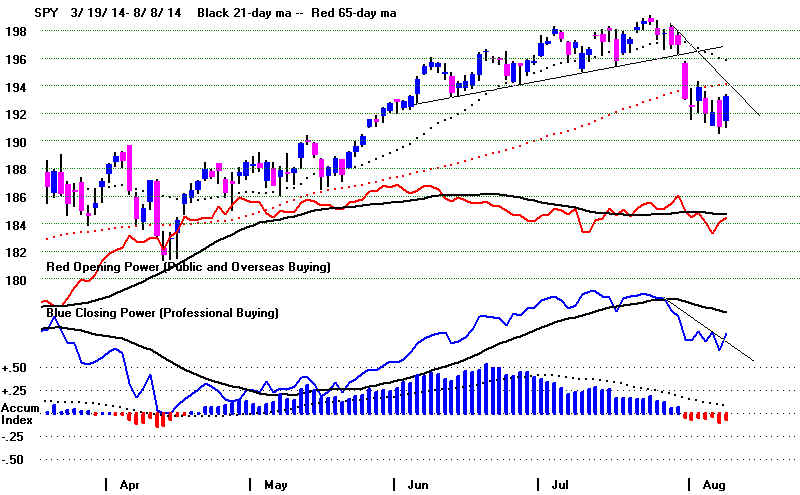
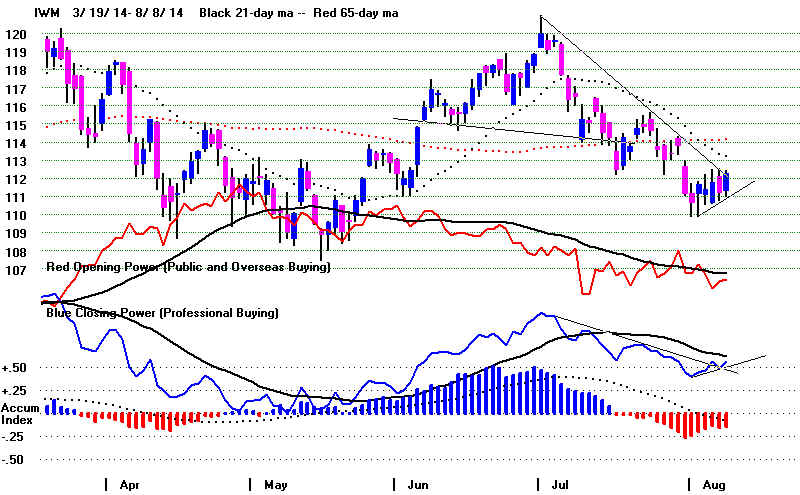
-----------------------------------------------------------------------------------------------------------------------------------------------------
Peerless DJI Chart
SPY Chart NASDAQ Chart QQQ
Chart
IBB Chart
IWM Chart
Hourly DJI-OBV Hourly-MVM0735
FAS-3x Financials IBB-Biotechs
--> 44
+19 MAXCP
stocks Bullish MAXCP Stocks (8/7/2014)
Highest A/I 200 DJI-30 Stock - CAT
--> 73
-56 MINCP stocks Bearish MINCP Stocks
(8/7/2014) Bearish plurality
--> 8 New Highs on NASDAQ 64 new lows. Bearish
plurality
--> 13 New Highs on NYSE 40 new lows. Bearish plurality
====================================================================================
8/7/2014 The Peerless Sell S19 is un-reversed. The V-I, ObvPct and
P-I are in
combination too low for a Buy B2 now. The Closing Powers
for the
major market ETFs turned down sharply today. Early strength
keeps
giving way to late-in-the-day selling. This suggests Professionals
selling
pressure is continuing. We should, I think, stay bearish until we either
get a
Peerless buy signal or the Closing Powers CPs break their
downtrends.
We need
more headroom. If the broken support levels of last week
are
considered where a good rally will turn back down from, then we
need to
back off further from this "ceiling" before buying. We also
need to a
much better assortment of bullish MAXCP stocks than the
meager list
we are now seeing.
There are lots of reasons to
be cautious now. The one I consider the
most
important is simple, namely that a 10%-13.5% DJI correction is
over-due.
> To
Key Index and Leading Stock Charts: DJI, SP-500, etc.
Peerless DJI Chart SPY Chart NASDAQ Chart QQQ
Chart
IBB Chart
IWM Chart
Hourly DJI-OBV Hourly-MVM0735
FAS-3x Financials IBB-Biotechs
--> 25
-20 MAXCP
stocks Bullish MAXCP Stocks (8/6/2014)
Highest A/I 200 DJI-30 Stock - CAT
--> 129
+46 MINCP stocks Bearish MINCP Stocks
(8/7/2014) Bearish plurality
--> 8 New Highs on NASDAQ 64 new lows. Bearish
plurality
--> 13 New Highs on NYSE 40 new lows. Bearish plurality
The DJI has
broken its steep uptrend. The key internal strength indicators
are declining and have turned negative. But the last rally was
not blatantly
unconfirmed by the A/D Line and the key internal strength indicators like
we saw in 1929, 1937, 1968-1969, 1972-1973, 1987, 1999-2000 or 2007-2008
when bear market followed. It is much more likely the current decline is leading
to a 10%-13.5% correction and not a bear market.

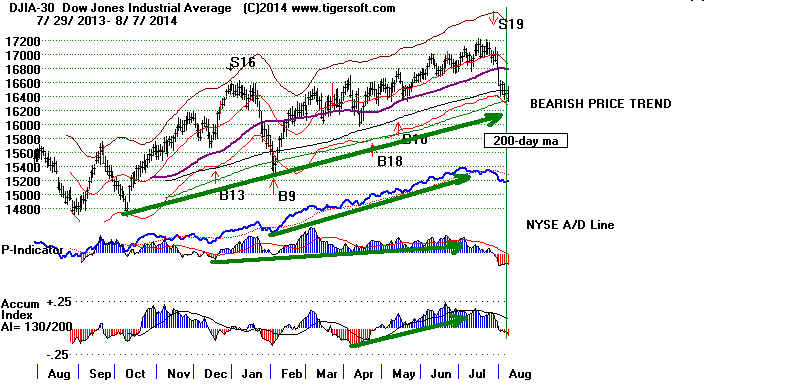
Why Is Yahoo Trying To Scare Investors?
Every few days Yahoo trucks out for its readers to see the ever-bearish
comments of the same very rich pundits, who keep decrying government
spending on even Public Works and who always seem ready to sack the
Federal Reserve in favor of the archaic Gold standard.
Billionaire
Tells Americans to Prepare For 'Financial Ruin'
Tonight Yahoo published a 4 months' old chart supposedly showing the
parallels between the market in 2014 with the market about to top
out in 1929. They failed to add the last four months' 5 months of DJI price
action this year. That makes all the difference. In the chart below, I have
continued the DJI's 2012-2014 price line with a red line representing the
rest of the DJI price movement since this parallel's chart was first published.
When you do this, we see the scary parallel has either failed or been much
delayed. Whereas the DJI plunged in after 9/3/1929, at the start of the
seventh quarter in this parallel's chart, the DJI actually has moved up
since February 2014.
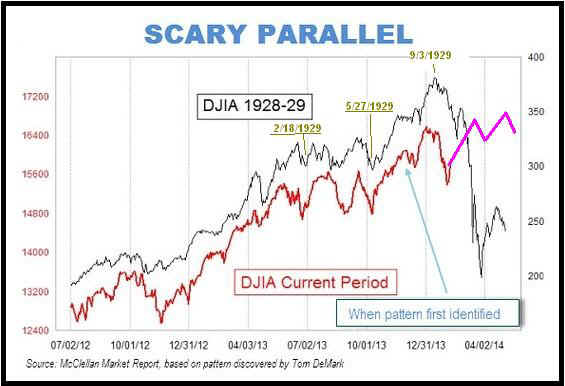
From a Peerless point of view, 1929 was extremely ripe for a decline, based
on the lengthy bearish divergence between the DJI's series of new highs and
the steadily falling A/D Line and mostly negative P-I and Accumulation Index
readings.
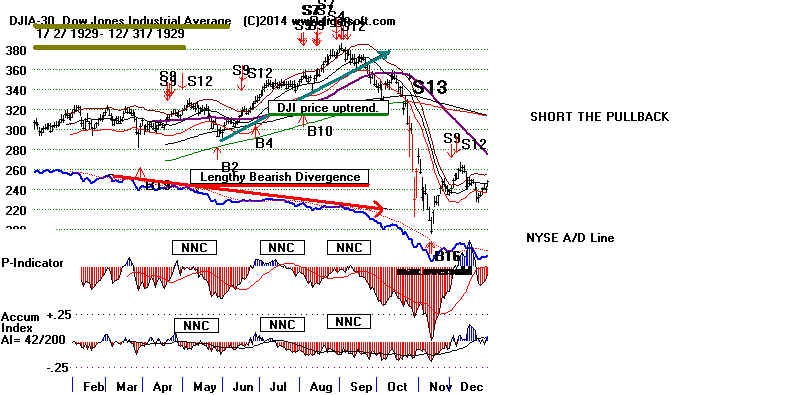
====================================================================================
OLDER HOTLINES
====================================================================================
8/6/2014 The Peerless Sell S19 is unreversed but the internal
strength
indicators are improving, especially the Hourly DISI (OBV)
Line.
All this improves the odds of a rally back up to the overhead
necklines'
resistances. Look at tonight's study of how the did at
the lower
band in August when key values approximated those now.
Still, we
are still only half way down to the 10% downside objective that
I still
consider a reasonable, simply because of how overdue such a decline
is.
See the three DJI and DIA charts below. We will want to watch the
falling A/D
Line for the 30-DJI stocks and falling oscillator representing
the percent
of DJI-30 stocks above their 65-dma is falling.
For Whom The Bell Tolls
There were
more bruising "pot-holes" for some well-known stocks.
Examples of stocks down more than 13% in today's trading.:
One Day AI/200
Pct Change
NUS NuSkin -20%
67
LINC Lincoln Ed
-20%
S Sprint.
-19%
89
WAG Walgreen -15%
114
TWX Time Warner -13%
90
GRPN GroupOn -13%
22
CTSH Cognizant -13%
147
SGMS Sci.Games -13%
84
NCMI Natl.Cinem.
-13%
97
These institutional mini-panics are
becoming more numerous. It makes
investors
and institutions alike wonder which will be the next stocks to
be
clobbered. Look at the lowest AI/200 stocks that start falling a lot for
ideas for
more short sales. Examples
ARIA -5%, AI/200=50
WLY -3% AI/200=32
QIWI -5%, AI/200=45
> To Key Index and Leading Stock Charts: DJI, SP-500, etc.
Peerless DJI Chart SPY Chart NASDAQ Chart QQQ
Chart
IBB Chart
IWM Chart
Hourly DJI-OBV Hourly-MVM0735
FAS-3x Financials IBB-Biotechs
--> 45
+15 MAXCP
stocks Bullish MAXCP Stocks (8/6/2014)
Highest A/I 200 DJI-30 Stock - CAT
--> 83
-42 MINCP stocks Bearish MINCP Stocks
(8/6/2014) Bearish plurality
--> 9 -3 New Highs on NASDAQ 31 -13 new lows. Bearish
plurality
--> 13 New Highs on NYSE 25 new lows. Bearish plurality
Sleep-Walking To War, as in 1914?
It still appears as though the US and
Russia are on a collision course
regarding
SE Ukraine where a majority of the people there would prefer
to be part
of Russia rather than part of Ukraine. Russia will not allow these
rebels to
be annihilated. And the US will likely keep aiding the Ukraine,
which will
not give up control of this area. This is a dangerous situation.
America
considers its power over-whelming. But Russian pride and
nationalism
are very real. This is already a hot conflict. There's no telling
when
Russian forces will be openly fighting Ukraine's. Then what will
Washington
and NATO do?
But technicals are supposed to factor all
this in. So, I would cover a few more
short
sales. But there hardly any attractive Bullish MAXCP stocks to buy.
With the
major market ETFs, IWM and MDY, I would accept the verdict of the
Closing
Power 21-dma. If the CP rises back above it, I would cover any
shorts in
them.
Assessing The Current Test
of The Lower Band.
If we were
give a Buy B2 (tagging the lower band) to today's key values
parameters,
how would past Buy B2s have worked out. The table below
helps
answer that question. The parameters I used were simple:
1) It must be August.
2) The DJI must be below the 2.5% lower band. ( la/ma < .975 )
3) P-I must not be below -300.
4) IP21 must not be below -.05.
5) OBV-Pct must not be below -.10
I found 12 cases
leaving out the 1990 instance where there had just been a Sell S9
Only in one case did a bear market continue without any rally.
(1977)
Here the DJI was already down 10% from its highs,
unlike now.
In
one more case, there was a paper loss of 4.4% (1939)
This, too, was as war neared.
In 3 cases, there was a paper loss between 2.% and 4%.
In
one more case, the paper loss was .94%
In 6 cases the DJI quickly rallied to the upper band without
a significant paper loss.
This would seem to suggest that the odds
are 10/12 (82.5%) that the DJI will rally
to the
upper 2.5% band at least in September. A paper loss of as much as 3.5%
did occur
in 33% of the cases.
                  Test Buy B2
             la/ma    annroc    AdjPi  PI-ch    IP21      V-I    OBV-Pct   65-day Pct Change
--------------------------------------------------------------------------
8/6/2004  .973  -.326  -264  +60  -.024   -100 -.069   -.006
     Current key values.....

(1-5)
--------------------------------------------------------------------------
8/8/1930  .949  -.233  -110  -39  +.015  -162  +.092  -.156
      DJI fell from 222.8 to 217.2 and then rallied to upper band in Sept.
      2.5% paper loss.
--------------------------------------------------------------------------
8/5/1931  .953  -.995  -198  +7   +.065  -222  -.079  -.105
      DJI immediately rallied to upper band.
--------------------------------------------------------------------------
8/12/1938 .963  +.059  -186  -15  -.015  -83   +.025  +.151
      DJI rallied to Sell S12 at upper 1.7% upper band.
--------------------------------------------------------------------------
8/10/1939 .966  +.034  -92   -49  -.049  -3    +.120  +.026
      DJI fell from 137.3 to 131.3 on 8/24 and then jumped to 154.1 on 9/13
      4.4% paper loss.
---------------------------------------------------------------------------
8/31/1954 .971 -.474  -264   -46  +.026  -306  -.089  +.025
      DJI immediately rallied from 335.8 to 362.3
---------------------------------------------------------------------------

(6-10)
8/6/1968  .975 -.276  -228  +17   -.027  -10   -.086  -.023
      DJI immediately rallied from 876.92 to 967.49 on 10/21/1968
---------------------------------------------------------------------------
8/13/1973 .969 -.167  -164  -25   +.022  -1    +.202  -.060
     DJI fell from 883.2 to 852.9 and then rallied to 977.76 on 10/8/1973
     3.4% paper loss.
---------------------------------------------------------------------------
8/12/1977 .972  -.423 -195  -20   +.034  -3    +.243  -.07
     DJI continued to fall, from 871.1 to 801.54.
---------------------------------------------------------------------------
8/8/1983  .965  -.435 -443  -32   -.029  -14   -.043   -.047
     DJI immediatedly rallied from 1163.06 to 1284.65 on 10/10/1983
---------------------------------------------------------------------------
8/10/1988 .969  -.331 -262  -28   +.042  -15   +.089   +.018
     DJI fell from 2034.14 to 1990.22 and then rallied to 2183.5 on 10/21/1988
     2.2% paper loss
---------------------------------------------------------------------------

8/3/1990  .959  -.282 -308  -26   +.120  -25   -.093   +.044
     ==> S9 on 7/19
     DJI fell from 2809.65 to 2365.10 on 10/11/1990
--------------------------------------------------------------------------

(11-12)
8/15/1997 .953  -.480 -78   -55  -.043   -37   +.034    +.056
     DJI fell from 7694.66 to 7622.42 and then rallied to upper band.
     0.94% paper loss
---------------------------------------------------------------------------
8/6/2004  .972  -.419  -54  +10  -.049   -273  +.026   -.049
     DJI immediately rallied from 9815.33 to upper band.
---------------------------------------------------------------------------
|
====================================================================================
OLDER HOTLINES
====================================================================================
8/5/2014 The Peerless Sell S19 is unreversed and the
Closing Power downtrends are still in force.
Exactly 100 Years Ago World War I Started. It began with
cries
of self-determination in Eastern Europe, political pandering
to
nationalist chauvinisms, Generals demanding mobilizations
of
their armies and the rigid following of pre-conceived battle
plans, instead of peace talks and diplomacy. Have we learned
anything from this horrendous tragedy?
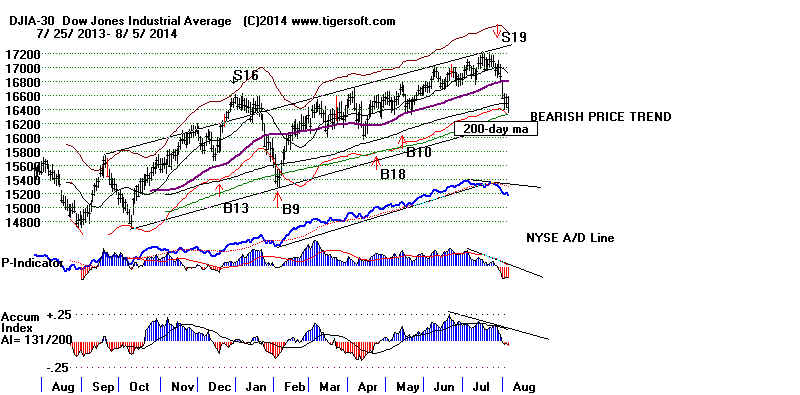
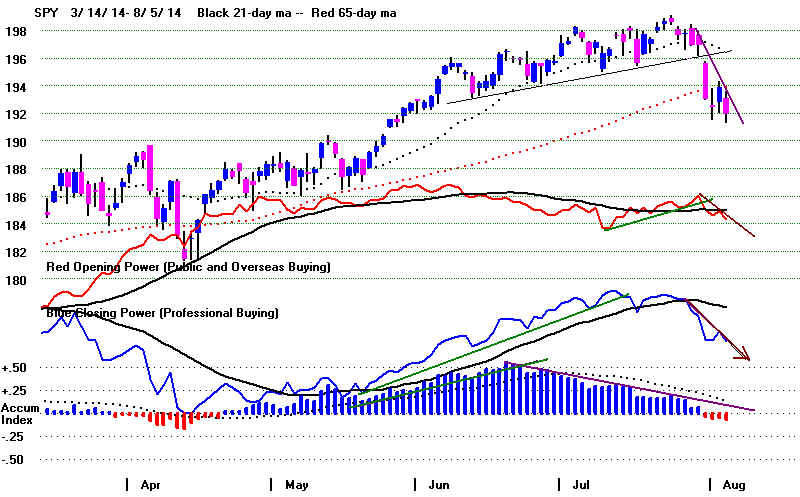
Lots of Negatives Face The Market
Monday's one-day bounce up
from the nested support of the rising 30-wk ma
and lower band has to be discouraging to the bulls. If this were a normal
decline, Monday's rally should have been extended today, gone higher and
eaten up some of the over-head supply of stock at the failed support levels,
so that a rally back to the upper band would be possible by early September.
As you can see, Peerless (post 2006 versions) have not yet given a Buy signal.
The Buy B2 in the 2006 version did not draw lessions from the 1928-1965 period
as subsequent versions of Peeless have.
It is the speed of the decline, the low levels of OBVPct and the V-Indicator
as well as the weak P-I readings which now come together to deny a Buy B2.
I hear lots of bearish predictions based on:
1) the Fed's likely switching to a tighter monetary policy in 2015,
2) on how artificial much of the Fed-fed rally has been,
3) how weak the working middle class consumer now is in America,
4) how over-due the market is for, at least, a 10% correction,
5) how sentiment indicators and use of margin all registered very over-bought
readings this Summer
6) how Wall Street billionaires are now selling and how
7) how various mysterious market cycles have now turned down.
But the one bearish factor that I never hear talked about, is the one that
scares me the most.
The very same derivatives and leveraged ETFs that propelled the market up
may work the very same way in reverse. Just think how easily Professionals,
Fund managers and Hedging Pools can now go short huge blocs of stocks
on down-ticks without borrowing a single share of stock. If fear sets in the
market
will surely collapse in ways that will rival the worst declines of the past. Even
the FED may not be able to contain the decline. That is what Greenspan
discovered
in 2001 and 2002.
> To Key Index and Leading Stock Charts: DJI, SP-500, etc.
Peerless DJI Chart SPY Chart NASDAQ Chart QQQ
Chart
IBB Chart
IWM Chart
Hourly DJI-OBV Hourly-MVM0735
FAS-3x Financials IBB-Biotechs
--> 30
MAXCP stocks Bullish MAXCP Stocks (8/5/2014)
Highest A/I 200 DJI-30 Stock - CAT
--> 125
MINCP stocks Bearish MINCP Stocks
(8/5/2014) Bearish plurality
--> 12
New Highs on NASDAQ 44 new lows.
Bearish plurality
--> 4 New Highs on NYSE 48 new lows. Bearish plurality
Déjà vu:
Sleep-Walking Us Into War.
The market is falling because politicians are again rattling their swords
about a region in Eastern Europe that wants to exercise its right to self-
determination. The politicians now are acting like clueless automatons,
totally unmindful of history. Are they sleep-walking us into a another
war just as Emperors and politicians did 100 years ago?
Does all the tough talk by Obama, Clinton and Kerry abut Russia scare
you? It sure scares me. It all seems eerie and forebodding. I studied
a lot of history. In particular, I learned that all the horrors of World War I
began in August 1914 (exactly 100 years ago) in the same way as now!
World War I was not desired by anyone. But Great Power militarism
(including pre-set mobilization plans
which dictated against diplomacy)
and chauvinist pandering by political elites first in Russia and Germany
and then in England turned a single event in Sarjevo, Serbia into
the horrors of World War I and its even more deadly aftermath,
the German Revolution, the Russian Civil War and then World War II.
I don't expect particularly far-sighted leadership from our bellicose President
or from British P.M. David Cameron. But France and Germany are different.
I don't think that they will allow American tough talk and support of
Ukraine to bring a Nato vs Russia military confrontation. France
has a long history of forming alliances with Russia and Russia is
now a vital trading partner with Germany.
Putin Appears To Be Readying A
Military Response
To Obama's Hard-Line Anti-Russian Rhetoric
Russia will probably intervene to protect Russian
speaking people in the
south-eastern regions of the Ukraine. It cannot do otherwise. To American
cold warriors this all seems like Soviet Expansionism. To Russians, intervention
would be a humanitarian response to suffering from people who used to
be part of the Soviet Union, who speak Russian, who identify with proud
Russian anti-Fascist traditions and who fear a resurgence of Western Ukrainian
SS-like Fasicsm. Putin remembers the Cold War. He remembers how
Gorbachev allowed East Germany to join West Germany with the understanding
that NATO would not expand Eastward. Ukrainian-Nato missiles pointed
at Moscow from only a distance of 400 miles is no more acceptable than
Cuban missiles pointed at Washington was in 1962.
I'm unable to see how this part of the world can be construed to be vital
to US or NATO interests. There is, I think, a very real danger that Russia
will go to war with the Ukraine government soon. This is would deeply
involve the US. America, by its own admission, has spent $5 billion to create
and shore up the new Ukrainian government. The tilt towards a regional
micro-war there seems inescapable.
Meanwhile, America does not spend $700 billion a year on security
and
its military idly. US political elites, ever representing Wall Street and major
corporations always in search of new markets, desire to control events,
governments and economies all over the globe. The Obama-Clinton-Kerry
approach says it will brook no challenges from anyone from weakened
Russia, whose population is now "only" 150 million, about half what it
was in the days of the old Soviet Union. |
====================================================================================
OLDER HOTLINES
====================================================================================
8/4/2014 Peerless Sell
S19 The DJI bounced up today from
the lower band and from the "sweet spot" (the zone between the rising
30-wk and 200-dma).
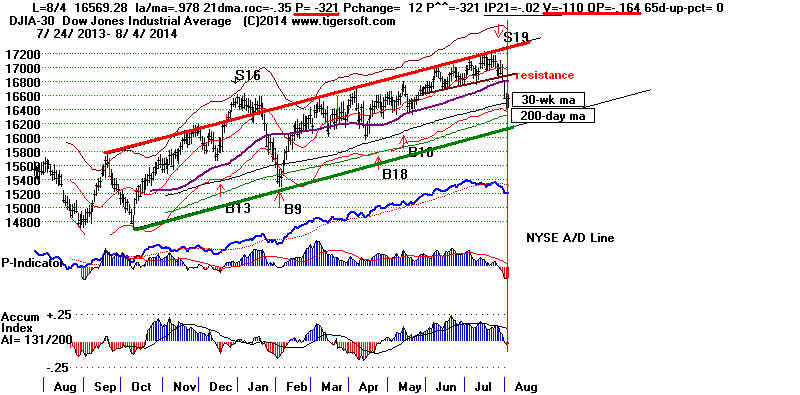
A recovery back to last Wednesday's lows, where the recent well-tested
support had help up the DJI, should not come as a surprise. But a rally past
that
level, around 16900 is not likely. With the low P-Indicator and V-Indicator readings
of yesterday when the lower band was tagged, no "Buy B2" could be given.
It should be noted, though, that such a signal could occur on a successful test
of Friday's low.
We have covered a few short sales, but remain mostly short a variety
of bearish MINCP stocks. There are not many Bullish MAXCP stocks
to choose from right now.
> To Key Index and Leading Stock Charts: DJI,
SP-500, etc.
Peerless DJI Chart SPY Chart NASDAQ Chart QQQ
Chart
IBB Chart
IWM Chart
Hourly DJI-OBV Hourly-MVM0735
FAS-3x Financials IBB-Biotechs
--> 29 MAXCP stocks Bullish MAXCP Stocks
(8/4/2014)
Highest A/I 200 DJI-30 Stock - CAT
--> 160
MINCP stocks Bearish MINCP Stocks
(8/4/2014) Bearish plurality
--> 17 New Highs on NASDAQ 35 new lows.
Bearish plurality
--> 13 New Highs on NYSE 31 new lows. Bearish plurality
Without a reversing Peerless Buy signal here, the present odds favor
a deeper decline before there can be a rally back to the 2.5% upper band.
Only about 40% of the cases where the lower band was tagged at this time
of the year produced an immediate bounce back to the upper band.
Watch FAS, the bank stocks' leveraged ETF.
This trades very well with the Peerless Buys and Sells.
A significant rally by it would be at odds with Peerless
and my belief that the next week or two will not see
a move much past last Wednesday's low.
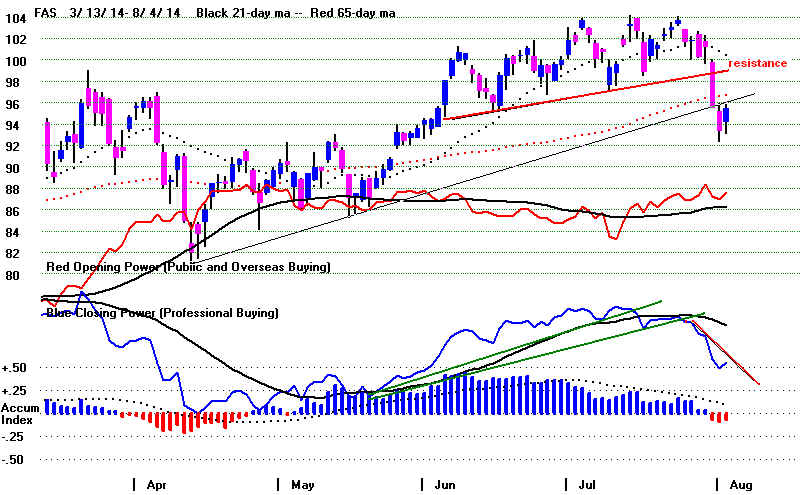
Of course, the "bounce" would probably become a "recovery" back up to
the DJI's recent highs if the Fed suddenly makes it clear that it wants
to keep rates low and that it would be pleased if the market were to move higher
now. Before this happens, I would expect breadth to improve. In this
scenario, too, we should also see a big recovery by bank stocks and FAS
(the leveraged ETF of banks). On the other hand, renewed negative
NYSE breadth and a new sharp decline by FAS would have to been
seen as bearish.
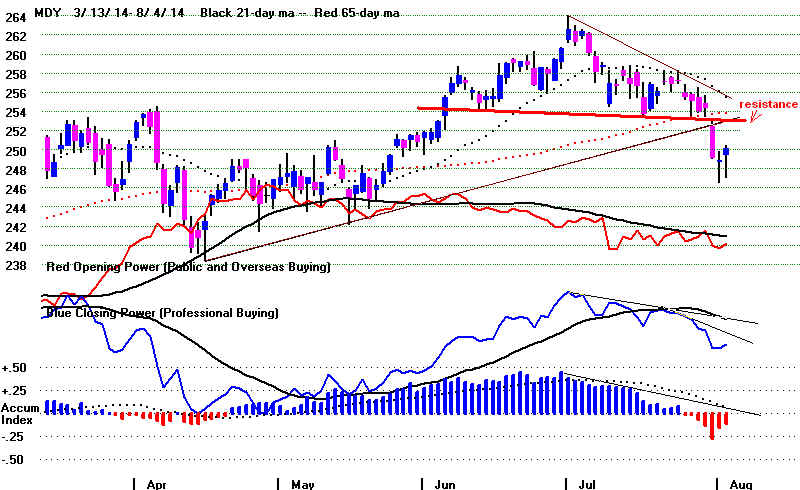
The DJI was the weakest of the major ETFs today. MDY (above) might be shorted
if it reaches and falls back from its neckline resistance at 253.50. QQQ's superior
Relative Strengh versus the DJI should keep us from shorting it.
TigerSoft Hedging
The beauty of hedging by being long the best of the Bullish
MAXCP Stocks
and short the most Bearish of the MINCP stocks was
illustrated by the
contrasting paths of ALUM and ESI today.
Multiple IP21 Bulges and Multiple IP21 "Pot-Holes"
ESI (ITT Education) crashed 46%. ESI's plunge also demonstrates the need to
short stocks showing multiple pot-holes of deep distribution where the IP21
falls below -.25. On the other hand, we should recognize the special bullishness
of a stock like ALUM when its IP21 shows multiple bulges above +.375.
ESI's plunge is somthing we have come to expect every month, or so, if
we short a handful of 5 or 6 bearish MINCP stocks. We can be wrong
about one or two of the 5 stocks we short, if one of the others falls
30% or more. That is exactly what is starting to happen with increasing
frequency. This cannot be a good sign.
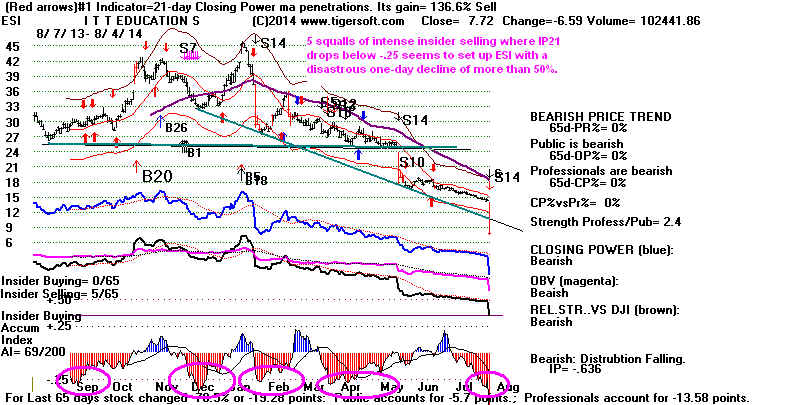
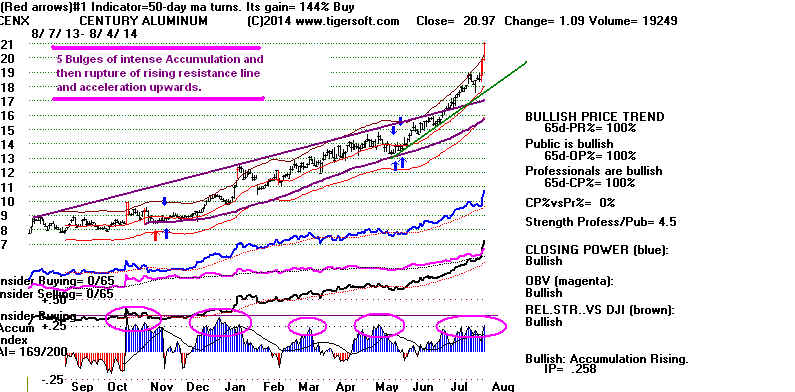
=====================================================================================
8/1/2014 Peerless Sell
S19 The DJI has fallen to the lower
band with only a Sell S19, "only" because S19s' avg. decline is less
than 3.6% at the time of a reversing Buys. There should be more
DJI movement to the downside, but first we should get a bounce.
Although, we have no new Buy signal yet, the lower band and the
rising 30-wk ma do often act as support. But they are not reliable
enough to warrant a Peerless buy signal.
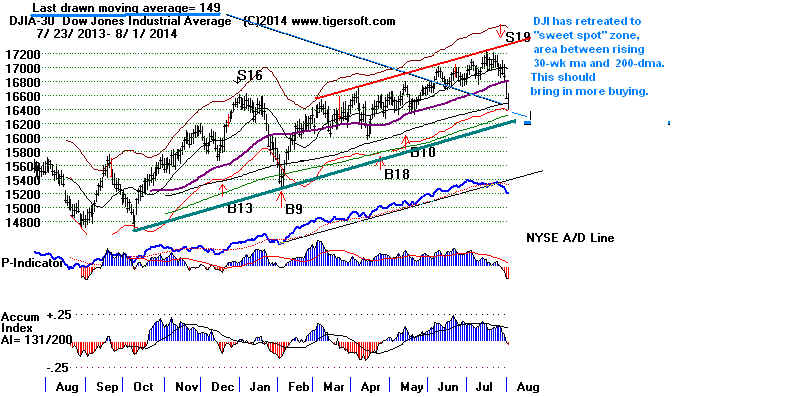
That makes it highly uncertain that we should immediately go out and
chase a much higher opening on Monday? Too many of these have
higher openings have faded badly recently.
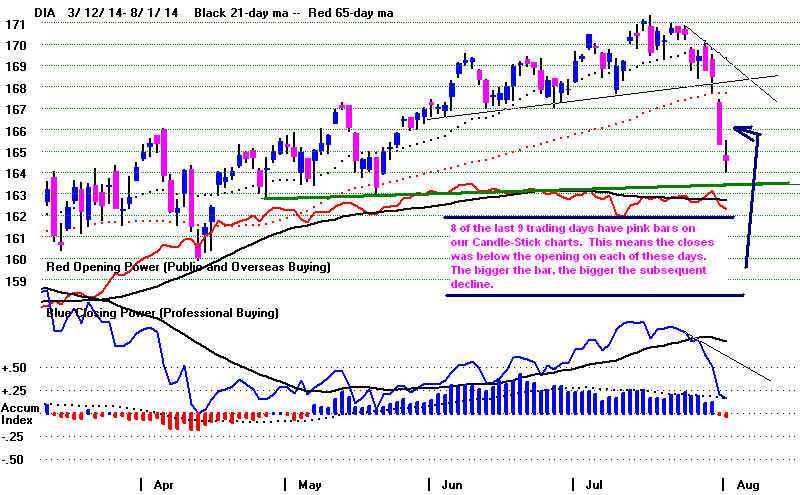
> To Key Index and Leading Stock Charts: DJI,
SP-500, etc.
Peerless DJI Chart SPY Chart NASDAQ Chart QQQ
Chart
IBB Chart
IWM Chart
Hourly DJI-OBV Hourly-MVM0735
FAS-3x Financials IBB-Biotechs
--> 16 MAXCP stocks Bullish MAXCP Stocks
(8/1/2014)
Highest A/I 200 DJI-30 Stock - CAT
--> 246
MINCP stocks Bearish MINCP Stocks
(8/1/2014) Bearish plurality
--> 9 New Highs on NASDAQ 76
new lows. Bearish
plurality
--> 11
New Highs on NYSE 55 new lows. Bearish plurality
Even though we have reached the lower band, I see no reason to rush
to cover or buy. An immediate recovery back to the 2% upper band or
higher occurs in only 39% of the taggings of the lower band at this time
of the year. Be careful of buying on a big up-opening.
I am still struck by the "long over-due" need for a 10% correction.
In addition, the next two weeks do not have a particularly bullish general
seasonality. Since 1965, the DJI has risen only 50.1% of the time from
August 3rd to August 13th.
While the DJI may recover a two hundred, or so, points, a rally will still
face stiff overhead resistance from the support levels broken on Thursday's
decline. Two of the broadest based ETFs, IWM and MDY must now
fight back against the bearishness of completed head and shoulders.
A rally back up above the broken necklines on the first attempt seems most
unlikely unless the FED offers a new and unexpected stimulus.
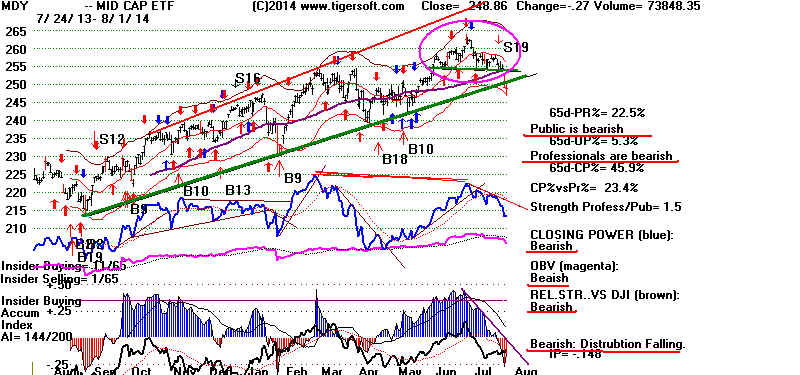
So, as long as the IWM and MDY necklines are not breached by a
recovery rally, I would stay short them and short our Bearish MINCP
stocks. I would not be short QQQ. It is the strongest of the major
market
ETFs and, so far, the NASDAQ has not broken its own neckline support.
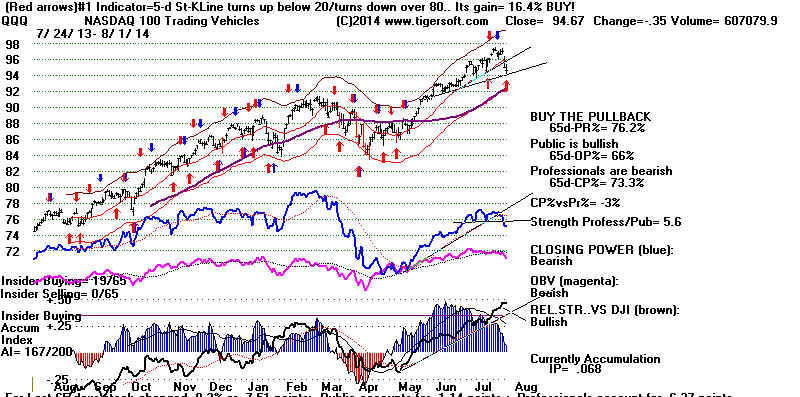
Since we have not had a Sell S9 or Sell S12, I would estimate the odds are
better than 50% chance for a rally back now back to the broken support levels
that existed just before Thursday's sharp sell-off. This is because of how
often in the past the DJI has successfully reversed up off the lower band
in the two weeks before August 3rd and the two weeks afterwards. See the
new study below.
Here are the statistics I computed today on this subject.
Statistics regarding tests of lower band
from July 20th to August 17th:
1928-2014
www.tigersoftware.com/PeerlessStudies/LateJuly-EarlyAugust/index.html
There were 38 tests of lower band in the 10 days
before August 1st
and during the first 17 days of August.
In 8 cases a bear market followed. (21.0%)
In 8 additional cases the DJI fell at least 3% before rallying. (21.0%)
In 7 additional cases, the DJI went a little lower and then rallied. (18.4%)
In 15 cases the DJI either immediately rallied or did so a day later
and
rallied, at least to the upper 2% upper band. (39.4%)
Of these 4 occurred with the DJI slightly below the
65-dma as now.
7/27/1945 .980
-.571 -619 +12 -.235 -328 -.383 -.019
DJI immediately rallied up past upper band.
8/6/1957 .964
-.563 -452 -31 -.118 -394 -.249 -.007
Kept falling in bear market.
Previous Sell S9.
7/21/1960 .968
-.528 -186 -11 -.126 -333 -.266 -.016
Fell from 616.6 to 601.7 on 7/25 and rallied to upper band.
7/30/1999 .964
-.340 -231 -34 -.01 -98 -.135
-.018
DJI rallied to upper band.
Of the 38, 10 occurred with the IP21
between -.02 and -.05.
4 of these 10 dropped much further because DJI was in a bear market.
One more dropped an additional 3% before rallying.
=====================================================================================
OLDER HOTLINES
=====================================================================================
7/31/2014 Peerless Sell
S19 It sure feels like the start
of a financial panic. As long support-levels give way under the
pressure of falling Closing Powers, I would stay heavily short.
Notice the way key uptrends are being broken and support levels
do not hold. The DJI looks like it has just started a
high dive.
The SP-500 closed today at its rising and well-tested
hyperbolic
support-line. Typically when prices break below such accelerating
uptrendlines it means that a bubble is breaking.
The NASDAQ closed at neckline in its "hands-above-the-head" pattern.
This is my term for describing a top pattern that most commonly appears
when speculation has reached unsustainable levels.
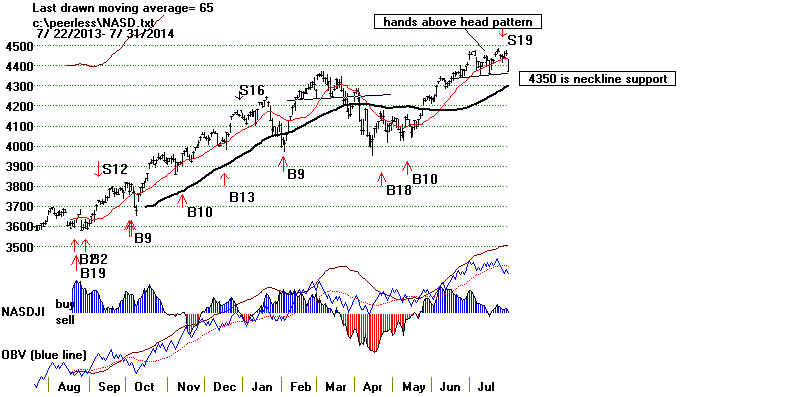
> To
Key Index and Leading Stock Charts: DJI, SP-500, etc.
Peerless DJI Chart SPY Chart NASDAQ Chart QQQ
Chart
IBB Chart
IWM Chart
Hourly DJI-OBV Hourly-MVM0735
FAS-3x Financials IBB-Biotechs
--> 24MAXCP stocks Bullish MAXCP
Stocks (7/31/2014)
Highest
A/I 200 DJI-30 Stock - CAT
--> 223
MINCP stocks Bearish MINCP
Stocks (7/31/2014) Bearish plurality
--> 9 New Highs on NASDAQ 73
new lows. Bearish
plurality
--> 8
New Highs on NYSE 74 new lows. Bearish plurality
_______________________________________________________________________
New studies to show
which stocks are most vulnerable as this Decline unfolds.
"First out of Gate Down:"
Biggest 21-day decliners
among New Lows
Biggest 21-day
decliners among MINCPs.
Biggest Gainers among Leveraged ETFs for last 21- days.
GASX + 40%,
YINN (China 3x Bull) +26%
SRTY +23%
DWTI 3x Short Crude +20%
SOXS 3x Short of Semi-Conductors +16%
AGA 3x Agricultural Short +15%
TWM Ultra-Short Russell +15%
_______________________________________________________________________
Has The Fed Lost Control:
Watch FAS
Watch the FAS, the leveraged big banks' ETF. It also has fallen
to support. A breakdown would mean that the FED has lost control
or, more likely, has lost its nerve. It is afraid of the tea-Party challenge
it will get if it keeps rates low much longer, even though food prices,
gas, oil and gold are not in uptrends that one usually sees when the
Fed raises rates.
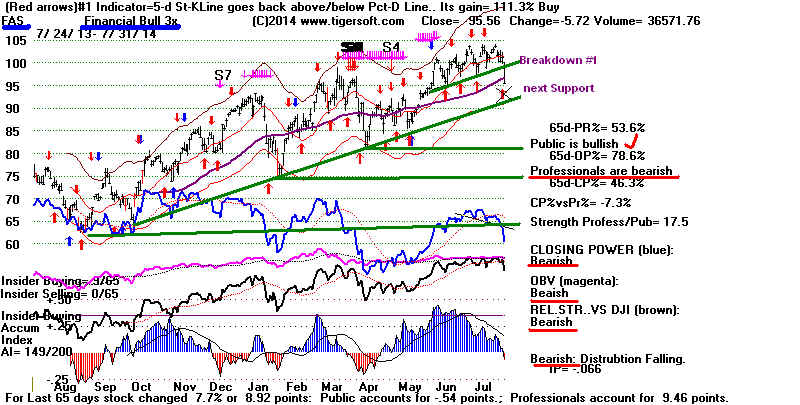
Actually,
Keynes Was Not A Marxist
The economic recovery will surely stall out if there is a 20% stock
market decline. The FED must know this. They will probably
intrude at the point the DJI is down 10%. A decline just this much
is actually healthy from a technical point of view.
A bigger decline than 13.5% would be a Panic. In it, is is the affluent
stop buying. The Fed cannot risk frightening away their buying power.
In the absence of a strong and healthy middle class, this could easily set the stage
for a significant economic turn-down.
It used to be (in the 1950s and early 1960s) that economists would
smile and happily tell students that a 1929-1932 Crash could not possibly
occur again. Economists and Politicians had learned the Keynesian lessons
about the 1930s: namely, when private spending stalls out, increase
Public Works (or start a new war). This will avert a deeper decline.
and a slow-down can be
But the Tea-Party people and modern Republicans completely reject this lesson.
In fact, they reject almost all government. Some even reject spending 50% of
the Federal Government on the military. And they vote in large numbers.
So, politicians dare not mention Keynes in a positive way.
I was asked today if we could see another Depression. As usual, I was the
"two handed economist". On the one hand, I said, the Fed and Congress have
the tools to keep such a Disaster away, but on the other hand, I continued,
a very significant part of the American Public really hates Washington DC.
This means that this no longer "silent majority" have intimidated even
those politicians who should know better.
So, without political leadership instead of political pandering, we may not be
able to muddle along as is anymore. Quite clearly, I think, Keynes showed
how quickly the animal spirit, Fear, can take over our sentiments. When
Fear dominates, private investing comes to a grinding halt and consumers
quickly postpone all unnecessary buying. Inventories of unsold goods grow.
Workers are laid off. Loans are not repaid. Even rich people suffer.
And government revenues go way down, forcing layoffs there, too.
What I should have added - but I also pander - was that Wall Street,
with the approval of the Wall Street dominated SEC, has created the
means by which it can destroy itself. Leveraged short-selling on down-ticks
large blocks of stock could not be made easier for hedge-funds and
super-bears, some of whom would like nothing better than destroy this
Administration with a Super-Crash. That leveraged short selling can
cause a bear market is easily seen in the way it exaggerated the drop
in Gold, Silver and mining shares after 2011.
It's not hard to foresee how all these leveraged short general market ETFs
could cause great harm as they drive this over-extended market down
even more quickly than it went up. In many ways, Wall Street has pumped
up the major market averages with Fed money and now, it seems, they
are ready to make just as much money by dumping and selling short.
Our Hotline has no choice but to eliminate most of its long positions
and hold tightly our earlier shorts. It usually is the smallest stocks which
get clobbered the most in a bear market. But the mid-caps look
very vulnerable, too. A panic usually knifes through trend-line
supports. 230 and 240 will probably act as better support
than the uptrendline at 248.
The primary lesson of the 2000-2003 and 2007-2009 bear markets
was that very few people have the endurance to ride out 21st Century
bear markets. And they don't need to, not if they act quickly enough
to cut their losses. Look at the leveraged short ETFs. Professionals
are obviously buying them. That is why their Closing Powers are
in uptrends. Their trend is also our friend.
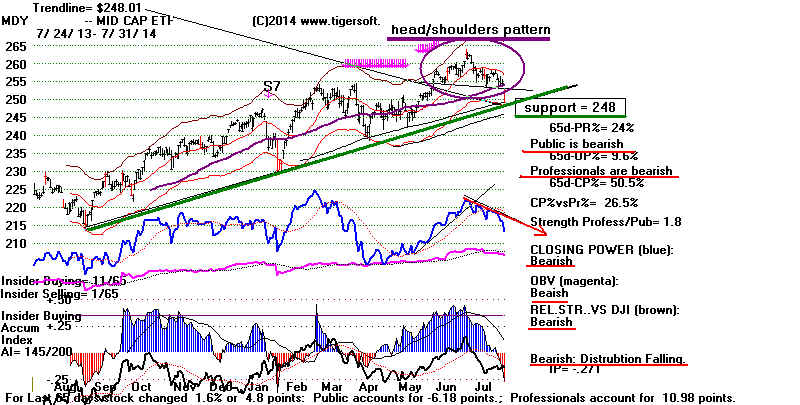
as seems
=====================================================================================
OLDER HOTLINES
=====================================================================================
7/30/2014 Peerless Sell
S19 Watch to see if the DIA and SPY
break their near-term support at 167.75 and 196.18, respectively.
With the all major market's Closing Powers falling, I would think
the markets will remain weak.
All the comments from 7/29 apply. In addition,
we want to watch to see if
the Dollar keeps rising versus the Yen and if 10-year
interest rates continue
to today's surge upwards. The way the best of the REITs keep making new
highs makes me doubt that 10-year rates will go back to 2.8%-3.0%.
We made some fairly easy money a year or so ago shorting the YEN.
I think the technical situation is similar. Compare the current chart's price
breakdown and heavy red Distribution with what it looked like a while back.
> To Key Index and Leading Stock Charts: DJI, SP-500, etc.
Peerless DJI Chart SPY Chart NASDAQ Chart QQQ
Chart
IBB Chart
IWM Chart
Hourly DJI-OBV Hourly-MVM0735
FAS-3x Financials IBB-Biotechs
--> 46 MAXCP stocks Bullish MAXCP
Stocks (7/30/2014)
Highest
A/I 200 DJI-30 Stock - CAT
Highest Power Ranked Leveraged ETFs - UPRO, TECL UDOW
--> 136
MINCP stocks Bearish MINCP
Stocks (7/30/2014) Bearish plurality
Lowest Power Ranked Leveraged ETFs - SRS, SPXU, SDS, SPXS
--> 46 New Highs on NASDAQ 45new lows. Bullish plurality
--> 53
New Highs on NYSE 49 new lows. Bullish plurality
When US stocks go down, some of us look to commodities and currencies
for other price trends to play. Heavy distribution, a weak Closing Power
and a well-tested priced support failure are all distinctly bearish for any
chart we are studying. FXY (Japanese Yen) shows this "triple bearish
threat" now. A breakdown to a new 5-year low under 92 would likely
bring a 10% decline.
Trading Japanese Yen with TigerSoft
2009
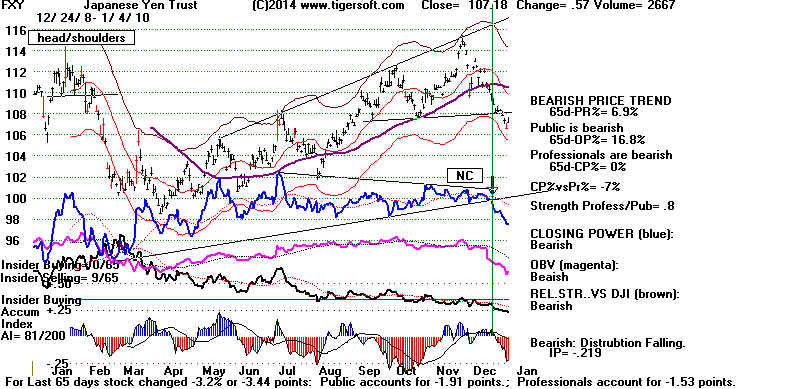 |
2010
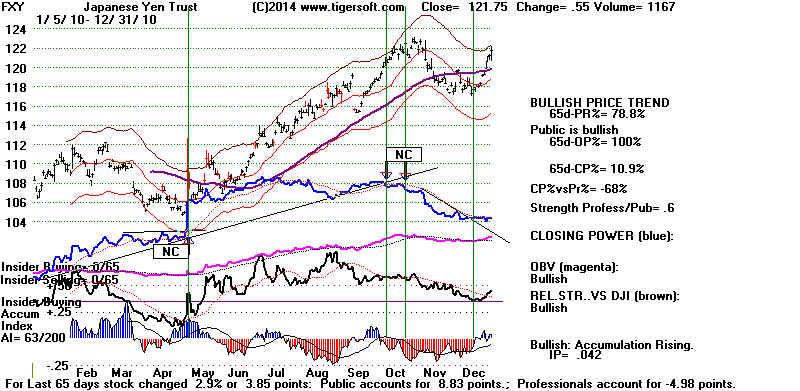 |
2011
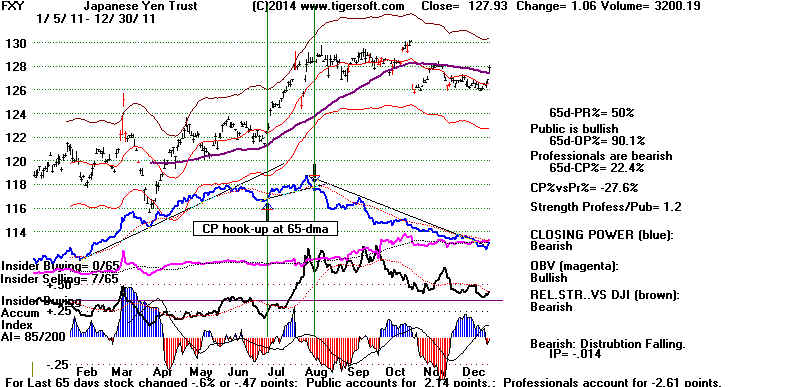 |
2012
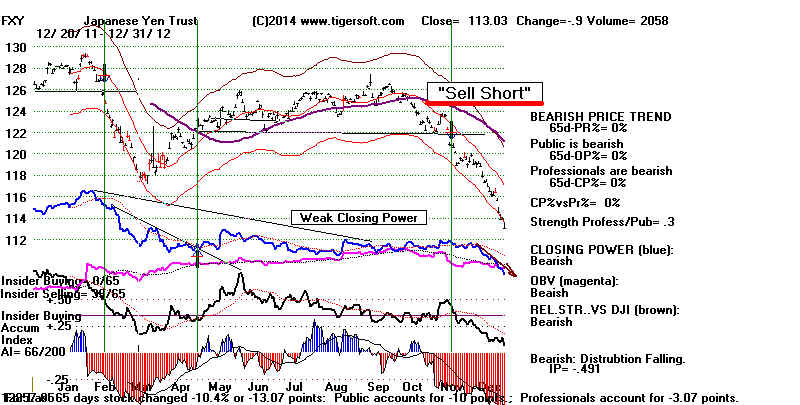 |
2013
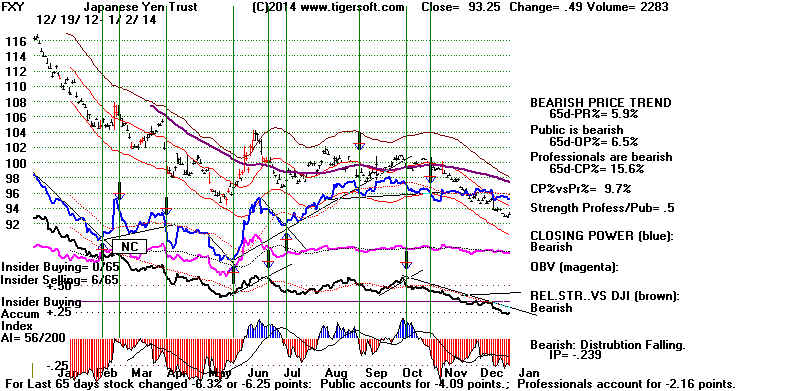 |
2014
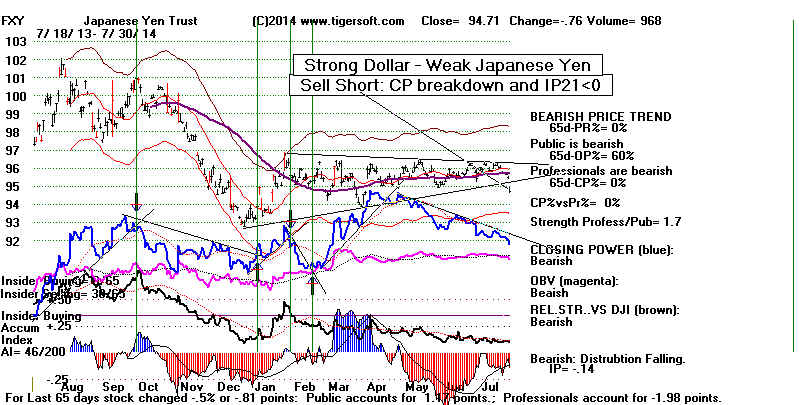 |
=====================================================================================
7/29/2014 Peerless Sell
S19 We remain hedged with 2x more short
positions than long positions. Be careful about buying at the openings now.
The Closing Powers for the major market ETFs are falling. Today saw
a bearish red popsicle on today's DJI candle-stick chart.
> To Key Index and
Leading Stock Charts: DJI, SP-500, etc.
Peerless DJI Chart SPY Chart NASDAQ Chart QQQ
Chart
IBB Chart
IWM Chart
Hourly DJI-OBV Hourly-MVM0735
FAS-3x Financials IBB-Biotechs
--> 43 MAXCP stocks Bullish MAXCP Stocks (7/29/2014)
Highest
A/I 200 DJI-30 Stock - CAT
Highest Power Ranked Leveraged ETFs - UPRO, UDOW , TECL
--> 112
MINCP stocks Bearish MINCP
Stocks (7/29/2014) Bearish plurality
Lowest Power Ranked Leveraged ETFs - SRS, VXX, SPXU, SDS,
--> 28 New Highs on NASDAQ 37 new lows. Bearish plurality
--> 40
New Highs on NYSE 33 new lows. Bullish plurality
In the past, S19s have tended to return bigger gains when they occurred with the
DJI farther up from the support of its rising 65-dma. We must now wait and see
if the gathering weakness in breadth will be bearish enough to break the various
indexes down below their support levels. Right now the Closing Powers for the
key major market ETFs are all in minor downtrends. However, the current
Accumulation Index values for DIA and QQQ are still above +.12, which suggests
there is ample buying support from institutions at the 65-dma to prop the
market up.
Biotechs jumped today on FDA approval for a PCYC drug. Independent Puma
Biotech (PBYI) rose more than 12%, as speculators began calculating how much its
anti-breast cancer drug might be worth if the FDA was satisifed with one large
trial to grant approval. Professionals are buying it once again. See chart at
bottom of today's hotline. .
Price Price
65-dma
Closing Power IP21
CP%-Pr% ITRS
Support Support/ Minor Trend
(65-day CP (50-day Pct.Change
Resistance
divergence) minus DJI's
50-day Pct.Change)
----------------------------------------------------------------------------------------------------------------
DIA 168.78 168.34
167
Falling
+.120
-8.5%
0
SPY 196.95 196.16
192
Falling
+.073
-4.5%
+2%
QQQ 96.6
95.86
92
Falling
+.194
-4.3%
+8%
IWM 113.34 112.73
114
Falling -.121
+15.3%
0
IBB 254.78 245.71
244
neutral
-.105
+6.1%
+9%
Exploded Chart of PBYI
I would trust the Professionals. Today, the Closing Power made a new high.
We will
watch its trend here, to help show the importance of Closing Power
in wild
situations like this. It has 30.12 million shares outstanding. "If approved,
neratinib
could reap $2.5 billion in annual sales by 2020". If its profits
from thia
came to $600 million/year, it would earn $20/share per year.
At current
prices, it has a 12:1 PE for potential 2020 earnings.
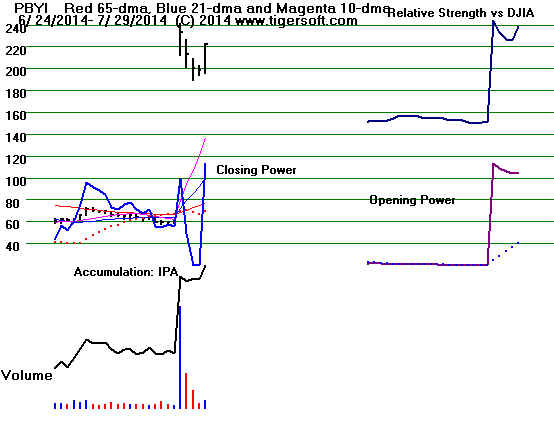
=====================================================================================
7/28/2014 New Peerless Sell S19 The P-Indicator has turned
negative after
being positive for more than 105 straight days. The Fed may step in again here
and try to stop the decline, but with the DJI's last 10% correction having occurred
32 months ago, a decline back down that much to a point just above January's
low at 15400 would actually be healthy, provided the decline politely stops there.
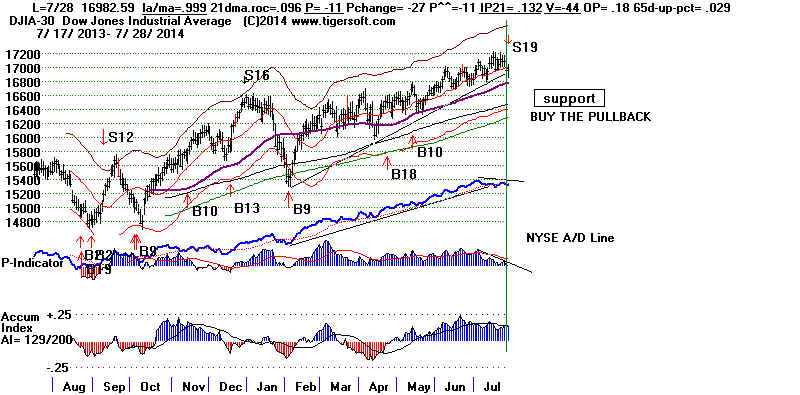
The smaller stocks look weaker now. IWM is the weakest
of the ETFS and
QQQ is the strongest. QQQ is being backed up by AAPL which made a new
high today. Interest rates are still below 2.5%. There are no bear markets
that I know that started with interest rates this low. Usually 10-year rates
have had to rise above 4.5% to spook a bull market. Of course, the underlying
economy, manufacturing, Main Street and the working middle class have
fallen way behind Wall Street's artificial Fed-fed boom. If profits start falling,
as they did in the Summer of 1929, the Fed will have to hand out money again
to buyers of stocks if they wish to stop the decline with only a 10%-13.5%
slippage.
S13 signals are not particularly bearish. Except for the 1971 case, they
have signaled it was time for a healthy decline to the lower band and
some consolidation before continuing the bull market. When I look at the
SP-500 chart, I see a well-tested and accelerating uptrend. These rising
trends usually are not broken until prices go hyperbolic. If this is true here,
the SP-500's decline will be shallow and once the well-tested accelerating
price-uptrend has been tested, I would expect a swift reversal back upwards.
The SP-500's bulge of Accumulation also suggest the hyperbolic uptrend
will probably offer excellent support if a decline reaches that level now.
Our Stocks' Hotline is short more than twice what we are now long.
Selling short IWM as the weakest ETF seems a reasonable
course of action
now. It is now below its H/S neckline and its 65-dma. .
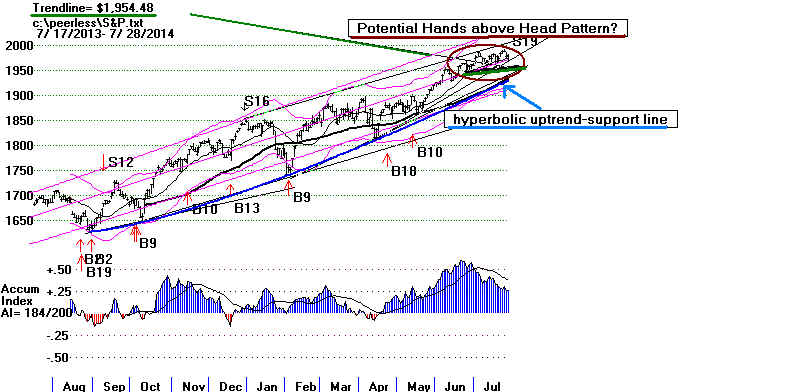
> To Key Index and
Leading Stock Charts: DJI, SP-500, etc.
Peerless DJI Chart SPY Chart NASDAQ Chart QQQ
Chart
IBB Chart
IWM Chart
Hourly DJI-OBV Hourly-MVM0735
FAS-3x Financials IBB-Biotechs
--> 82 MAXCP stocks Bullish MAXCP Stocks (7/28/2014)
Highest
A/I 200 DJI-30 Stock - CAT
Highest Power Ranked Leveraged ETFs - UPRO, TECL UDOW
--> 117
MINCP stocks Bearish MINCP Stocks
(7/28/2014) Bearish plurality
Lowest Power Ranked Leveraged ETFs - SRS, ERY, VXX, DUG,
--> 32 New Highs on NASDAQ 51 new lows. Bearish plurality
--> 52
New Highs on NYSE 35 new lows. Bullish plurality
=====================================================================================
OLDER HOTLINES
=====================================================================================
7/25/2014
Still No Peerless Sell but we are very close
to one.
> To Key Index and
Leading Stock Charts: DJI, SP-500, etc.
Peerless DJI Chart SPY Chart NASDAQ Chart QQQ
Chart
IBB Chart
IWM Chart
Hourly DJI-OBV Hourly-MVM0735
FAS-3x Financials IBB-Biotechs
--> 81 MAXCP stocks Bullish MAXCP Stocks
(7/25/2014)
Highest
A/I 200 DJI-30 Stock - CAT
Highest Power Ranked Leveraged ETFs - UPRO, TECL. UDOW
--> 95 MINCP stocks Bearish MINCP Stocks
(7/25/2014) Bearish plurality
Lowest Power Ranked Leveraged ETFs - SRS, ERY, VXX, DUG,
--> 23 New Highs on NASDAQ 32 new lows. Bearish plurality
--> 33
New Highs on NYSE 25 new lows. Bullish plurality
We are very close to seeing the P-Indicator turn negative. It stands at a mere
+15. Its turning negative would be the first time this has happened in more
than
105 trading days and so bring a reversing Sell S19 provided the DJI does not close
more than 1.1% below the 21-day ma on the day the P-I turns negative. In the past,
Sell S19s brought
only one big decline in 7 earlier instances and that required
a head/shoulders pattern. It occurred in 1971 when Pres. Nixon stopped backing
the Dollar with Gold. I suspect a change now by the Fed's withdrawing from
its easy money stance would have a comparable effect. Right now that is not
expected. Dividend and REIF stocks remain the leaders even as Visa, Boeing
and Caterpillar got hit hard on Friday. (Did you hear that BA's CEO said he
was not about to retire now that he had his employee's "cowering". His
joke
to Wall Street analysts did not go unnoticed. Somehow it was not fully appreciated
by the folks who make the planes we fly in.)
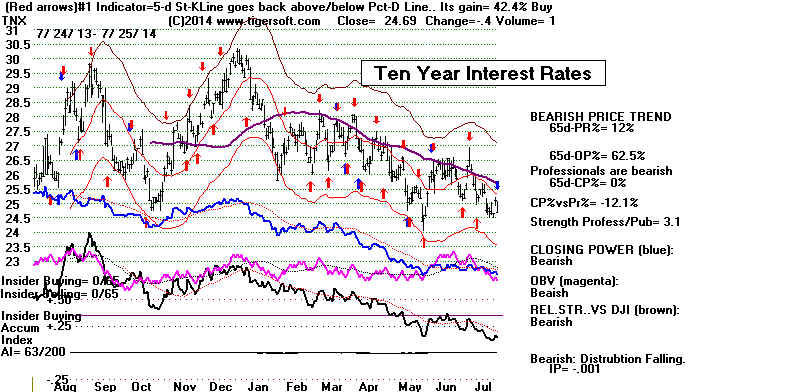
Ten-Year rates are still bullishly below 2.5%.
Historically rates this low have
never allowed the end of a bull market. It is true, however, that rates this low did
not stop the bear markets of 2001 and 2002 from worsening. If we can assume
the Fed know this history, I think we must assume that they dare not let rates go up
much and will likely act quickly to bolster the market if it starts to decline.
This,
I think, is exactly why the DJI has not had a 10%+ correction since 2011.
More of a decline seems likely. DIA's price uptrend has
been violated. IWM
bearishly broke below its 65-dma. SPY is the strongest general market ETF.
But even it could have its Closing Power uptrend broken on a sharply down day
following a CP non-confirmation. This is a classic Tiger Sell. I have to add
that
usually big bulges of Accumulation set up good short-term buying opportunities
when the Closing Power is broken. This rule does have exceptions, particularly
late in a bull market.
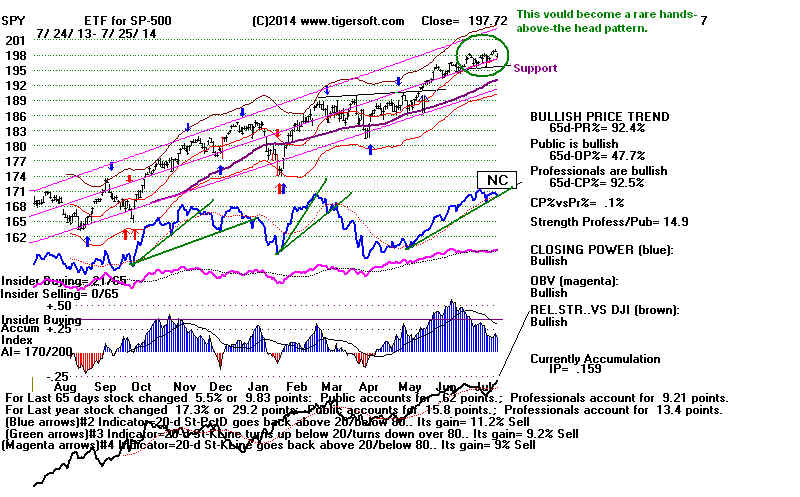
Head/Shoulders in Shorts' Index cannot be bullish.
I built a directory of the most heavily shorted stocks. It shows a bearish
head/shoulders
pattern after a false breakout. This suggests the last rally succeeded in running
in some shorts, but now prices in these stocks could give way quickly. GRPN and
LULU (below) look particularly weak among the most heavily shorted stocks.
Professionals do most of the shorting. So, these stocks seem worthy of our shorting.
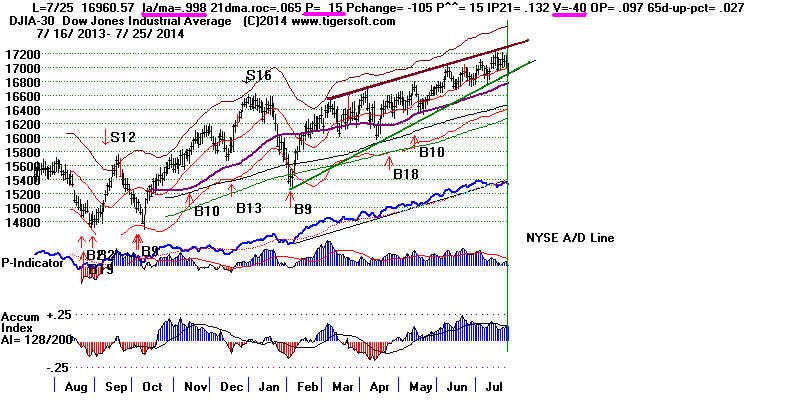
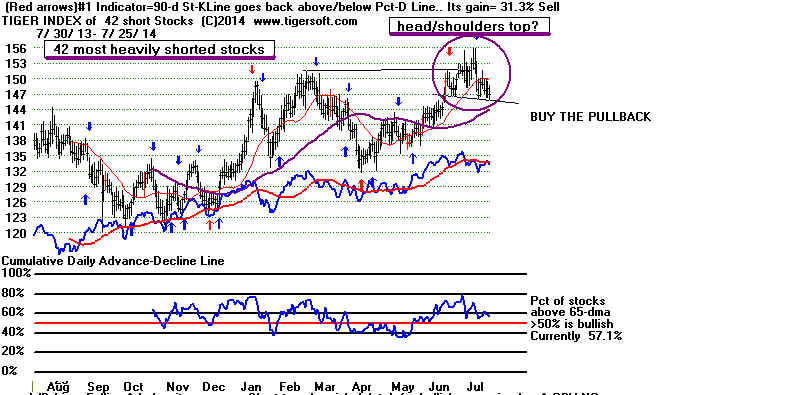 |
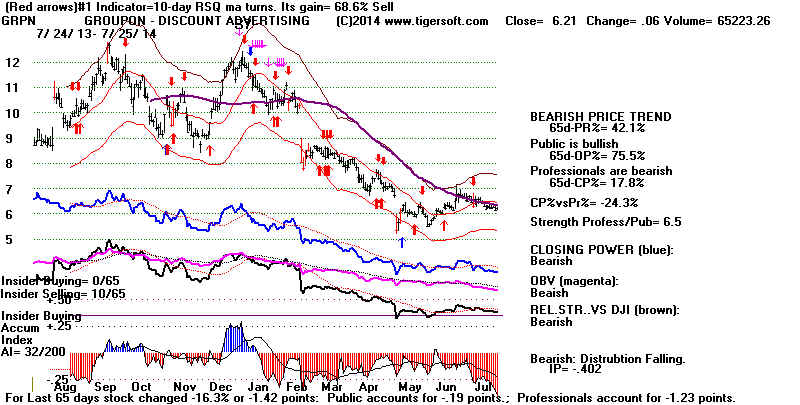 |
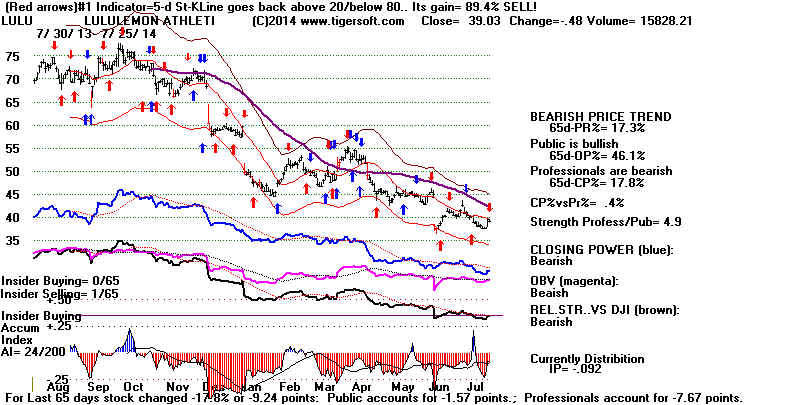 |
Not
very surprising in view of the heavy red distribution, Thursday's pop based on a
take-over suggestion put out by SODA executives, seems to have gone flat and fizzled
with investors.
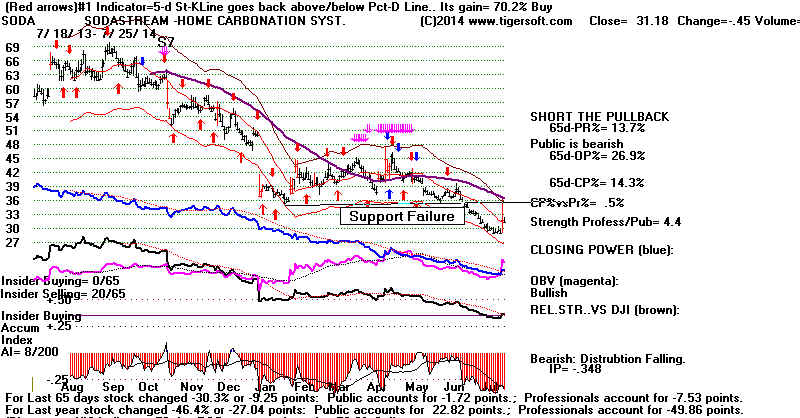 |
=====================================================================================
OLDER HOTLINES
=====================================================================================
7/24/2014
Still No Peerless Sell and no sell is likely
tomorrow.
I do think a DJI decline is likely short-term. 75% of our Bullish MAXCP
stocks declined today. It's been a long time since that has happened when
the market was little changed from the previous day. CAT, the highest AI/200
stock dropped in brisk trading tech leader QCOM also broke down sharply.
But a big decline seems very unlikely. The FED will not allow it. At least,
that's what's been true for 2 years. If we were going into a new market
tumble owing to some kind of international crisis (financial or otherwise),
gold and silver would almost certainly be turning up. The opposite is true.
> To Key Index and Leading Stock Charts:
DJI, SP-500, etc.
Peerless DJI Chart SPY Chart NASDAQ Chart QQQ
Chart
IBB Chart
IWM Chart
Hourly DJI-OBV Hourly-MVM0735
FAS-3x Financials IBB-Biotechs
--> 105 MAXCP stocks Bullish MAXCP Stocks
(7/24/2014)
Highest
A/I 200 DJI-30 Stock - CAT
Highest Power Ranked Leveraged ETFs - UPRO, TECL. UDOW Bullish plurality
--> 70 MINCP stocks Bearish MINCP Stocks
(7/24/2014)
Lowest Power Ranked Leveraged ETFs - SRS, VXX, DUG, SOXS
--> 71 New Highs on NASDAQ 33 new lows. Bullish plurality
--> 165
New Highs on NYSE 25 new lows. Bullish plurality
When I look at the weekly chart of the DJI, I am reminded how powerful
the upward momentum has been and the fact that neither the DJI nor the
weekly NYSE A/D Line is close to breaking its long uptrendline.
Weekly DJI and Weekly DIA
Respect Their Momentum
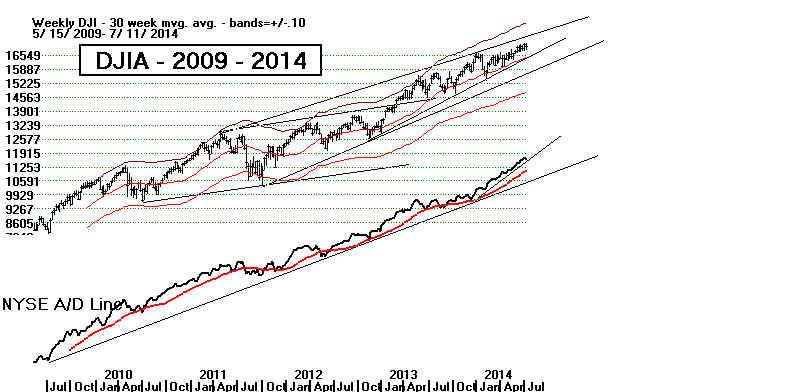
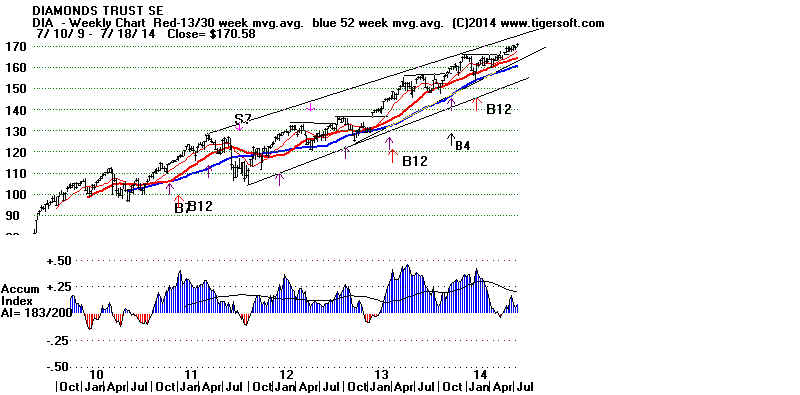
SODA's
POP
Insider Trading at Heavily Shorted
SODA
Management Fighs Back by Saying Somone Might Bid for Their Company
Israeli based SodaStream (SODA) jumped up 20% intra-day and closed at $31.63.
Bloomberg News
reported that it is in talks to be taken private at $40 per share. One
lucky or insider-informed options
trader bought 500 (largest trade of day) $30 call options (1.90 out of
the money) to expire on Friday
for $4500. Two hours later, when story broke, they were worth
$250,000.
It is by no means clear the SEC has the power or resources to
penalize anyone in this Israeli
company or even get them to discuss the matter. Many non-US
countries, as a matter of policy,
never prosecute insider trading. At least, they are not
hypocrites. The SEC talks a lot about
its mission to go after insider traders. But such talk has
little bite and occurs mostly just to
give the little investor the false belief that Wall Street is a
level playing-field.
The SEC should also interview the Bloomberg News agency.
The SEC certainly could find out
the identity of the person buying the options and discover where
he works. Will they do this?
Will they prosecute? I'd say the odds of that are less then
the odds were that the guy was just
lucky. At least, we covered our short sale in SODA a
day or two earlier because the stock's
CLosing Power had broken its downtrendline.
Stocks that are heavily shorted
will often get some kind of a bounce when their CLosing Power
downtrend is broken. If this occurs in the week of options'
expiration, one could probably make
money buying out of the money options like this felllow
did. If the stock was going to artificially
be made to bounce by an unsubstantiated report of a
"buy-out", this is when it would most
likely occur.
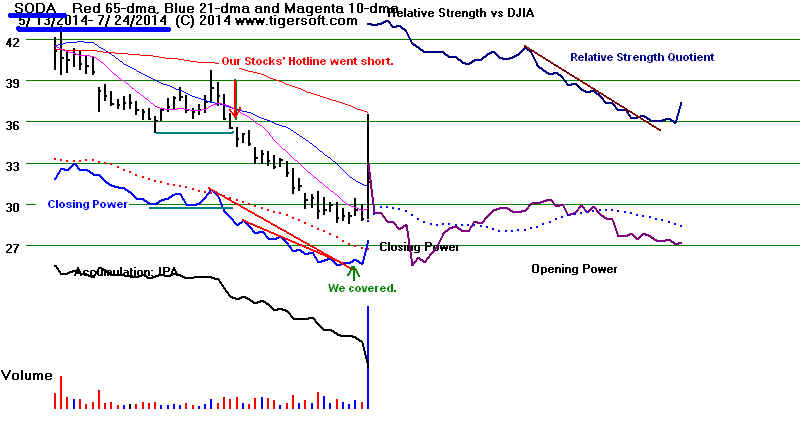
This weeknd I will publish a report on the most
"bullish" and most "bearish"
of the 50 most shorted stocks on the NASDAQ, as well as a TigerSoft Index
chart of them. Is there any evidence that heavily shorted NASDAQ
stocks are weaker than the NASDAQ itself? We'll find out.
NASDAQ's 50 Most Shorted Stocks
7/24/2014
http://online.wsj.com/mdc/public/page/2_3062-nasdaqshort-highlites.html
| Company |
Symbol |
7/15/14 |
6/30/14 |
Chg |
% Chg |
% Float |
Days to
cover |
Avg daily
volume |
| 1 |
Sirius XM Holdings Inc.
|
SIRI |
297,599,734 |
318,200,825 |
-20,601,091 |
-6.5 |
10.7 |
8 |
38,362,856 |
| 2 |
Frontier Communications
Corporation |
FTR |
173,126,077 |
171,896,797 |
1,229,280 |
0.7 |
17.4 |
30 |
5,716,608 |
| 3 |
Intel Corporation |
INTC |
161,625,885 |
174,354,201 |
-12,728,316 |
-7.3 |
3.2 |
6 |
29,163,291 |
| 4 |
Micron Technology, Inc.
|
MU |
121,751,101 |
121,763,539 |
-12,438 |
... |
11.4 |
4 |
27,159,397 |
| 5 |
Apple Inc. |
AAPL |
103,680,863 |
112,228,389 |
-8,547,526 |
-7.6 |
1.7 |
3 |
41,090,329 |
| 6 |
Gilead Sciences, Inc.
|
GILD |
95,485,621 |
93,715,153 |
1,770,468 |
1.9 |
6.3 |
8 |
11,356,669 |
| 7 |
BlackBerry Limited |
BBRY |
92,926,346 |
93,661,383 |
-735,037 |
-0.8 |
19.0 |
4 |
20,849,306 |
| 8 |
Staples, Inc. |
SPLS |
90,451,533 |
88,659,899 |
1,791,634 |
2.0 |
14.1 |
12 |
7,371,270 |
| 9 |
Groupon, Inc. - Class A
Common Stock |
GRPN |
88,389,748 |
80,506,749 |
7,882,999 |
9.8 |
19.4 |
6 |
15,904,804 |
| 10 |
Microsoft Corporation
|
MSFT |
88,093,640 |
92,223,934 |
-4,130,294 |
-4.5 |
1.2 |
4 |
23,238,906 |
| 11 |
Windstream Holdings, Inc.
|
WIN |
87,328,013 |
85,729,993 |
1,598,020 |
1.9 |
14.6 |
14 |
6,366,732 |
| 12 |
Applied Materials, Inc.
|
AMAT |
75,572,354 |
73,663,449 |
1,908,905 |
2.6 |
6.2 |
7 |
11,301,385 |
| 13 |
Comcast Corporation -
Class A Common Stock |
CMCSA |
73,561,641 |
81,351,887 |
-7,790,246 |
-9.6 |
3.4 |
7 |
11,053,693 |
| 14 |
MannKind Corporation |
MNKD |
71,777,133 |
67,874,816 |
3,902,317 |
5.8 |
30.5 |
8 |
8,642,379 |
| 15 |
Cisco Systems, Inc. |
CSCO |
70,622,550 |
69,418,158 |
1,204,392 |
1.7 |
1.4 |
3 |
27,356,834 |
| 16 |
PowerShares QQQ Trust,
Series 1 |
QQQ |
65,100,942 |
67,045,296 |
-1,944,354 |
-2.9 |
... |
2 |
28,276,735 |
| 17 |
Twenty-First Century Fox,
Inc. - Class A Common Stock |
FOXA |
58,248,470 |
59,163,045 |
-914,575 |
-1.6 |
4.1 |
7 |
8,645,772 |
| 18 |
JetBlue Airways
Corporation |
JBLU |
54,008,561 |
53,274,827 |
733,734 |
1.4 |
21.8 |
7 |
7,305,908 |
| 19 |
ARIAD Pharmaceuticals,
Inc. |
ARIA |
53,119,785 |
48,055,172 |
5,064,613 |
10.5 |
29.4 |
8 |
7,027,376 |
| 20 |
Capstone Turbine
Corporation |
CPST |
51,982,962 |
52,977,138 |
-994,176 |
-1.9 |
15.9 |
20 |
2,545,688 |
| 21 |
Exelixis, Inc. |
EXEL |
47,267,295 |
48,710,009 |
-1,442,714 |
-3.0 |
25.0 |
6 |
8,116,408 |
| 22 |
Zynga Inc. - Class A
Common Stock |
ZNGA |
47,219,300 |
50,307,416 |
-3,088,116 |
-6.1 |
6.8 |
4 |
13,432,259 |
| 23 |
GT Advanced Technologies,
Inc. |
GTAT |
46,384,897 |
41,338,709 |
5,046,188 |
12.2 |
34.2 |
3 |
14,515,938 |
| 24 |
Dendreon Corporation |
DNDN |
42,870,253 |
43,262,434 |
-392,181 |
-0.9 |
27.9 |
22 |
1,943,304 |
| 25 |
NVIDIA Corporation |
NVDA |
42,420,819 |
43,087,529 |
-666,710 |
-1.6 |
8.0 |
7 |
6,250,427 |
| 26 |
Arena Pharmaceuticals,
Inc. |
ARNA |
41,042,913 |
41,738,231 |
-695,318 |
-1.7 |
18.8 |
6 |
6,821,993 |
| 27 |
NII Holdings, Inc. |
NIHD |
39,720,683 |
47,639,624 |
-7,918,941 |
-16.6 |
23.5 |
9 |
4,188,839 |
| 28 |
VIVUS, Inc. |
VVUS |
39,474,428 |
37,987,360 |
1,487,068 |
3.9 |
39.4 |
27 |
1,471,044 |
| 29 |
Facebook, Inc. - Class A
Common Stock |
FB |
38,899,205 |
41,081,656 |
-2,182,451 |
-5.3 |
2.0 |
1 |
41,612,553 |
| 30 |
Liberty Global plc -
Class C Ordinary Shares |
LBTYK |
38,793,362 |
45,188,018 |
-6,394,656 |
-14.2 |
7.2 |
13 |
3,077,064 |
| 31 |
Wendy's Company (The) |
WEN |
38,604,777 |
38,841,047 |
-236,270 |
-0.6 |
11.4 |
10 |
3,882,126 |
| 32 |
American Realty Capital
Properties, Inc. |
ARCP |
37,949,174 |
50,123,395 |
-12,174,221 |
-24.3 |
4.3 |
5 |
8,137,663 |
| 33 |
RF Micro Devices, Inc.
|
RFMD |
37,834,302 |
34,225,906 |
3,608,396 |
10.5 |
13.4 |
6 |
6,656,923 |
| 34 |
Cadence Design Systems,
Inc. |
CDNS |
37,033,622 |
39,696,628 |
-2,663,006 |
-6.7 |
13.0 |
15 |
2,425,071 |
| 35 |
Myriad Genetics, Inc.
|
MYGN |
36,985,326 |
38,120,845 |
-1,135,519 |
-3.0 |
49.5 |
50 |
740,134 |
| 36 |
Plug Power, Inc. |
PLUG |
36,670,543 |
32,051,386 |
4,619,157 |
14.4 |
22.8 |
4 |
9,795,070 |
| 37 |
Whole Foods Market, Inc.
|
WFM |
35,786,966 |
34,116,445 |
1,670,521 |
4.9 |
9.8 |
6 |
6,072,759 |
| 38 |
People's United
Financial, Inc. |
PBCT |
34,641,468 |
34,847,944 |
-206,476 |
-0.6 |
11.3 |
13 |
2,567,368 |
| 39 |
FuelCell Energy, Inc.
|
FCEL |
32,460,825 |
31,960,341 |
500,484 |
1.6 |
14.5 |
9 |
3,609,079 |
| 40 |
PDL BioPharma, Inc. |
PDLI |
31,658,977 |
31,338,082 |
320,895 |
1.0 |
21.9 |
15 |
2,118,091 |
| 41 |
Mylan Inc. |
MYL |
30,928,913 |
30,296,246 |
632,667 |
2.1 |
8.3 |
6 |
5,513,982 |
| 42 |
Fastenal Company |
FAST |
30,064,373 |
29,638,412 |
425,961 |
1.4 |
11.0 |
10 |
2,959,391 |
| 43 |
Amarin Corporation plc -
American Depositary Shares, each representing one Ordinary Share |
AMRN |
29,353,095 |
28,141,017 |
1,212,078 |
4.3 |
17.8 |
19 |
1,581,196 |
| 44 |
Yahoo! Inc. |
YHOO |
29,140,764 |
27,580,196 |
1,560,568 |
5.7 |
3.1 |
2 |
18,689,572 |
| 45 |
Dynavax Technologies
Corporation |
DVAX |
27,634,270 |
27,915,640 |
-281,370 |
-1.0 |
10.6 |
16 |
1,713,511 |
| 46 |
Novavax, Inc. |
NVAX |
26,917,096 |
24,259,414 |
2,657,682 |
11.0 |
12.1 |
7 |
3,695,446 |
| 47 |
lululemon athletica inc.
|
LULU |
26,415,291 |
27,629,087 |
-1,213,796 |
-4.4 |
25.2 |
12 |
2,252,428 |
| 48 |
Exact Sciences
Corporation |
EXAS |
25,476,441 |
25,882,945 |
-406,504 |
-1.6 |
31.1 |
29 |
873,372 |
| 49 |
Corinthian Colleges, Inc.
|
COCO |
25,300,532 |
28,716,738 |
-3,416,206 |
-11.9 |
31.5 |
7 |
3,718,317 |
| 50 |
Microchip Technology
Incorporated |
MCHP |
25,066,344 |
24,939,805 |
126,539 |
0.5 |
1 |
=====================================================================================
OLDER HOTLINES
=====================================================================================
7/23/2014
Still No Peerless Sell and no sell is likely
tomorrow.
To get a Sell S19
this week we would need to have NYSE declines exceed
advances by a total of 1510 for Thursday and Friday together. If tomorrow were to
bring a breaking of the Closing Power uptrends shown below for the key
ETFs, the Peerless Sell might then be set up for Friday. But seasonality turns
short-term bullish for the five days after Sunday, the 27th. Since 1965, the DJI has
risen 57.4% of the time in this period. Let's wait for Peerless!

Puma Biotech (PBYI) is on the prowl.
Meanwhile, watch what happens to PBYI tomorrow. Its breast cancer drug
reported extremely favorable results on 1000 women and 8% of the stock
has been sold short! This should be a big boost for biotechs generally.
This is what excites NASDAQ speculators. As long as its Closing Power
is rising, I think we can expect higher prices from it.
"In a trial of 2,821 women with early stage HER2-positive breast cancer,
the drug, neratinib, improved disease-free survival by 33 percent compared
to the placebo. Based on the results, Puma intends to apply for regulatory
approval in the first half of next year." Source
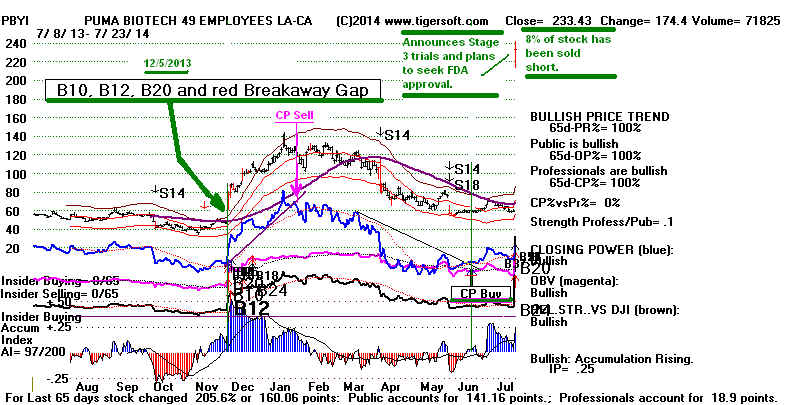
> To Key Index and Leading Stock Charts: DJI, SP-500, etc.
Peerless DJI Chart SPY Chart NASDAQ Chart QQQ
Chart
IBB Chart
IWM Chart
Hourly DJI-OBV Hourly-MVM0735
FAS-3x Financials IBB-Biotechs
--> 130 MAXCP stocks Bullish MAXCP Stocks
(7/23/2014)
Highest
A/I 200 DJI-30 Stock - CAT
Highest Power Ranked Leveraged ETFs - UPRO, TECL. UDOW Bullish plurality
--> 45 MINCP stocks Bearish MINCP Stocks
(7/23/2014)
Lowest Power Ranked Leveraged ETFs - SRS, VXX, DUG, SOXS
--> 55 New Highs on NASDAQ 26 new lows. Bullish plurality
--> 147
New Highs on NYSE 16 new lows. Bullish plurality
The DJI is clearly stuck in its rising wedge pattern. But the QQQ and NASDAQ
are trying to start a new run. They made marginal breakouts today. It's not
clear
if the QQQ can disconnect itself from the DJI if latter falls back to its uptrendline's
support. Staying long some of Bullish MAXCP and short some of the Bearish MINCPs
has been working. There's no need to change that approach. This seems a better
approach than going long the strongest ETF, QQQ, and short the weakest, either
IWM or MDY if their Closing Power up-trendlines are broken.
====================================================================================
OLDER HOTLINES
====================================================================================
7/22/2014 Still No Peerless Sell. With 1192 more up than down on
the
NYSE today, the A/D Line has resumed its uptrend, the P-Indicator has moved
higher and we cannot easily get a Sell S19.
In addition the NYSE and IWM are much
more
comfortably above their head/shoulders patterns' necklines. The timeliness
of
this turn-around was impressive. The Fed did what was needed. It held the
10-year rates under 2.45%. Now the leading QQQ made a new high.
At
96.61, it seems bound to reach 100, if only for all the publicity that will get it.
Remember that back in 2000, it hit 119.
I
think it's best to close out some of short positions now, such as IWM and the
most
profitable of the shorts among the BEARISH MINCPs.
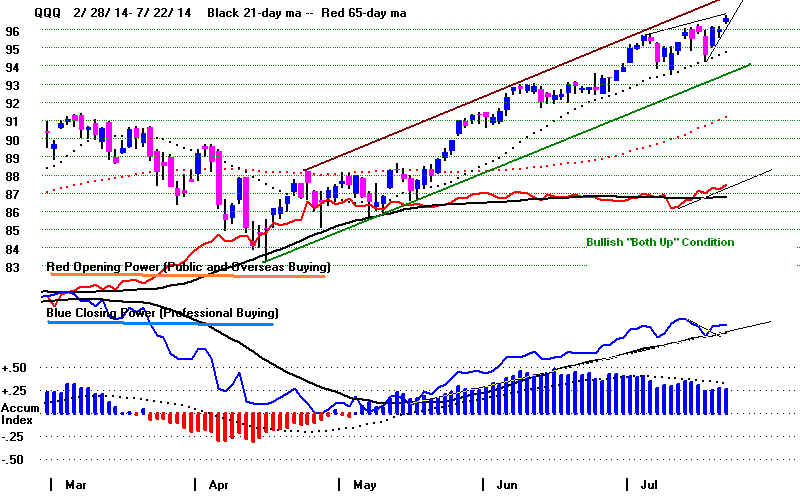
> To Key Index and
Leading Stock Charts: DJI, SP-500, etc.
Peerless DJI Chart SPY Chart NASDAQ Chart QQQ
Chart
IBB Chart
IWM Chart
Hourly DJI-OBV Hourly-MVM0735
FAS-3x Financials IBB-Biotechs
--> 116 MAXCP stocks Bullish MAXCP Stocks
(7/22/2014)
Highest
A/I 200 DJI-30 Stock - CAT
Highest Power Ranked Leveraged ETFs - UPRO, DIG, TECL. UDOW Bullish plurality
--> 75 MINCP stocks Bearish MINCP Stocks
(7/22/2014)
Lowest Power Ranked Leveraged ETFs - ERY, SRS, VXX, DUG, SPXU
--> 25 New Highs on NASDAQ 18 new lows. Bullish plurality
--> 84
New Highs on NYSE 9 new lows. Bullish plurality
CHIPOTLES' PE OF 60 SEEMS A LITTLE SPICEY


My
favorite fast food restaurant, Chipotle, jumped an amazing 69.84 (11.84%) today.
That's 10 points more than the stock was selling for when I recommended it back
in
2008. Today its current PE is 61.90. Is it worth that much? Its jump owed only
partly to its widely beating the experts' estimates. With MCD's reeling and reeking
from
selling lots of expired food from China, more and more people are seeking
out CMG's
locally grown produce and harmone-free chicken.
CMG raised
their prices by 10% several months ago and the lines of customers
at peak
hours are still as long as ever. The price of a side-order of their delicious
spicey
chicken with a tortilla is only $2.25. And with a smile, they will usually give
you a
bigger portion in a bowl. Just don't ask for anythng else if you are a
penny-pincher.
Just a side
order of lettuce with sauce will jump your serving of chicken up to $5.00.
This new
policy is what they call a "three-for". It is bound to irritate loyal
customers
like me.
A bowl of lettuce should not cost $3.00 in a fast food restaurant. I may
bring my
own and stuff it in the tortilla before anyone notices!
You can get
as much rice and beans as you like in a regular meal. You can easily
make this
regular meal into two servings. So the $8.00 you pay does go a long ways.
CMD's
restaurants are noisy, the seats are hard and uncomfortable and the staff
is now more
highly regimented than relaxed and friendly, qualities which made me
very loyal
to them a few years ago.
The two
joint-CEOs have paid themselves a collossal $150 million since 2011.
But their
workers are mostly paid less than $9.00 hour. That is a sore subject.
It may make
CMG vulnerable to strikes and unionization some day. But they
would
quickly fire anyone who did not act happy just to have a CMG job. More
likely to
impact them will be the movement to local higher minimum wage laws.
If you read
YELP about CMG you get the feeling that quality and cleanliness
are being
set aside in the haste to make Wall Street more money no matter the
cost.
I have not noticed this, but some mystery shoppers have. The company
does appear
to act on feed-back from its customers when it can. They show
that they
are trying to keep you a loyal customer.
As long as CMG has the healthiest fast food around, they will keep opening
up new
stores and
more and more people will find them. To see how CMG measured up, we
went to a
Panera Bread (PNRA) restaurant last week. The servings were much smaller.
Except for
the bread, I wished we had gone to CMG. We would have saved $5.00, too.
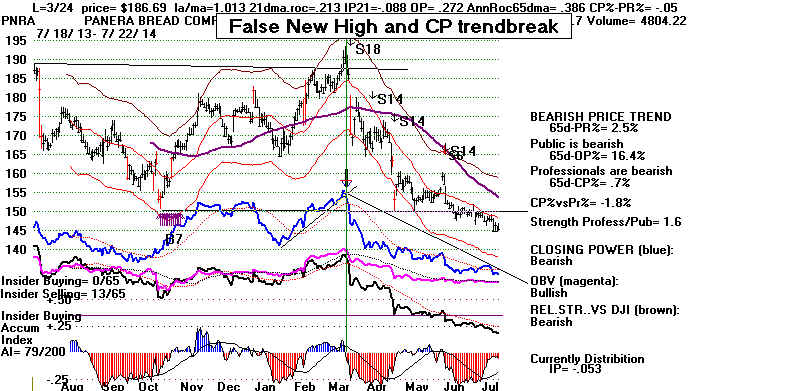
I reckon
the odds are 82.5% CMG's stock will now either retreat or go into
a holding
pattern for a couple of months. This is what it has done since 2006
(when it
was founded). Red high reversing volume at the stock's upper band has
led to an
immediate breakout run only twice in past 18 instances of this
exceptional
trading activity. CMG has been a wonderfully strong stock.
With stocks
that are not so strong, a Red High Volume warning could
easily be
calling a major top. See the Tiger CMG charts since 2006.
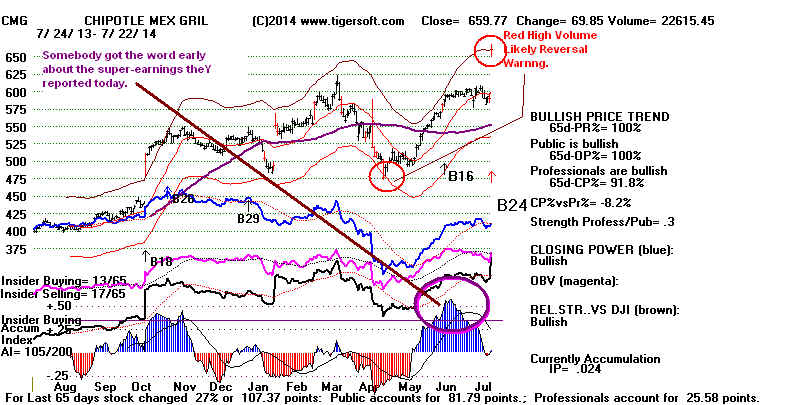
Watch for Red High Volume Reversal Bars
at The Upper Band in a Tiger Stock Chart
Watch your
Tiger charts more generally for red high volume bars when prices
reach the
upper band as this is usually bearish, especially if the stock has recently
risen
disproportionately and outrageously. This is typically a buying climax.
All the
good news is out and every buyer that can be induced to chase the stock
has jumped
aboard. When the Closing Power breaks its uptrend or makes a new
low, you
know that Professionals are starting to employ their "UNLOAD ALL THE
WAY"
down strategy.
=====================================================================================
OLDER HOTLINES
=====================================================================================
7/21/2014
Still No Peerless
Sell. But we must now worry that the
P-Indicator will turn negative if NYSE breadth is negative tomorrow.
Being
Hedged is recommended. Breadth needs to improve
dramatically
now
to avoid a Sell S19.
Because the rising wedge pattern seemed to offer limited upside potential
and
the heavily distributed stocks, especially those in retail, seem to be
getting weaker and weaker, I have have suggested being hedged with
some
Bearish MINCP short sales and long Bullish MAXCP stocks. As might
be
expected given 2.4% 10-year rates, Utilities, REITS and Big Bank Stocks
have
the most bullish Tiger Index charts. They show much stronger A/D Lines
and
have much higher percentages of their stocks above the 65-dma.
See the latest Tiger Index charts here.
As
long as the NYSE (shown below) does not break its neckline, the market
-
almost by definition - is holding up. The NYSE's chart is a very helpful
trading took, But a price-breakdown by the NYSE below 10840 would be quite
bearish for at least a month. I showed last night that when these patterns
are
completed, the odds are 16/19 (84.2%) that the NYSE will very quickly more than
fulfill its downside projections. Here the pattern is small, but historically
that
hardly matters. Certainly, it is a perfectly symmetrical and classic-looking
head/shoulders pattern. See H/S patterns' charts on the
NYSE going back to 1987.
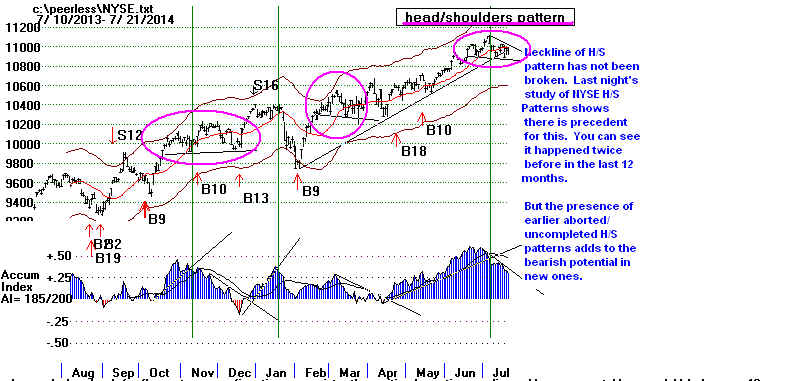
Bullishly so far, the neckline for the NYSE was not broken and
the
Russell-2000 IWM's H/S pattern is still in some doubt.

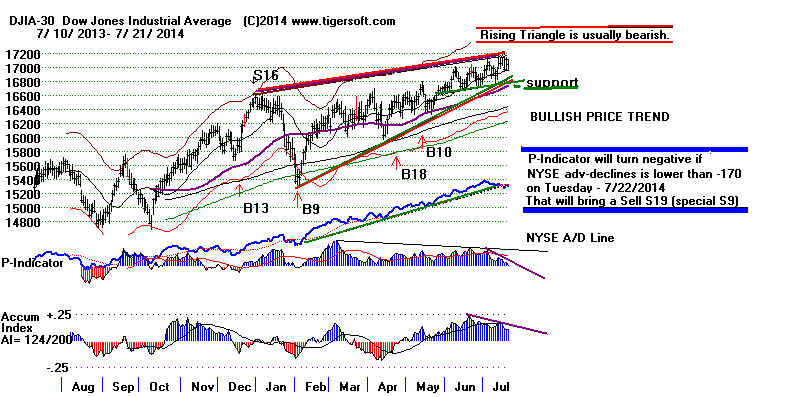
Will There Be A Sell S19
But now we have to worry about the P-Indicator turning negative. After
more
than
105 straight days of being positive, its going negative here will probably bring
a new
Sell S19. (This used to be called a "special S9"). More than 170
down than up
on
the NYSE tomorrow would cause the P-I to turn negative. This seems inevitable
as
the historical odds of the DJI rising over the next week are only 46.8%, based
on
the DJI's behavior at this time of year since 1965. Here is the past track record
for Sell S19s. As you can see, they are
reliable but do not usually bring deep declines.
> To Key Index and Leading Stock Charts: DJI, SP-500, etc.
Peerless DJI Chart SPY Chart NASDAQ Chart QQQ
Chart
IBB Chart
IWM Chart
Hourly DJI-OBV Hourly-MVM0735
FAS-3x Financials IBB-Biotechs
--> 112 MAXCP stocks Bullish MAXCP
Stocks (7/21/2014)
Highest
A/I 200 DJI-30 Stock - CAT
Highest Power Ranked Leveraged ETFs - UPRO, TECL. UDOW Bullish plurality
--> 38 -37
MINCP stocks Bearish MINCP Stocks
(7/21/2014)
Lowest Power Ranked Leveraged ETFs - SRS, VXX, DUG, SPXU
--> 24 New Highs on NASDAQ 21 new lows. Bullish plurality
--> 39
New Highs on NYSE 10 new lows. Bullish plurality
What could save the situation now would be a surge of positive breadth.
This is
something the Fed could do by encouraging rates to fall short-term. I did notice
the
Bond Funds did rise quite a bit today. Unfortunately, this could also be because
they
are considered a haven from falling stocks.
The
A/D Line Uptrend of the NYSE is in danger, too, of decisively breaking
the
Up-trendline it started 5 1/2 months ago. So far, the break in the uptrend
has
been minor. To avoid this and abort its, so far, minor trend-break, it will need
to
start to surge tomorrow.
Low
interest rates back in 2001 and 2002 did not prevent a bear market from
getting much worse. But they may be able to prevent a bear market occurring
in
dividend stocks, REIT and perhaps the blue chip DJI, too. This, of course, is
what
the FED is trying to do. The reason they were created was to try to limit
the
selling panics that had characterized the Gilded Age, 1880 - 1914. Wikopedia
reports
seven "market panics" in that period.
THE NIFTY 1000
In effect, we have a "nifty-1000". judging from the still strong looking
Russell-1000.
It is the tiers below the biggest 1000 companies that there are troubles. That is
why IWM (Russell-2000) has turned so much weaker than the other indexes we
follow. So, we must watch also the Closing Power of IWM, the ETF for the
Russell-2000.
As the broadest index track, its emerging head and shoulder pattern reflects the
same weakness that the A/D Line uptrend break shows. Most companies are
not doing as well as the SP-500 or DJI-30 AND most Americans are not doing as
as the Wall Street One-Percent.
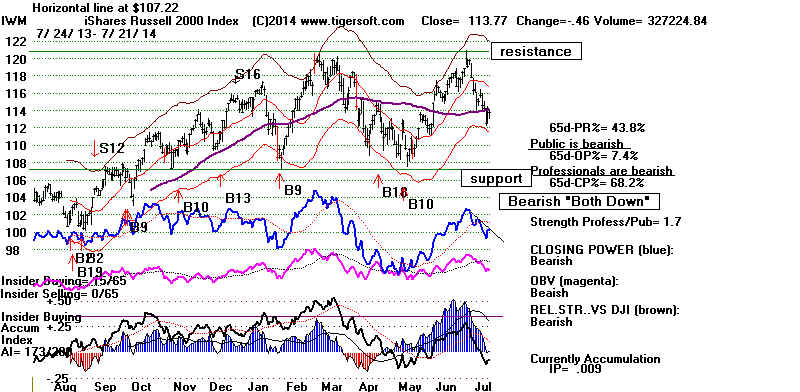
=====================================================================================
OLDER HOTLINES
=====================================================================================
7/18/2014 The Head/Shoulders Patterns Are Still Bearish Warnings Now.
See last
Thursday's comments about the parallels now with April 2010.
Still No Peerless Sell. That's good for the blue
chips and defensive
sector, including REITs and other dividend plays. But we need more strength from
from
smaller stocks this week to dismiss and brush aside the bearish looking
head/shoulders pattern from the Russell-2000 IWM. Specifically, the head/shoulders
can
fairly safely be considered to have been aborted only if it can get back above its
65-dma with its Accumulation Index clearly positive (say, above +.07). Its
IP21 now
stands at 0. The Closing Power is also declining still. But on the positive
side,
you
can see its recent bulge of Accumulation. It reached +.50. Our Closing Power
rules
would declare IWM a buy if its Closing Power can next turn up on this
test
of its 65-dma.
Peerless tells us the market is safe. Perhaps, the one-day break in the A/D Line can
be
excused as simply a matter of only charting trading days. If we left blank
a
non-trading day but shifted the next plot on the X-axis, the A/D Line might not
have
been violated. So, one-day violations of the A/D Line can be insignificant.
This
may be the case here, if breadth is strong this week. The old S6 (breaks in
the A/D Line)
were
not considered valid until the DJI broke its own recent support level
or a
well-tested price uptrendline. This it has not done yet. But the market's
breadth will need to improve this coming week to prevent the A/D Line break
looking like one more bearish technical development.
This
will be difficult. The market will be facing bearish seasonality. Since 1965,
the
DJI has only risen 40.4% of the time over the next week.
Stay hedged is my advise.
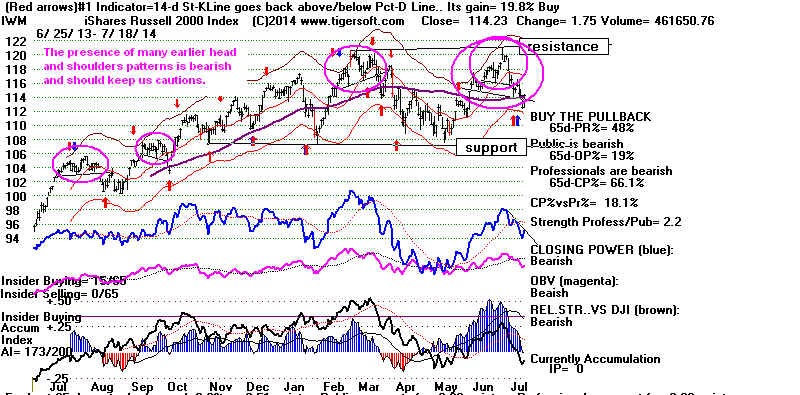

The
market now, I think, is like "Man" in the Reinassance thinker Giovanni
Pico
della Mirandola's cosmology. It is at a point where it can go either direction,
UP or
DOWN, as determined by the free will and the decisions made by the Fed.
Pico
said MAN could determine his own future. Man could be base and
suffer or he could use his higher reason and sentiments and thrive as he seeks
the
sublime. Sadly, the Fates denied poor Pico much of a future. As an
upstart youth, Pice was tried for heresy by the Pope and later poisoned by a
reactionary Prince who envied his talents
Do
all the head/shoulders patterns warn us that the bull market is going to
be
poisoned? The nay-sayers are already telling us its sublime heights are
a
heresy.
10-Year Interest rates are now below 2.5%. It is difficult to see why dividend
players
will
dump their dividend stocks as long as the Fed keeps rates this low. But the
interest rates are near the bottom of their price channel.
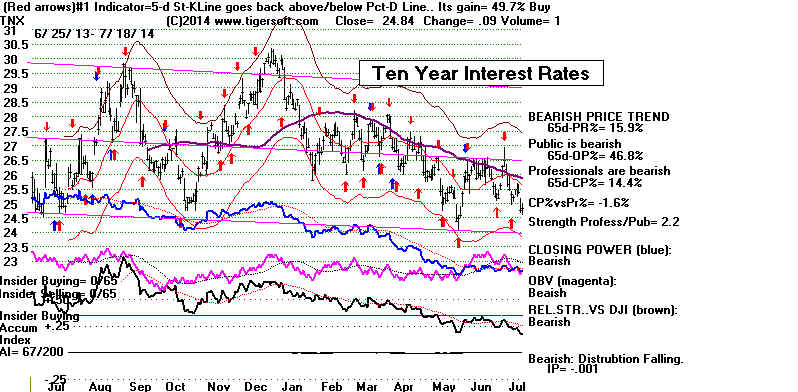
Watch The NYSE's Head/Shoulder Pattern
Renewed weakness and a breaking of the neckline in the NYSE's classic mini-H/S
would
be bearish for even many of the dividend stocks. Even back in the late 1960s,
I
noticed how often head/shoulders patterns would appear in the NYSE chart
I
would see in the NY Times. These patterns still appear frequently. They seem
to
act as a warning sign for all the folks going to work on Wall Street and
reading the paper on their way to work. I have produced these H/S patterns'
charts on the NYSE going back to 1987. What I learned
from this exercise
is
that the patterns can still produce substantial declines even when their
current Accumulation (IP21) on the neckline violation is quite high. See for
yourself this and how reliable they are from a trading point of view.
I
counted 22 head/shoulders patterns in the NYSE since 1987. Only four did
not
have their neckline violated. 16 of the 22 (72/7%) H/S NYSE patterns more than
fulfilled their minimum downside price objective based on the height of pattern
projected down from the point of breakdown. 4 of the 22 (18.2%) made false
breakdowns.
But
what about the positive IP21 reading of the NYSE on Thursday when the neckline
was
tested? It stood at a very positive +.332 level.
There were no cases in the
past
that showed such a high IP21. However, there were 6 cases where the IP21
stood
between +.10 and +.19. Each of these fell significantly.
NYSE Head/Shoulders' Patterns
(To be completed: Neckline of H/S pattern must be violated and
Prices must fall below 65 dma for two days)
IP21
July 2014
Not completed
March 2014
One day neckline violation and quick reversal back up.
-------------------------------------------------------------------------------------------------
Oct 1987
-.007
NYSE fell from 170 (decisive break) to 132 (Dec. bottom)
May 1987
<0
Pattern's neckline not violated
Nov 1989
+.033
NYSE fell from 155 (decisive break) to 149.5 (avhieving minimum
price objective)
May 1992
-<0
NYSE quickly got back above 65-dma with very positive IP21.
1 Feb 1994
+.106
NYSE fell from 260 to 243 in five weeks.
July 1996
<0
NYSE fell from 350 to intra-day low of 330 in six days.
2 Oct 1997 +.126 NYSE plunged intra-day from neckline (490) to 460 (same day) and reversed next day/
Sept 1997 +.042
Pattern's neckline not violated
May 1999 >0
Pattern's
neckline not violated
Jan 2000
<0
NYSE fell from 630 to 580 in five weeks.
Feb 2000
+.02
NYSE fell from 640 to 560 in fours weeks.
3 June 2001 +.186 NYSE fell from 637 to 500 in three months
Feb 2004
>+.07
Pattern's neckline not violated/
March 2005
+/019 NYSE fell from
7280 to 6850 in four weeks.
May 2007 +/079 NYSE fell from 8250 to 7750 in four weeks.
4 October 2007 +.113
NYSE jumped back above neckline at 11000 and then fell to 9400 in a month.
June 2008
+.053
NYSE plunged from 9100 to 4800
in five months.
July 2009
<0
NYSE
jumped back above neckline/65-dma in four days and advanced sharply.
5 May 2010
+.155
NYSE fell from 7337 to 6400 in
two months/
August 2011
-.143 NYSE fell
from 7831 to 6600 in two months.
May 2012
+.046
NYSE fell from 7700 to 7300 in
three weeks.
6 May 2014
+.188
NYSE fell from 9300 to
8900 in four weeks.
August 2014
>.05
NYSE fell
from neckline at 9550 to 9300 in two weeks.
> To Key Index and Leading Stock Charts: DJI, SP-500, etc.
Peerless DJI Chart SPY Chart NASDAQ Chart QQQ
Chart
IBB Chart
IWM Chart
Hourly DJI-OBV Hourly-MVM0735
FAS-3x Financials IBB-Biotechs
--> 116 MAXCP stocks Bullish MAXCP Stocks
(7/18/2014)
Highest
A/I 200 DJI-30 Stock - CAT
Highest Power Ranked Leveraged ETFs - UPRO, DIG, TECL. UDOW Bullish plurality
--> 75 MINCP stocks Bearish MINCP Stocks
(7/18/2014)
Lowest Power Ranked Leveraged ETFs - ERY, SRS, VXX, DUG, SPXU
--> 25 New Highs on NASDAQ 18 new lows. Bullish plurality
--> 84
New Highs on NYSE 9 new lows. Bullish plurality
--------------------------------------------------------------------------------------------------------------------------------------------------------
OLDER HOTLINES
--------------------------------------------------------------------------------------------------------------------------------------------------------
7/17/2014 Still No Peerless Sell. Accordingly, I
expect the DJI to hold
up fairly
well along with many defensive dividend plays, as in late-1986. 10-yr
Interest rates fell sharply today.
But the
broader market has become much more vulnerable. There are now more
NASDAQ new
lows than new highs and the number of bearish MINCPs
excede the
numbers of bullish MAXCPs. But most bearish, the key charts now
look just
like they did in April 2010
right before the "Flash Crash". This
is bound to
dawn on more and more traders this weekend.
IWM
(ETF for Russell-2000 below) has completed its third head/shoulders of the
year.
This adds to the bearishness of the one just completed. Note today's
IWM
decline also broke below its 65-dma, too and the current Accum. Index
(IP21) has turned negative. Going short IWM or TNA (3x) now seems reasonable.
The
Closing Power and Opening Power trends are bearishly both down now.
This
is the weakest of the major market ETFs.
The
key indexes' charts look a lot like they did just before the Flash Crash
of
2010. See the six charts below. The major difference now is that DJI
is
acting stronger and does not now show a head/shoulders pattern like it
did
in 2010.
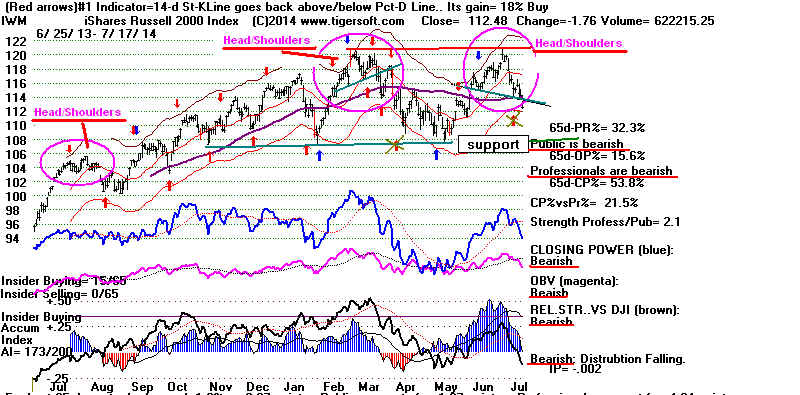
Perhaps, the DJI can suddenly reverse back upwards Friday,
presumably
because of how much interest rates fell today and because the headlines
from
the Ukraine and Israel are not really such theats to the markets.
I
would suggest that a rally Friday is essential to rescue the bulls. Otherwise,
traders will dwell on the weakened technicals and ominous-looking head and
shoulders pattern. These H/S patterns alone may result in another
sharply down Monday. If this happens, there is some risk that we
will
see a sharply down-Monday. That decline could get out of control.
It is
hard not to remember how patterns about the same size as those
see
now in NASDAQ, NYSE and SP-500 plus leveraged short ETFs led to the
2010
Flash Crash. See below. The charts look very similar.
http://en.wikipedia.org/wiki/2010_Flash_Crash
The
decline could be worse:
Might
leveraged short ETFs really cause the next stock market crash?
"ETFs
to Make You Rich During a Market Crash"- TheStreet
NASDAQ 2010
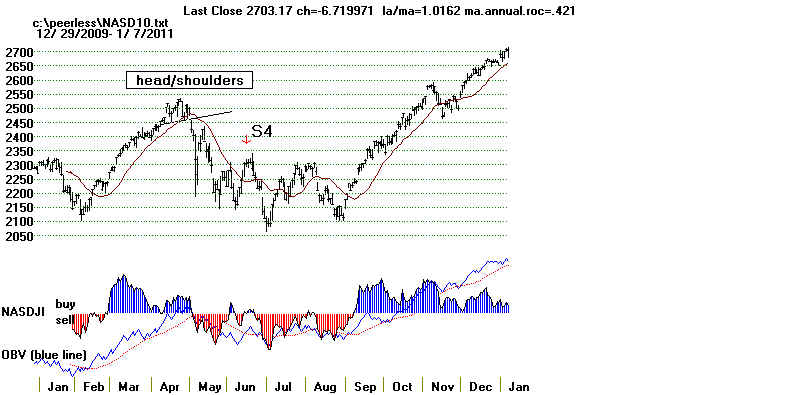 |
NYSE 2010
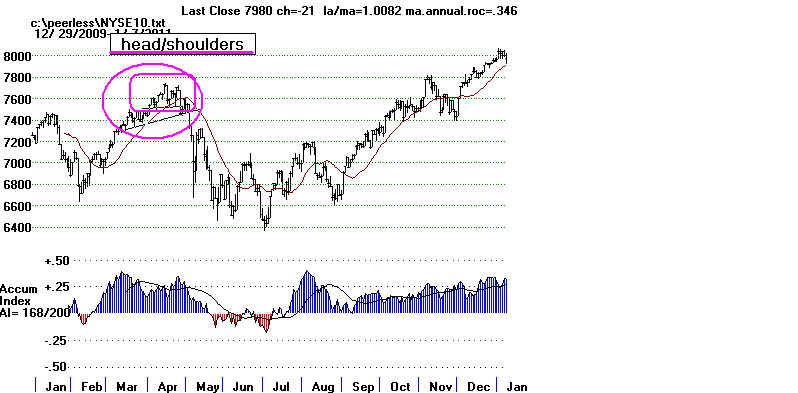 |
SP-500 2010
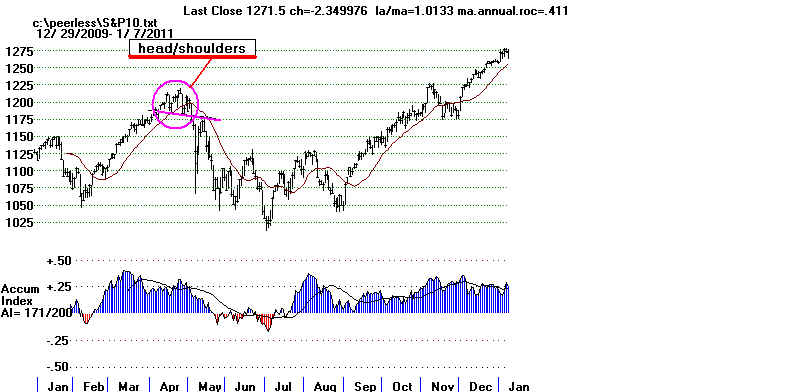 |
Serious technical damage was done to the market today.
1) The NYSE A/D Line has broken its uptrend. In the old days, before automatic
signals,
this
would have been a Peerless Sell S6.
2) IWM, the ETF for the Russell-2000 has completed its head/shoulders AND
broken below its 65-dma. The pattern is reliable and justifies shorting
tomorrow.
3) The DIA's Closing Power uptrend has been violated. This suggests more
profit-taking is warranted.
4) Now we have to wait and see if the biotech ETFs will break their 65-dma.
Completed
headand shoulders do not guarantee this.
5) Finally, we seeun almost completed head/shoulders patterns in the
NASDAQ, the NYSE and the SP-500.
If
these are completed, I would think we will see quickly test their
65-dma. The NASDAQ complete a head/shoulders pattern in February
and
March. 65% of heal/shoulders patterns that are completed fulfill
their
minimum downside projection and often much more when there
is
not Peerless Sell. That success percentage rises when there are many
other
head/shoulders and when the index or stock itself has earlier
formed a head/shoulders.
Today's weakness owed mostly to fears that the shooting down of
a
Malaysian airliner today by Russian separatists in SE Ukraine
will
escalate the growing cold war between US and Russia. Rather,
than
that, one hopes it will cause Russia to think twice about
giving advanced weapons like the 3-man anti-aircraft missile system
used
today to shoot the airliner down. If I'm right and Putin is more
cautious than Americans realize, he may now realize that helping
these
separatists is too risky. But this remains to be seen.
> To Key Index and
Leading Stock Charts: DJI, SP-500, etc.
Peerless DJI Chart SPY Chart NASDAQ Chart QQQ
Chart
IBB Chart
IWM Chart
Hourly DJI-OBV Hourly-MVM0735
FAS-3x Financials IBB-Biotechs
--> 66 MAXCP stocks Bullish MAXCP Stocks (7/17/2014) Bearish
plurality
Highest
A/I 200 DJI-30 Stock - CAT
Highest Power Ranked Leveraged ETFs - UPRO, DIG, TECL. UDOW
--> 145
MINCP stocks Bearish MINCP Stocks
(7/17/2014)
Lowest Power Ranked Leveraged ETFs - ERY, SRS, VXX, DUG, SPXU
--> 9 New Highs on NASDAQ 59 new lows. Bearish plurality
--> 19
New Highs on NYSE 22 new lows. Bearish plurality
=====================================================================================
=====================================================================================
7/16/2014
Still No Peerless
Sell. Can the DJI still rise to 17800 on this
advance?
That seems to be what the FED wants. Signs of deflation, not inflation,
are encouraging
the FED not to change course. This is bullish for REITs. Note
the strength,
too, in MSFT and semi-conductors.
Counter-cyclical gold stocks
remain in their
slump. So, the DJI and the favored Bullish MAXCP stocks should
continue to make
more gains. .
But serious
problems are apparent. Stay hedged by shorting some of the bearish
MINCP.
We see ugly but
not yet completed head/shoulders patterns in important stocks
and ETFs:
AMGN, BA, BAC, BMRN, IWM, MDY, TNA and UNG.
Head/Shoulders
do not all prove
to be tops, but they cannot be ignored. Our studies show that
they also must
break below their 65-dma support. For bearish short-sellers, they work
out well, about
60% of the time, even when Peerless has not yet given a Sell.
(This statistic is derived by counting H/S stocks in the SP-500 from
1990-2012
when there
was no Peerless Sell. See this in the new Killer
Short Sales book
to be
released this weekend.)
TNA's
Accumulation Index is still quite positive. This suggests to me that
it may not
break its 65-dma.
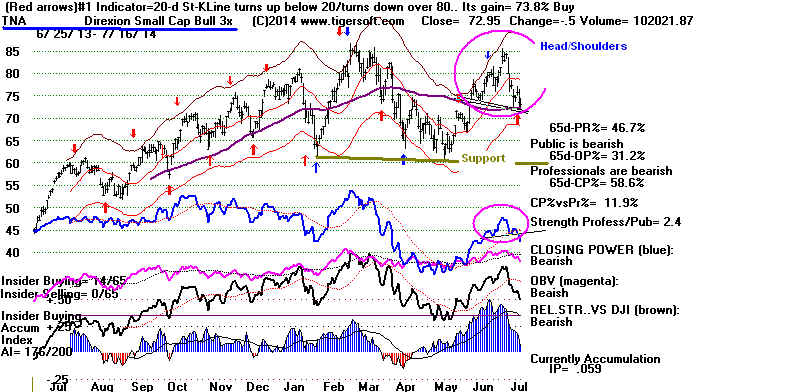
The H/S necklines
of BBH, BIIB, BMRN, DBA, ESRX, MCD and USB have
been broken.
These stocks and sectors could start falling quite sharply even
as the DJI tries
to hold up "appearances". I think IWM and MDY are
are the
key ETFs to watch
now. Both might close below their H/S necklines and
their 65-dma
supports. Consider the height of their patterns to be a good
basis for judging
how far down they will go if their necklines are broken.
As in the Summer
of 1986 when the DJI went sidewise and the NASDAQ
fell 16%, small
caps could continue to slide while the DJI stays between 16600
and 17200.
This would be in keeping with the long-established pattern of the
DJI being the
last index standing.
Watch the NYSE
A/D Line. A breaking of its uptrend will be one more step
towards a bear
market.
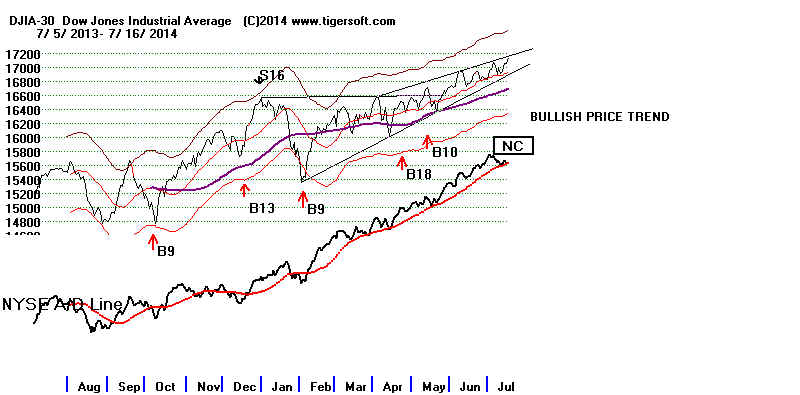
> To Key Index and
Leading Stock Charts: DJI, SP-500, etc.
Peerless DJI Chart SPY Chart NASDAQ Chart QQQ
Chart
IBB Chart
IWM Chart
Hourly DJI-OBV Hourly-MVM0735
FAS-3x Financials IBB-Biotechs
--> 92 MAXCP stocks Bullish MAXCP Stocks (7/16/2014)
Highest
A/I 200 DJI-30 Stock - CAT
Highest Power Ranked Leveraged ETFs - UPRO, DIG, TECL, ERX
--> 95 MINCP stocks Bearish MINCP Stocks
(7/16/2014) Bearish plurality
Lowest Power Ranked Leveraged ETFs - ERY, SRS, VXX, DUG, SPXU
--> 32 New Highs on NASDAQ 34 new lows. Bearish plurality
--> 66
New Highs on NYSE 11 new lows. Bullish plurality
PEERLESS IS STILL HOPEFUL FOR THE DJI
The A/D Line is
not confirming the DJI's advance. How bearish is this?
Since 1928, it
has taken a minimum of 24 trading days' of A/D Line divergences
to produce a top
that leads to bear market in 17 of the 21 bear markets since 1945.
So the size of
the A/D Line divergence is probably still too small to bring a
bear market.
Of course, the market's bearishness would change immediately
if the DJI were
to form and complete a head/shoulders pattern and individual
sectors could
breakdown badly even as the DJI holds up.
(See the
statistics: www.tigersoft.com/Intro/Peerless/index.htm
)
What about the
negative V-I? It stands at -12 now with the DJI 1.2%
over the 21-dma.
We need at least an additional 180 points advance.
This, at least,
is what the past 35 S9Vs tells us: their lowest LA/MA in the past
occurred with the
DJI 2.35% over the 21-dma.
Watch the
Accumulation Index. If an Sell S9V did occur, with the IP21 now
+.155, it is not
likely to bring a big decline. That is what the track record of
Sell S9 key
values shows. When the IP21 was above +.10, the average DJI
drop after an S9V
was only 4.1% in 7 cases. Below +.10, the DJI typically
fell 10%.
The same differential applies to S9Vs in July. When the IP21 was
above +.1, the
DJI fell only 2.6%. With the IP21 below +.10, the 5 July S9Vs
brought an
average 12.8% decline. (I am doing research for the new
Peerless book
which shows how variations in the key values tended to change
power of each
signal.) (See S9V statistics.)
=====================================================================================
OLDER HOTLINES
=====================================================================================
7/15/2014 Still No Peerless Sell.
Can the DJI still rise to 17800 on this
advance?
That seems to be what the FED wants.
But today there
were 1000 more down than up on today's minor DJI gain. We are
starting to see
more and more days with these bearish divergences. Usually, the
market
immediately pulls back when this happens. In this way a Peerless Sell S9
or S9V is
avoided. A big DJI jump this week could bring a Sell. The V-I stands
at -25.
But for now, we
have to remain bullish. The Closing Powers for the DIA,
SPY
and QQQ are each rising, a is the Hourly DJI's DISI (OBV) Line.
REITs and Big
Banks led the advance. The Midcaps and Biotechs are forming what may
turn out to be
bearish head/shoulders pattern. It would help the market's internals
if they turned up
and voided these pattern.
My study of when
significant declines of the last 100 years does show that Julys
are patricularly
bearish, though Septembers and Octobers have brought more
DJI drops than
July in the year of mid-term Elections. That may end up be the
most likely
scenario if there are signs then that Republicans will take the Senate.
I think that
would un-nerve Wall Street, if only because the Fed would then be
under more
pressure to raise rates to lift the Dollar. See "Top Secrets" below.
.
> To
Key Index and Leading Stock Charts: DJI, SP-500, etc.
Peerless DJI Chart SPY Chart NASDAQ Chart QQQ
Chart
IBB Chart
IWM Chart
Hourly DJI-OBV Hourly-MVM0735
FAS-3x Financials IBB-Biotechs
--> 81 MAXCP stocks Bullish MAXCP Stocks (7/15/2014) Bullish
plurality
Highest
A/I 200 DJI-30 Stock - CAT
Highest Power Ranked Leveraged ETFs - DIG, UPRO, ERX. TECL SOXL
--> 80 MINCP stocks Bearish MINCP Stocks
(7/15/2014)
Lowest Power Ranked Leveraged ETFs - ERY, SRS, VXX, DUG, SPXU
--> 10 New Highs on NASDAQ 36 new lows. Bearish plurality
--> 39
New Highs on NYSE 16 new lows. Bullish plurality
TOP SECRETS
Frequency of DJI Declines of More Than 8%
by Month and Presidential Election Year
1915-2014
I think 1915 is a
good point to study data on market tops. The Federal Reserve was
created the year
before to reduce the number of financial panics which had peppered
the stock market
about once every three years between 1900 and 1913.
July is the month when
significant tops have occurred in the last 100 years.
The year of mid-term
Elections produced the most significant tops. But
Julys in mid-term
Elections are about average in the number of tops they spawn.
If we make it through
August, it is September or October we have to worry
most about according
the Top Secrets table below.
June and December are
the months when significant tops have been most
infrequent.
| |
Jan |
Feb |
Mar |
Apr |
May |
June |
July |
Aug |
Sept |
Oct |
Nov |
Dec |
Total |
| PE |
3 |
3 |
1 |
3 |
1 |
|
|
1 |
2 |
|
4 |
1 |
19 |
| PE+1 |
1 |
1 |
3 |
1 |
3 |
|
4 |
1 |
1 |
1 |
|
1 |
17 |
| PE+2 |
1 |
4 |
2 |
2 |
3 |
1 |
2 |
1 |
3 |
4 |
2 |
|
25 |
| PE+3 |
|
1 |
1 |
2 |
1 |
|
4 |
2 |
2 |
1 |
1 |
1 |
16 |
| Total |
5 |
9 |
7 |
8 |
8 |
1 |
10 |
5 |
8 |
6 |
7 |
3 |
7 |
=====================================================================================
OLDER HOTLINES
=====================================================================================
7/14/2014
Still No Peerless
Sell.

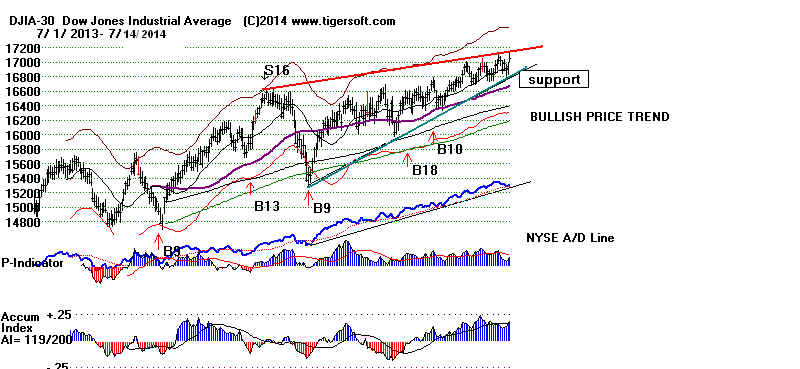
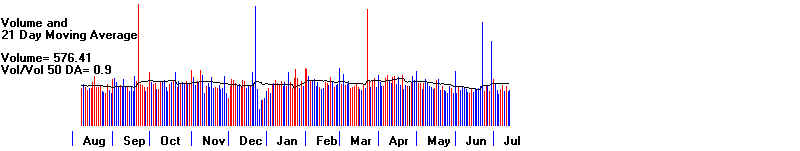
The DJI has breached the 17000 round number resistance. The 1200 point
width of the previous trading range at the point of breakout, 16600, suggests
the DJI's minimum target of 17800 is now quite feasible, provided the
A/D Line uptrend continues. The huge jump in the opening today shows
how much Yellen's dovish promises can still do for the market. It also
shows Public buying from what was probably a Professionally rigged 100+
point higher opening. This is exactly what we would expect to see if this is
to become a climactic vertical advance. Such an advance will also probably bring
in a big jump in volume at the end of the advance in a classic red high volume
reversal occurs. So, the low volume right now is actually bullish, in my
opinion. The Hourly DJI's DISI (OBV) Line remains
strong.
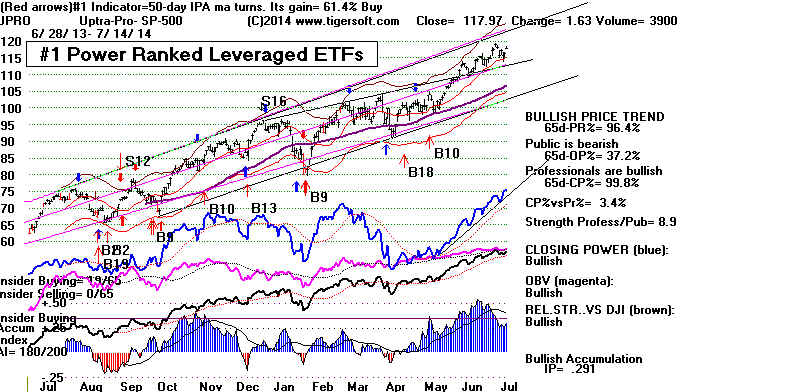
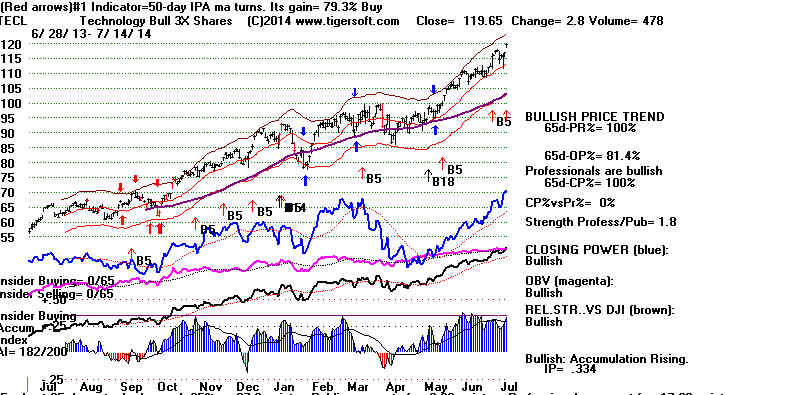
> To Key Index and
Leading Stock Charts: DJI, SP-500, etc.
Peerless DJI Chart SPY Chart NASDAQ Chart QQQ
Chart
IBB Chart
IWM Chart
Hourly DJI-OBV Hourly-MVM0735
FAS-3x Financials IBB-Biotechs
--> 138 MAXCP stocks Bullish MAXCP Stocks (7/14/2014) Bullish
plurality
Highest
A/I 200 DJI-30 Stock - CAT
Highest Power Ranked Leveraged ETFs -UPRO (CP NH today), DIG, ERX. TECL (CP NH today)
--> 54 MINCP stocks Bearish MINCP Stocks
(7/14/2014)
Lowest Power Ranked Leveraged ETFs - ERY, VXX, SRS, DUG, SOXS
--> 30 New Highs on NASDAQ 26 new lows.
--> 79
New Highs on NYSE 8 new lows. Bullish plurality
Hedging Is Working Out, Too.
The lowest Power Ranked Stocks with weak Closing Powers continue
to live in bleak bear markets where rallies are quickly snuffed out.
I have liked the idea of being short some of these as a hedge against a
downside surprise. As long as their Closing Powers stay in downtrends,
our Stocks' Hotline will stay short them. See SODA and BTH below.
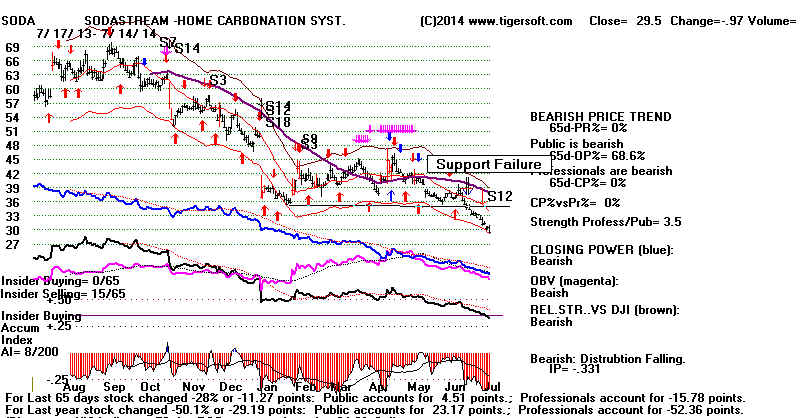
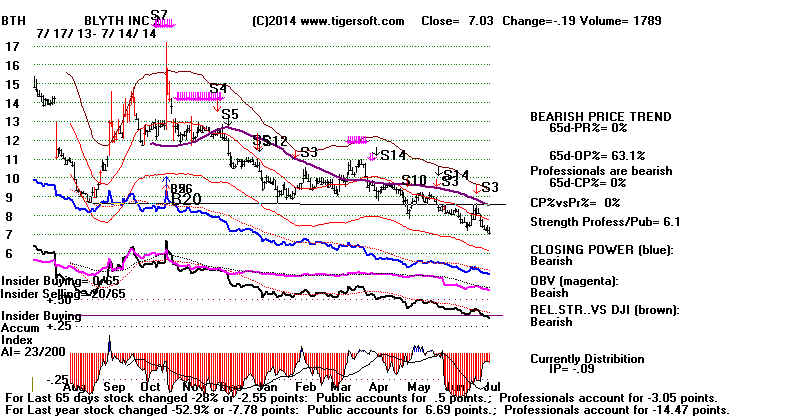
====================================================================================
OLDER HOTLINES
====================================================================================
7/11/2014
Still No Peerless
Sell. The DJI's rising wedge
pattern remains in control. Narrow movements by it up and down
are likely to continue, perhaps until August. Significant breaks in
the DJI's Accumulation Index this early in July are rare. The QQQ
is stronger. The Hourly DJI's DISI (OBV) Line is
rising much faster
than the DJI itself. This mostly occurs before rallies.
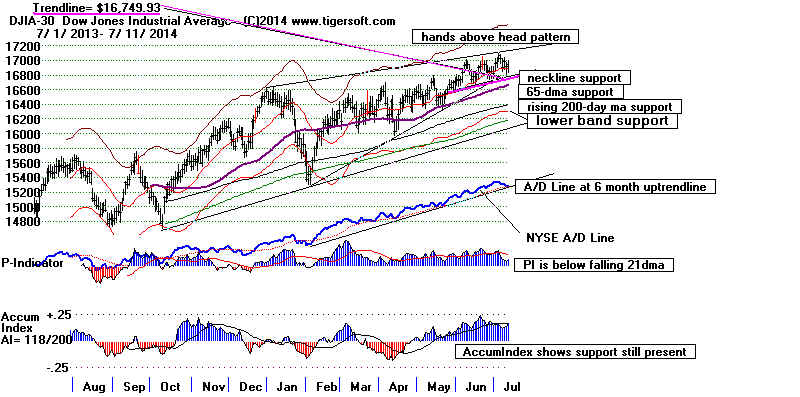
There are two technical support levels that must be watched now. The first is
neckline in the DJI's "hands-above-the-head" pattern. That support now
crosses at 16750. The second support is the rising trend of the NYSE
A/D Line. A simultaneous break in these two supports in the original 1981
would have been taken as a judged "Sell S5/Sell S6". A decline to the
lower band
would likely follow a penetration of these two supprts.
I have a new piece of research to offer tonight. It first deals with
the frequency of July tops going back for the last 100 years. It helps us
see when tops significant tops are most likely. In the Summer, it shows that
most of the tops are made in the late Summer: with the most in mid-to-late July,
then August and September. This is the "Summer Rally" effect. Table
1 below
shows only one significant DJI top in June in the last 100 years, or two if one goes
back to 1900. By comparison, Julys produced 9 significant tops since 1915,
Augusts - 4 and Septembers - 7. By "significant", I mean tops before
a DJI
decline of at least 8%.
The presence of only one June top and only one significant July top
before
July 12th is, perhaps, significant now. The July 1st, 2014 top made thus far
will have to be followed by one or more additional new highs to fit the strong
past pattern where July tops since 1915 have all except one case occurred
after July 11th.
But it we should be alert. My new research for the Short Selling
books shows
that the DJI actually spends 32.9% of its time declining to a bottom at least
8% below its last peak. And, of course, the current bull market is 65 months old.
If the A/D Line were to be broken, profit-taking could drop the DJI down 8%
from its peak. There are a good many major tops that occur after such a decline.
So an 8% correction might well set up a Sell S9 on the next rally, That would
probably
occur in August. The decline from that peak would also represent Wall Street's
predictable crying/begging for more money from the Federal Reserve.
A Sell S9 is not the only way could get a Peerless Sell here. The V-Indicator
is negative. A 2.5% rally up right now might bring a Sell S9V. There is also
a good chance we will see a Sell S19 when the P-Indicator finally turns negative.
It would do so having been positive the requisite 105 straight days.
All things considered, I would prefer now to be hedged with some of our
Bearish MINCP stocks.
> To Key Index and Leading Stock Charts: DJI, SP-500, etc.
Peerless DJI Chart SPY Chart NASDAQ Chart QQQ
Chart
IBB Chart
IWM Chart
Hourly DJI-OBV Hourly-MVM0735
FAS-3x Financials IBB-Biotechs
--> 202 MAXCP stocks Bullish MAXCP Stocks
(7/11/2014) Bullish plurality
Highest
A/I 200 DJI-30 Stock - CAT
Highest Power Ranked Leveraged ETFs - DIG, UPRO (CP NH today), ERX
--> 52 MINCP stocks Bearish MINCP Stocks
(7/11/2014)
Lowest Power Ranked Leveraged ETFs - ERY, VXX, SRS
--> 19 New Highs on NASDAQ 19 new lows.
--> 66
New Highs on NYSE 8 new
lows. Bullish plurality
There have been 73
declines of more than 8% in the DJI in the last 100 years.
These do not overlap.
The study also shows that Wall Street's emphasis on
on the bullish side of
the market rests heavily on statistics which only
consider declines of
20% or more. The truth is more bearish. The DJI actually
spends 32.9% of its
time falling from 8% to 55% down from its peak,
when we consider
rallies of 20% ot more up from a bottom to have established
a bottom.
(Details in my new Killer Short Sales).
1914-2003: Significant Declines
No. Length in Days
Bear Markets with
DJI declines 28
8499
(23.3% of all 10 years)
of more than
19.5%
Deep
Intermediate-Term Declines 9
1175
(3.2% of all 100 years)
ranging from
13.6% to 19.9%.
Corrections from
8%-13.5%
39 2316
(6.4% of all years)
-------------------------------------------------------------------------------------------------
76
11990 (32.9% of all 36,425 days in 100 years)
Frequency of significant DJI tops before declines of more than 8%
going back for the last 100 years by month:
(There is no over-lapping among these.)
Tops before
Tops before Tops before
Total
Declines of
Declines of Declines of
20% or more
13.6%-19.9% 8%-13.5%
---------------------------------------------------------------------------------------------------------------------------------------
January
1973, 2000
1984
1990, 1994
7
(2)
(plus years 1900, 1906 (2) )
(9)
---------------------------------------------------------------------------------------------------------------------------------------
February
1931, 1934, 1966 (3) 1926, 1980 (2)
1924, 1929, 1935, 2004 (4)
9
---------------------------------------------------------------------------------------------------------------------------------------
March
1932, 2002 (2)
1923, 1937 (2) 1997, 2005 (2)
6
---------------------------------------------------------------------------------------------------------------------------------------
April
1930, 1981 (2)
1971
1936, 1956, 1987, 1988, 2010 (5) 8
---------------------------------------------------------------------------------------------------------------------------------------
May
1946, 2001 (2)
2010
1928, 1929, 1965, 2006, 2012 (5) 8
---------------------------------------------------------------------------------------------------------------------------------------
June
June 1, 1992
1
(plus 1901)
(2)
---------------------------------------------------------------------------------------------------------------------------------------
July
July 3, 1931
July 12, 1957 July 14, 1919
9
July 18, 1933
July 17,
1999 July 14, 1943
July 16,
1990 (2)
July 31, 1997
July 19, 2007
(3)
(4)
----------------------------------------------------------------------------------------------------------------------------------------
August
Aug 16, 1937
1926, 1956, 1959 (3)
5
Aug 25, 1987
(2)
----------------------------------------------------------------------------------------------------------------------------------------
September
1929,
1932, 1939
1955, 1978, 1986 (3)
7
1976 (4)
(plus 1912 (1))
(8)
----------------------------------------------------------------------------------------------------------------------------------------
October
2007 (1)
1918, 1922, 1927, 1979, 1989
(5) 6
----------------------------------------------------------------------------------------------------------------------------------------
November
1916,
1919, 1931,
1928, 1980 (2)
7
1938, 1940 (5)
(plus 1909 (1))
(6)
----------------------------------------------------------------------------------------------------------------------------------------
December
1961,
1968 (2)
1915
3
........................................................................................................................................................................................
==================================================================================
OLDER HOTLINES
==================================================================================
7/10/2014
Still No Peerless Sell.
The DJI's rising wedge
pattern remains in control. Narrow movements by it up and down
are likely to continue, perhaps until August. Significant breaks in
the DJI's Accumulation Index this early in July are rare. The QQQ
is stronger. Its Closing Power made a new recovery high. TNA
gave an optimized short-term buy on the test of its rising 65-dma.
Our Stocks' Hotline remains hedged, but long several more than short.
> To
Key Index and Leading Stock Charts: DJI, SP-500, etc.
Peerless DJI Chart SPY Chart NASDAQ Chart QQQ
Chart
IBB Chart
IWM Chart
Hourly DJI-OBV Hourly-MVM0735
FAS-3x Financials IBB-Biotechs
--> 202 MAXCP stocks Bullish MAXCP Stocks
(7/10/2014) Bullish plurality
Highest
A/I 200 DJI-30 Stock - CAT
Highest Power Ranked Leveraged ETFs - UPRO, DIG, ERX
--> 52 MINCP stocks Bearish MINCP Stocks
(7/10/2014)
Lowest Power Ranked Leveraged ETFs - ERY, SRS, VXX
--> 9 New Highs on NASDAQ 29 new lows. Bearish plurality
--> 39
New Highs on NYSE 21 new lows. Bullish plurality
The reversal back up from the intra-day neckline support was helped
by the fall in interest rates. Was the FED acting today to reassure
the bond market? However, Tiger shows a Buy for the 10-Year bond's
interest rates, meaning short-term interest rates are apt to rise.
That could weaken todays' strongest group, REITs and dividend stocks.
That would make it incumbent on the QQQ to continue to perform well.
Professionlals definitely boosted this technology sector after today's weak
opening.
So, the strategy now of betting on the QQQ to do better than the DJI seems reasonable.
This is ETF that must do well.
Smaller stocks are another story. They were hit fairly hard by this 2% DJI
decline. But short-term, they are on a new Stochastic-Buy at their rising
65-dma..
TNA - 10 Year Rates
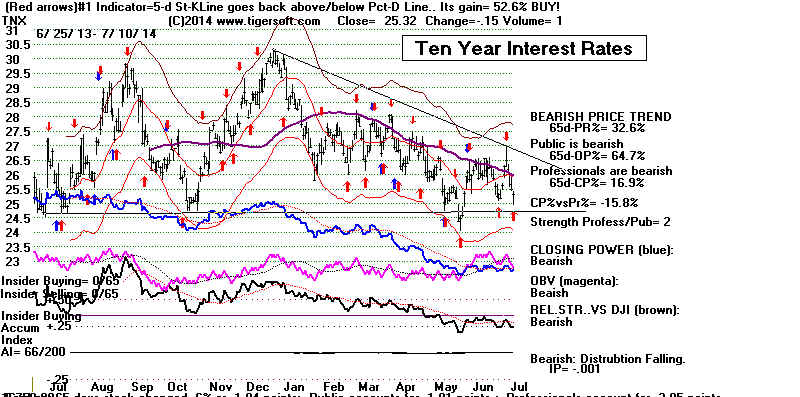 |
DJI-30 Its
price pattern is usually bearish, but the A/D Line is still rising and
support
seems strong under the current levels. But that does not
mean the
DJI will rise much back above 17000.
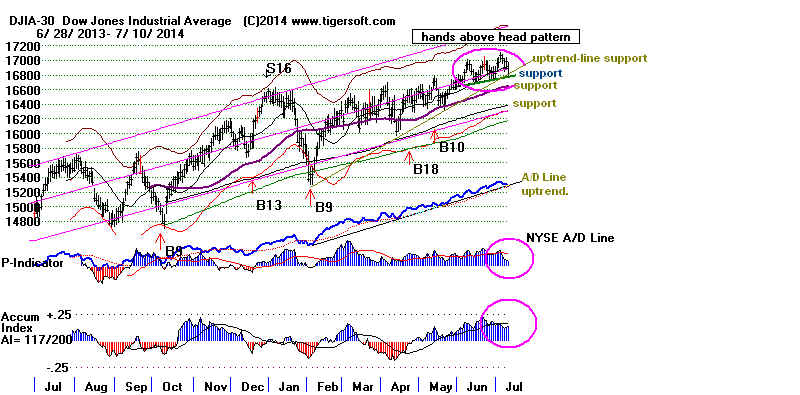 |
QQQ - Its Closing
Power is bullishly rising.
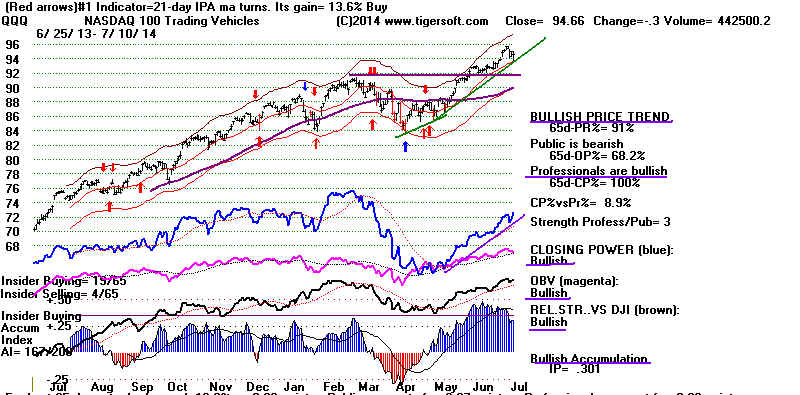 |
TNA - Leveraged
- It should rally up from its 65-dma. The Accumulation Index is
shows enough support to be optimistic.
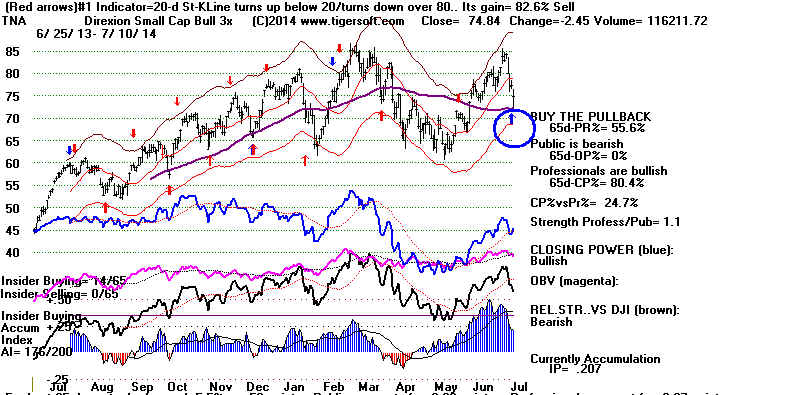 |
==================================================================================
OLDER HOTLINES
==================================================================================
7/9/2014 Still No Peerless Sell. But A Testing of 16600
Lies
Ahead for the DJI.
Today's rally was on low volume. It was lower than either of two down-days
right
before it. The DJI's annualized momentum of the 21-dma is below +.07. That
means
the 21-dma is not good support. A bigger decline is already shaping up
in
the Futures tonight as I write this. A rupture of the hand-above-the
head
("I surrender") pattern's neckline at 16770 should set a decline by the DJI
down
to at least 16200. There the support of the lower band and the rising 200-dma|
will
come into play. At that point, I would expect the FED to do or say something
to try to
stop
the decline from getting worse. That has been their "modus operandi" for
the
last three years.
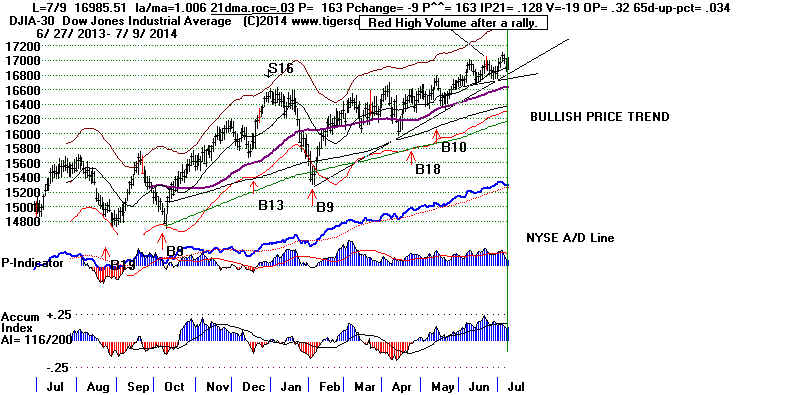
All
the bearish factors I have mentioned in the last week still apply. I won't
repeat them here again. They have already led me to predict first a
test
of the DJI's 65-dma. If that does not hold, then we are apt to see
a
3%-4% decline down from 16906, the point where the DJI's IP21 crossed
below
its 21-dma. This would mean a DJI decline to 16220. See the chart below.
That
is about as much of a DJI decline as we should expect without a Peerless Sell
given
the break by the current Accumulation Index (IP21) below its 21-day
ma.
(See the relevant data in the completed table in yesterday's Hotline.)
Because the probability of the decline seemed high, I suggested taking
profits in over-tended stocks whose Closing Powers turn weak. I also
suggested hedging with the increasing number of Bearish MINCP stocks.
Today's rally helped us do just this on our Stock's Hotline.
A "Politicized" Fed Could Bring Higher Rates
Much Sooner Than The Fed Now Countenances
There
is "new" news. I learned today that some
House Republicans now
want
to run this Fall's political campaign as a referendum on the Fed's low
interest
rate policies. In particular, they would overturn if they win the
Senate's majority the Humprhrey-Hawkins
mandate from 1978 that says
the
Fed must weigh unemployment statistics as much as inflation in setting
interest rates. This is a cause many Conservatives want to take up feeling
there
are is a bloc of older voters who are likely to vote who would love to
get
4% or 5% on their retirement savings. The view here is based on a
calculus that believes most other voters consider talk of the Federal Reserve
and
monetary policy to be just a lot "white noise" to tune out. See:
http://www.creators.com/conservative/david-harsanyi/it-s-about-time-we-politicized-the-fed.html
The
political chances of such a mandated policy change seem low.
Even
if the Republicans did win Congress, getting the Senate to change the
FED
will be difficult. Wall Street's influence would be decisive. Wall Street
and
wealthy people generally have benefited enormously from the Fed's
low
rate policies. Would the new Senate be filibuster proof? Wouldn't Obama
veto
any such changes?
Still, I think the big question is whether making the FED a political issue in the
coming Election Year campaigns will change the Fed's strong support of
cheap
money? Will the Fed allow rates to start going up earlier than otherwise?
And
if they do this, will the Fed loose control of the bull market that they
have
clearly rigged. Watch to see if the "talking heads" on TV start talking
about
FED "reform"and the need to better protect against inflation, especially
since
long-term Unemployment is not much impacted by dovish Fed policies.
> To
Key Index and Leading Stock Charts: DJI, SP-500, etc.
Peerless DJI Chart SPY Chart NASDAQ Chart QQQ
Chart
IBB Chart
IWM Chart
Hourly DJI-OBV Hourly-MVM0735
FAS-3x Financials IBB-Biotechs
--> 95 MAXCP stocks Bullish MAXCP Stocks (7/9/2014) Bullish
plurality
Highest
A/I 200 DJI-30 Stock - CAT
Highest Power Ranked Leveraged ETFs - UPRO, DIG, ERX
--> 65 MINCP stocks Bearish MINCP Stocks
(7/9/2014)
Lowest Power Ranked Leveraged ETFs - ERY, SRS, VXX
--> 25 New Highs on NASDAQ 13 new lows. Bullish plurality
--> 54
New Highs on NYSE 10 new lows. Bullish plurality
==================================================================================
OLDER HOTLINES
==================================================================================
7/7/2014 Still No Peerless Sell.
The
Hamas-Israeli fighting now should keep the stock market under
a
dark cloud for now. If history teaches anything, however, it is that
an
outright war there should not have any lasting impact on the US stock
market.
But
the DJI is giving warning signs. We need to be aware of them.
It might be wise to sell some over-extended long positions if they break
their
Closing Power uptrends and short some of the Bearish MINCP stocks.
A
rupture by the DJI of its rising wedge's uptrend-support would complete
not
just this pattern but also complete a rare "hands above the heads" pattern.
This
is a top pattern showing excessive speculation. It is similar to a head/shoulders
except that the left and right shoulder are higher than the head.
Such
a breakdown might have enough downside momentum to
break
the apparent support at the rising 65-dma.
> To Key Index and Leading Stock Charts: DJI,
SP-500, etc.
Peerless DJI Chart SPY Chart NASDAQ Chart QQQ
Chart
IBB Chart
IWM Chart
Hourly DJI-OBV Hourly-MVM0735
FAS-3x Financials IBB-Biotechs
--> 77 MAXCP stocks Bullish MAXCP Stocks (7/8/2014) Bullish
plurality
Highest
A/I 200 DJI-30 Stock - CAT
Highest Power Ranked Leveraged ETFs - UPRO, DIG, ERX
--> 55 MINCP stocks Bearish MINCP Stocks
(7/8/2014)
Lowest Power Ranked Leveraged ETFs - ERY, VXX, DUG
--> 9 New Highs on NASDAQ 20 new lows. Bullish plurality
--> 26
New Highs on NYSE 11 new lows. Bullish plurality
I
should also point out the red price bar 11 trading days ago. This I
call
"red high volume" because Volume that day was significantly above the
average daily volume. Red high volume after a big advance
which does
not
occur on a breakout shows bearish "churning". (We often see
this
in our Tiger charts of low priced stocks. It is less common in
highed stocks). Example. All these aspects of the DJI's Peerless chart
should be factored into our assessment of the market's technicals now.
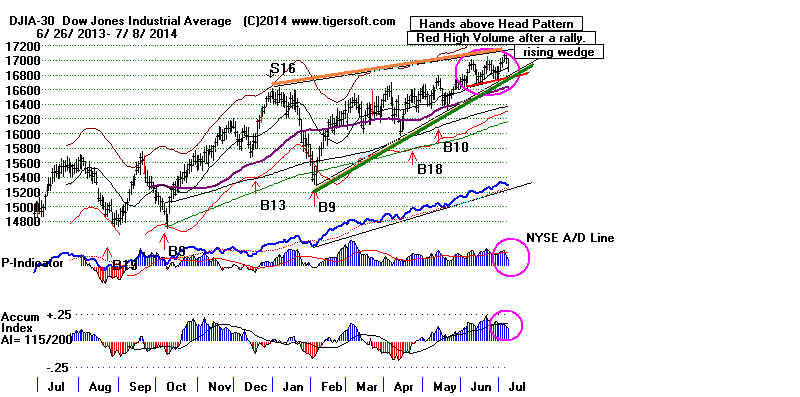
In my
opinion, the most worisome sign was yesterday's clear penetration
by
the Accumulation Index of its 21-dma. In a slightly altered technical
environment, this would bring a Sell S4. But such breakdowns by IP21
of
its 21-dma are amply bearish enough to bring a 3%-4% decline.
I
think that is what we are seeing now.
Look at the
table below and you will see that:
1. IP21 breakdowns only occurred once before July 9th in all the years back to 1929.
2. The biggest decline when there was no Peerless Sell was 5%, back in 1944.
3. Without a Peerless Sell. most further declines were between 2% and 4%,
Summer IP21 Drops below TISI without a Sell S4
DJI must be above lower 3.0% band.
DJI must be in a bull market and above its 65-dma.
7/12/1929
DJI rose from 346.4 to 381.2 before collapsing.
8/7/1935
DJI kept rising.
8/13/1936
DJI fell to LB (lower band) and then rose strongly.
7/28/1941 DJI immediately started its big Pearl Harbor decline. (There were
other Peerless sells)
7/18/1944
DJI fell 5% and then rose strongly. No Peerless Sell.
(7/11/1947
DJI fell 5% and then rallied back to upper band. This
was a Sell S4)
7/13/1948
DJI fell to the lower band and then rallied to upper
band. (There were other Peerless sells)
7/30/1962 DJI fell from 279.2 to 263.1 before rallying strongly. (There was
no other timely sell signal at top.)
7/29/1954 DJI fell 3% before rallying strongly.
7/8/1955
DJI fell to lower band before rallying up past upper
band. (There was another Peerless sells)
7/24/1956 DJI fell from 513.2 to 468.2. (There was another
Peerless sells)
8/18/1958 DJI kept rising.
8/5/1959 DJI fell 9%. There were other Peerless
sells)
8/29/1961 DJI fell to LB. (There was another Peerless sells)
7/29/1964 DJI fell less than 1% and then resumed its advance.
------------------------------------------------------------------------------------------------------
8/16/1967 DJI fell from 915.68 to 894.71 (2+%) and then
rallied to upper band. (No Peerless Sell)
7/21/1975 DJI fell from 854.74 to 793,26. There had been a
Peerless sell at top.
7/14/1976 DJI fell from 1005.16 to 970.83 (3+%)
8/14/1978 DJI fell 12% (Better Peerless Sells followed.)
8/24/1979 DJI fell 10% (Better Peerless Sells followed.)
7/10/1980 DJI kept rising. .
7/13/1980 DJI rallied from 1197.82 to 1243.69 before falling
to LB
8/1/1985 DJI fell from 1346.1 to 1298.16 (4%) before
rallying strongly. (No Peerless Sell.)
7/20/1987 DJI kept rising. .
8/15/1989 DJI kept rising.
7/17/1991 DJI fell from 2978.76 to 2913.69 (2+%) There
had been a previous Peerless sell
8/12/1992 DJI fell from 3320.83 to 3152.25 (5%)There
had been a Peerless sell
8/13/1993 DJI fell from 3669.64 to 3547.02 (3+%) No
Peerless Sell.
8/13/1995 DJI fell from 4693.32 to 4601.40 (2+%)
No Peerless Sell.
8/12/1997 DJI fell from 7960,84 to 7622.42 (4+%) No Peerless Sell.
7/24/1998 DJI fell from 8937.36 to 7539,07 (Major Peerless Sellls at top.
8/1/2003 DJI kept rising.
7/30/2007 DJI fell from 13358.31 to 12845.78. Many
Peerless Sells at the top.
8/14/2009 DJI kept rising.
8/18/2010 DJI fell from 10415.54 to 9985.81, Many Peerless
Sells at the top.
7/29/2011 DJI fell from 12143.24 to 10655.3. Many Peerless
Sells at the top
7/31/2012 DJI kept rising.
8/5/2013 DJI fell from 15112,19 to 14840.95, Many
Peerless Sells at the top.
7/8/2014 DJI = 16906.52 No Peerless Sells.
If a Decline des follow, a 4% decline would be typical if there has been no Peerless Sell.
That suggests a bottom at 16200.
=================================================================================
OLDER HOTLINES
=================================================================================
7/3/2014 Still No Peerless Sell. The DJI could
now stall at its rising resistance
line.
Note that the DJI's Accumulation Index seems to be turning flat.
However, I would think that any short-term post July 4th pullback will not be a problem.
Both
the NYSE A/D Line and P-Indicator remain very positive and are rising. The
Hourly DJI and the Hourly DISI are in uptrends, too.
|
==================================================================================
OLDER HOTLINES
==================================================================================
7/7/2014 Still No Peerless Sell. The DJI, SPY, OEX,
NYSE and IWM
have all
stalled at their rising resistance lines. The DJI's Accumulation Index
and
P-Indicator have both fallen below their 65-dma.
A 3%-4% DJI
decline now based on the IP21falling below its 21-dma would
be in
keeping with the history of this new penetration, though most of these
declines
started later in the Summer. (See the new historical study of this
development
at the bottom of this page.)
Several
important stocks now show head/shoulders' patterns in the making:
DAL, ESRX, HPQ and MCD. So does UNG (natl gas ETF) and DBA
(Agriculure)
More and
more key stocks now have negative Accumulation: AAPL, ADBE, ARGR,
ALXN, AMZN,
BA, BMRN... just to start the list.
What are we
to make of all this? The DJI has now risen 64 months without more
than a 17%
correction? You have to go back to the good times of 1991-1998.
and back to
the 1947-1957 expansion to find longer bull markets without a 17%
interim
sell-off. The bull market of 1982-1987 was 60 months old when its
final peak
was made. The bull market of 2003 - 2007 was 55 months old
at its last
peak.
Peerless
still has not given a Sell. Why? The FED is the best answer I can give.
Peerless
heavily relies upon the NYSE A/D Line and this is now being pushed up
by the
Fed's extraordinarily supply of lots and lots of money to the Big Banks,
who are
allowed to buy stocks and play with derivatives, all still in a mostly unregulated
way.
The FED has not required them to make more loans to American consumers
or small
businesses in return for this cheap supply of trillions of Dollars.
With the US
economy only luke-warm, Big Money chooses to play stocks,
bonds and
take-overs. Those investments are still the best game in town.
And there's
a kicker. The availability of numerous leveraged short ETFs
gives Big
Money the illusion that they could quickly hedge their long bets if
they needed
to. They don't seem to appreciate that these leveraged shorts
would
likely rise extraordinarily quickly if the market were to break down.
In that
case, I fear that the "tail might wag the dog", as it were. The rush
into short
leveraged derivatives could produce a self-fulfulling debacle
like
nothing we have ever seen if the FED is not very careful.
Nothing
presently is pushing the FED to change their approach. The Dollar is
stable.
Inflation is not apparent in commodities, other than in rising oil prices.
Japan and
Europe also have very low interest rates. And Federal Government
revenue is
rising. So, why would the FED raise interest rates and risk damaging
the
fragile, over-extended stock market? I don't think it would. So, unless
something
bad from
outside the economic arena befalls the market, the DJI is probably
safe for a
while longer.
Most
likely, the pullback, if it continues, will stop at the rising 65-dma, now at 16600.
A decline
to that level will probably bring a Buy B11 if the P-Indicator stays
positive.
This is less than a 4% retreat. And as for hedging and shorting, there
just are
not many Bearish MINCP stocks that look vulnerable now.
> To Key Index and
Leading Stock Charts: DJI, SP-500, etc.
Peerless DJI Chart
SPY Chart
NASDAQ Chart QQQ Chart
IBB Chart
IWM Chart
Hourly DJI-OBV
Hourly-MVM0735
FAS-3x Financials IBB-Biotechs
--> 122 MAXCP stocks Bullish MAXCP Stocks (7/7/2014) Bullish
plurality
Highest
A/I 200 DJI-30 Stock - CAT
Highest Power Ranked Leveraged ETFs - UPRO, DIG, ERX
--> 33 MINCP stocks Bearish MINCP Stocks
(7/7/2014)
Lowest Power Ranked Leveraged ETFs - ERY, SRS, SOXS
--> 27 New Highs on NASDAQ 7 new lows. Bullish plurality
--> 42
New Highs on NYSE 4 new lows. Bullish plurality
How important is it now that the DJI's Accumulation Index has fallen below it
own 21-day
ma without a Sell S4? Let's go back over Julys and Augusts
in the past
when the same thing happened in a rising market and see what then
followed:
Summer IP21 Drops below TISI without a Sell S4
7/12/1929
DJI rose from 346.4 to 381.2 before collapsing.
8/7/1935
DJI kept rising.
8/13/1936
DJI fell to LB (lower band) and then rose strongly.
7/28/1941 DJI immediately started its big Pearl Harbor decline. (There were
other Peerless sells)
7/18/1944
DJI fell 5% and then rose strongly.
7/14/1947 DJI fell 5.5% and then rallied back to upper band.
7/13/1948
DJI fell to the lower band and then rallied to upper
band. (There were other Peerless sells)
7/30/1962 DJI fell from 279.2 to 263.1 before rallying strongly. (There was
no other timely sell signal at top.)
7/29/1954 DJI fell 3% before rallying strongly.
7/8/1955
DJI fell to lower band before rallying up past upper
band. (There was another Peerless sells)
7/24/1956 DJI fell from 513.2 to 468.2. (There was another
Peerless sells)
8/18/1958 DJI kept rising.
8/5/1959 DJI fell 9%. There were other Peerless
sells)
8/29/1961 DJI fell to LB. (There was another Peerless sells)
7/29/1964 DJI fell less than 1% and then resumed its advance.
to be contimued tomorrow night.
=================================================================================
OLDER HOTLINES
=================================================================================
7/3/2014 Still No Peerless Sell. The DJI could
now stall at its rising resistance
line.
Note that the DJI's Accumulation Index seems to be turning flat.
However, I would think that any short-term post July 4th pullback will not be a problem.
Both
the NYSE A/D Line and P-Indicator remain very positive and are rising. The
Hourly DJI and the Hourly DISI are in uptrends, too.
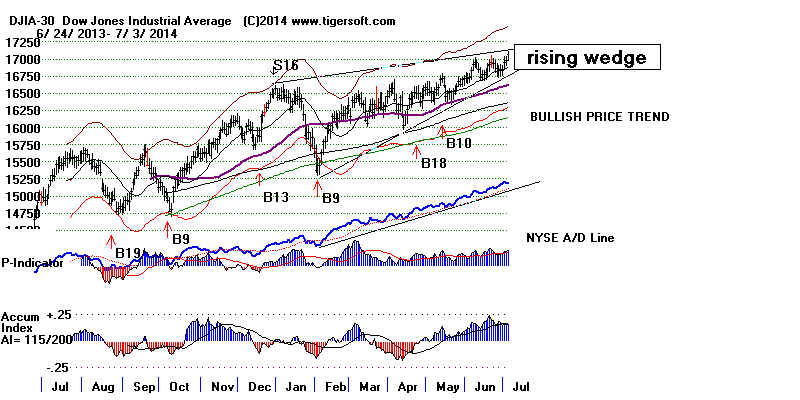
The QQQ is much stronger now than the DJI.
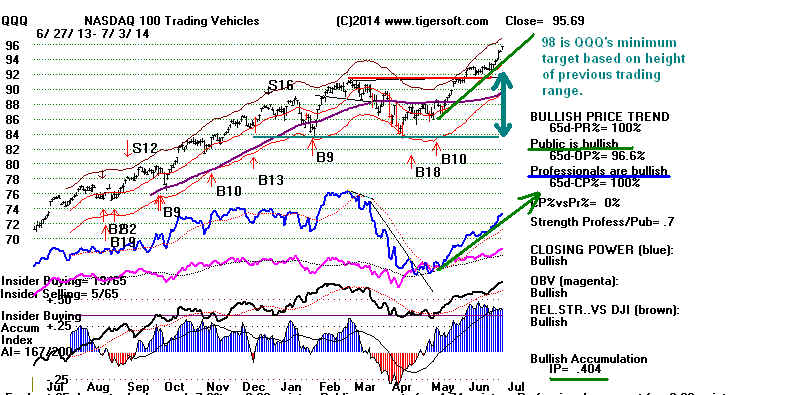
While
the QQQ has broken out and is running, we must now wait to see if
the
DJI, the SPY and IWM can move a little higher next week and make
breakouts. In the case of DIA and SPY, a breakout would send them above
their
rising resistance lines. Such action would be in keeping with the notion
that
the market may be ready to enter a late-stage climax and starting an
exciting, steep vertical ascent. Professionals are skeptical of this, judging from
the
lagging Closing Powers.
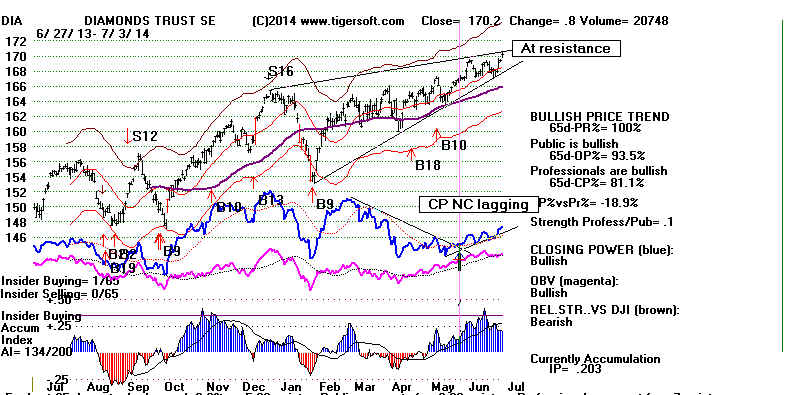 |
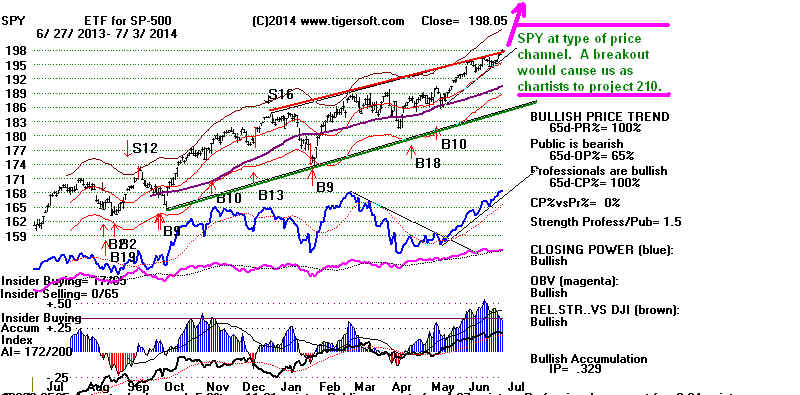 |
> To
Key Index and Leading Stock Charts: DJI, SP-500, etc.
Peerless DJI Chart
SPY Chart
NASDAQ Chart QQQ Chart
IBB Chart
IWM Chart
Hourly DJI-OBV
Hourly-MVM0735
FAS-3x Financials IBB-Biotechs
--> 138 MAXCP stocks Bullish MAXCP Stocks (7/3/2014) Bullish
plurality
Highest
A/I 200 DJI-30 Stock - CAT
Highest Power Ranked Leveraged ETFs - UPRO, DIG, ERX
--> 17 MINCP stocks Bearish MINCP Stocks
(7/3/2014)
Lowest Power Ranked Leveraged ETFs - ERY, SRS, SOXS
--> 79 New Highs on NASDAQ 11 new lows. Bullish plurality
--> 121
New Highs on NYSE 5 new lows. Bullish plurality

Why Is CAT doing so well?
CAT is the
highest AI/200 stock in the DJI. This makes it our current Tahiti
Dow stock. Since
1970, they have averaged well over 20% per year gains,
simply holding them
automatically for 18 months. First, it will have to surpass
its February 2011 peak
and resistance.
Why is it going up? Cramer's pumping? Perhaps. Why
is there so much
high Accumulation?
This shows very big institutional buying. Perhaps, CAT's
rise predicts a big
increase in Overseas' Public Works and road building. In that
case, this will help
lots of exporting multi-national companies. That will boost
the DJI.
But before crediting an overseas' expansion, I think we must watch
the TigerSoft index of
non-US ETFs to see if it can make a recovery new high.
Right now, it seems
unlikely that the foreign ETFs are strong enough to be the
reason behind CAT's
advance and heavy accumulation. So what's up?
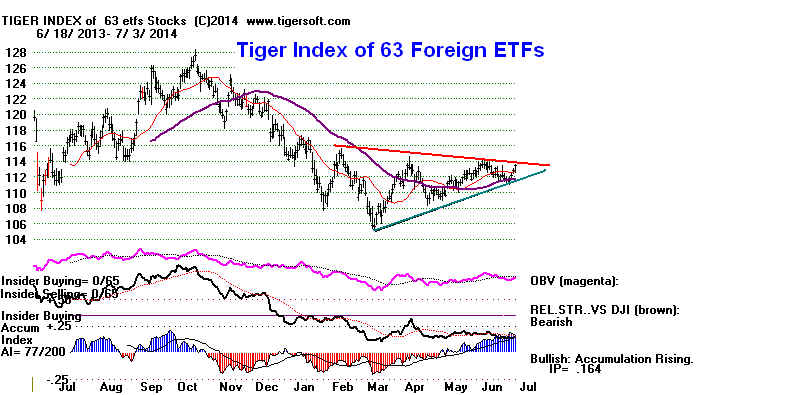
CAT's rise is certainly
not do its traditional sources of strength: mining, open-pit coal
or electrical power
generation. So, what's really up? Is it going to be bought out?
No. It's way too
big.
Here's my thought:
driving around, whenever I see big road repairs, I always see
big CAT tractors.
And this is an Election Year. Maybe, we are about to see
a big Election Year
push for a new job-creating Public Works' program. And
might it just be that Republicans are finally going to agree to a big new Public Works'
and Road Building
Program? There is
precedent for big Republican road programs.
Coolidge's road building legislation in 1925
went a long ways in boosting the 1920s'
roaring automobile
industry and Eisenhower's 1955 legislation was responsible for the
interstate highway
system that we take for granted today.
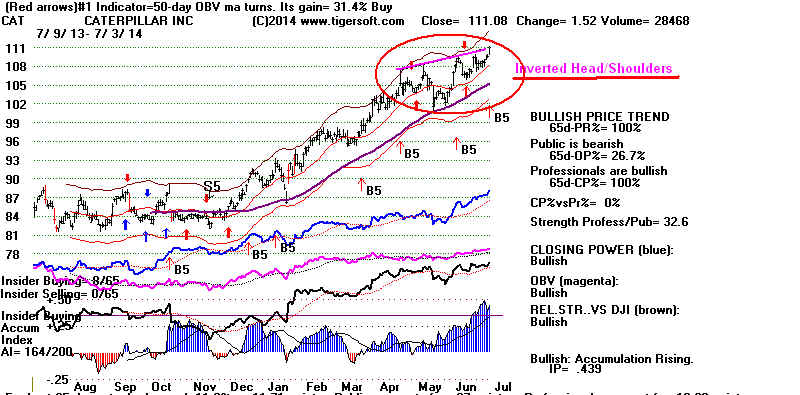
=================================================================================
OLDER HOTLINES
=================================================================================

I will be finishing the long-needed, entirely
re-written Explosive Super Stocks and
Killer Short Sales. These will be On-line
books like the Tiger Closing Power e-book,
but quite a bit longer because so much has
happened since 1995. Each is $38.50 by
check sent to Wm. Schmidt, 5970 Gullstrand St.,
San Diego or $42.50 by CC.
See the new
research below on how high IP21 and breakouts
would have identified most of the best performing
stocks in the first six months of this year. Our
Explosive Super Stocks book refines this simple
idea and shows what are the "tells" of a likely reversal.
As for new on-line Killer Short Sales book,
the
2000-2003 and 2007-2009 bear markets show
forcefully how simple it is to profit from the extremes
of insider selling patterns we have identified that
make the best short sales.
7/2/2014 Still No Peerless Sell. Internals remain
strong enough
to keep any Peerless
Sells away for a while. Today's breadth did turn
negative, but the usual
bullishness of the market the day before and
after July 4th should
keep the indexes moving higher.
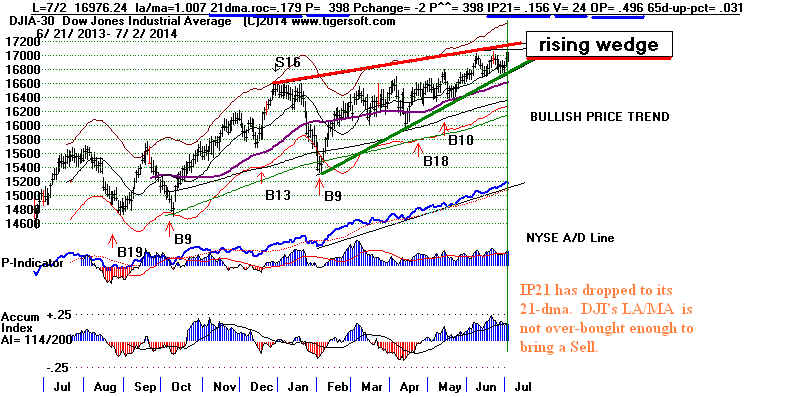
> To Key Index and Leading Stock
Charts: DJI, SP-500, etc.
Peerless DJI Chart
SPY Chart
NASDAQ Chart QQQ Chart
IBB Chart
IWM Chart
Hourly DJI-OBV
Hourly-MVM0735
FAS-3x Financials IBB-Biotechs
--> 267 +30
MAXCP
stocks Bullish MAXCP Stocks (7/2/2014) Bullish
plurality
Highest
A/I 200 DJI-30 Stock - CAT
Highest Power Ranked Leveraged ETFs - UPRO, DIG, ERX
--> 17 -6 MINCP stocks Bearish MINCP Stocks
(7/2/2014)
Lowest Power Ranked Leveraged ETFs - ERY, SRS, SOXS
--> 41
New
Highs on NASDAQ 10 new lows. Bullish plurality
--> 64
New Highs on NYSE 3 new lows. Bullish plurality
Best Performing Stocks Stocks
in First 6 Months of 2014
over $10.
Speculation can be very
profitable in Tiger's Explosive Super Stocks.
I've re-written our
1995 Explosive Super Stocks to show how to find
these stocks early-on
and stay in them so long as their rally can safely
be expected to
continue.
You can see below the
first step used here is to search the ACCUMVER and
VHIP21 stocks and the
LOWPRICE and NEWHIGHS stocks in our
Tiger Data Page with
the Tiger Power Ranker. Over and over, we have found
that an insider
buying bulge of Accumulation is most often seen just before
or at the start
of the take-off in a previously quietly trading stock with
Insider Buying
levels of Accumuation the make new highs.
Order the New on-line Explosive Super Stocks
for $42.50 by CC.
EXPLOSIVE SUPER STOCKS IN 2014
July 2, 2014
Stock Price 2014 Comments
Pct
Gain
------------------------------------------------------------------------------
RDNT 6.62 296% Radnet - outpatient diagnostic imaging services 4248 employees
B5, B20, B16, B5
Red high volume on breakout and IP21 reached .449
CP uptrend has been broken.
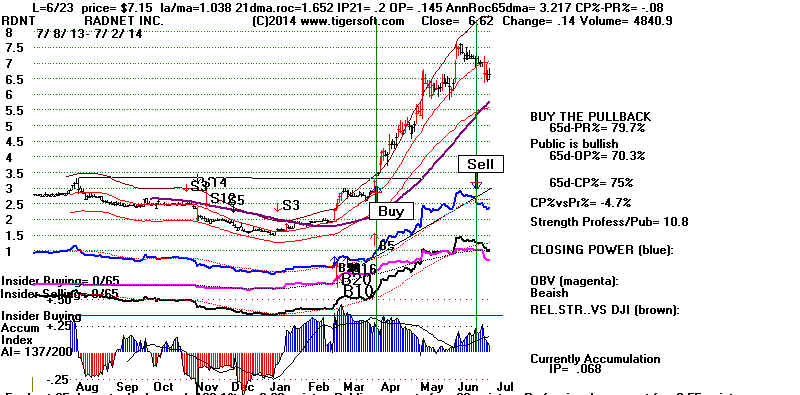 -------------------------------------------------------------------------
BIOF 6.62 287% BioFuel ENergy = 7 employees
Two dry-mill ethanol production facilities in Minnesota
B5, B16, B16, B18, B9, B26
-------------------------------------------------------------------------
BIOF 6.62 287% BioFuel ENergy = 7 employees
Two dry-mill ethanol production facilities in Minnesota
B5, B16, B16, B18, B9, B26
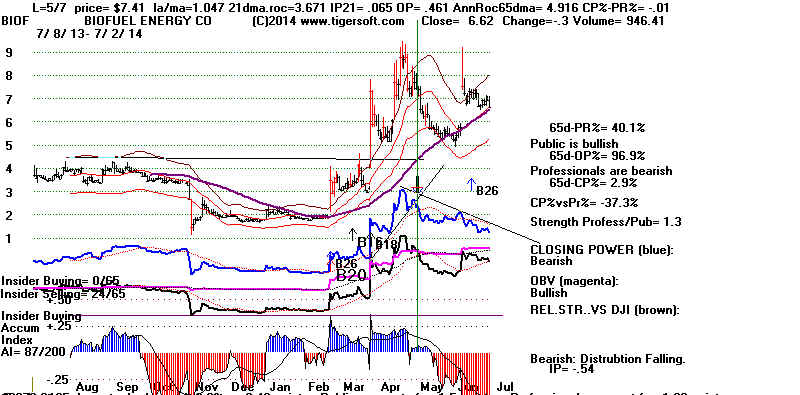 -------------------------------------------------------------------------
ICPT 246.21 260% Huge gap up and high volume Reversal Day
http://finance.yahoo.com/q/pr?s=ICPT+Profile
-------------------------------------------------------------------------
PTX 9.07 259% Pernix Therap. Closing Power still rising
huge red volume on first day up,
B5, B16, B10, B5, B9, B26, B10
IP21 reached .45 on first day up.
-------------------------------------------------------------------------
ICPT 246.21 260% Huge gap up and high volume Reversal Day
http://finance.yahoo.com/q/pr?s=ICPT+Profile
-------------------------------------------------------------------------
PTX 9.07 259% Pernix Therap. Closing Power still rising
huge red volume on first day up,
B5, B16, B10, B5, B9, B26, B10
IP21 reached .45 on first day up.
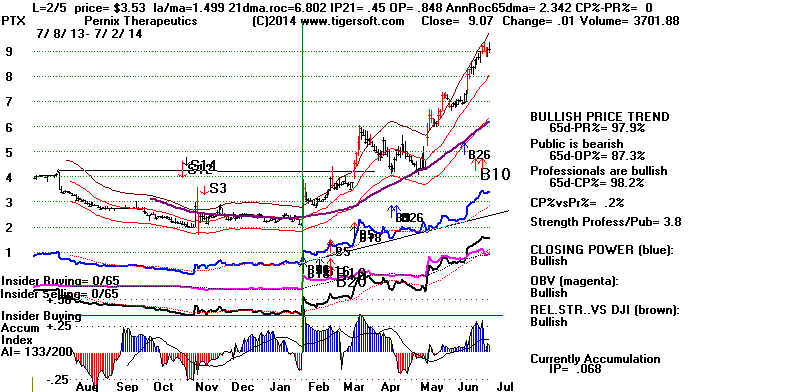 -------------------------------------------------------------------------
ITMN 44.15 199% Intercept Pharm
hige price jump on take-off.aa
-------------------------------------------------------------------------
ITMN 44.15 199% Intercept Pharm
hige price jump on take-off.aa
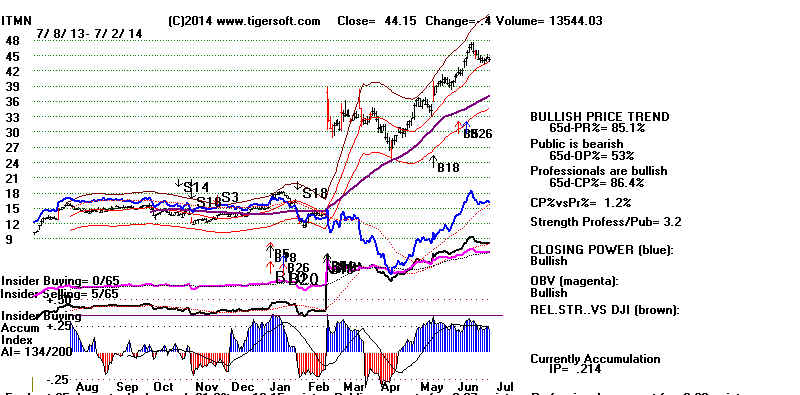 -------------------------------------------------------------------------
VTNR 9.65 188% Vertex Energy
Classic red high volume Breakout B12, IP21 = .471
-------------------------------------------------------------------------
VTNR   9.65 188% Vertex Energy
                 Classic red high volume Breakout B12, IP21 = .471
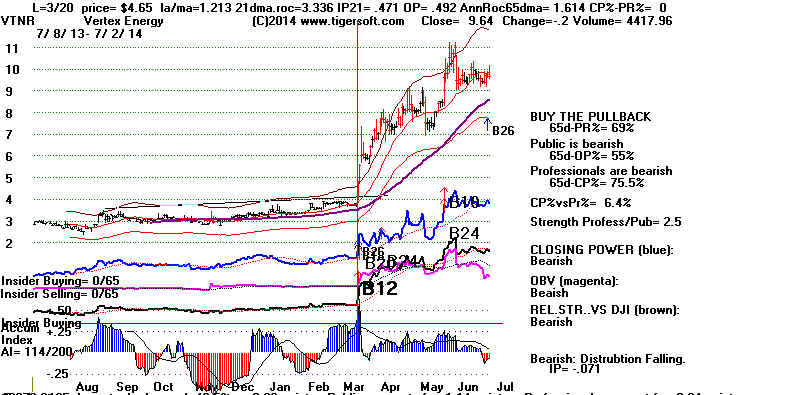 -------------------------------------------------------------------------
TGTX 11.03 182% TG Therapeutics Closing Power bullishly making new highs.
-------------------------------------------------------------------------
TGTX  11.03 182% TG Therapeutics Closing Power bullishly making new highs.
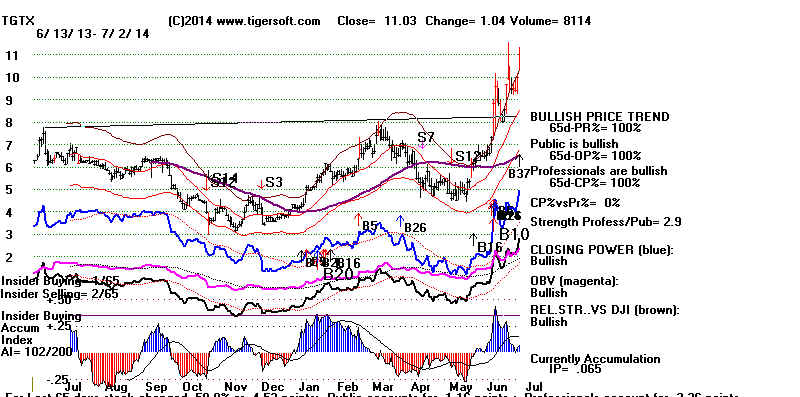 --------------------------------------------------------------------------
SQBG 13.74 154% Sequential Brands
Early IP21 bulge of .691 before B24m B26, B20
--------------------------------------------------------------------------
SQBG 13.74 154% Sequential Brands
Early IP21 bulge of .691 before B24m B26, B20
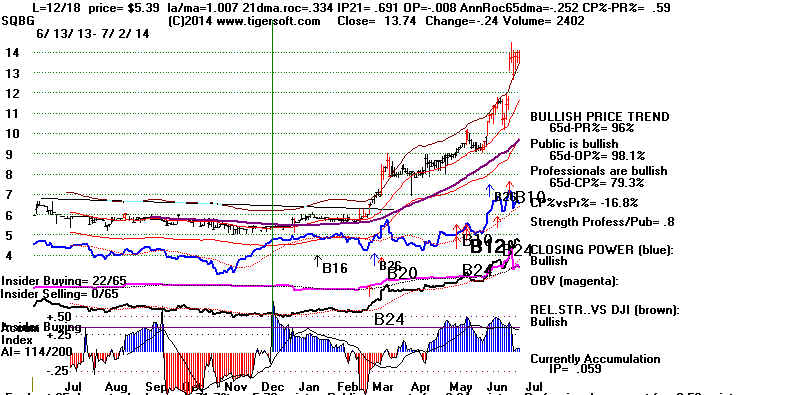 --------------------------------------------------------------------------
Others:
--------------------------------------------------------------------------
Others:
GWPH 104.92 152% GW Pharm Classic Buy B12 with IP21 of ,424
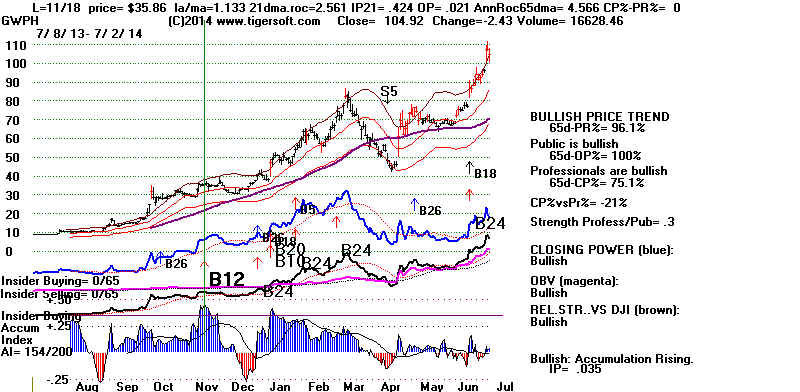 ----------------------------------------------------------------------------
EMES 106,67 140% Emerge Energy Serv
----------------------------------------------------------------------------
KONE 6.37 125% Kingtone Wireless
----------------------------------------------------------------------------
EMES 106,67 140% Emerge Energy Serv
----------------------------------------------------------------------------
KONE 6.37 125% Kingtone Wireless
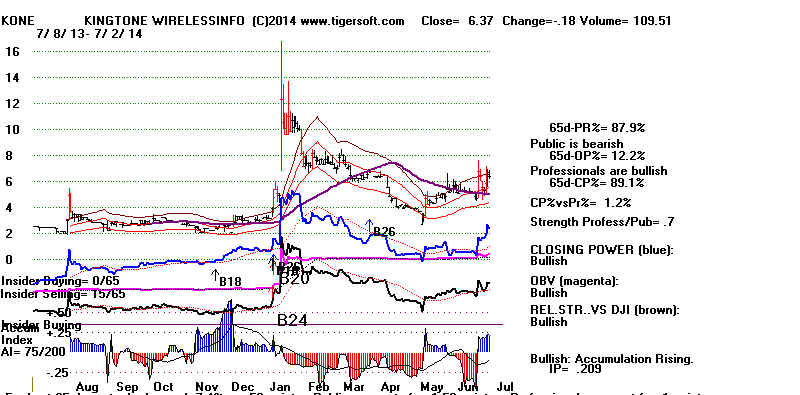 hznp
AMRI 21.58 114% Albany Molecular
PES 17.72 121% Pioneer Energy Current MAXCP stock
SKBI 7.55 115% Skystar Bio Pharm
HZNP 16.27 113% Horizon Pharm hznp
AMRI 21.58 114% Albany Molecular
PES 17.72 121% Pioneer Energy Current MAXCP stock
SKBI 7.55 115% Skystar Bio Pharm
HZNP 16.27 113% Horizon Pharm
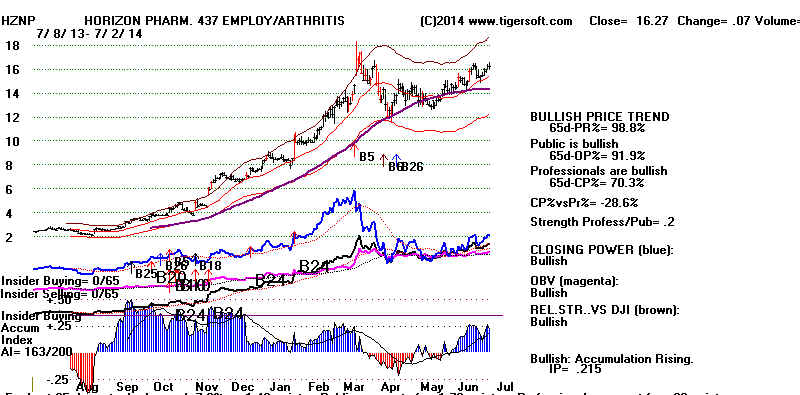 MOBI 7.96 113% Sky-mobi Limited
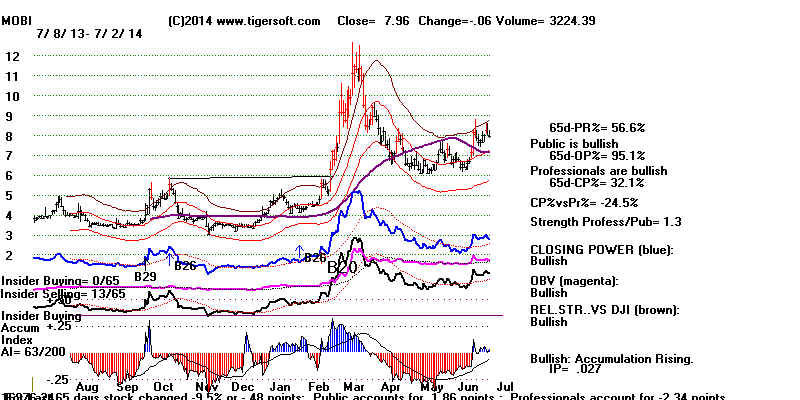 SPCB 9.86 113% SuperCom Security Software (Israel)
BDSI 11.82 100% Biodelivery Sci.
SPCB 9.86 113% SuperCom Security Software (Israel)
BDSI 11.82 100% Biodelivery Sci.
|
=================================================================================
OLDER HOTLINES
=================================================================================
7/1/2014 Still No Peerless Sell. Only the DJI has not
made
a new high among the
major indexes. While today's rally reflects
the usual advance we
have come to expect early in the week before
one of the major
holidays, it sure likes we will see much higher
prices, based on:
1) the absence of a Peerless Sell,
2) the very high Accumulation Index readings for the NASDAQ,
SP-500 and OEX
mentioned here a week ago,
3) the powerful NYSE A/D Line,
4) the uptrending Closing Powers,
5) the projected target of 2300 for the SP-500 and
6) the way the old 5400 high resistance of the NASDAQ from
the year 2000 seems to beckon. The NASDAQ is 13.2% above
today's close.
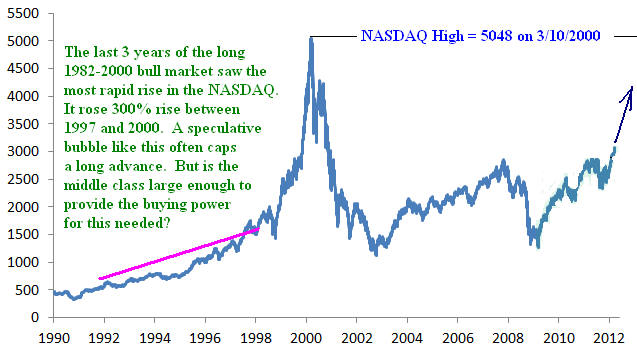
When the S&P-500
broke above its long-term flat resistance at 1600,
it set up a minimum
target of 2300, or about 327 or 15% points higher
than it is today.
Technicians commonly obtain a minimum projected
upside target by adding
the height of the trading ranges to the point
of breakout from a
trading range.
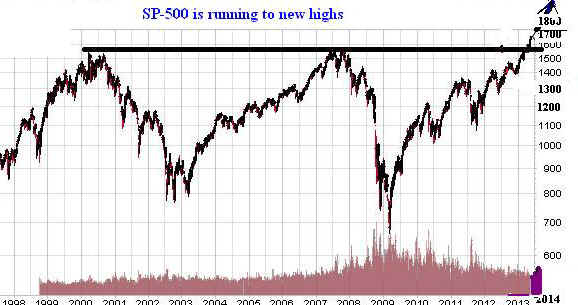
> To Key Index and Leading Stock
Charts: DJI, SP-500, etc.
Peerless DJI Chart
SPY Chart
NASDAQ Chart QQQ Chart
IBB Chart
IWM Chart
Hourly DJI-OBV
Hourly-MVM0735
FAS-3x Financials IBB-Biotechs
--> 267 +30
MAXCP
stocks Bullish MAXCP Stocks (7/2/2014) Bullish
plurality
Dividend Stocks
Bullish
Leveraged ETFS
--> 17 -6
MINCP stocks Bearish MINCP Stocks
(7/2/2014)
--> 118 New Highs on NASDAQ 12 new lows.
Bullish plurality
--> 179
+25 New Highs on NYSE 6
new lows. Bullish plurality
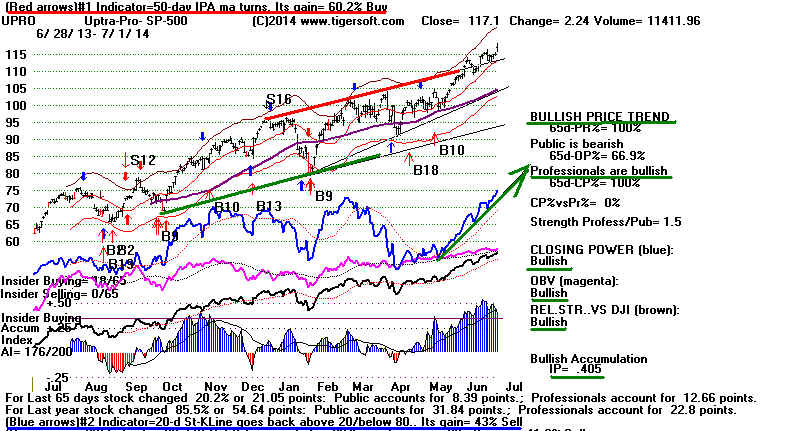
==================================================================================
OLDER HOTLINES
==================================================================================
6/30/2014 Still No Peerless Sell. The NYSE A/D Line made another
new high today. So did the NASDAQ and
QQQ. Peerless cannot easily
give another Sell with the current technicals.
Since 1965, the DJI has
risen 61.7% of the time over the next two
weeks.
> To Key Index and Leading Stock
Charts: DJI, SP-500, etc.
Peerless DJI Chart
SPY Chart
NASDAQ Chart QQQ Chart
IBB Chart
IWM Chart
Hourly DJI-OBV
Hourly-MVM0735
FAS-3x Financials IBB-Biotechs
--> 237 MAXCP stocks Bullish MAXCP Stocks (6/30/2014) Bullish
plurality
--> 23 MINCP stocks Bearish MINCP Stocks
(6/30/2014)
--> 57 New Highs on NASDAQ 21 new lows.
Bullish plurality
--> 154
New Highs on NYSE 4
new lows. Bullish plurality
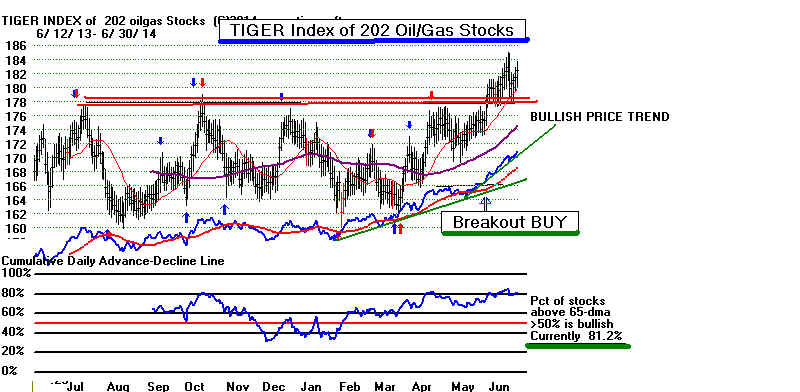
Our most bullish stocks' groups, remain dominated Dividend Plays,
REITs and Oil/Gas
stocks. Though the QQQ and NASDAQ made new
new highs today as the
DJI held back, my sense is that conservatively
playing the strongest
higher priced stocks is preferable to placing
bets on lower priced
stocks. Just looking at the downtrendling
A/D Line for a large
sample (573) of low priced stocks should make
you see how hard it is
now to find a winner in this group. It is the
Public which tends to
boost these stocks. This is a market dominated
by Professionals.
The middle class has just shrunk too much to
give great hope of a
general low priced stock boom such as we saw
in 1968, 1999 and 2000.
Oil-boom areas in the US are an exception. So,
that is one of the
reasons we can expect still more speculation in
oil/gas drilling and
exploration companies.
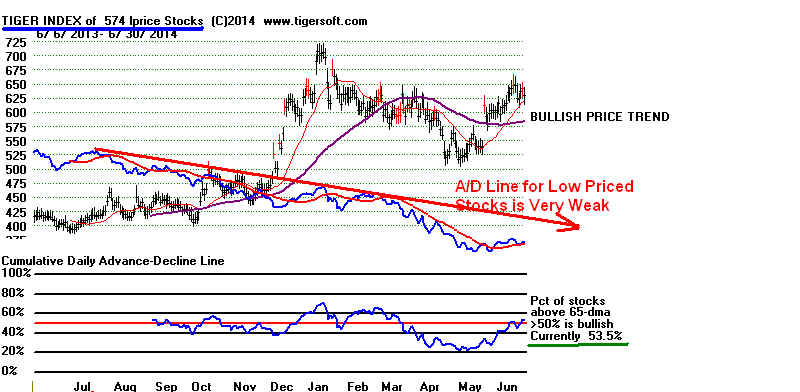
Today here were 7-8
times more Stocks over $50 making new highs
than there were stocks
under $10 making new highs. The TigerSoft
Index chart of stocks
over $100 below is much more bullish looking,
too, than the chart of
stocks under $7.5 above.
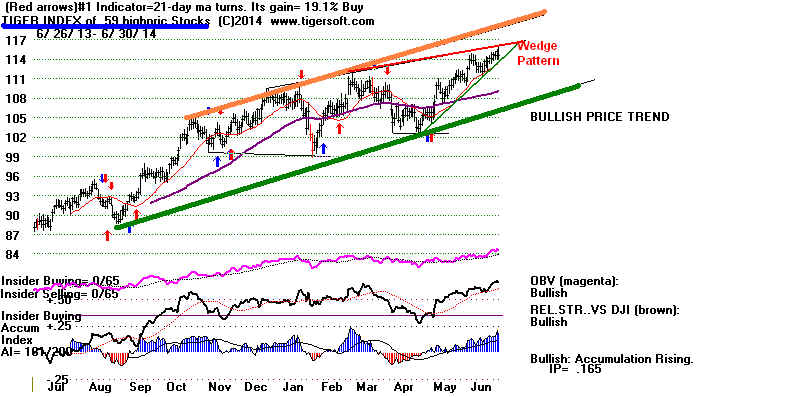
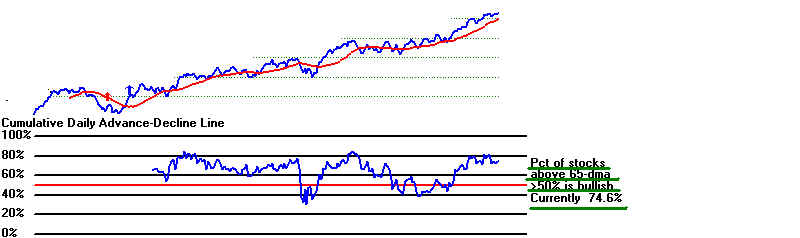
Note the steeply rising
A/D Line of these high priced stocks. Still, there
is a potential rising
wedge pattern in their Index. So, if we focus on
higher priced stocks,
we should be prepared to recognize the way
these stocks
technically signal they may be about to fall 20% or more.
Looking back at before
20%+ declines in the current (2013-2014)
Tiger download of
higher priced stocks, I found a number of warning
signs that seem
important to be wary of now. I hope you will want to study these
fairly closely,
especially if you trade higher priced stocks. Some of them
are fairly subtle.
Warnings of Tops in Higher Priced Stocks
1
False
breakouts -
- ADS Red High Volume, last new high confirmed and
20% decline.
- Coupled with CP and OBV NC - AMZN14 30%
decline
- Coupled with CP NC and Red High Volume Break of 65-dma PNRA14
2
Rising
Head/Shoulders completed and then 65-dma turns down. CEO14
Classic Head/Shoulders with negative IP21 and weak CP on right shoulder NFLX14
3
IP21 NNC
(negative non-confirmation Tiger S9) with prices at upper band (S9)
-- then quick break of 65-dma CLB14 - 26%
decline
-- then CP trend-break. MA14, MSTR14
4
Rally
Failure to make a new high and Red High Volume Decline
GOOG14
5
Swift 20% advance with Multiple Candle Stick Sell S1s at upper band
followed by Reversal/Minor New Low or Closing Power uptrendbreak.
ICE14, PCLN14,
WYNN14, WBK14
6
Red
High Volume Churning at upper band
--- with CP NC and turndown. PTR14
--- Red high volume Reversal Day with CP
NC and trendbreak
RL14 , V14
7
Failure
of Prices to Rally Up Past A Falling 65-dma with
Red High Vol. Breakdown. Also series of S1s. TNH14
==============================================================================
OLDER HISTORY
==============================================================================
6/27/2014 Still No Peerless Sell. Bears are noticing the dwindling
momentum in the DJI.
They remind us how a ball tossed high up in the
air at some point seems to
stop in mid-air for a split second before
plummeting back to earth.
> To Key Index and Leading Stock
Charts: DJI, SP-500, etc.
Peerless DJI Chart
SPY Chart
NASDAQ Chart QQQ Chart
IBB Chart
IWM Chart
Hourly DJI-OBV
Hourly-MVM0735
FAS-3x Financials IBB-Biotechs
--> Bullish MAXCP Stocks (6/27/2014) Bullish
plurality
--> Bearish MINCP
Stocks (6/27/2014)
--> New Highs on NASDAQ Bullish plurality
-->
New Highs on NYSE Bullish plurality
Peerless does have a Sell S8
to spot such cases. If the DJI closes less than
.035% from its previous day
for two days in a row within 0.1% from its
previous close, it can
bring a Sell S8 if other conditions are true: Namely,
1) It is between May and October.
2) The DJI is not above the 3.5% upper band,
3) The DJI is now below the 1.7% lower band,
4) The DJI must not be up more than 12% over the last 65 trading days.
5) The DJI must not be up less than 3.5% over the last 65 trading days.
Sell S8s in the 2nd Years of
the 4-Year Presidential cycle, such as now,
are not common; there have
been only 3 since 1928. Having a higher IP21
tends to bring much smaller
DJI declines if there is a Sell S8. The current +.176
for the IP21 is within the
acceptable range. But right now we cannot get
a Sell S4 because the DJI is
not up far enough from the 21-day ma.
Bull Spread Ideas
Though the DJI is stuck in a narrowing rising wedge pattern,
other key
indexes are not waiting for
the DJI to breakout and move higher. Thus,
just as the NYSE A/D Line soared to a new high on Friday, so
did the
NASDAQ and the QQQ.
There are bullish precedents for this even after
Peerless gives a Sell Signal.
In 2000, the QQQ rose for 10 weeks even
after the DJI peak on January
13th and Peerless Sell S9s and S12s.
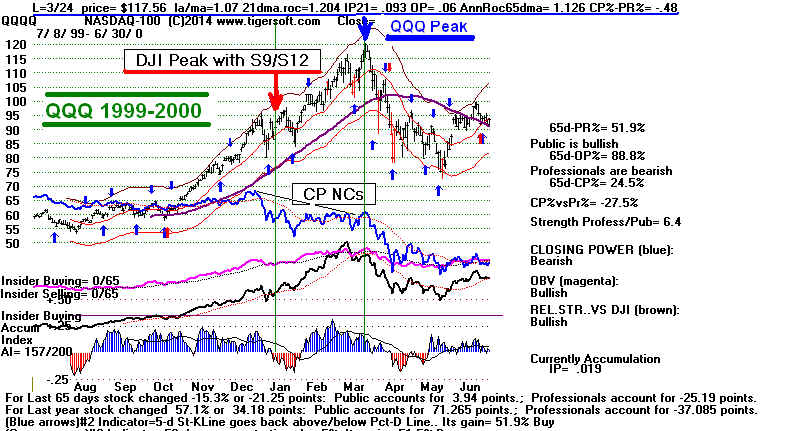
Below is a list of the ETFs
and key stocks making new highs with
very high IP21.
A high IP21 (current Accumulation Index) occurring
breakouts usually means that
there will be more new highs. Writing covered
calls or doing bull spreads
on them seen a reasonable approach.
ETFS and Leading Stocks Making
New Highs with IP21>.375 ("Insider Buying threshold")
IP21
---------------------------------------------------------------------------------------------------------------------------------------
VUG .542
Vanguard Growth
Biggest holdings: AAPL, KO, GOOG, ORCL, QCOM, SLB, DIS, FB and Philip Morris
CNK .507 Cinemark
Holdings
ITT
.500 ITT
AMP
.476 Financial
RSG .460
Republic Services
JKE .460 Large Growth Stocks (too thin to
trade).
WCN .451 Waste
Connections.
DVA
.441 Davita
QQQ
.414 QQQ
QLD .413 Leveraged QQQ
CBG .401 CB
Ellis
UPW .392 Leveraged
Utilities
MSFT .384
HHC .379
KO .378
TQQQ .377 Leveraged QQQ
---------------------------------------------------------------------------------
FDS .371 FactSet
Research
SIRO .371 Siro Dental
AIV .359
REIT
TWC .359 Time Warner
SATS .344 Echostar
EQR .334 REIT
QEP .334
SLB .32
Schlumberger
CNW .313 Con-Way
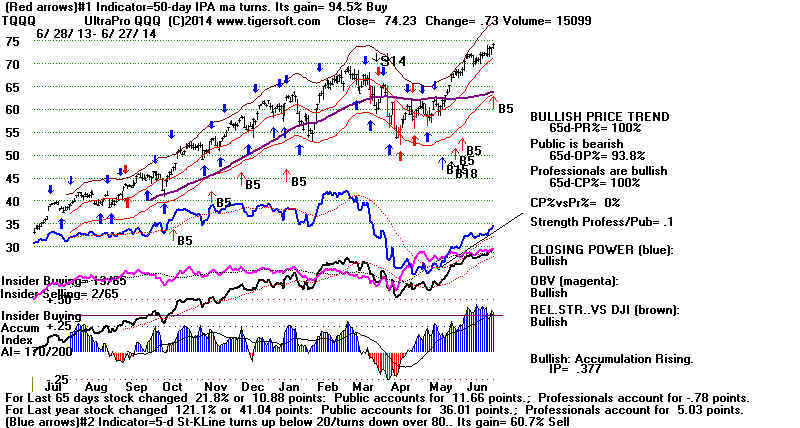
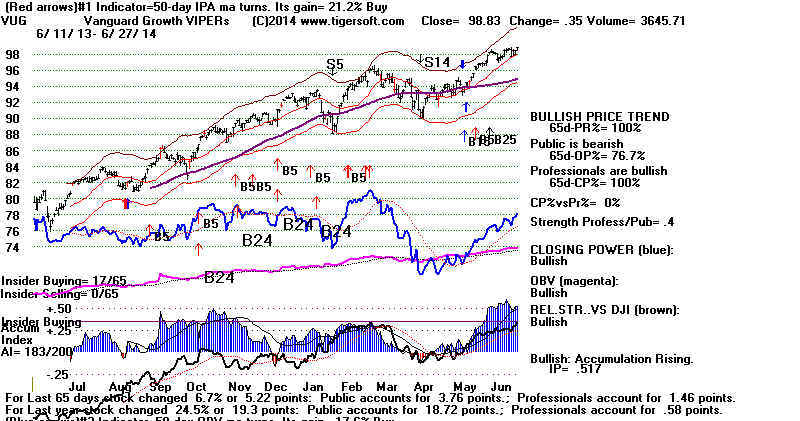
================================================================
Older Hotlines
================================================================
6/26/2014 Still No Peerless Sell. The DJI remains
stuck in a narrowing
rising wedge pattern.
While this is normally bearish, the dangers in this
pattern diminish if it only
breaks down near the apex of its pattern. And
so far, there has been no
breakdown. If there is a breakdown in the
pattern, the rising 65-dma
would be the next likely support; below that
support should come in at the
rising 200-day ma at 16350 which is near
the lower 3.5% band.
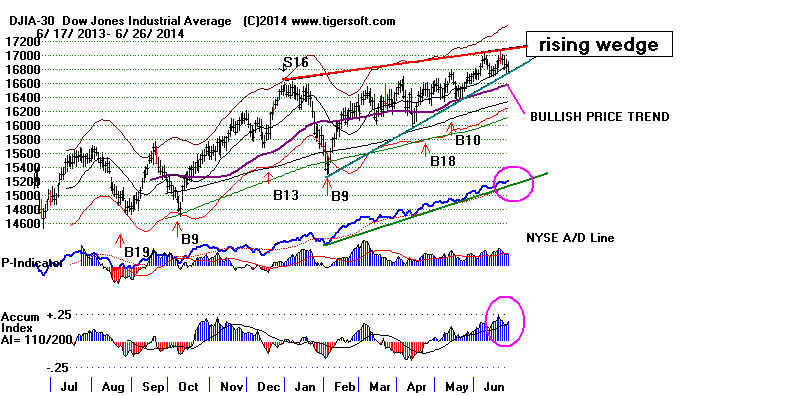
> To Key Index and Leading Stock
Charts: DJI, SP-500, etc.
Peerless DJI Chart
SPY Chart
NASDAQ Chart QQQ Chart
IBB Chart
IWM Chart
Hourly DJI-OBV
Hourly-MVM0735
FAS-3x Financials IBB-Biotechs
--> 113 MAXCP stocks Bullish MAXCP Stocks (6/26/2014) Bullish
plurality
--> 28 MINCP stocks Bearish MINCP Stocks
(6/26/2014)
--> 28 New Highs on NASDAQ 13 new lows.
Bullish plurality
--> 94
New Highs on NYSE 9
new lows. Bullish plurality
Mostly Bullish Technicals
We've seen here that
seasonality becomes quite bullish at the start of
July and that very high IP21
and OPct readings like we have had this
week in the NASDAQ,S&P
and OEX usually are preludes to significant
additional advances.
Most important, the NYSE A/D Line keeps making
new highs and remains in an
uptrend.. That's reliably bullish, too. And,
don't forget: there's no DJI
head/shoulder pattern. So, the technicals
look safe enough.
Moreover, some bull markets have lasted a little
longer than the present one.
now 5 years and 3 months' old, using
March 2009 as the bottom and
requiring a 20+ interim decline to end it.
Longer bull markets did occur
in 1949-1957 and 1982-1987.
The Fears of The FED
Then, there's the FED.
It shows a strong aversion to chancing even
a DJI decline of more than
7%, presumably because it fears the bearish
dynamics that might then take
over and bring a really disastrous drop
in the markets as in 2008-9.
Remember how the Fed would not allow more
than a DJI 10% decline from
April 2003 to December 2007, 56 months.
They are even more afraid
now, I would suggest, thinking that any bigger
decline might get out of
their control. They study economics. They can
see the overwhelming evidence
that excessive concentration of Wealth
and stagnant wages virtually
guarantees under-consumption and
over-production at some
point. If anything, under-employment and
foreign competition with US
manufacturing is much worse than before
the 2008 Crash.
What could be worse?
Now, the FED must fear how all the leveraged
derivatives might quickly
exaggerate any decline. This is something
no one talks about. But
it is very scary to me. I remember the main
cause of the 1987 Crash as
being the widespread computerized trading
of index options.
My conclusion, the FED will
not chance a big decline. They will keep
rates very low and they will
make no secret about it.
Historically, low volatility
like we now are seeing has always lead to a
first temporary 10%-11%
decline followed by a full recovery. Anything
more than 11% would be out of
the ordinary and dangerous, with or
without a Peerless Sell.
Low Volatility Is Natural in A Rising Wedge
How dangerous is low
volatility? Sometimes, the DJI goes virtually
unchanged for a day or two.
This can be quite bearish. It can bring a
Sell S8. But these
usually occur along with other Sells. More about
this on Sunday night.
In addition, we see low
volatility in the optimized bands on the DJI
that Tiger can produce.
The resulting optimzed upper and lower bands
bracket 93% of the DJI's
daily closings for the last year. My quick
study of past years optimized
bands shows the ones in blue where
the bands were under .035, as
they have been in 2012, 2013 and so
far in 2014.
There are several such cases.
Looking at the Peerless
charts for the last 12 months where their bands
were under .035 for three
years, like now, we find: 2007, 1994 and 1965.
The initial decline was
always followed by a full recovery and more
new highs. It was
always between 10% and 11% from the DJI's peak.
In 2007, there were two 10%
DJI corrections and recoveries, before a collapse
the next year.
In 1994, the DJI fell 11%
before fully recovering when the FED loudly
raised the Fed Funds rate by
.25.
In 1965, the DJI finally fell
11% because of events in Viet Nam before
fully recovering and topping
out the next year.
NEW STUDY
Optimized Upper and Lower Bands on DJIA:
1915-2014
I have marked in blue the case where
the optimized upper or lower band
were found to be less than .035 (3.5%). 1 2014 .031 -.028 upper band above lower band
2 2013 .032 -.034
3 2012 .030 -.043
4 2011 .045 -.075
5 2010 .038 -.065
6 2009 .075 -.105
7 2008 .055 -.135
8 2007 .039 -.047
9 2006 .027 -.033
10 2005 .029 -.030
11 2004 .036 -.036
12 2003 .046 -.055
13 2002 .070 -.085
14 2001 .070 -.100
15 2000 .075 -.070 upper band above lower band
16 1999 .060 -.047 upper band above lower band
17 1998 .070 -.070
18 1997 .060 -.060
19 1996 .048 -.038
20 1995 .040 -.020 upper band above lower band
21 1994 .029 -.038
22 1993 .028 -.023 upper band above lower band
23 1992 .027 -.032
24 1991 .070 -.038 upper band above lower band
25 1990 .043 -.075
26 1989 .043 -.035 upper band above lower band
27 1988 .050 -.042 upper band above lower band
28 1987 .055 -.185
29 1986 .055 -.055
30 1985 .041 -.024 upper band above lower band
31 1984 .060 -.048 upper Band above Lower Band
32 1983 .047 -.030 upper Band above Lower Band
33 1982 .090 -.040 upper Band above Lower Band
34 1981 .038 -.050
35 1980 .046 -.070
36 1979 .037 -.055
37 1978 .060 -.055 upper Band above Lower Band
38 1977 .027 -.034 upper Band above Lower Band
39 1976 .035 -.035
40 1975 .070 -.042 upper Band above Lower Band
41 1974 .060 -.090
42 1973 .055 -.075
43 1972 .042 -.027 upper Band above Lower Band
44 1971 .048 -.044 upper Band above Lower Band
45 1970 .055 -.075
46 1969 .037 -.055
47 1968 .046 -.036 Upper Band above Lower Band
48 1967 .038 -.038
49 1966 .035 -.055
50 1965 .028 -.038
51 1964 .027 -.023 Upper Band above Lower Band
52 1963 .030 -.027 Upper Band above Lower Band
53 1962 .060 -.075
54 1961 .036 -.025 Upper Band above Lower Band
55 1960 .038 -.047
56 1959 .034 -.042
57 1958 .035 -.024 Upper Band above Lower Band
58 1957 .028 -.047
59 1956 .039 -.046
60 1955 .041 -.048
61 1954 .041 -.024 Upper Band above Lower Band
62 1953 .070 -.035
63 1952 .028 -.027 Upper Band above Lower Band
64 1951 .034 -.042
65 1950 .035 -.070
66 1949 .030 -.038
67 1948 .042 -.043
68 1947 .040 -.038 Upper Band above Lower Band
69 1946 .043 -.085
70 1945 .047 -.026 Upper Band above Lower Band
71 1944 .029 -.022 Upper Band above Lower Band
72 1943 .034 -.042
73 1942 .041 -.045
74 1941 .040 -.055
75 1940 .047 -.130
76 1939 .075 -.080
77 1938 .105 -.100 Upper Band above Lower Band
78 1937 .050 -.115
79 1936 .041 -.055
80 1935 .055 -.042 Upper Band above Lower Band
81 1934 .055 -.080
82 1933 .160 -.115
83 1932 .240 -.155
84 1931 .115 -.165
85 1930 .080 -.220
86 1929 .088 -.220
87 1928 .070 -.055
88 1927 .040 -.049
89 1926 .036 -.055
90 1925 .039 -.040
91 1924 .046 -.035
92 1923 .035 -.050
93 1922 .031 -.040
94 1921 .047 -.065
95 1920 .065 -.075
96 1919 .06 -.065
97 1918 .044 -.033
98 1917 .047 -.07
99 1916 .047 -.07
100 1915 .08 -.065 Upper Band above Lower Band
|
=================================================================
6/25/2014 Still No Peerless Sell. The DJI reversed back
up from its
rising 21-day ma,
It is still, however, stuck in its rising wedge pattern and
the NASDAQ seems
stymied by the resistance of its old highs. The
Closing Powers of the
key ETFs did not break their rising 21-day ma, so
now new CP uptrendlines
can be drawn. The Hourly DJI below shows
the trading range that
lodges the DJI. Small insignificant moves will probably
be the dominant
characteristic of the market now until there is either
a breakout or
breakdown. Without a new Peerless and with the Closing
Power uptrends
restored, I would think the DJI will move above 17000
sooner than it will
fall back below 16700.
Seasonally since 1965,
the DJI has shown slight weakness over the next 5 trading
days. After that,
we get the start of the traditional Summer Rally that supposedly
prevails until the end
of the first week in September. Thus, the first two weeks
of July have brought a
rising DJI 63.8% of the time with an average gain is 0.6%.
At today's levels that
means 100 DJI points. So a breakout next month would
seem to be a good bet.
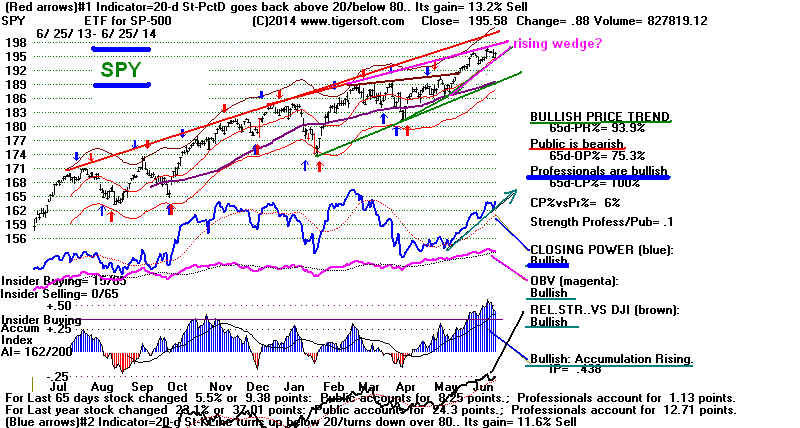
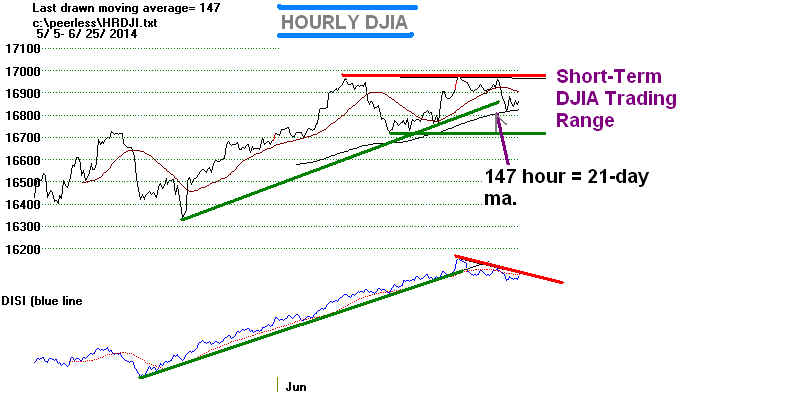
When Leads Falter...
As the bull market gets
older, we have to expect some of the leaders to
falter. When this
happens hot momentum money just shifts to the stocks
that still are in
staunch uptrends. This can keep the much watched indexes
rising for a good long
time. Only when enough stocks start to fall by the wayside,
does the A/D Line
register non-confirmations coompared to the DJI. Applying
this general principle
is made harder when interest rates are very low and
dividend paying stocks
and bond funds make up so many of NYSE stocks that
rise day by day.
That is the case now. So, instead, we want to watch when
important stocks start
to break year long-price and Closing Power uptrends.
These I try to spot on
the 100 or so charts I post nightly. In the last few days,
such breakdowns have
taken place in BA, LMT and QCOM. So, there is some
weakening taking place.
But it's probably not enough to change the general
market's uptrend.
> To Key Index and Leading Stock
Charts: DJI, SP-500, etc.
Peerless DJI Chart
SPY Chart
NASDAQ Chart QQQ Chart
IBB Chart
IWM Chart
Hourly DJI-OBV
Hourly-MVM0735
FAS-3x Financials IBB-Biotechs
--> 105 MAXCP stocks Bullish MAXCP Stocks
(6/25/2014) Bullish plurality
--> 51 MINCP stocks Bearish MINCP Stocks
(6/25/2014)
--> 27
New
Highs on NASDAQ 18
new lows. Bullish plurality
--> 86
New Highs on NYSE 11
new lows. Bullish plurality
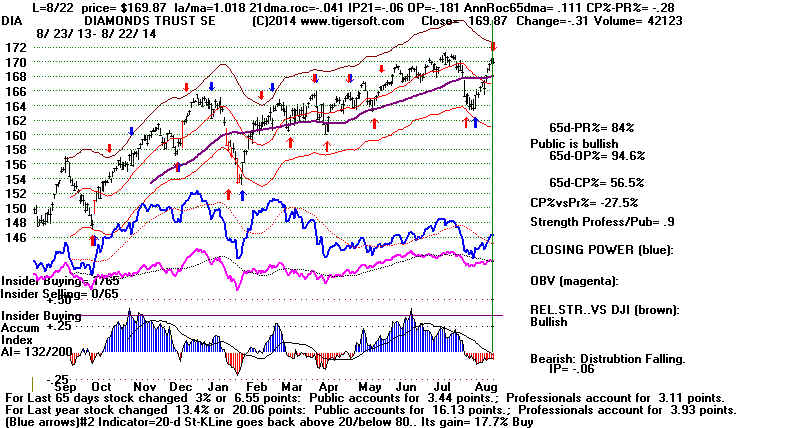
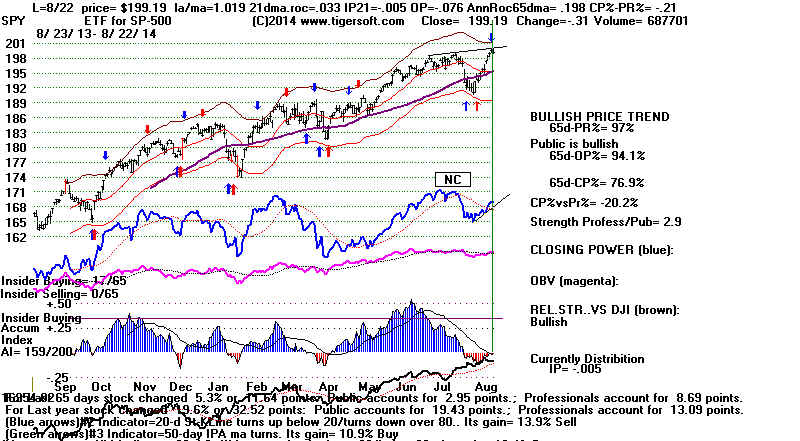
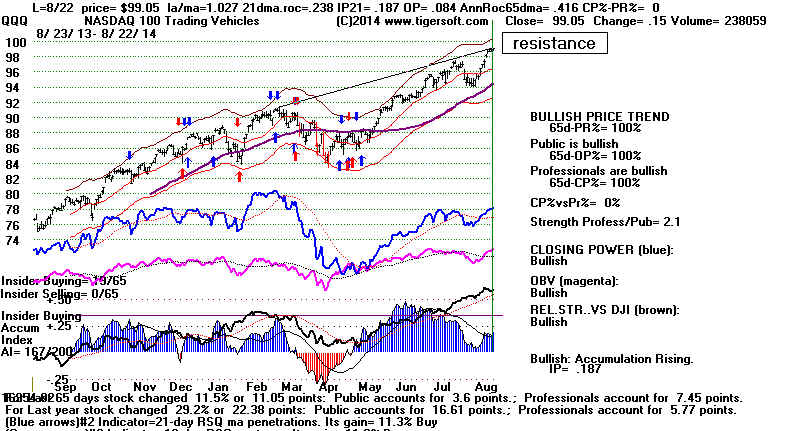
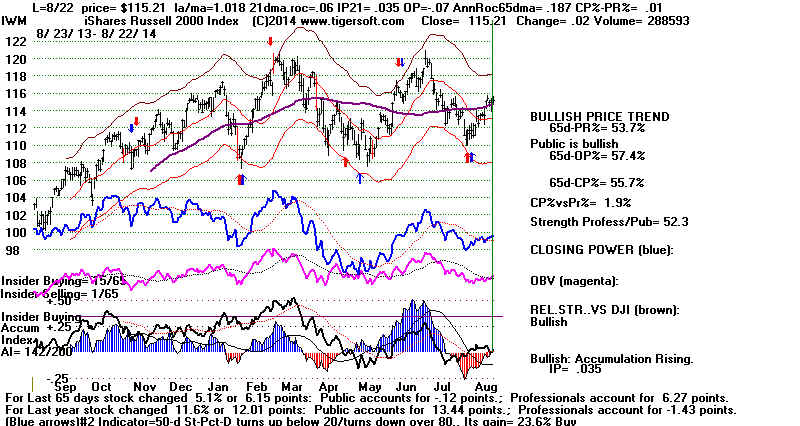
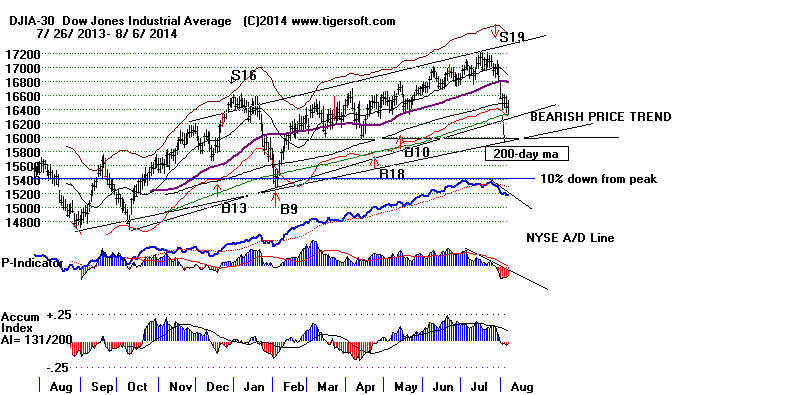
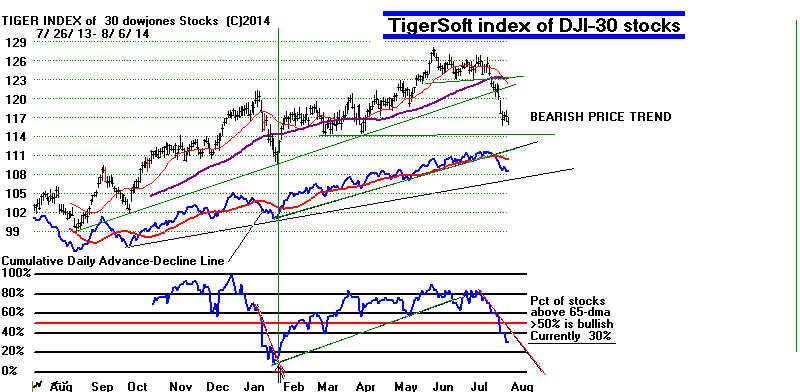
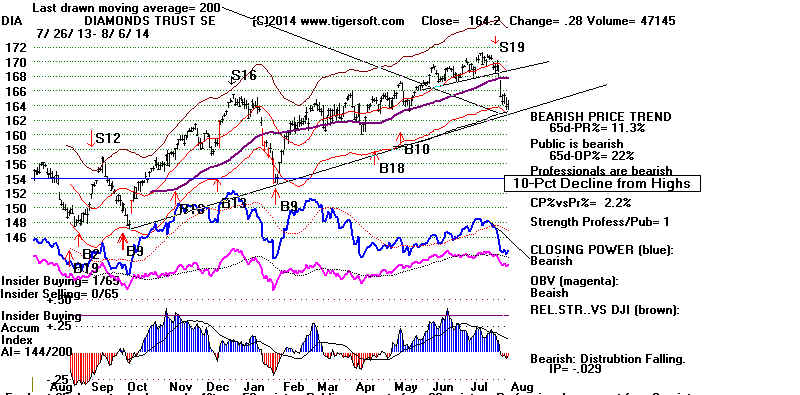
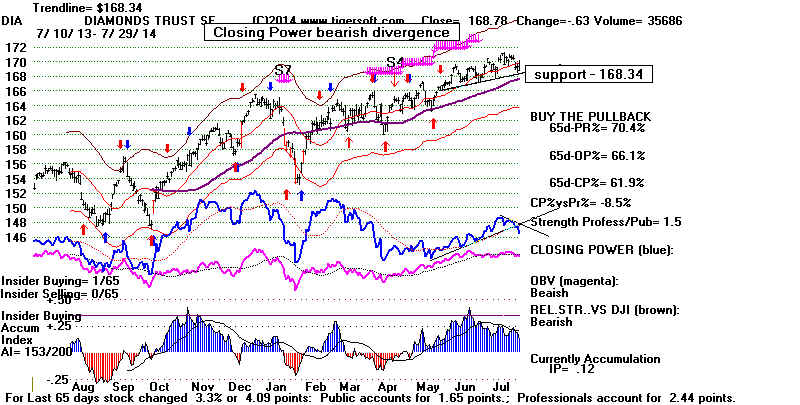
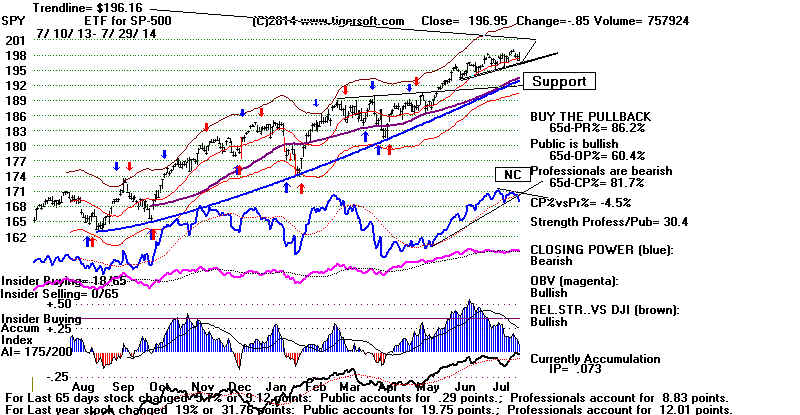
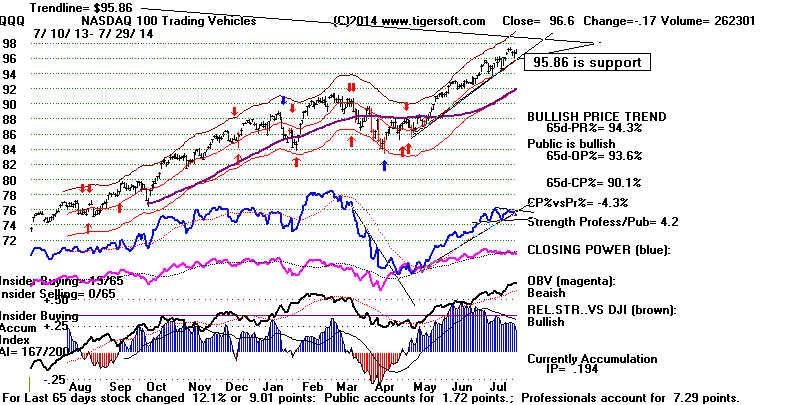
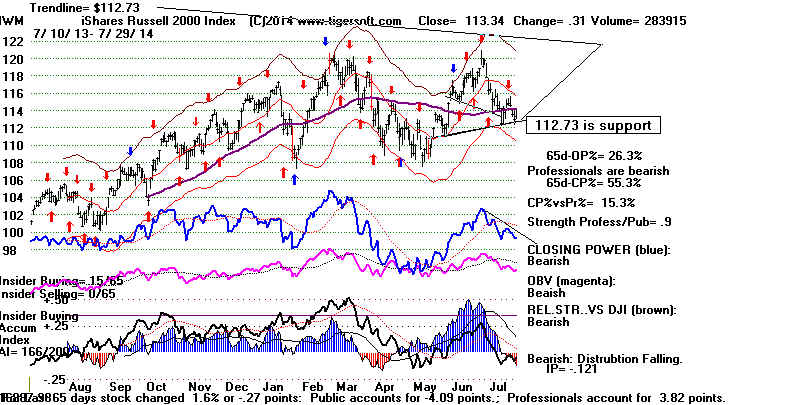
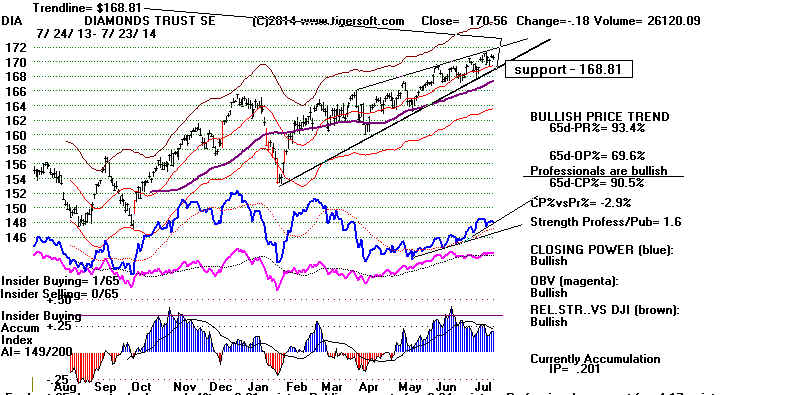
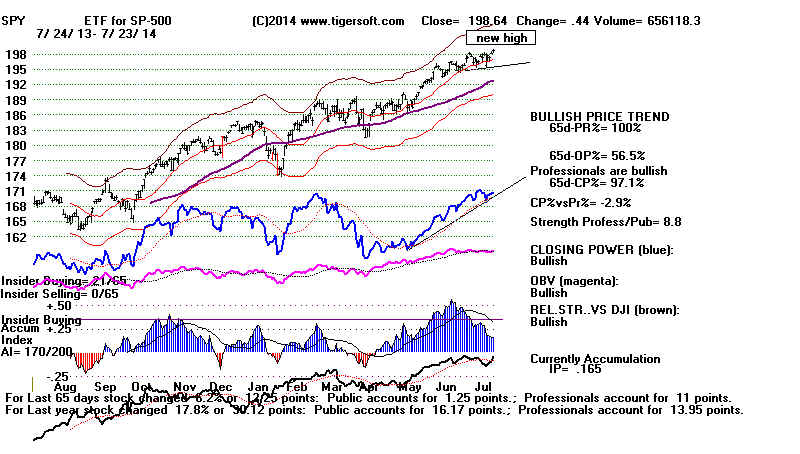
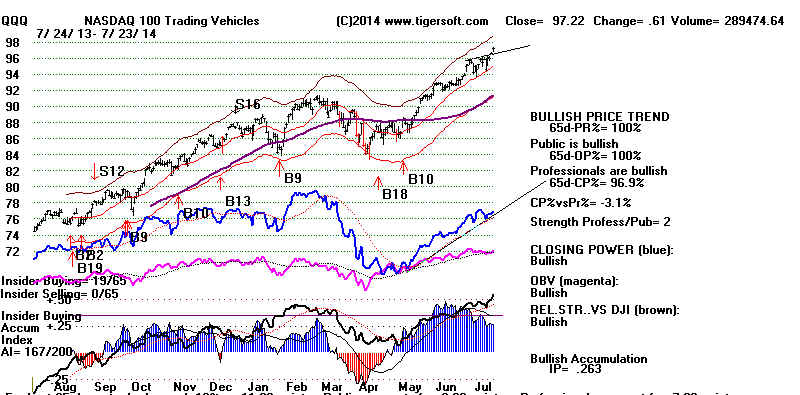
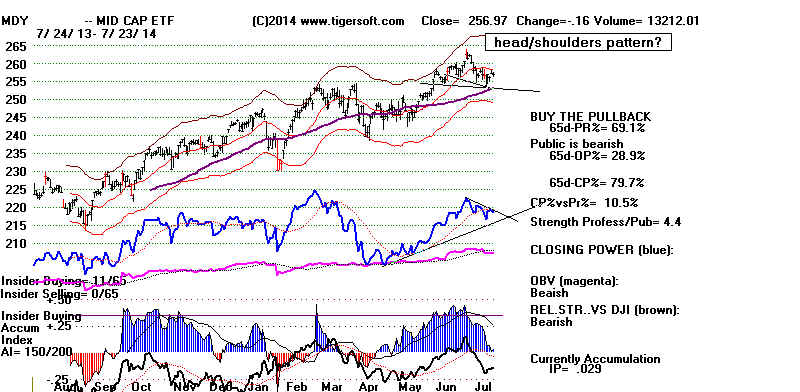
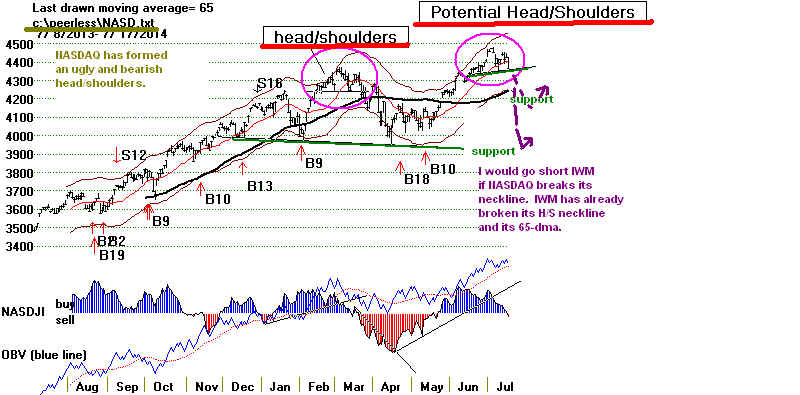
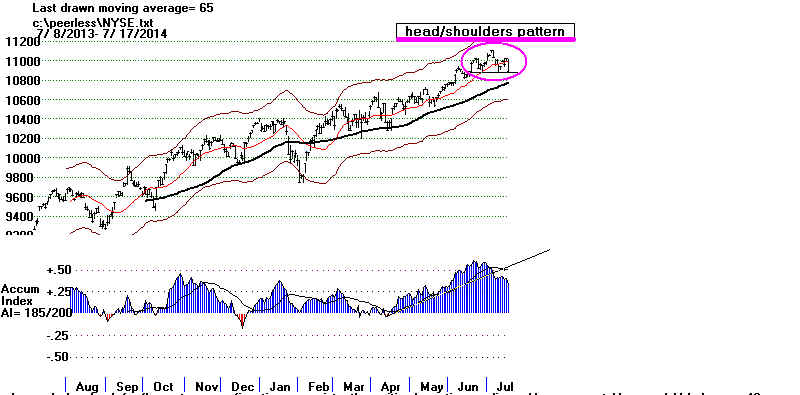
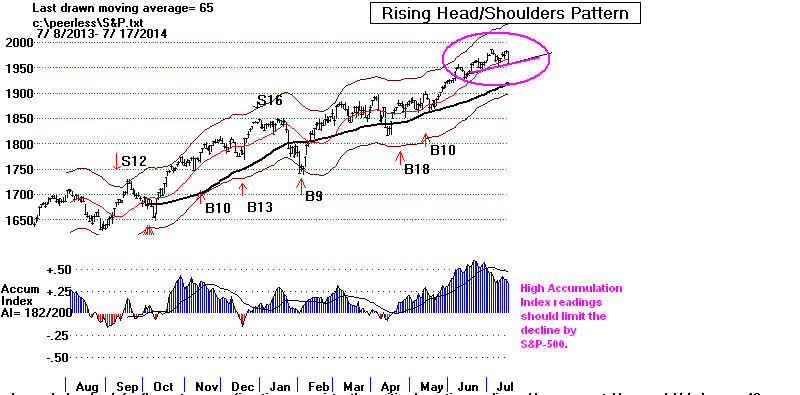
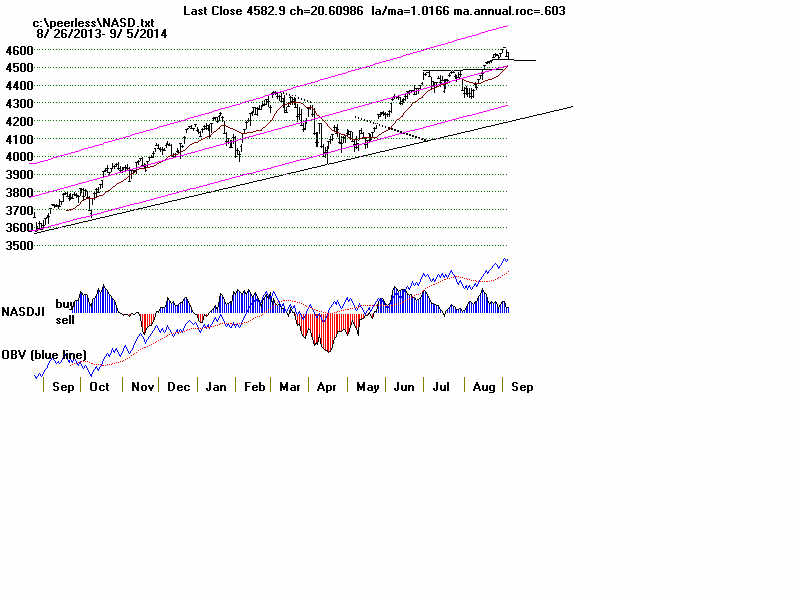
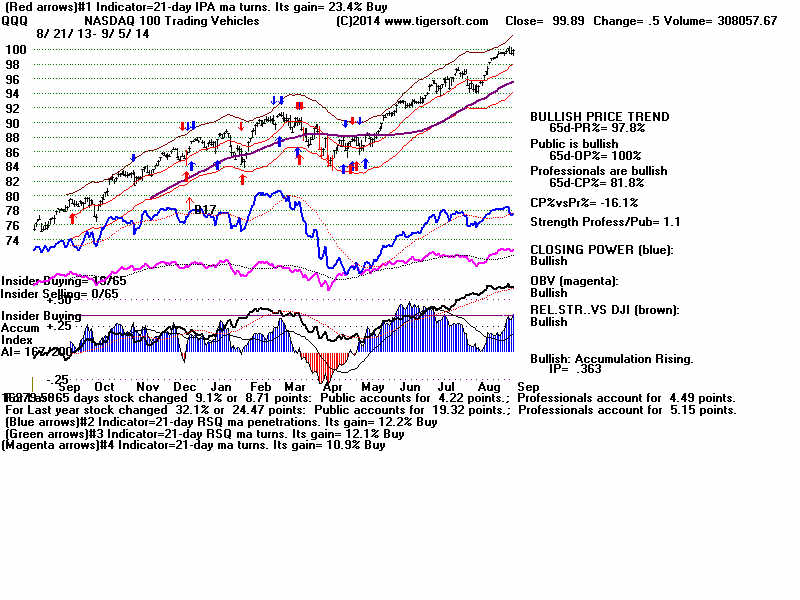
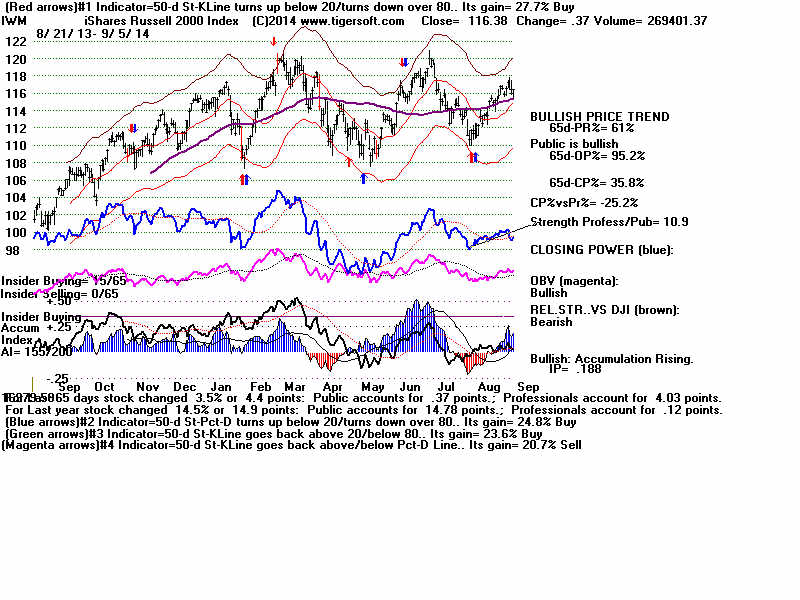
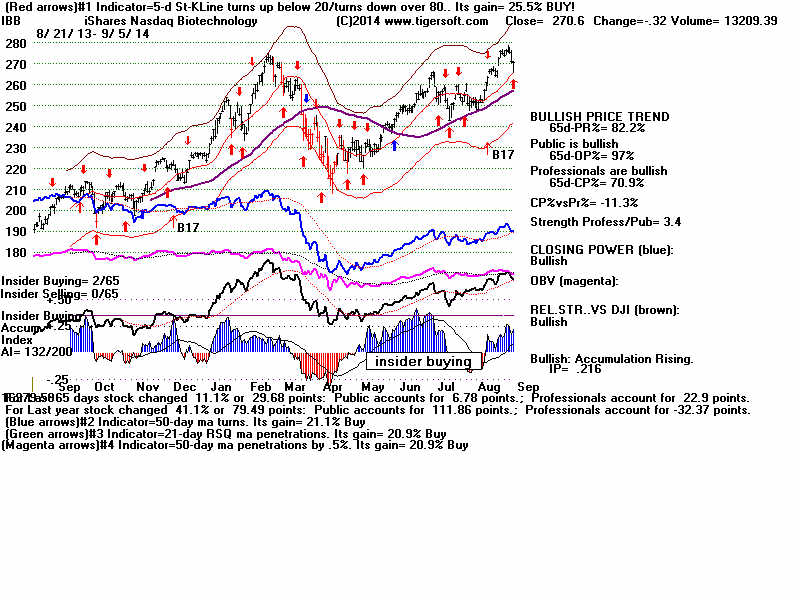
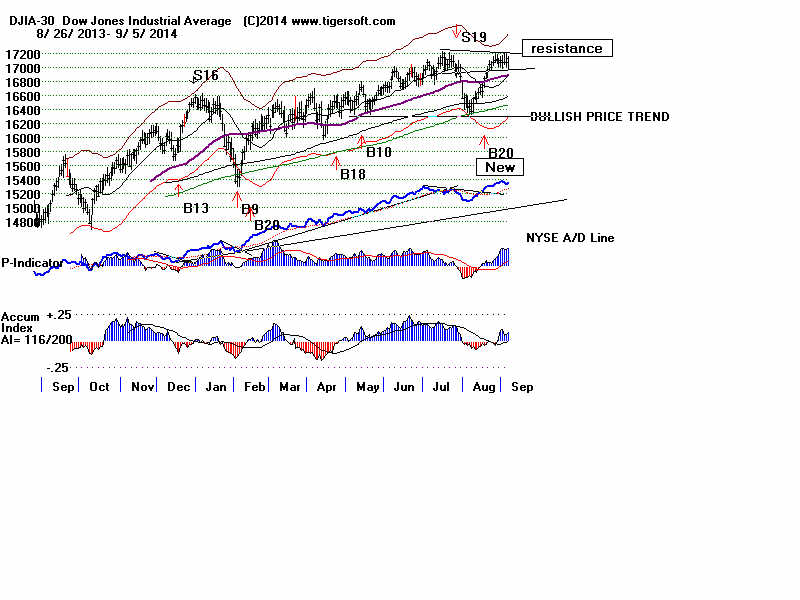
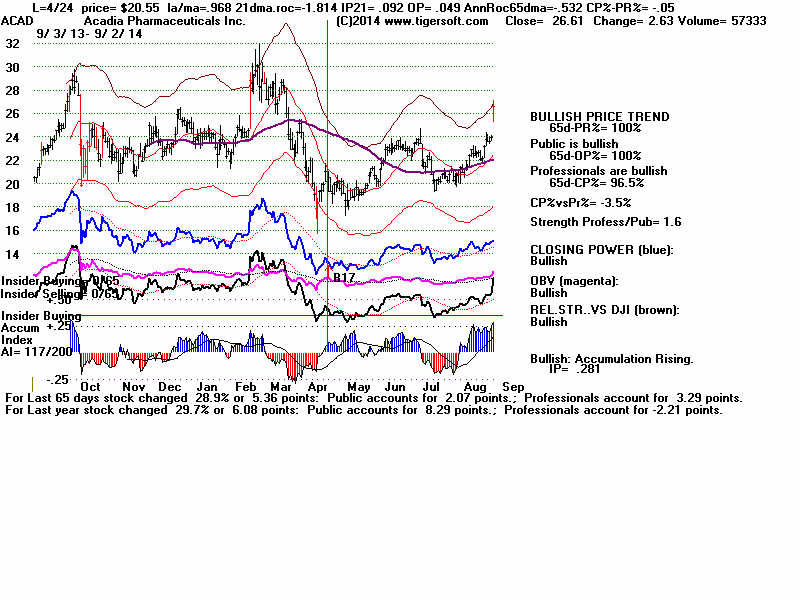
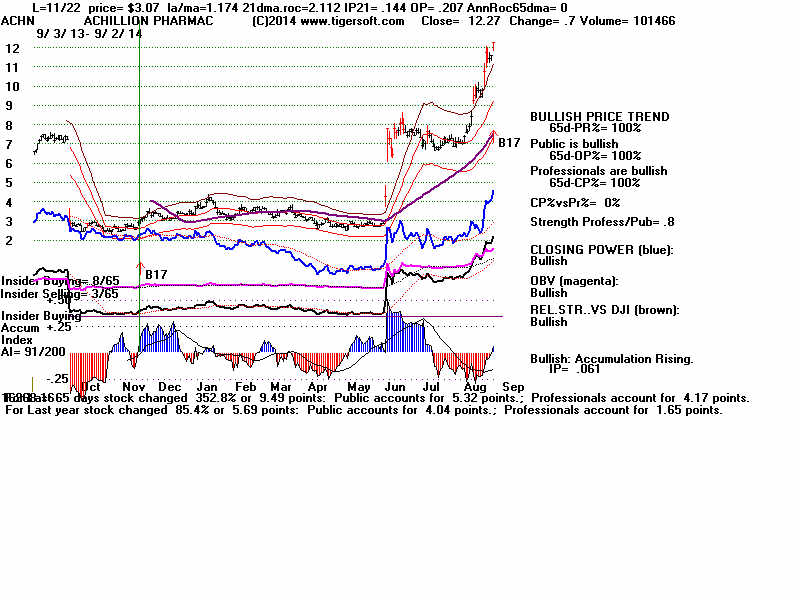
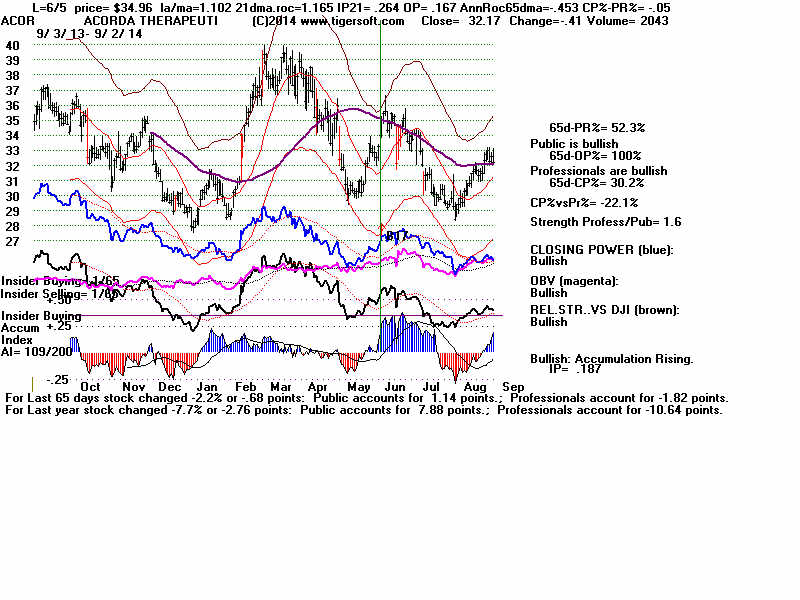
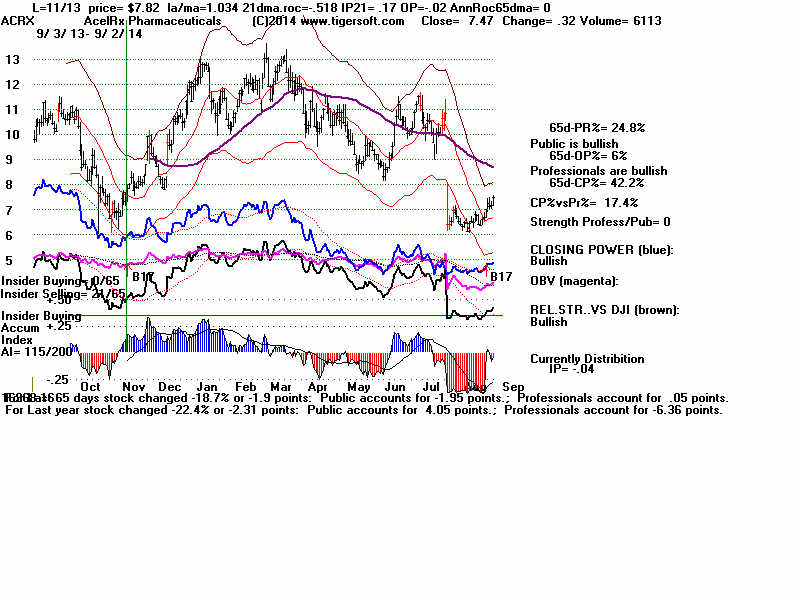
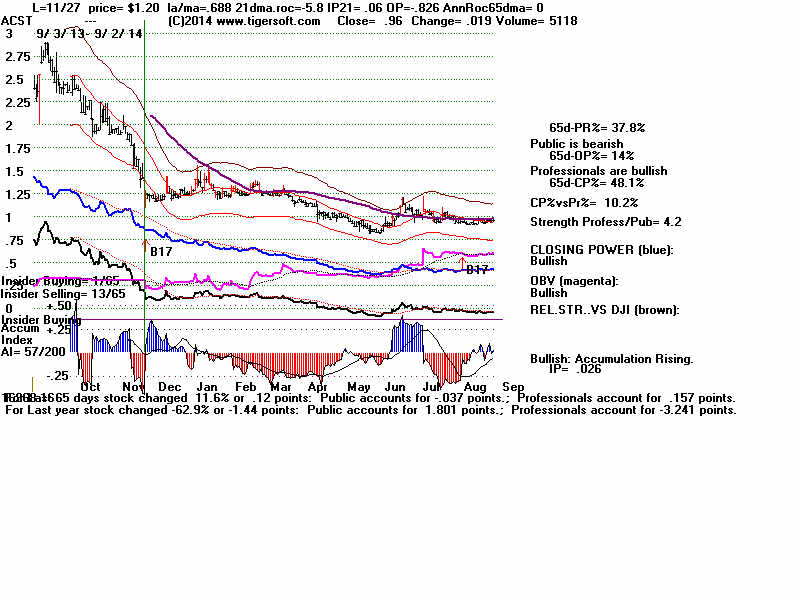
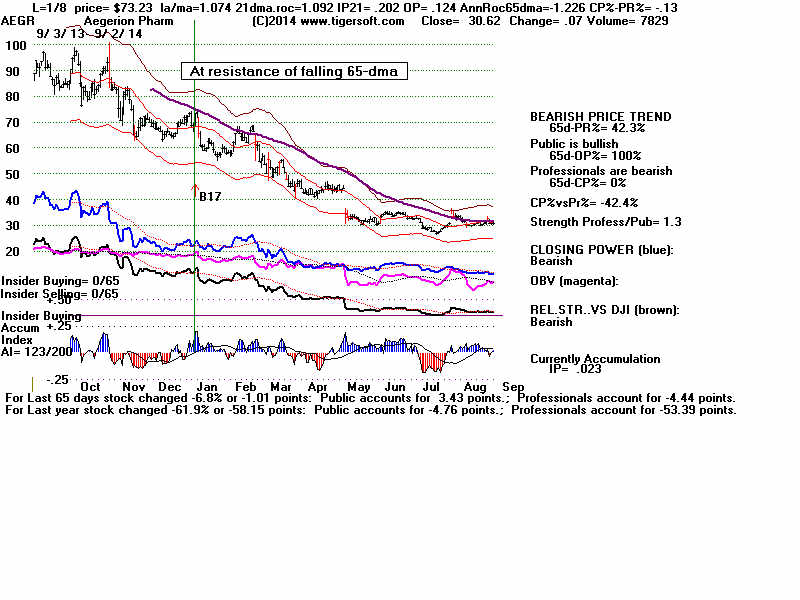
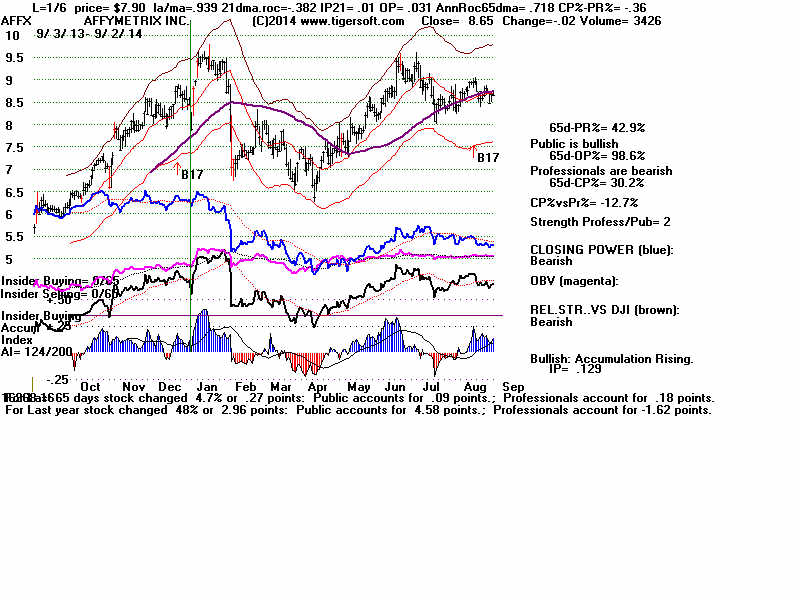
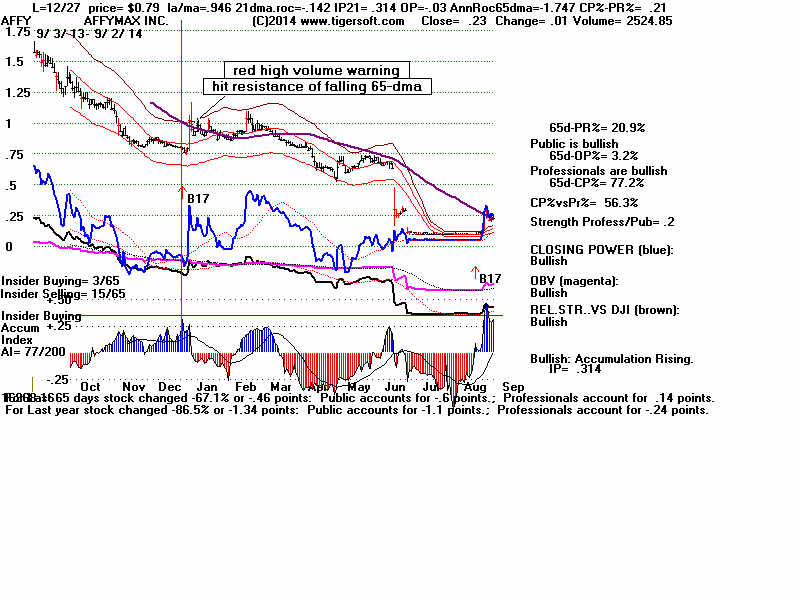
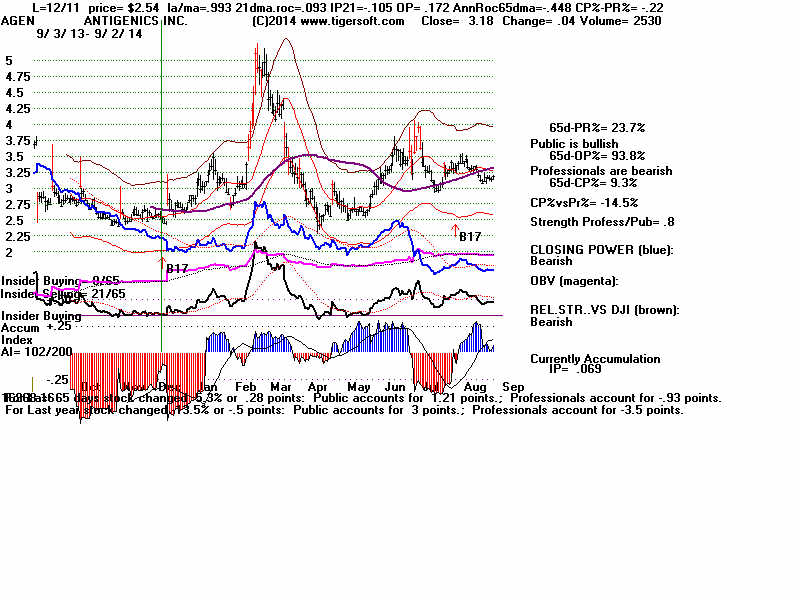
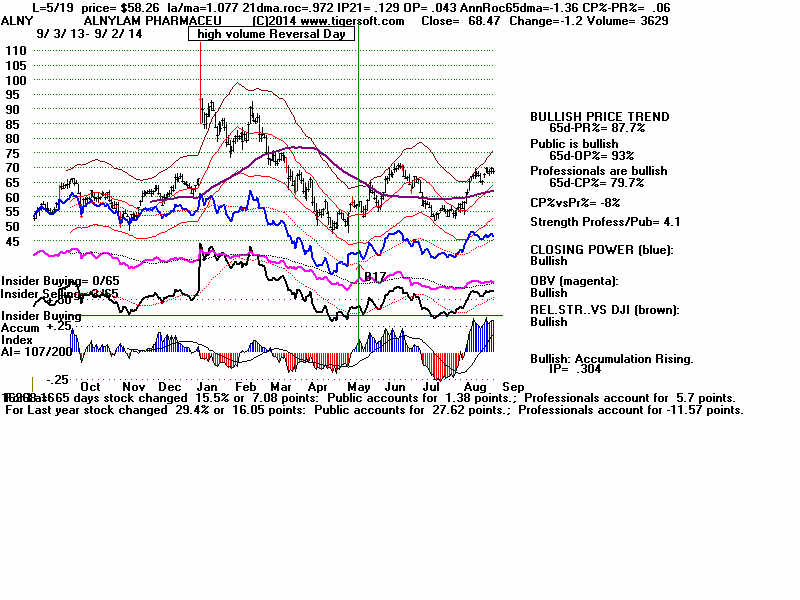
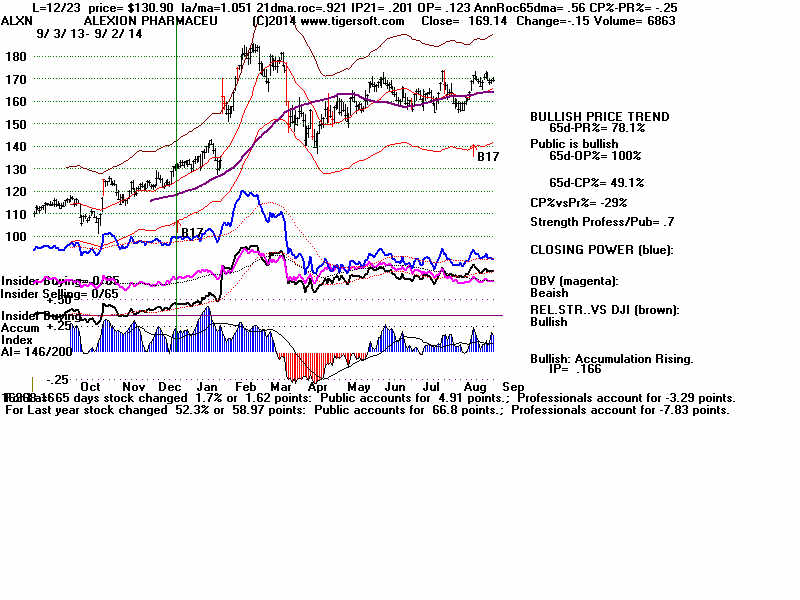
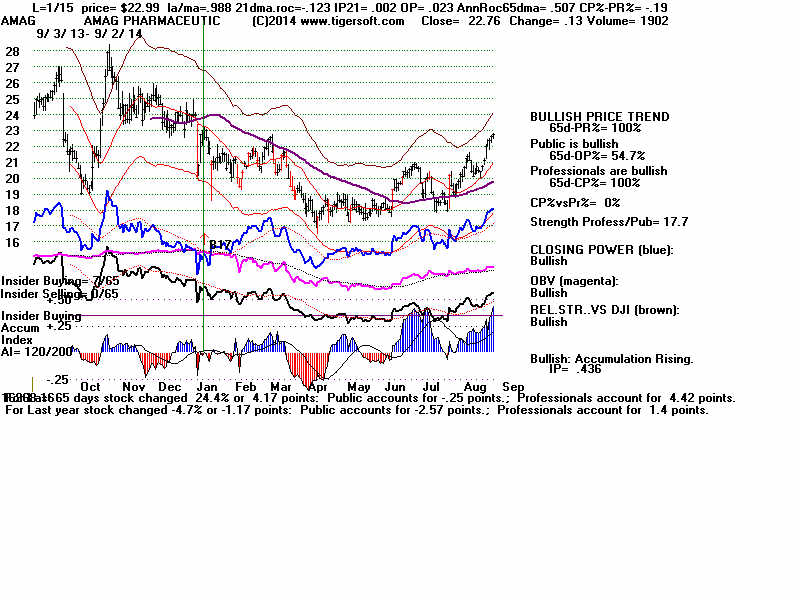
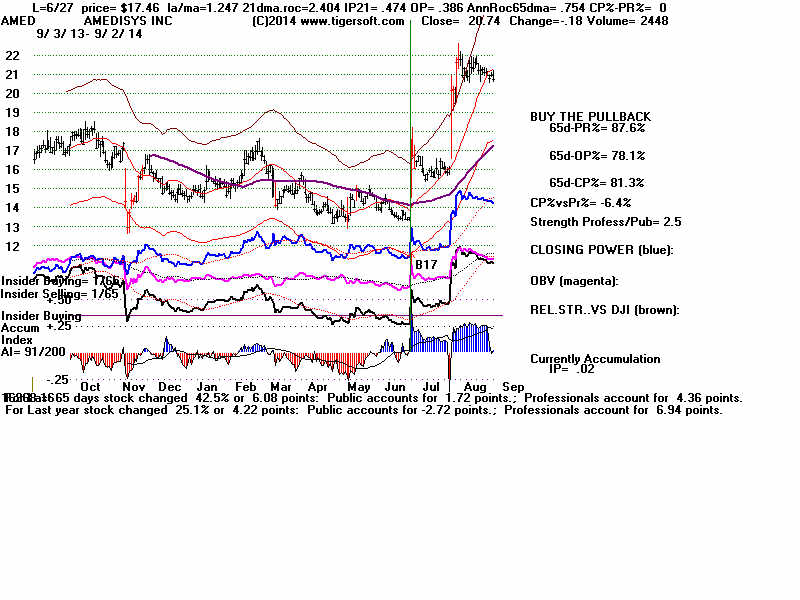
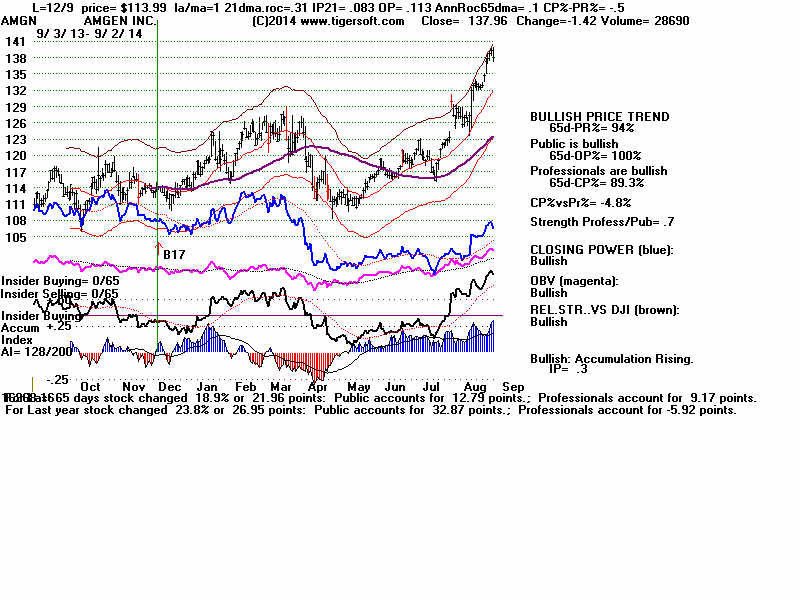
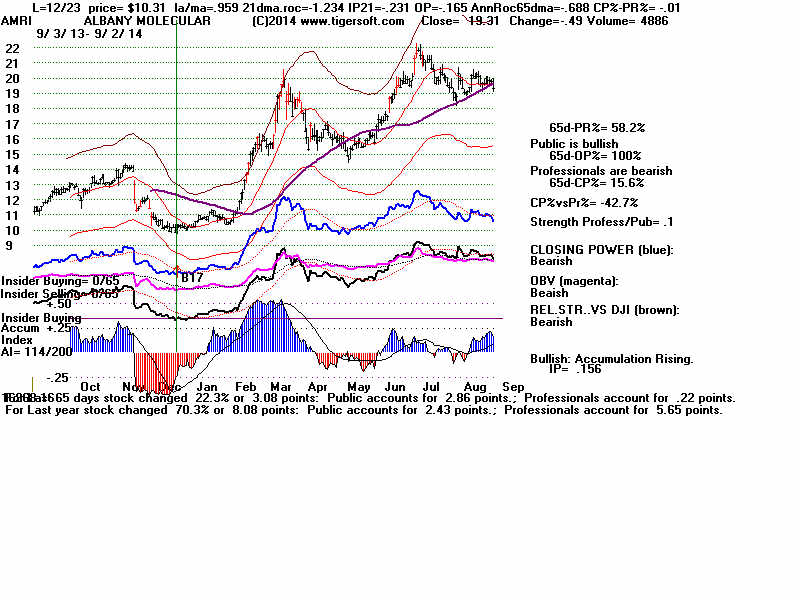
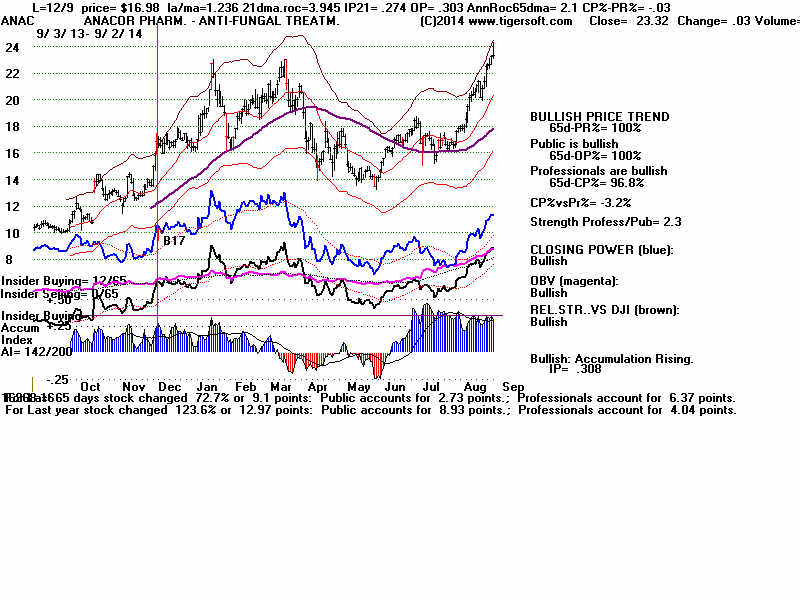
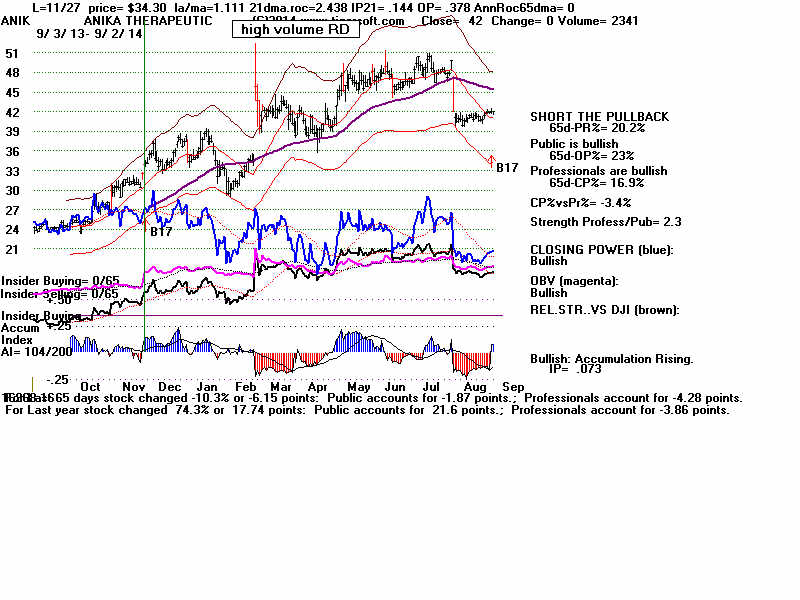
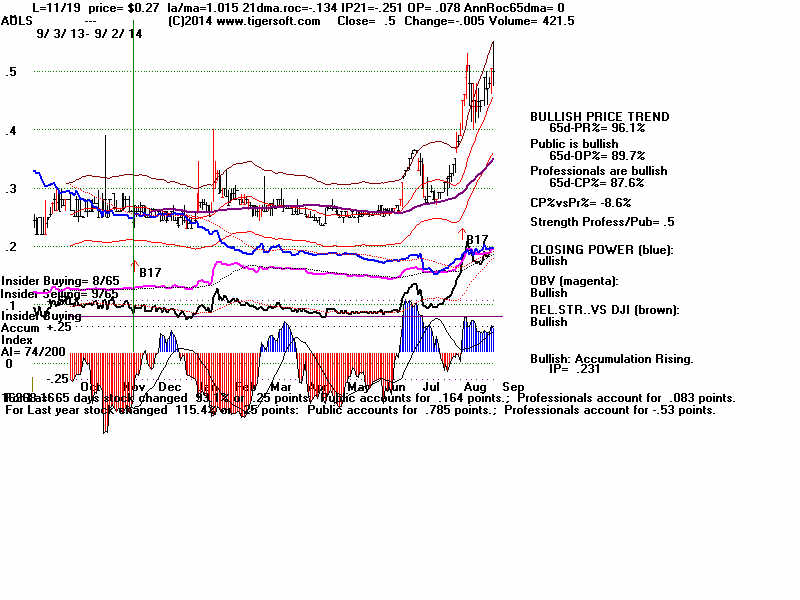
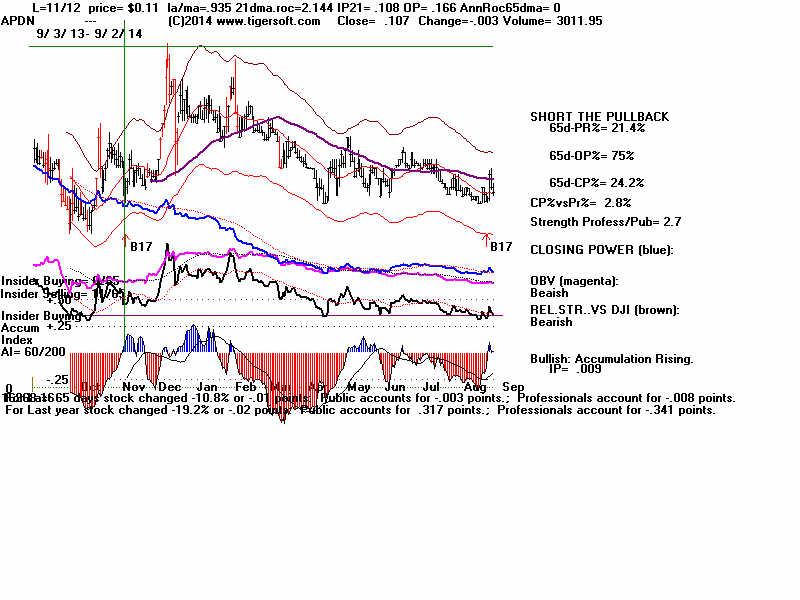
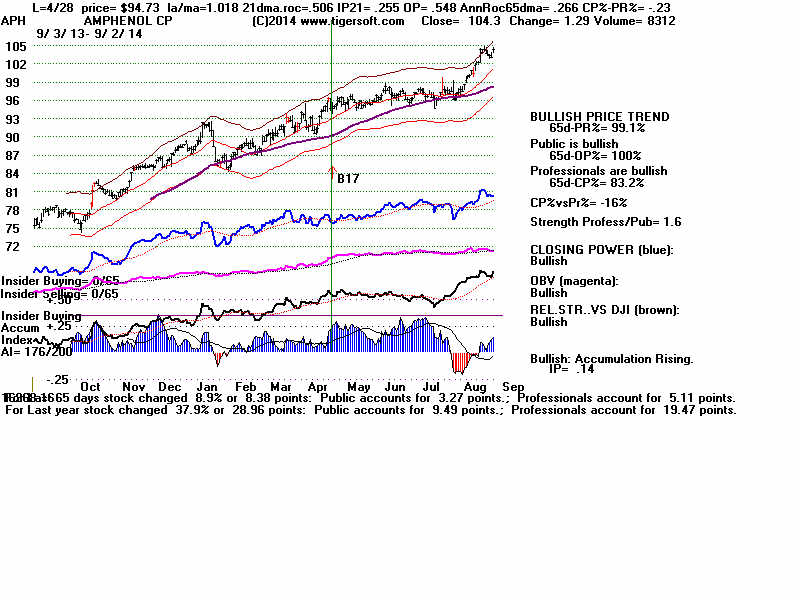
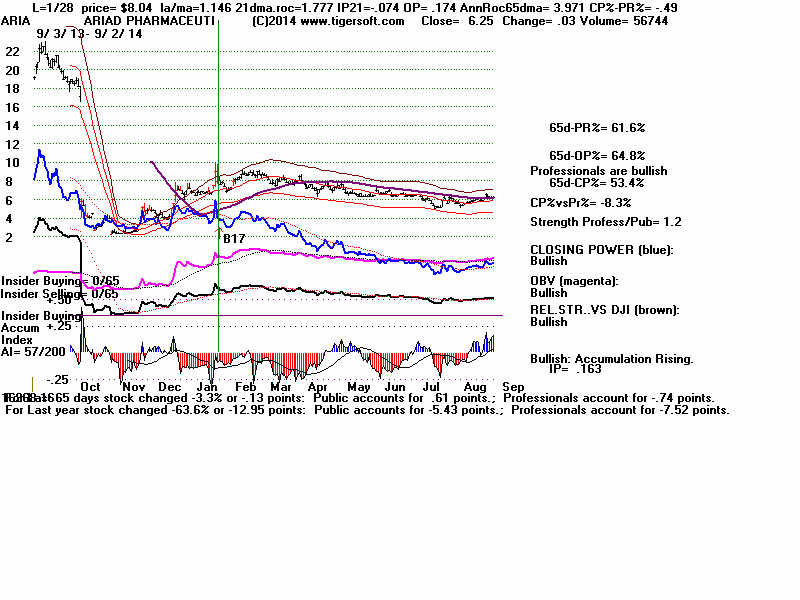
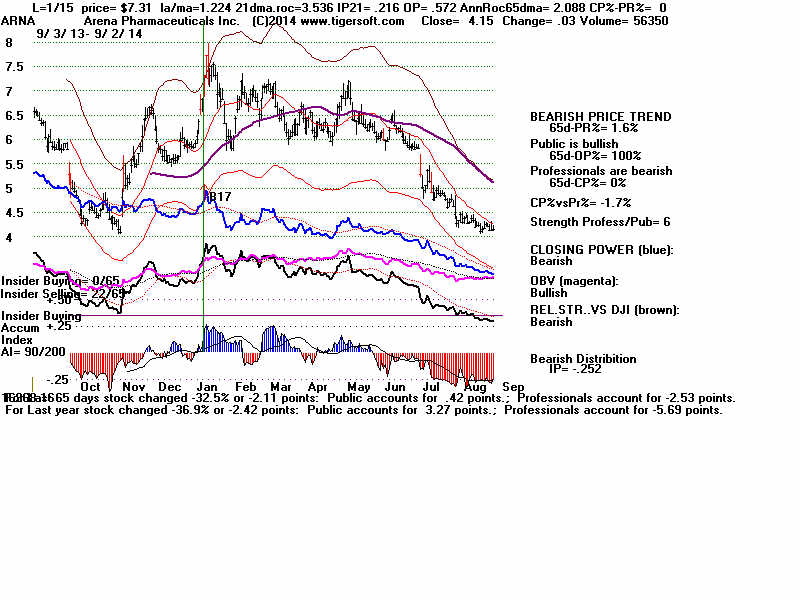
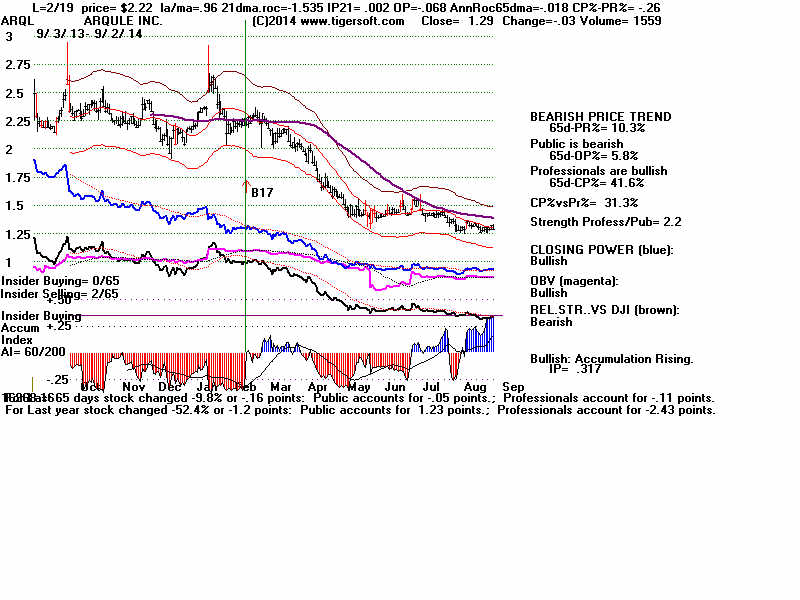
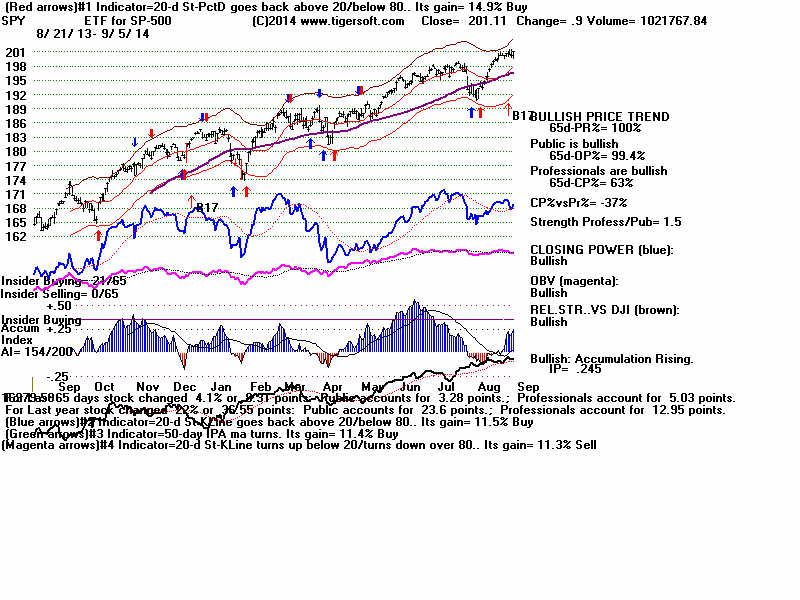
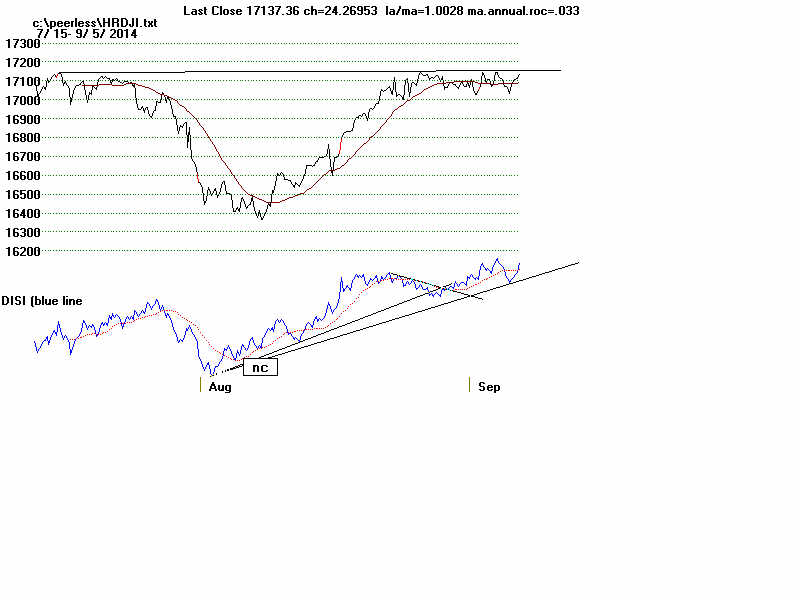
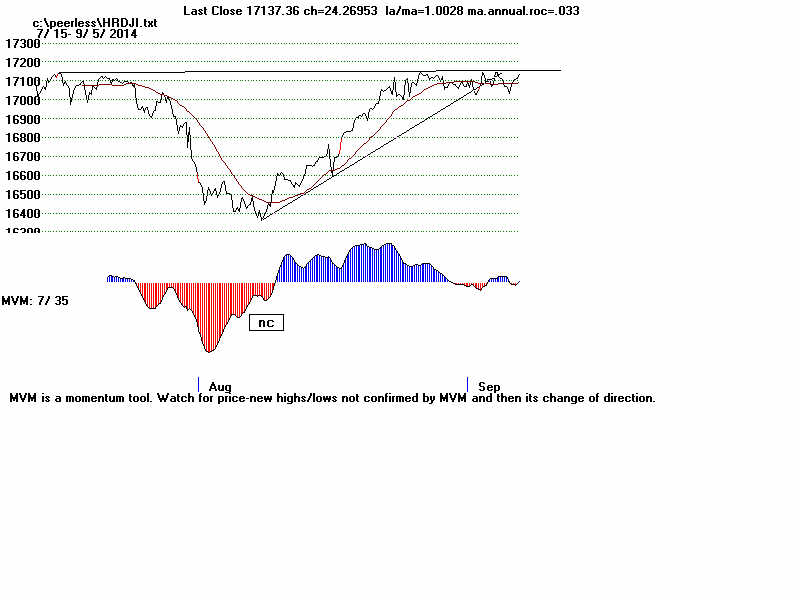
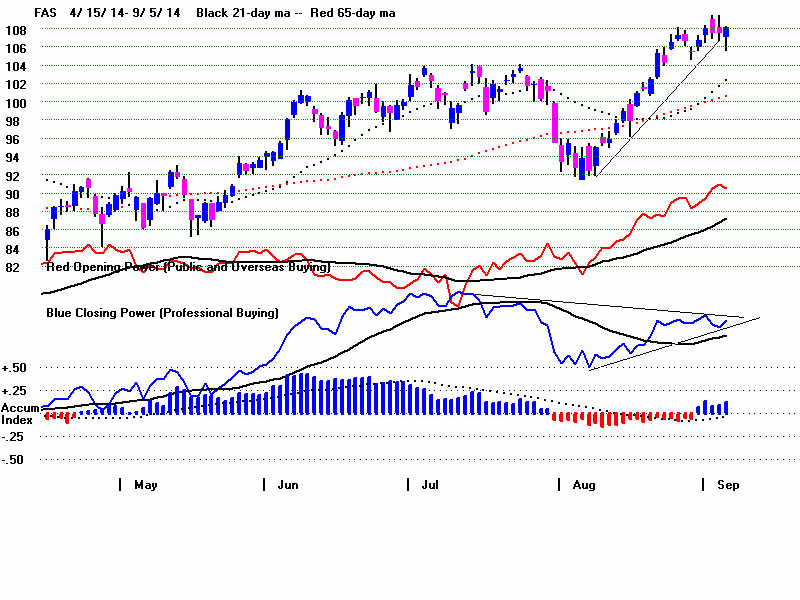
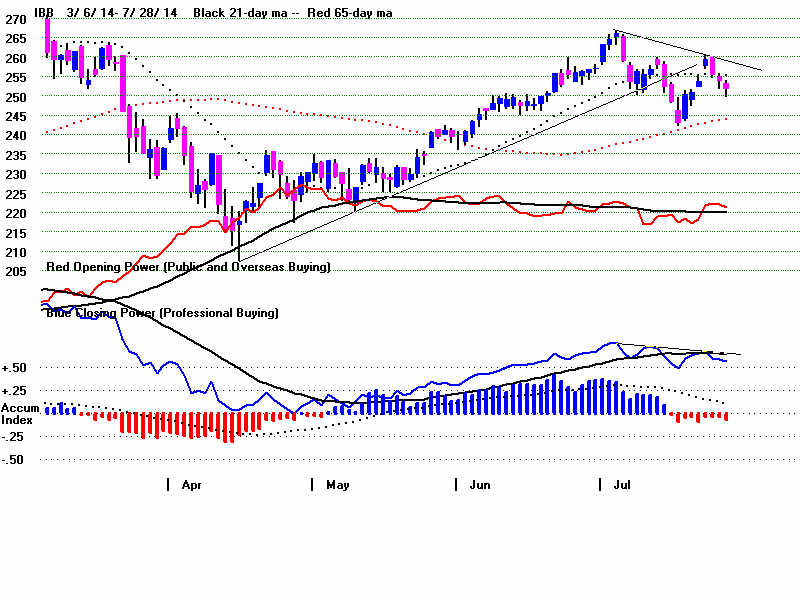
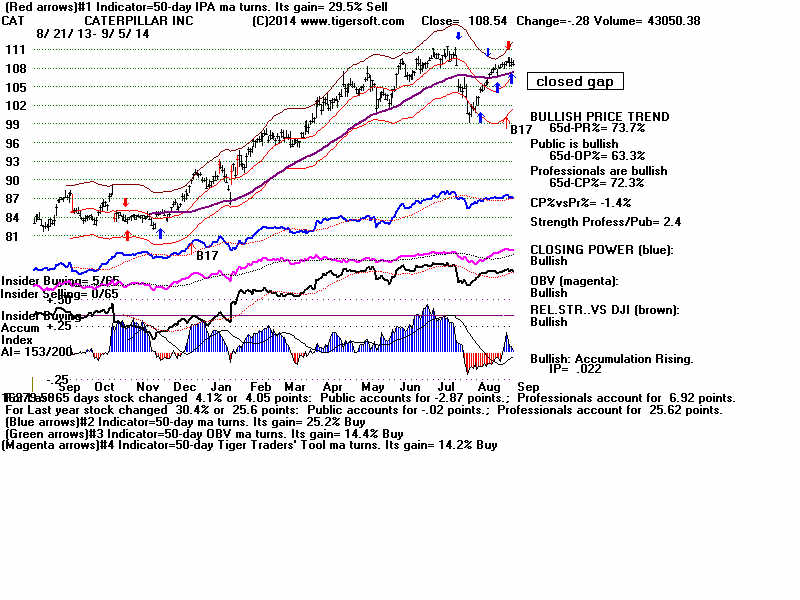
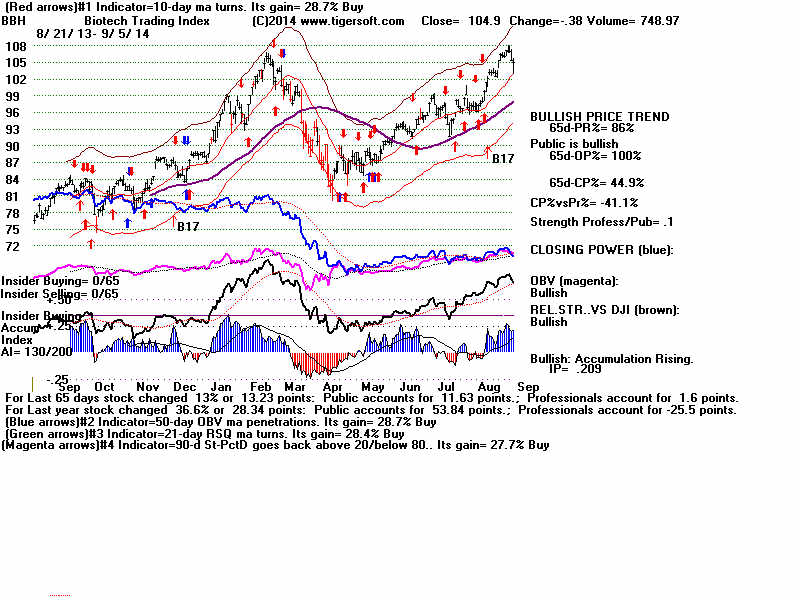
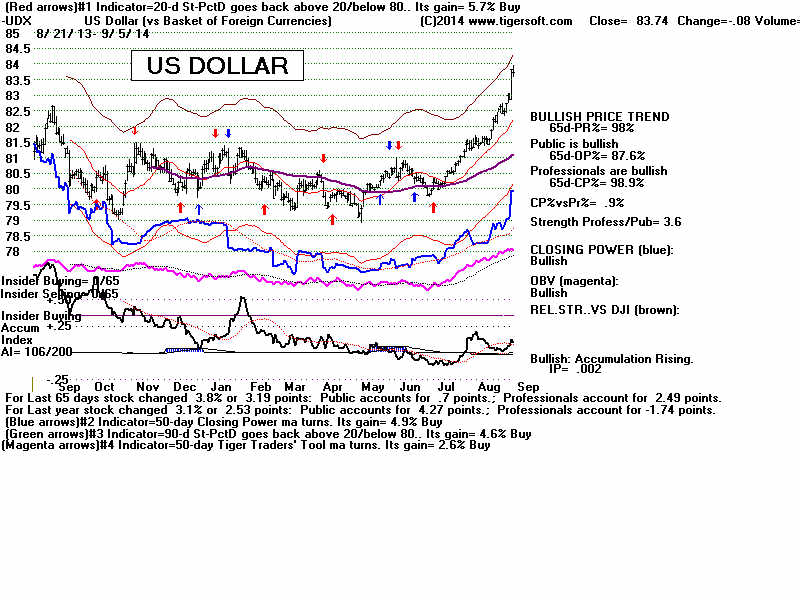
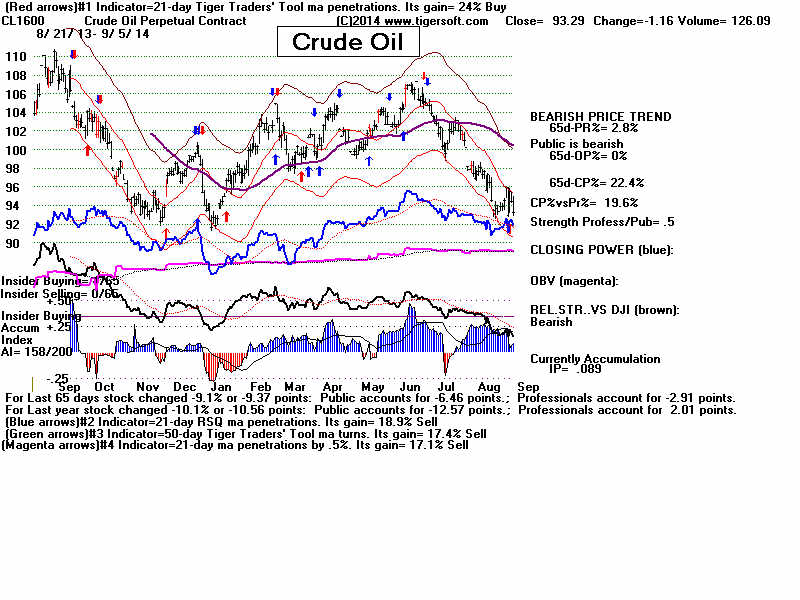
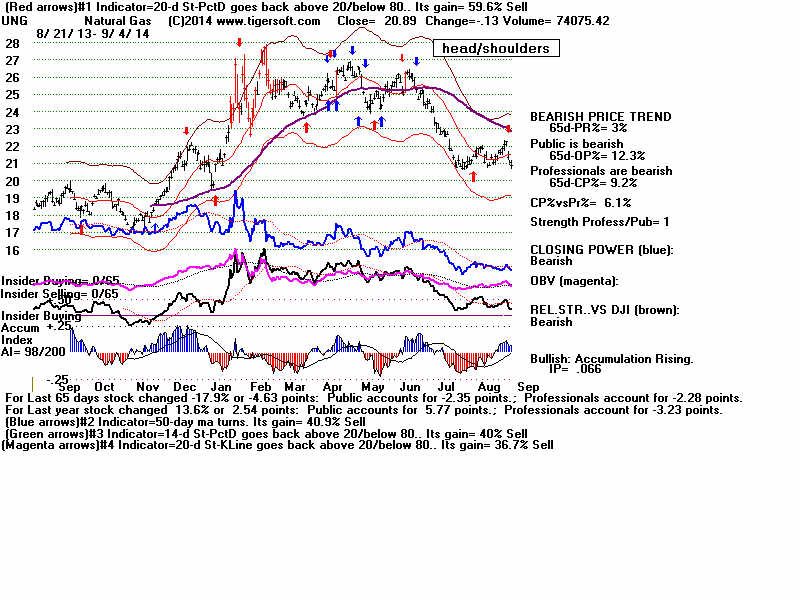
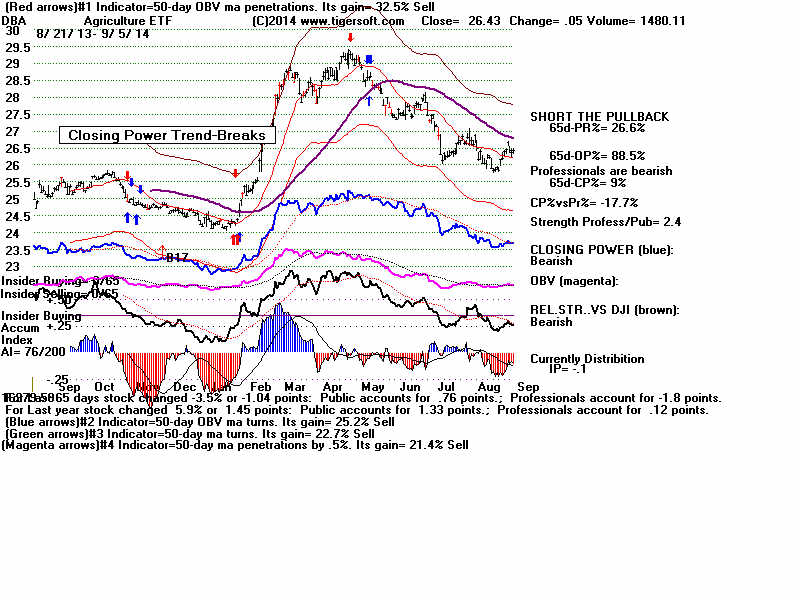
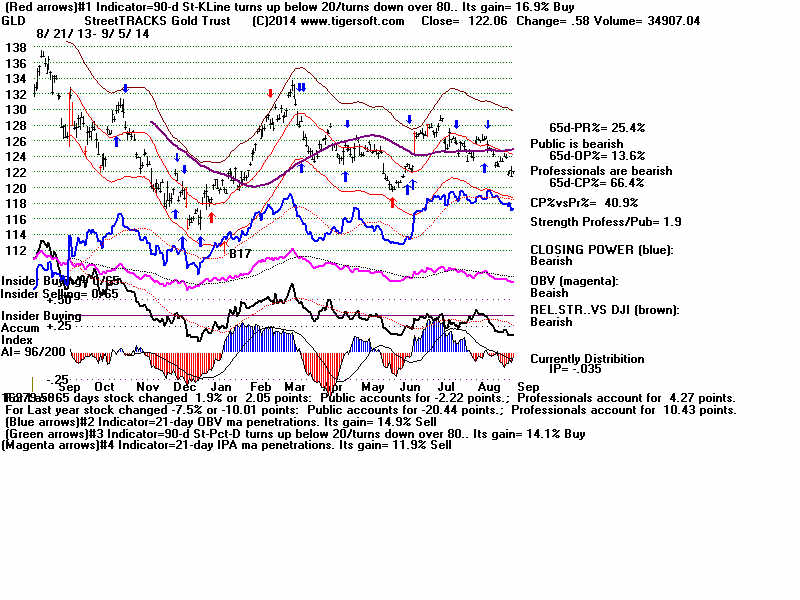
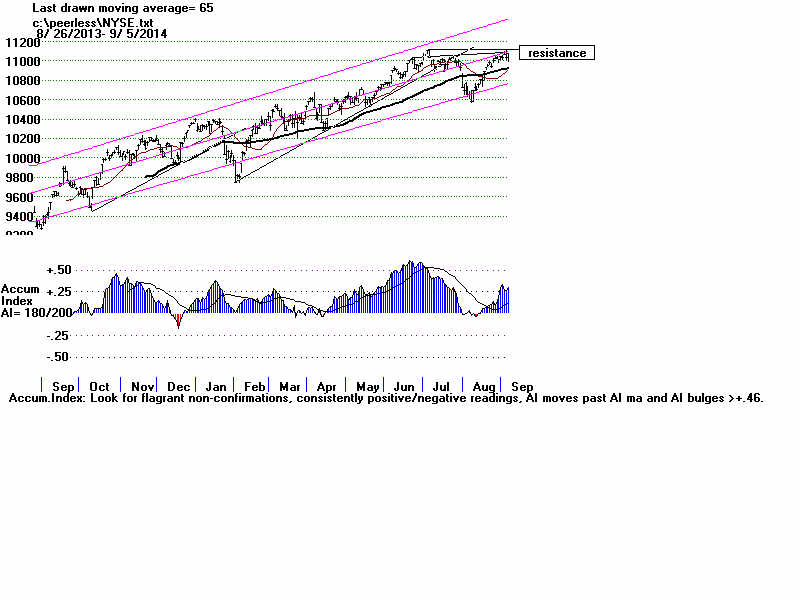
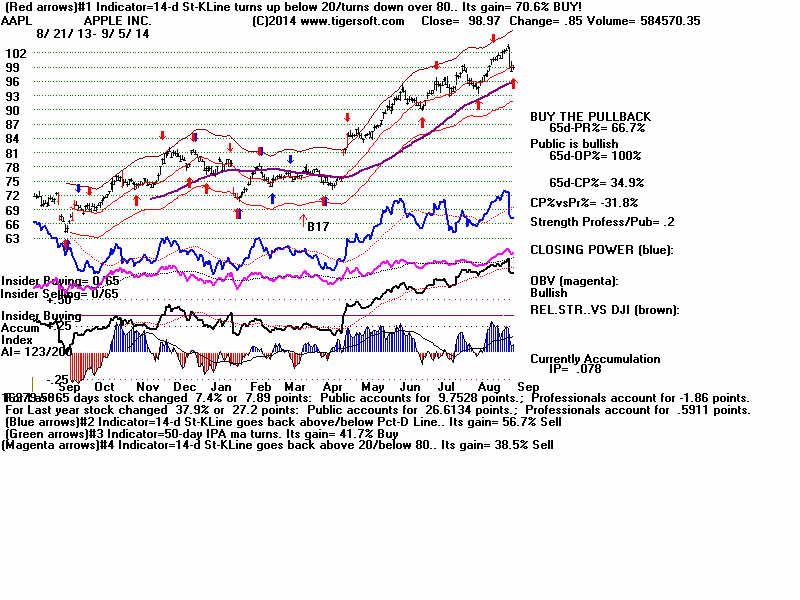
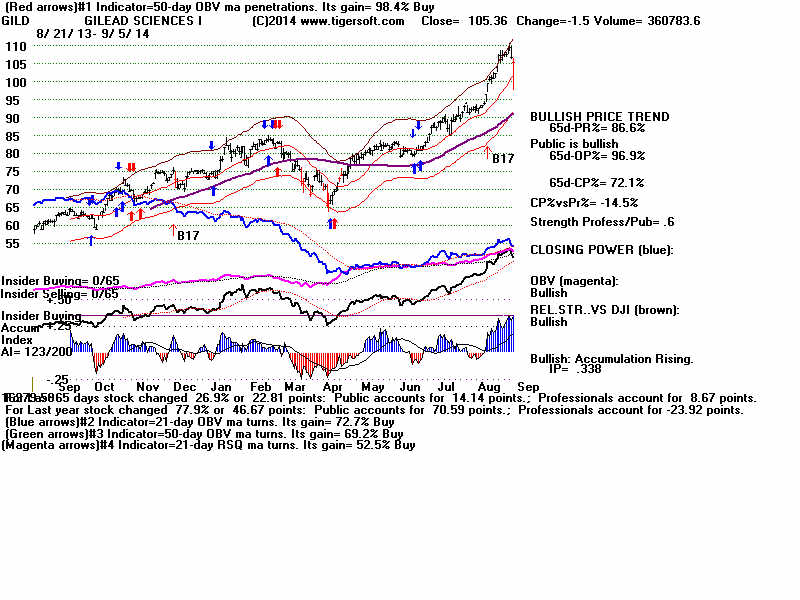
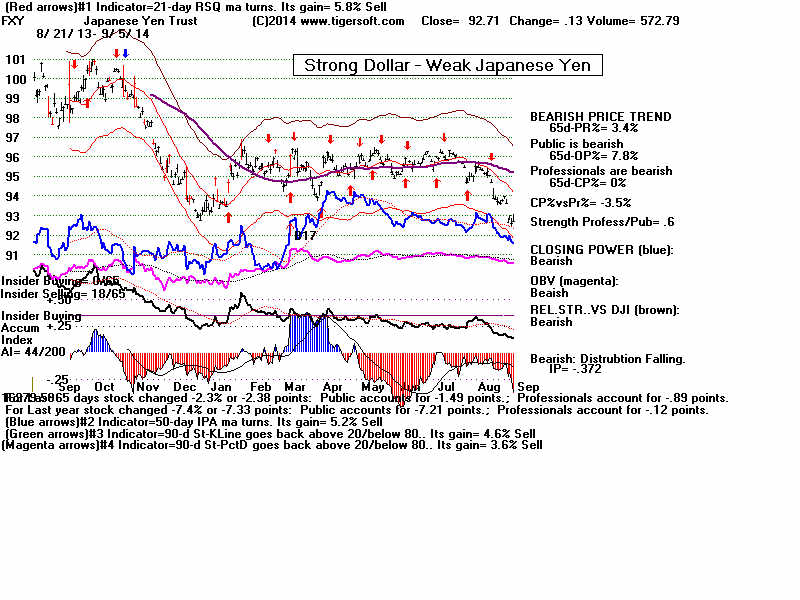
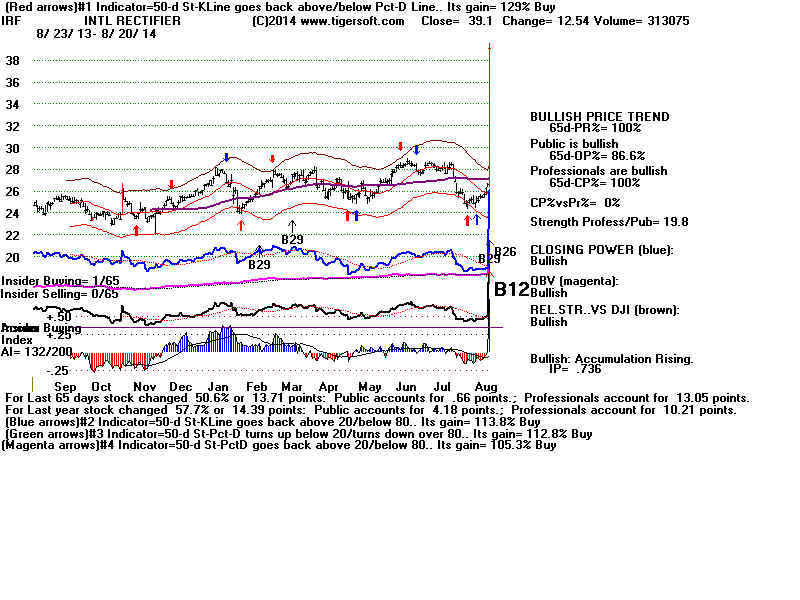
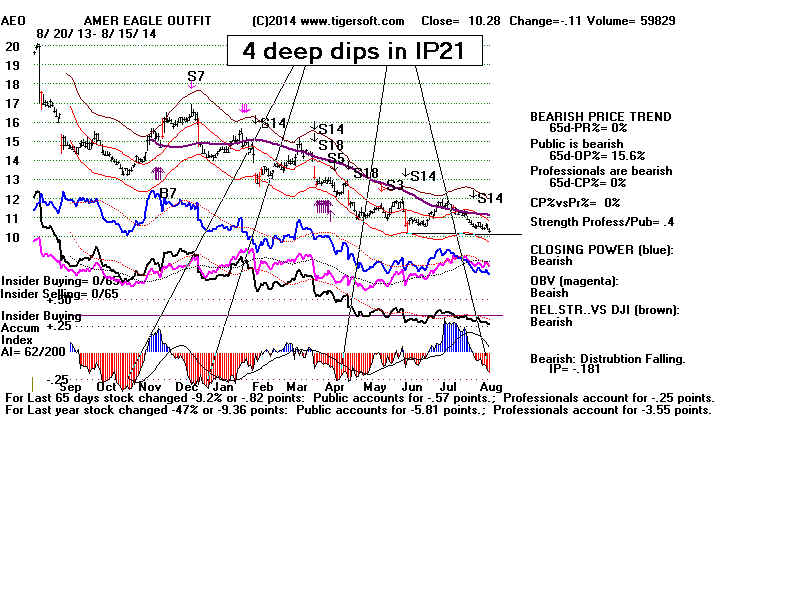
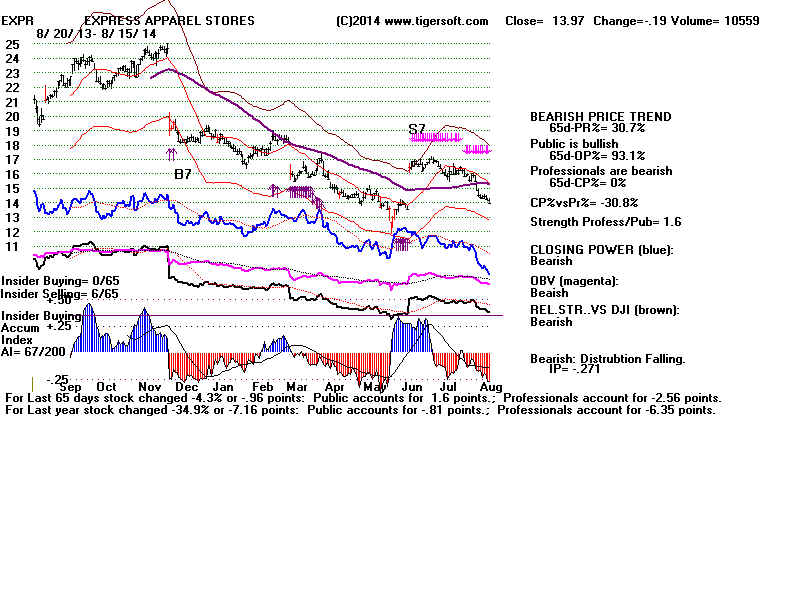
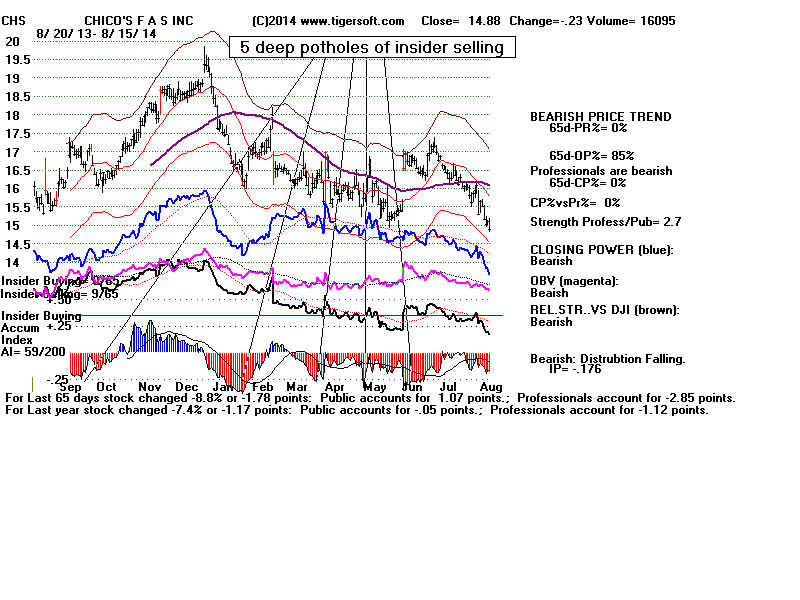
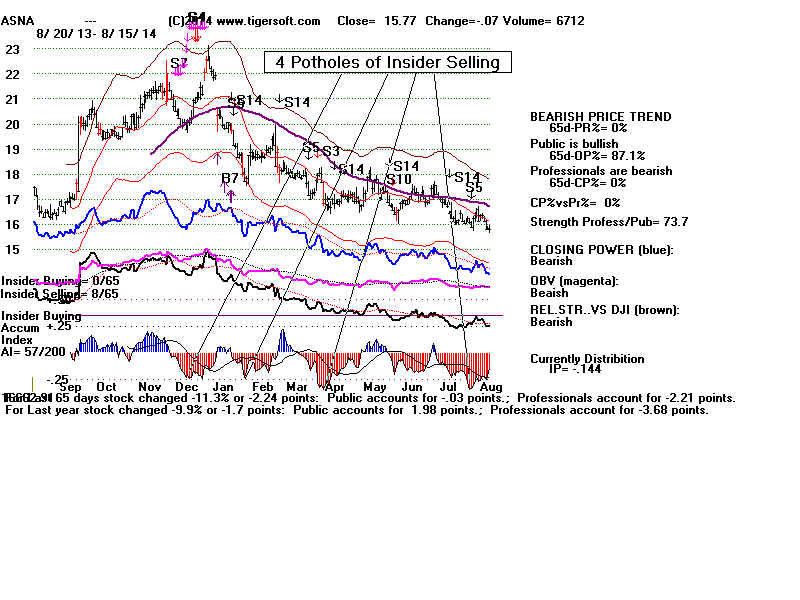
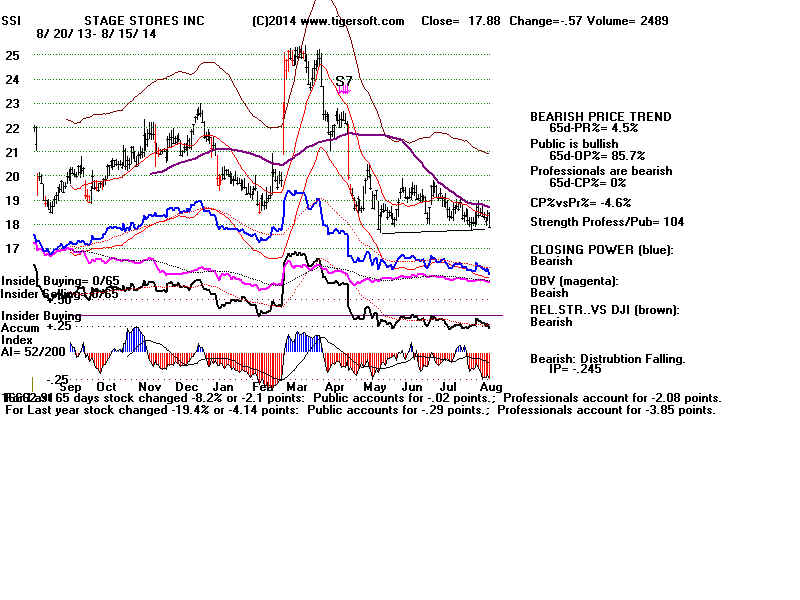
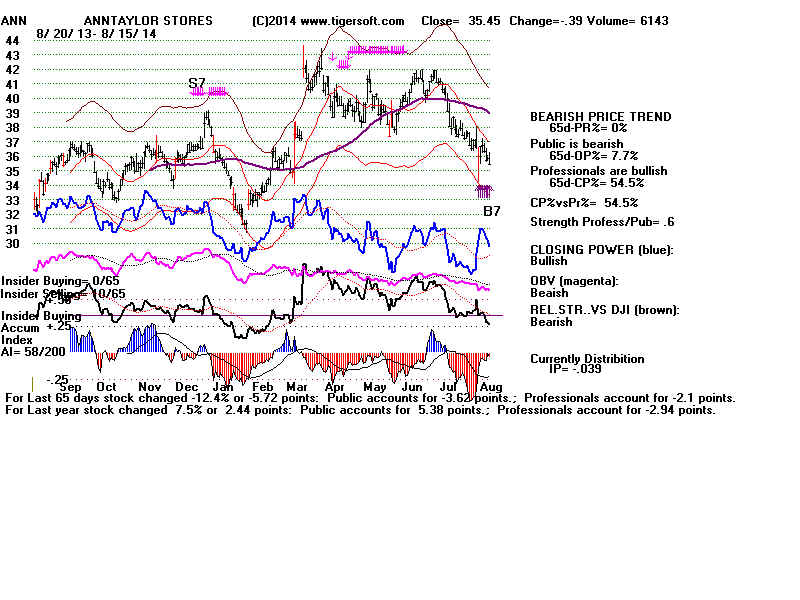
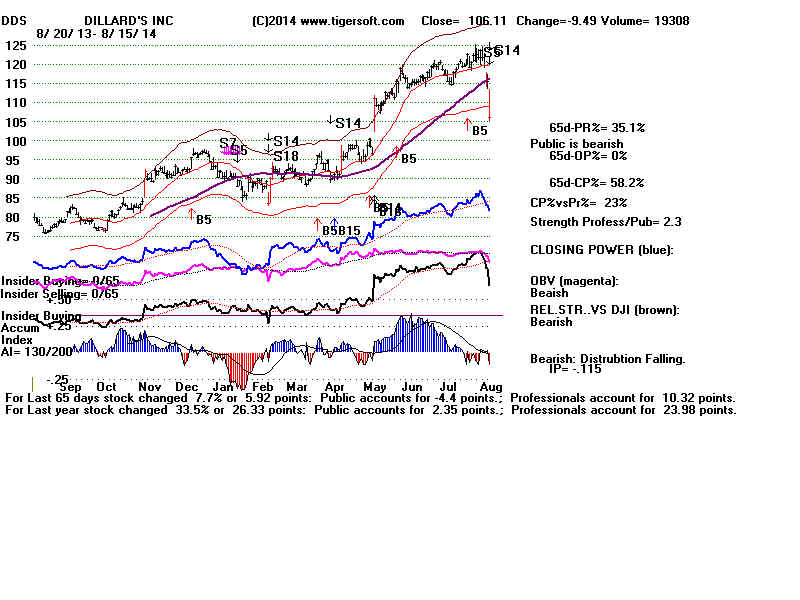
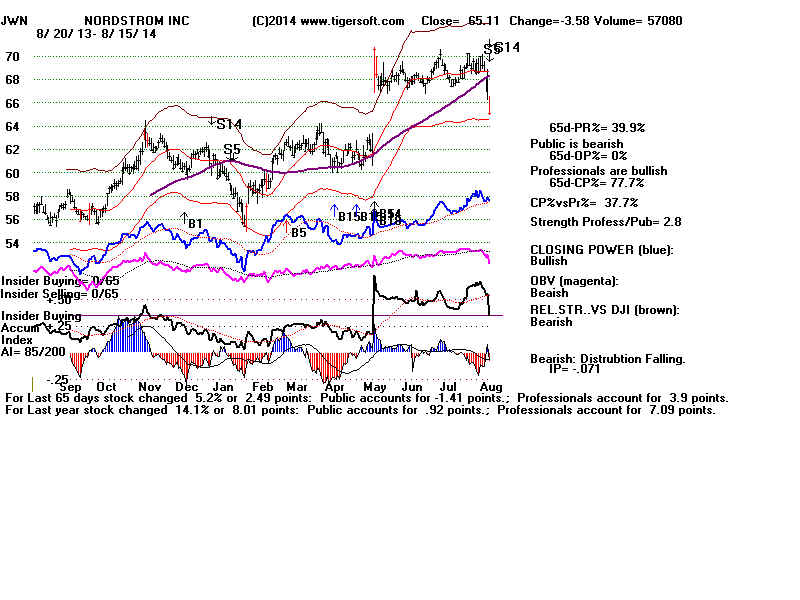
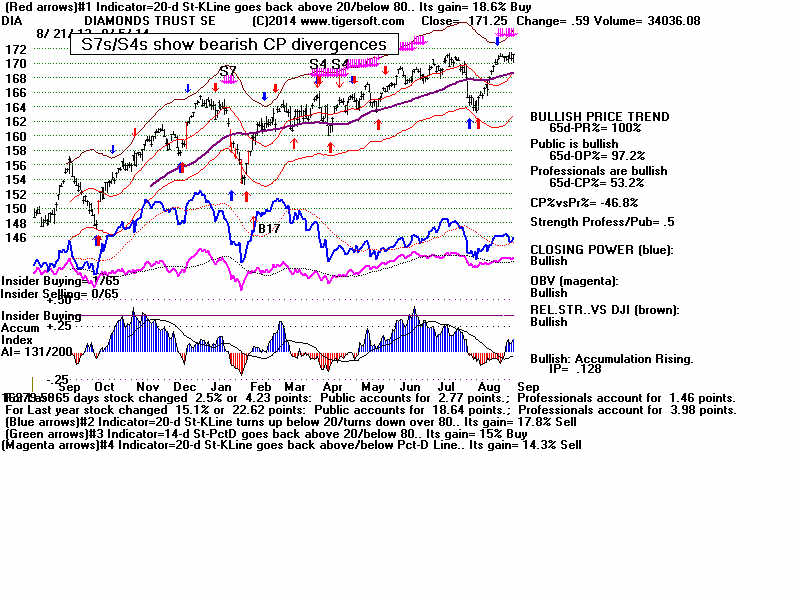
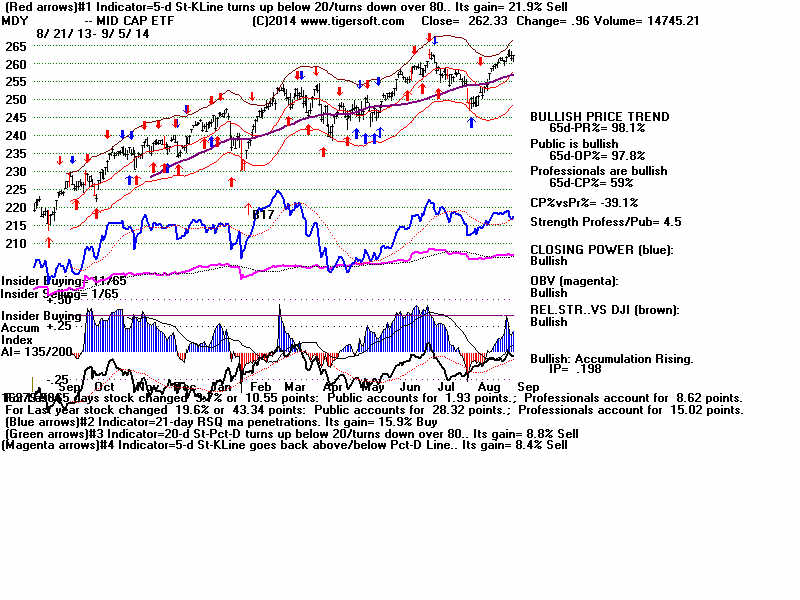
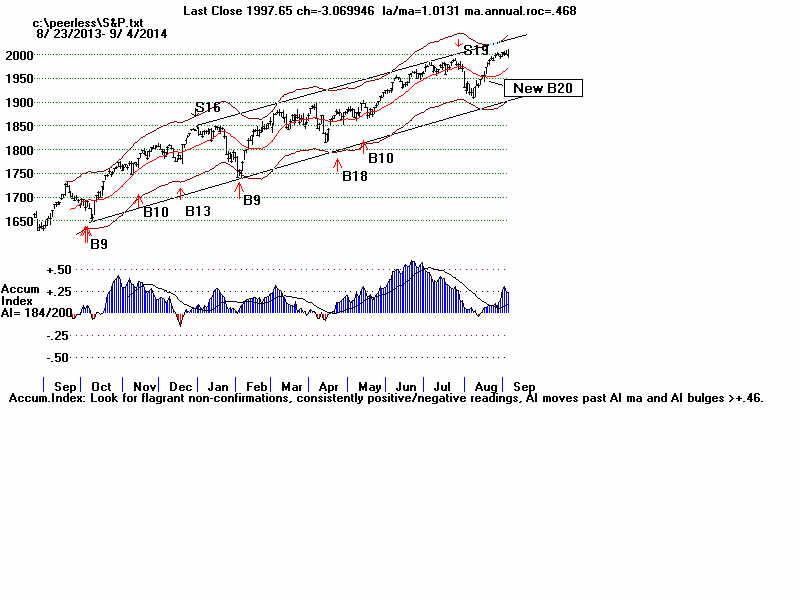
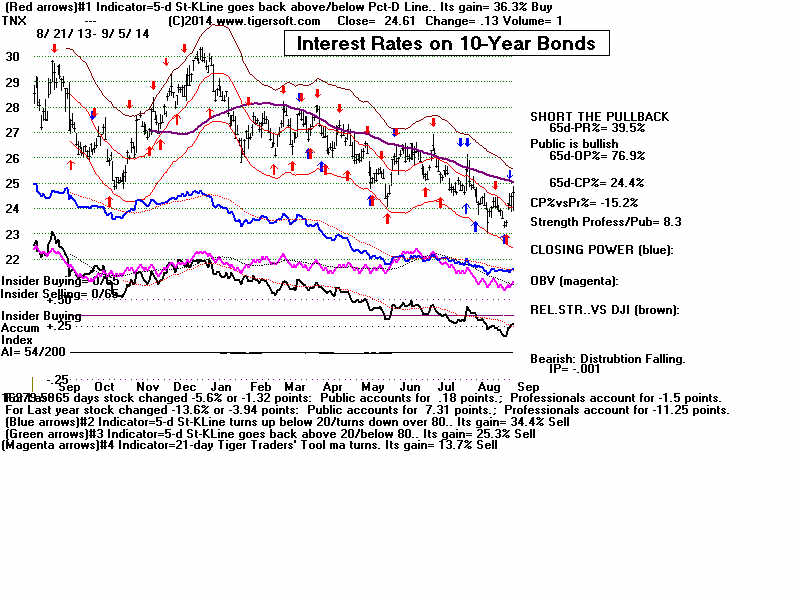
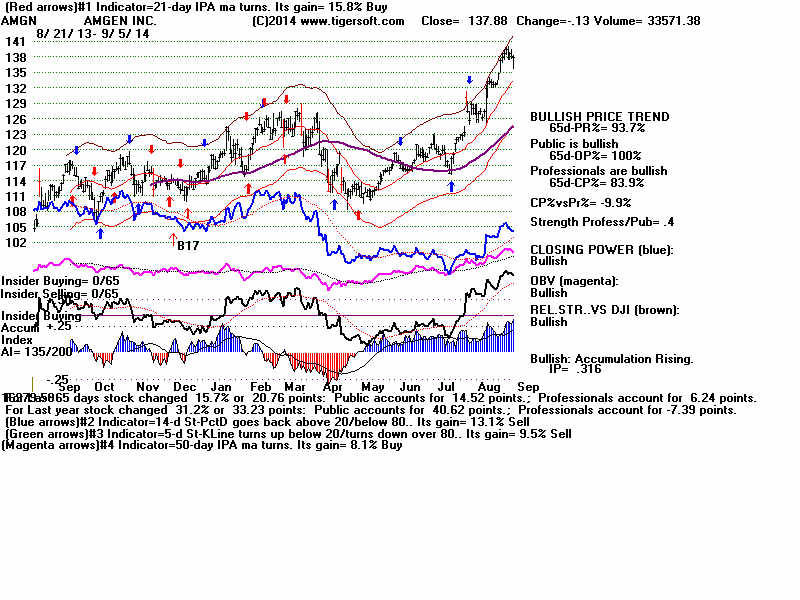
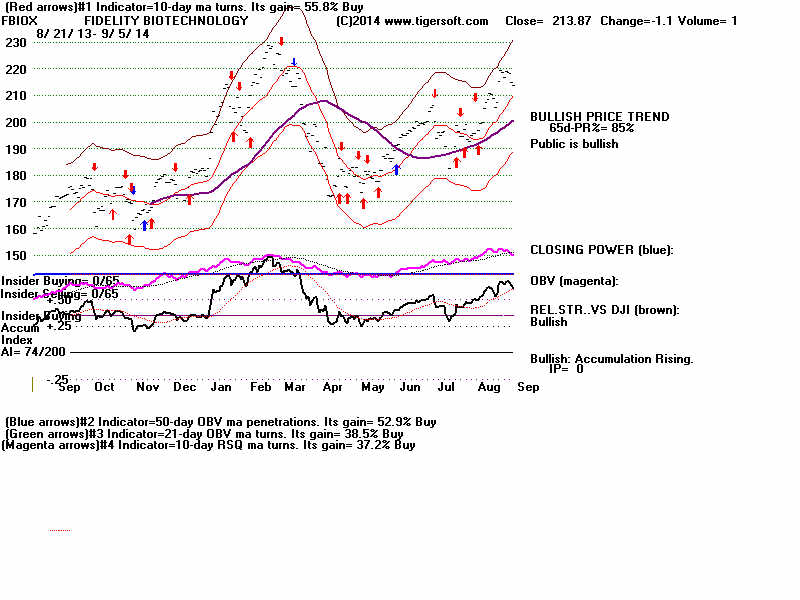
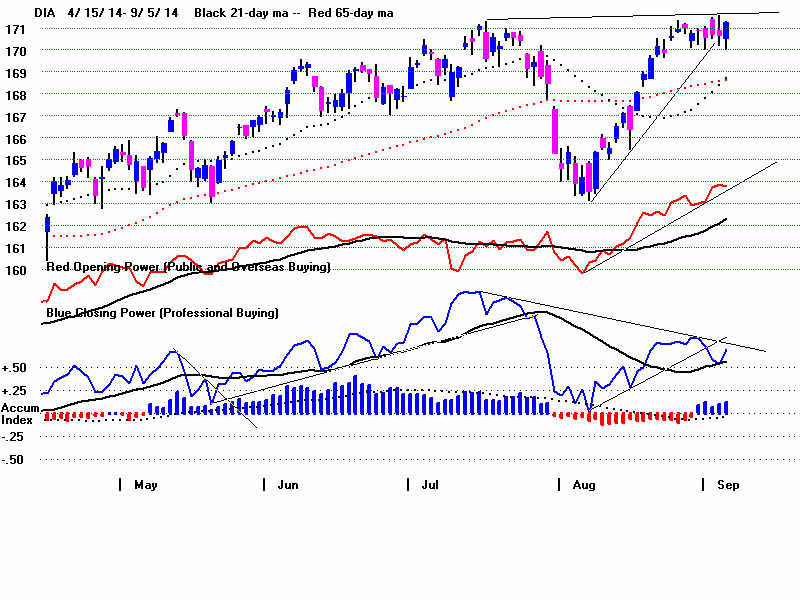
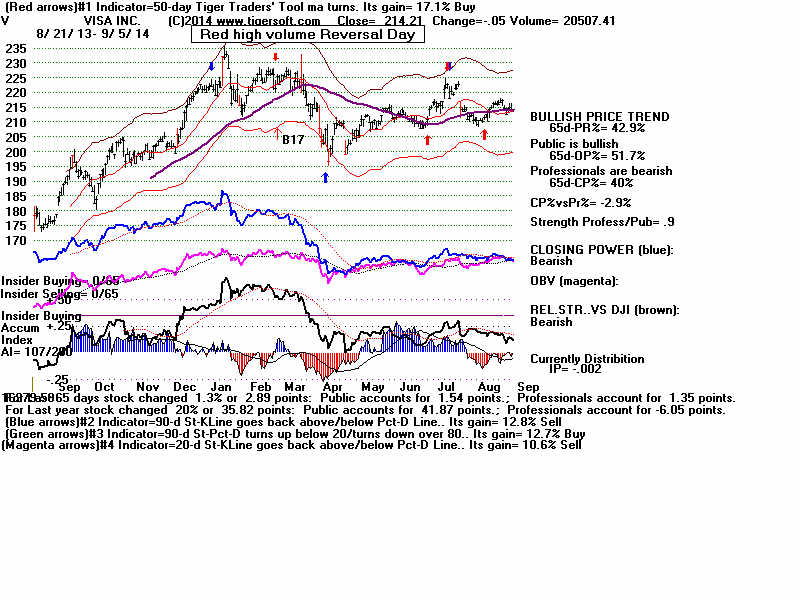
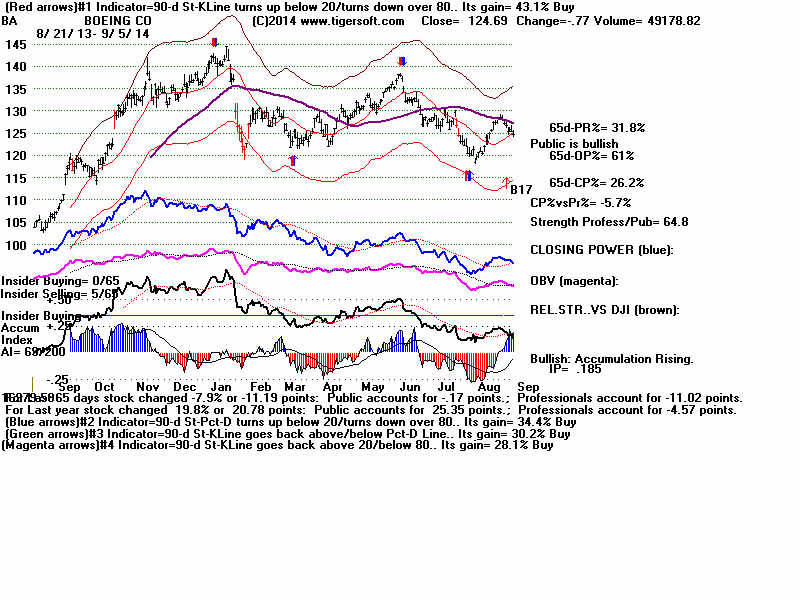
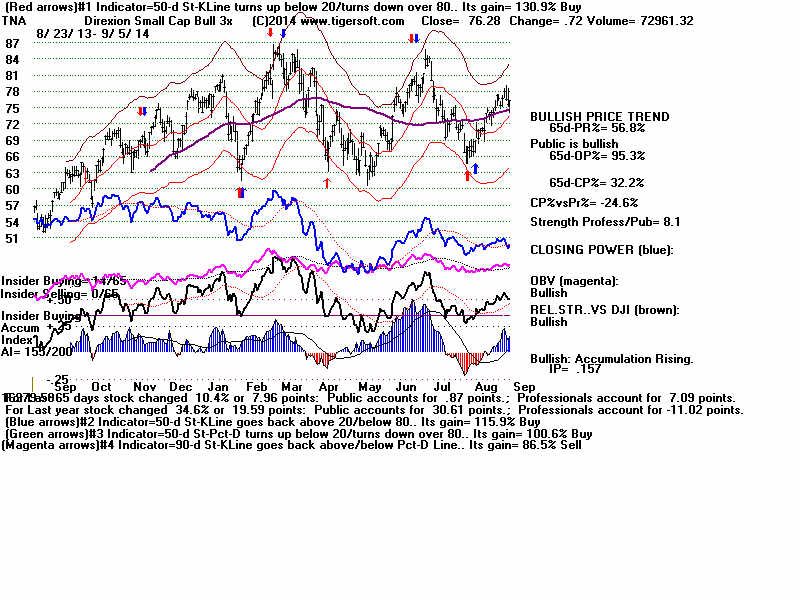
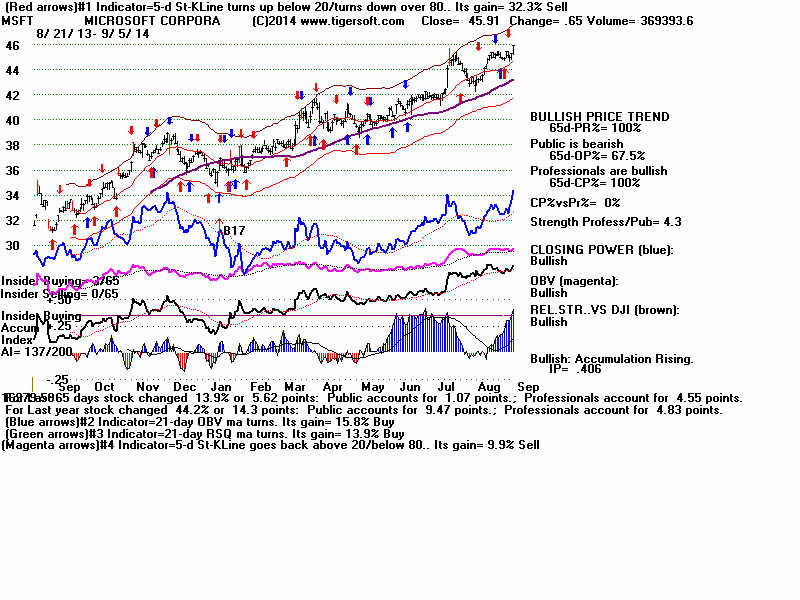
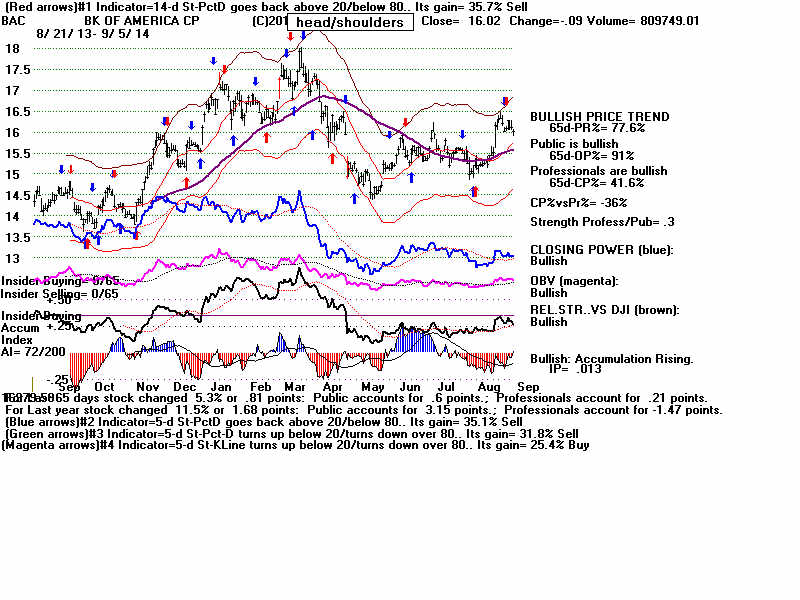
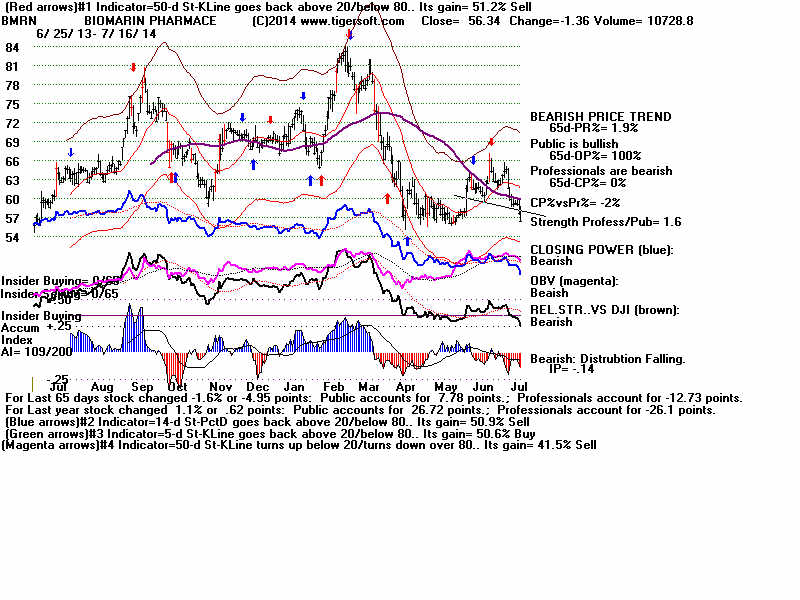
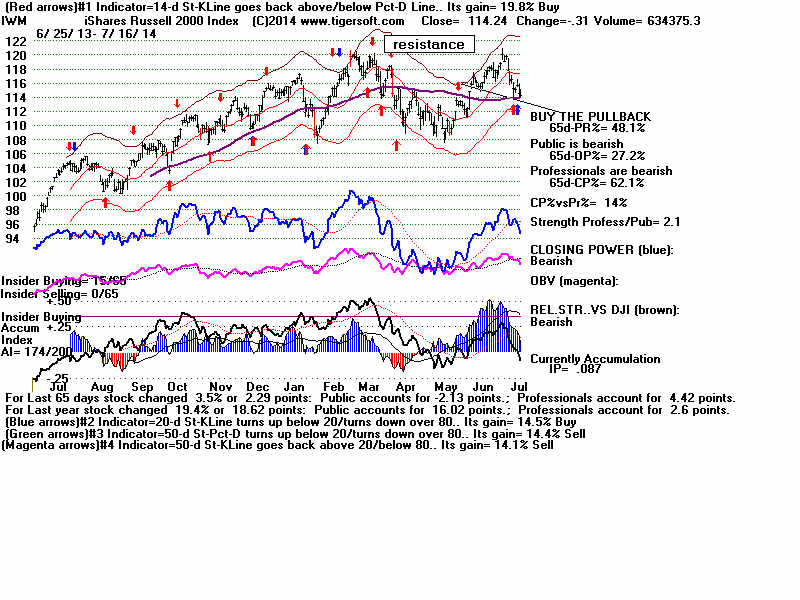
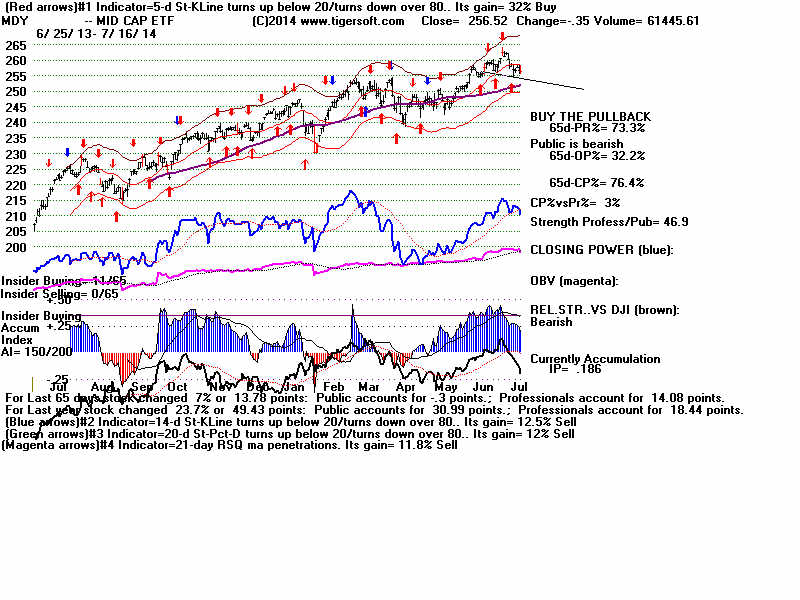
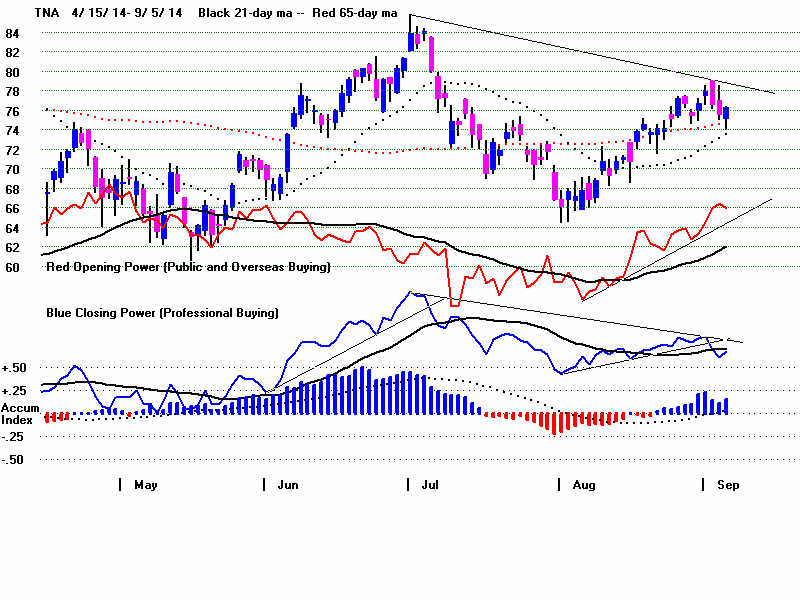
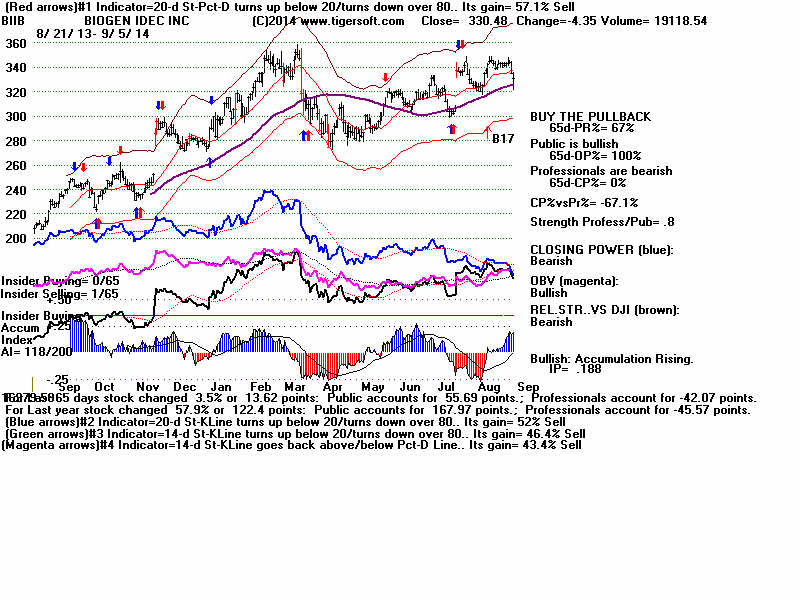
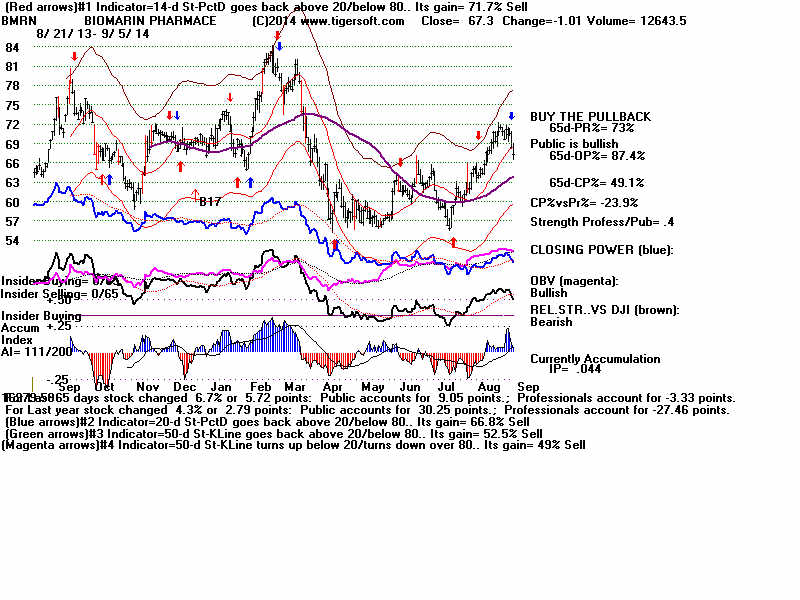
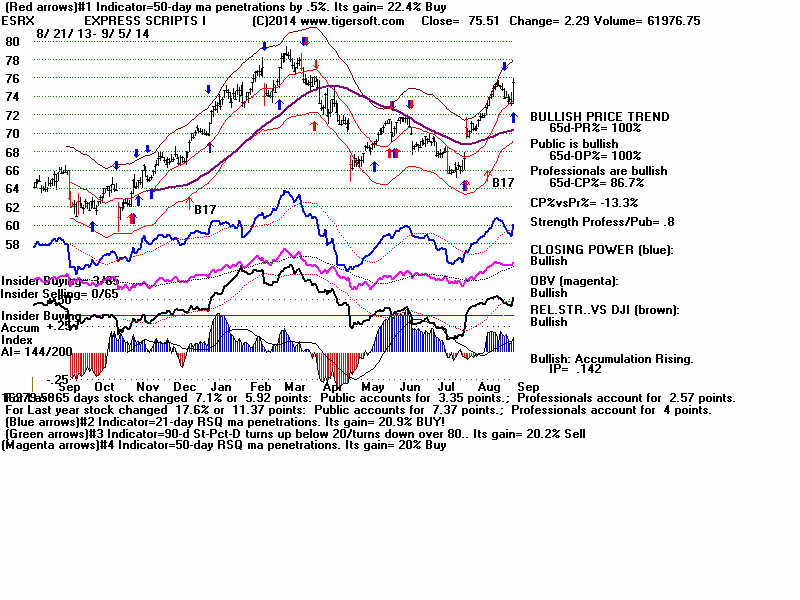
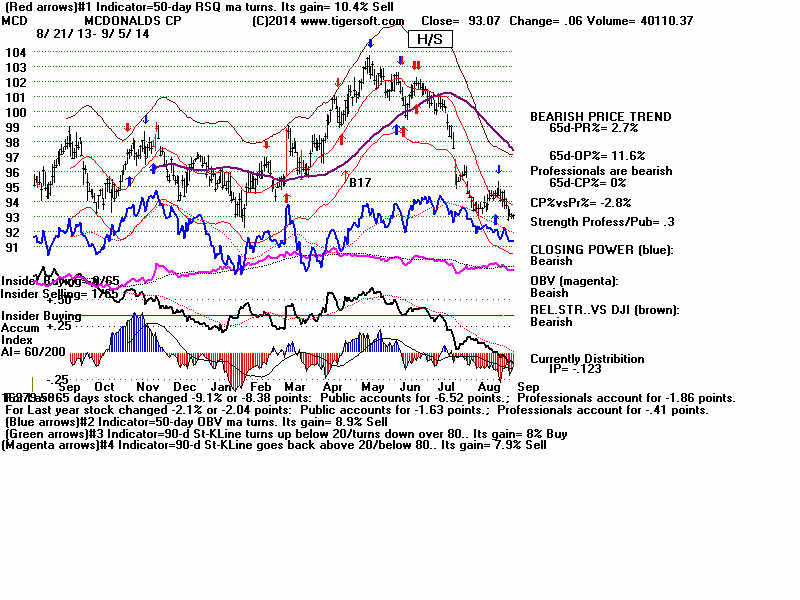
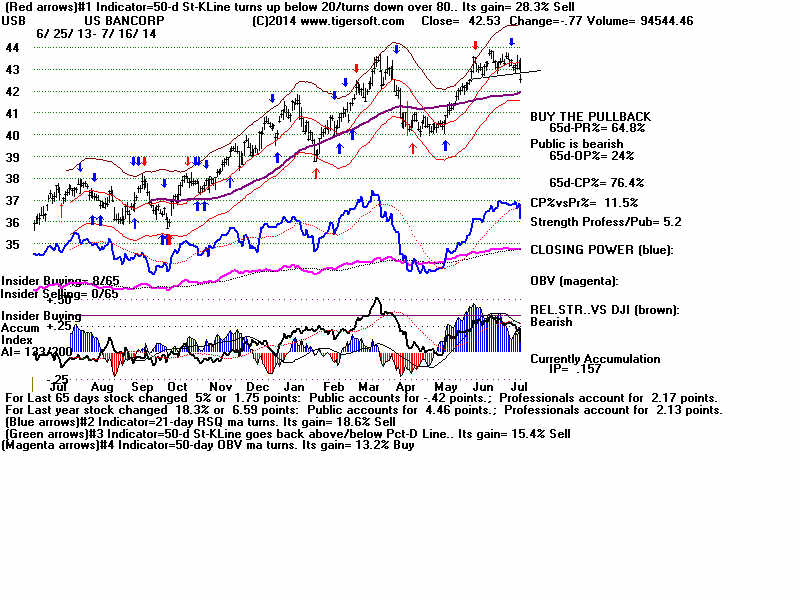
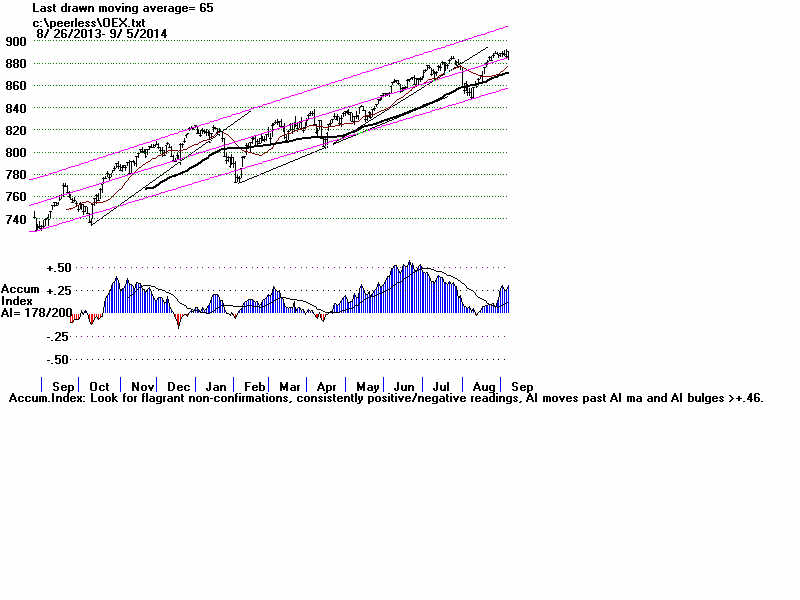
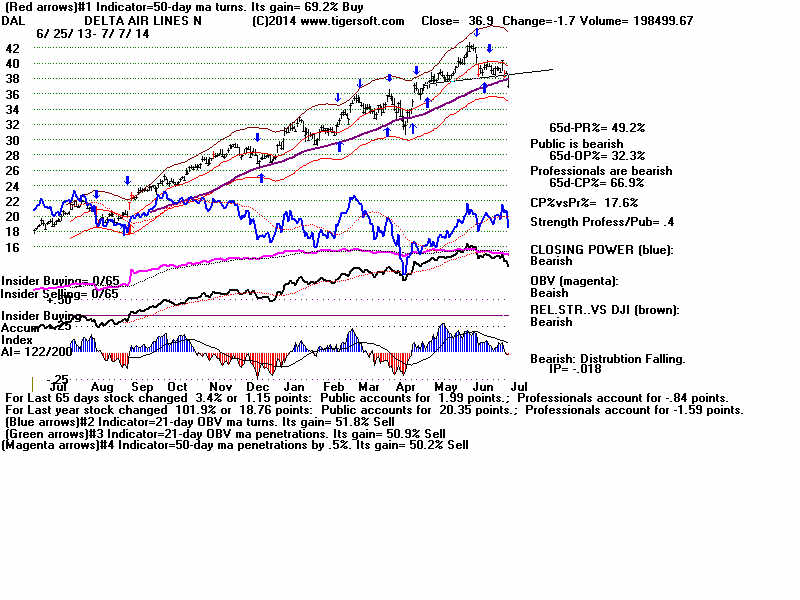
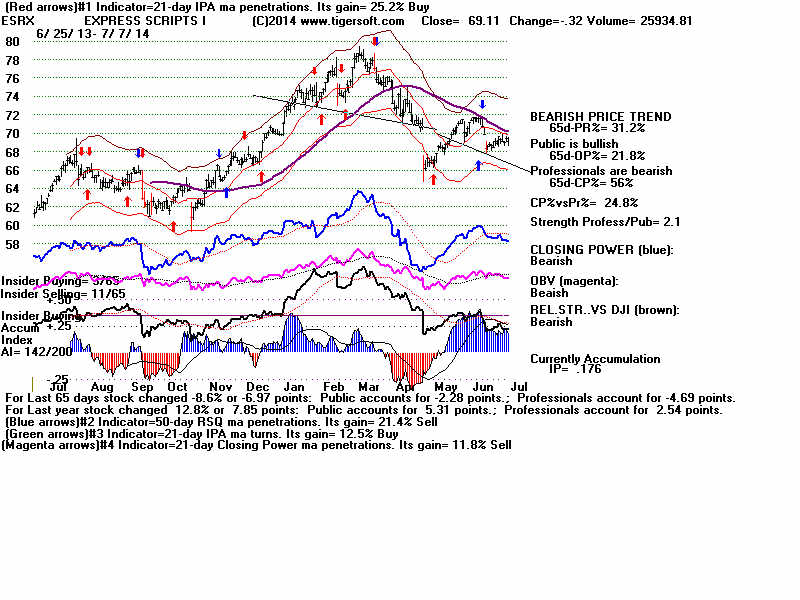
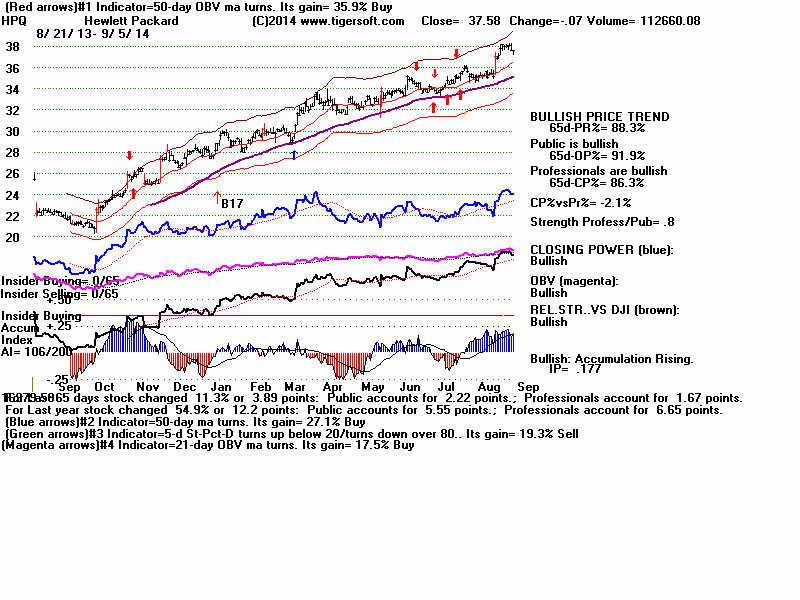
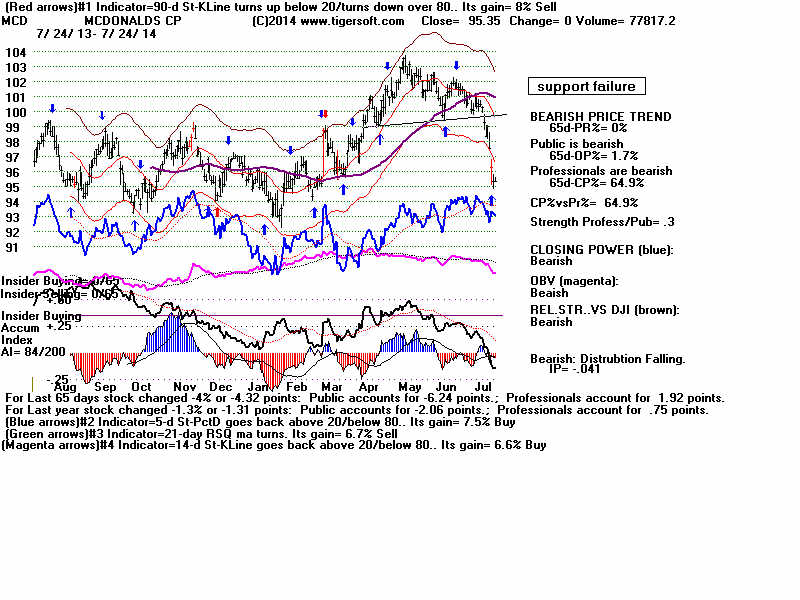
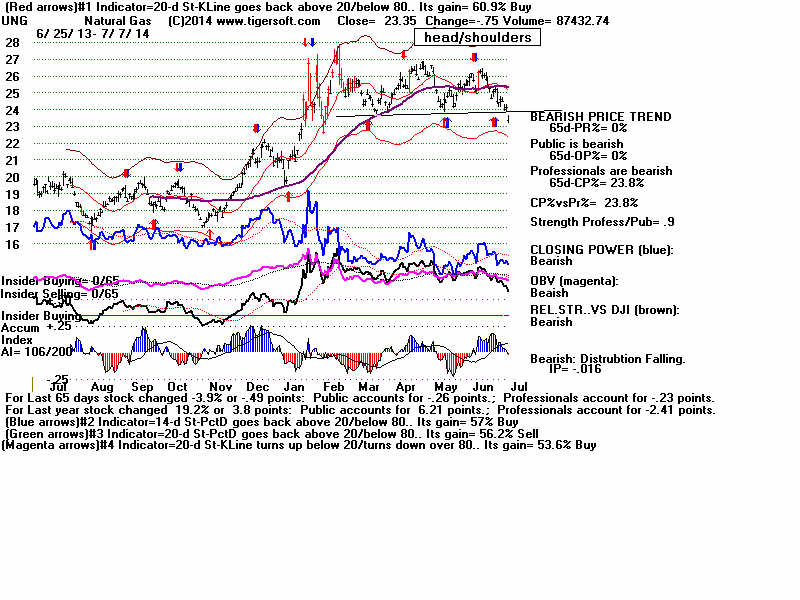
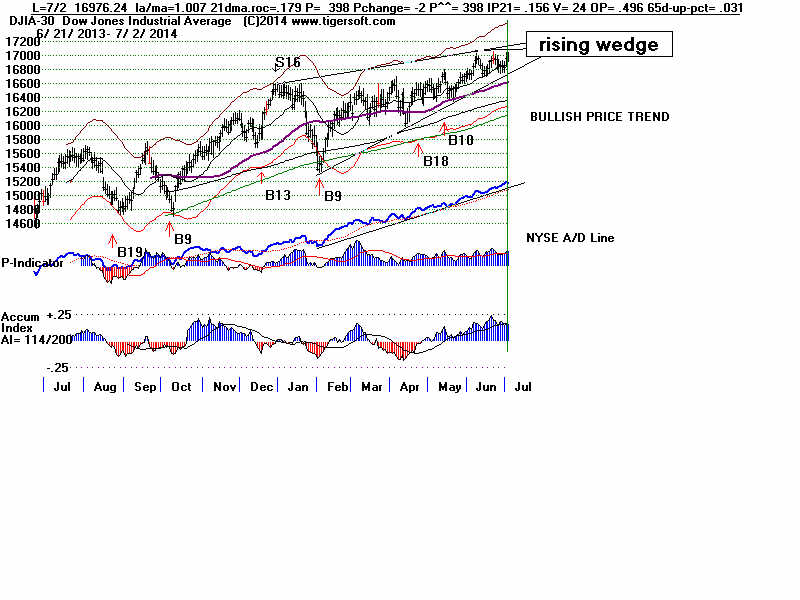
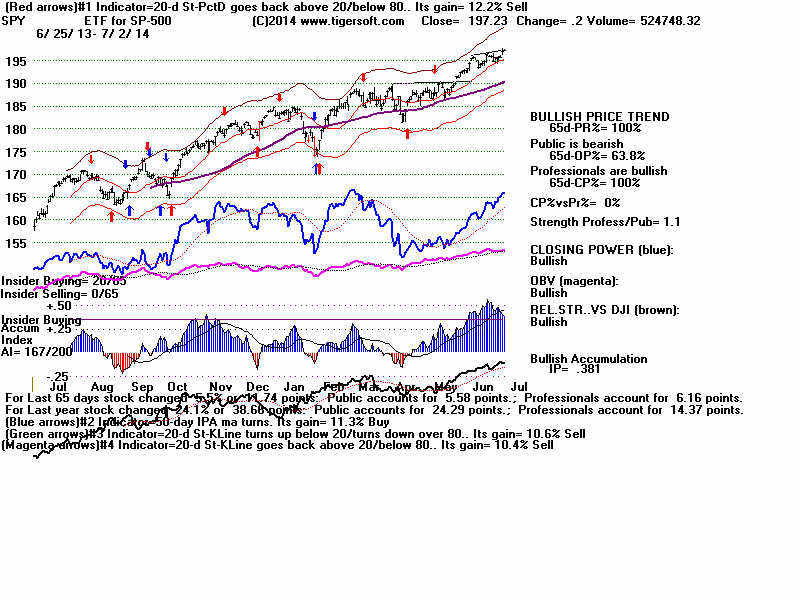
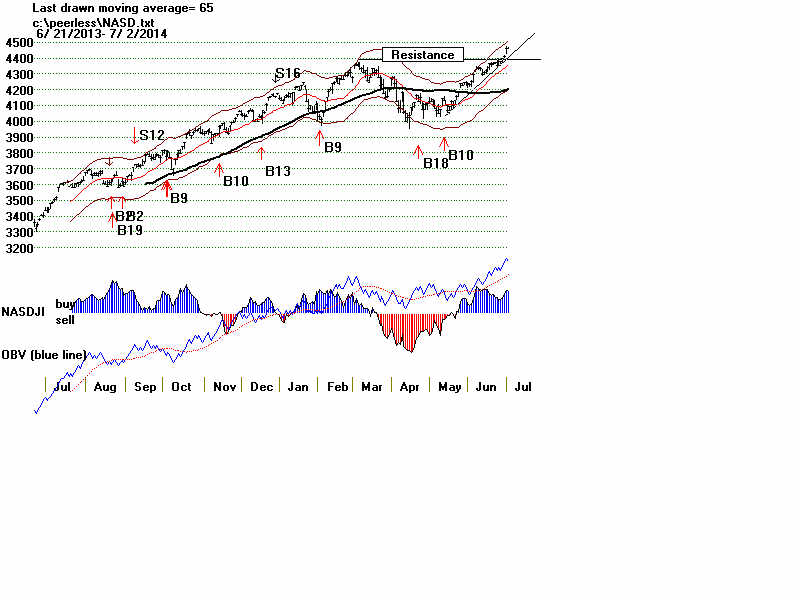
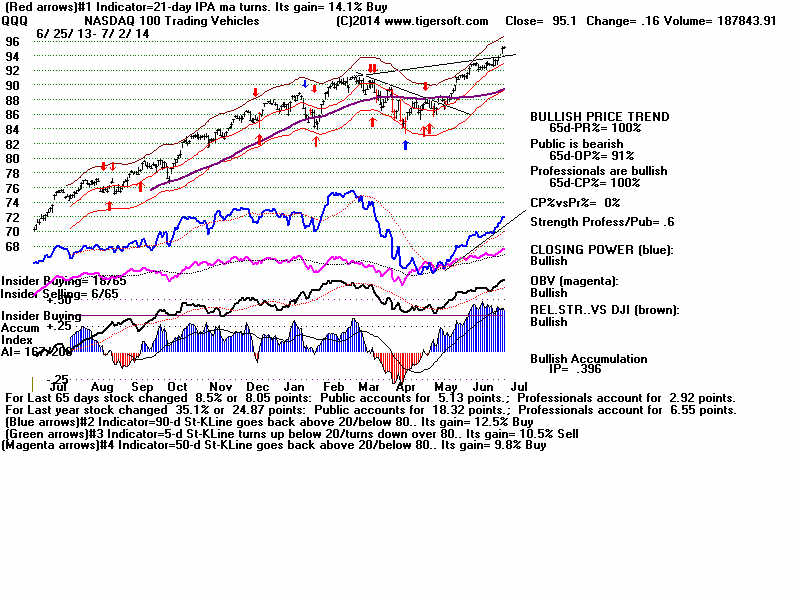
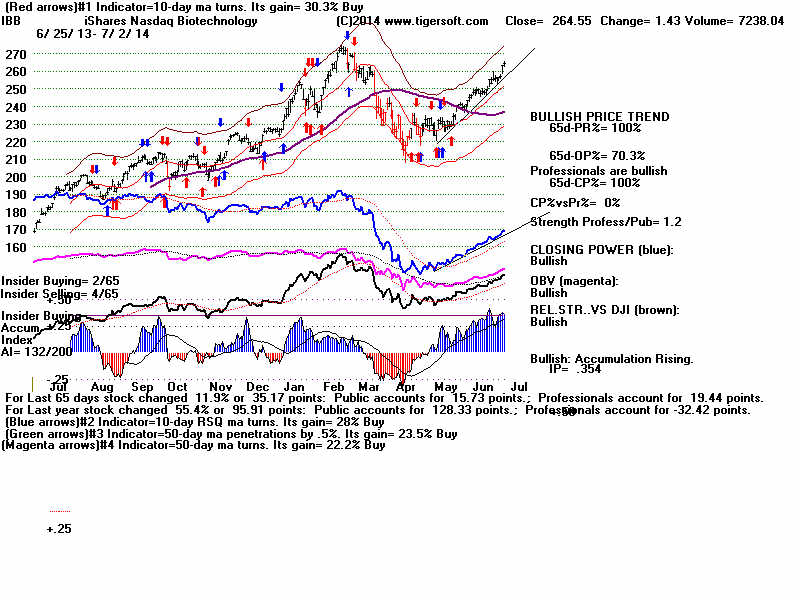
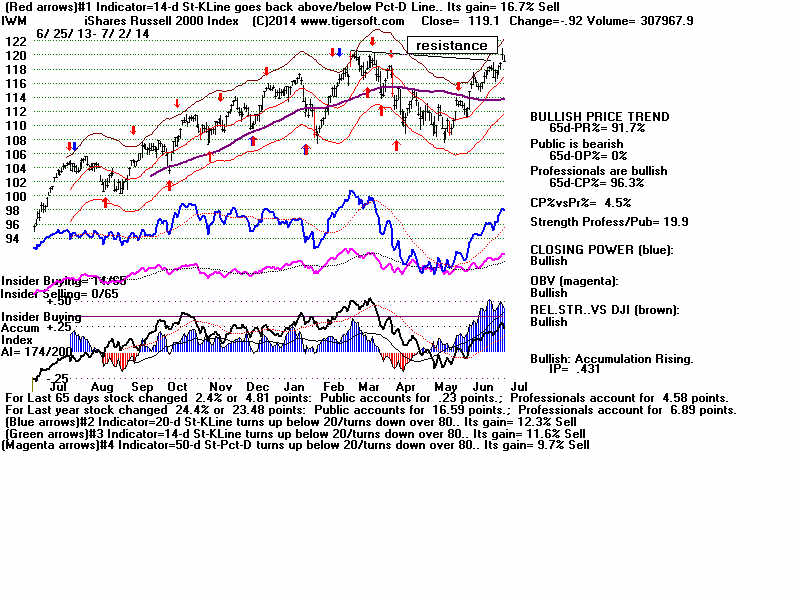
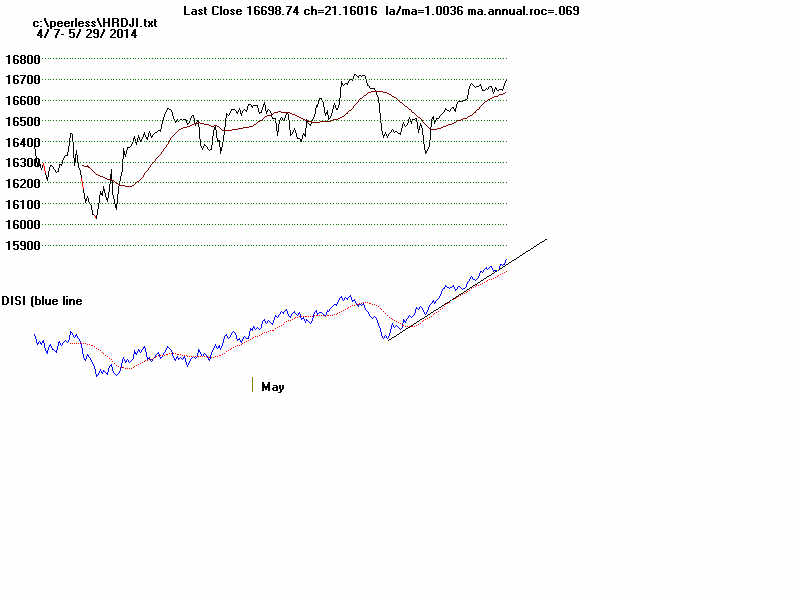
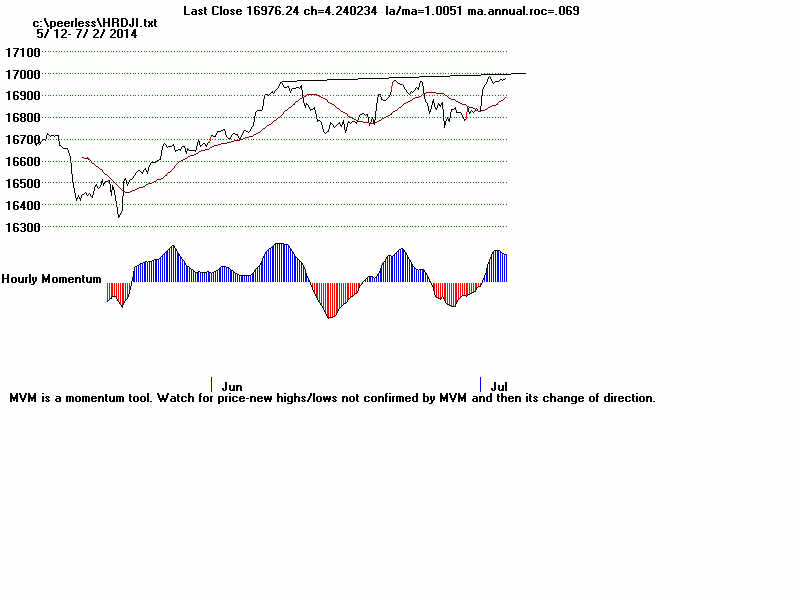
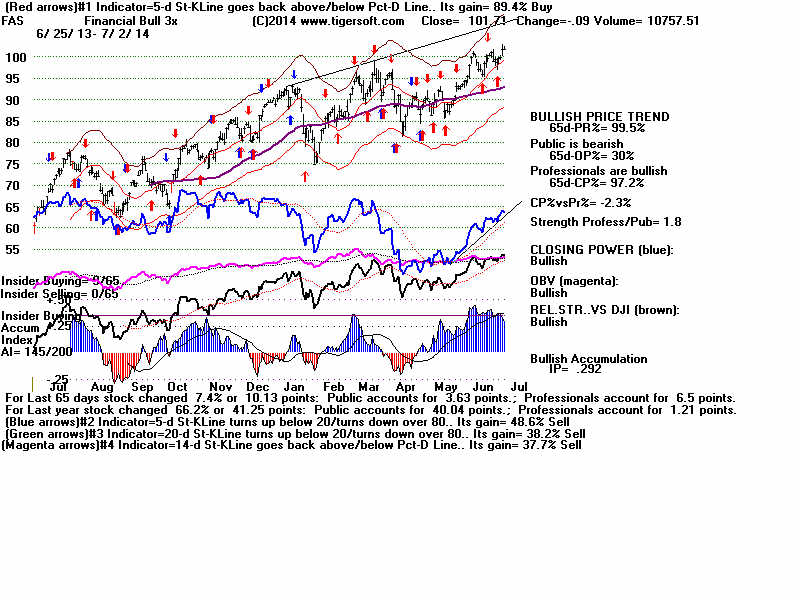
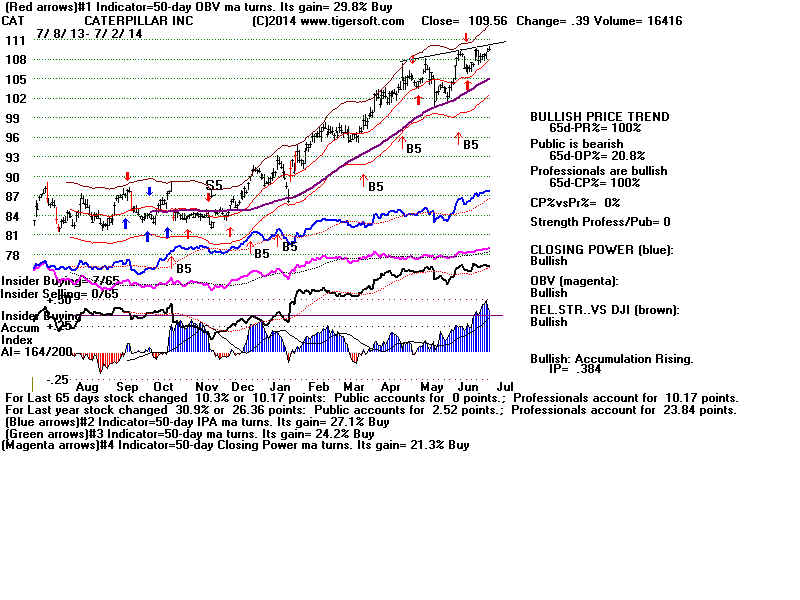
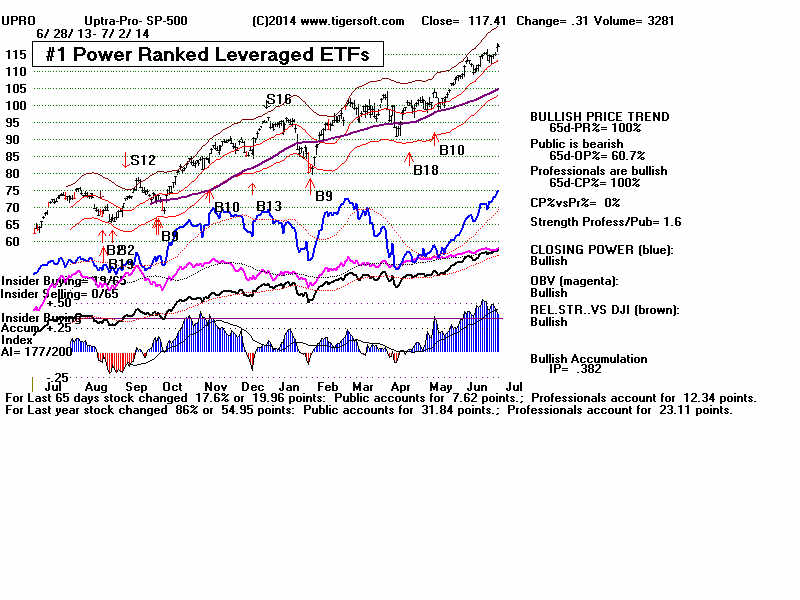
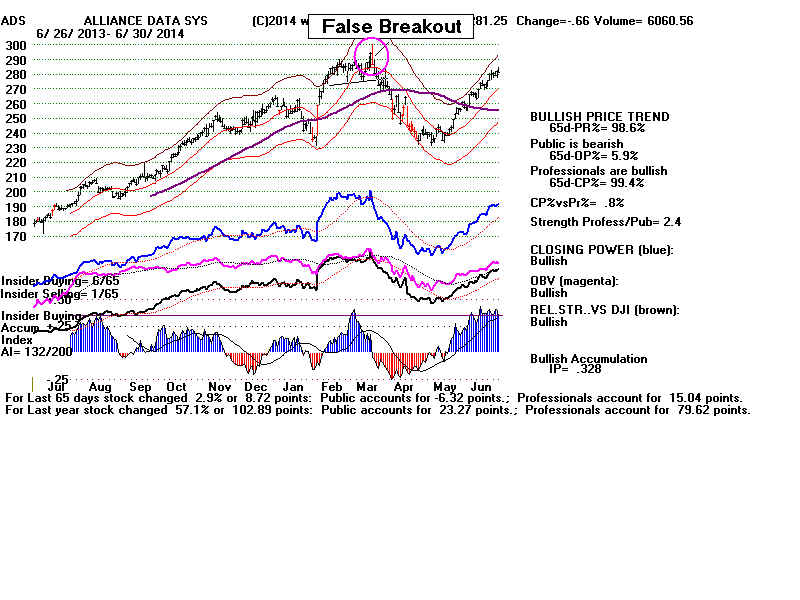
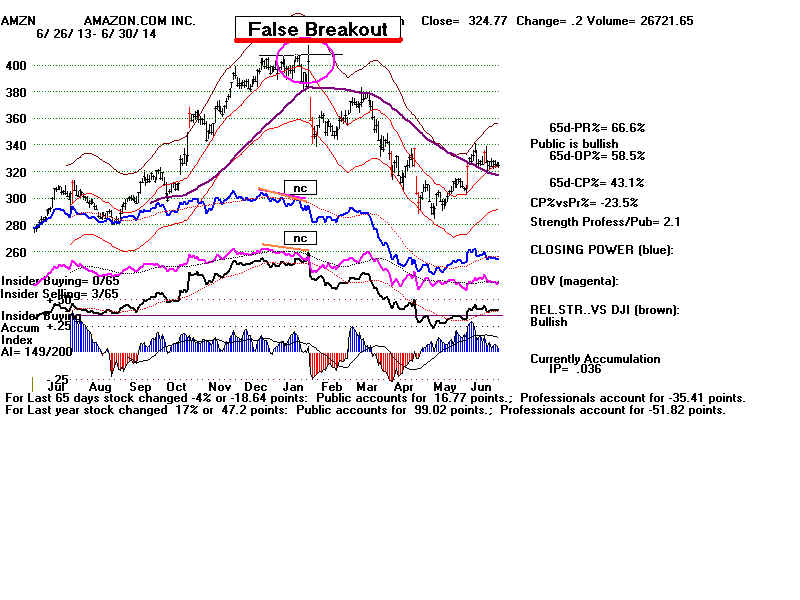
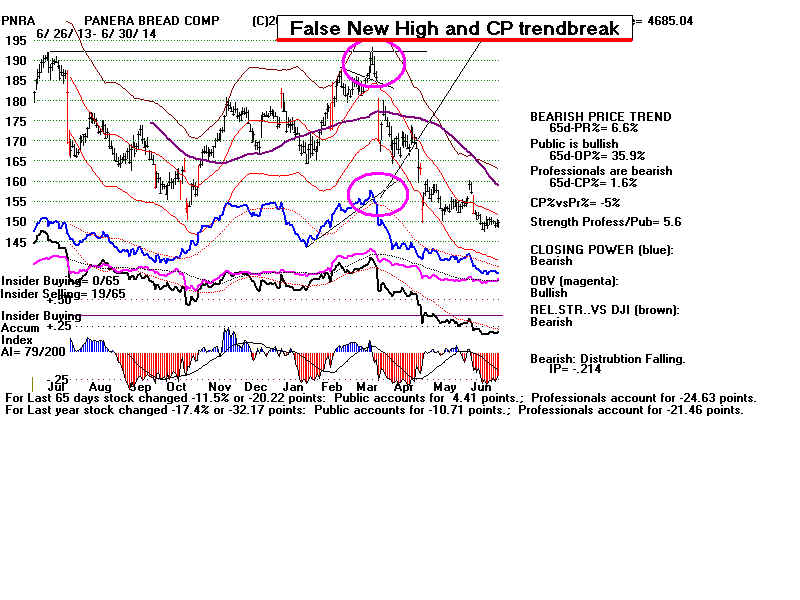
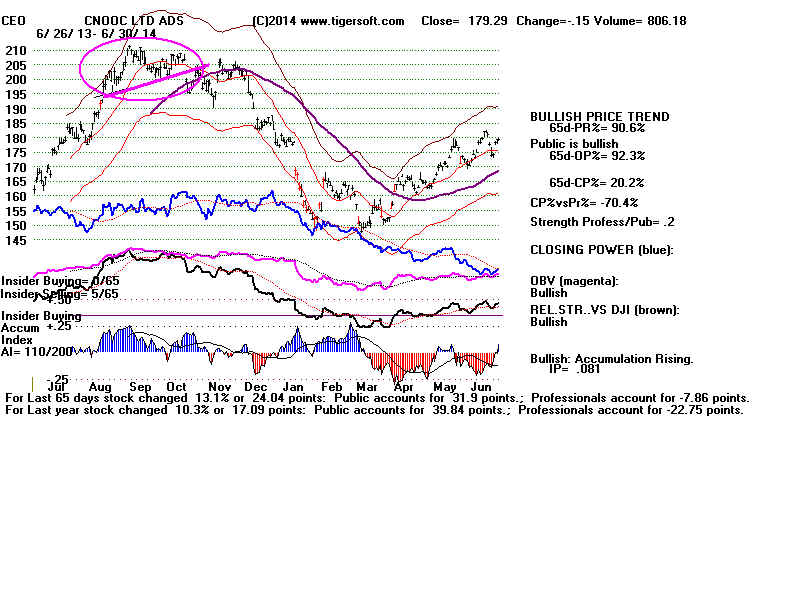
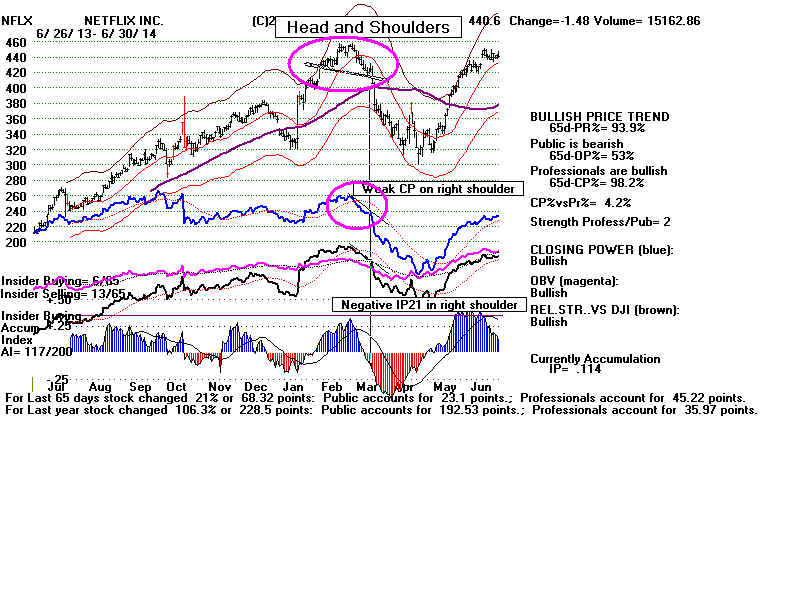
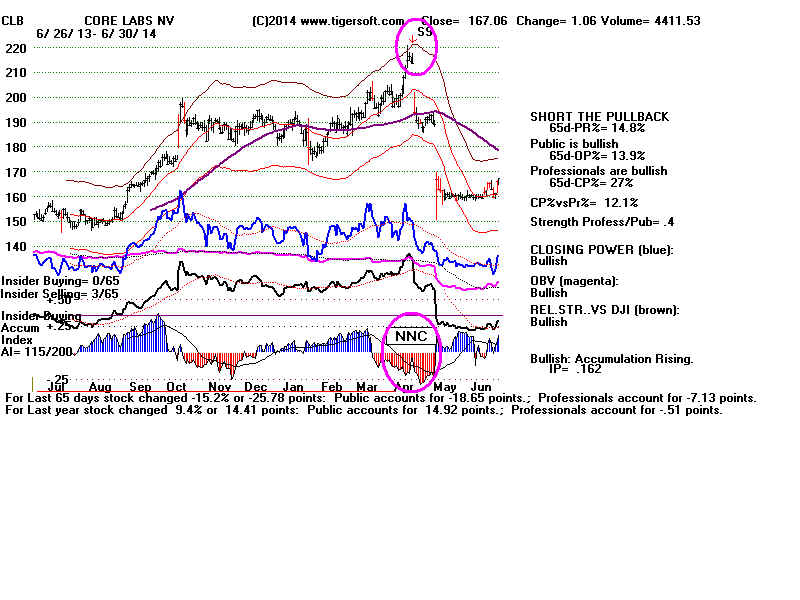
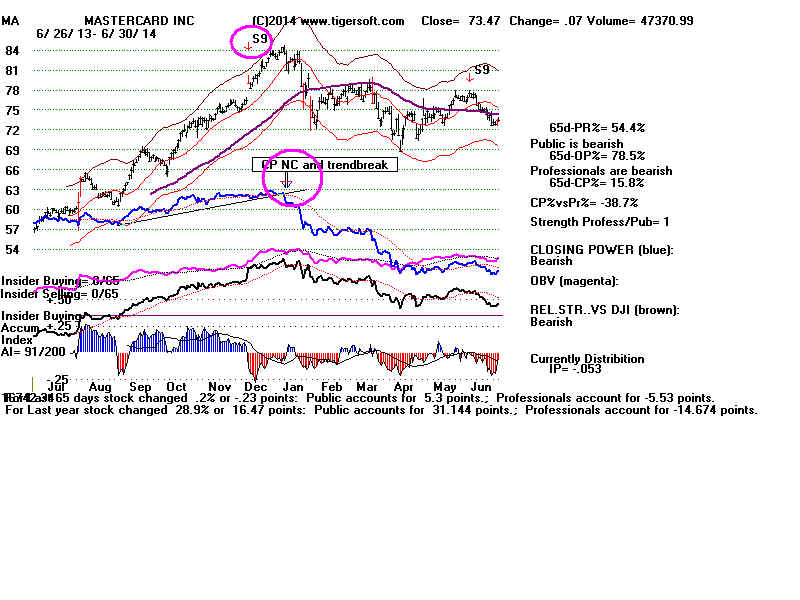
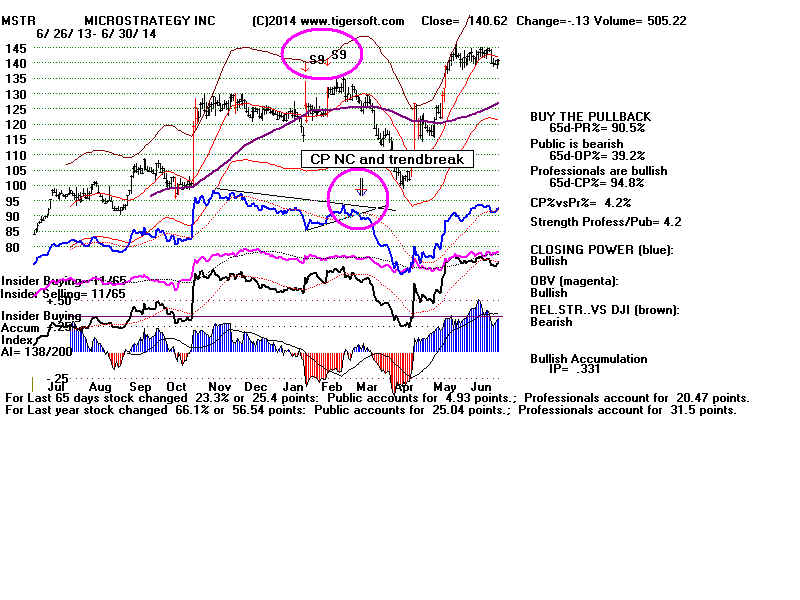
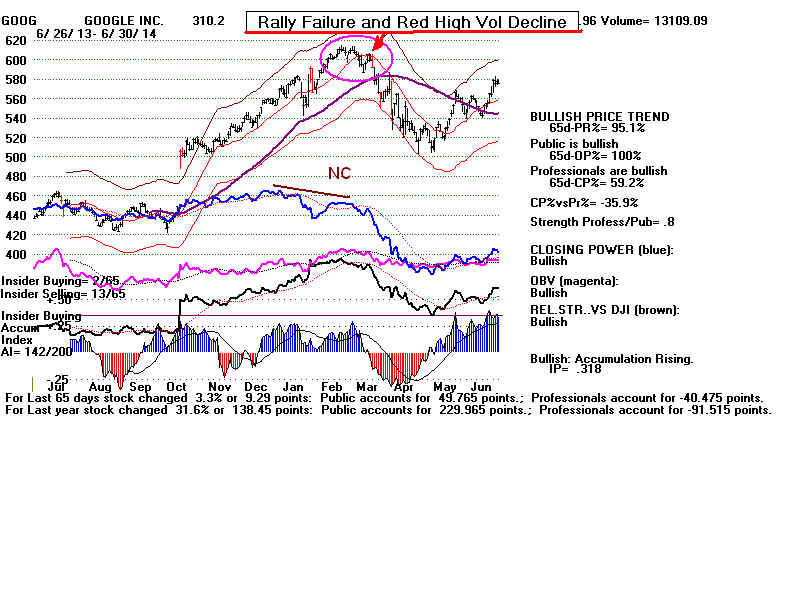
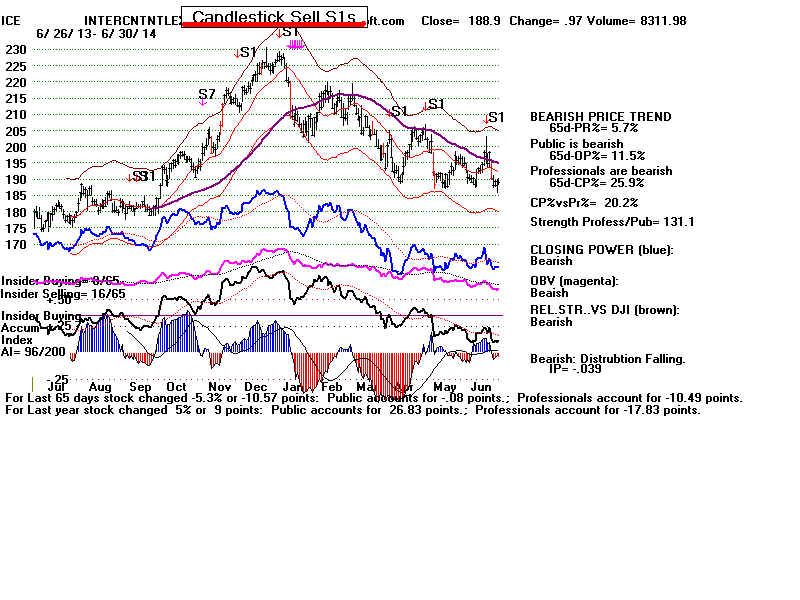
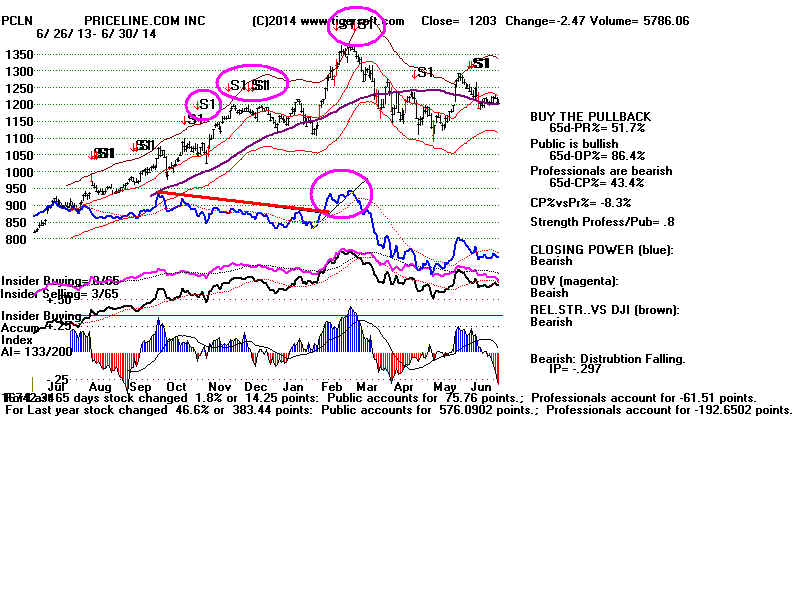
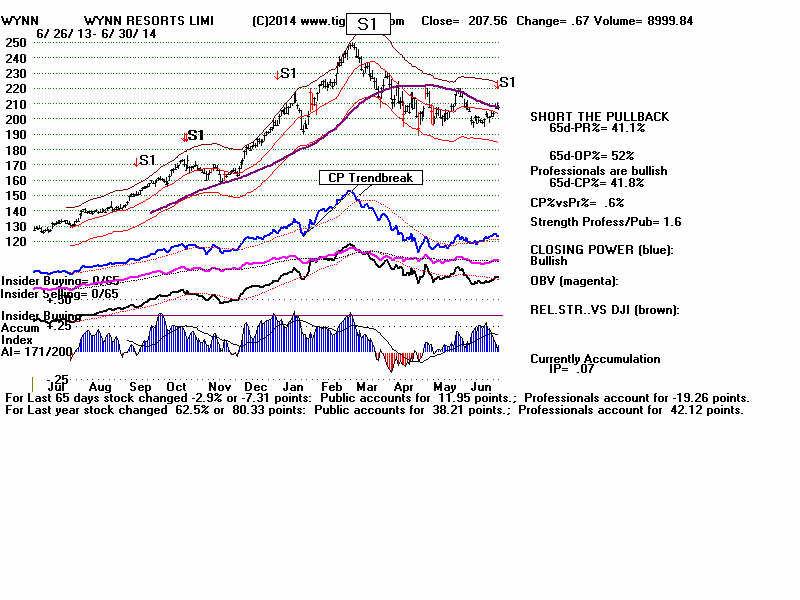
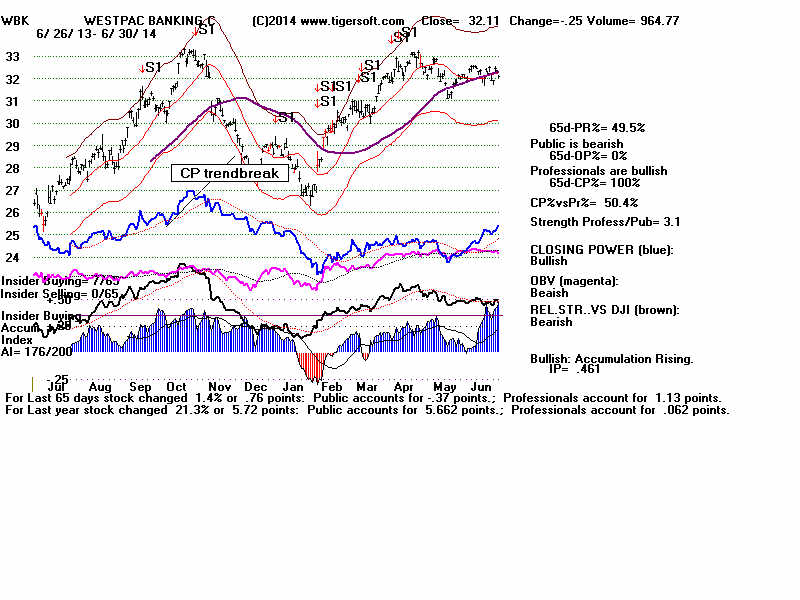
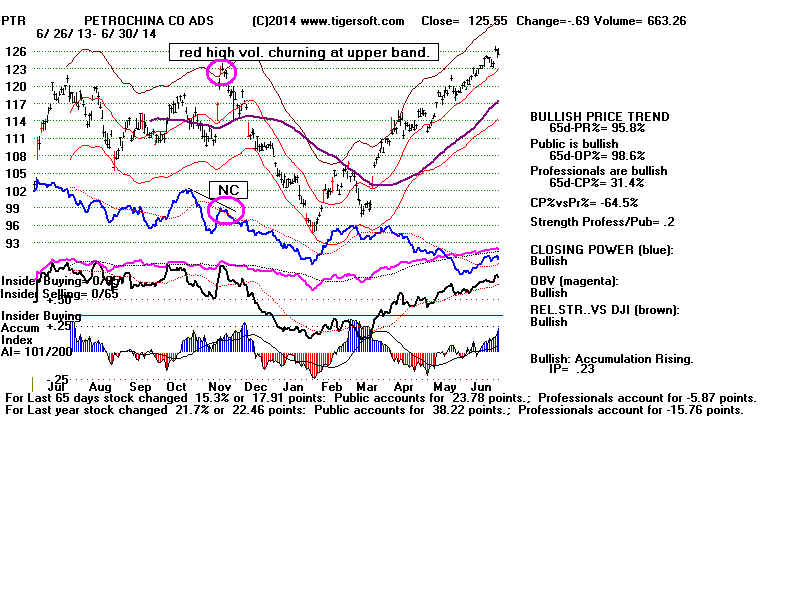
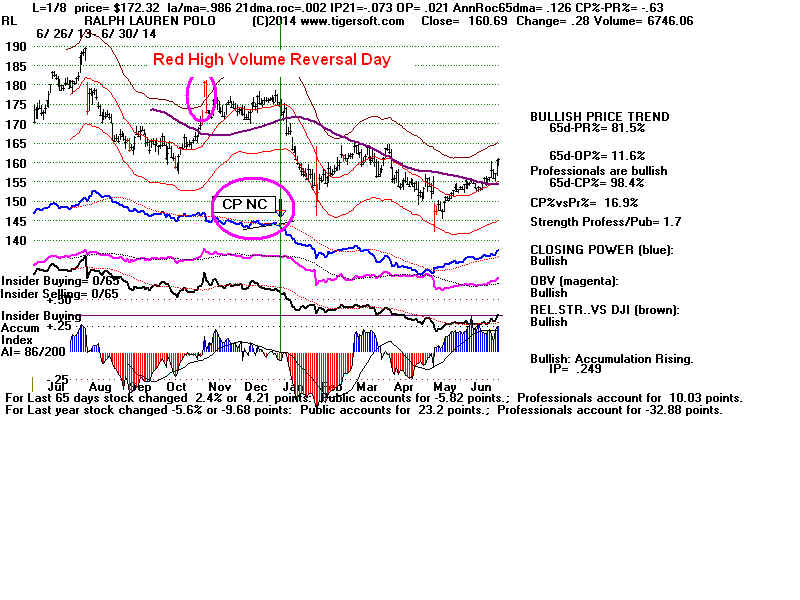
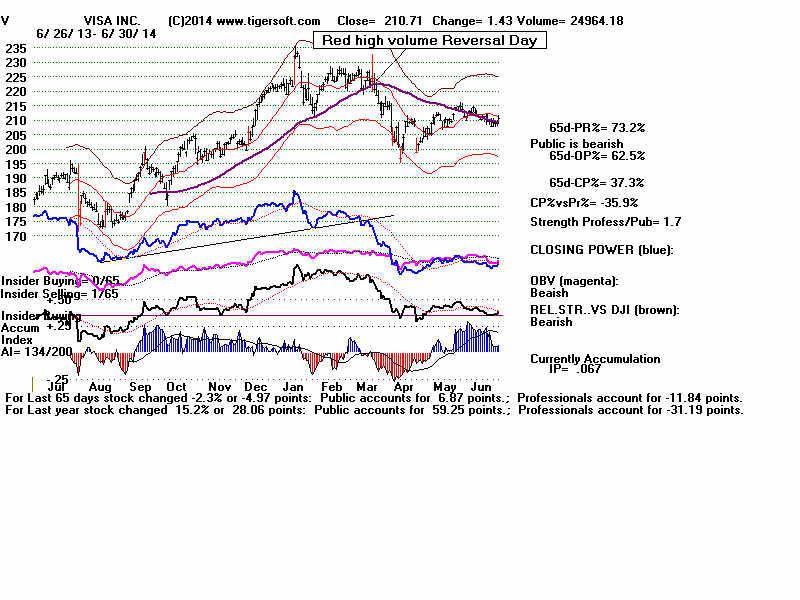
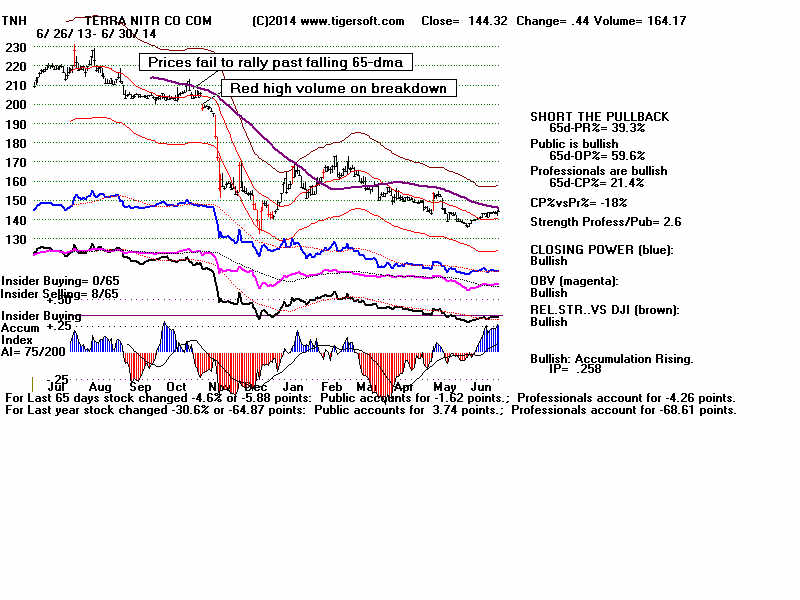
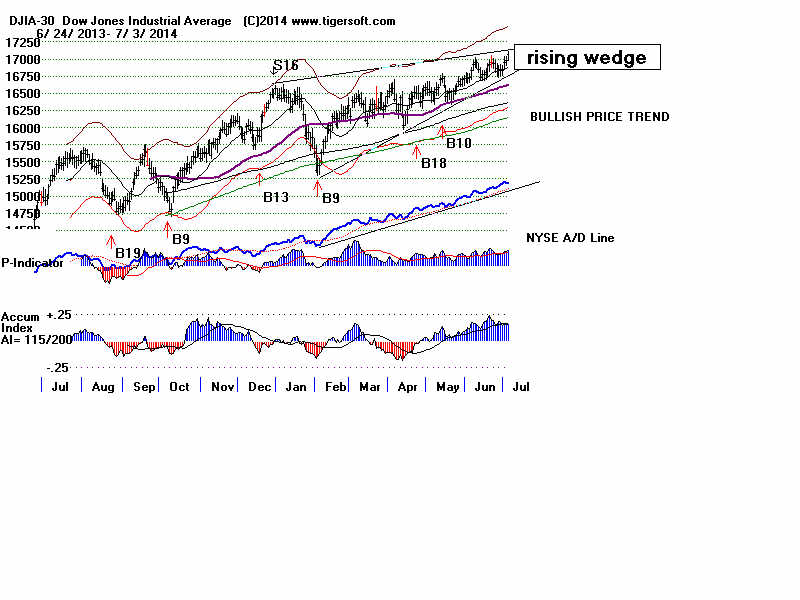
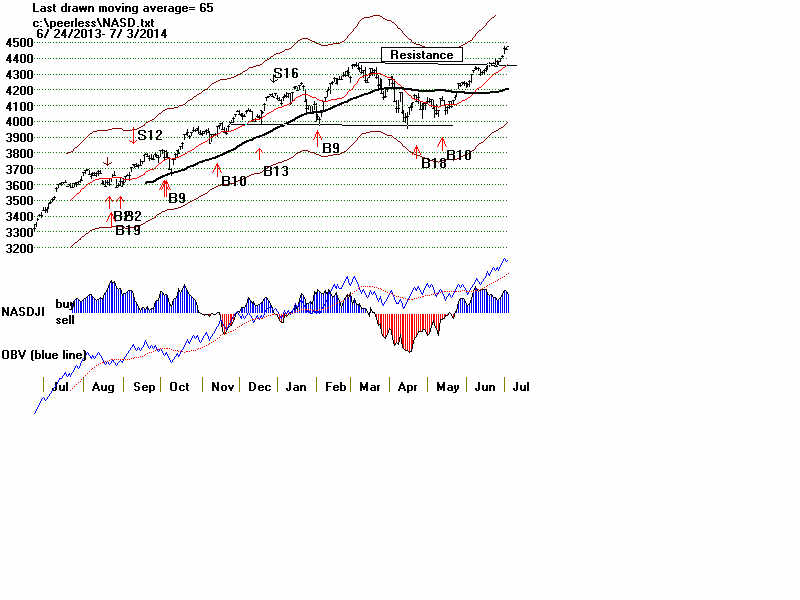
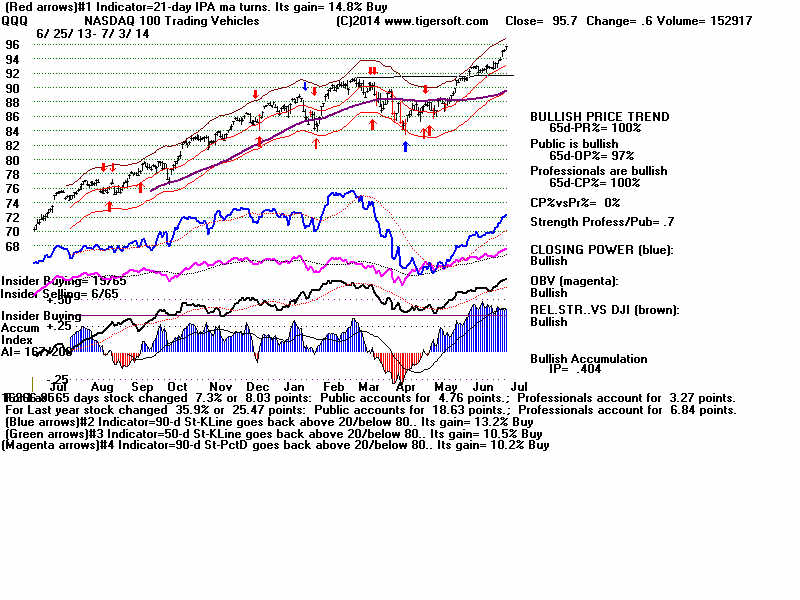
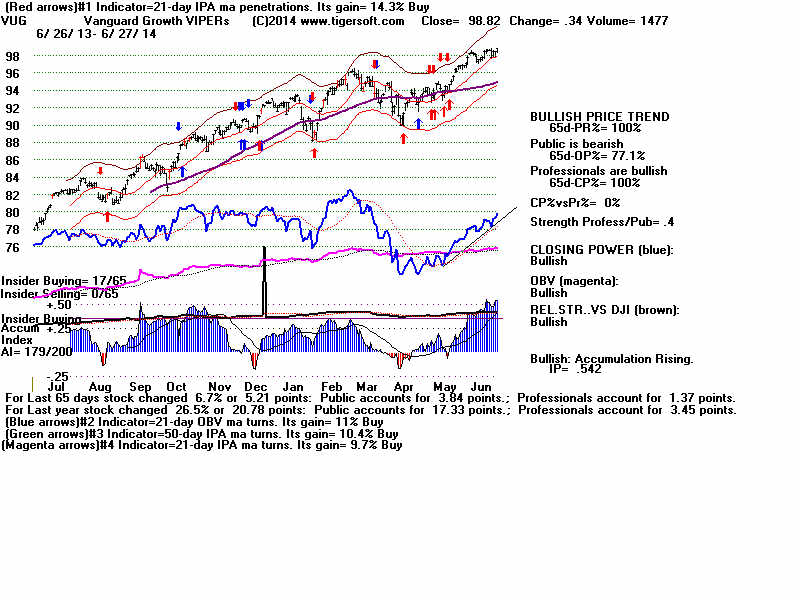
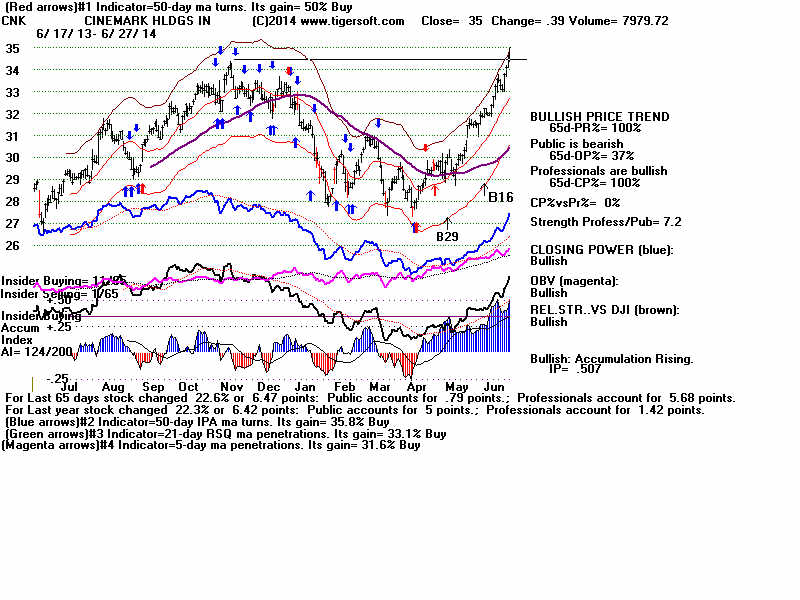
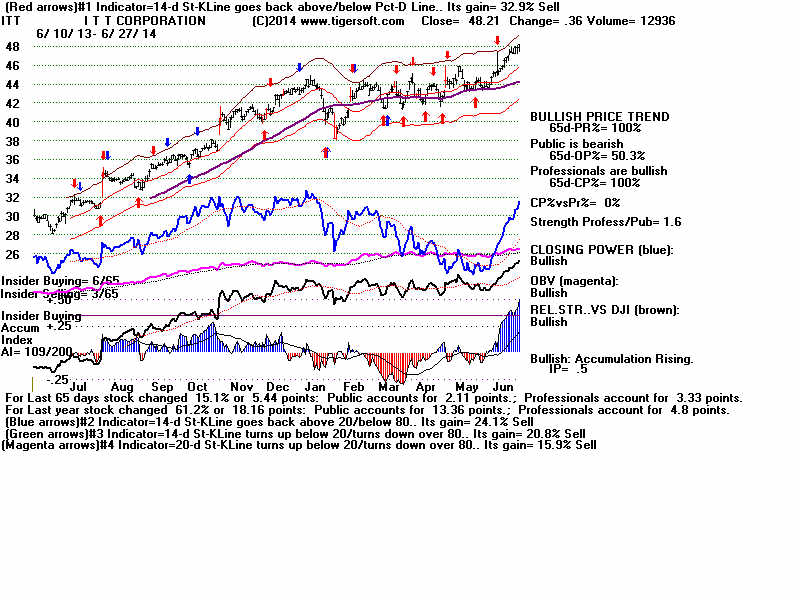
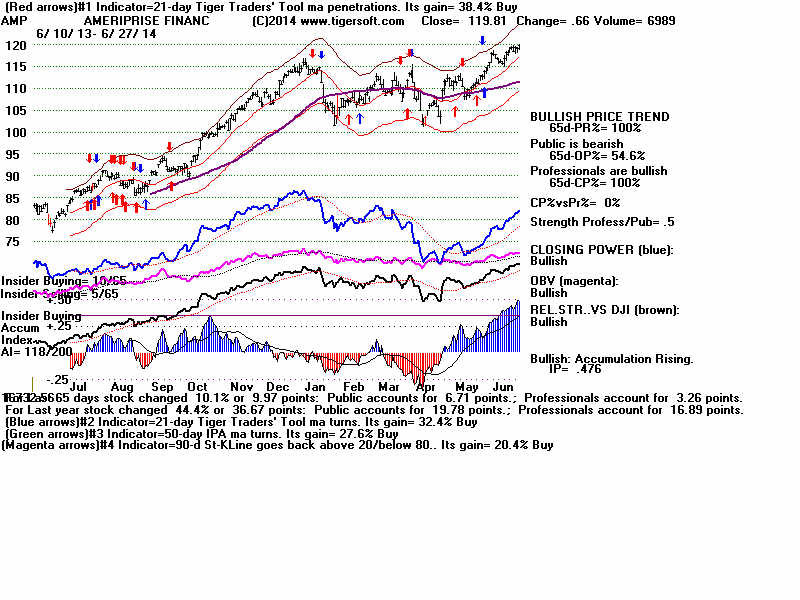
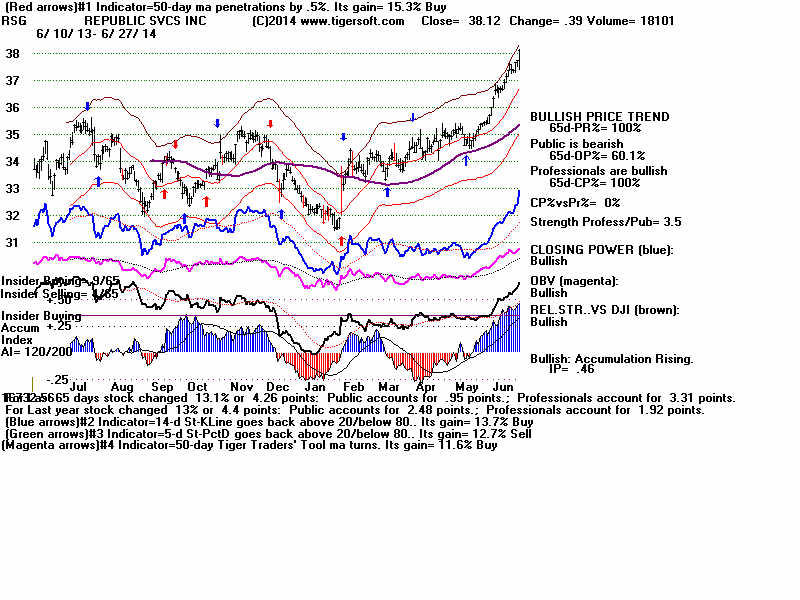
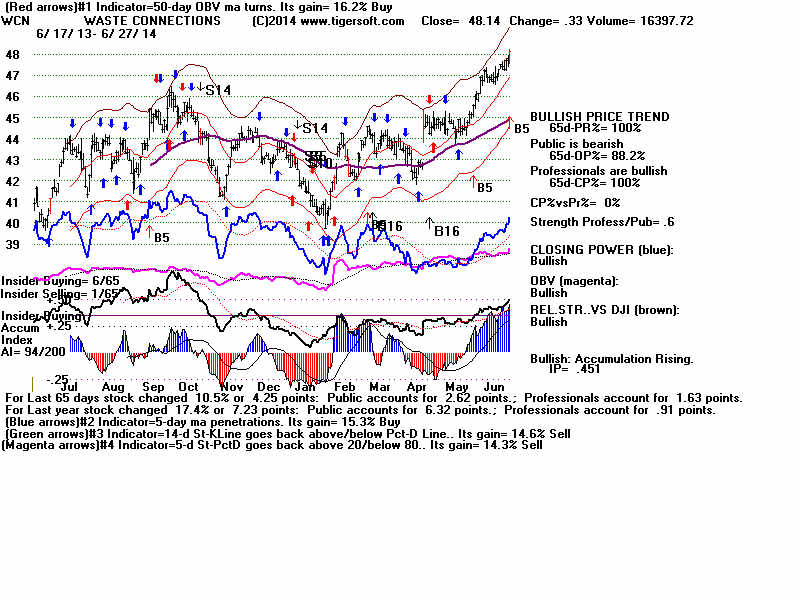
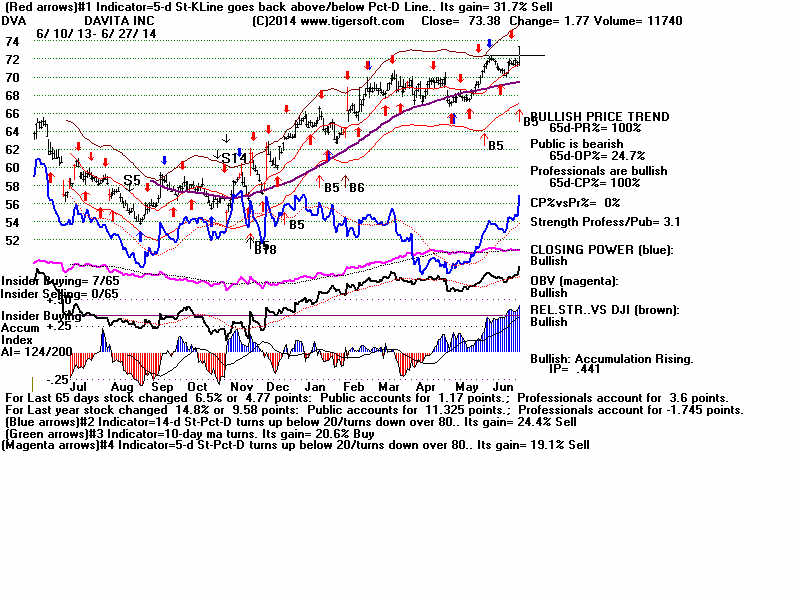
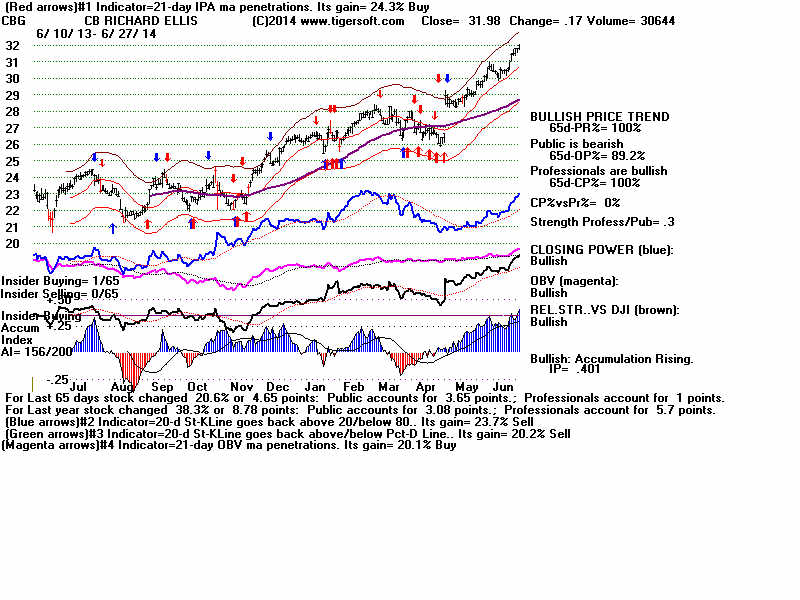
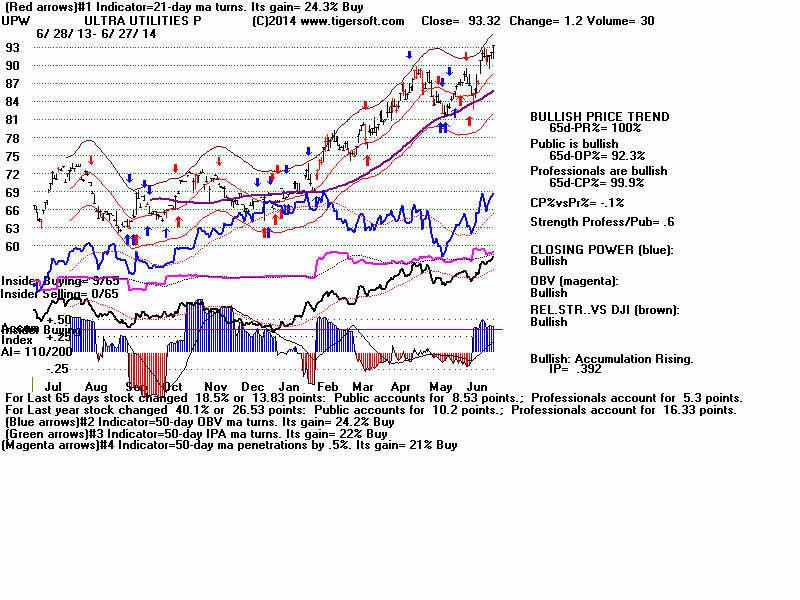
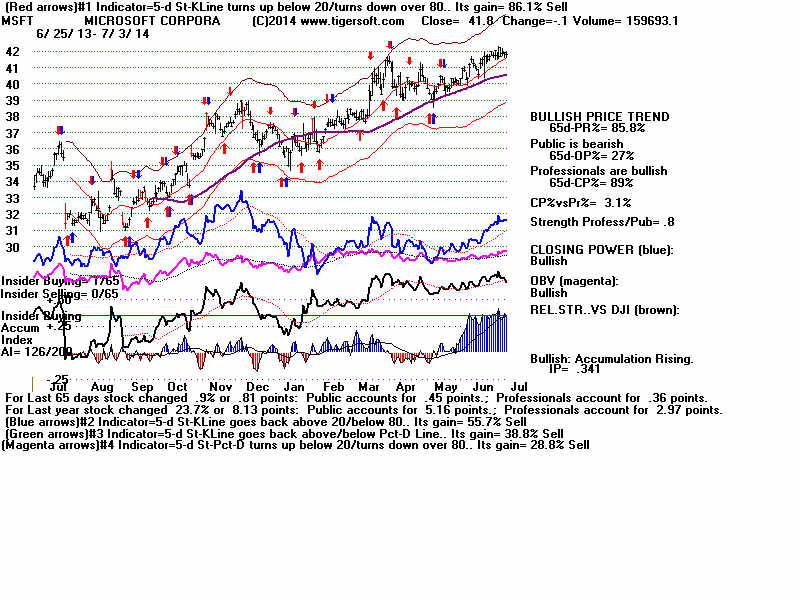
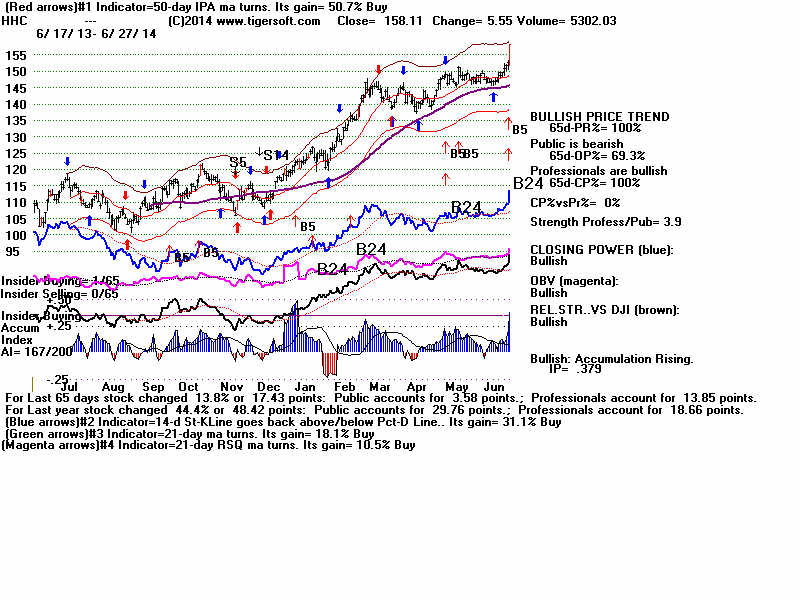
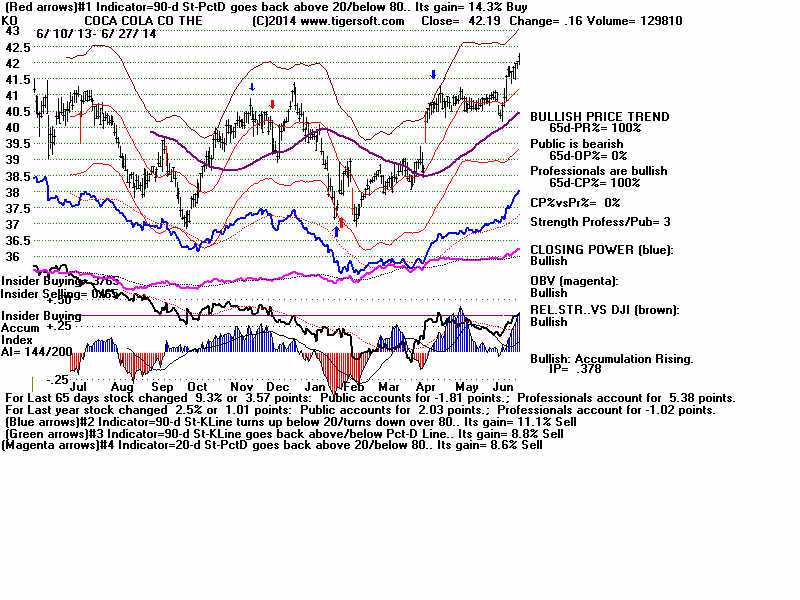
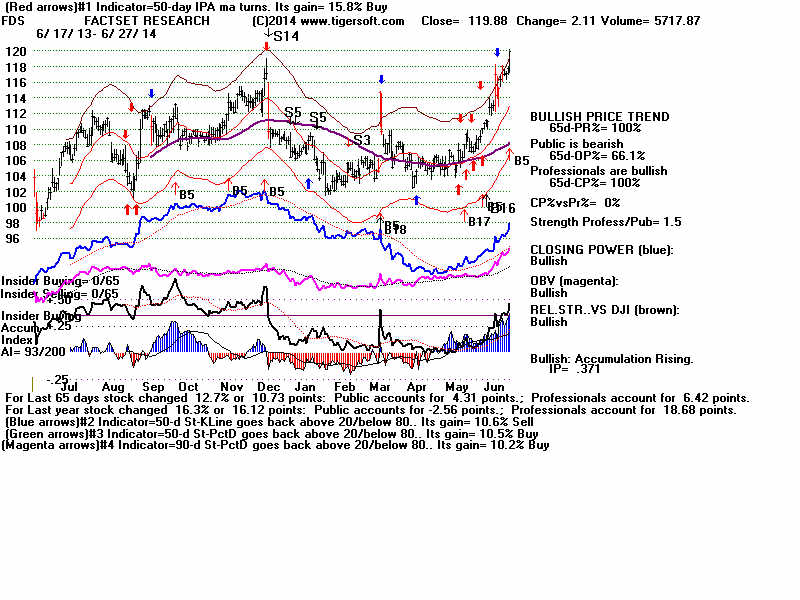
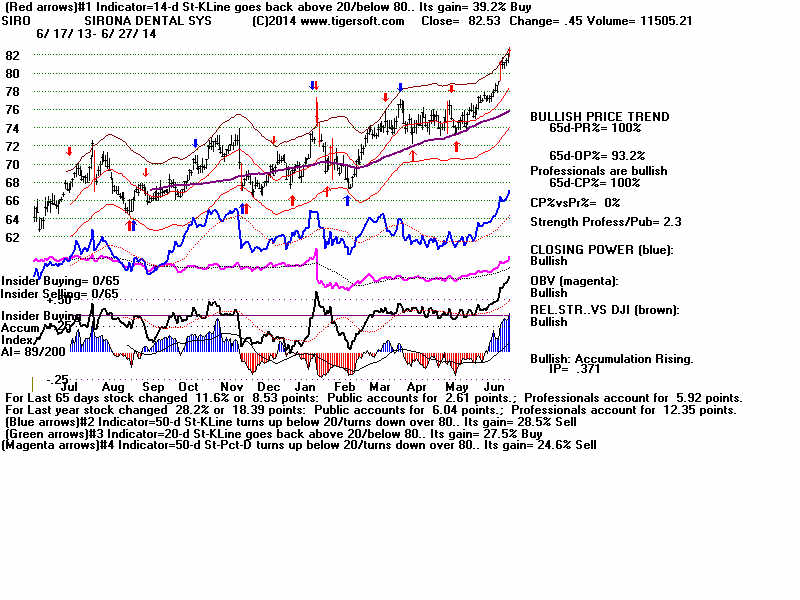
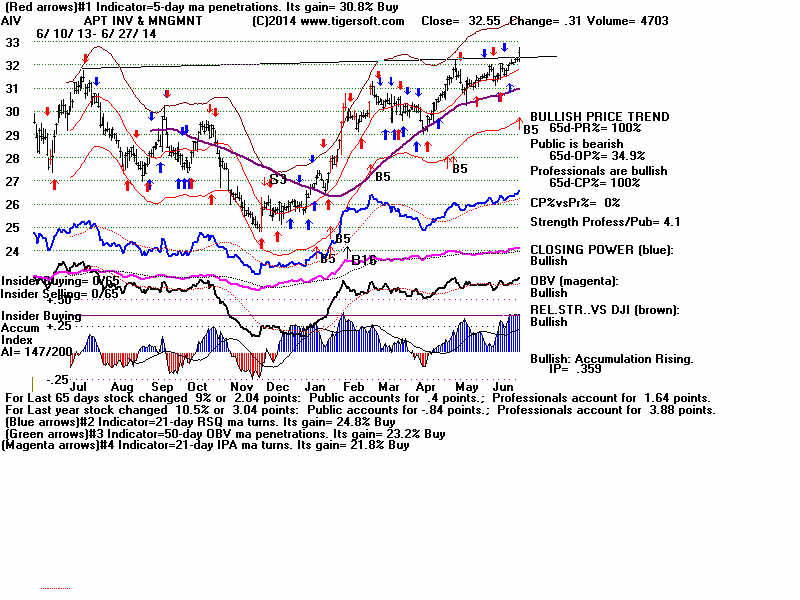
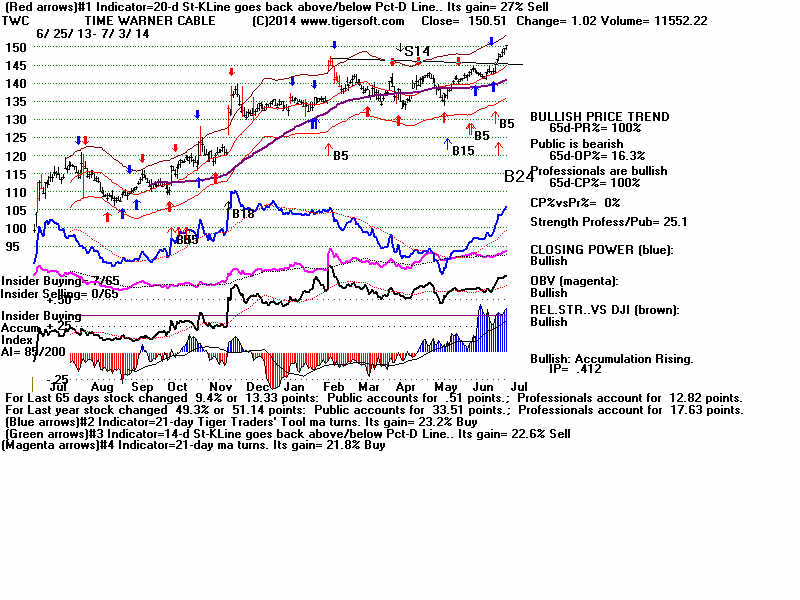
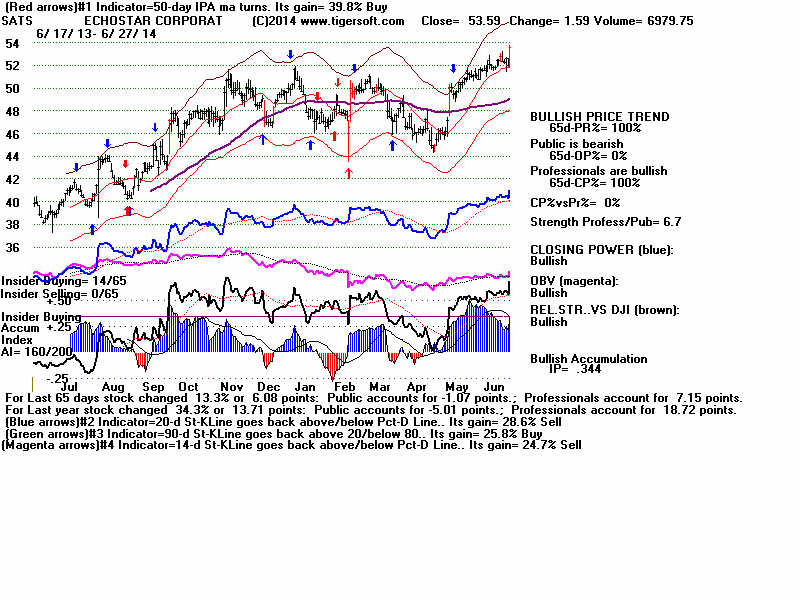
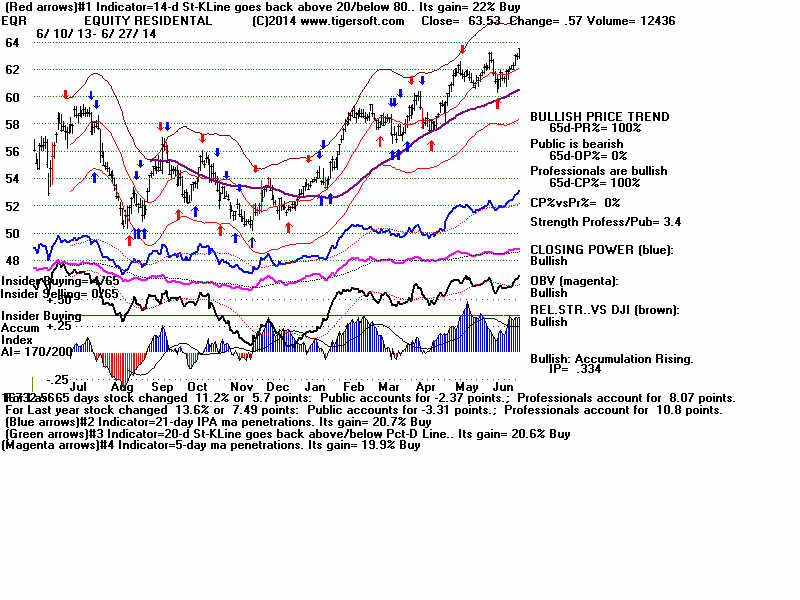
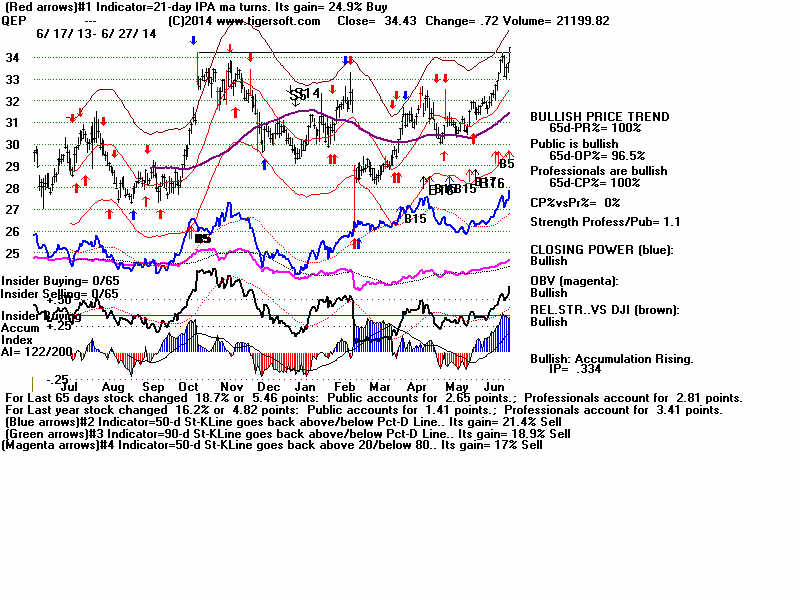
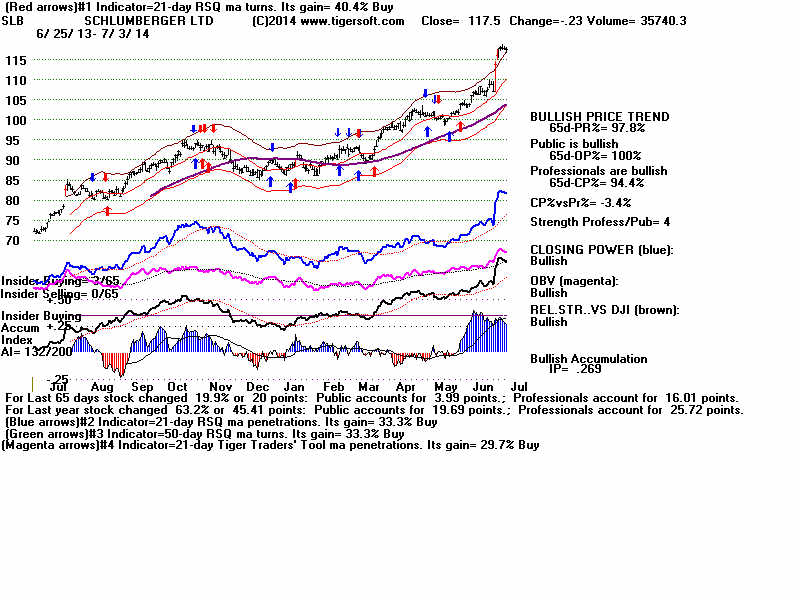
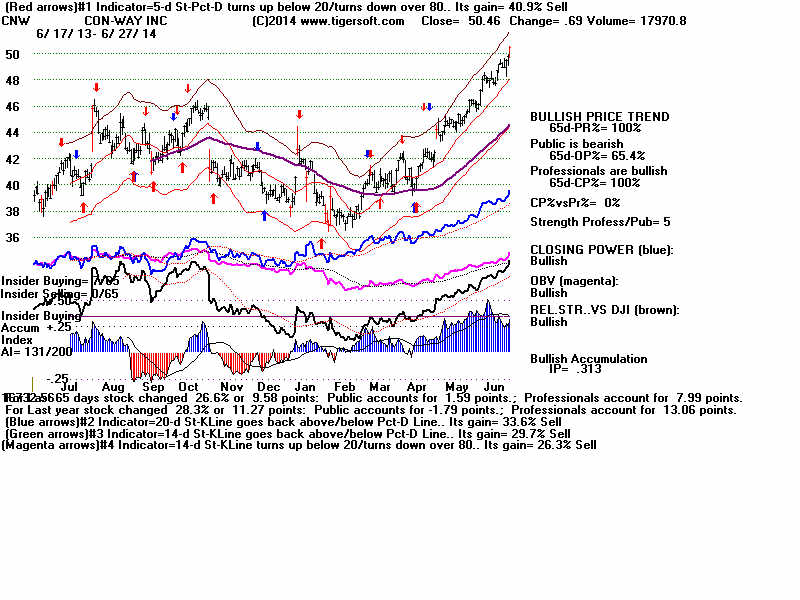
LISTEN TO THIS MAN. No past leader is more aware of the Russian mindset, nor done more to combat it, than Walesa. If Ukranians need arms, a back door, 3rd party deal to have Saudi Arabia or even China supply them would be a heckuva lot safer than going down this rabbit hole with Putin. The EU is smart enough to not get involved - why are so many Americans, with so little to gain, talking about combat and war? WHAT THE HELL IS IT WITH US? Why is every world problem our issue? What OTHER methods to avoid conflict do you think there could be besides MORE CONFLICT? Why even HAVE a State Department is diplomacy, tact and negotiations are never considered?