------------------------------------------------------------------------------------------------------------------------------
Materials
for February 2015 Tiger Software Meeting
(C) 2015 William Schmidt, Ph.D. www.tigersoft.com
-->
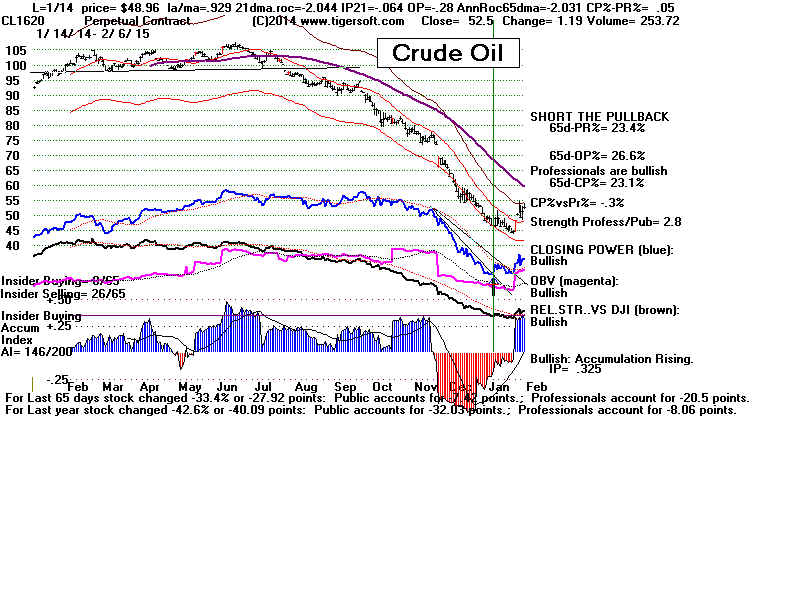
Crude Oil Bottoms.
-->
Reversals by DJI
-------------------------------------------------------------------------------------------------------------------------------
Hi, Tigers!
Let's start February right.
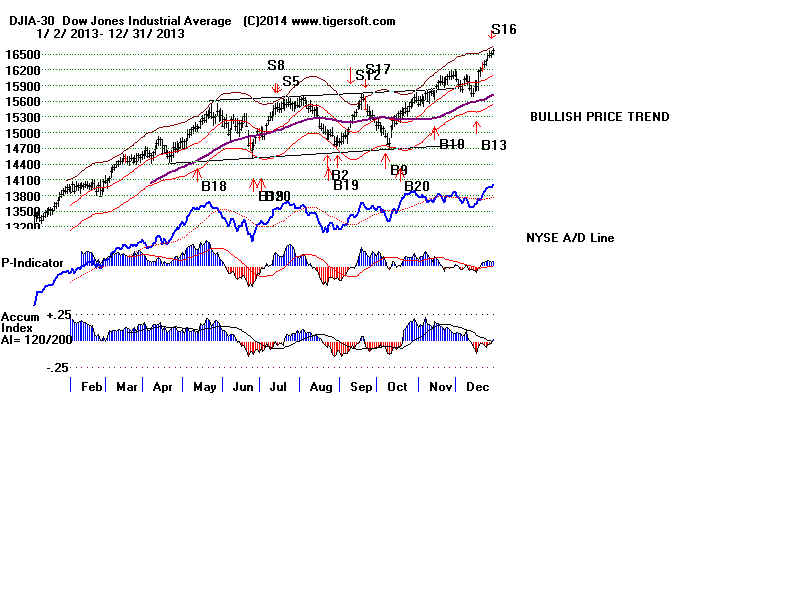
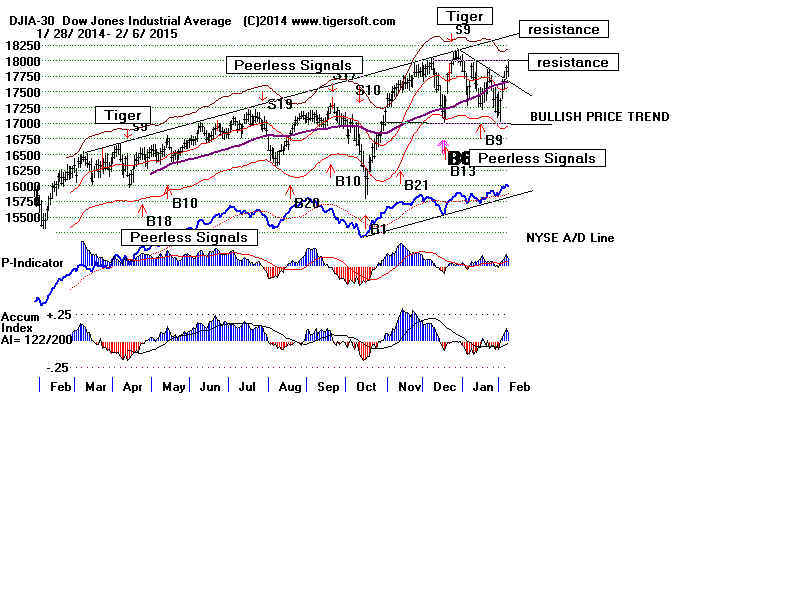
Peerless says the market should go higher with its Buy B9
and rising NYSE A/D Line. It is rare for the market to
turn down without the A/D Line blatantly failing to
keep up with the DJI's advance. And when there is
no such divergence, usually we see a Head/Shoulders
top or the DJI rallies above the 2.1% band with a Accum.
Index negative. That almost happened in December,
but it did not.
February is an up-month 59.2% of the time since 1965.
It averages 0.5%. But in years before a Presidential
Election, in the 21-days after Feb 8th, the DJI is up
83.3% of the time and rises 3.4% on average.
We know years before a Presidential Election, like 2015,
are quite bullish. They have averaged 14%-15% gains. Why?
Because Washington politicians want to keep their cushy jobs
and most voters keep score for at least a couple of years.
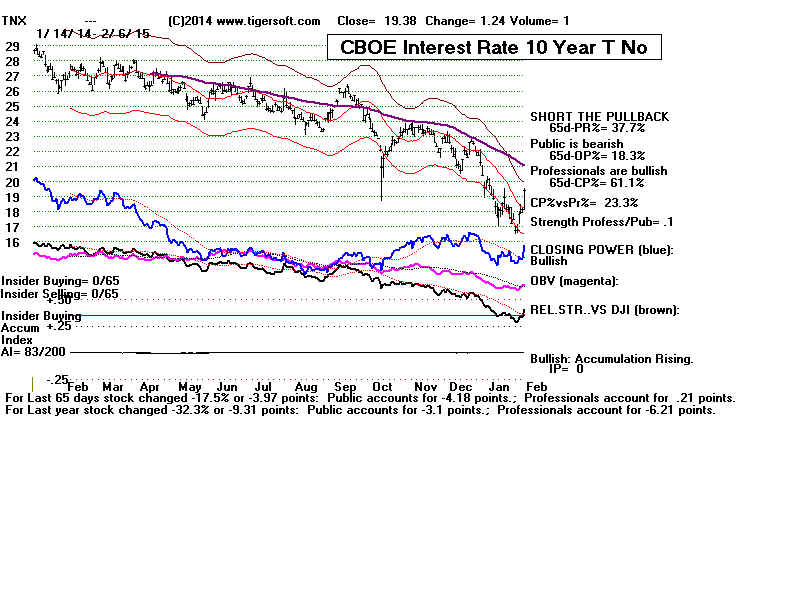
But what if the Fed suddenly
raised rates because wages
are rising faster than productivity and Job Growth is
now expanding too fast? We must keep an eye on
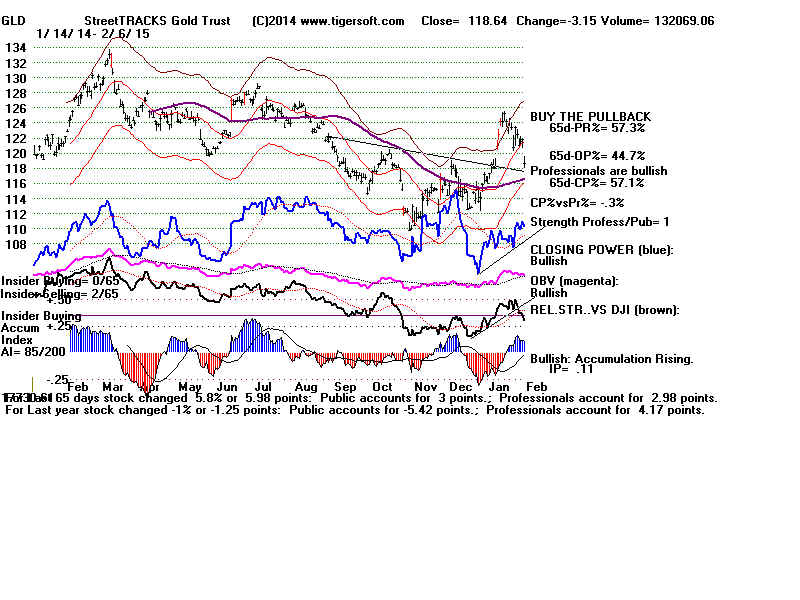
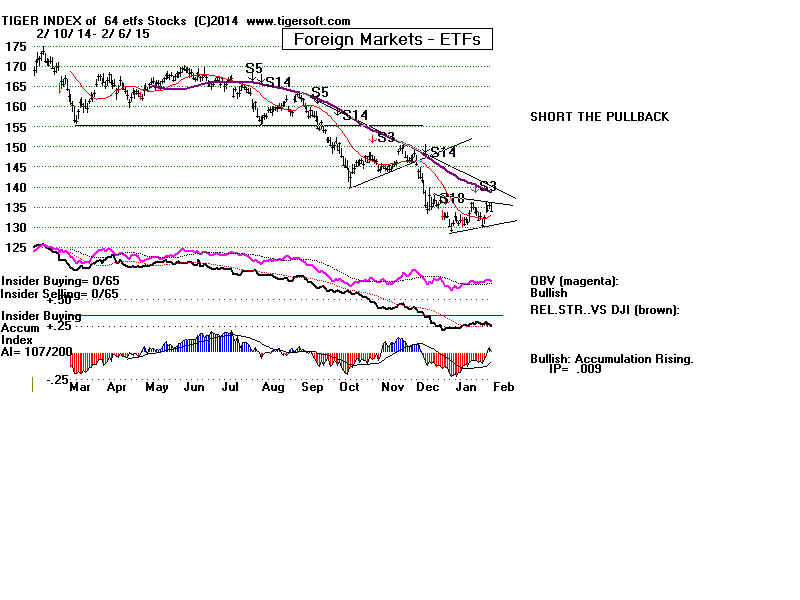
lots of interest rates (TNX), World markets (Foreign ETFs),
Crude Oil and of course Gold. A big rise by Gold very
often leads to Fed tightening and a market top.
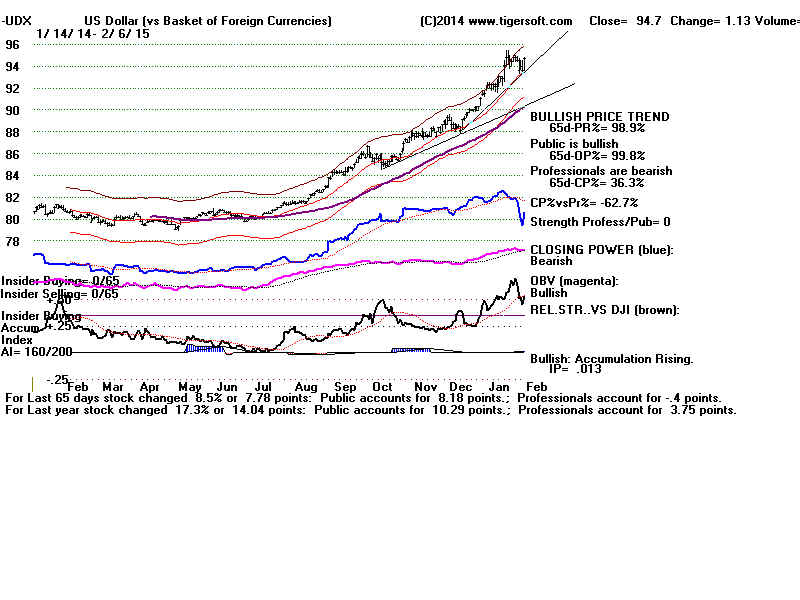
The Jobs numbers were so good, many traders thinks this
guarantees the Fed will raise rates this Summer. That
expectation will dampen the markets ability to rise much
after April, I would think. This is important. A rising Dollar
makes certain groups winners in the stock market
and certain groups losers.
 |
As you know, Peerless is on a Buy B9. Historically, its avg gain
on the DJI is +10% at the time of the of the next Peerless Sell.
Median gain is over 7%. January B9s are particularly bullish
as are B9s in the third year of the -year Presidential cycle.
BREAKDOWN of BUY B9 TRADES: 1929-2014
=====================================
No.  Date        Peerless    DJI      Pct      Paper
                 Signal               Gain     Loss
==========================================================
 1   19340910      B9        89.3     .038     .029
----------------------------------------------------------------------
 2   19341220      B9        99.6     .044     None
----------------------------------------------------------------------
 3   19350531      B9       110.64    .198     None
----------------------------------------------------------------------
 4   19351213      B9       140.2     .114     .009
-----------------------------------------------------------------------
 5   19431108      B9       131.7     .245     .016
-----------------------------------------------------------------------
 6   19431117      B9       130.2     .26      .004
----------------------------------------------------------------------
 7   19431126      B9       131.3     .249     .013
----------------------------------------------------------------------
 8   19440907      B9       143.6     .142     .004
----------------------------------------------------------------------
 9   19440914      B9       142.9     .148     None
----------------------------------------------------------------------
10   19450326      B8       152.3     .077     None
----------------------------------------------------------------------
11   19460225      B9       187.2     .135     .006
----------------------------------------------------------------------
12   19461009      B9       163.1     .126     None
----------------------------------------------------------------------
13   19480920      B9       177.4     .07      .007
----------------------------------------------------------------------
14   19481122      B9       176.3     .022     .029
----------------------------------------------------------------------
15   19481129      B9       172       .048     .004
----------------------------------------------------------------------
16   19481201      B9       173.2     .040     None
----------------------------------------------------------------------
17   19501205      B9       225.4     .15      .003
----------------------------------------------------------------------
18        19550117                 B9                 388.2                .207             None
----------------------------------------------------------------------
19   19581125      B9       540.5     .203     None
----------------------------------------------------------------------
20   19661201      B9       789.95    .124     .005
----------------------------------------------------------------------
21   19670412      B9       844.65    .051     None
----------------------------------------------------------------------
22   19670519      B9       874.55    .063     .031
----------------------------------------------------------------------
23   19740207      B9       828.46    .033     .03
----------------------------------------------------------------------
24   19741009      B9       631.02    .038     None
----------------------------------------------------------------------
25   19750528      B9       817.04    .058     .002
----------------------------------------------------------------------
26   19751209      B9       824.15    .225     None
----------------------------------------------------------------------
27   19761005      B9       966.76    .018     .046
----------------------------------------------------------------------
28   19771206      B9       806.91   -.017     .017
----------------------------------------------------------------------
29   19780223      B9       750.95    .154     None
----------------------------------------------------------------------
30   19781218      B9       787.51    .125     None
----------------------------------------------------------------------
31   19790206      B9       822.85    .077     .008
----------------------------------------------------------------------
32   19801028      B9       932.59    .058     .016
----------------------------------------------------------------------
33   19811023      B9       837.99    .04      .008
----------------------------------------------------------------------
34   19820930      B9       896.25    .179     None
---------------------------------------------------------------   -------
35   19821123      B9       990.99    .067     None
----------------------------------------------------------------------
36        19830124                 B9                 1030.17            .207              None
----------------------------------------------------------------------
37        19860122                 B9               1502.29              .215             None
----------------------------------------------------------------------
38   19860407      B9      1735.51    .052     None
----------------------------------------------------------------------
39   19860711      B9      1821.43    .008     .029
----------------------------------------------------------------------
40   19861118      B9      1817.21    .324     None
----------------------------------------------------------------------
41        19880108                 B9               1911.31              .059             None
----------------------------------------------------------------------
42        19880122                 B9               1903.51              .063             None
----------------------------------------------------------------------
43   19880325      B9      1978.95    .056     None
----------------------------------------------------------------------
44   19930921      B9      3537.23    .122     None
----------------------------------------------------------------------
45         19960110                B9               5032.94              .103             None
----------------------------------------------------------------------
46   19960410      B9      5485.98    .048     None
----------------------------------------------------------------------
47   19960507      B9      5420.95    .06      None
----------------------------------------------------------------------
48   19961213      B9      6304.87    .087     .005
----------------------------------------------------------------------
49   19970911      B9      7660.98    .034     None
----------------------------------------------------------------------
50   19971219      B9      7756.29    .183     .012
----------------------------------------------------------------------
51   19981001      B9      7632.53    .459     None
----------------------------------------------------------------------
52   19990524      B9     10654.67    .045     .011
----------------------------------------------------------------------
53   20001124      B9     10470.23    .042     .014
----------------------------------------------------------------------
54   20001220      B9     10318.93    .058     None
----------------------------------------------------------------------
55   20010323      B9      9504.78    .183     None
----------------------------------------------------------------------
56   20011101      B9      9263.9     .092     None
----------------------------------------------------------------------
57   20020918      B9      8172.45    .074     .121
----------------------------------------------------------------------
58   20021209      B9      8473.41    .035     .02
----------------------------------------------------------------------
59   20021216      B9      8627.4     .017     .038
----------------------------------------------------------------------
60   20041014      B9      9894.45    .103     .014
----------------------------------------------------------------------
61   20041022      B9      9757.81    .118     None
----------------------------------------------------------------------
62   20050624      B9     10297.84    .124     .008
----------------------------------------------------------------------
63   20060718      B9     10799.23    .148     None
----------------------------------------------------------------------
64   20081223      B9      8419.49    .063     None
----------------------------------------------------------------------
65   20111121      B9     11547.31    .048     .028
----------------------------------------------------------------------
66   20131007      B9     14936.24    .105     .01
----------------------------------------------------------------------
Total                     N0.= 64     .108      .009
        Returns by Size of Gain
        -----------------------
               No.        Pct.of Total
=>.10          30            .455
=>.05 - <.10   18            .273
=>.02 - <.05   14            .212
=>0   - <.02   3             .045
<0             1             .015
--------------------------------------
Total          66           1.0  (100%)
        Returns by Year
        ---------------
                             No.           Avg.Gain     Pct.of Total
Pres. Election Years         20            .07           .303
Year after Pres.El.Yr.       10            .094         .152
Mid-Term Election Yr.        22            .124          .333
Year before Pres.El.Yr.      14            .146          .212
----------------------------------------------------------------------
              Total          66            .108          1.0  (100%)
         Returns by Month
         ----------------
               No.        Avg.Gain        Pct.of Total
January        6             .142           .091
February       4             .099          .061
March          3             .103          .045
April          3             .05           .045
May            5             .084          .076
June           1             .123          .015
July           2             .077          .030
August         0             0             0
September      8             .1            .121
October        9             .118          .136
November       11            .145          .167
December       14            .089          .212
--------------------------------------------------------
Total          66            .108          1.0  (100%)
   Returns by Day of Month
   -----------------------
               No.         Avg.Gain    Pct.of Total
-------------------------------------------------------
1-10           22            .101          .333
11-20          20            .111          .303
21-31          24            .112          .364
-------------------------------------------------------
Total          66            .108         1.0  (100%)
|
The A/D Line is pointing up. 10-year rates are way below 2%.
What could possibly go wrong? US Austerity? Terror? Greek
default of govt. debts to world's bankers, including those in
US? Rise in rates? Euro meltdown?
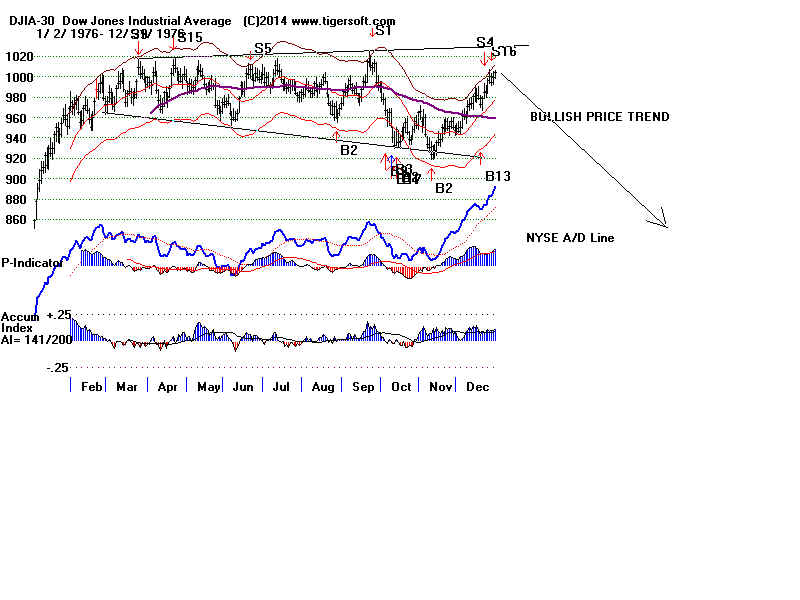
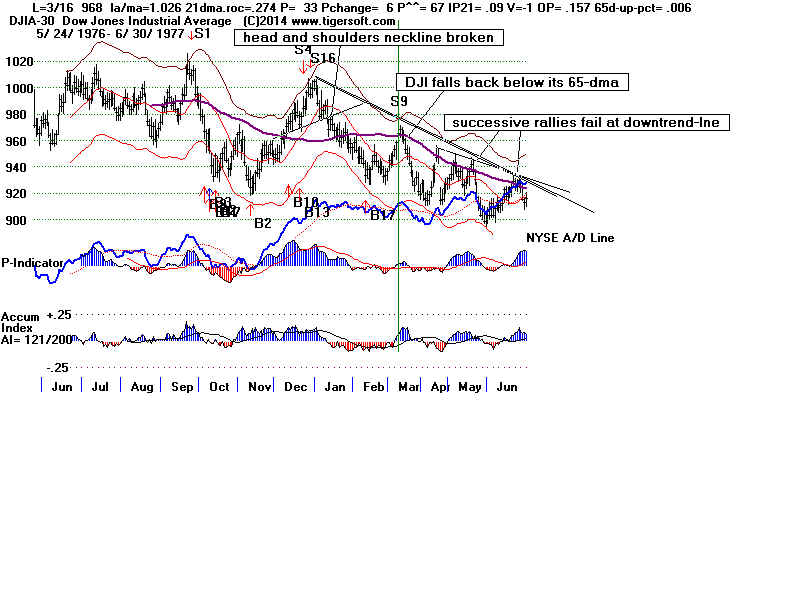
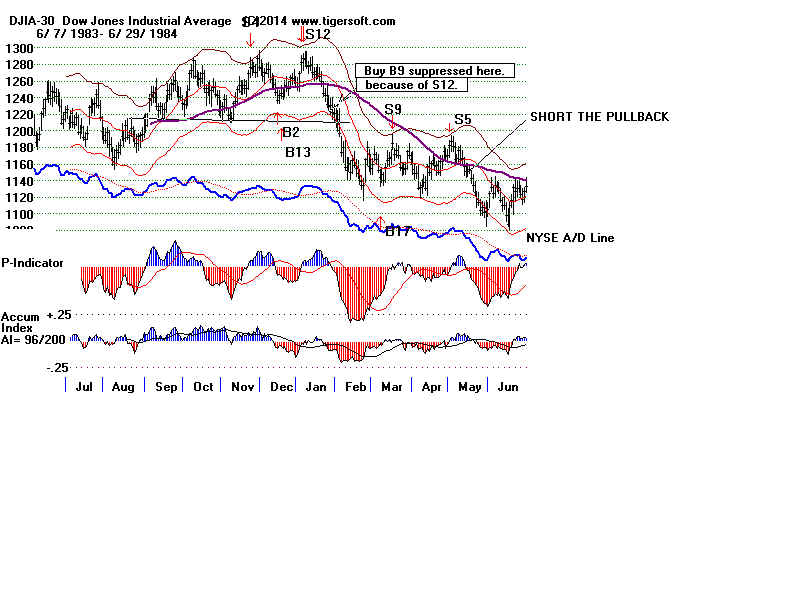
A rising A/D Line did not prevent the bull market of 1975-1976
from turning into a bear market for 15 months. The FED's
high rates, higher gasoline prices and Jimmy Carter's
federal budget austerity caused this. Or the DJI from falling 17%
from January to July 1984.
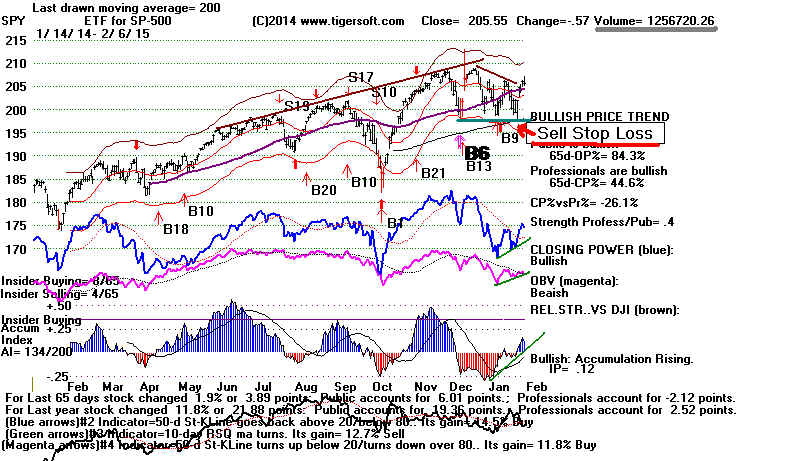
---> We are now seeing increasing draw-downs if we wait for the
Closing Power to "clinch" Peerless Buys on the key ETFS. Same
thing with waiting for IDOSC, CCI, 5-day ANROC turns up. Best to
just act on Peerless Buy and use a stop 3.5% below the Buy B9 signal
or any well-tested horizonatal support below the 200-day ma support.
See the paper losses above. SPY offered a perfect well-tested
support to use at its still rising 200-day ma.
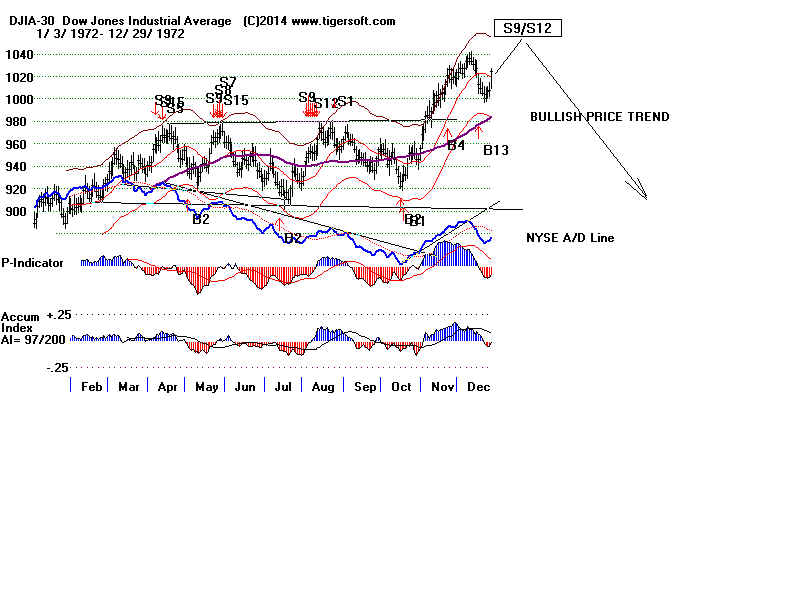
---> The DJIA has been in a trading ranges recently. Lengthy DJI trading ranges
this long
and much longer have occurred many times in the past. The best examples are:
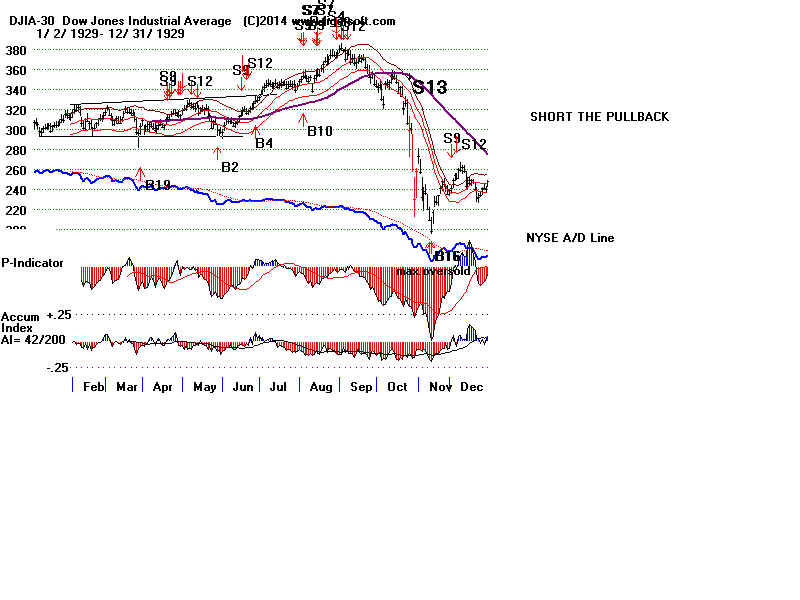
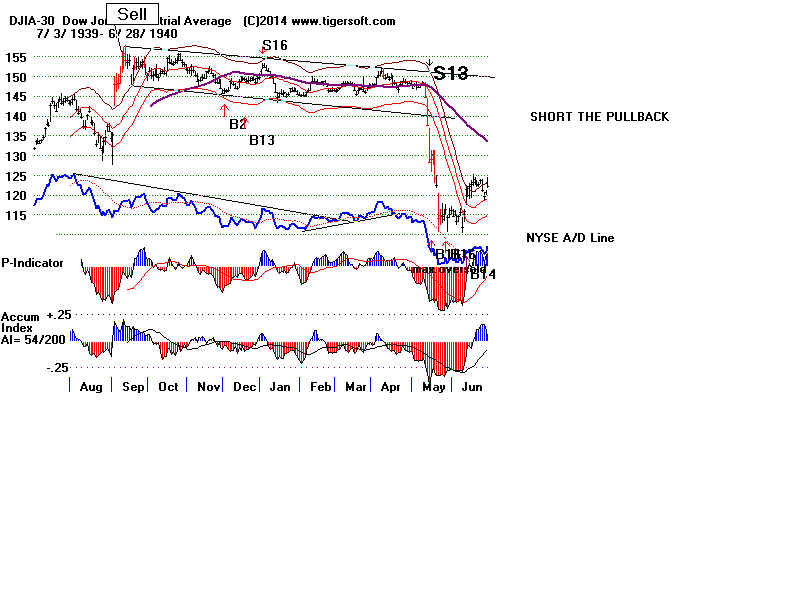
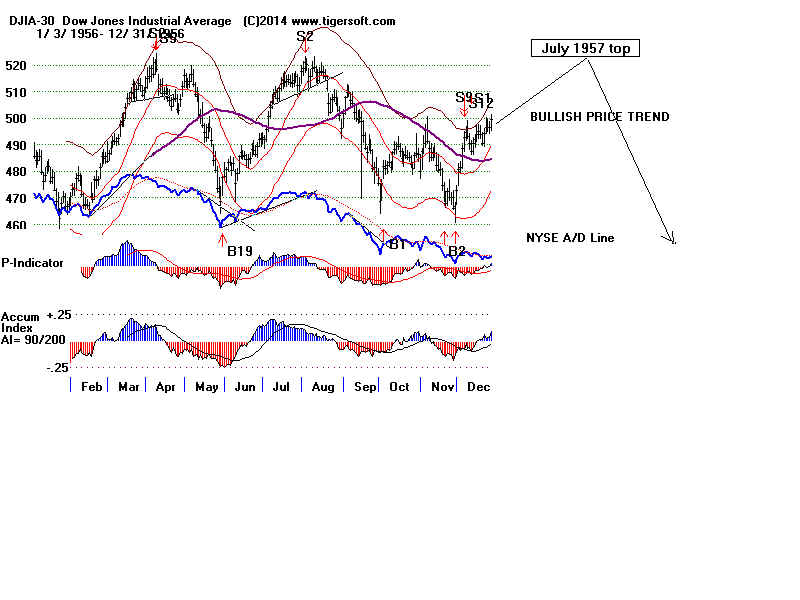
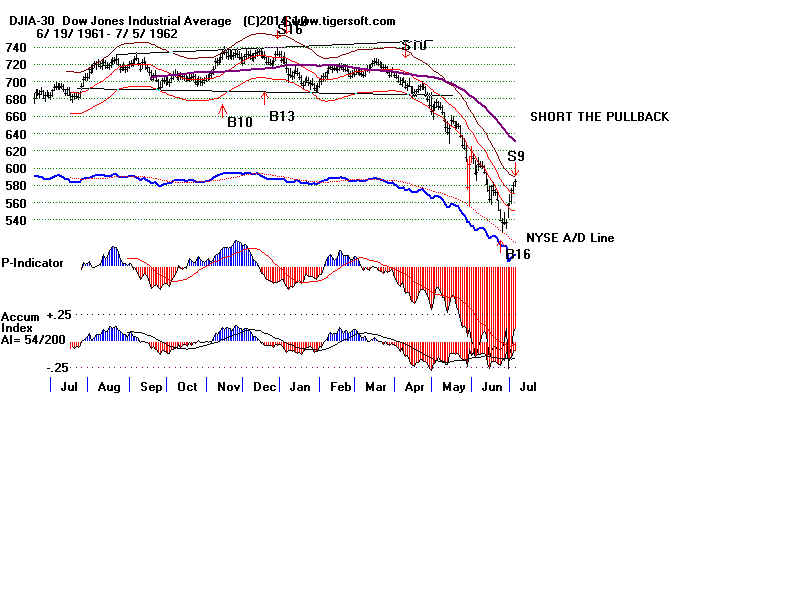
Flat Trading Ranges and Outcomes:
1928-2015
length
----------------------------------------------------
1929 6 months' 25% advance, then utter collapse.
1939-1940 8.5 months 25% bear market.
1956-1957 19 months 19.5% decline
1961-1962 9 months 26% decline
1972-1973 8 months 15% advance and long bear market.
1976-1977 11 months bear market for 15 months.
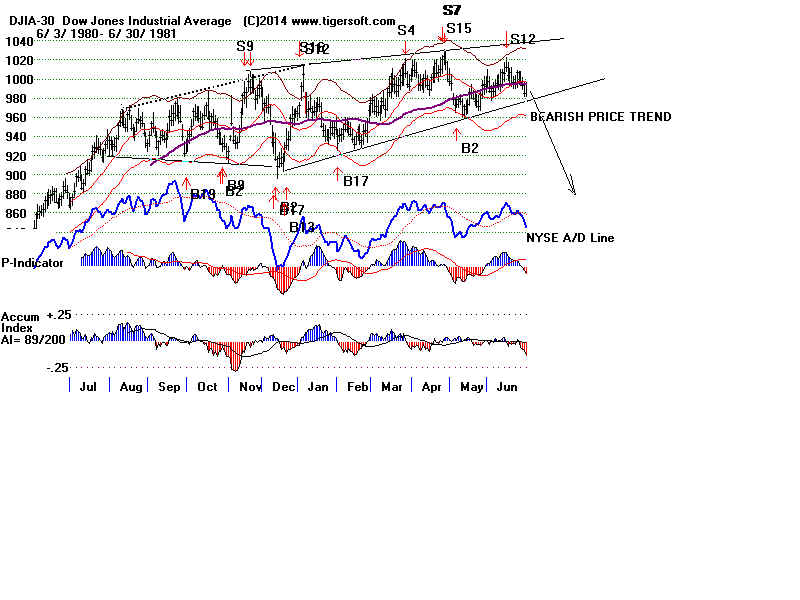
1980-1981 9 months bear market for 15 months.
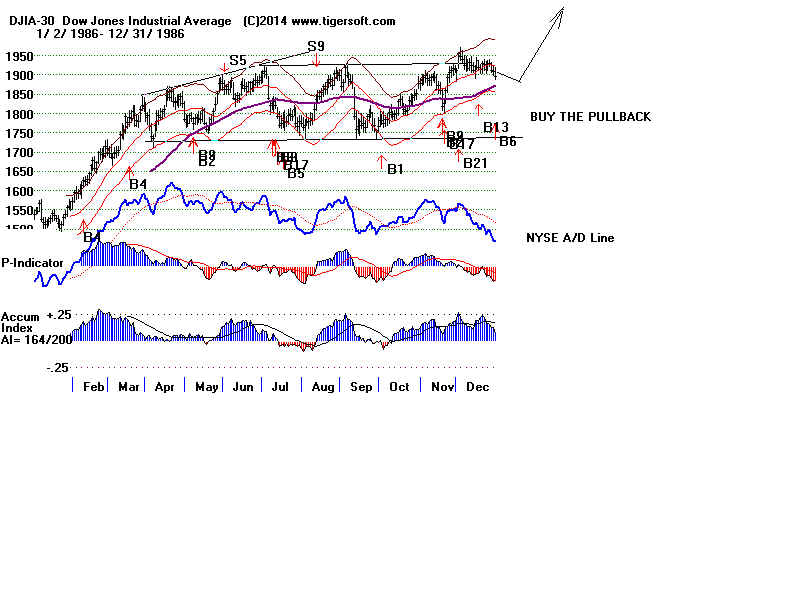
1986-1987 10 months 40% advance and October 87 Crash.
2013 6 months 10% advance and zig-zags higher.
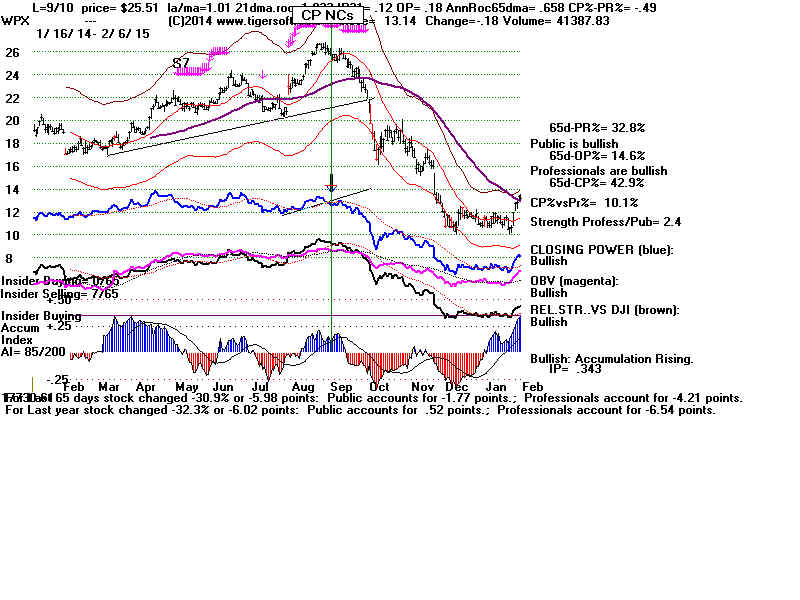
How might we TRADE major market ETFs within this range, while it lasts. In the past,
I have emphasized the
Hourly DJI,
Closing
Power trend-breaks especially after CP NCs.
automatic
5-day Stochastic Buys/Sells,
CCI
6-day
Inverted Traders' Index.
A/D Line
short term trends.
Good
reversals from support begin with 3:1 advances to
declines ratio on NYSE
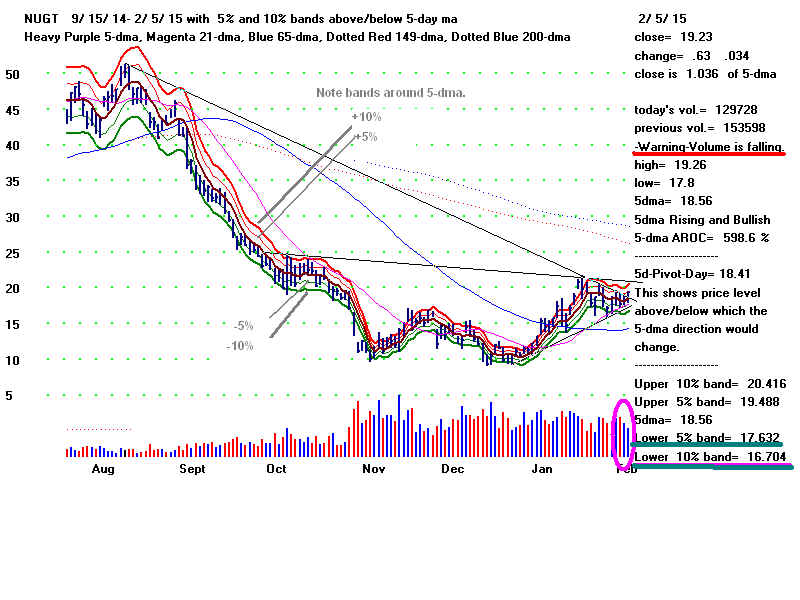
---> I want now to introduce at the meeting New TigerSoft charts.
These charts show the TigerSoft 6-Month Price, Volume,
5-day mvg.avgs and bands. Let me show some ways to trade
the more volatile ETFs, like NUGT, with the new 6-month charts
and the AROC (annualized Rate of Change) of the 5-day ma.
---> The new charts let you see resistance, support and breakout
levels more clearly, I think you will agree.
---> We want to watch for failures of daily volume to confirm
daily advances to the upper bands.
---> We should consider using two sets of Buy orders, one
at the lesser lower band and one at the lower band. These
targets are shown on the new six month price chart.
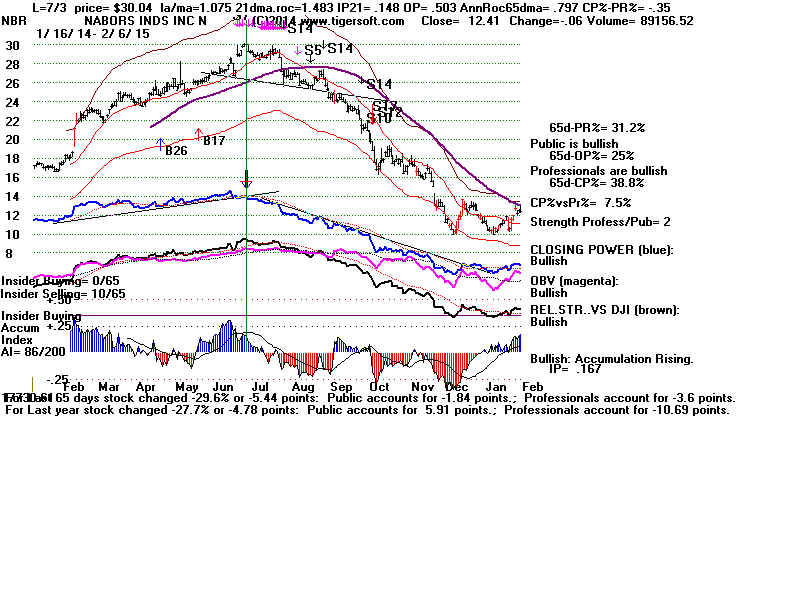
With Peerless on a Buy, how can we find proditable long-side trades
and also find good short sales to hedge with. Watch the CLosing Power
for NCs, trend-breaks and the 65-dma, too. Professionals usually know first.
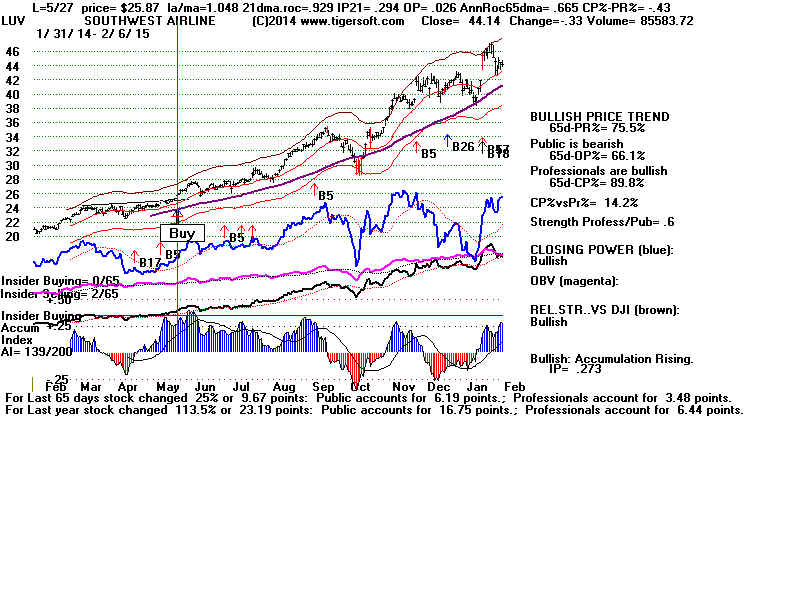
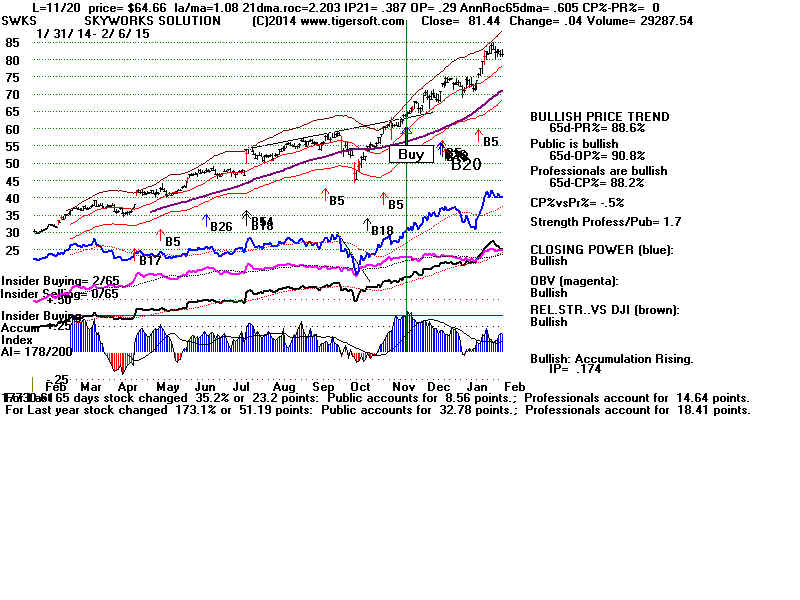
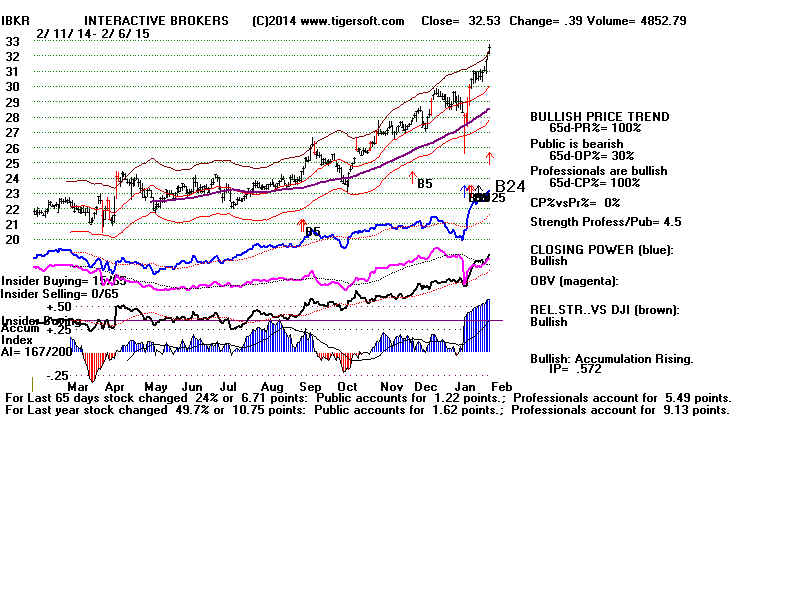
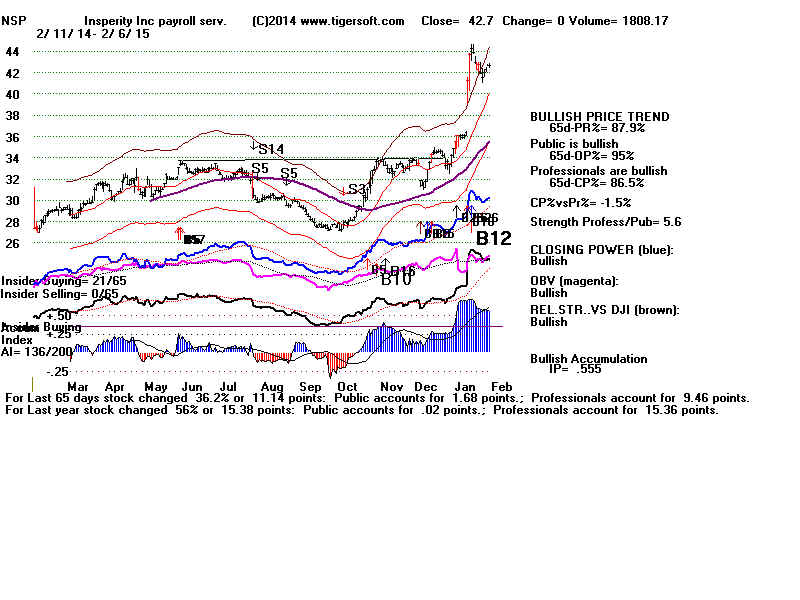
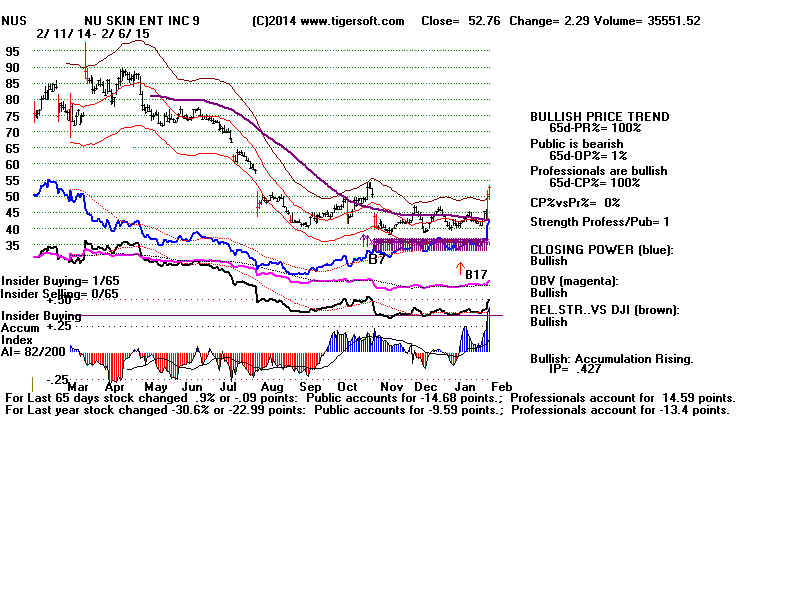
---> In newer bull markets and when the ratio of NASDAQ new highs
to new lows is greater than the ratio of NYSE new highs to new lows,
we like to find Tiger B10s, B12, B17s, B20s, B24s, B25s, B26s. These show
insider buying and confirming relative strength.
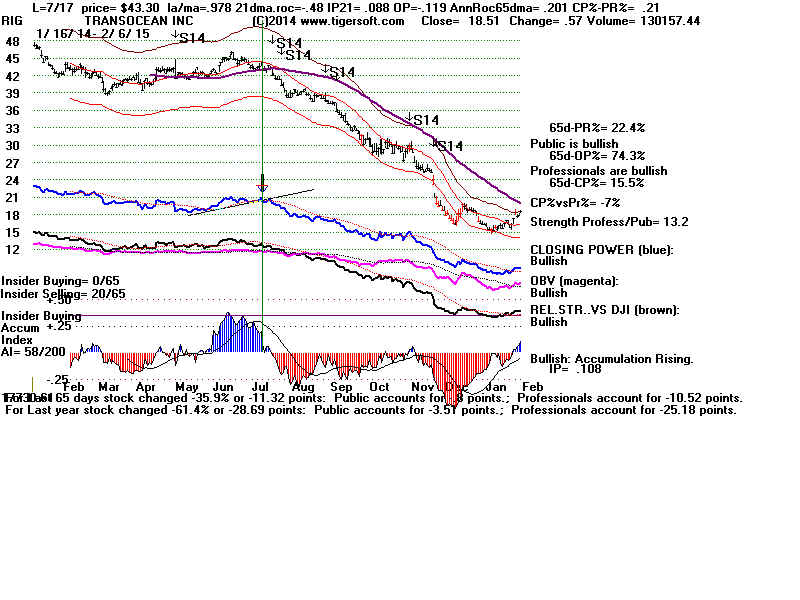
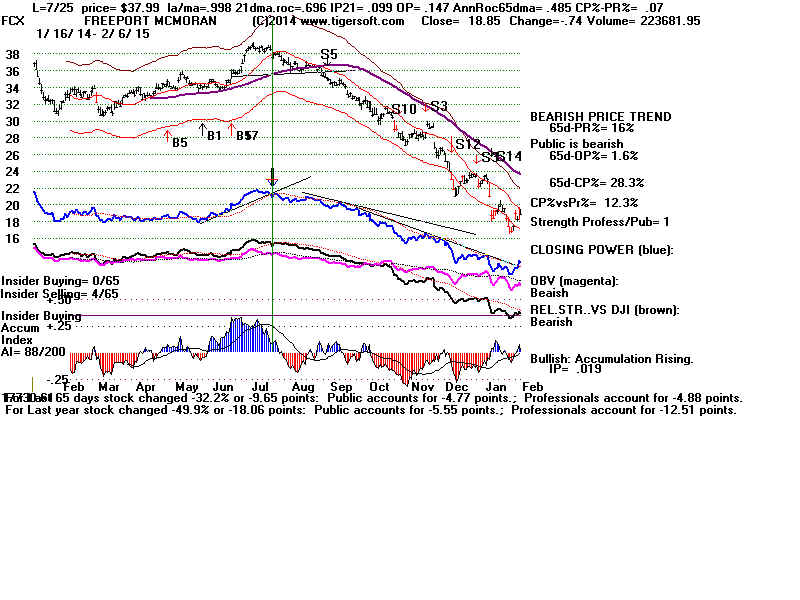
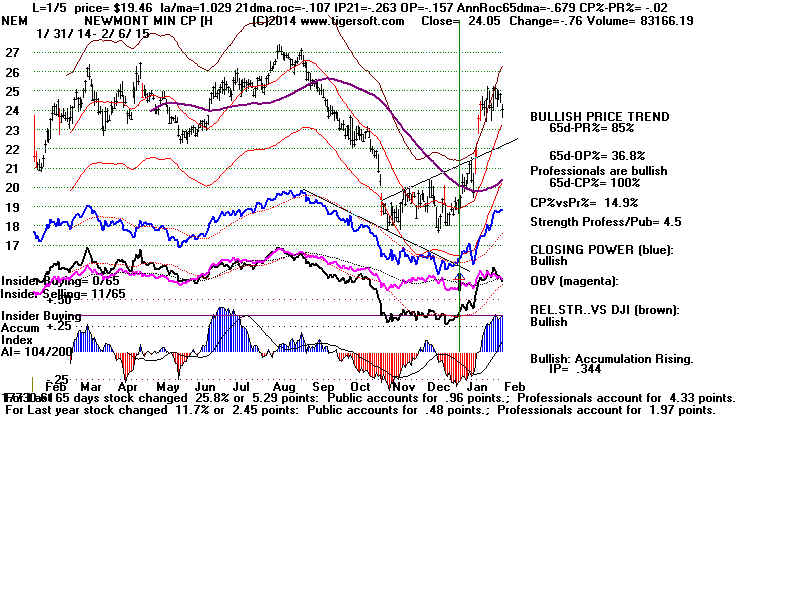
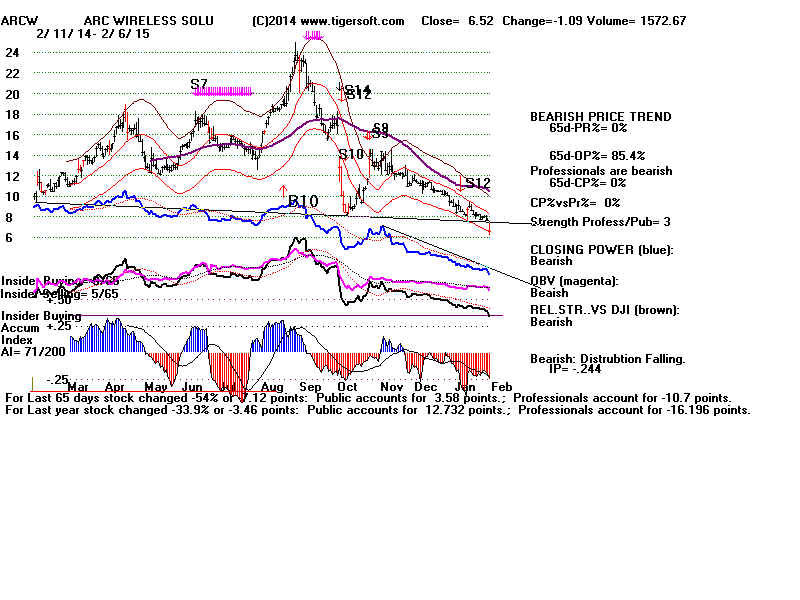
---> What are deeply over-sold stocks that break their Closing Power?
See how Closing Power has called
many Crude Oil bottoms. We do
our homework on the Hotline to make it payoff for subscribers.
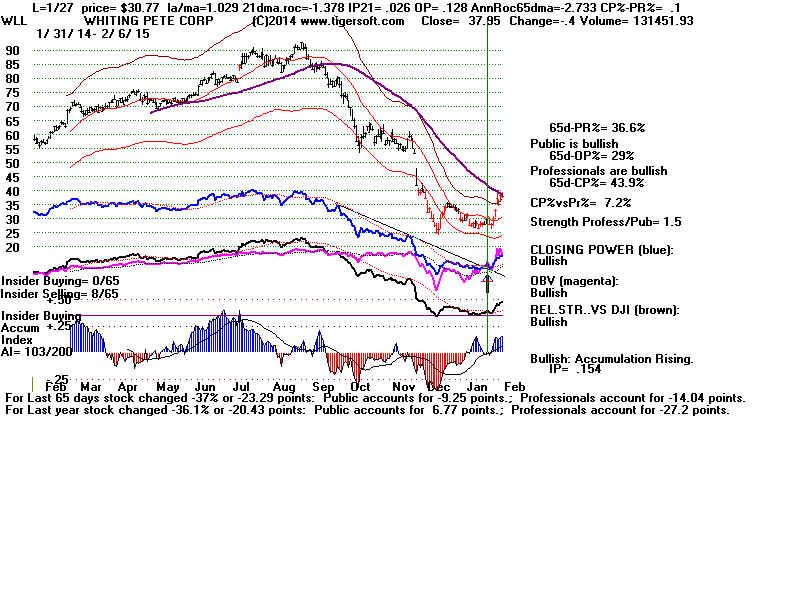
--> What are deeply over-sold stocks showing simple price trend-breaks?
---> What are stocks showing new Stochastic short-term Buys at support
and showing improving internals? Tiger easily lets you find these stocks
using the Flaging of Stochastic-Buys and Sells.
---> What are the strongest trending stocks now?
Stocks up the most over
a specified time period.
Use Old Power Ranking for x number of days.
Bullish MAXCPs
Power Rank the MAXCPs.
Weekly New Highs
Run weekly flag program and look for recent weekly B12s.
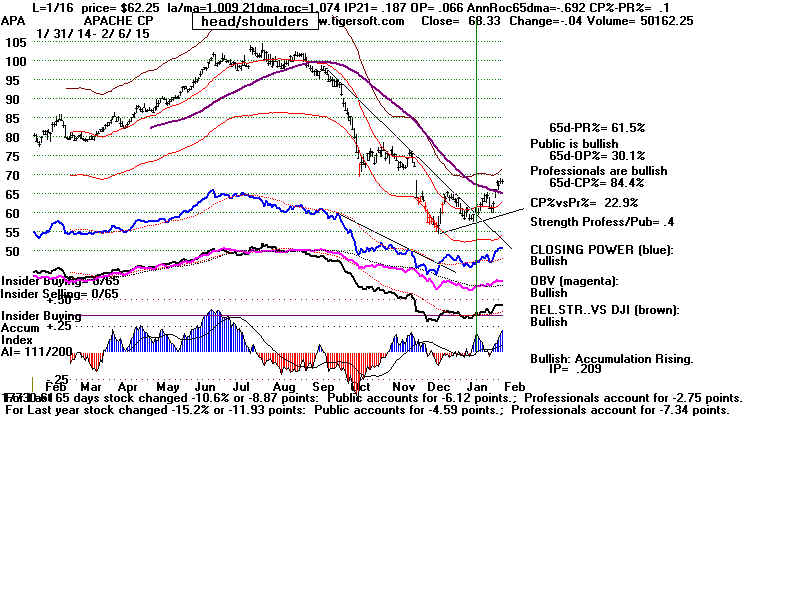
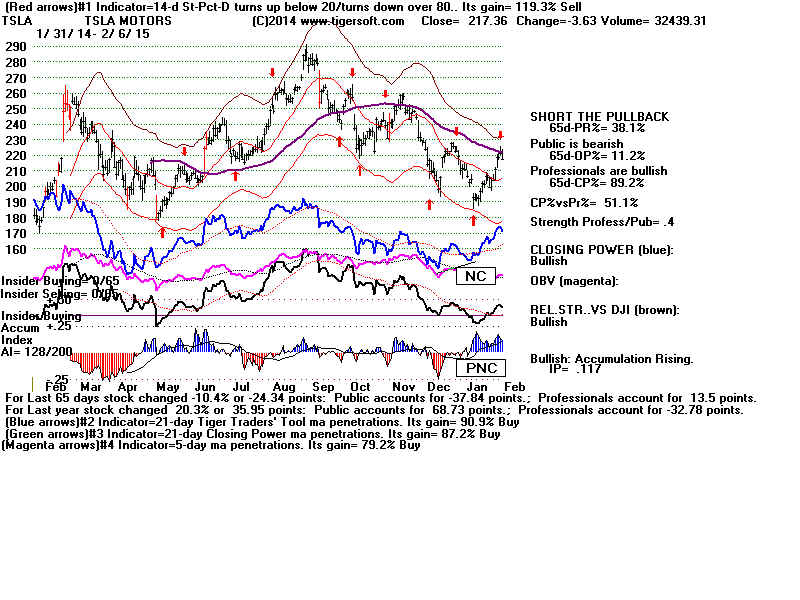
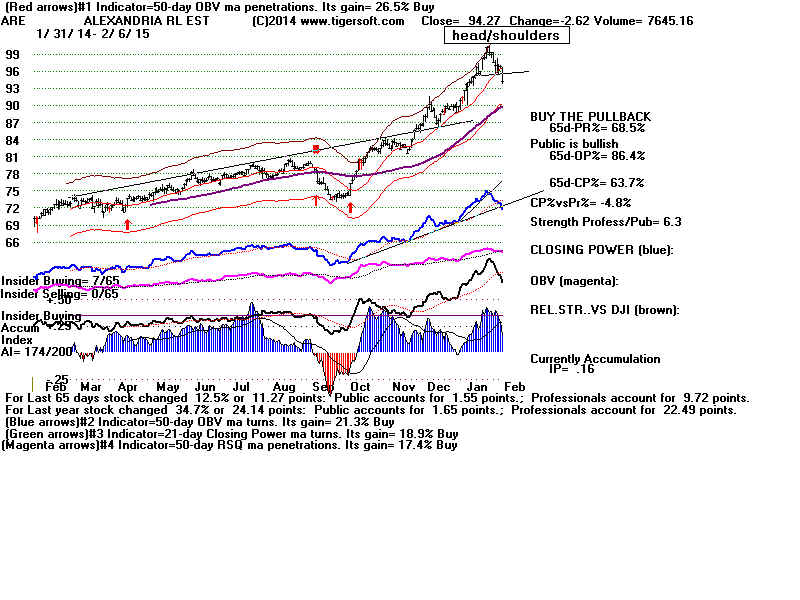
Which are the some of the stocks that have gone the longest
without a correction below their 65-dma? Or even their 21-day ma.
Use HISTB19 flags. But be careful if they break their Closing Power
uptrend or form head/shoulders, especially if they are over-extended.
---> Which are the stocks now showing the biggest recent bulges of insider and
Professional buying? These often lead to rallies that last, at least, another
6 months. Use the Downloads from TigerSoft - HIGHIP21 (Current high
IP21) and ACCUMVER (past IP21s). The first group shows intense insider
Buying right from a screeniong of all 6000 stocks? Look at the VHIP21
high Accum low priced stocks. From these we want red high volume
breakouts above flat resistance. Ideally, they will also have gaps
and multiple bulges of intense Accum.
---> The big jump in jobs would seem to bring closer the date when the
Fed will raise rates, even though the Dollar is already very strong. The Big
Banks love the prospects of an even stronger Dollar. Trade FAS on the upside.
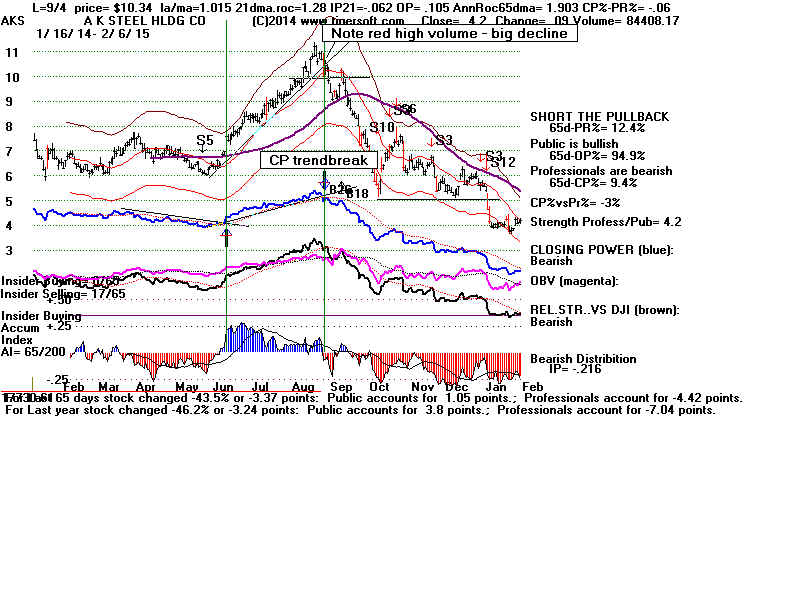
---> Over-extended stocks eventually top out. All this sounds
easy enough, but
let's look back at how strongly uptrending stocks in the past have topped out,
even when they started off the year in powerful uptrends. See new books
on Explosive Super Stocks and Killer Short Sales. Look at the SP-500 stocks
down the most for the 100 days.
----> And if we want to hedge by selling short some of the most BEARISH
MINCP stocks, how long do we need to wait for the bullish "January effect"
on weak stocks to wear off?
-
Come and join us this Saturday. We'll make it worth your while.
Free San Diego Tiger Users' Group Meeting
Saturday,
Feburary. 7th 12:45 - La Jolla Coco's
There'll be plenty to talk about. I hope you can come.
It should be real fun to bring all our experience and knowledge
together to solve some of the key questions we all have about
investment survival in an age when Wall Street seems to
have so many advantages.
See you Saturday. Best wishes to all.
Bill