Crude Oil Looks Like It Has Bottomed
(C) 2015 William Schmidt, Ph.D. www.tigersoft.com
All Rights Reserved
1/30/2015
-------------------------------------------------------------------------
Crude Oil bottoms typically occur when Professionals shift from being net
sellers
and become net buyers. Professionals on Wall Street know first.
They know a
bottom has been made long before the headlines tell the average investor or
consumer.
For informed investors this simple insight can be very profitable.
That's because
Our TigerSoft Closing Power tells investors when Professionals make this
shift.
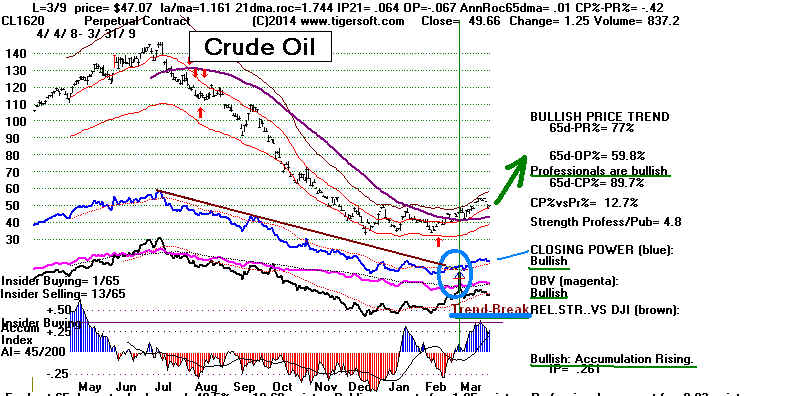
TigerSoft's Closing Power measures what professionals are doing. When
the (blue)
Closing Power is falling, they are net sellers and when the Closing Power is
rising,
they are net buyers. It follows from this that we can expect the
declining trend in
Closing Power to come to an end almost exactly when Crude Oil prices are
about
to reverse and go up significantly. And sure enough, this is exactly
what we find when
we study the past and look at every significant bottom in Crude Oil since
1980..
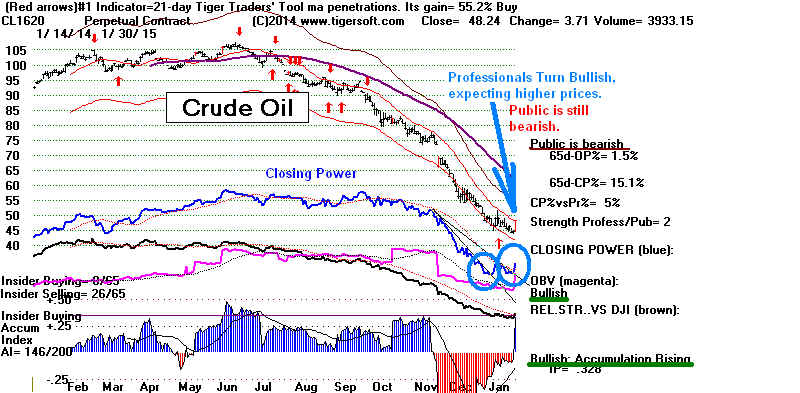
First consider the Crude Oil year's Chart for 1/30/2015. See how the
blue
Closing Power has just broken its downtrend. This is quite bullish for
Crude Oil
in our opinion.
Study the charts below. You will see how Closing Power
downtrend-breaks
exactly called the most significant Crude Oil bottoms, those of 1984, 1986,
1999 and 2009. The Tiger Closing Power turns upwards show us that
Professionals have become bullish. In fact, they are buying buying from
the broader Public, who still expect lower prices, based on the stream
of headlines they read about falling fuel prices.
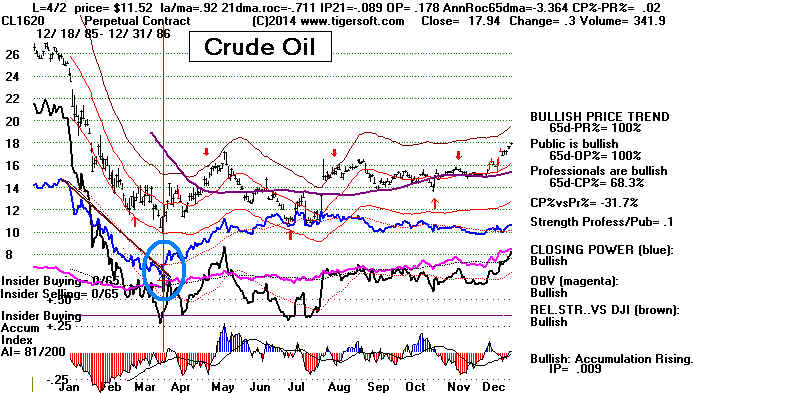
Crude Oil Bottom in 1984
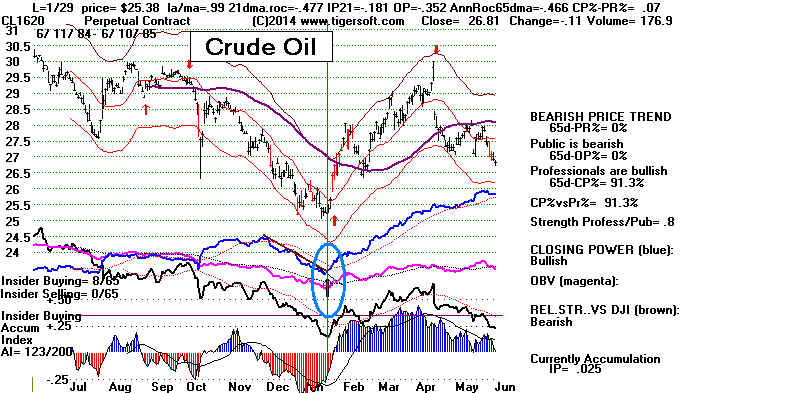
Crude Oil Bottom in 1986
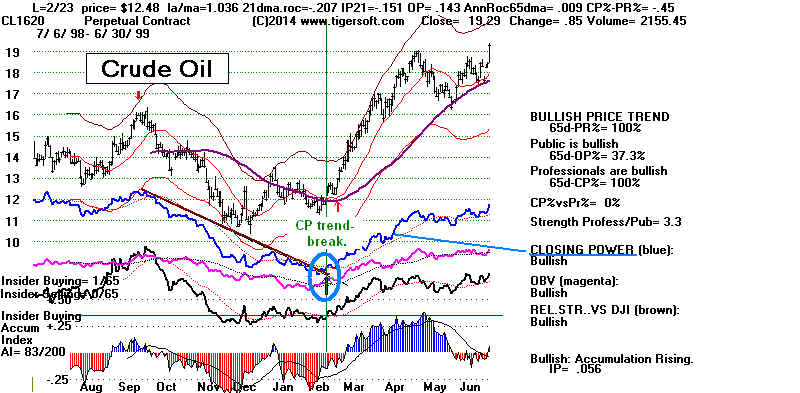
Crude Oil Bottom in 1999
Crude Oil Bottom in 2009
You can see from the very Long-Term Charts of Crude Oil that these were
the most signifiant
bottoms. http://www.macrotrends.net/1369/crude-oil-price-history-chart