Table 1
------------ Big DJI Reversals after
Declines.
2009-2015
Number A/D
Day of
Day of Next
Subsequent
Ratio<1> Reversal Reversal Day
6-wk high
=========================================================
2
2-3 10/3/2014 17009.69
16991.91 Rally Failed. DJI fell to
16117.24 on 10/16
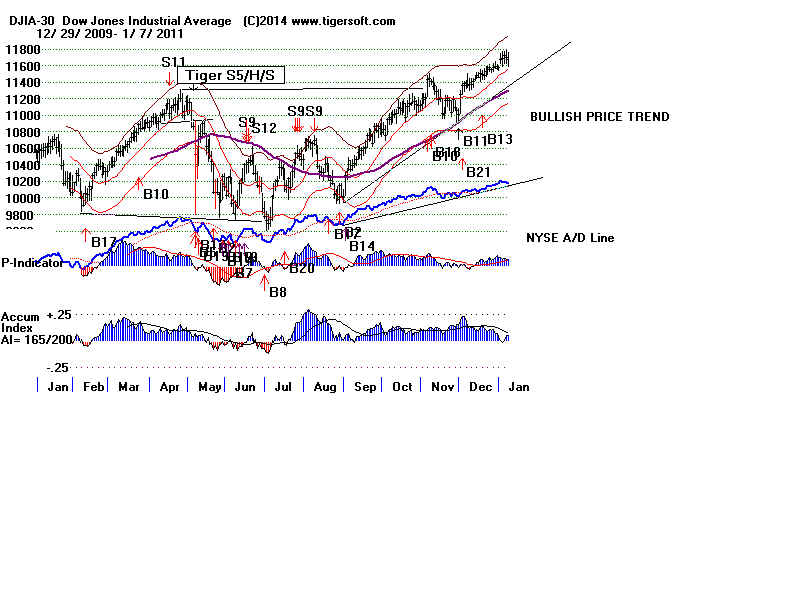
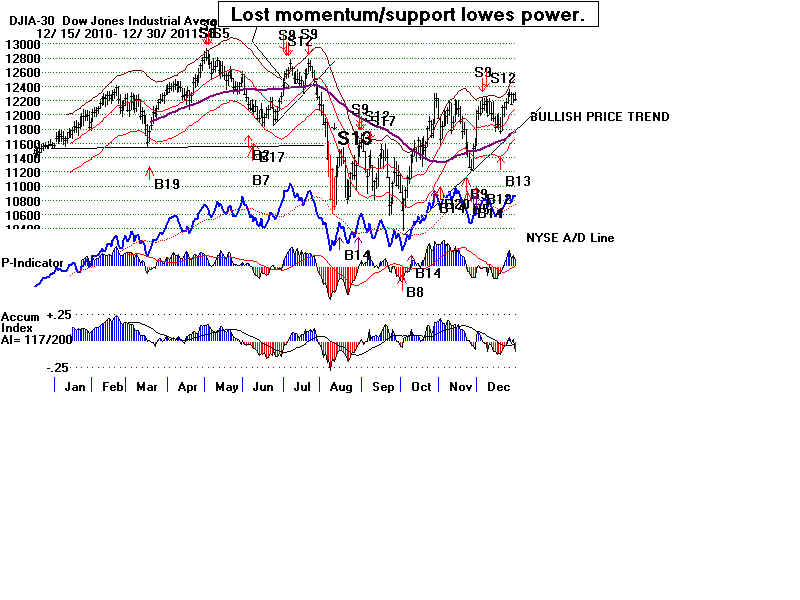
3/17/2011 11613.3
11858.52
-------------------------------------------------
5
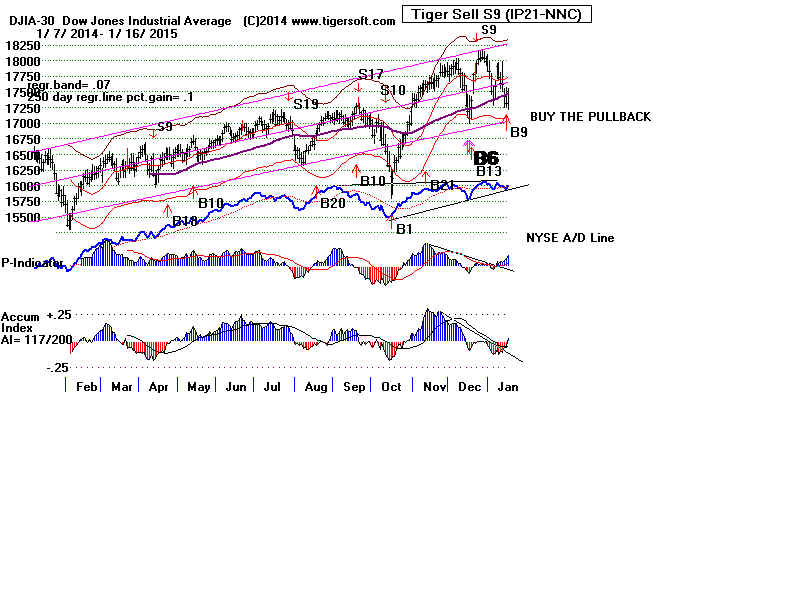
3-4 1/7/2015
17907.87 17737.37
8/8/2014 16553.93
16569.98
2/6/2014 15628.53
15974.08
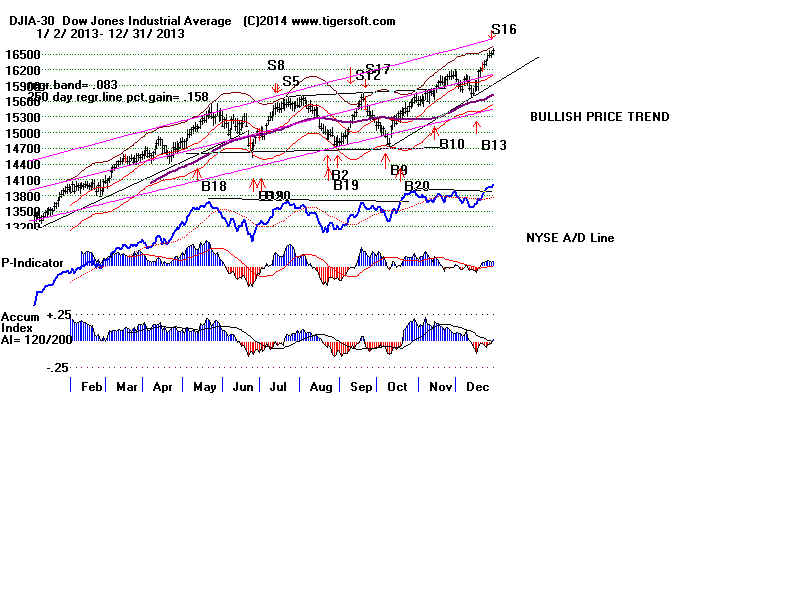
6/25/2013 14760.31
14910.14
12/1/2010 11255.78 17778.15
-------------------------------------------------
3
4-5 1/16/2015
17511.57 ?
10/8/2014
16994.22 16659.25
17958.78 12/5/2014
6/28/2011 12188.69
12261.42 12571.91 7/30/3011
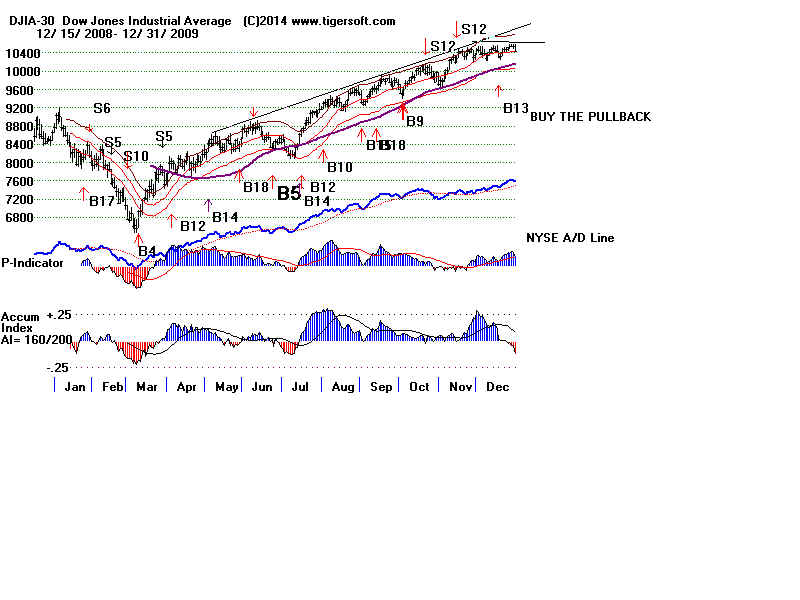
11/5/2009 10005.96
10023.42 107355.43 1/19/2015
-------------------------------------------------
3
5-6 10/10/2013
15126.07 15237.11
10/6/2011
11123.33 11103.12 hit 12231.11
7/13/2009
8331.68 8359.49
-------------------------------------------------
3
6-7 9/1/2010
10269.47 10320.1
7/7/2010
10018.28 10138.99
6/10/2010 10172.53
10211.07
-------------------------------------------------
4
>7 12/17/2014
18053.71 17778.15
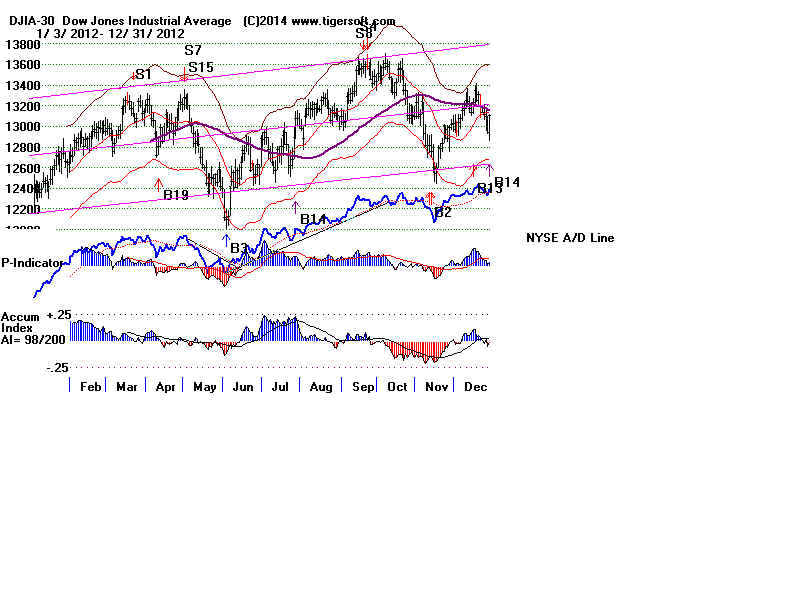
11/19/2012 12795.96
12788.51 hit 13350.96
6/6/2012
12414.79 12460.96
3/10/2009 6926.49
6930.40
<1> Day of reversal.
Table
2 ------------ Big DJI Reversals Following Declines --------
NYSE A/D
DJI Daily Jumps
Next Day
up down Ratio
---------------------------------------------------------------------------------------------------------------------------
1/16/2015 2595 589
4.41
17320.71 to 17511.57 ?
1/7/2015 2418 762
3.17
17584.52 to 17907.87 17737.37
12/17/2014 2841 371
7.66
17356.87 to 18053.71 17778.15
10/8/2014 2551 638
4.01 16719.39
to 16994.22 16659.25
10/3/2014 2124
1035 2.05
16801.05 to 17009.69 16991.91 Rally
Failed.
8/8/2014 2397 773
3.10
16368.27 to 16553.93 16569.98
2/6/2014 2345 776
3.02
15440.23 to 15628.53 15974.08
10/10/2013 2557 450
5.68 14702.98 to
15126.07 15237.11
9/9/2013 2464 615
4.01
14922.50 to 15063.12 15191.06
6/25/2013 2493 820
3.04
14659.56 to 14760.31 14910.14
11/19/2012 2696 356
7.57
12588.31 to 12795.96 12788.51 hit 13350.96
6/6/2012 2691 377
7.14
12127.95 to 12414.79 12460.96
10/6/2011 2607 474
5.50
10939.95 to 11123.33 11103.12 hit 12231.11
8/11/2011 2832 228
12.42 10719.94 to
11143.31 11269.02
6/28/2011 2457
605 4.06
12043.56 to 12188.69
12261.42
3/17/2011 2232 819
2.72
11613.3 to 11744.59
11858.52
12/1/2010 2403
676 3.55
11006.02 to 11255.78 11362.41
9/1/2010 2668 431
6.19
10014.72 to 10269.47
10320.1
7/7/2010
2689 447
6.02
9743.62 to 10018.28
10138.99
6/10/2010
2731 405
6.74
9899.25 to 10172.53
10211.07
11/5/2009
2495 537
4.64
9802.14 to 10005.96 10023.42
7/13/2009
2565 498
5.15
8146.52 to 8331.68
8359.49
3/10/2009
2936 225
13.05 6547.05 to
6926.49 6930.40 |